Abstract
Landfilling of organic waste is still the predominant waste management method in Canada. Data collection and analysis of the waste were done for the case study city of Montréal in Canada. A life cycle assessment was carried out for the current and proposed waste management system using the IWM-2 software. Using life cycle assessment results, a non-dominated sorting genetic algorithm was used to optimize the waste flows. The optimization showed that the current recovery ratio of organic waste of 23% in 2017 could be increased to 100% recovery of food waste. Also, recycling could be doubled, and landfilling halved. The objective functions were minimizing the total energy consumption and CO2eq emissions as well as the total cost in the waste management system. By using a three-objective optimization algorithm, the optimized waste flow for Montréal results in 2% of waste (14.7 kt) to anaerobic digestion (AD), 7% (66.3 kt) to compost, 32% (295 kt) to recycling, 1% (8.5 kt) to incineration, and 58% (543 kt) to landfill.
1. Introduction
The increased population in urban areas leads to a significant raise in waste generation. Conventional waste management methods like landfill are amongst the main contributors to greenhouse gas (GHG) emissions in the world. Landfills occupy large areas of lands and potentially pose a risk to human health and the surrounding environment. Therefore, it is crucial to find alternative methods for better municipal solid waste management (MSWM) in urban areas. Annually, 2.01 billion tons of waste are produced globally, and waste to energy technologies provide approximately 1.5% of the final energy consumption in Europe [1].
Efforts have been made worldwide to reduce landfilling of the biodegradable fraction of waste, but the reduction amount is not satisfying so far. An example is food wastes (FW), which are the easily biodegradable organic waste (OW) [2]. It contributes almost half of the total municipal wastes in most countries [3] and has great potential to be used for energy purposes. However, it is directly landfilled in many cases. In 2014 and 2015, FW accounted for 38 [4] and 39 million tons [5] in the USA, respectively, and three-quarters of these amounts were landfilled [4,5]. The EU Landfill Directive in 1999 prevented landfilling the OW and forced the members to reduce the quantity of biodegradable municipal waste sent to landfills to 75% (2006), 50% (2009), and then 35% (2016) compared to 1995 [6]. Based on this directive, the proportion of municipal waste disposed of by landfilling should be reduced to 10 % or less of the total amount of municipal waste generated by 2035 but most of the European countries could not achieve this target [7]. In 2018, 247 million tons of municipal solid waste (MSW) were treated in the EU by landfilling (23%), recycling (30%), composting (17%) and incineration with or without energy recovery (47%) [8].
Life cycle assessment (LCA) evaluates the potential environmental impacts of products. IWM-2 is a life cycle inventory (LCI) model for integrated waste management that predicts the environmental burdens of a specific waste management system [9].
Numerous studies have focused on the LCA of diverse waste management systems. [1] compared recovery methods, which are beneficial compared to disposal options and concluded that thermal treatment and anaerobic digestion (AD) might be favorable over composting. Composting usually require large areas, is highly affected by weather condition and has odor problems. [10] criticized large-scale centralized composting due to enhanced environmental impacts and therefore, considered it a temporary solution. Decentralized waste management systems decrease transportation requirements significantly. [11] found out that the presence of a composting plant at 10 km from the municipality would decrease 65% of the environmental impacts due to the external transport.
Connecting agriculture and waste is beneficial in terms of the reduction of GHG emissions. Still, there are some challenges regarding increased costs and acceptance for the use of digestate as a fertilizer (e.g., legal restrictions on the use of digestate produced from sewage sludge) [12,13] reported that N2O emissions of the application of liquid and solid portions of the digestate were the most significant contributors to global warming among all the life cycle stages. In another study, [14] coupled AD with composting to reduce the drawbacks associated with the direct soil distribution of anaerobic digestates such as the emission of CO2 and obtained stable products to be safely used in soils without affecting their N- and P-fertilizing capacity.
According to [15], one way to improve the utilization efficiency of biomass is the use of waste and production residues, and a vast majority of waste to energy technologies have lower GHG emissions when compared to fossil fuels.
The performance of waste management methods depends on the waste composition and climate conditions. The agglomeration of Montréal (MTL) in the province of Québec (Canada) was chosen as the case study. Due to the severe weather condition in this province, the energy consumption of Québec’s residents is one of the highest in the whole world. Currently, about half of the energy demand in Québec is supplied through renewable sources and the Québec government has ambitious plans of increasing this amount to 60.9% in 2030 [16]. One of the key targets in this plan is increasing bioenergy production by 50% by 2030. MTL as the biggest city in this province plays a vital role in achieving those targets. Therefore, in this study the authors focused on the current waste flow in MTL and presented different possible scenarios for MSWM in this city. The challenges to achieve optimized waste flows are discussed. The focus of the present study is on municipal solid waste, which includes residential, commercial, and institutional waste, and excludes industrial, construction, and hazardous waste [17]. To the best of authors’ knowledge, there are no LCA studies of waste, and especially OW management for the chosen case study city.
The paper is organized as followed: First, the waste composition in MTL, and the current waste flow in the city is presented. Then, different MSWM scenarios are defined and their environmental performance are compared using IWM-2 LCA methodology. In the next section, based on the preliminary LCA results, a mathematical model is developed and the waste flow is optimized to minimize the equivalent CO2 of GHG emissions, total energy consumption in waste management system, and total cost of the system. In the final section, the challenges in the way to reach to this optimized waste flow are discussed. The aim of this study was LCA of the current waste management system and waste management systems with new technologies in Montréal.
2. Current Status of Waste Management in Montreal
The work uses the Canadian city Montréal as a case study. The agglomeration of Montréal (MTL) includes 16 cities together with the City of Montréal, which in turn is divided into 19 boroughs. The City of Montréal is the largest city in the Canadian province of Québec (24% of the population) [18] and the second-most populous municipality in Canada, with around 2 million inhabitants [19,20]. Currently, most of the OW in Québec is landfilled or combusted, and it is planned to ban the disposal of OW and reach 60% diversion from landfill [21]. Moreover, MTL has a Waste Management Master Plan firmly anchored in the targets of the Québec Residual Materials Management Policy with its 2011–2015 Action Plan of the Government of Québec. According to this plan, the recovery target for recyclables, OW, and construction and demolition waste (CD) is 70%, 60%, and 70%, respectively [19]. It is also planned, by 2030, to increase bioenergy production by 50% through various methods such as bio-methanation of OW [16]. Mishandling of OW in MTL or Québec has been reported by several studies [18,22]. Therefore, the environmental assessment of the current and proposed waste management systems is essential regarding their impact on energy consumption and emissions.
2.1. Data Collection and Analysis
Data collection and analysis for the waste flow of MTL was mainly done based on the reports published by the Service de l’Environnement in MTL [19,23]. Their report characterizes waste collections from three sources, including residential, institutional, and commercial ones. The generated waste included OW (FW, yard waste and mixed residue), paper and cardboard (PC), metal, glass, plastic (MGP), CD, harmful household products (, paint, pesticide, mercury devices, etc.), textile, E-waste, and household waste. Collection and disposal of waste are handled by the municipalities in MTL in different ways, and separation of materials is done in sorting centers. Curbside collection service collects the household waste and recyclables, and partially OW. OW consisting of FW and yard waste is collected in most of the buildings of eight or fewer dwellings in MTL, and then transformed into compost. Seven eco-centers in MTL collect CD, wood, metal, tire, polystyrene and textile, harmful household products, E-waste, yard waste (gardening and weeding residues, leaves, and Christmas trees), and other reusable materials. CD is also collected on the street or as a result of resident calls. Household waste and non-recyclable CDs are sent to the landfills.
2.2. Trend in Waste Generation
Figure 1 illustrates the generated waste in MTL (2012 to 2017). In MTL, total waste generation decreased from 970 kt in 2012 to 931 kt in 2017. The average amount of OW, MGP and PC, CD, and textile, E-waste & harmful household products was 361 kt, 286 kt, 234 kt, and 8 kt, respectively. Various factors affected the decrease in waste quantities such as replacement of printed newspapers by digital editions, eco-design of products which reduces the weight of containers, reduction of over-packaging, and reduction of consumption.
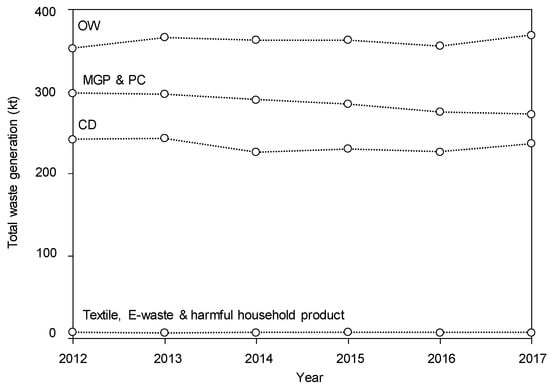
Figure 1.
Total waste generation in MTL [19,23]; OW: organic waste, PC: paper and cardboard, MGP: metal, glass, plastic, CD: construction and demolition waste, and E-waste: electronic products.
Many products that used to be made from recyclable materials changed to multi-layered flexible packaging that are not accepted for recycling in MTL. For example, in MTL, plastic #6 (polystyrene), different kinds of plastic bags and films are not considered as recyclable items. The number of public policies on plastic carrier bags has more than tripled since 2010, and they are now found on all continents, ranging from the municipal to the intergovernmental level [24]. Introducing the degradable plastics as the environmental-friendly alternatives to the market can decrease the vast amounts of plastics that are landfilled. For instance, Malmir used a solvent casting method to prepare biodegradable films of poly (3-hydroxybutyrate-co-3-hydroxyvalerate) with cellulose nanocrystals, which has the capability for applications in the industry of food packaging [25] and achieved well-dispersed bionanocomposites with improved mechanical and barrier properties [26].
2.3. Waste Flow
The waste flow of MTL in 2017 is shown in Figure 2. Based on this figure, in MTL, 931 kt waste was generated and the whole amount of this waste was the subject of the research. This amount was comprised of 95% recyclables (OW, PC, MGP, CD, textile, E-waste, and harmful household product) and 5% non-recyclables (non-recyclable CD and other materials), and the portion of diverted and landfilled waste was 45% and 55%, respectively. Adding mixed paper from OW (139 kt) to PC and MGP (272 kt), recyclables could account for 357 kt. OW in MTL accounted for 369 kt from which around 85 kt was recovered. The recovery ratio of OW increased from 11% in 2012 to 23% in 2017 but was still far from the 60% recovery target in 2011–2015 Action Plan of the Government of Québec. The recovery ratio of PC and MGP, and CD was 60%, and 68%, respectively. To compare, household waste collected from urban and rural sectors of Saguenay in the Canadian province of Québec comprised of 53% to 66% OW, 4% PC, 15% MGP, and 5% textile [27].
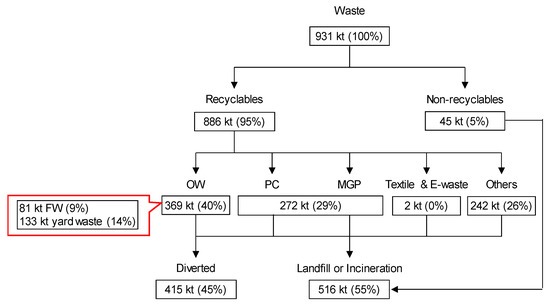
Figure 2.
Waste flow of MTL in 2017 [19,23].
The waste flow also shows the percentage of FW and yard waste for the OW of MTL. This percentage was not available for 2017, and we assumed the same percentage in 2016 [19]. Accordingly, FW accounted for 9% (81 kt), and yard waste was 14% (133 kt). The rest of the OW was 17% (155 kt) mixed residue.
3. Methodology
3.1. LCA Methodology
IWM-2 was used as the LCA methodology to predict the environmental burdens of integrated waste management systems [28,29]. The scope of the environmental analysis model was defined to include the major components of residential waste, including paper, plastic, glass, aluminum and steel, FW, and yard waste. Other types of wastes were considered as components which could be treated through energy recovery and landfilling options [29]. Goals, functional unit, and system boundary, life cycle inventory, and life cycle impact assessment in the following sections were based on IWM-2.
3.1.1. Goals, Functional Unit and System Boundary
LCA of the current waste management systems and waste management systems with new technologies in MTL was considered. These technologies were based on composting of FW, and energy recovery from mainly FW and yard waste. The total waste generated in MTL in 2017 was considered as a functional unit in the mentioned systems. The model evaluated the environmental burdens associated with waste management from the point at which a material is discarded into the waste stream to the point at which it was either converted into a useful material or, it was finally disposed [28]. Accordingly, waste collection, waste transfer, sorting of recyclable materials at a materials recovery facility, reprocessing of recovered materials into recycled materials, composting, energy recovery and landfilling were evaluated by the model through recycling of paper, plastics, glass, steel, and aluminum, composting and AD of paper, yard waste and food waste, and incineration and landfilling of all waste components [29]. However, in this study, only AD and composting of FW and incineration of yard waste was considered.
3.1.2. Life Cycle Inventory
The analysis of all the material and energy inputs and outputs for each stage in the life cycle could be combined to give the overall life cycle inventory [9]. The overall estimation of energy consumption and emissions of the waste management systems in this study was conducted with the help of the IWM-2 model and its pre-defined standard data in Microsoft Excel for Office 365 MSO version 16 and Microsoft Visual Basic for Applications version 2012.
3.1.3. Life Cycle Impact Assessment
The model estimated the energy consumed (or produced) and the emissions to air, water, and land associated with different waste management practices [28]. The specific indicator parameters evaluated, and the environmental effects associated with these parameters are shown in Table 1.

Table 1.
Indicator parameters [28,30].
3.2. Waste Management Scenarios
LCA has been conducted for the current waste management systems in MTL (Sc1) and three proposed scenarios (Sc2, Sc3, and Sc4) in which the energy consumption and emissions have been determined. All the proposed scenarios considered the maximum amount of recycling rates. They also fed all the yard waste to incineration technology because lignin does not undergo AD, and cellulose and hemicellulose are degraded slowly in comparison [1]. In the case of FW, Sc2 specified all the FW for the AD technology, Sc3 assumed all the FW for the composting technology, and Sc4 allocated half of the FW for the AD technology and the other half for the composting technology. Figure 3 shows the amount of input waste for waste management scenarios in MTL.
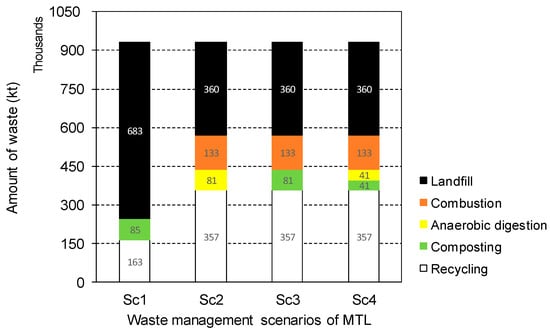
Figure 3.
Amount of input waste for waste management scenarios in MTL.
3.3. Optimization
LCA results are useful measures to develop a mathematical model for the energy and environmental performance of a waste management system. The IWM-2 software is a helpful tool for conducting LCA for a waste management system as it includes all different parts of the system, including transportation, sorting, and energy recovery. The results obtained from IWM-2 included the energy consumption and the CO2 equivalent of GHG emissions from each waste management technology that were good indicators of waste management system performance. Based on the results derived from the different proposed scenarios, the ranges of the waste sent to each technology was defined. According to these values, the amount of waste sent to each section was changed to obtain the equivalent CO2 of GHG emissions (CO2eq) and energy consumption of each technology (E) for the specified waste amount. By using these results, a curve fitting tool was applied to develop a second-order mathematical relationship for both energy consumption and CO2eq of GHG as a function of waste input [30]. To achieve a better fit, the data for all technologies were normalized. The general form of the Equation for each technology is as follows:
where, E is the energy consumption in each technology, CO2eq is the equivalent CO2 of GHG emissions from each technology, x is the amount of waste sent to each section, μ and σ are the mean and variance of the data obtained for each technology, respectively, and a and b and c are constants. The values of μ and σ were derived from the curve fitting tool utilized for developing the Equations.
E = a [(x − µ)/σ]2 + b [(x − µ)/σ] + c,
CO2eq = a [(x − µ)/σ]2 + b [(x − µ)/σ] + c.
3.3.1. Objective Functions
The total energy consumption and CO2eq emission were calculated from the following equations [30]:
Etotal = EAD + EC + ECbs + EL + ER,
CO2total = CO2AD + CO2C + CO2Cbs + CO2L + CO2R.
In Equation (3), EAD, EC, ECbs, EL, and ER are energy consumption at AD, composting, incineration, landfilling, and recycling units, respectively. In the energy from waste facilities including AD and incineration, the energy consumption was calculated from the electrical energy generated minus the energy consumed. For the recycling unit, the saved energy by using recovered material was subtracted from the energy consumed for recycling the material.
In Equation (4), CO2AD, CO2C, CO2Cbs, CO2L, and CO2R are GHG emissions of the anaerobic digestion, composting, incineration, landfilling, and recycling units, respectively. These quantities show the total emissions of each technology in their life cycle based on equivalent CO2.
These two quantities are functions of waste input in each technology. In this optimization procedure, two of the objective functions were minimizing the total energy consumption and CO2 equivalent of GHG emissions.
Cost is a vital factor in designing an integrated waste management system. Table 2 contains the estimated cost function for each waste management technology. The costs were categorized into the initial capital costs and operating costs and the parameter x denotes the annual waste input of each technology.
Table 2.
Costs in Canadian dollars per ton of annual waste input.
In addition to the total energy consumption and CO2eq emission (Equation (3) and Equation (4)), the total cost of the waste management system was also considered as an objective function to be minimized [30]:
Costtotal = Cost2AD + Cost2C + Cost2Cbs + Cost2L + Cost2R.
Consider X to be a vector containing the waste input of each technology (X= (xAD, xC, xI, xL, xR)), and the arrays of this vector were decided by the optimization constraints, then X* was optimal in the space S, if energy, CO2 and total cost are minimized:
Etotal(X*) & CO2eq.total(X*) & Costtotal(X*) ≤ Etotal(X) & CO2eq.total(X) & Costtotal(X) for all X ∈ S
3.3.2. Constraints
Based on the results obtained from IWM-2, the best scenario was chosen. Therefore, the optimization constraints could be determined according to the chosen scenario. The lower bounds for the waste input of landfill and recycling units were the current amount of waste sent to these units in MTL.
3.3.3. Method
An optimization algorithm was used to find the best waste flow for the waste management system in MTL. This optimization algorithm was a multi-objective one as the proposed system should be both environmentally friendly and economically feasible. GA is a popular option for solving such constrained multi-objective optimization problems. GA has been evolved into different forms that each of them is different from the original GA. One of these evolved forms is a non-dominated sorting genetic algorithm (NSGA) developed by Srinivas and Deb [33]. The difference between NSGA and original GA is only in how the selection operator works while crossover and mutation operators remain the same.
In this study, an improved form of NSGA, meaning NSGA-II [34] was used to minimize the energy consumption, CO2eq of GHG emissions, and cost of the system. This improved algorithm was less complicated in terms of calculations, and the solutions were more diverse compared to original NSGA [35].
Figure 4 illustrates the procedure of optimization. The first step was an initialization, which included defining objective functions, input variables, and constraints. The mass input of the five technologies (AD, compost, incineration, landfill, and recycling) were taken as input variables. In the next step, a set of values was assigned to the defined input variables as the initial population and a fitness function was found for each set of answers in the next step. Then, using this initial population, the values of the objective functions were calculated to identify the answers that minimize them. Next, the non-dominated sorting was done to order the answers based on their fitness functions. In step 4, parent chromosomes were chosen among the ordered initial population. The crossover process was used to generate children for the chosen parents. In the following step, the mutation operator was utilized for the children. Unlike the crossover process where the children have the same characteristics as the parents, after mutation, some of the children gain characteristics that belong to neither of parents. Then, these mutated children are mixed with other children, and again non-dominated sorting will occur, and children are chosen for the next generation. Finally, the stop criterion of the algorithm was checked. The steps 2 to 8 were repeated until this criterion is met.
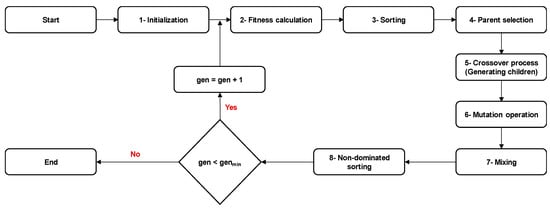
Figure 4.
Procedure of optimization.
4. Results and Discussion
4.1. LCA Results
Greenhouse gases (carbon dioxide (CO2), methane (CH4) and nitrogen oxides (NOx), and the CO2eq in kt of CO2), acid gases (nitrogen oxides (NOx), sulfur oxides (SOx) and hydrochloric acid (HCl)), smog emissions (NOx, particles (PM) and volatile organic compounds (VOC)), energy consumption and remaining amounts in the current status of waste management and the proposed scenarios in MTL are presented in Table 3. In MTL, Sc1 consumes the most energy (6869 TJ saving) and emits the least CO2eq (69 kt). Sc3 and Sc4 are the better waste management scenarios in which 14027 TJ and 14043 TJ energy is saved, and 127 kt and 144 kt CO2eq is emitted, respectively. Each waste management system has its own residuals, for example ash in incineration, or residuals that could not being further recycled in recycling etc. These residuals are usually sent to landfill.
Table 3.
The emissions in the current status and proposed scenarios of waste management in MTL.
With Sc1 as the reference scenario of today’s waste management system, Sc2 uses anaerobic digestion, Sc3 uses compost, and Sc4 uses anaerobic digestion and compost. The equivalent CO2 is calculated using CO2eq = CO2 + 21 * CH4 + 310 * NOx.
In the AD module (Sc2), emissions originate from biogas combustion (GHG contributor), aerobic composting (GHG contributor), and water (leachate) from the process. All the methane produced is typically combusted, and the resultant CO2 emissions are not counted. Biogas combustion emits NOX too, which contributes to equivalent CO2 emission. Therefore, emissions of CH4 + NOx and equivalent CO2 are higher for the scenarios with a higher AD ratio. The model does not consider offsetting the combustion of fossil fuels rather than biogas and, consequently, emission saving.
Process emissions of composting include only one direct emission, which originates from aerobic composting. GHG emissions of composting are thus lower than AD;
Among the proposed alternative scenarios, Sc2 indicates that using the AD unit as the sole FW treatment technology has the lowest efficiency in MTL. One of the reasons can be attributed to the FW quantity in MTL which does not seem high enough for the maximum simultaneous reduction of energy consumption and CO2 production by AD. It is worth mentioning that IWM-2 estimates the material-specific AD yields of CH4 and CO2 based upon the lab studies of AD of MSW in landfills [25]. Accordingly, various kinds of AD set-ups are neglected, and hence, further LCA studies are required based on lower FW quantity feeding to AD units in order to find out the energy consumption and CO2 emissions of each set-up. Studies showed that although there were 688 centralized AD plants for biowaste treatment (average capacity 31,700 ton/year) in EU in 2016, small scale AD (5.2 ton/year) can be technically viable with potential biogas production performance like large scale AD (3372 ton/year) [36].
4.2. Optimization Results
Based on the results obtained from IWM-2, the best scenario is when all the FW is divided between AD and compost, all the yard waste is sent to an incinerator, and all the recyclable materials are recovered. Therefore, the optimization constraints can be determined. As mentioned previously, the lower bounds for the waste input of landfill and recycling units are the current amount of waste sent to these units in MTL:
0 ≤ xAD ≤ 81,
0 ≤ xC ≤ 81,
xAD + xC = 81,
0 ≤ xCbs ≤ 133,
360 ≤ xL ≤ 683,
163 ≤ xR ≤ 357.
Table 4 shows the parameters of Equations (1) and (2) for each waste management technology, obtained by using MATLAB curve fitting tools. To explain more, based on the result of the fourth LCA scenario (Sc4), the waste input to each technology was changed and the amount of CO2eq of GHG emissions and energy consumption of each technology was recorded. Then, two curves were fitted for unit based on their waste input (one for CO2 and one for Energy). These values were used for doing the optimization. The results of two-objective and three-objective optimizations are presented in the following sections.
Table 4.
Equation parameters for different waste management technologies.
This three-objective optimization for the integrated waste management system of MTL considers the cost as an objective function in addition to total energy consumption and CO2eq emissions of GHG. Table 5 shows the best three optimum waste flows for MTL.
Table 5.
The best three waste flows resulted from optimization.
In the best optimum design (design number 1) which has the lowest total cost among these three options based on the value derived for the total amount of waste, 58% of total waste should be sent to the landfill unit (540 kt). Recycling unit has the highest share after landfill (32%) equal to 295 kt. Taking FW into account, 14.7 kt should be sent to AD and 66.3 kt to composting unit, which accounts for 2% and 7% of the total waste, respectively. The incineration unit has the lowest share in the system (1% equal to 8.5 kt) of total waste (Figure 5).
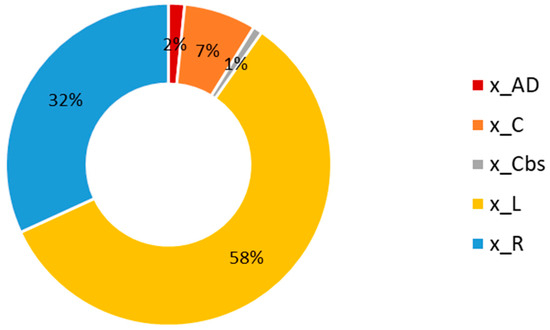
Figure 5.
The optimized waste flow for MTL.
4.3. Discussion
It is clear from the results that the main benefit of having an integrated MSWM system is a significant reduction of energy consumption and emissions. LCA provides a comprehensive, consistent and transparent overview of flows in the waste management systems with quantification of the environmental profile [37]. Based on the optimization results, the amount of recycled waste in MTL should increase by 87 kt per year. Also, adding incineration and AD units to the waste management system of the city would increase the share of energy produced from renewable sources. The results are consistent with the study by [38] with increasing focus on recycling. Also, [39] assessed the environmental and economic benefit of the substitution of energy crops with food waste in AD and concluded that a reduction of 42% in the carbon footprint of the electricity produced from the biogas plant can be obtained. Moreover, installing new units like AD and incineration creates more jobs in the city which is a social benefit of this MSWM system. A study by [40] showed that new jobs could be created in the various processing centers and between transportation nodes of the waste management system. Employment opportunities by waste to energy include the collection and sorting of waste, waste transportation, waste plant construction, and plant operation. On average, a Waste-to-Energy plant in Europe can create 62 direct jobs, and the total direct and indirect jobs in 2011 was 56,000 in Europe [41]. However, it should be noted that all these results have been driven based on this assumption that all types of wastes are separated completely which is not possible in real life. The following bullet points summarizes different challenges present in the way to achieve this optimized waste flow:
- (1)
- As mentioned above, the biggest challenge is complete separation and sorting of different types of the waste. Creating sorting units for the whole amount of waste is an expensive solution. Therefore, another solution is encouraging people to be more interested in source separation of waste.
- (2)
- Hydro Québec is the only supplier of electricity in the province of Québec. Unfortunately, there is no specific policy about buying self-generated electricity from private suppliers. Therefore, it affects the interest from external investors to help to construct expensive units like AD and incineration.
- (3)
- The other existing challenge is the public awareness. People should become aware of the hazards of landfilling the municipal waste and realize what an important role they play in different waste management scenarios.
- (4)
- Another challenge is the location of new AD and incineration units and whether there should be one central unit or several distributed units across the city. Although a study by [36] concluded the advantages of a fully decentralized AD systems, the authors believe that more detailed LCA studies are needed to find the solution for this problem.
- (5)
- The severe weather condition in Montréal during its long winters is another challenge for utilizing organic waste management facilities like AD and composting units. Further thermal energy would be required to keep the system in an optimum temperature condition. Especially in case of AD and composting, cold weather might slow down the degradation process. Putting the AD in a greenhouse has been suggested and is recommended. Study by [42] showed that an AD could 49% less heat energy by being housed in a greenhouse.
5. Conclusions
The work presents an analysis of waste flow including OW, PC, MGP, CD, textile, E-waste, harmful household product, and other materials in a case study city Montréal. It shows the huge potential of energy recovery from FW and yard waste instead of landfilling them, as is the current OW management method.
In MTL in 2017, 931 kt waste was generated, and the portion of diverted and landfilled waste was 45% and 55%, respectively. OW in MTL accounted for 369 kt from which around 85 kt was recovered.
Four scenarios were analyzed to assess the greenhouse gas emissions and costs of different waste management strategies. With the current waste management system as the reference scenario 1, the proposed scenarios Sc2, Sc3, and Sc4 feed all the yard waste to incineration. Moreover, all the food waste goes to anaerobic digestion in Sc2 and to composting in Sc3. Sc4 considers 50% of FW for AD and composting.
The LCA study showed that in MTL, Sc3 and Sc4 are the better waste management scenarios in which 14,027 TJ and 14,043 TJ energy is saved, and 127 kt and 144 kt CO2eq are emitted, respectively.
Based on the results obtained from LCA studies, NSGA-II was used as an optimization algorithm to optimize the waste flow in MTL. The objective functions were minimizing the total energy consumption and CO2eq emission of GHG and the total cost in the waste management system. The optimized waste flow for MTL by using a three-objective optimization algorithm is sending 2% of waste (14.7 kt) to AD, 7% (66.3 kt) to compost, 32% (295 kt) to recycling, 1% (8.5 kt) to incineration, and 58% (543 kt) to landfill.
Based on the optimization results, the benefits of this integrated MSWM system are significant reduction of energy consumption and equivalent CO2 emissions. The other benefits are increasing the share of renewable energy production and creating more jobs through construction of AD and incinerations units. However, this should be noted that in all these scenarios it has been assumed that different waste types are completely separated. Therefore, proper separation and sorting of recyclable material, food waste and yard waste is a big challenge. Another challenge is the lack of a specific policy for buying self-generated electricity, which reduces the interest from external investors to invest into the construction of AD and incineration units in the city. The other challenge is low public awareness about the dangers of landfilling and their important role in having an efficient MSWM system. Finally, the severe weather conditions during the long winters of MTL could affect the efficiency of AD and composting and these units would need further thermal energy to operate properly.
Author Contributions
Data curation, T.M.; Formal analysis, T.M. and S.R.; Investigation, T.M. and S.R.; Methodology, T.M. and S.R.; Project administration, T.M; Resources, T.M; Software, T.M and S.R.; Supervision, U.E.; Validation, S.R.; Visualization, T.M. and S.R.; Writing – original draft, T.M. and S.R.; Writing – review & editing, U.E. All authors have read and agreed to the final version of the manuscript.
Funding
This research was supported by NSERC funding for the Canada Excellence Research Chair in Smart, Sustainable and Resilient Cities and Communities.
Conflicts of Interest
The authors declare no conflict of interest.
References
- Mayer, F.; Bhandari, R.; Gath, S. Critical review on life cycle assessment of conventional and innovative waste-to-energy technologies. Sci. Total Environ. 2019, 672, 708–721. [Google Scholar] [CrossRef] [PubMed]
- Malmir, T.; Tojo, Y. Municipal solid waste management in Tehran: Changes during the last 5 years. Waste Manag. Res. 2016, 34, 449–456. [Google Scholar] [CrossRef] [PubMed]
- Sindhu, R.; Gnansounou, E.; Rebello, S.; Binod, P.; Varjani, S.; Thakur, I.S.; Nair, R.B.; Pandey, A. Conversion of food and kitchen waste to value-added products. J. Environ. Manag. 2019, 241, 619–630. [Google Scholar] [CrossRef] [PubMed]
- United States Environmental Protection Agency. Advancing Sustainable Materials Management: 2014 Fact Sheet; United States Environmental Protection Agency, Office of Land and Emergency Management: Washington, DC, USA, 2016.
- United States Environmental Protection Agency. Advancing Sustainable Materials Management: 2015 Fact Sheet; United States Environmental Protection Agency, Office of Land and Emergency Management: Washington, DC, USA, 2018.
- Evangelisti, S.; Lettieri, P.; Borello, D.; Clift, R. Life cycle assessment of energy from waste via anaerobic digestion: A UK case study. Waste Manag. 2014, 34, 226–237. [Google Scholar] [CrossRef]
- European Environment Agency. Diversion of Waste from Landfill; European Environment Agency: Copenhagen, Denmark, 2019.
- Levaggi, L.; Levaggi, R.; Marchiori, C.; Trecroci, C. Waste-to-Energy in the EU: The Effects of Plant Ownership, Waste Mobility, and Decentralization on Environmental Outcomes and Welfare. Sustainability 2020, 12, 5743. [Google Scholar] [CrossRef]
- McDougall, F.R.; White, P.R.; Franke, M.; Hindle, P. Integrated Solid Waste Management: A Life Cycle Inventory; John Wiley & Sons: Hoboken, NJ, USA, 2001. [Google Scholar]
- Lundie, S.; Peters, G.M. Life cycle assessment of food waste management options. J. Clean. Prod. 2005, 13, 275–286. [Google Scholar] [CrossRef]
- De Feo, G.; Ferrara, C.; Iuliano, C.; Grosso, A. LCA of the Collection, Transportation, Treatment and Disposal of Source Separated Municipal Waste: A Southern Italy Case Study. Sustainability 2016, 8, 1084. [Google Scholar] [CrossRef]
- Lyng, K.-A.; Stensgård, A.E.; Hanssen, O.J.; Modahl, I.S. Relation between greenhouse gas emissions and economic profit for different configurations of biogas value chains: A case study on different levels of sector integration. J. Clean. Prod. 2018, 182, 737–745. [Google Scholar] [CrossRef]
- Nayal, F.S.; Mammadov, A.; Ciliz, N. Environmental assessment of energy generation from agricultural and farm waste through anaerobic digestion. J. Environ. Manag. 2016, 184, 389–399. [Google Scholar] [CrossRef]
- Grigatti, M.; Barbanti, L.; Hassan, M.U.; Ciavatta, C. Fertilizing potential and CO2 emissions following the utilization of fresh and composted food-waste anaerobic digestates. Sci. Total Environ. 2020, 698, 134198. [Google Scholar] [CrossRef]
- Quek, A.; Balasubramanian, R. Life Cycle Assessment of Energy and Energy Carriers from Waste Matter—A Review. J. Clean. Prod. 2014, 79, 18–31. [Google Scholar] [CrossRef]
- Gouvernement du Québec. The 2030 Energy Policy; Gouvernement du Québec: Montreal, QC, Canada, 2016.
- Mohsenizadeh, M.; Tural, M.K.; Kentel, E. Municipal solid waste management with cost minimization and emission control objectives: A case study of Ankara. Sustain. Cities Soc. 2020, 52, 101807. [Google Scholar] [CrossRef]
- Richter, A.; Bruce, N.; Ng, K.T.; Chowdhury, A.; Vu, H.L. Comparison between Canadian and Nova Scotian waste management and diversion models—A Canadian case study. Sustain. Cities Soc. 2017, 30, 139–149. [Google Scholar] [CrossRef]
- Ville de Montréal. Portrait 2016 des Matières Résiduelles de L’agglomération de Montreal; Ville de Montréal: Montreal, QC, Canada, 2017. [Google Scholar]
- Québec, Government of Québec, Institut de la statistique. 2015. Available online: www.stat.gouv.qc.ca/statistiques/profils/region_06/region_06_00_an.htm (accessed on 23 October 2019).
- Communauté Métropolitaine de Montréal. Draft amendment, To the 2015–2020 residual materials management plan for metropolitan Montréal; Communauté Métropolitaine de Montréal: Montreal, QC, Canada, 2019. [Google Scholar]
- Henault-Ethier, L.; Martin, J.P.; Housset, J. A dynamic model for organic waste management in Quebec (D-MOWIQ) as a tool to review environmental, societal and economic perspectives of a waste management policy. Waste Manag 2017, 66, 196–209. [Google Scholar] [CrossRef]
- Ville de Montréal. Bilan 2017 des Matières Résiduelles de L’agglomération de Montréal; Ville de Montréal: Montreal, QC, Canada, 2018. [Google Scholar]
- Nielsen, T.D.; Holmberg, K.; Stripple, J. Need a bag? A review of public policies on plastic carrier bags—Where, how and to what effect? Waste Manag. 2019, 87, 428–440. [Google Scholar] [CrossRef]
- Malmir, S.; Montero, B.; Rico, M.; Barral, L.; Bouza, R. Morphology, thermal and barrier properties of biodegradable films of poly (3-hydroxybutyrate-co-3-hydroxyvalerate) containing cellulose nanocrystals. Compos. Part A Appl. Sci. Manuf. 2017, 93, 41–48. [Google Scholar] [CrossRef]
- Malmir, S.; Montero, B.; Rico, M.; Barral, L.; Bouza, R.; Farrag, Y. PHBV/CNC bionanocomposites processed by extrusion: Structural characterization and properties. Polym. Compos. 2019, 40, E275–E284. [Google Scholar] [CrossRef]
- Guerin, J.E.; Paré, M.C.; Lavoie, S.; Bourgeois, N. The importance of characterizing residual household waste at the local level: A case study of Saguenay, Quebec (Canada). Waste Manag. 2018, 77, 341–349. [Google Scholar] [CrossRef]
- EPIC/CSR (Environment and Plastics Industry Council/Corporations Supporting Recycling). Integrated Solid Waste Management Tools: User Guidance Document; EPIC/CSR (Environment and Plastics Industry Council/Corporations Supporting Recycling): Carrey, NC, USA, 2000. [Google Scholar]
- Haight, M. Technical Report: Integrated Solid Waste Management Model; University of Waterloo: Waterloo, ON, Canada, 2004. [Google Scholar]
- Pourreza Movahed, Z.; Kabiri, M.; Ranjbar, S.; Joda, F. Multi-objective optimization of life cycle assessment of integrated waste management based on genetic algorithms: A case study of Tehran. J. Clean. Prod. 2020, 247, 119153. [Google Scholar] [CrossRef]
- Éco Entreprises Québec. Consultation Tarif 2019—Sommaire; Éco Entreprises Québec: Montreal, QC, Canada, 2019. [Google Scholar]
- Colvero, D.A.; Ramalho, J.; Gomes, A.P.D.; de Matos, M.A.A.; da Cruz Tarelho, L.A. Economic analysis of a shared municipal solid waste management facility in a metropolitan region. Waste Manag. 2020, 102, 823–837. [Google Scholar] [CrossRef]
- Deb, K. Multi-objective Optimization Using Evolutionary Algorithms; John Wiley & Sons: Hoboken, NJ, USA, 2001; Volume 16. [Google Scholar]
- Deb, K.; Pratap, A.; Agarwal, S.; Meyarivan, T.A.M.T. A Fast and Elitist Multiobjective Genetic Algorithm: NSGA-II. IEEE Trans. Evol. Comput. 2002, 6, 182–197. [Google Scholar] [CrossRef]
- Wang, Y.; Shen, Y.; Zhang, X.; Cui, G.; Sun, J. An Improved Non-dominated Sorting Genetic Algorithm-II (INSGA-II) applied to the design of DNA codewords. Math. Comput. Simul. 2018, 151, 131–139. [Google Scholar] [CrossRef]
- Thiriet, P.; Bioteau, T.; Tremier, A. Optimization method to construct micro-anaerobic digesters networks for decentralized biowaste treatment in urban and peri-urban areas. J. Clean. Prod. 2020, 243, 118478. [Google Scholar] [CrossRef]
- Christensen, T.H.; Damgaard, A.; Levis, J.; Zhao, Y.; Björklund, A.; Arena, U.; Barlaz, M.A.; Starostina, V.; Boldrin, A.; Astrup, T.F.; et al. Application of LCA modelling in integrated waste management. Waste Manag. 2020, 118, 313–322. [Google Scholar] [CrossRef]
- Habib, K.; Schmidt, J.H.; Christensen, P. A historical perspective of Global Warming Potential from Municipal Solid Waste Management. Waste Manag. 2013, 33, 1926–1933. [Google Scholar] [CrossRef] [PubMed]
- Bartocci, P.; Zampilli, M.; Liberti, F.; Pistolesi, V.; Massoli, S.; Bidini, G.; Fantozzi, F. LCA analysis of food waste co-digestion. Sci. Total Environ. 2020, 709, 136187. [Google Scholar] [CrossRef]
- Safdar, N.; Khalid, R.; Ahmed, W.; Imran, M. Reverse logistics network design of e-waste management under the triple bottom line approach. J. Clean. Prod. 2020, 272, 122662. [Google Scholar] [CrossRef]
- Sooriyaarachchi, T.M.; Tsai, I.T.; El Khatib, S.; Farid, A.M.; Mezher, T. Job creation potentials and skill requirements in, PV, CSP, wind, water-to-energy and energy efficiency value chains. Renew. Sustain. Energy Rev. 2015, 52, 653–668. [Google Scholar] [CrossRef]
- Walker, M.; Theaker, H.; Yaman, R.; Poggio, D.; Nimmo, W.; Bywater, A.; Blanch, G.; Pourkashanian, M. Assessment of micro-scale anaerobic digestion for management of urban organic waste: A case study in London, UK. Waste Manag. 2017, 61, 258–268. [Google Scholar] [CrossRef]


Publisher’s Note: MDPI stays neutral with regard to jurisdictional claims in published maps and institutional affiliations. |
© 2020 by the authors. Licensee MDPI, Basel, Switzerland. This article is an open access article distributed under the terms and conditions of the Creative Commons Attribution (CC BY) license (http://creativecommons.org/licenses/by/4.0/).