Article

Solar+ Optimizer: A Model Predictive Control Optimization Platform for Grid Responsive Building Microgrids

1
Lawrence Berkeley National Laboratory, Berkeley, CA 94720, USA
2
Schatz Energy Research Center, Humboldt State University, Arcata, CA 95521, USA
3
Department of Electrical Engineering and Computer Sciences, University of California Berkeley, Berkeley, CA 94720, USA
*
Author to whom correspondence should be addressed.
These authors contributed equally to this work.
Energies 2020, 13(12), 3093; https://doi.org/10.3390/en13123093
Submission received: 18 May 2020 / Revised: 6 June 2020 / Accepted: 9 June 2020 / Published: 15 June 2020
(This article belongs to the Special Issue Evaluation of Energy Efficiency and Flexibility in Smart Buildings)

Abstract

:
With the falling costs of solar arrays and battery storage and reduced reliability of the grid due to natural disasters, small-scale local generation and storage resources are beginning to proliferate. However, very few software options exist for integrated control of building loads, batteries and other distributed energy resources. The available software solutions on the market can force customers to adopt one particular ecosystem of products, thus limiting consumer choice, and are often incapable of operating independently of the grid during blackouts. In this paper, we present the “Solar+ Optimizer” (SPO), a control platform that provides demand flexibility, resiliency and reduced utility bills, built using open-source software. SPO employs Model Predictive Control (MPC) to produce real time optimal control strategies for the building loads and the distributed energy resources on site. SPO is designed to be vendor-agnostic, protocol-independent and resilient to loss of wide-area network connectivity. The software was evaluated in a real convenience store in northern California with on-site solar generation, battery storage and control of HVAC and commercial refrigeration loads. Preliminary tests showed price responsiveness of the building and cost savings of more than 10% in energy costs alone.

Graphical Abstract

1. Introduction

The United States electrical grids face a range of new challenges to safe and reliable operation: aging infrastructure, increased penetration of less predictable renewable generators to mitigate climate change and the increasing occurrence of extreme weather events all place stress on the grid [1]. To address these issues, more decentralized grid architectures have been proposed [2] based on distributed energy resources (DERs) and microgrids [3,4,5]. Collections of buildings with local DER and energy storage could operate in grid-disconnected (islanded) mode in case of outages, improving system resiliency [6,7]. Buildings that participate as DERs could also provide additional opportunities for energy storage using their thermal systems (Heating, Ventilation and Air Conditioning (HVAC) and Refrigeration) [8]. With the emergence of low-cost solar and battery storage, small-size microgrids are now a commercially viable option at sites with a high value for resilience and several products to control them have appeared in the market [9,10,11]. However, microgrid software typically focuses on site protection and battery control and does not coordinate with control of building systems, especially HVAC [12].
HVAC systems represent the largest fraction of the energy use and demand in commercial buildings [13]. Traditional HVAC control strategies deploy rather simple control algorithms [14] that might reside in zone-level thermostats (in small and medium commercial buildings) or in a centralized building automation system (in larger commercial buildings). These algorithms rely on static schedules, irrespective of the actual occupancy of the building or grid needs. While more modern HVAC control strategies exist, they do not typically incorporate DER and are largely proprietary in their implementation, making them hard to extend.
The lack of interoperability between these new control systems limits the realization of the full potential for microgrid systems [15]. For instance, a microgrid controller that has very little information about the status of the building and its projected load cannot operate the battery optimally. Furthermore, there can be missed opportunities for HVAC and refrigeration controllers to take full advantage of periods of high solar generation to pre-cool or pre-heat, utilizing innate thermal storage in the mass of buildings and refrigerated goods.
To address this gap, this paper presents a software platform called “Solar+ Optimizer” (SPO), which was developed, deployed and tested in a pilot application at a fueling station with convenience store in Blue Lake, California, United States. The software provides optimal control of the building loads and DERs and has been built exclusively on open-source libraries. The controller takes into account the time-varying costs of energy and demand and the status of the grid connection to reduce the overall operational cost for the building owner, and it provides demand-response services to the grid. The platform is designed to be scalable, as well as vendor and protocol agnostic. This allows building managers to take advantage of a larger market of connected devices (both sensors and actuators) without being tied down to any particular manufacturer ecosystem, and it could enable less costly adaptation and modification of the system over the expected multi-decade lifetime of microgrid hardware.
The paper is organized as follows. Section 2 reviews the existing literature of advanced control studies with a focus on experimental and field studies. Section 3 introduces the overall software architecture and details the principal components within. Section 4 describes the deployment of the hardware and software on a case study and presents experimental results and analysis. Section 5 discusses the results and technical challenges encountered during the demonstration. The paper ends with conclusions and future work in Section 6.

2. Literature Review and Contribution

Research on advanced control strategies and algorithms (e.g., MPC and reinforcement learning) with application to building systems and DERs has grown significantly in the last decade [16], as the potential of these advanced controls to provide flexibility to the electrical grid has become more evident. Previous studies have investigated MPC applications in a range of HVAC and thermal energy storage systems in buildings: These include MPC utilizing an ice storage tank and building thermal mass [17,18]); MPC for Air Handlers (AHU) and Variable Air Volume (VAV) systems [19,20,21]; and MPC applied to window operation for mixed natural and mechanical ventilation in an office building [22,23]. Studies have also demonstrated the coordination of HVAC, energy storage and PV generation using MPC based controls in simulated commercial buildings [24,25,26,27]. However, most of these studies developed customized solutions, closely tied to the specific building and equipment setup; the gap that this work fills is an MPC application that is built to be extensible and scalable.
There are several control algorithms that have been used for optimizing building systems and DER. Linear programming was employed to minimize the conditional value at risk in the objective function while providing resilience and cost minimization in commercial buildings through local energy generation and storage [7,28]. Genetic algorithms have also been used to optimize the building thermal loads [29,30]. Reduced energy costs and improved occupant thermal comfort within buildings were achieved by using particle swarm optimization [31,32]. Dynamic programming was employed by Benjamin Heymann and Jiménez-Estévez [33] to reduce the energy costs while meeting the building load requirements. A neural network model was trained using the Levenberg–Marquardt algorithm to predict the optimal boiler operation period in commercial buildings [34]. Another emerging type of advanced control is Deep Reinforcement Learning (DRL) [35,36,37,38,39,40]. While DRL is a model-free approach, most DRL methods use detailed models to generate synthetic data for training purposes. EnergyPlus models of the buildings have been used during the training period [36,37,38,39,40], along with the Building Controls Virtual Test-Bed (BCVTB) [41], which has been leveraged for controls based on the co-simulation framework [37,38]. The DRL algorithms were used to minimize energy costs while maintaining thermal comfort by controlling room temperature setpoints [37], air flowrate in the VAV boxes [38], supply water temperature [39] or outdoor air damper positions [40]. This robust area of new research is promising, with many approaches to optimal control still in their infancy. There is not yet an agreed-on standard approach for these problems.
While the majority of research on advanced control algorithms is conducted on simulations, some studies have deployed those advanced controls on real systems, which allows researchers to test their software in a live environment with unforeseen system behavior that is difficult or impossible to include in simulation. MPC control of multiple air handling units (AHUs) or rooftop units (RTUs) in multi-zone real buildings are demonstrated in [42,43,44,45,46]. Experiments using MPC to control building systems, behind-the-meter energy storage and DERs have also been demonstrated [47,48,49]. MPC based controllers were deployed in office buildings to determine the setpoints for the supply air temperature, fan speed and the zone air temperature for each AHU [42,43], and West et al. [42] additionally controlled the chilled water and hot water valve position. MPC has also been used to control the air conditioning in large spaces that were served by multiple RTUs by turning on/off different stages of operation of each RTU. These controls were demonstrated in a gym space of a university campus [44] and in a restaurant [45]. Carli et al. [46] used MPC to control the fan speed of a fan coil unit that supplies conditioned air to a single office space in a university building. Frequency regulation as a grid service (by varying the air flow rate setpoints, which resulted in modifying the fan speed) was implemented in the FLEXLAB ® testbed [50] at Lawrence Berkeley National Laboratory [47,48]. A public school building in southern Italy was chosen as a site of demonstration in [49], where the authors performed their optimizations in the cloud and send the control signals to the Internet of Things (IoT) devices and controllers that were retrofitted in the school building to control the battery and various loads through an intermediary gateway. DRL strategies have also been implemented in real buildings, although in small experiments. Chen et al. [51] used DRL to control the damper position of a VAV box in a single conference room in a building and Zhang and Lam [52] used it to control the supply water setpoint to the HVAC system in a experimental test-bed office in a university building.
A core barrier in progressing from simulations to real-world deployment of advanced controls is the lack of a robust and reliable software infrastructure to implement those controls in real-world building systems, which often have an eclectic mix of various controllers and systems in place. There has been work on middle-ware software platforms that collect data from various connected sensors and actuators across different systems within a building [42,43,46,48,49,53,54,55,56]. The ability to retrieve data from various IoT sensors and devices, store these data centrally and use them for simulations of better control algorithms have been demonstrated in [46,49,53,54,55,56]. Interfacing with the existing proprietary control software for gathering data and publishing control signals is another common solution, but this requires site specific implementations as seen in [42,43,48]. Bruno et al. [49] and Carli et al. [46] introduced a software stack and also demonstrate actual controls capabilities on real buildings based on decisions determined by the optimization engine. However, the architecture seems rather case specific with no mention of expansion capabilities to other types of buildings or systems. The VOLTTRON [57] platform has also been used in research studies for data collection and optimization of flexible building loads and grid integration, but these works have been in simulation [58,59,60], in laboratory environments [61], or are still in progress [62,63]. Most of the platforms reviewed here employ a publish-subscribe method of communication (usually Message Queue Telemetry Transport, MQTT [64]) for messaging, which relies upon a central broker, usually residing in the cloud. This is in line with broader trends for information technology and software services moving to a cloud-based software architecture, but the buildings industry is justifiably reluctant to adopt this model. Cybersecurity vulnerabilities and the possible loss of data and control signals during a network outage are major issues that concern building managers, particularly in commercial buildings. Furthermore, in a microgrid application there can be loss of network connectivity during a blackout, when the system is expected to continue working and provide resilience. Hence, having controls that are able to operate in a mode with local communication and computation may be required to enable widespread adoption of smart control platforms.
Among the field demonstrations of advanced controls, the scope of controls were limited to a very small subset of buildings, mostly office spaces and buildings on university campuses, laboratories or experimental test-beds. Experiments were conducted in well-instrumented environments and thus presented more measured data for advanced controls deployment than general buildings do. Most existing studies rely on proprietary software and do not describe the effort required to deploy both software and hardware, which is critical for replication. While some papers discuss software implementation, the focus was generally on communication and software architecture, with less emphasis on the integration of systems and controls with those software. Those that did demonstrate integration between the controller and the building, deployed a cloud based solution that is susceptible to network outages and more vulnerable to security risks. The SPO solution presented in this paper represents an advance in the field studies of advanced building controls by narrowing the gap between MPC based simulation studies and field demonstrations. The main contributions of this paper are:
  • An integrated software architecture that supports a vendor- and protocol-agnostic data acquisition and control framework that enables both local and/or cloud based controls. The architecture is extensible to other building types, equipment and DERs.
  • A field demonstration of this software controlling HVAC, refrigeration and DER using MPC. The software is deployed in the local area network in a real-world small commercial building.
  • A proof-of-concept demonstration of a building controller that is responsive to various grid signals (time varying energy costs) and that supports demand response events.
  • A description of the implementation challenges experienced during deployment and operations, intended to accelerate the effort of future researchers and practitioners who could avoid these barriers that have been identified.

3. Controller Architecture and Components

The Solar+ Optimizer (SPO) is a software solution that has been developed to integrate sensors and controllers for building systems and DERs and to identify real-time optimal control actions for the connected systems such as building loads and batteries. It supports integration across multiple devices and protocols, as illustrated in the architecture diagram in Figure 1. Through support for several communication protocols and APIs, SPO allows integration of systems that are typical for small and medium commercial buildings. It can operate completely within a local network, but can also be configured to operate in tandem with cloud-based resources. This section describes the different software components of SPO that enable these capabilities.

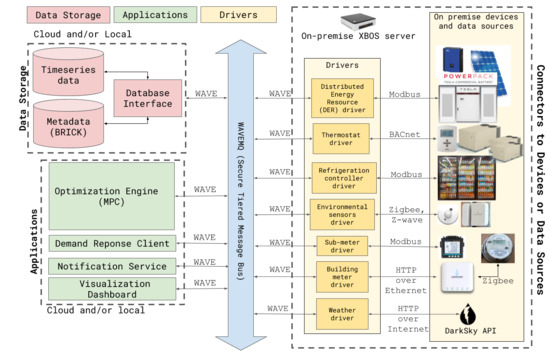
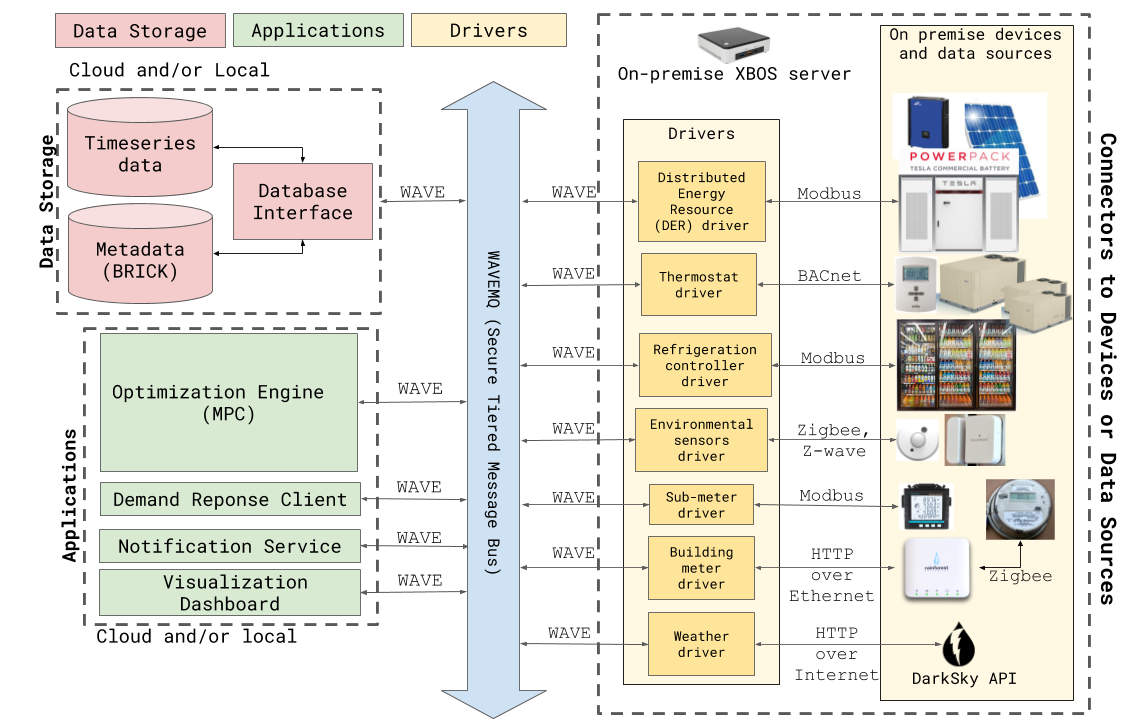
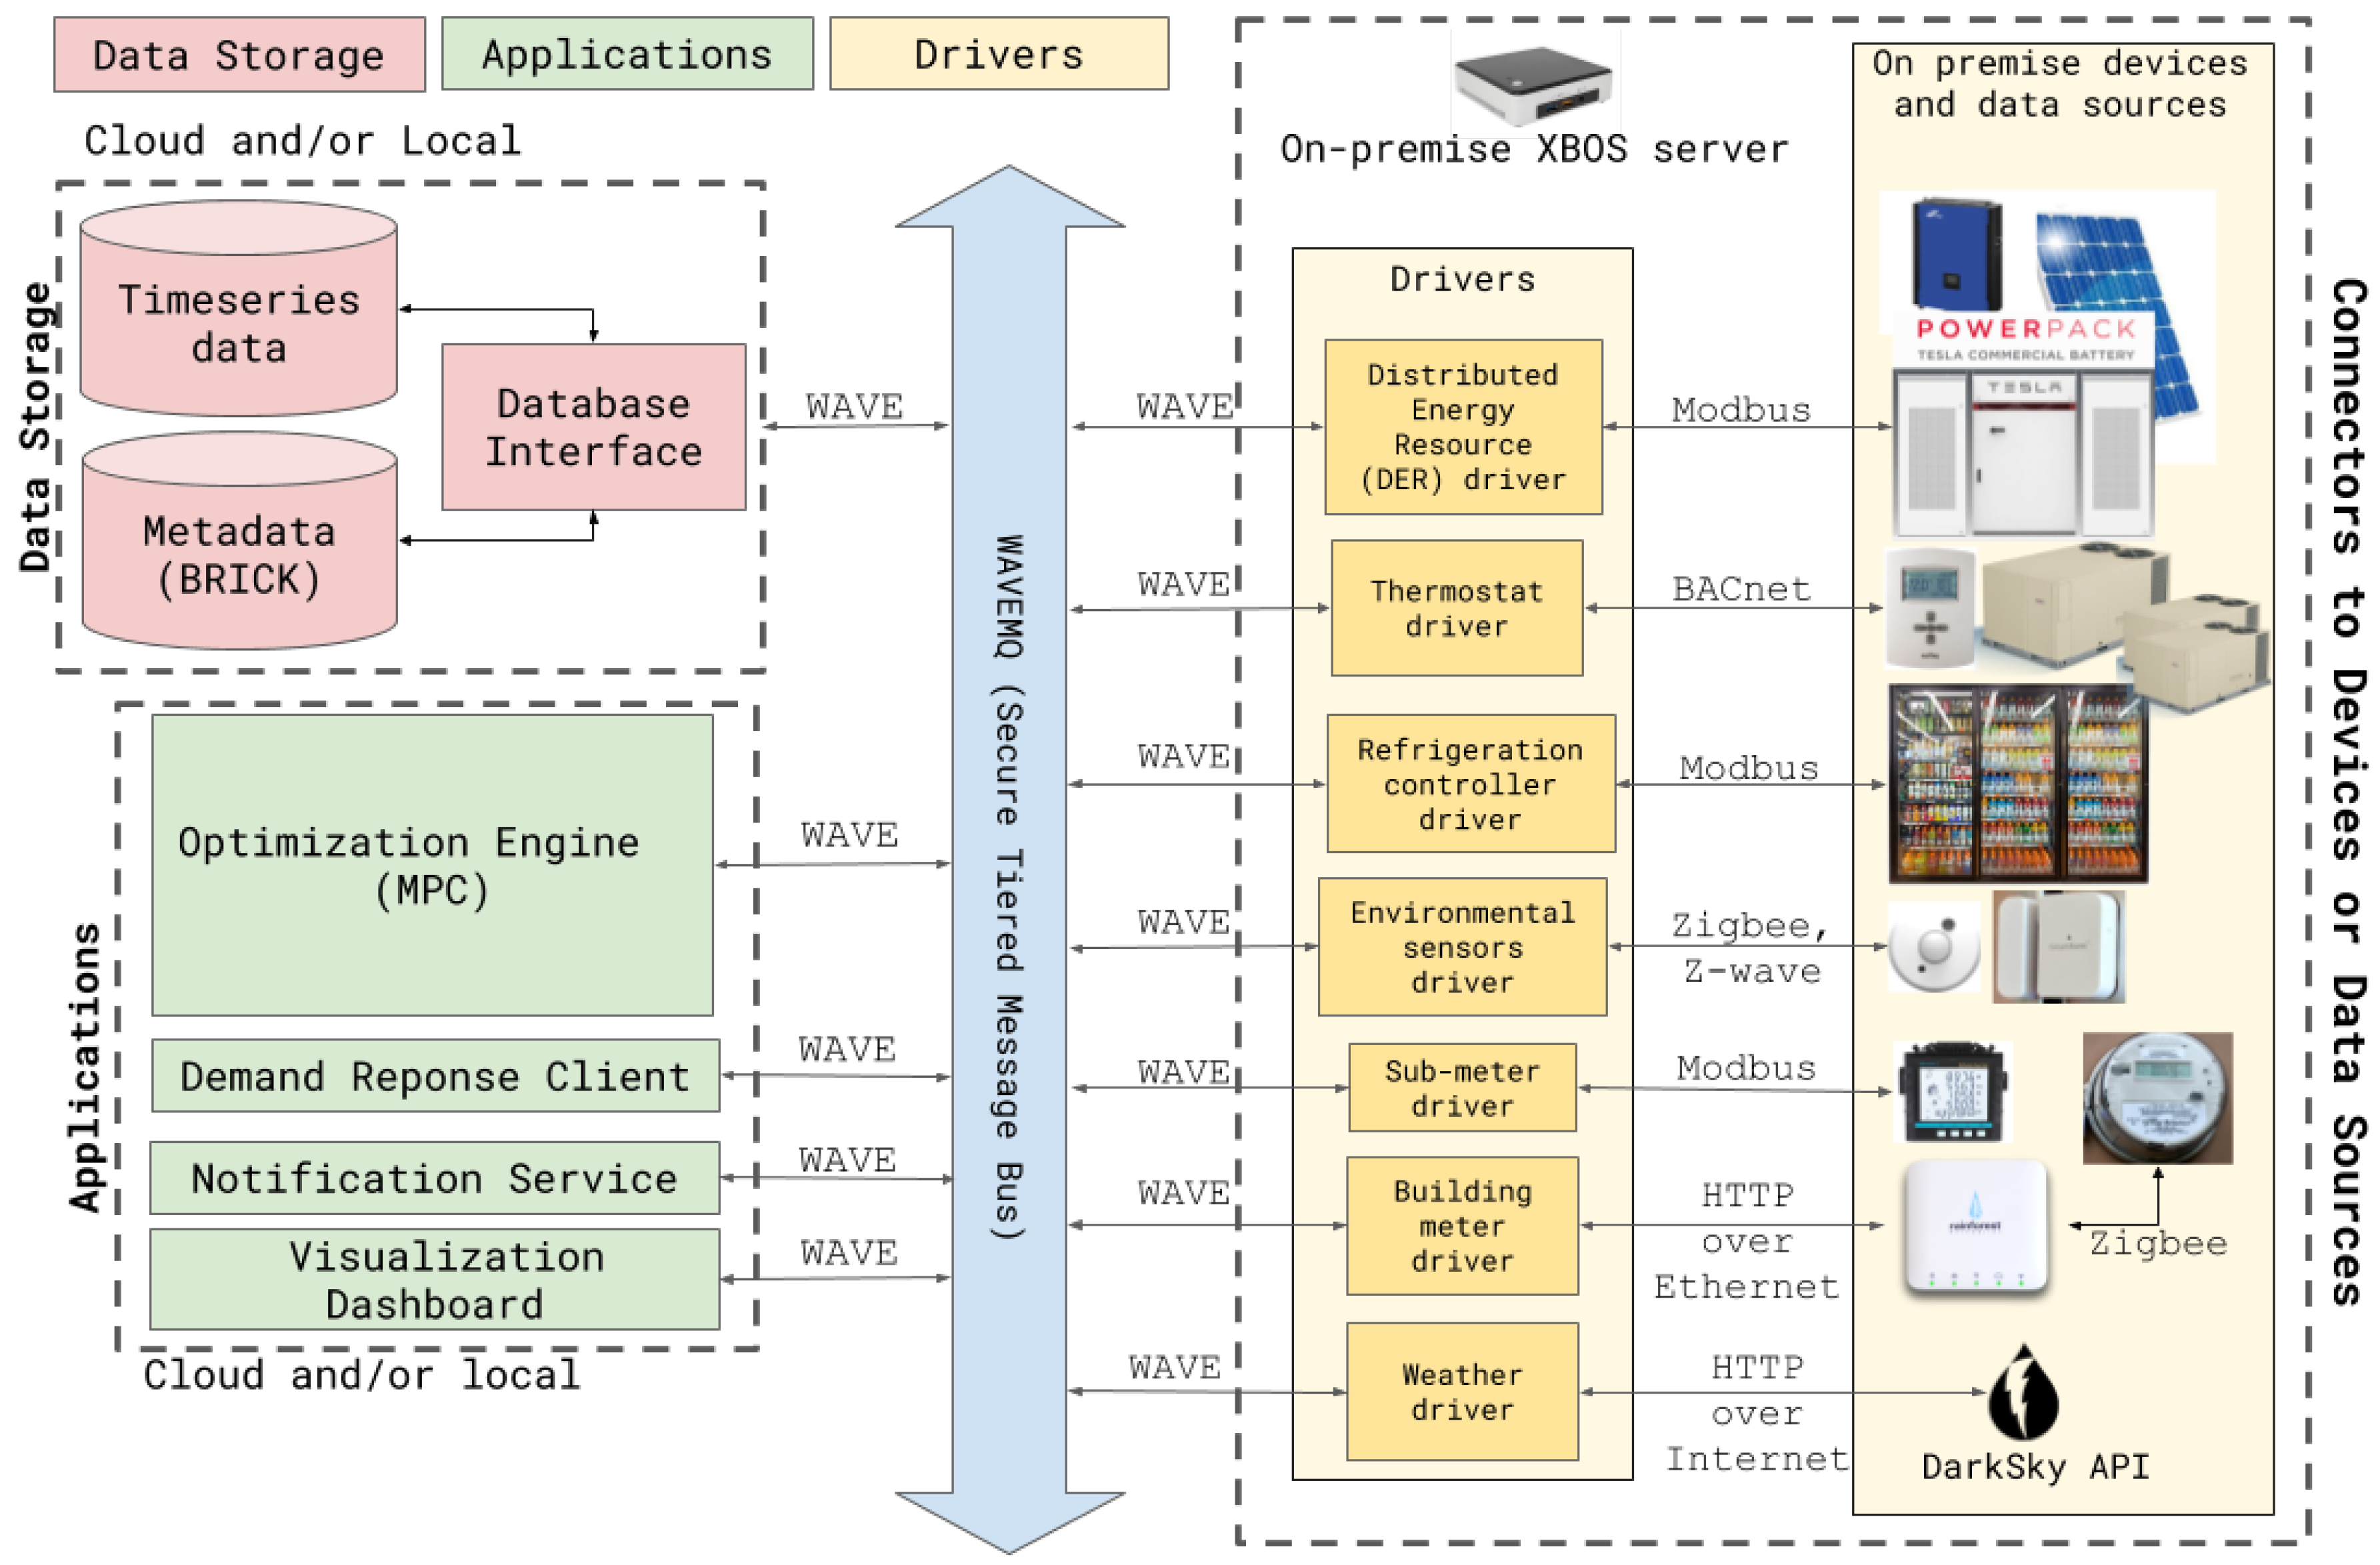
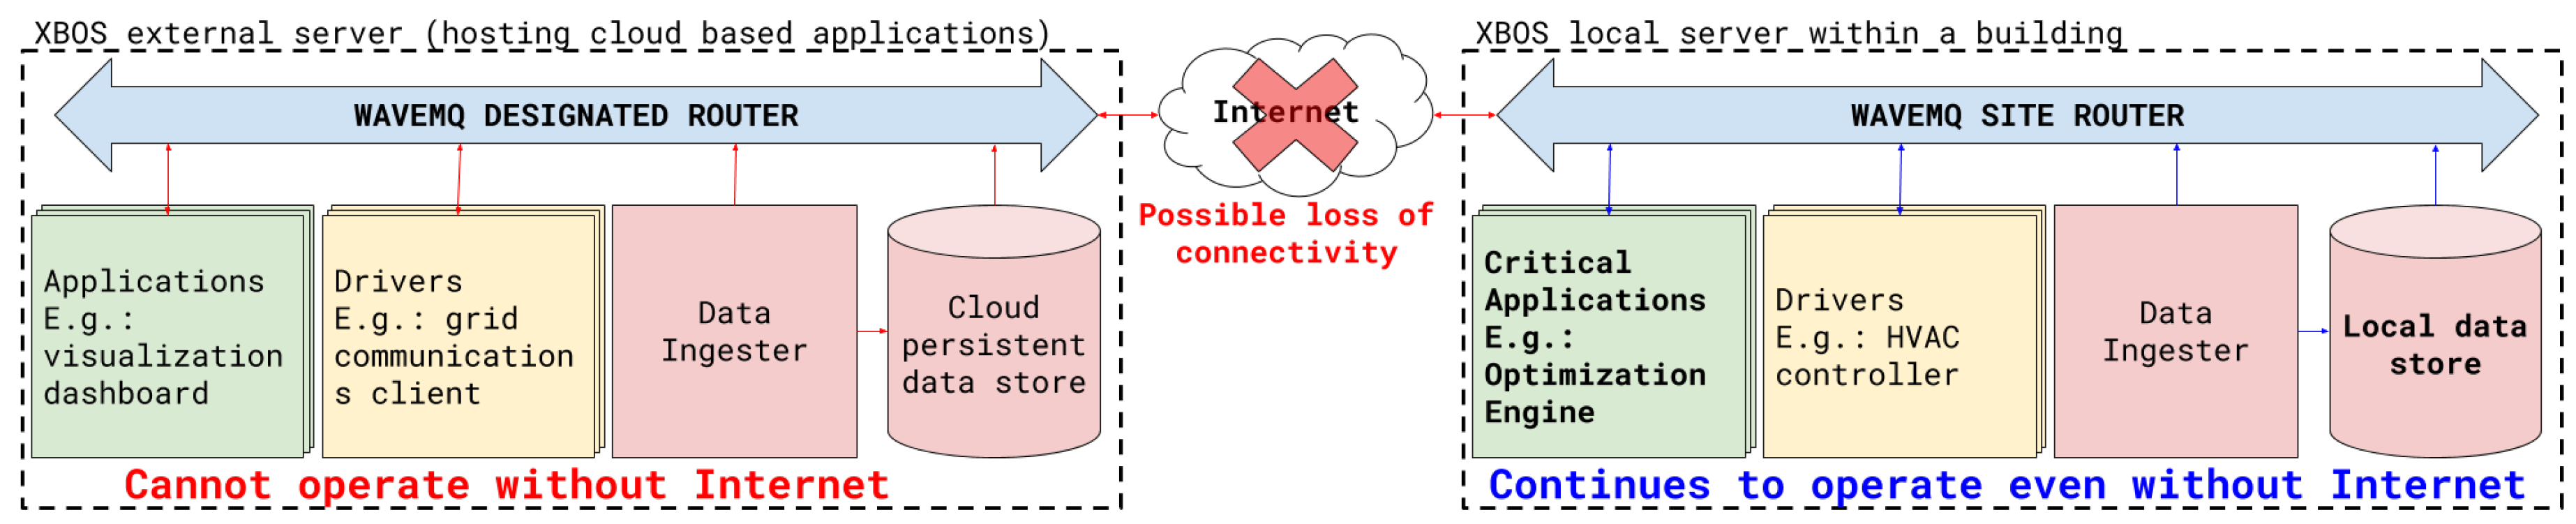
3.1. eXtensible Building Operating System (XBOS)

To coordinate the numerous heterogeneous connected devices and controllers within a building, robust network communication is a key requirement. Most commercial and academic solutions use middleware, i.e., software that resides between the hardware devices and other data sources that produce data and the applications that use these data. SPO uses XBOS, an open-source building operating system developed for real-time data acquisition from sensors and control of building actuators [65]. XBOS consists of the following components:
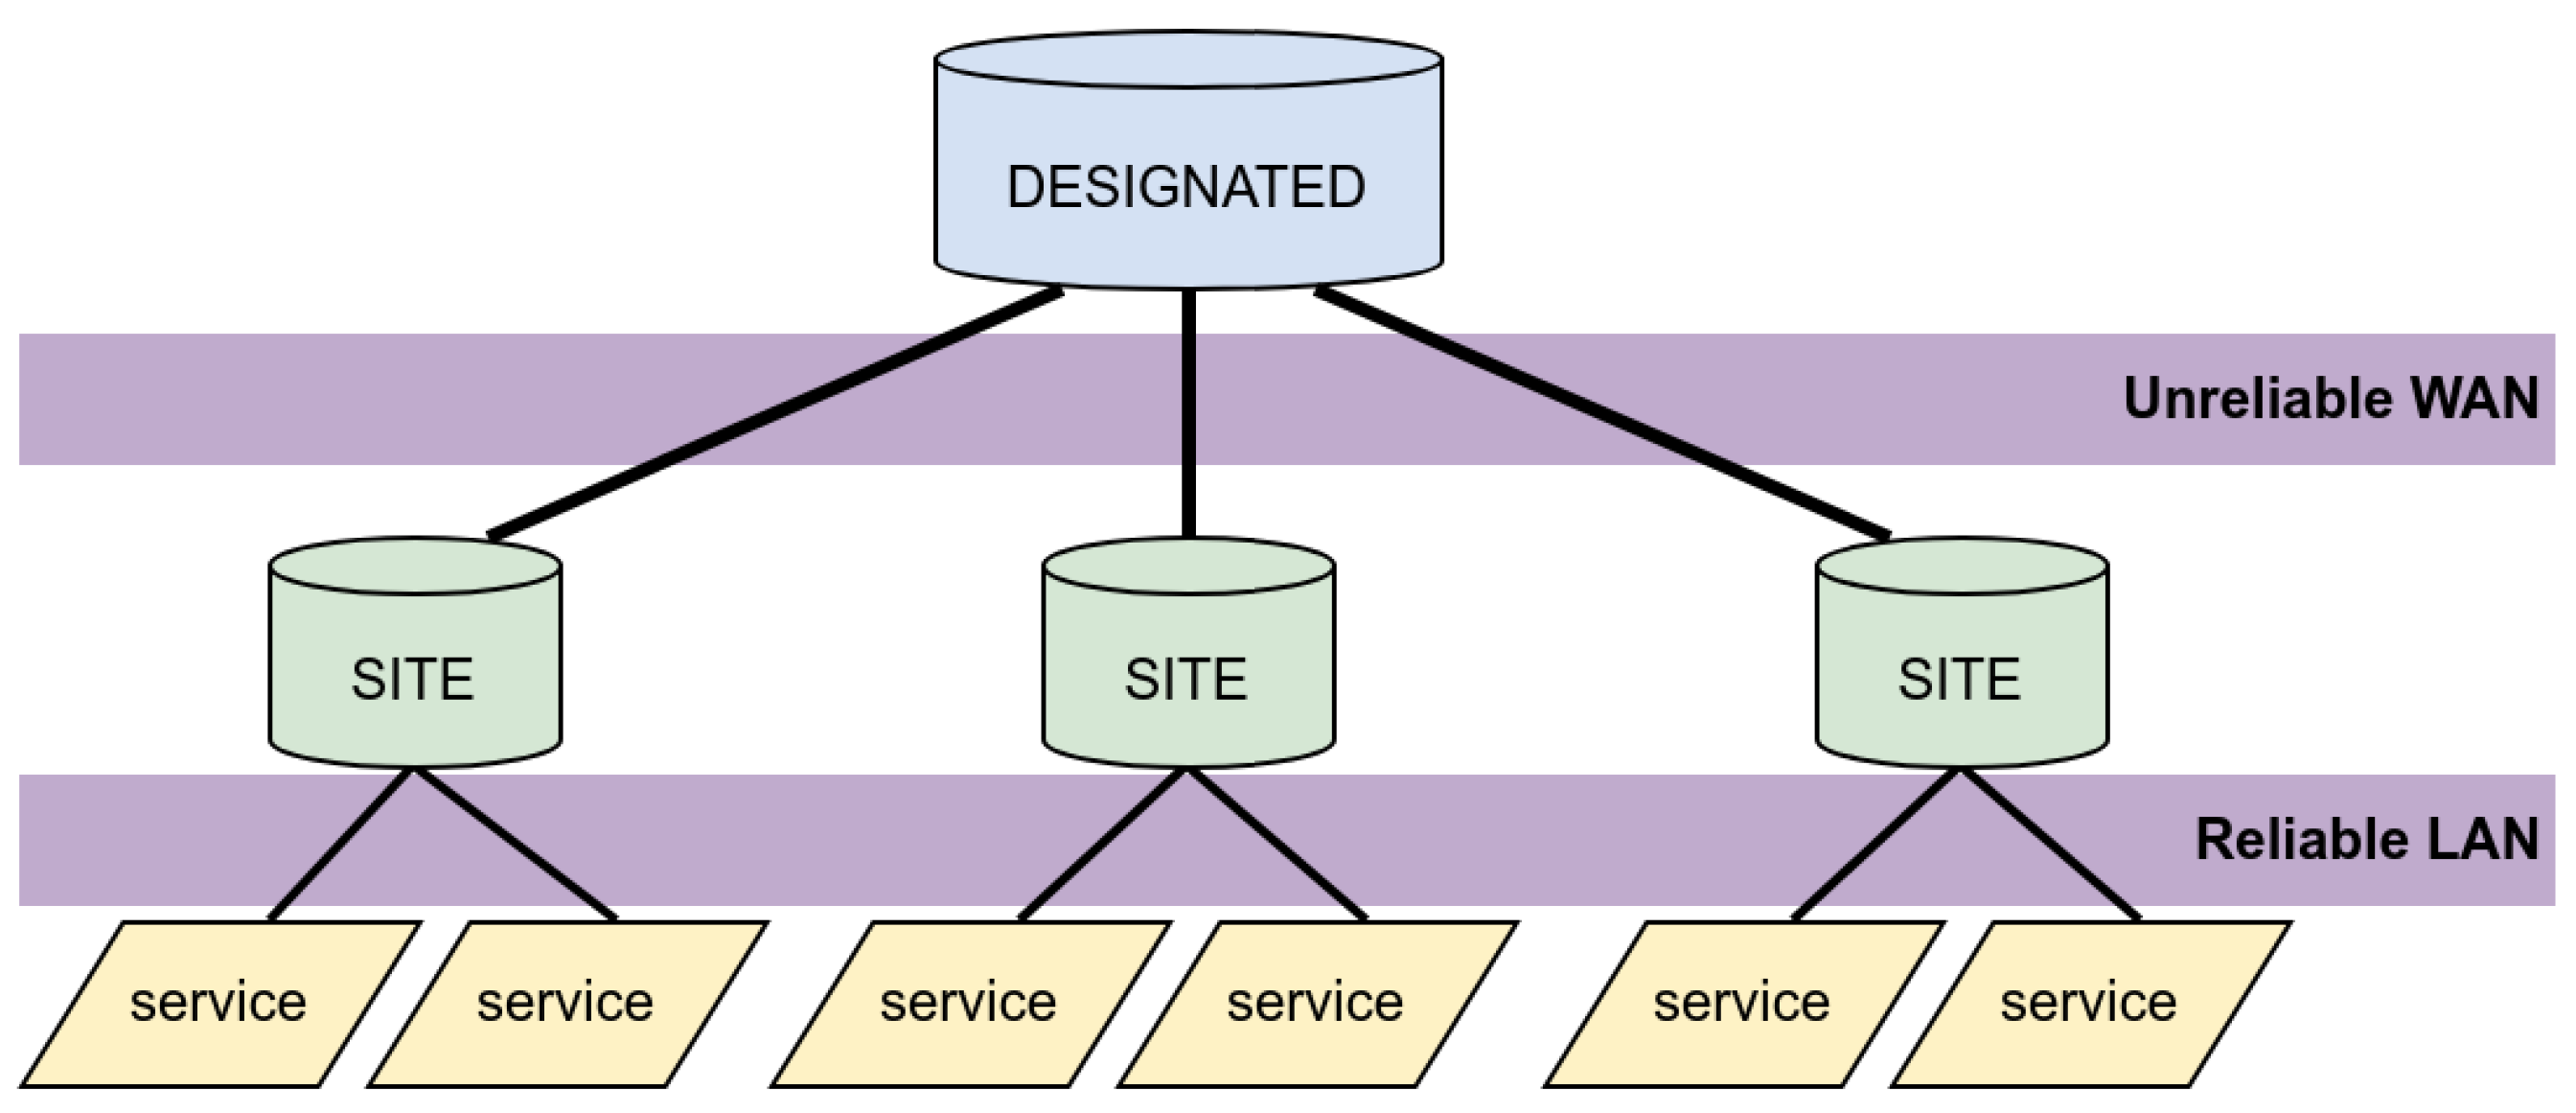
  • WAVE and WAVEMQ: WAVE is an authentication engine that handles permissions and access control. WAVEMQ is a multi-tier publish-subscribe message bus that allows exchange of data and control signals.
  • Drivers: Drivers are connectors to real devices and other data sources (e.g., web based services, emulated devices, etc.). A driver is responsible for gathering data from a device and for controlling the device in response to requests from an external controller. With the required permissions, a driver can publish and subscribe to messages on WAVEMQ.
  • Data Storage: Both operational and configuration data are stored on dedicated databases. There are separate data stores for the building metadata represented using the Brick schema [66] and for the continuous real-time data that are being collected by the drivers.
  • Applications: Developers can write applications on the XBOS platform using real-time data that is being published on the message bus (e.g., notification service and visualization dashboard) or using historical data that have been stored in the database (e.g., MPC based optimization engine and fault detection tools). Applications can publish control signals for the devices on WAVEMQ and can trigger a change in their mode of operation.

3.2. WAVE and WAVEMQ

WAVE is “an authorization framework offering decentralized trust: no central services can modify or see permissions and any participant can delegate a portion of their permissions autonomously” [67]. WAVEMQ is a tiered publish-subscribe message bus that all drivers and applications on XBOS use to transmit messages [68]. WAVE-based keys and permissions authorize drivers and applications to communicate with one another. The tiered nature of WAVEMQ is implemented in the form of a single “designated router” that is deployed on reliable hardware, typically located in the cloud, and additional message routers at each site, called “site routers”, as illustrated in Figure 2. The services, which can be drivers or applications that have been granted the required WAVE permissions, can publish (i.e., write) on or subscribe (i.e., read) to a particular topic (i.e., sensor measurements or actuation commands) on the bus.
During network outages and loss of connectivity between the site routers and the designated router, this tiered architecture of WAVEMQ enables the site router to continue message delivery across the services hosted locally. By buffering messages that have not yet been delivered to the designated router since the loss of Internet connectivity, and by re-attempting to publish these messages once the connectivity has been restored, WAVEMQ also mitigates the risk of data loss. Messages in XBOS are defined using Google’s Protocol Buffers or protobufs [69] and the native functions and services are implemented as remote procedural calls using the gRPC framework [70]. These technologies support platform and language independent development, which means drivers and applications can be developed in any programming language and they can use the auto-generated language specific bindings for functions calls and message transmission.

3.3. Drivers

Drivers are the components of XBOS responsible for presenting a uniform communication interface, to local hardware devices and external software applications, that is agnostic to the particular protocols and networks used by those devices and applications. Figure 1 shows some examples of hardware devices that can be integrated using XBOS drivers: environmental sensors, electric meters, HVAC controllers, battery controllers, solar inverters, etc. Internet weather services and utility APIs for power prices are few examples of external software applications from which drivers gather data. These devices and services communicate over a variety of protocols, including older, legacy equipment such as refrigeration or HVAC controllers that communicate over wired, non-Internet Protocol (non-IP) based protocols such as Modbus serial [71] or BACnet MS/TP [72]. In such cases, it is essential to set up the drivers locally within the building’s physical network. The drivers also translate the data from the device to the necessary protobuf format required to publish it on WAVEMQ and also interpret the control signals from XBOS applications to equivalent commands for the devices (e.g., changes to the HVAC setpoints or battery charge rate, etc.).

3.4. Data Storage

Data storage to the database on each WAVEMQ router is handled by an XBOS service called the “data ingester.” This service, along with the tiered WAVEMQ message bus, allows SPO to access multiple data stores for the same data at different designated and/or site routers, as needed, without configuring additional data replication or mirroring scripts. SPO takes advantage of this feature by providing the capability of deploying the whole system—the drivers, data storage and optimization engine—locally with a building’s local area network, provided that all the required data can be obtained from local devices and services.
For buildings and sites that allow both cloud and local communication, the preferred approach is to deploy the essential and critical drivers and applications such as sensor and actuator drivers and optimization engine locally and deploy drivers that communicate with web services (e.g., utility demand response (DR) servers, weather APIs, etc.) and read-only applications (e.g., benchmarking tools and visualization dashboards) on the cloud. Such a strategy limits the drivers that have access to local actuators to be located within the local network, and also reduces the chance that a controller remains in a suspended state due to loss of connectivity to cloud-based intelligence. With this network configuration, multiple data ingester services can be configured across the local site router and the cloud designated router. While the local ingester ensures that the most recent data are always available locally for the optimization engine and other critical applications, the ingester on the cloud can store the messages to a more persistent cloud data store for permanent storage and analytical applications. This preferred architecture is illustrated in Figure 3.
The caveat in Figure 3 is that the critical applications on the site router should not require any data from the drivers on the designated router. If applications require data from external web services, it is recommended to host the drivers that are querying them directly on the site router to minimize points of failure.

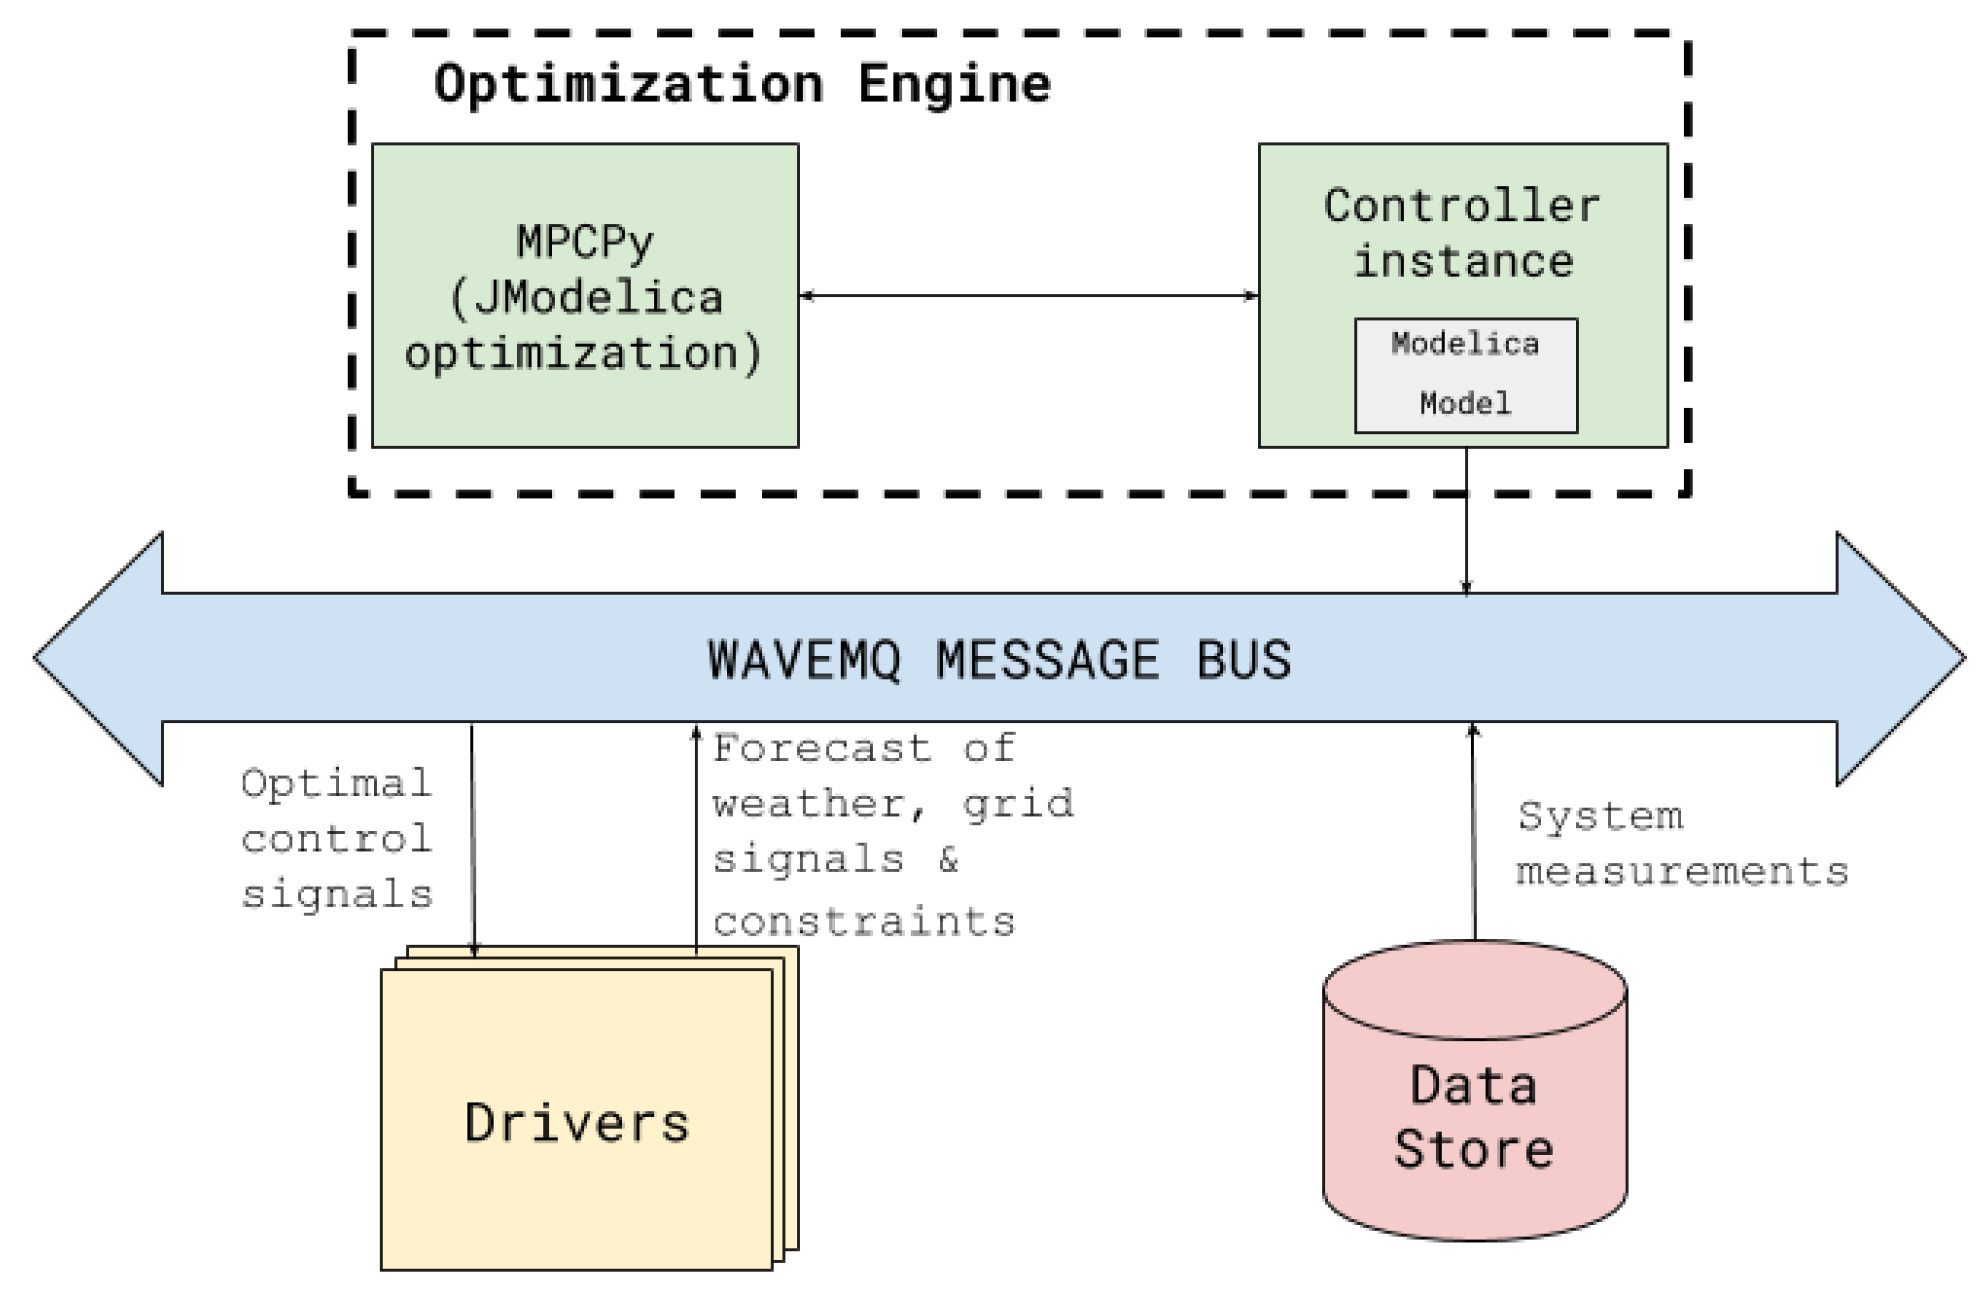
3.5. Applications: Optimization Engine
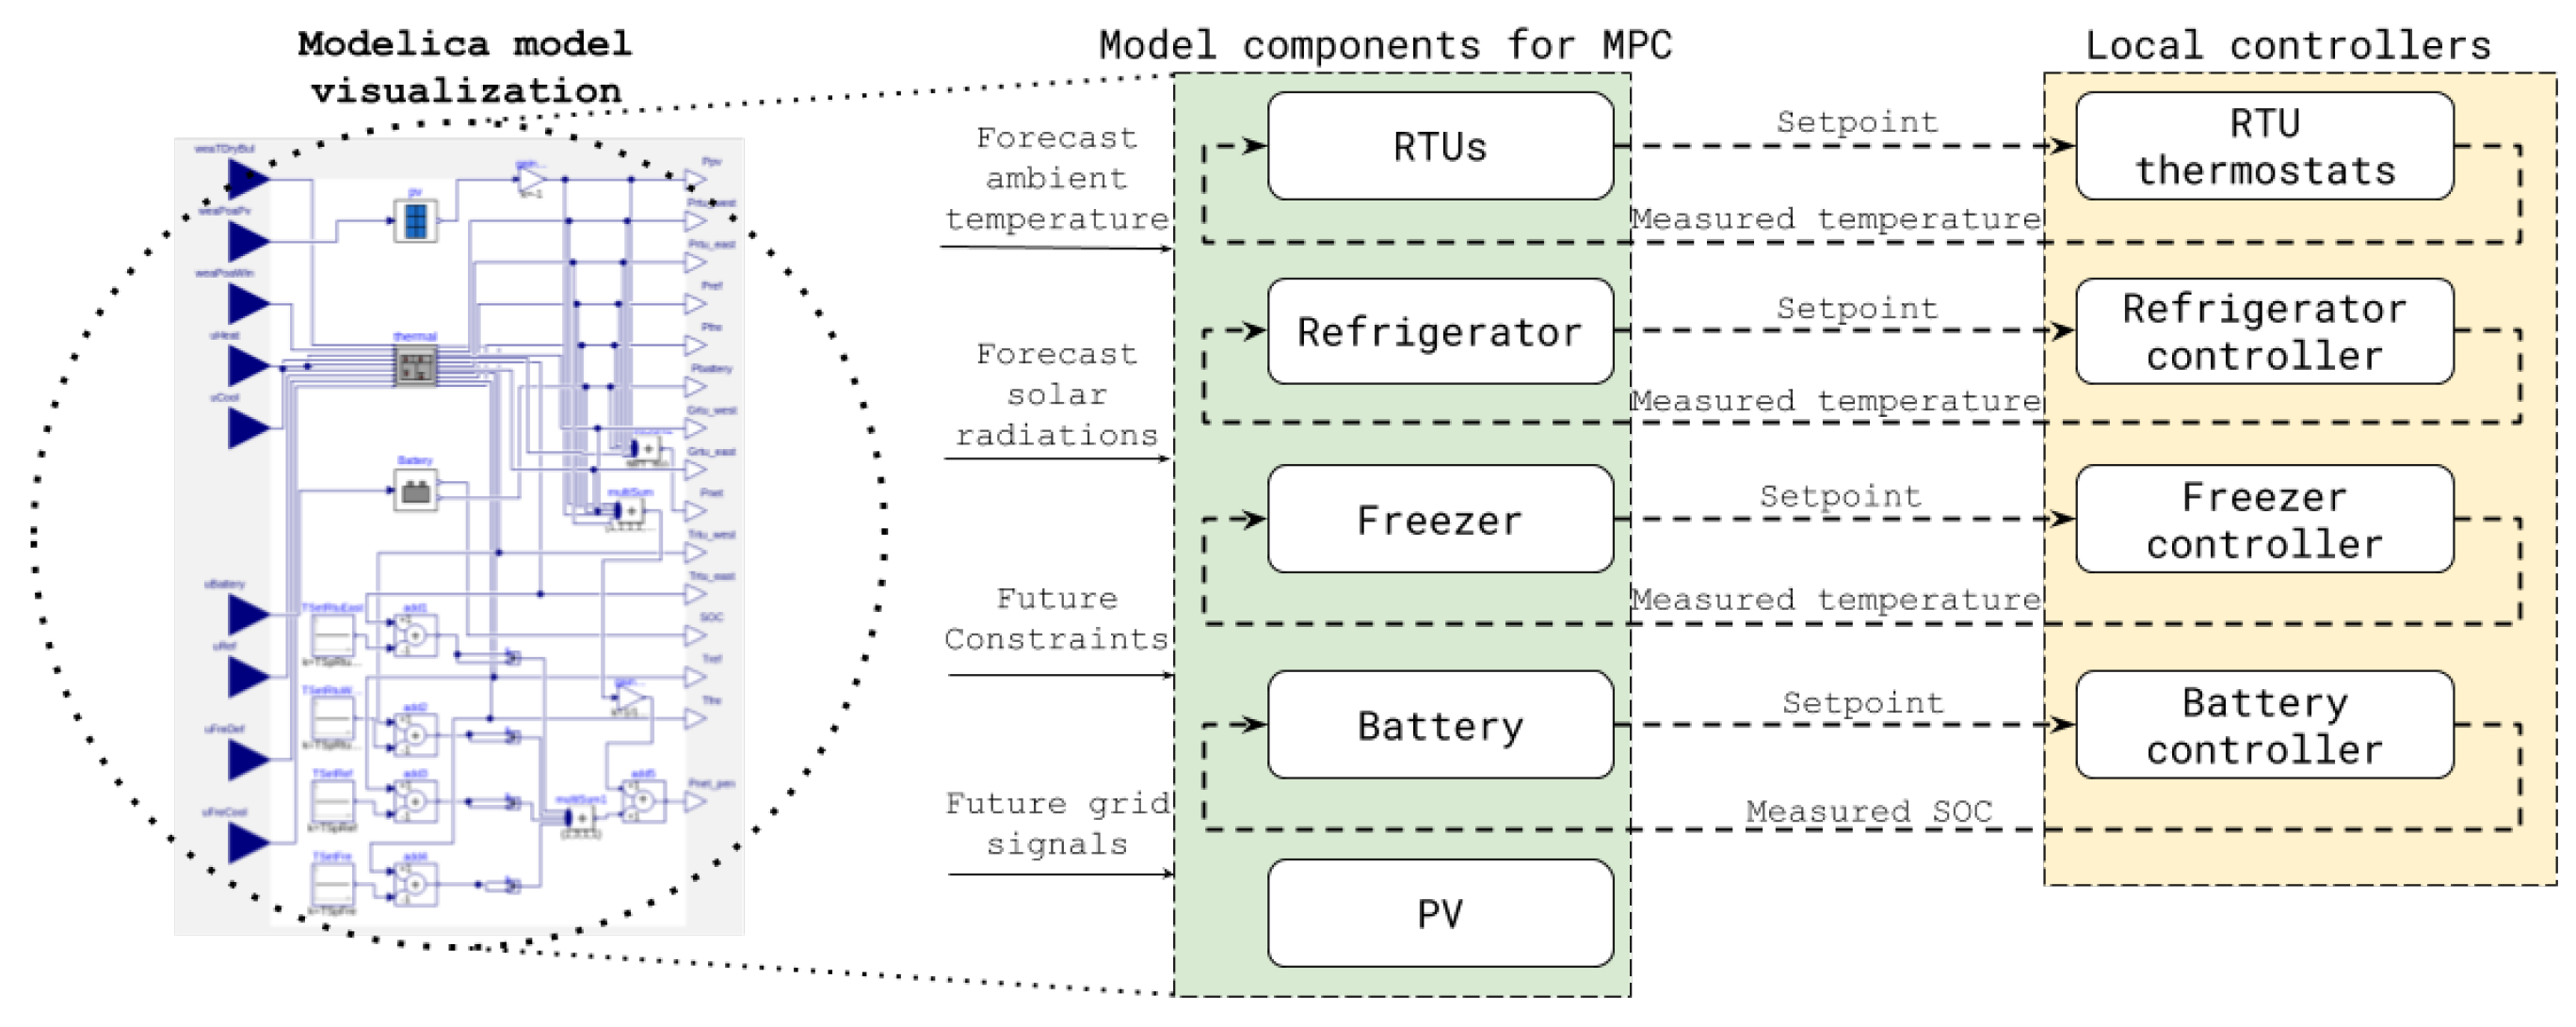
Existing solutions often use proprietary platforms and site-specific specifications for generating and sending optimal control signals to devices. Similarly to how XBOS is used as middleware platform by SPO, the open-source package MPCPy [73] is used to implement MPC-based optimization in an extensible and open-source framework. SPO integrates MPCPy as an XBOS application, extending its capabilities to interact with real-time systems. This application, labeled as the “Optimization Engine” queries historical data and future forecasts from the data store, solves the optimization problem using the MPCPy framework and publishes control signals to devices through WAVEMQ. Figure 4 depicts this interaction between the optimization engine, the data store and the device drivers. Through this implementation, SPO provides a scalable, protocol- and manufacturer-independent solution for implementing advanced building controls. This section details the components of the optimization engine.

3.5.1. MPCPy

The MPCPy package [73] is designed to facilitate the simulation, testing and implementation of MPC for building systems. It includes several generic capabilities such as solving optimal control problems with constraints, parameter estimation and validation, interaction with real and/or emulated building systems, and data processing including weather, internal loads, grid signals, etc.

3.5.2. Model Formulation

MPCPy utilizes models defined in the Modelica language [74], an equation-based multi-domain language to model complex physical systems including mechanical, electrical and deterministic control systems. These models can be used to predict the future system behavior and to support linked simulation-optimization problems. For use in optimization, MPCPy focuses on the use of simplified physical models, often known as “grey-box” models. These grey-box models include sufficient detail about the building systems to simulate overall responses but not the specific details of typical expert-defined building energy models. The goal is to balance model specificity with computational efficiency for use with optimization solvers. MPCPy utilizes JModelica.org [75] to generate and solve a control optimization problem based on the user-provided Modelica model, objective and constraint information and input data (e.g., weather or electricity prices). JModelica.org uses CasADi [76] to compute function derivatives and the optimization algorithm IPOPT [77] to solve the resulting nonlinear problem. IPOPT, short for interior point optimizer, is a state-of-the-art nonlinear optimization library to solve large-scale continuous system optimization problems.

3.5.3. Optimization Configuration for Grid Interactions

Using the MPCPy framework, the SPO optimization engine is designed to minimize the cost of building operations subject to various DR scenarios or grid price signals. SPO can optimize for different types of peak-load reduction DR events (e.g., through utility programs such as Peak Day Pricing [78] or Critical Peak Pricing [79]), as well as dynamic prices [80,81]. At its most basic level, SPO minimizes electricity bills of buildings that are subject to Time-Of-Use (TOU) tariffs that contain both energy and demand charges. Other modes of operation for responding to signals from the grid are shown in Table 1, including real-time pricing, demand limiting, load shedding, load shifting and load tracking.
The optimization engine is structured in a flexible way so that the various responses to grid signals can be easily configured and swapped. This is achieved by formulating the objective function in a generic way, translating the grid signals into components of this parameterized function and into constraints of the optimization problem. The various options are stored in variables of a configuration file to easily switch between modes. Table 1 summarizes the five grid signals and the corresponding configuration in the optimization engine. The constraints presented here only relate to the grid-responsive modes, excluding other constraints related to system operation (e.g., indoor temperature boundaries).

3.5.4. Supervisory Control Scheme

MPC is a receding horizon control process, which can be briefly described as follows: at each sampling interval, system states are measured or estimated and fed back to the controller model to update the model states. With the updated information, the controller predicts the system behavior based on the built-in model within the control horizon (e.g., the next 6 h) along with disturbance forecast such as weather and occupancy. The optimization algorithm then tries to find an optimal solution by minimizing the objective function subject to the latest system constraints. The first control action is implemented and then the MPC engine relaunches a new optimization at the next control interval. The SPO optimization engine follows this approach, but it is designed to be a supervisory controller, i.e., it does not replace but rather interacts with local controllers such as thermostats. The optimizer periodically (e.g., every 5 min) sends optimal setpoints to the local controllers, and they control the equipment through traditional control loops at a finer time scale (e.g., 1 s).

3.5.5. Weather Forecast

The optimization engine requires weather forecast data to operate. The SPO weather forecast module predicts solar radiation using data from external weather forecast services. Hourly forecasts of outdoor dry bulb temperature, relative humidity, wind speed and cloud cover for the duration of the control horizon (e.g., 6 h into the future) are required by the controller. A solar forecast model has also been implemented in this module to calculate the global solar radiation [82]. The direct and diffuse solar radiation are further computed based on the predicted global solar radiation [83]. Based on the predicted solar radiation, the plane-of-array solar radiation can be easily calculated and used as inputs for building and photovoltaic (PV) system models.

4. Evaluation

In this section, the performance of the SPO solution in a real commercial building is evaluated. It begins with the description of the site where SPO has been deployed, the hardware and software details, followed by the specifications of the optimization engine and concludes with the results of how SPO controls the building’s loads and its distributed energy resources in response to different grid signals.

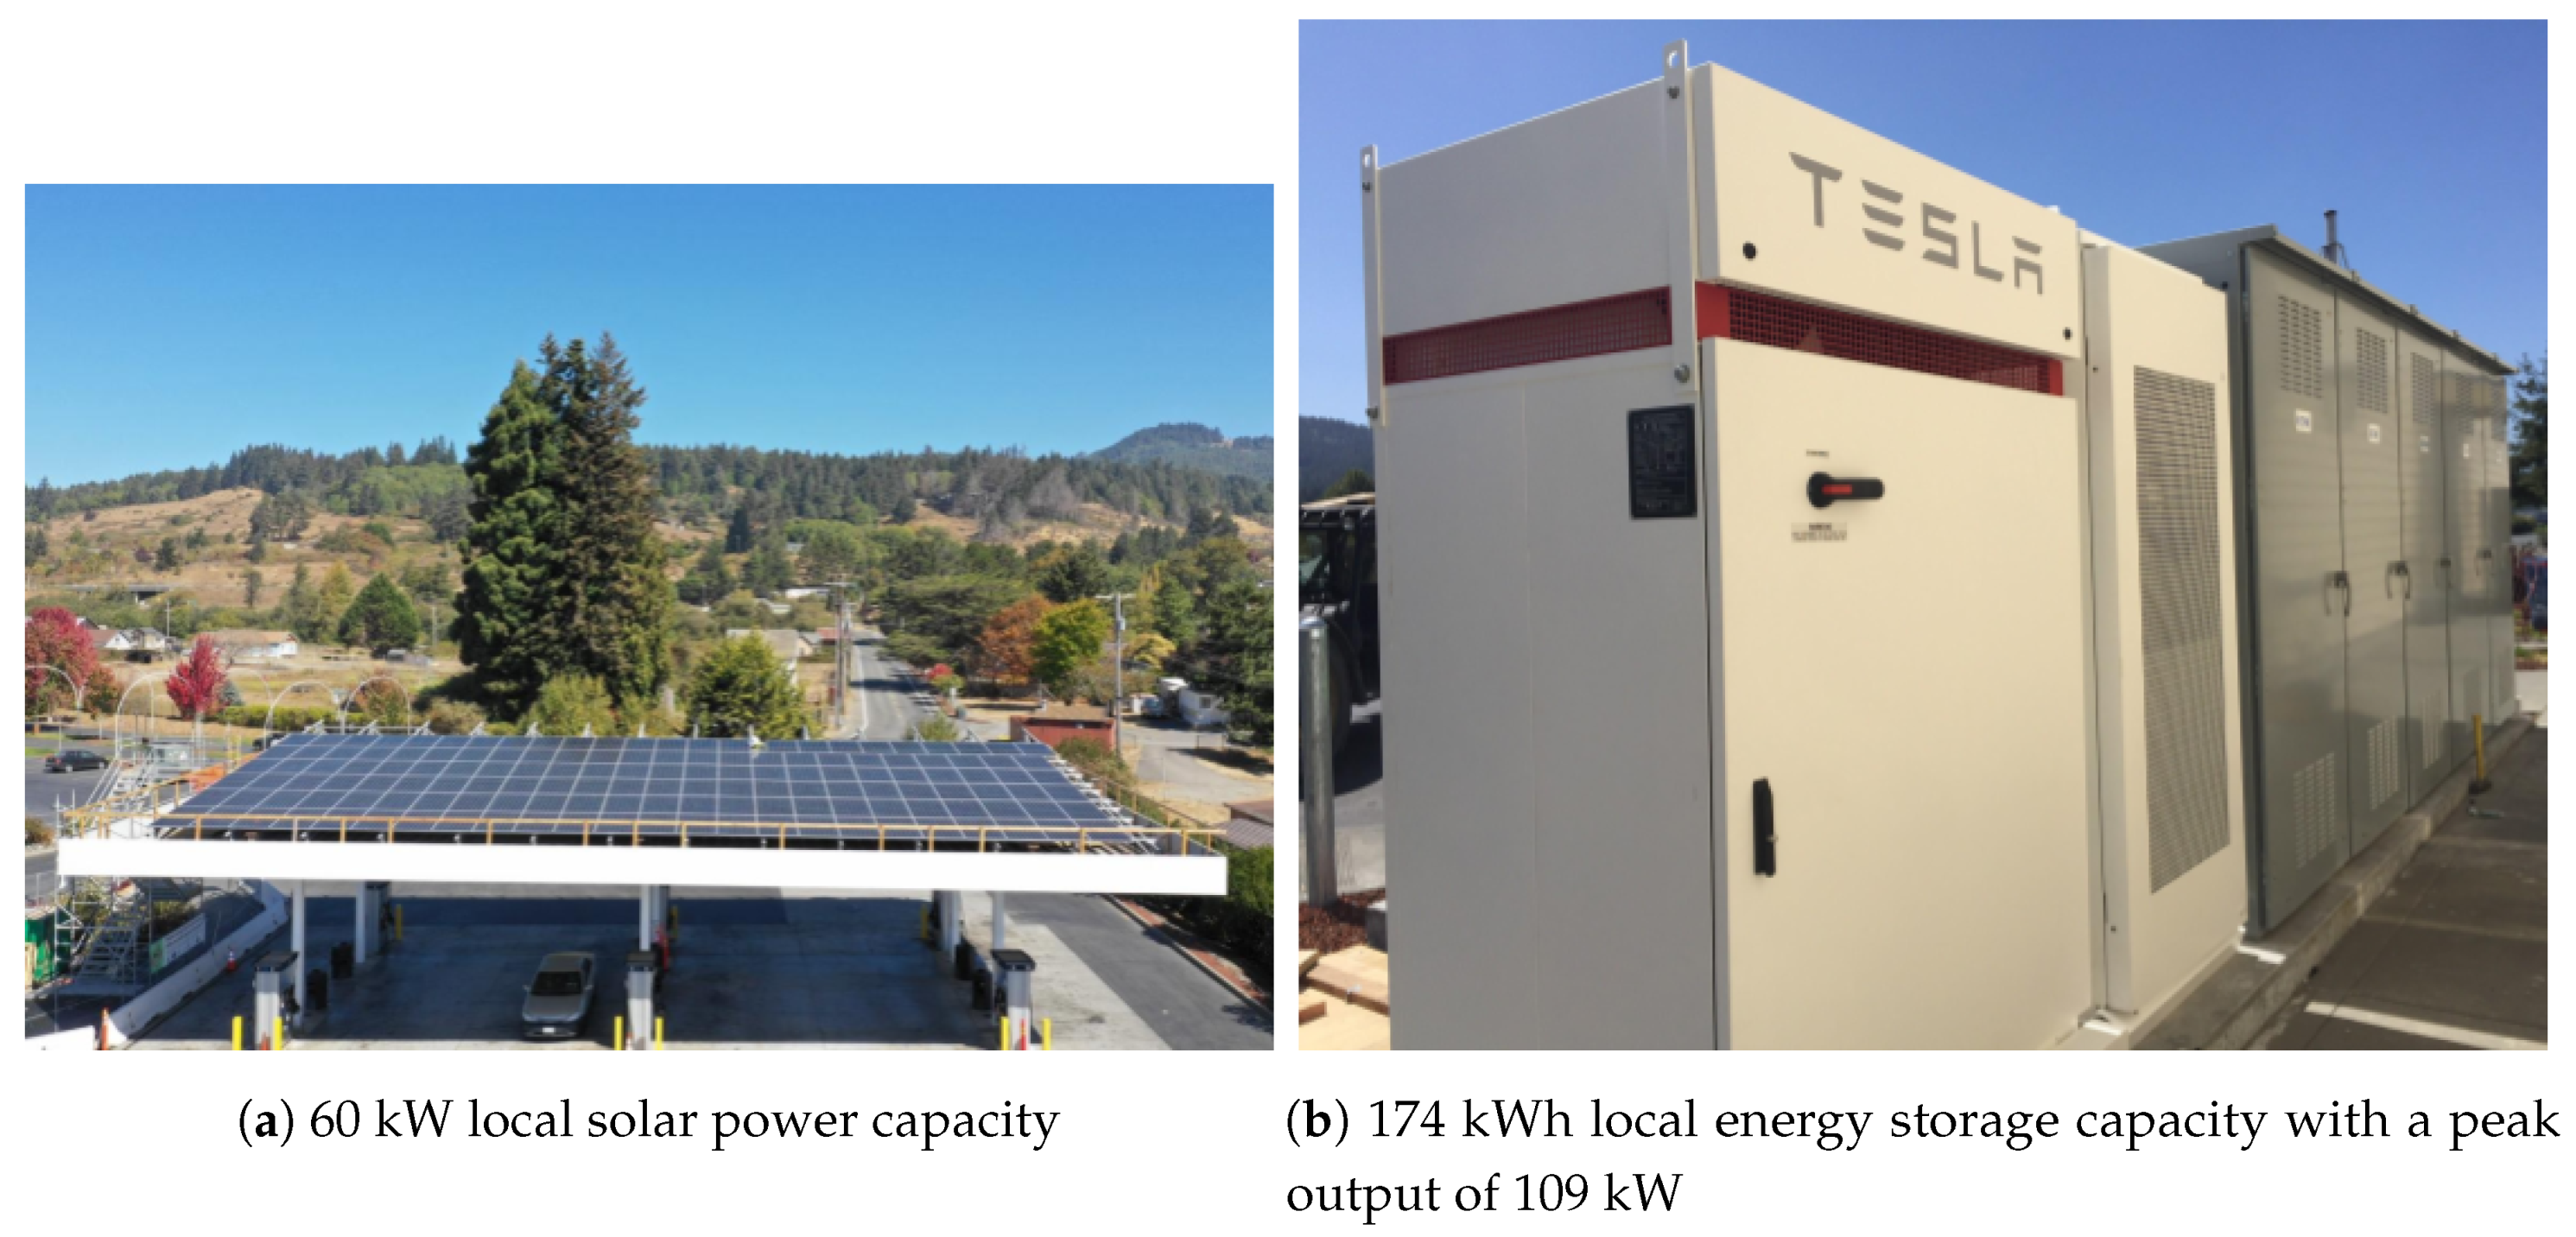
4.1. Site Description

The SPO has been deployed in a convenience store/gas station in Blue Lake, California, United States at the Blue Lake Rancheria. Being located at the edge of the utility service territory and in a generation-constrained area of Humboldt County in California, this site is at a strategic point for supporting grid reliability. The refueling and cold storage services provided by the store are recognized as critical community needs by the operators, particularly during blackouts or natural disasters, which drives their interest in energy resiliency at the site. Strongly tied to this motivation is the requirement for network resilience, that is, being able to operate in an Internet-disconnected mode as well. A unique aspect about this particular building is that it is attached to a casino complex and hence the store also contains gaming machines. The presence of these machines within the convenience store means there are regulatory requirements for network and firewall restrictions that prevent any control signals from originating outside their local network. The site has a unique combination of a real need for resilience and a site with professional IT network staff who require robust cybersecurity.
The store is typically open 24 h a day, 7 days a week and serves frequent customers throughout a day. The space inside the store is conditioned by two separate two-stage roof top units (RTUs), virtually (but not physically) dividing the store into an “east zone” and a “west zone”. These RTUs are controlled by individual thermostats that have been installed in the corresponding zones. The store also has a walk-in refrigerator for storing and displaying beverages through a set of glass reach-through doors and a walk-in freezer for storing and displaying ice-cream and frozen food. The site has 60 kW of local solar power generation capacity along with a battery with 174 kWh of energy storage (and power capacity of 109 kW). As seen in Figure 5, the solar panels are installed on the gas station canopy and the energy storage unit is a Tesla Powerpack.
The typical daily energy consumption is about 800 kWh (or 33 kW average demand), with an hourly average load profile illustrated in Figure 6. However, the gaming machines in the store contribute a significant portion of the total electrical load, and only about 15 kW of the electrical demand is for the thermal systems (i.e., the two RTUs, the refrigerator and the freezer), which are controllable by SPO. The remaining uncontrolled demand is primarily from gaming machines that are located in the store. The building exhibits peak demand in the early morning and early evening periods—both prime targets for thermal load shifting to alleviate system stress around sunrise and sunset. It currently operates on the E19S electricity tariff offered by Redwood Coast Energy Authority, a community-choice aggregator that provides retail options to customers in Humboldt County who could otherwise be served by the distribution utility, Pacific Gas and Electric Company [84]. The site soon plans on moving to the B19 tariff [85]. Both these tariffs contain time-of-use energy charges ($/kWh) and time-of-use demand charges ($/kW), with the key difference being the timing of the peak prices. In B19, the peak prices occur later in the day, between 16:00 and 21:00 daily to account for the growing duck-curve problem in California [86], while E19S is a legacy tariff with the peak prices during the 12:00–18:00 period that historically included coincident peak demand. The building operators are motivated to reduce their overall energy costs by reducing energy consumption and by effective management of the peak loads on the grid.

4.2. Hardware and Software Set Up

Given the cybersecurity requirements at the site, the SPO system uses local drivers with local storage and an MPC-based optimization engine. The local SPO server with a WAVEMQ site router has been hosted on an Intel NUC computer with an Intel i7 processor and 2TB of internal disk capacity [87] at the site. The designated WAVEMQ router is hosted on a cloud server, which is also attached to a persistent data store, also in the cloud. InfluxDB [88] is utilized as the timeseries database, both in the cloud and on the local server. The local server has been configured with a retention policy to only store the most recent two weeks of data that might be relevant for the optimization engine. The local server also hosts the drivers that communicate with each of the devices and/or services (over the protocols mentioned) listed below, reading data once every minute and publishing to the WAVEMQ message bus. There are data ingester services set up both at the site router and the designated router to store these published messages in the local and the cloud-based InfluxDB databases, respectively. The drivers for the controllers also subscribe to the ‘optimal setpoints’ being published by the optimization engine so that they can change the setpoints of the controllers.
The list of data sources and/or controllers, with their respective communication protocols are given below:
  • Electricity Meters: The building has six Continental Controls Wattnode power meters [89] that measure the power consumption of: whole building, west zone RTU compressor, east zone RTU compressor, refrigerator compressor, refrigerator evaporator fan and freezer compressor and evaporator fan, respectively. These devices measure instantaneous power parameters and communicate over Modbus serial.
  • HVAC: The two RTUs are controlled by two separate KMC Flexstat 120063CEW [90] thermostats, which communicate over BACnet/IP. The preferred temperatures in the west and east zone are 20.56 and 21.67 C (or 69 and 71 F, respectively), respectively. The heating and cooling setpoints of the thermostats are controlled by the optimizer.
  • Refrigeration: Sporlan Parker PSK214 Modbus (serial) [91] refrigeration controllers are used to control the large refrigeration systems. By default the freezer is set to an indoor temperature of −21.67 C (−7 F) and the refrigerator to 0.56 C (33 F). During the experiments, the SPO controlled the indoor cabinet temperature setpoint of the equipment.
  • PV and Battery: The inverters of the PV panels and the battery are interfaced with a Schweitzer Engineering Laboratories SEL-3505 Real Time Automation Controller (RTAC) [92]. The RTAC is the short-timescale microgrid controller for this system and it handles power flows, circuit switching and safety aspects during the grid-islanded system operation. However, due to certain restrictions at this site, the RTAC only allows ’read’ operations (over Modbus(TCP)) to be performed by the SPO.
  • Emulated Battery: As the Tesla battery on site only allows ’read’ operations, a software-based emulated battery is used for the experiments. This battery has been scaled down to a size that makes sense for conventional small and medium convenient stores (without power-hungry gaming machines, but HVAC and refrigeration). The emulated battery has a total capacity of 27 kWh, with a peak output of 14 kW (equivalent to two Tesla Powerwalls [93]).
  • Weather: The current outdoor temperature, cloud cover, relative humidity and wind speed data, along with their 48-h forecasts, are collected from the DarkSky weather service’s REST API [94].
  • Grid Signals: Provides information about the prices based on tariffs or dynamic prices and/or could also publish information about scheduled demand response events. While this is currently implemented as library function that retrieves the grid signals from a static database, retrieving the real-time or day-ahead Independent System Operator (ISO) prices or dynamic prices from a utility using protocols such as IEEE 2030.5 [95] or OpenADR [96] are planned future work.
Table 2 provides a list of data and their respective sources that are required for the optimization engine. A summary of the controllers and the variables that can be controlled, with the default values and lower and upper bounds, is given in Table 3. These limits were provided by the convenience store operators after considering the requirements for indoor air conditioning and food storage. The limits have been encoded into the respective drivers so that even if the optimization engine produces a setpoint outside the limits, the drivers can ensure that those values are not set on the actual device. It is to be noted that the list of variables in Table 2 and Table 3 are a subset of variables that can be read from or written to each of the devices.

4.3. Optimization Engine Set Up

4.3.1. Modeling

As mentioned in Section 4.1, the main occupied zone in the store is conditioned by two RTU systems. One of the two food storage rooms is conditioned by a custom-made refrigeration system; the other by a freezer. The layout of these spaces is captured by the building model, which includes four thermal zones: two RTU zones, one refrigerator zone and one freezer zone. The building zones are modeled using the lumped resistance and capacitance approach: each zone is represented by one resistance and one capacitance and connected with each other thermally. The overall building thermal model is therefore a linear fourth-order model. The battery system is modeled based on the bucket model approach by considering the battery as a repository for energy [97]. The state variable is the battery SOC and the input is the real power that should be stored in or extracted from the battery. The PV system is modeled with a constant efficiency and the input is the predicted plane-of-array solar radiation. The linearity of these models allows efficient computation for the optimization algorithm, which takes about one minute to converge to an optimal solution in these experiments. Figure 7 shows the MPC model structure and its interaction with the local controllers.
The weather parameters considered for the building are the dry bulb temperature and the solar radiation. The dry bulb temperature forecast is obtained from the Dark Sky API based on the site latitude and longitude. The solar radiation forecasts for the building and PV system are predicted using the built-in model as described in Section 3.5.5. The prediction horizon used in the experiments is 6 h. The store zones are occupied by staff for 24 h each day. The occupancy disturbance is therefore not considered. The major internal load disturbance in the store is from the gaming machines, which emit heat directly to the zone. These machines are in operation 24 h per day. This internal thermal load is therefore assumed to be constant in the model. The system constraints for MPC used in the experiments are defined by the facility staff and are summarized in Table 3. The thermal comfort setpoints for the HVAC system are constrained to values between 19.44 C (67 F) and 23.33 C (74 F). The constraints for the freezer cabinet temperature setpoint are from −34.44 C to −18.89 C (−30 F to −2 F). The constraints for the refrigerator cabinet temperature are from 0.56 C to 3.33 C (33 F to 38 F). The battery cannot be charged more than 95% and discharged below 25% of its total capacity. The maximum charge or discharge power is 14 kW. The upper and lower bounds for the power consumption are calculated for each grid signal, as shown in Table 1.
The system states of the model are the space temperatures of the RTU systems, cabinet temperatures of the refrigerator and freezer system and the battery SOC. These values are all measured and thus there is no need for state estimations in the MPC formulation. The measured states are updated in the model at each control interval (5 min). The control inputs for the model are the heating or cooling rate for the RTUs, the cooling rates for the refrigerator and the freezer, and the battery charging and discharging rate. The control outputs are the supervisory setpoints for each individual system: zone setpoints for the RTUs, refrigerator setpoint, freezer setpoint and charge/discharge power setpoint for the battery. When the setpoints are sent to each controller, the controller decides its operation mode based on its internal control loop implemented by the manufacturer. For instance, the thermostat receives the optimal setpoint and determines whether to switch the RTU heating or cooling state ON or OFF.

4.3.2. Controller Start-Up

The controller needs to be instantiated once the system model has been specified. During this process, the software loads and initializes all the components including the MPC model, the optimization problem, the system states (measured temperatures and SOC), the inputs (outdoor dry bulb temperature, solar radiation, grid signals and constraints) and the outputs (setpoints), based on the configuration. The objective function and associated constraints to grid signals, as summarized in Table 1, are automatically updated according to the goal of each experiment. At every control interval, the software calls the instantiated controller to solve the optimization problem and pushes the solutions to the respective devices over WAVEMQ. A single instance of the controller can handle different types of grid signals and only requires re-instantiation when configuration parameters (e.g., new input sources and modified outputs) are changed.

4.4. Experiments

To evaluate the performance of the SPO, the system was subjected to different grid signals (as shown in Table 1) and the optimal setpoints that were generated were pushed to the equipment in the building. This paper presents the results of three tests: (1) a dynamic pricing signal; (2) a Time-Of-Use (TOU) tariff; and (3) a demand limiting signal. While most commercial buildings in the US are enrolled in a TOU tariff rate, some utilities are moving towards use of dynamic pricing for grid integration [80,81]. These prices are also considered as the replacement for event-based demand response programs. These use cases are a representative collection of legacy (i.e., TOU tariffs and event-based demand response programs) and emerging (i.e., dynamic pricing) interaction mechanisms between grid and building-level microgrids.
By specifying a linear regression model based on the weather, solar production and building load data from ten days prior to each experiment (excluding days when SPO was being run), a weather-normalized baseline has been calculated for each of the following experiments. The battery was excluded from the baseline formulation because it was not operated during the period of baseline data collection. For all the experiments, the preferred temperatures for the HVAC zones are 20.56 C (69 F) and 21.67 C (71 F) for the west and east zones, respectively. The key metric used to evaluate the performance of the SPO system is the total cost of electricity (including both energy and demand charges) since the primary objective of SPO’s optimization engine is to minimize this cost. This is the cost incurred due to the net load consumption supplied by the grid. All variables in the following equation are assumed to be non-negative.
n e t l o a d = t o t a l b u i l d i n g l o a d p o w e r p r o d u c e d b y P V + b a t t e r y c h a r g i n g r a t e b a t t e r y d i s c h a r g i n g r a t e .

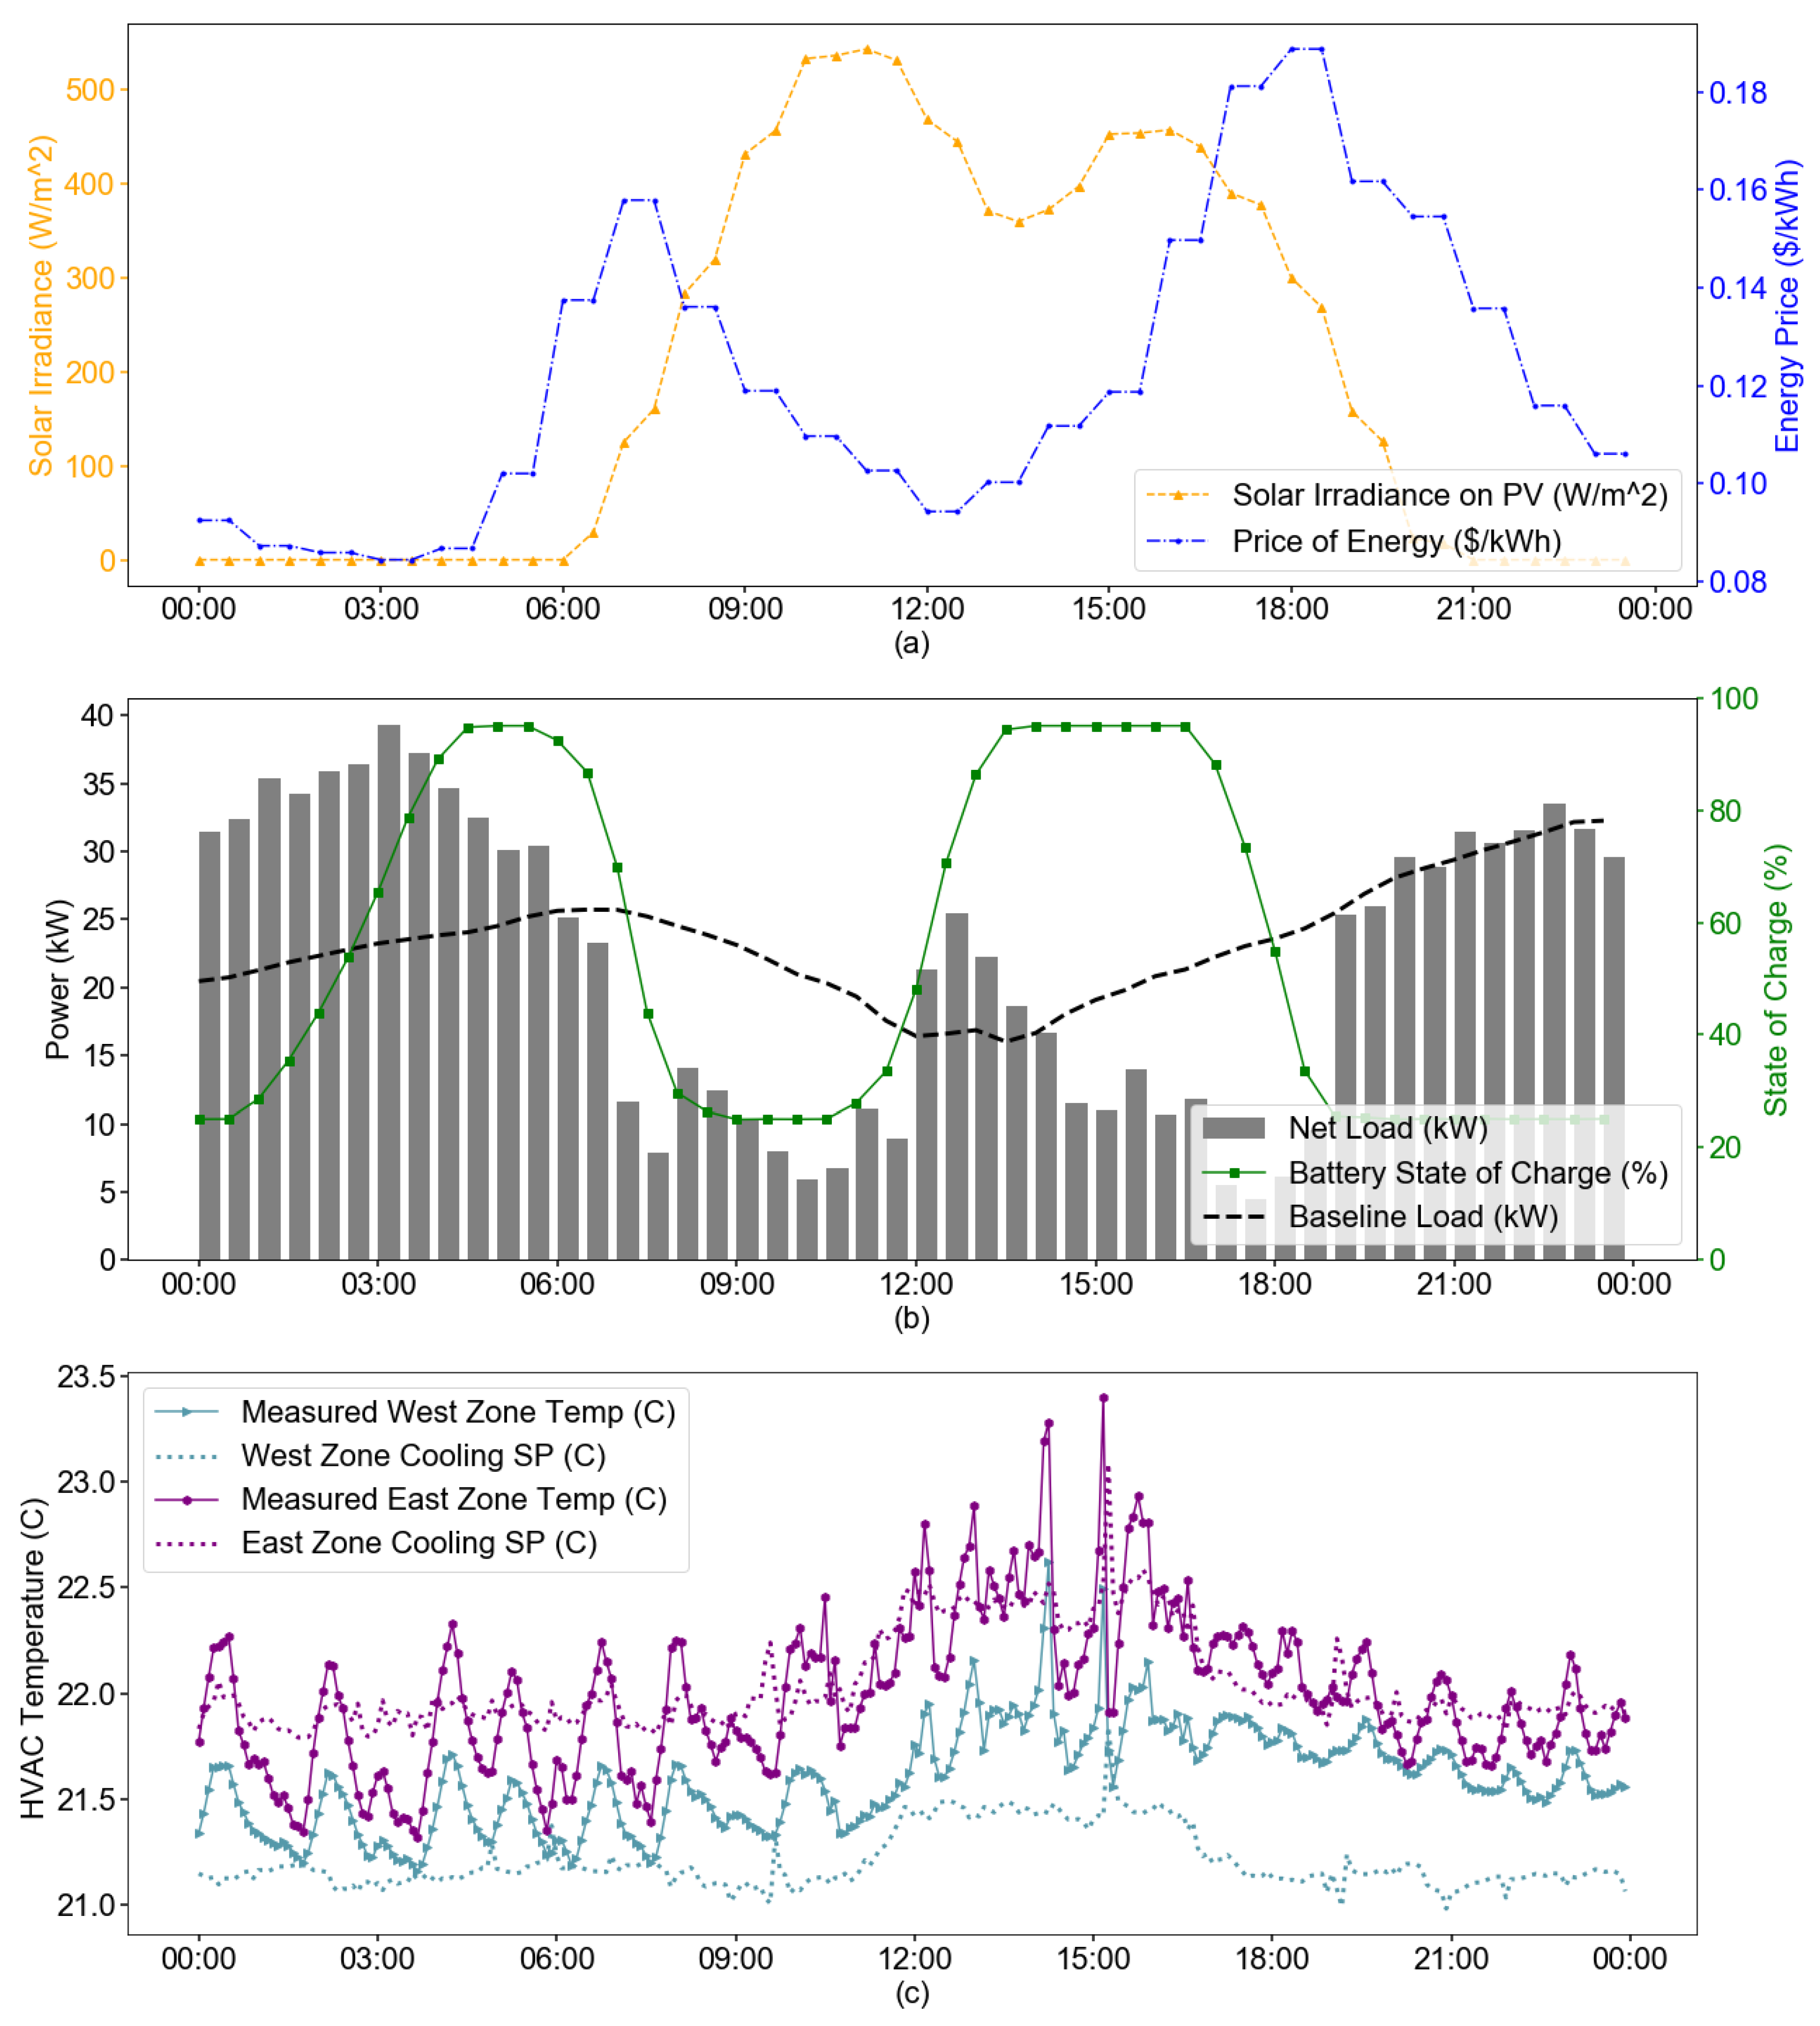
4.4.1. Dynamic Prices

This test, conducted on 17 May 2020 evaluated the behavior of the SPO in response to dynamic prices. A grid signal containing a 24 hour price forecast for the event day was generated and published on WAVEMQ. The prices were based on the wholesale market prices obtained from the California Independent System Operator (CAISO), the entity responsible for the California energy markets. These prices reflect the duck-curve dynamics in California, which occur when the net electricity demand drops during mid-day due to large amounts of solar generation during that time. The demand ramps up rapidly in evening hours as the sun sets, but air conditioning loads continue to be present due to the thermal lags in buildings, and many people return home and begin evening activities.
Figure 8 shows the results of the dynamic price test. Section (a) of the figure shows the driving variables: dynamic prices and solar irradiance. Section (b) shows the battery state of charge, and the resulting net load controlled by the SPO, compared to the baseline power profile. Section (c) shows the SPO generated setpoints for the HVAC zones and their corresponding temperature profiles.
The expected behavior of the system is that the battery, the HVAC and the refrigeration loads will be controlled to minimize consumption during high price times and shift consumption to low price times, subject to the constraints on comfort and other factors. In the operational test, this behavior was observed in broad terms. Figure 8b shows how the net building load was lower at times of high prices and higher during the beginning and the middle parts of the day when prices were low. This was achieved through a combination of battery dispatch and modification of thermal setpoints. Deviations from this baseline are attributed to the behavior of the control system.
The baseline load was much lower the first 6 h of the day as the battery was charged to full capacity during these hours. This was in preparation of the increasing prices, starting from 06:00, when the battery discharges completely to support the building load (Figure 8b). The battery was controlled similarly during the high price periods that occurred later in the day as well. From the slope of the battery state of charge, it is evident that the rate of charging and discharging change also vary according to the the price fluctuations. In Figure 8c, it can be seen that the responses of HVAC systems were mainly for the second peak in the afternoon. From around 12:00 to 17:00, the battery was in charging mode and the cooling power usage was kept minimum as the indoor temperatures were increasing. Once the battery began to discharge, the HVAC systems began to bring the indoor temperatures back to the preferred temperatures slowly. Even though the HVAC systems used more power during the high price duration, the net energy use decreased as battery was discharging. Due to very strict constraints on the temperatures and also owing to undersized equipment, there were hardly any changes in the operation of refrigeration systems. However, the temperatures of both the freezer and refrigerator were maintained within the bound set by the convenience store operators.
As there were no demand charges in this signal, the total cost of electricity constitutes only the energy cost, which is calculated by multiplying the hourly energy charge with the hourly energy consumption. The total cost for this day was $59.14 for the SPO optimized actions as compared to the $68.72 for the baseline load, generating a savings of 13.94%.

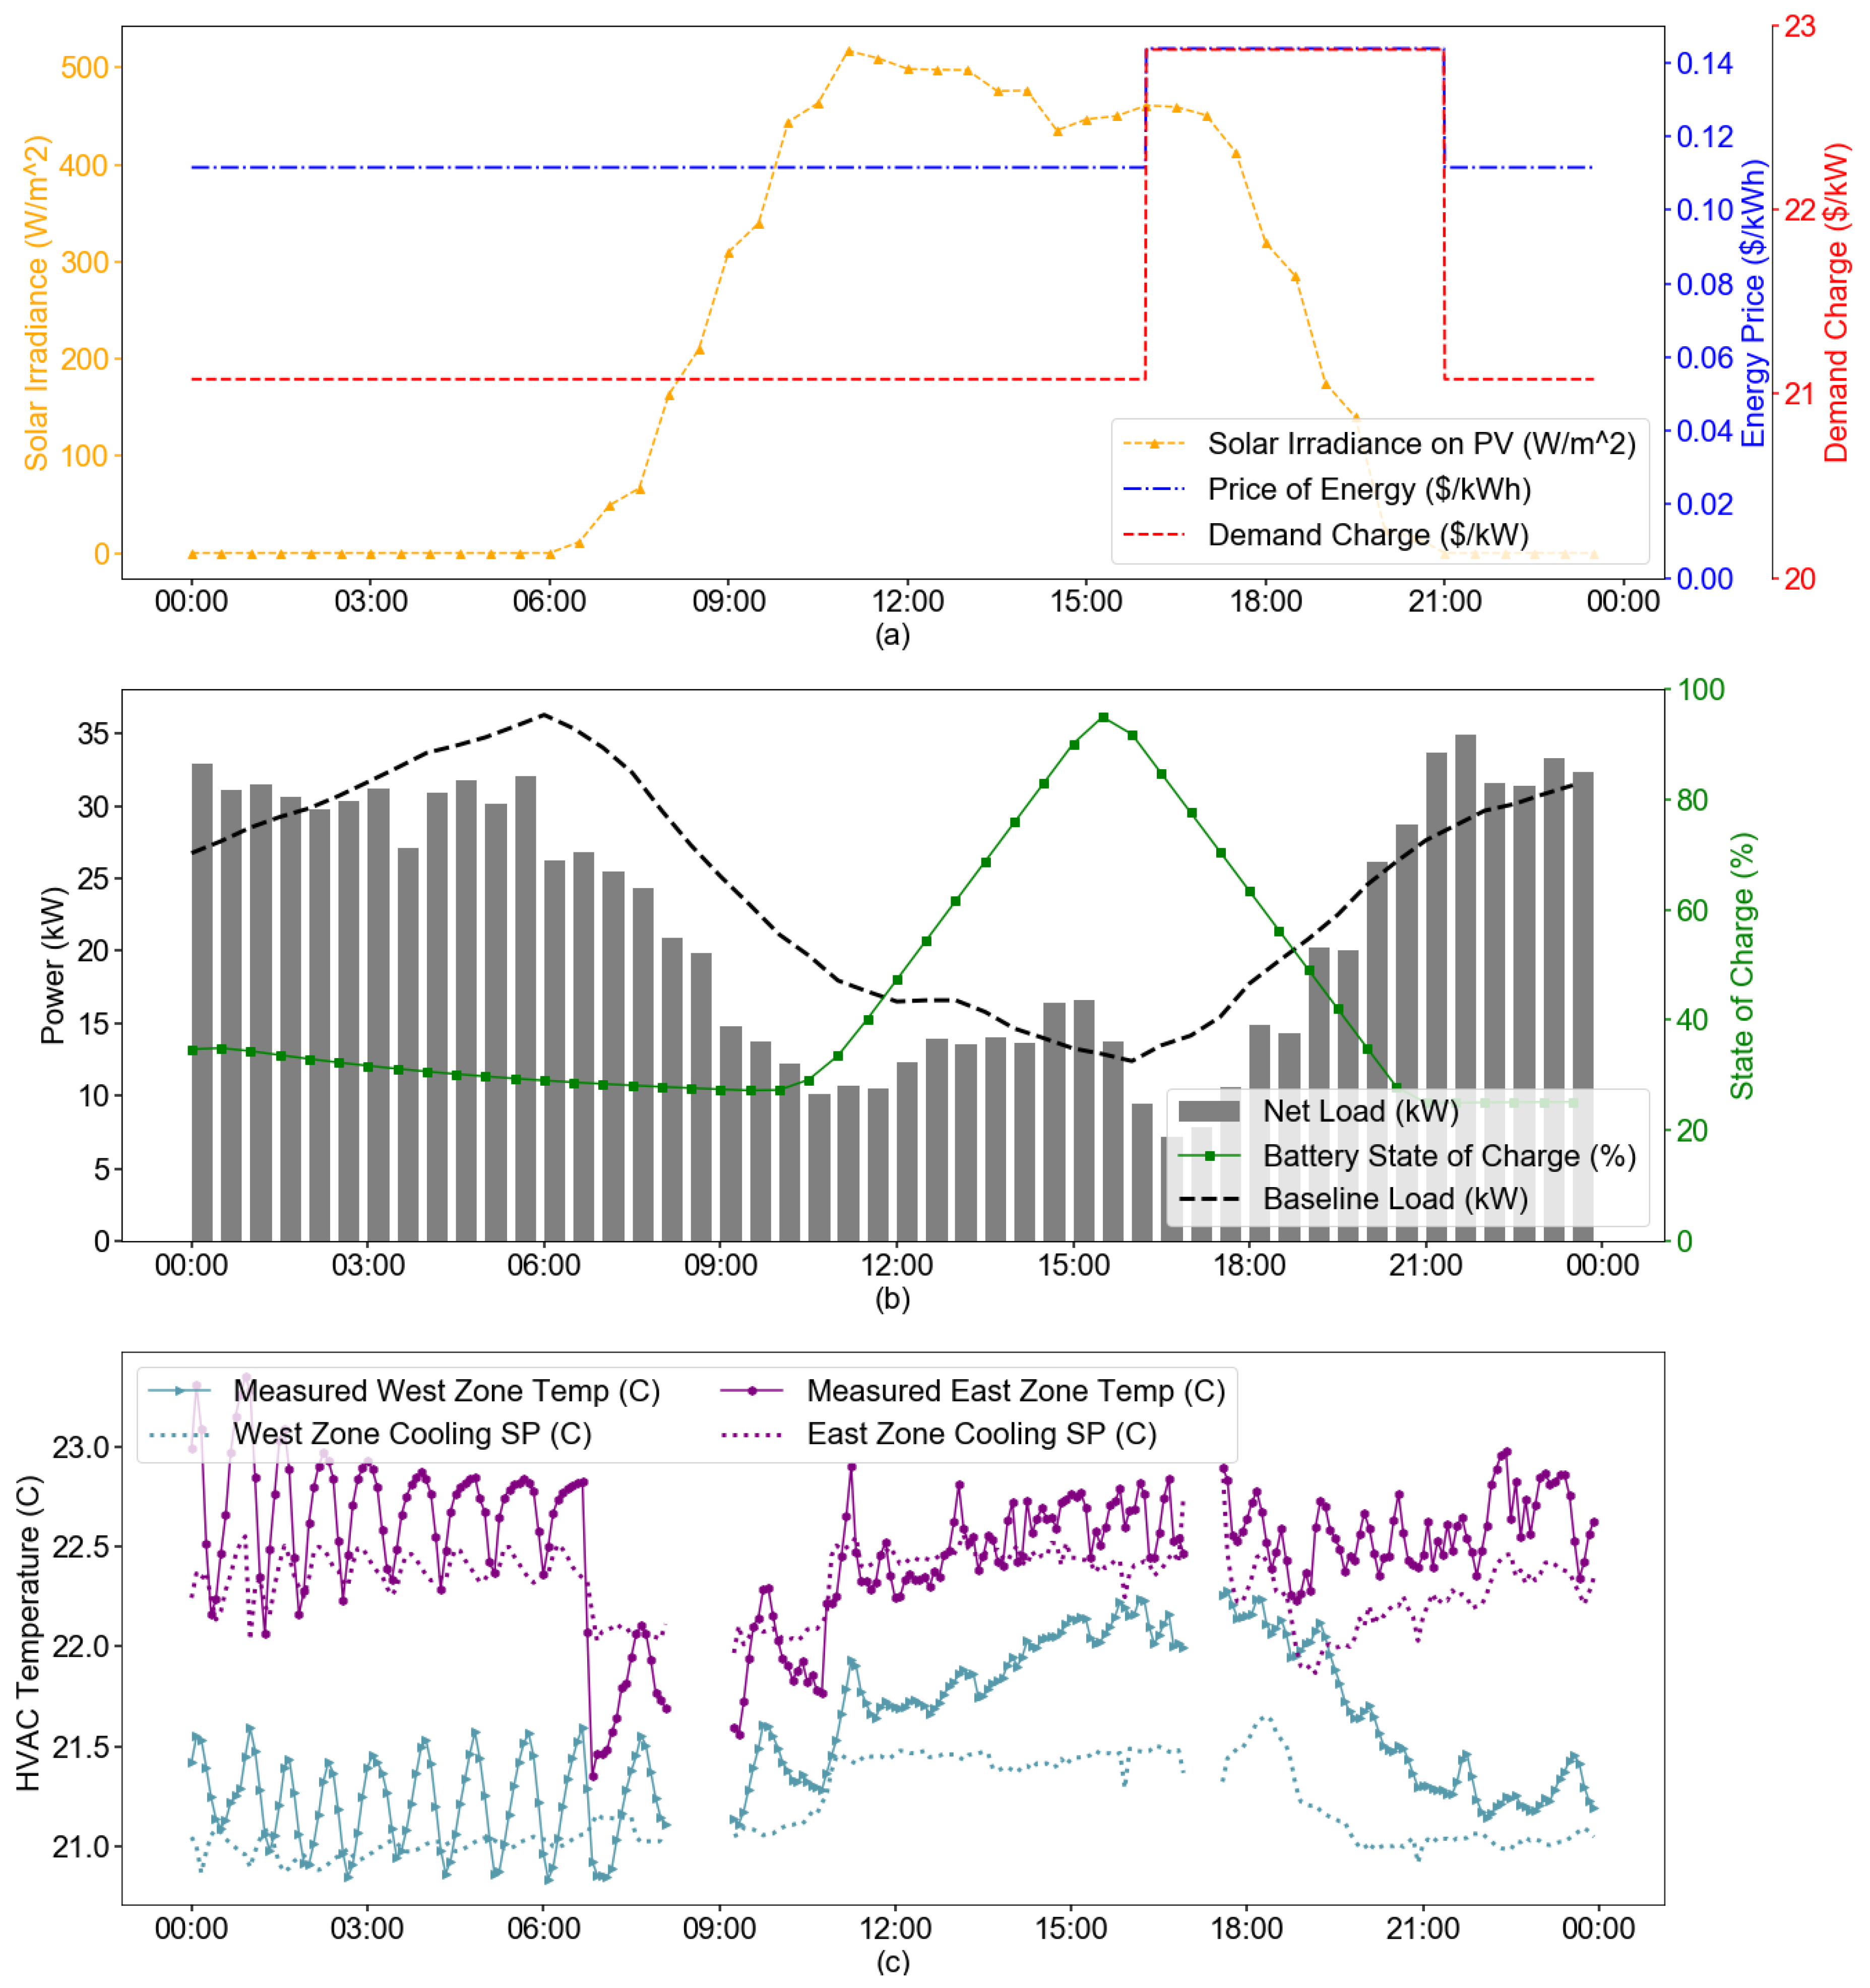
4.4.2. Time-Of-Use Prices

This experiment, conducted on 15 May 2020, tested the response of SPO to the winter TOU rates of the B19 tariff [85]. This tariff contains time of use based energy prices and demand charges. Figure 9a shows the solar irradiance, demand and energy charges. The peak price window for both demand and energy charges are from 16:00 to 21:00 Figure 9b shows the battery and net load responses, controlled by the SPO. Figure 9c shows the HVAC zone setpoints that were generated by SPO and the actual temperatures for these two zones (gaps in the chart are due to missing data, where the thermostats temporarily lost network connection).
In response to the peak prices, the battery began to charge quite late until the PV generation began to get online and charged up to its maximum of 95% of its capacity right before 16:00 and started to discharge until 21:00, the end of the peak period. The HVAC systems started pre-cooling very early at around 07:00 Then, it started to increase the indoor temperatures once the battery began to charge. During the beginning hours of the peak period, the temperatures were maintained as high to reduce the HVAC load. Then, the HVAC west began to cool down the space as the accumulated penalty of deviating from the setpoint began to get high. With regards to the refrigeration systems, there were still hardly any periods when the temperatures were allowed to rise, but they always remained within the limits.
Table 4 compares total electricity costs incurred in these 24 hour for the SPO optimized building against the building’s baseline load for this day (shown in Figure 9b). The energy cost is calculated as described in the previous experiment and it can be seen that SPO was able to save 10.33% of the total energy cost. Calculating the total demand cost and the subsequent savings is slightly more complicated. The total demand cost is the sum of the demand costs across all the different TOU rate periods (e.g., 16:00–21:00). The maximum load (load refers to the 15-min average power consumption) for each rate period across the whole billing cycle (typically monthly), or, in this case, the whole day, multiplied by the corresponding demand charge is the demand cost for that period. This introduces the caveat that the demand cost shown in Table 4 might not be the final demand cost for the full billing cycle. Hence, for the purposes of evaluating this experiment, the billing cycle is assumed to be one day. Under this assumption, SPO reduced the total demand cost by $21.13. For a realistic billing cycle of a month, through continuous peak demand management by SPO, much higher demand cost savings can be accrued.

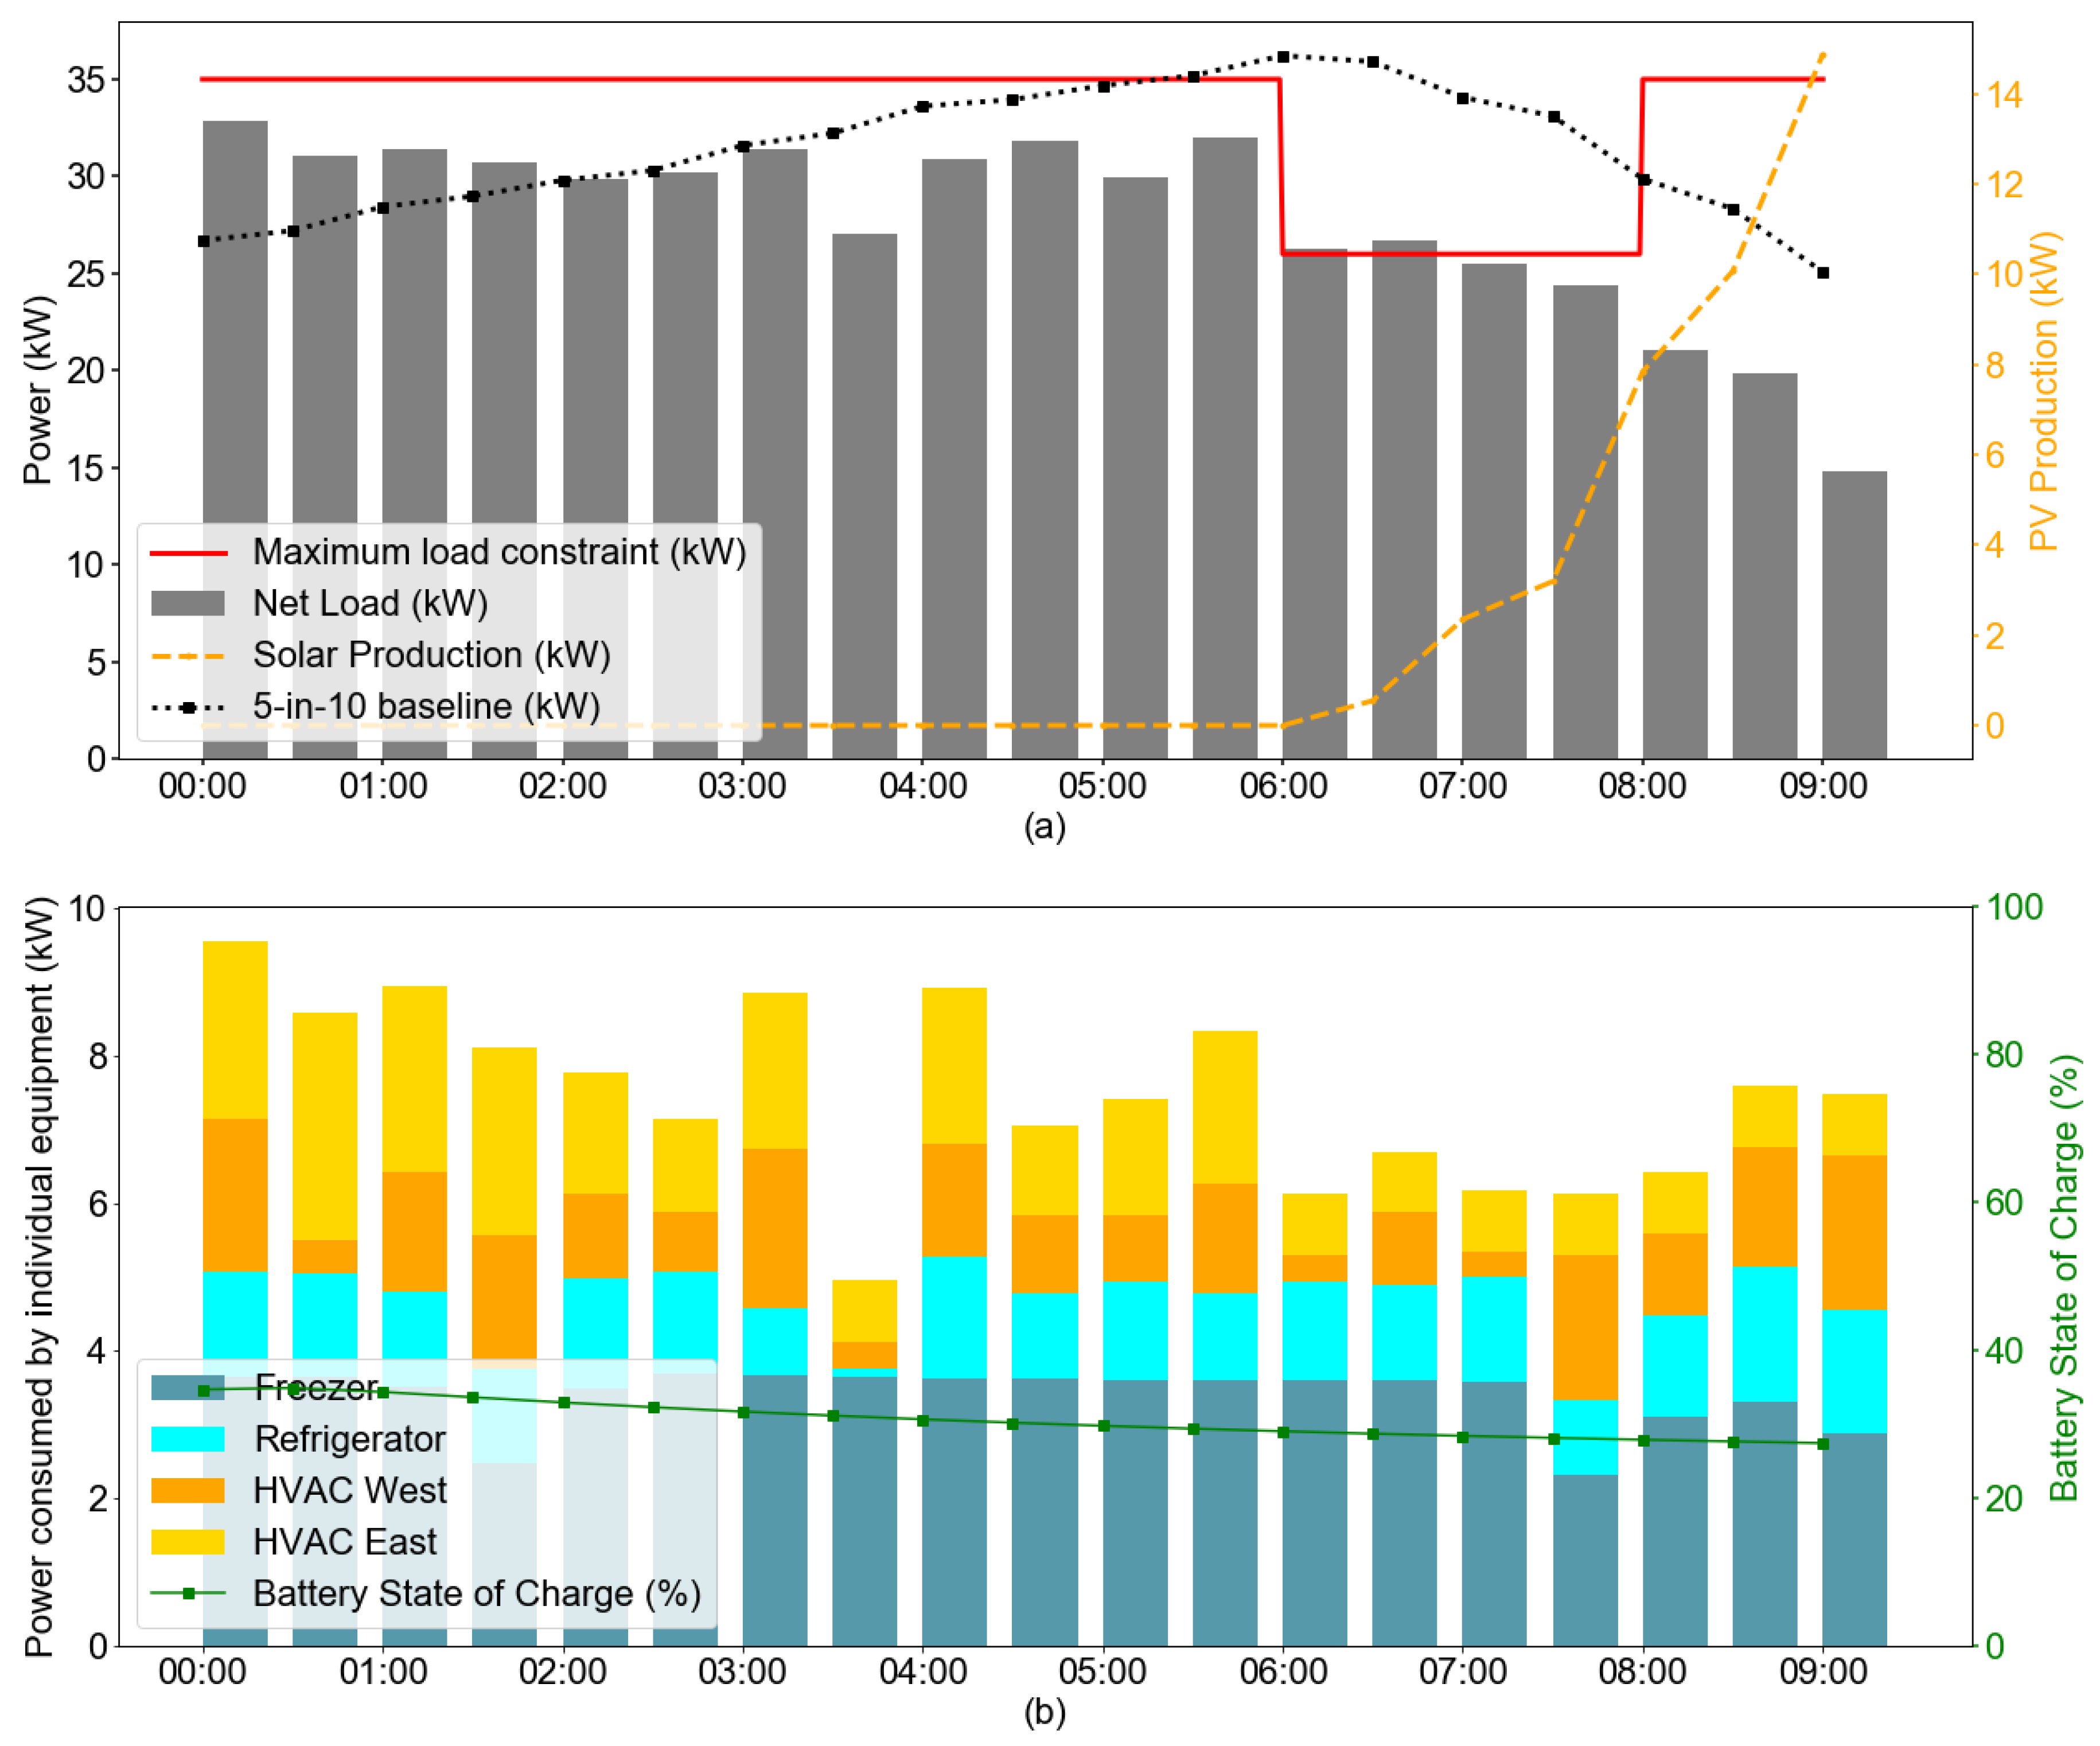
4.4.3. Demand Limiting Event

Demand limiting “refers to shedding loads when pre-determined peak demand limits are about to be exceeded … and this is typically done to flatten the load shape when the pre-determined peak is the monthly peak demand” [98]. Coordinated load limiting efforts across multiple buildings helps to reduce the stress on the utility during peak hours.
An experiment was conducted in May 2020 to test the response of SPO to a demand-limiting signal. The signal constrained demand to 26 kW from 06:00 to 08:00., given that minimum baseline load during this period is 32.9 kW. Figure 10a depicts the response of SPO: the building reduced its average power consumption at 06:00 to 26.30 kW from 32 kW at 05:30. Figure 10b shows that this was achieved by reducing in the power consumption of the two HVAC units from 06:00 (in yellow and orange) and a drop in power consumption of the freezer unit at 07:30. However, the battery state of charge remained nearly flat throughout the event as SPO decided not to employ the battery during it. This is evidence of SPO’s intelligent load control capabilities as it is able to coordinate the controllable load without depending on the battery to handle grid signals.

5. Discussion

Overall, this work represents a proof of concept for an open-source, extensible, cyber-secure software system that can optimally control energy use in a microgrid.

5.1. Benefits to Developers

A core design intent of SPO was the ability to be modular and extensible, unlike solutions presented in previous studies [43,46]. For this reason, SPO was developed on top of modern open-source projects such as XBOS and MPCPy. Its core communication infrastructure, based on a distributed and secure message bus [68] and gRPC [70], allows developers to seamlessly replace components such as databases, optimization engines and drivers. For instance, the native XBOS data store was replaced by another time-series database [88], due to the cybersecurity requirements of the demonstration site. The use of gRPC is an innovative feature compared to other open-source projects [57,99], and it allows developers to use languages they are more familiar with or are more advantageous for a particular application. Hence, XBOS drivers have been developed in both Go and Python as part of this project. Further, native integration with BRICK metadata schema [66] is a distinctive feature of SPO. BRICK is an emerging “open-source effort to standardize semantic descriptions of the physical, logical and virtual assets in buildings and the relationships between them” [100]. BRICK avoids hard-coding sensor names in the software, making the application more portable between buildings. For instance, instead of representing a sensor as “supply_temp_VAV002_AHU01”, BRICK queries can search for the ID of the supply air temperature sensor in any VAV belonging to any AHU.
During the model construction and calibration phase, the use of MPCPy was crucial to make the software more flexible. MPCPy affords the construction of multiple systems that can be quickly replaced with others, as long as the inputs and outputs stay the same. This allows rapid switching between emulated components and real components (e.g., a virtual battery with a real battery) and vice versa. Furthermore, it provides the possibility to run the optimization engine in “shadow mode” (i.e., the optimal controller computes setpoints, but it does not send them to the actual devices) and, if necessary, to quickly swap to controlling the real systems. This setup allowed debugging the system with real-time data but avoided loss of comfort or disruption of business operation.

5.2. Challenges of the Real World Deployment

The real-world deployment of SPO was a useful step to test the robustness of the implementation and understand the challenges with real systems. The lessons learned during this process are summarized in Table 5.
Selecting sensors and controllers for the project proved to be the first hurdle. While there is a proliferation of new IoT and smart home devices on the market, very few met the cybersecurity and local control requirement of the project. In particular, to access the API of most smart thermostats, an Internet connection is required. This was undesirable for a microgrid that needs to work during network outages. Eventually, a BACnet thermostat was selected for installation, although its cost was significantly higher than other alternatives and it did not provide native data encryption. There is a clear need for modern connected devices that meet the requirements of commercial buildings and microgrids. The deployment process also revealed the effect of the fast rate of change of the online services and IoT market. In the middle of the project, the weather service used to gather weather forecasts for the site had to be replaced, because its free service was terminated after a corporate acquisition. As this paper is written, the new weather forecast service was also acquired by a different company and there is uncertainty about the future of the service and API.
Precise control of refrigerator and RTU operation through these networked controllers represented another challenge. Often, the details about the local control loop (e.g., deadbands, hysteresis and other safeguard mechanisms) were not provided by the manufacturer and they had to be reverse-engineered by the research team. While these features are useful to protect the equipment, they added uncertainty to the results of each control action determined by the supervisory controller. Additional issues related to the ability to control the system emerged when it became clear that the refrigeration system was undersized and its temperatures tightly prescribed, allowing for little flexibility in its operation. Unlike typical commercial buildings, the 24-h operation of the store also added challenges and unique problems for the testing of the system deployment. Conflicts between local temperature adjustments by the staff and the setpoints suggested by the system also emerged. In the system monitoring process, unexpected data were often observed. In one instance, the store temperature kept dropping even though the cooling systems had not been running. Analysis revealed that the door openings had a large impact on the thermal conditions of the store. This type of event was very difficult to characterize in the model. The placement of the sensors in the store also impacted the controls. As additional sensors were not installed in the store, the measurements from the temperature sensors located within the thermostats and the refrigeration controllers were used to determine the state of the system. Unfortunately, these devices were installed away from the areas where staff and customers typically orbit, and hence did not capture the user comfort.
As it is typical of deployment projects, the research team had to work with multiple departments within the same organization, each having their own set of requirements. Building occupants expressed concerns about temperature oscillations during experiments. The IT department defined strict cybersecurity requirements and access control procedures. These issues were resolved through clear and responsive communication with all parties involved at all times, providing frequent and regular updates and expectations. Providing the local staff with a real-time dashboard and alarm/notification system was a very effective way of keeping them engaged and updated. However, these needs also impacted the number of experiments allowed and their boundaries.
Further, the overall project schedule was significantly delayed because of logistical issues (i.e., unforeseen delays in equipment delivery and faulty equipment) regulatory requirements (i.e., working with utilities to sign off on the relatively novel microgrid interconnect agreement and receiving approval before battery and PV commissioning) and unfortunate and unforeseen natural disasters (i.e., power shutoffs due to wildfires and the COVID-19 pandemic). Although this combination of circumstances was unique, field deployments of advanced technologies should account for delays in their timeline. The delays that were experienced due to the wildfires and the pandemic only underscore the value of research that is focused on accelerating deployment of these systems. While it is unreasonable to expect that every microgrid would face similar challenges, a core goal of deployment-focused research must be to identify solutions to these challenges and improve the ability of developers to deploy advanced energy systems at scale.

5.3. Limitations and Future Work

During field tests, the SPO system demonstrated the ability to respond to both price- and and demand- based grid signals, using all the controllable loads: the battery, the two RTUs, the freezer and the refrigerator. The system has been collecting data from the local controllers and sensors for almost a year and has been controlling the equipment for seven months at the time of writing this paper. However, thus far the experiments have lasted approximately one week at a time and the results presented in the paper covered only a single day of operations. Thus, there needs to be further prolonged testing to evaluate the performance and the robustness of the system in the long run. Additionally, the baseline load for each of the experiments has been determined using a linear regression model based on historical environmental and building load data. In addition, the focus of this paper is to demonstrate an integrated software solution in a real building rather than precisely investigating the performance of the optimal control algorithm. The next steps in the research project involve determining more accurate baselines (statistical techniques such as Random Forest Regression, Autoregressive integrated moving average (ARIMA), etc.) and improving and evaluating the performance of the optimization algorithm by comparing it against other advanced control solutions.
Currently, the measurements recorded by the temperature sensors that are embedded into the thermostats and the refrigeration controllers have been used by SPO’s optimization engine. While this characteristic allows easy deployment of SPO, there has been work planned to improve the building model by collecting data from temporarily installed temperature loggers across the store. Installing additional sensors to record occupancy related information would also be greatly beneficial. For example, with a door sensor, SPO would have been able to track the door open/close events and the model would have been able to take into account the effect of outside air in the store.
While this pilot site has unique characteristics, this test successfully demonstrates the feasibility of the SPO system for similar types of buildings. Many convenience stores in operation today (around 12,000 in California alone) have similar HVAC and refrigeration systems and can be upgraded to become a building-scale microgrid. Quick serve restaurants, hotels and grocery stores are other possible candidates for deployment of these systems. Deploying SPO in such buildings would provide data points regarding the portability and the scalability of the whole system and identifying another deployment site is also a part of the future work.

6. Conclusions

This paper presents the design, implementation and preliminary test of Solar+ Optimizer (SPO), a control software that provides demand flexibility to building-scale microgrids. The software uses Model Predictive Control (MPC) to optimally coordinate the operation of building loads and the distributed energy resources on site. SPO is designed to be vendor-agnostic and protocol-independent and is built on open-source software. The software has been tested in a convenience store in northern California with on-site solar generation, battery storage and control of HVAC and commercial refrigeration loads and preliminary results show the ability to shed load in response to price signals and to curtail demand, generating more than 10% savings in energy costs alone. Future work includes more extensive testing and publishing the project as an open-source library as well as sharing the data obtained during the project.

Author Contributions

Conceptualization, K.Z., D.B., and M.P.; Methodology, K.Z., D.B., and M.P.; Software, A.K.P., K.Z., P.G., D.B., M.M. and G.F.; Validation, K.Z., D.B., P.A., J.Z., R.B. and M.P.; Formal analysis, A.K.P. and K.Z.; Investigation, A.K.P., M.M. and M.P.; Resources, A.K.P., M.M., J.Z. and R.B.; Data curation, A.K.P.; Writing—original draft preparation, A.K.P., K.Z. and M.P.; Writing—review and editing, A.K.P., P.G., D.B., P.A., R.B. and M.P.; Visualization, A.K.P. and K.Z.; Supervision, D.B., R.B. and M.P.; Project administration, P.A., J.Z. and R.B.; Funding acquisition, P.A., R.B. and M.P. All authors have read and agreed to the published version of the manuscript.

Funding

This research was funded by California Energy Commission grants EPC-17-002 and EPC-15-057 and by the U.S.–China Clean Energy Research Center (CERC) 2.0 on Building Energy Efficiency (BEE), supported by the U.S. Department of Energy, Building Technologies Office. Lawrence Berkeley National Laboratory is a multiprogram science lab in the national laboratory system supported by the U.S. Department of Energy through its Office of Science under Contract No. DE-AC02-05CH11231.

Acknowledgments

The authors wish to acknowledge the Blue Lake Rancheria for supporting this research by providing cost share and providing their convenience store as a pilot site to deploy the Solar+ Optimizer software.

Conflicts of Interest

The authors declare no conflict of interest.

References

  1. Li, Z.; Guo, J. Wisdom about age [aging electricity infrastructure]. IEEE Power Energy Mag. 2006, 4, 44–51. [Google Scholar]
  2. Mariam, L.; Basu, M.; Conlon, M.F. Microgrid: Architecture, policy and future trends. Renew. Sustain. Energy Rev. 2016, 64, 477–489. [Google Scholar] [CrossRef]
  3. Hirsch, A.; Parag, Y.; Guerrero, J. Microgrids: A review of technologies, key drivers, and outstanding issues. Renew. Sustain. Energy Rev. 2018, 90, 402–411. [Google Scholar] [CrossRef]
  4. Yoldaş, Y.; Önen, A.; Muyeen, S.; Vasilakos, A.V.; Alan, İ. Enhancing smart grid with microgrids: Challenges and opportunities. Renew. Sustain. Energy Rev. 2017, 72, 205–214. [Google Scholar] [CrossRef]
  5. Parhizi, S.; Lotfi, H.; Khodaei, A.; Bahramirad, S. State of the art in research on microgrids: A review. IEEE Access 2015, 3, 890–925. [Google Scholar] [CrossRef]
  6. Bahramirad, S.; Khodaei, A.; Svachula, J.; Aguero, J.R. Building Resilient Integrated Grids: One neighborhood at a time. IEEE Electrif. Mag. 2015, 3, 48–55. [Google Scholar] [CrossRef]
  7. Tavakoli, M.; Shokridehaki, F.; Akorede, M.F.; Marzband, M.; Vechiu, I.; Pouresmaeil, E. CVaR-based energy management scheme for optimal resilience and operational cost in commercial building microgrids. Int. J. Electr. Power Energy Syst. 2018, 100, 1–9. [Google Scholar] [CrossRef]
  8. Lizana, J.; Chacartegui, R.; Barrios-Padura, A.; Valverde, J.M. Advances in thermal energy storage materials and their applications towards zero energy buildings: A critical review. Appl. Energy 2017, 203, 219–239. [Google Scholar] [CrossRef]
  9. Eaton. Microgrid and Distributed Energy Resources. Available online: https://www.eaton.com/us/en-us/catalog/services/microgrid-and-distributed-energy-resources.html (accessed on 14 May 2020).
  10. Company, S.E. Don’t Panic. Make Your Complex Microgrid Easy with S&C. Available online: https://www.sandc.com/en/solutions/microgrids/ (accessed on 14 May 2020).
  11. Electric, S. Microgrid Solutions. Available online: https://www.se.com/us/en/work/solutions/microgrids/ (accessed on 14 May 2020).
  12. Reynolds, J.; Rezgui, Y.; Hippolyte, J.L. Upscaling energy control from building to districts: Current limitations and future perspectives. Sustain. Cities Soc. 2017, 35, 816–829. [Google Scholar] [CrossRef]
  13. EIA. Annual Energy Outlook 2019: Commercial Sector Key Indicators and Consumption Reference Case. Available online: https://www.eia.gov/outlooks/aeo/data/browser/#/?id=5-AEO2019&sourcekey=0. (accessed on 7 May 2020).
  14. Hydeman, M.; Taylor, S.T.; Eubanks, B. Control sequences & controller programming. ASHRAE J. 2015, 57, 58–62. [Google Scholar]
  15. Joos, G.; Reilly, J.; Bower, W.; Neal, R. The need for standardization: The benefits to the core functions of the microgrid control system. IEEE Power Energy Mag. 2017, 15, 32–40. [Google Scholar] [CrossRef]
  16. Henze, G.P. Model predictive control for buildings: A quantum leap? J. Build. Perform. Simul. 2013, 6, 157–158. [Google Scholar] [CrossRef] [Green Version]
  17. Henze, G.P.; Kalz, D.E.; Liu, S.; Felsmann, C. Experimental Analysis of Model-Based Predictive Optimal Control for Active and Passive Building Thermal Storage Inventory. HVAC R Res. 2005, 11, 189–213. [Google Scholar] [CrossRef]
  18. Henze, G.P.; Felsmann, C.; Knabe, G. Evaluation of optimal control for active and passive building thermal storage. Int. J. Therm. Sci. 2004, 43, 173–183. [Google Scholar] [CrossRef]
  19. Nabil Nassif, S.K.; Sabourin, R. Optimization of HVAC Control System Strategy Using Two-Objective Genetic Algorithm. HVAC R Res. 2005, 11, 459–486. [Google Scholar] [CrossRef] [Green Version]
  20. Nassif, N.; Kajl, S.; Sabourin, R. Simplified Model-based Optimal Control of VAV Air-conditioning System. In Proceedings of the Ninth International IBPSA Conference, Montreal, QC, Canada, 15–18 August 2005; pp. 823–830. [Google Scholar]
  21. Wang, S.; Jin, X. Model-based optimal control of VAV air-conditioning system using genetic algorithm. Build. Environ. 2000, 35, 471–487. [Google Scholar] [CrossRef]
  22. May-Ostendorp, P.; Henze, G.P.; Corbin, C.D.; Rajagopalan, B.; Felsmann, C. Model-predictive control of mixed-mode buildings with rule extraction. Build. Environ. 2011, 46, 428–437. [Google Scholar] [CrossRef]
  23. Corbin, C.D.; Henze, G.P.; May-Ostendorp, P. A model predictive control optimization environment for real-time commercial building application. J. Build. Perform. Simul. 2013, 6, 159–174. [Google Scholar] [CrossRef]
  24. Lee, Y.M.; Horesh, R.; Liberti, L. Optimal HVAC Control as Demand Response with On-site Energy Storage and Generation System. Energy Procedia 2015, 78, 2106–2111. [Google Scholar] [CrossRef] [Green Version]
  25. Biyik, E.; Kahraman, A. A predictive control strategy for optimal management of peak load, thermal comfort, energy storage and renewables in multi-zone buildings. J. Build. Eng. 2019, 25, 100826. [Google Scholar] [CrossRef]
  26. Marušić, D.; Lešić, V.; Capuder, T.; Vasak, M. Price-Optimal Energy Flow Control of a Building Microgrid Connected to a Smart Grid. In Proceedings of the 2018 26th Mediterranean Conference on Control and Automation (MED), Zadar, Croatia, 19–22 June 2018; pp. 1–9. [Google Scholar]
  27. Xue, Y.; Todd, M.; Ula, S.; Barth, M.J.; Martinez-Morales, A.A. A comparison between two MPC algorithms for demand charge reduction in a real-world microgrid system. In Proceedings of the 2016 IEEE 43rd Photovoltaic Specialists Conference (PVSC), Portland, OR, USA, 5–10 June 2016; pp. 1875–1880. [Google Scholar]
  28. Tavakoli, M.; Shokridehaki, F.; Marzband, M.; Godina, R.; Pouresmaeil, E. A two stage hierarchical control approach for the optimal energy management in commercial building microgrids based on local wind power and PEVs. Sustain. Cities Soc. 2018, 41, 332–340. [Google Scholar] [CrossRef]
  29. Reynolds, J.; Rezgui, Y.; Kwan, A.; Piriou, S. A zone-level, building energy optimisation combining an artificial neural network, a genetic algorithm, and model predictive control. Energy 2018, 151, 729–739. [Google Scholar] [CrossRef]
  30. Magnier, L.; Haghighat, F. Multiobjective optimization of building design using TRNSYS simulations, genetic algorithm, and Artificial Neural Network. Build. Environ. 2010, 45, 739–746. [Google Scholar] [CrossRef]
  31. Bonthu, R.K.; Pham, H.; Aguilera, R.P.; Ha, Q.P. Minimization of building energy cost by optimally managing PV and battery energy storage systems. In Proceedings of the 2017 20th International Conference on Electrical Machines and Systems (ICEMS), Sydney, NSW, Australia, 11–14 August 2017; pp. 1–6. [Google Scholar]
  32. Wang, Z.; Yang, R.; Wang, L. Intelligent multi-agent control for integrated building and micro-grid systems. In Proceedings of the ISGT 2011, Anaheim, CA, USA, 17–19 January 2011; pp. 1–7. [Google Scholar]
  33. Benjamin Heymann, J. Frédéric Bonnans, P.M.F.J.S.F.L.; Jiménez-Estévez, G. Continuous optimal control approaches to microgrid energy management. Energy Syst. 2018, 9, 59–77. [Google Scholar] [CrossRef] [Green Version]
  34. Macarulla, M.; Casals, M.; Forcada, N.; Gangolells, M. Implementation of predictive control in a commercial building energy management system using neural networks. Energy Build. 2017, 151, 511–519. [Google Scholar] [CrossRef] [Green Version]
  35. Vázquez-Canteli, J.R.; Nagy, Z. Reinforcement learning for demand response: A review of algorithms and modeling techniques. Appl. Energy 2019, 235, 1072–1089. [Google Scholar] [CrossRef]
  36. Jia, R.; Jin, M.; Sun, K.; Hong, T.; Spanos, C. Advanced Building Control via Deep Reinforcement Learning. Energy Procedia 2019, 158, 6158–6163. [Google Scholar] [CrossRef]
  37. Wang, Y.; Velswamy, K.; Huang, B. A Long-Short Term Memory Recurrent Neural Network Based Reinforcement Learning Controller for Office Heating Ventilation and Air Conditioning Systems. Processes 2017, 5, 46. [Google Scholar] [CrossRef] [Green Version]
  38. Wei, T.; Wang, Y.; Zhu, Q. Deep reinforcement learning for building HVAC control. In Proceedings of the 2017 54th ACM/EDAC/IEEE Design Automation Conference (DAC), Austin, TX, USA, 18–22 June 2017; pp. 1–6. [Google Scholar]
  39. Zhang, Z.; Chong, A.; Pan, Y.; Zhang, C.; Lu, S.; Lam, K. A Deep Reinforcement Learning Approach to Using Whole Building Energy Model For HVAC Optimal Control. In Proceedings of the 2018 ASHRAE/IBPSA-USA Building Performance Analysis Conference and SimBuild, Chicago, IL, USA, 26–28 September 2018. [Google Scholar]
  40. Ahn, K.U.; Park, C.S. Application of deep Q-networks for model-free optimal control balancing between different HVAC systems. Sci. Technol. Built Environ. 2020, 26, 61–74. [Google Scholar] [CrossRef]
  41. Wetter, M. Co-simulation of building energy and control systems with the Building Controls Virtual Test Bed. J. Build. Perform. Simul. 2011, 4, 185–203. [Google Scholar] [CrossRef] [Green Version]
  42. West, S.R.; Ward, J.K.; Wall, J. Trial results from a model predictive control and optimisation system for commercial building HVAC. Energy Build. 2014, 72, 271–279. [Google Scholar] [CrossRef]
  43. Bengea, S.C.; Kelman, A.D.; Borrelli, F.; Taylor, R.; Narayanan, S. Implementation of model predictive control for an HVAC system in a mid-size commercial building. HVAC R Res. 2014, 20, 121–135. [Google Scholar] [CrossRef]
  44. Kim, D.; Braun, J.; Cai, J.; Fugate, D. Development and experimental demonstration of a plug-and-play multiple RTU coordination control algorithm for small/medium commercial buildings. Energy Build. 2015, 107, 279–293. [Google Scholar] [CrossRef] [Green Version]
  45. Kim, D.; Braun, J.E. Development, implementation and performance of a model predictive controller for packaged air conditioners in small and medium-sized commercial building applications. Energy Build. 2018, 178, 49–60. [Google Scholar] [CrossRef]
  46. Carli, R.; Cavone, G.; Ben Othman, S.; Dotoli, M. IoT Based Architecture for Model Predictive Control of HVAC Systems in Smart Buildings. Sensors 2020, 20, 781. [Google Scholar] [CrossRef] [PubMed] [Green Version]
  47. Vrettos, E.; Kara, E.C.; MacDonald, J.; Andersson, G.; Callaway, D.S. Experimental Demonstration of Frequency Regulation by Commercial Buildings—Part I: Modeling and Hierarchical Control Design. IEEE Trans. Smart Grid 2018, 9, 3213–3223. [Google Scholar] [CrossRef] [Green Version]
  48. Vrettos, E.; Kara, E.C.; MacDonald, J.; Andersson, G.; Callaway, D.S. Experimental Demonstration of Frequency Regulation by Commercial Buildings—Part II: Results and Performance Evaluation. IEEE Trans. Smart Grid 2018, 9, 3224–3234. [Google Scholar] [CrossRef] [Green Version]
  49. Bruno, S.; Giannoccaro, G.; La Scala, M. A Demand Response Implementation in Tertiary Buildings Through Model Predictive Control. IEEE Trans. Ind. Appl. 2019, 55, 7052–7061. [Google Scholar] [CrossRef]
  50. FLEXlab. Advanced Integrated Building & Grid Technologies Testbed. Available online: https://flexlab.lbl.gov/ (accessed on 4 May 2020).
  51. Chen, B.; Cai, Z.; Bergés, M. Gnu-RL: A Precocial Reinforcement Learning Solution for Building HVAC Control Using a Differentiable MPC Policy. In Proceedings of the 6th ACM International Conference on Systems for Energy-Efficient Buildings Cities, and Transportation, New York, NY, USA, 13–14 November 2019; Association for Computing Machinery: New York, NY, USA, 2019; pp. 316–325. [Google Scholar] [CrossRef]
  52. Zhang, Z.; Lam, K.P. Practical Implementation and Evaluation of Deep Reinforcement Learning Control for a Radiant Heating System. In Proceedings of the 5th Conference on Systems for Built Environments, Shenzhen, China, 7–8 November 2018; Association for Computing Machinery: New York, NY, USA, 2018; pp. 148–157. [Google Scholar] [CrossRef]
  53. Brundu, F.G.; Patti, E.; Osello, A.; Giudice, M.D.; Rapetti, N.; Krylovskiy, A.; Jahn, M.; Verda, V.; Guelpa, E.; Rietto, L.; et al. IoT Software Infrastructure for Energy Management and Simulation in Smart Cities. IEEE Trans. Ind. Inform. 2017, 13, 832–840. [Google Scholar] [CrossRef]
  54. Fagiani, M.; Severini, M.; Valenti, M.; Ferracuti, F.; Ciabattoni, L.; Squartini, S. rEMpy: A comprehensive software framework for residential energy management. Energy Build. 2018, 171, 131–143. [Google Scholar] [CrossRef]
  55. Bottaccioli, L.; Aliberti, A.; Ugliotti, F.; Patti, E.; Osello, A.; Macii, E.; Acquaviva, A. Building Energy Modelling and Monitoring by Integration of IoT Devices and Building Information Models. In Proceedings of the 2017 IEEE 41st Annual Computer Software and Applications Conference (COMPSAC), Turin, Italy, 4–8 July 2017; Volume 1, pp. 914–922. [Google Scholar]
  56. Berbakov, L.; Batić, M.; Tomašević, N. Smart Energy Manager for Energy Efficient Buildings. In Proceedings of the IEEE EUROCON 2019—18th International Conference on Smart Technologies, Novi Sad, Serbia, Serbia, 1–4 July 2019; pp. 1–4. [Google Scholar]
  57. Akyol, B.A.; Haack, J.; Ciraci, S.; Carpenter, B.; Vlachopoulou, M.; Tews, C. VOLTTRON: An Agent Execution Platform for the Electric Power System. In Proceedings of the Third International Workshop on Agent Technologies for Energy Systems (ATES 2012), Valencia, Spain, 5 June 2012. [Google Scholar]
  58. Evins, R.; David, N. Using Simple Predictive Models to Improve Control of Complex Building Systems. In Proceedings of the 4th ACM International Conference on Systems for Energy-Efficient Built Environments, Delft, The Netherlands, 8–9 November 2017; Association for Computing Machinery: New York, NY, USA, 2017. [Google Scholar] [CrossRef]
  59. Mirakhorli, A.; Dong, B. An Open Source Smart Building Energy Management Platform through VOLTTRON. In Proceedings of the 2017 International Building Performance and Simulation Association Conference, San Francisco, CA, USA, 7–9 August 2017. [Google Scholar]
  60. Hao, H.; Liu, G.; Huang, S.; Katipamula, S. Coordination and Control of Flexible Building Loads for Renewable Integration; Demonstrations using VOLTTRON; U.S. Department of Energy Office of Scientific and Technical Information: Oak Ridge, TN, USA, 2016. [CrossRef] [Green Version]
  61. Luo, J.; Pourbabak, H.; Su, W. The application of distributed control algorithms using VOLTTRON-based software platform. In Proceedings of the 2017 8th International Renewable Energy Congress (IREC), Amman, Jordan, 21–23 March 2017; pp. 1–6. [Google Scholar]
  62. Raker, D.; Sellers, A.; Kini, R.; Green, M.; Stuart, T.; Ellingson, R.; Khanna, R.; Heben, M. Grid Integration of Building Systems and 1 MW Photovoltaic Array using VOLTTRON. In Proceedings of the 2017 IEEE 44th Photovoltaic Specialist Conference (PVSC), Washington, DC, USA, 25–30 June 2017; pp. 2926–2930. [Google Scholar]
  63. Raker, D.; Kini, R.; Huntsman, R.; Green, M.; Sapci, O.; Stuart, T.; Ellingson, R.; Khanna, R.; Heben, M. Transactive Mitigation Of Variability In The Output Of 1 MW Photovoltaic Array Using VolttronTM. In Proceedings of the 2018 IEEE 7th World Conference on Photovoltaic Energy Conversion (WCPEC) (A Joint Conference of 45th IEEE PVSC, 28th PVSEC 34th EU PVSEC), Waikoloa Village, HI, USA, 10–15 June 2018; pp. 1462–1467. [Google Scholar]
  64. For the Advancement of Structured Information Standards (OASIS), T.O. MQTT. Available online: http://mqtt.org/ (accessed on 14 May 2020).
  65. Fierro, G. XBOS Overview. Available online: https://docs.xbos.io (accessed on 6 May 2020).
  66. Balaji, B.; Bhattacharya, A.; Fierro, G.; Gao, J.; Gluck, J.; Hong, D.; Johansen, A.; Koh, J.; Ploennigs, J.; Agarwal, Y.; et al. Brick: Towards a Unified Metadata Schema For Buildings. In Proceedings of the 3rd ACM International Conference on Systems for Energy-Efficient Built Environments, Stanford, CA, USA, 15–17 November 2016; Association for Computing Machinery: New York, NY, USA, 2016; pp. 41–50. [Google Scholar] [CrossRef] [Green Version]
  67. Andersen, M.P.; Kumar, S.; AbdelBaky, M.; Fierro, G.; Kolb, J.; Kim, H.S.; Culler, D.E.; Popa, R.A. WAVE: A Decentralized Authorization Framework with Transitive Delegation. In Proceedings of the 28th USENIX Security Symposium (USENIX Security 19), Santa Clara, CA, United States, 14–16 August 2019; Association: Santa Clara, CA, USA, 2019; pp. 1375–1392. [Google Scholar]
  68. Andersen, M.P. WAVEMQ—Tiered message bus for WAVE 3. Available online: https://github.com/immesys/wavemq (accessed on 6 May 2020).
  69. Developers, G. Protocol Buffers. Available online: https://developers.google.com/protocol-buffers (accessed on 7 May 2020).
  70. gRPC Authors 2020. gRPC: A High-Performance, Open Source Universal RPC Framework. Available online: https://grpc.io (accessed on 7 May 2020).
  71. Organization T.M. Modbus. Available online: http://www.modbus.org/specs.php (accessed on 14 May 2020).
  72. American Society of Heating, R.; (ASHRAE), A.C.E. BACnet. Available online: http://www.bacnet.org/ (accessed on 14 May 2020).
  73. Blum, D.H.; Wetter, M. MPCPy: An Open-Source Software Platform for Model Predictive Control in Buildings. In Proceedings of the 15th Conference of International Building Performance Simulation, San Francisco, CA, USA, 7–9 August 2017. [Google Scholar]
  74. Mattsson, S.E.; Elmqvist, H. Modelica—An international effort to design the next generation modeling language. In Proceedings of the 7th IFAC Symposium on Computer Aided Control Systems Design, Gent, Belgium, 28–30 April 1997. [Google Scholar]
  75. Åkesson, J.; Gäfvert, M.; Tummescheit, H. JModelica—An Open Source Platform for Optimization of Modelica Models. In Proceedings of the 6th Vienna International Conference on Mathematical Modelling, Vienna, Austria, 11–13 February 2009. [Google Scholar]
  76. Andersson, J.; Åkesson, J.R.; Diehl, M. CasADi: A Symbolic Package for Automatic Differentiation and Optimal Control. Recent Adv. Algorithm. Differ. 2012, 87, 297–307. [Google Scholar]
  77. Wächter, A.; Biegler, L.T. On the Implementation of a Primal-Dual Interior Point Filter Line Search Algorithm for Large-Scale Nonlinear Programming. Math. Program. 2006, 106, 25–57. [Google Scholar] [CrossRef]
  78. Gas, P.; Company, E. Find out if Peak Day Pricing Is Right for Your Business. Available online: https://www.pge.com/en_US/small-medium-business/your-account/rates-and-rate-options/peak-day-pricing.page. (accessed on 15 May 2020).
  79. Edison, S.C. Get to Know Critical Peak Pricing (CPP). Available online: www.sce.com/business/rates/cpp (accessed on 18 May 2020).
  80. International, P.G. SMUD Sees Early Success with Dynamic Pricing Pilot. Available online: https://www.power-grid.com/2013/07/10/smud-sees-early-success-with-dynamic-pricing-pilot/ (accessed on 15 May 2020).
  81. Fund, E.D. The Costs and Benefits of Real-Time Pricing. Available online: https://citizensutilityboard.org/wp-content/uploads/2017/11/FinalRealTimePricingWhitepaper.pdf (accessed on 15 May 2020).
  82. Zhang, Q.; Huang, J.; Lang, S. Development of typical year weather files for Chinese locations. ASHRAE Trans. 2002, 108, 1063–1086. [Google Scholar]
  83. Perez, R.; Ineichen, P.; Seals, R.; Michalsky, J.; Stewart, R. Modeling daylight availability and irradiance components from direct and global irradiance. Sol. Energy 1990, 44, 271–289. [Google Scholar] [CrossRef] [Green Version]
  84. Authority, R.C.E. RCEA Community Choice Energy Program: Commercial, Industrial & Agricultural Generation Rates. Available online: https://redwoodenergy.org/wp-content/uploads/2020/03/March-2020-Com-Rates-for-Website.pdf (accessed on 16 May 2020).
  85. Gas, P.; Company, E. ELECTRIC SCHEDULE B-19. Available online: https://www.pge.com/tariffs/assets/pdf/tariffbook/ELEC_SCHEDS_B-19.pdf (accessed on 16 May 2020).
  86. Office of Energy Efficiency & Renewable Energy. Confronting the Duck Curve: How to Address Over-Generation of Solar Energy. Available online: https://www.energy.gov/eere/articles/confronting-duck-curve-how-address-over-generation-solar-energy. (accessed on 16 May 2020).
  87. Intel. Intel NUC. Available online: https://www.intel.com/content/www/us/en/products/boards-kits/nuc.html (accessed on 14 May 2020).
  88. InfluxData. InfluxDB. Available online: https://www.influxdata.com/ (accessed on 15 May 2020).
  89. Systems, C.C. Wattnode Modbus. Available online: https://ctlsys.com/product/wattnode-modbus/ (accessed on 14 May 2020).
  90. Controls, K. BAC-120063CEW. Available online: https://www.kmccontrols.com/product/bac-120063cew/ (accessed on 14 May 2020).
  91. Corporation, P.H. Sporlan Electronic Refrigeration Controllers: PSK214N9EXBS. Available online: https://ph.parker.com/us/en/sporlan-electronic-refrigeration-controllers/psk214n9exbs (accessed on 16 May 2020).
  92. Laboratories, S.E. SEL-3505/3505-3: Real-Time Automation Controller (RTAC). Available online: https://selinc.com/products/3505/ (accessed on 14 May 2020).
  93. Tesla. Meet Powerwall, Your Home Battery. Available online: https://www.tesla.com/powerwall (accessed on 16 May 2020).
  94. Company, T.D.S. Dark Sky API. Available online: https://darksky.net/dev (accessed on 14 May 2020).
  95. Association, I.S. 2030.5-2018-IEEE Standard for Smart Energy Profile Application Protocol. Available online: https://standards.ieee.org/standard/2030_5-2018.html (accessed on 16 May 2020).
  96. Alliance, O. OpenADR. Available online: https://www.openadr.org/ (accessed on 14 May 2020).
  97. Reniersa, J.M.; Mulder, G.; Ober-Blöbaum, S.; Howey, D.A. Improving optimal control of grid-connected lithium-ion batteries through more accurate battery and degradation modelling. J. Power Sources 2018, 379, 91–102. [Google Scholar] [CrossRef] [Green Version]
  98. Kiliccote, S.; Piette, M.A.; Hansen, D. Advanced Controls and Communications for Demand Response and Energy Efficiency in Commercial Buildings. In Proceedings of the Second Carnegie Mellon Conference in Electric Power Systems: Monitoring, Sensing, Software and Its Valuation for the Changing Electric Power Industry, Pittsburgh, PA, USA, 11–12 January 2006. [Google Scholar]
  99. Pipattanasomporn, M.; Kuzlu, M.; Khamphanchai, W.; Saha, A.; Rathinavel, K.; Rahman, S. BEMOSS: An agent platform to facilitate grid-interactive building operation with IoT devices. In Proceedings of the 2015 IEEE Innovative Smart Grid Technologies-Asia (ISGT ASIA), Bangkok, Thailand, 3–6 November 2015; pp. 1–6. [Google Scholar]
  100. Consortium, B. Brick: A Uniform Metadata Schema for Buildings. Available online: https://brickschema.org/ (accessed on 15 May 2020).
Figure 1. Software architecture diagram of the Solar+ Optimizer system.
Energies 13 03093 g001
Figure 2. WAVEMQ: A tiered publish-subscribe message bus [68].
Energies 13 03093 g002
Figure 3. The services on the site router continue to run even during network outages.
Energies 13 03093 g003
Figure 4. The optimization engine component and its relationship to other parts of SPO.
Energies 13 03093 g004
Figure 5. Distributed Energy Resources installed on site.
Energies 13 03093 g005
Figure 6. Daily load profile of the convenience store across different seasons.
Energies 13 03093 g006
Figure 7. MPC model structure.
Energies 13 03093 g007
Figure 8. (a) SPO’s response to hourly dynamic prices and varying solar irradiance. (b) Through battery discharge and reduction in building load, where the net load is minimum during high price times and the battery charges during the low price times anticipating the high price period. (c) SPO changes the thermostat setpoints to vary the zone temperature. Preferred temperatures: 20.56 C (69 F) for the West Zone and 21.67 C (71 F) for the East Zone.
Energies 13 03093 g008
Figure 9. (a) SPO’s response to a TOU tariff with both demand charges and energy costs and varying solar irradiance. (b) The battery is used effectively for reducing net load during peak price hours. (c) SPO changes the thermostat setpoints to vary the zone temperature. Preferred temperatures: 20.56 C (69 F) for the West Zone and 21.67 C (71 F) for the East Zone.
Energies 13 03093 g009
Figure 10. (a) Reduction in net load during a 26 kW demand limiting grid signal from 06:00 to 08:00 (b) Breakdown of controlled loads; HVAC and freezer loads cause the decrease in net load consumption; the battery was not used during this event.
Energies 13 03093 g010
Table 1. MPC configuration for handling different grid signals.
ModeObjectiveInformation in the SignalConstraints
Price
based
Minimize cost of
energy and/or power
Energy price and/or
demand charges,
estimated peak power
None
Demand
limiting
Minimize cost of
energy and/or power
Energy price and/or
demand charges,
estimated peak power,
maximum power P m a x
P P m a x
Load
shedding
Minimize cost of
energy and/or power
Energy price and/or
demand charges,
estimated peak power,
baseline power P b a s e l i n e ,
P s h e d , start time, final time
P P b a s e l i n e P s h e d for
[ t s t a r t , t f i n a l ]
Load
shifting
Minimize cost of
energy and/or power
Energy price and/or
demand charges,
estimated peak power,
baseline power P b a s e l i n e ,
P d e c r e a s e , P i n c r e a s e ,
start increase time,
final increase time,
start decrease time,
final decrease time
P P b a s e l i n e + P i n c r e a s e for
[ t s t a r t , i n c r e a s e , t f i n a l , i n c r e a s e ]
and
P P b a s e l i n e P d e c r e a s e for
[ t s t a r t , d e c r e a s e , t f i n a l , d e c r e a s e ]
Load
tracking
Minimize error against
reference power profile
Reference power
profile P r e f e r e n c e
P P r e f e r e n c e < ϵ
Table 2. List of data sources and relevant variables (Inputs to the optimization engine).
SourceProtocolVariables
Wattnode MeterModbus (serial)active power (W)
KMC ThermostatBACnet/IPindoor temperature ( C)
Refrigeration ControllerModbus (serial)cabinet temperature ( C)
RTACModbus
(TCP)
PV production (W)
battery charge/discharge rate (W)
battery state of charge (%)
Battery (emulated)-battery charge/discharge rate (W)
battery State of Charge (%)
Dark Sky APIHTTPoutdoor temperature ( C)
cloud cover (%)
relative humidity (%)
wind speed (mph)
and 48-hour forecasts of these
Grid Signals (tariffs, dynamic prices, Demand response events)-price of energy ($/kWh)
demand charge ($/kW)
amount of load limit/shed/shift (W)
Table 3. List of Controllers and their relevant variables (Outputs of the optimization engine).
ControllerProtocolControl VariablesDefaultLower LimitUpper Limit
Thermostat EastBACnet/IPheating setpoint
cooling setpoint
19.44 C
21.67 C
17.22 C
19.44 C
22.22 C
23.33 C
Thermostat WestBACnet/IPheating setpoint
cooling setpoint
18.33 C
20.56 C
17.22 C
19.44 C
22.22 C
23.33 C
FreezerModbus (serial)cabinet temp. setpoint−21.67 C−34.44 C−18.89 C
RefrigeratorModbus (serial)cabinet temp. setpoint0.56 C0.56 C3.33 C
Battery (emulated)-charge/discharge rate0W−14 kW14 kW
Table 4. Comparison of estimated costs for energy and demand between SPO and Baseline controls.
CostsSPO Optimized LoadBaseline Load
Energy Cost
Demand Cost
$61.42
$793.86
$68.63
$814.99
Total Cost$855.28$883.62
Table 5. A summary of challenges faced during the implementation and deployment of SPO.
#CategoryDescription of Challenge
1TechnicalLimited choice of secure connected devices with local communication interfaces
2TechnicalUncertain service and support for connected products, web services and underlying libraries (e.g., discontinued services, APIs changes).
3TechnicalComplex interaction of advanced supervisory control with local control in each connected device (e.g., thermostat hysteresis and defrost control).
4TechnicalOverconstrained systems (e.g., undersized refrigerator with tight temperature control bands)
5TechnicalFaulty equipment and sensors that make modeling harder due to unexpected behavior and incorrect representation of the system state
6TechnicalUnmodeled and unmeasured effects in the systems (e.g., unknown occupancy, door opening, internal gains due to uncontrolled equipment)
7OrganizationalConflicting objectives and different risk tolerance between occupants/managers and researchers (e.g., thermal comfort, refrigerator temperature swings)
8OrganizationalStrict site/organization procedures and requirements (e.g., cybersecurity procedures)
9LogisticDelays in equipment deliveries (e.g., components in high demand)
10LogisticFaulty new equipment that needs to be replaced
11RegulatoryLong lead times to work with highly-regulated, risk-adverse entities (e.g., utilities to sign off on the interconnect agreement, receiving approval before battery and PV commissioning)
12ExceptionalUnfortunate and unforeseen natural disasters (e.g., power shutoffs due to threats of wildfires, COVID-19 pandemic)

