Article

A Case Study on Distributed Energy Resources and Energy-Storage Systems in a Virtual Power Plant Concept: Technical Aspects

1
Faculty of Electrical Engineering, Wroclaw University of Science and Technology, 50-370 Wrocław, Poland
2
Faculty of Computer Science and Management, Wroclaw University of Science and Technology, 50-370 Wrocław, Poland
3
TAURON Ekoenergia Ltd., 58-500 Jelenia Góra, Poland
*
Authors to whom correspondence should be addressed.
Energies 2020, 13(12), 3086; https://doi.org/10.3390/en13123086
Submission received: 6 May 2020 / Revised: 28 May 2020 / Accepted: 8 June 2020 / Published: 15 June 2020
(This article belongs to the Special Issue Signal Analysis in Power Systems)

Abstract

:
The article presents calculations and power flow of a real virtual power plant (VPP), containing a fragment of low and medium voltage distribution network. The VPP contains a hydropower plant (HPP), a photovoltaic system (PV) and energy storage system (ESS). The purpose of this article is to summarize the requirements for connection of generating units to the grid. Paper discusses the impact of the requirements on the maximum installed capacity of distributed energy resource (DER) systems and on the parameters of the energy storage unit. Firstly, a comprehensive review of VPP definitions, aims, as well as the characteristics of the investigated case study of the VPP project is presented. Then, requirements related to the regulation, protection and integration of DER and ESS with power systems are discussed. Finally, investigations related to influence of DER and ESS on power network condition are presented. One of the outcomes of the paper is the method of identifying the maximum power capacity of DER and ESS in accordance with technical network requirements. The applied method uses analytic calculations, as well as simulations using Matlab environment, combined with real measurement data. The obtained results allow the influence of the operating conditions of particular DER and ESS on power flow and voltage condition to be identified, the maximum power capacity of ESS intended for the planed VPP to be determined, as well as the influence of power control strategies implemented in a PV power plant on resources available for the planning and control of a VPP to be specified. Technical limitations of the DER and ESS are used as input conditions for the economic simulations presented in the accompanying paper, which is focused on investigations of economic efficiency.

1. Introduction

A Virtual Power Plant (VPP) is still an actual approach and there is not a standardized definition for the framework of a VPP in the literature. The origin of the terminology of “Virtual Power Plant” may be traced back to 1997, when S. Awerbuch, in the book “The Virtual Utility—Accounting, Technology and Competitive Aspects of the Emerging Industry” defined Virtual Utility as flexible cooperation of independent, market-driven actors that assures an efficient energy service expected by the consumers without the need for appreciating assets [1]. A VPP manages distributed energy resources (DER) named also distributed generation (DG) units [2]. For example, wind, solar and hydroelectric power generation units are interconnected. Managing them together enables them to be more effective [3,4,5].
A Virtual Power Plant, as an autonomous, intelligent unit equipped with effective and safe power flow control systems, consists of generators, loads and energy storage that is connected to the distribution network [6]. These devices are equipped with controllers, which usually power electronic converters that allow for power flow control [6]. Coordinating the work of the entire VPP is a difficult and demanding task. The system’s architecture must not only enable power flow control but also ensure VPP protection—not only related to power system security but also cybersecurity. In Reference [7], VPP architecture based on a common information model (CIM) and IEC standard 61850 is shown.
There have recently been many attempts to integrate intelligent solutions in power systems. An interesting discussion related to microgrids and the VPP is presented in Reference [8]. Microgrids allow increasing the efficiency of the use of distributed energy sources and energy storage systems. It also allows for regulating the load. Microgrids can be connected to the power system or operate as a standalone system. VPP management is based on computer software that enables the integration of distributed sources. In systems connected to the distribution network, the value of the power generated by the generation sources, the operation of the energy storage and the response of the demand side are optimized. Several propositions proclaiming the idea of transforming microgrids to a virtual power plant have recently been discussed, among others in References [2,6]. Additionally, it is also worth mentioning a new topic called virtual microgrids, which can be recognized as software solutions and algorithms supporting the planning, design and operation of microgrids. As an example of the virtual microgrids, it is worth noting a prosumer cluster connection into virtual microgrids to obtain cost reduction [9] or energy peer-to-peer trading in virtual microgrids [10].
Due to the random nature of the generated power, a large number of independent renewable energy sources can lead to system stability problems and therefore the connecting of distant generation sources, loads and energy storage units into a VPP has many benefits [11]. Work [12] shows the possibility of using charging points for electric vehicles, as well as wind generation, in the VPP concept. It also presents power flow optimization while taking into consideration price, wind generation and electric vehicles. Paper [13] concerns VPP control power consumption for heating. The operation algorithm is based on the application of thermal mass to the building to defer power consumption from electric space heating.
There are many different aspects to VPP power flow control. The main goals correspond to economic aspects related to electrical energy trading. The VPP control algorithms predict energy storage charging at low energy prices, as well as discharging energy storage and the sale of energy at peak demand at high prices. Paper [14] presents a stochastic bi-level optimization model to maximize day-ahead profit and to minimize predicted real-time production and the consumption of imbalance charges. In Reference [15], the bidding strategy of a VPP is determined using mathematical models. Ref. [16] presents decentralized coordination of VPP units, considering both active and reactive power using the novel Lagrangian relaxation-based mechanism. The method takes into account the effect of flexible demand and prevents the creation of new demand peaks and troughs. Another aspect concerns optimizing the use of locally generated energy and using the right strategy for storing energy in energy storage [17,18]. Power flow in a VPP, due to technical aspects, can also be optimized. In Reference [19], the binary backtracking search algorithm (BBSA) is used to optimize power flow in a VPP in order to achieve a reduction of generation cost and power losses, as well as, to increase reliability. To achieve the same goal, risk-constrained stochastic programming is used in Reference [20] and the Imperialist competitive algorithm is used in Reference [21]. A big problem in the modern generation can also be seen to be carbon dioxide emissions. In Reference [22], binary particle swarm optimization (BPSO) is used to solve the indicated issues.
However, technical issues cannot be overlooked when planning the different strategies for a VPP. For example, voltage levels at all points in the distribution network should be within the range allowed by the standards. The same applies to the values of currents in the transformer lines and windings. Cooperation between units included in the VPP, meeting these expectations, is presented in Reference [23]. Moreover, issues regarding the operation of the storage itself are also important. Studies on the impact of energy storage parameters on VPP strategy and performance are presented in References [24,25]. The crucial technical aim of the VPP is concentrated on the aggregation control of the number of distributed generation units, which are grid-connected close to consumers (end-users, households). The aggregation verification may be a centralized or not system supported by a logic control algorithm, as well as, a communication infrastructure [26]. The control strategies must concern reliability, uncertainty, stability, demand response, power quality, active and reactive power management, protection and balancing and reliability in various load circumstances [27,28,29].
Additionally, when technical aspects are indicated it is worth noticing the management entities—virtual power players issues. Virtual power players’ aim is the generation and services remuneration or charging energy consumption. The diversity of players to expedite participation in the electricity markets is described in the literature [11,30,31]. Reference [32] proposes the methodology to DER management. The article includes resource scheduling, aggregation and remuneration. The aggregation process is realized by k-means algorithm. Clustering is realized for different approaches, that concerns tariffs definitions for the period of a week. Customer remuneration is realized in accordance to Portuguese time-of-use tariffs. The research corners twenty thousand consumers and five hundred distributed generation units. The paper [33] deal with the same issues. However, it is realized for 2592 operation scenarios. Those cases consider over 5 hundred DGs, over 20 thousand consumers and ten suppliers. The article [34] is another example of using clustering to prosumers aggregation. The article [35] presents the discussion of demand response in point economic pros and effectiveness. This article presents a sensitivity analysis of demand response prices for the virtual power player operation costs. Additionally, the analysis comparison of cost of distributed resources and demand-side response during facing supply unavailability. This calculation is performed in a real smart grid on buses with associated micro-production. This allows the creation of sub-groups of data according to their correlations. The clustering process is evaluated so that the number of data sub-groups that brings the most added value for the decision-making process is found, according to players’ characteristics. In addition to the technical aspects, selected issues concerning the roles of VPP partners are discussed in the accompanying paper [36]. Physical and financial streams between them are highlighted in point of the decision model which is concentrated on profits maximization. The results show that the number of distributed energy resources and the available storage capacity of battery energy storage has an impact on the economic efficiency of the VPP.
This article aims to study the technical aspects of integration of the above-mentioned units with an electrical power system (EPS) with regards to their prospective application in the VPP. The mentioned limitations are related to the regulation and protection procedures applied in the control of generation units and storage systems and also their possible influence on power system parameters. This article presents calculations and power flow of a real virtual power plant (VPP), containing a fragment of low and medium voltage distribution network. The model contains the hydropower plant (HPP), a photovoltaic system (PV), energy storage system (ESS). The problem is based on the identification of the limitations, which are dictated by the technical requirements of cooperation of power generation units and energy storage systems with the power system; the application of the simplified calculation, which is supported by precise simulation techniques so that the maximum power capacity of the planned energy storage system in the planed VPP can be indicated and the investigation of real measurements of a photovoltaic power plant in order to reveal the impact of power control strategy on the potential of the resources integrated with the VPP. The presented review of VPP definitions and aims, as well as a summary of VPP projects, are the motivation for this paper. Additionally, to obtain the economic issues and impact on electricity marked firstly the technical requirements must be assured. The contribution of this paper covers the current gap of knowledge related to the VPP project which exhibits in the real case limitations of utilization the DER and ESS. For example, this paper provides the real case example of calculation and simulation focused on the determination of maximum power capacity of the ESS planned In terms of VPP efficiency and sensitivity, it is important to identify the maximum level of ESS power capacity that can be connected in the planned node to be installed in the selected network node. Results of presented investigations formulate margin condition for the VPP resources. Another example of the contribution of the paper to the current knowledge gap is the attempt to determine the influence of the power regulation strategies applied in PV plants on the real power range available for the VPP control strategies. Using the real measurement investigations it was shown that reactive power consumption implemented in the PV inverters reduces the energy volume potentially available for VPP form the PV installations. Mentioned examples constitute the limitation for the VPP project and can be adapted to other VPP investments.
The aim of this paper is to identify possible limitations in the development of the VPP which might be related to the regulation, protection and integration of power generation units with power systems. The mentioned problem can be seen to be a crucial issue, especially on the preliminary stage of the VPP concept and when different approaches for the economic strategies for VPP are created. After the introduction section, which highlights the main motivations of this paper, Section 2 presents a literature review of the technical aspects of VPP. This includes recent investigations regarding network integration, as well as a review of a selected real case of VPP realization. The aim of Section 2 is to identify current problems and solutions related to VPP and to provide the range of functionality of current VPP projects. Section 3 highlights the problems regarding the investigations presented in this paper. It has to be emphasized that technical aspects of DER and ESS, associated with the VPP, can be considered on several levels. Thus, Section 3 consists of the identification of codes and technical standards that define the requirements and permissible limits of electrical power system parameters and power quality, protection schemes and active and reactive power control issues applied for distributed energy resources. An additional element described in Section 3 is the energy storage control and limitations coming from the charging and discharging characteristics of energy storage systems. The revealed aspects can be treated as boundary conditions for the identification of their impact on VPP planning and operation strategies. The main investigations are presented in Section 4, which starts with a description of the topology of a medium voltage network in the area of the investigated VPP. The investigations are based on a real VPP project and present results considering the investigation of the cooperation of a 1 MW hydropower plant with 0.5 MW battery energy storage connected to the same node of medium voltage distribution network and impact of their operating condition on power flow and voltage level in observed network belonging to the VPP, (b) identification of maximum power capacity of battery energy storage which can be connected to considered node of the VPP as well as identification of general grid capacity of the investigated fragment of the distribution network to connect possible DERs/ESSs, (c) the identification of the impact of power control strategy applied in a PV power plant on resources available for the VPP. The maximum power capacity of the ESS is understood as the rated power of the ESS determined by requirements for power quality parameters of the grid and requirements for the integration of the generation units with power systems. In presented investigations, the storage capacity of the considered ESS is fixed and is used as a margin condition for the simulations. The storage capacity determines the ESS operability usually reflected by available time for charging and discharging. The selection of storage capacity of the ESS is usually based on specific aim functions considering selected intentions of using the ESS like economic aspects or islanding mode. The maximum power capacity of the ESS is restricted by the standards and regulations addressed to cooperation with the grids. The presented analysis is based on simulations conducted in Matlab combined with real measurements. The initial condition for the calculation was based on the real measurements of load and generated power that represent a day of summer load peak demand. As a result of the investigation, the maximum power capacity of the considered ESS is identified with regards to the requirements for the permissible level of rapid voltage changes. Additionally, the impact of the power control strategy applied in a PV power plant on resources available for the VPP was also identified. In Section 5 a discussion about the influence of requirements for grid connection applicable to power generation units and its impact on limitation of the maximum power capacity of distributed energy resources and energy storage systems considered for planning operation of the VPP is provided in the broadest context. Section 6 presents the conclusions.
The identified limitations for the VPP, resulting from the technical aspects presented in this paper, are used as the input conditions for the economic investigations presented in the accompanying paper [36]. The paper presents the results of economic efficiency, including sensitivity analysis on price factors and DER production volumes, as well as the capacity of ESS.

2. Literature Review in the Context of the Technical Aspects of the VPP

2.1. Selected Investigations of the VPP: Load Demand Reduction, Voltage Control, Islanding, Microgrids, Power Quality

In recent years, in the literature related to the technical aspects of a VPP, several examples are worth noting.
  • Reference [37] introduces a regulation mechanism for a VPP. The calculation method of a virtual power plant’s frequency performance is presented. The model proposed in the article enables the VPP’s regulation performance score to be analyzed and the VPP’s regulation control strategies to be simulated. The obtained results show that the strategy can reduce a VPP’s variability caused by DGs.
  • Reference [38] presents the possibility of using μ-CHP generation units in households, which would lead to a situation where consuming households will also be able to produce electricity. This enables the local management of the grid. The application of information and communication technologies (ICT) enables the clustering of μ-CHPs in VPP. The research was conducted by the companies ECN and Gasunie. The results indicated that a cluster of 10 households with a μ-CHP may reduce the substation peak load by 30–50% without infringing user comfort.
  • Reference [39] indicates the need for efficient voltage control. The article presents the possibility of using small run-of-the-river hydropower plants, which are connected to a VPP to control the network voltage. The control is realized with the management of the reactive and active power of communicated hydro power plants belonging to a virtual power plant. The paper contains research on the efficiency of various voltage control measures. The small hydro power plant’s active and reactive power enables the voltage in the electrical network to be controlled with PV during times of high feed-in.
  • Reference [18] presents research on the optimal configuration model of an energy storage system (ESS) in a VPP with large-scale distributed wind power. The optimal objective function of the energy storage system is established with consideration of economy, load shifting and safety standards. The particle swarm optimization algorithm is used to solve the model. The model feasibility is verified on the IEEE 33 node system. The obtained results indicate that larger ESS configurations lead to a positive impact on load shifting.
  • Reference [40] contains simulations of a VPP. The analyzed VPP consists of a 200 MW wind power plant (WPP), a 100 MW photovoltaic power plant, PV and +/− 250 MW pumped storage. The indicated DG units are integrated into an islanded grid with a thermal power plant. The base islanded grid load is 1300 MW. The article describes the control strategies of the pumped storage power plant. The analyzed strategies are focused on the improvement of the power quality (PQ) level in case of significant solar power variations.
  • Reference [41] concerns the frequency control issues connected with an increasing amount of wind generation, which can be seen as an important part of a VPP. The authors indicate that the inertia of the system has an important function because it determines the influence on frequency variation during the changes in generation or power demand level. Thus, the doubly-fed induction generator wind turbines, which reduce the effective inertia of the system, may be used to control the frequency.
  • Reference [42] contains a technical-economic impact analysis of the massive integration of small generators and demands into a VPP. The results can be observed in system functioning and on the outcome of demands and generators within the VPP. The paper contains the analysis and comparison of several VPP strategies. Additionally, the article proposes optimization algorithms based on the modification of the big band and big crunch (BB–BC) optimization method. The algorithms under research aim to determine the optimal location and optimal load control strategy of renewable energy sources and also the optimal operation schedule of energy storage elements in order to minimalize the energy purchased from a substation. The important outcome of the research is that a high reduction of energy purchased from substation energy is possible using the control of the load demand in a VPP.
  • Reference [43] contains the description of a flexible energy optimizer for microgrids and VPPs. In the article, the unit commitment and economic dispatch problem is solved by an enhanced mixed integer linear programming (MILP) method. Additionally, different post-optimization modules were developed, which enabled the potential network constraint violations to be mitigated and power quality to be improved. One of the strategies is toward to enhance voltage and loading quality, reduce power losses and support selected ancillary service in worst voltage quality nodes and nodes with high power consumption.
  • Reference [44] presents the architecture for a VPP and the interaction of customer meters using a virtual power plant controller. The paper contains the description of human machine interface (HMI) development to access reactive power metering at the location of customers. Additionally, the article presents a recording tool for reading a VPP controller. The VPP controller is able to control the reactive power flows to the customers and it, therefore, carries out a proactive operation to reduce voltage instability.
  • Reference [45] contains the impact analysis of harmonic distortion on the energization of energy distribution transformers integrated into a VPP. One of the parts presents the analysis of an analytical procedure that predicts the inrush current and the parameters of a single-phase power transformer under a distorted voltage condition. The aim of the indicated analysis is that variations in inrush current resources correspond to the voltage harmonic distortion level expressed by the total harmonic distortion in the voltage. Although, it is important to notice that in large-scale home appliance use of electronic power equipment so the level of distortions may increase in the future.

2.2. Review of Selected Real Case VPP Realizations

Despite the many investigations concerning VPP concepts, strategies and control, it is worth noticing actual VPP projects, which show the scale of developments and results:
  • The Fenix project was developed to improve the contribution of distributed energy resources to the electric network by aggregating them into Large Scale Virtual Power Plants. The project is based on the cooperation of DG owners, energy companies, research institutes and universities—EDF, Areva, Siemens, ECRO SRL, Imperial College London, the University of Manchester and the University of Amsterdam, among others. The project consists of three phases [46]. The first phase involves the preparation of two scenarios—northern and southern—which are described in this subsection. The analysis presented in paper [46] included the DER contribution to the network, as well as its strengths and weaknesses. The second phase covered the design of the communication and control system between the DERs in a VPP. The last phase concerned the validation of previously prepared analysis and systems through the realization of building 2 installations—in the UK and Spain [47]. Close to Bilbao City in Spain, there is a FENIX Southern Demonstration VPP connected to the Iberdrola system. The indicated installation connect a lot of different DER, such as combined heat and power (CHP), wind turbines, hydropower, photovoltaics, a CHP-biomass system, with a combined total capacity of 0.168 GW. The distribution area, that the project is realized has the peak demand equal to 0.320 GW. It works as a casual VPP. It means, that information from every connected distributed energy source is analyzed in the main control system. The information is exchanged in an intelligent interface called “FENIX Boxes.” This system connects every DG. The indicated intelligent electronic devices assures adequate steering and implementation for the communication protocols. The protocols use wireless communication approaches for the distributed energy sources and control systems. It is based on the Virtual Private Network. The Virtual Private Network unites the heat and power plants, wind and solar sources and heat pumps, which assures creation of the interconnected, flexible system that has centralized control.
  • The project Smart Power Hamburg aims to design a VPP. It is towered to aggregate the variable load and CHP units in Hamburg in Germany. The created Virtual Utility applies the present urban infrastructure. The infrastructure consists of CHP units, heat storage systems and a building with demand-side management. It presents a new direction to the generation of electricity, as well as, covering heat demand in the urban area. The connection of cogeneration and heat storage systems enables the unit to be operated according to electrical demand instead of heating demand, thus increasing the unit’s flexibility. The project shows the possibility of integrating the bunkers storage possibility, swimming pools or heating networks, which are steered by the indicated virtual power plant [48].
  • The Danish EDISON virtual power plant case was started in 2009. It is related to analyzing the Bornholm Island that provides supportive services to real energy market players for example, generation companies to obtain the effective application of distributed energy resources [49].
  • A battery storage virtual power plant placed in the Australia. The South Australia conducted the biggest case study project. The indicated virtual power plant consists of a lot of the small-scale batteries and photovoltaics. The total capacity of indicated units is five MW (seven MWh). The indicated systems are connected to the central monitoring and management element in the VPP. The important element of the project is to simplify local network constraints, stabilize prices of electric energy and support renewable energy sources. The South Australia has great potential for exploitation of renewable energy—more than forty percent of the generated power proceeds from the wind farms or rooftop photovoltaic systems [50].

3. Problem Statement

The cited examples show significant progress in the development of VPPs. However, this article aims to highlight technical aspects at the preliminary stage of the concept and operation planning of a VPP. The size of the ESS, the capacity of available power generation, as well as control restrictions on the use of the DER and ESS have to be identified. The cited examples are also of interest due to permanent amendments of standards and network codes. This is why the problem has its beginnings in the technical requirements of the cooperation of power generation units and energy storage systems with a power system. The aim of this section is firstly to generally review the technical requirements dedicated to controlling the DER and ESS in terms of their cooperation with the power system and then to select and discuss in detail several topics which can appear on the primary level of VPP planning. Among the wide list of technical aspects, this paper presents three of them. They were selected due to the association of the VPP project with the distribution network and small generation units. Thus, the technical aspects presented in this section serve as the base for further investigation of the following problems:
  • cooperation of the DER and ESS and their impact on the power flow and voltage level in the observed network belonging to the VPP,
  • identification of maximum power capacity of ESS which can be connected to the considered node of the VPP and identification of grid capacity to connect possible DERs and ESSs
  • investigation of the impact of the power control strategy applied in DERs on resources available for the VPP.

3.1. Review of Control of DER, Protection Systems, Requirements for the Connection to the Grid and Parallel Operation with EPS

Distributed energy resources, as well as energy storage systems, should fulfill the requirements in relation to relevant power system parameters including:
  • the frequency and voltage levels, which are usually associated with the requirements for reactive power regulation, as well as frequency control issues,
  • the short-circuit current contribution,
  • the fault-ride-through capability, which exhibits itself in the requirements for protection devices and settings.
The issues of the impact of distributed energy resources on power system parameters were described by Conseil International des Grands Réseaux Électriques (CIGRE) in Reference [51] and Verband der Elektrotechnik Elektronik Informationstechnik (VDE) in Reference [52]. The European Commission established the requirements for connecting power sources to the grid in Reference [53]. The Agency for the Cooperation of Energy Regulators (ACER), in Reference [54], made it mandatory for transmission system operator (TSO) and distribution system operator (DSO) to include the mentioned requirements in network codes (NC). The network codes set out the necessary minimum standards and requirements that need to be followed when connecting the DER. A prominent example of the network code is the European Network of Transmission System Operators for Electricity (ENTSO-E) network code [55]. In the case of distributed generation with a connection point below 110 kV, the ranges of permissible limits of power system parameters are defined separately for four types of power generating modules, depending on the maximum power capacity. For the Central Europe networks, the different types of maximum capacity threshold from which a power generating module is a categorized are:
  • “type A”: 0.8 kW–1 MW,
  • “type B”: 1 MW–50 MW,
  • “type C”: 50 MW–75 MW,
  • “type D”: higher than 75 MW.
For the particular types of power generating modules at the point of connection to the grid, the following are defined:
  • a permissible range of frequency,
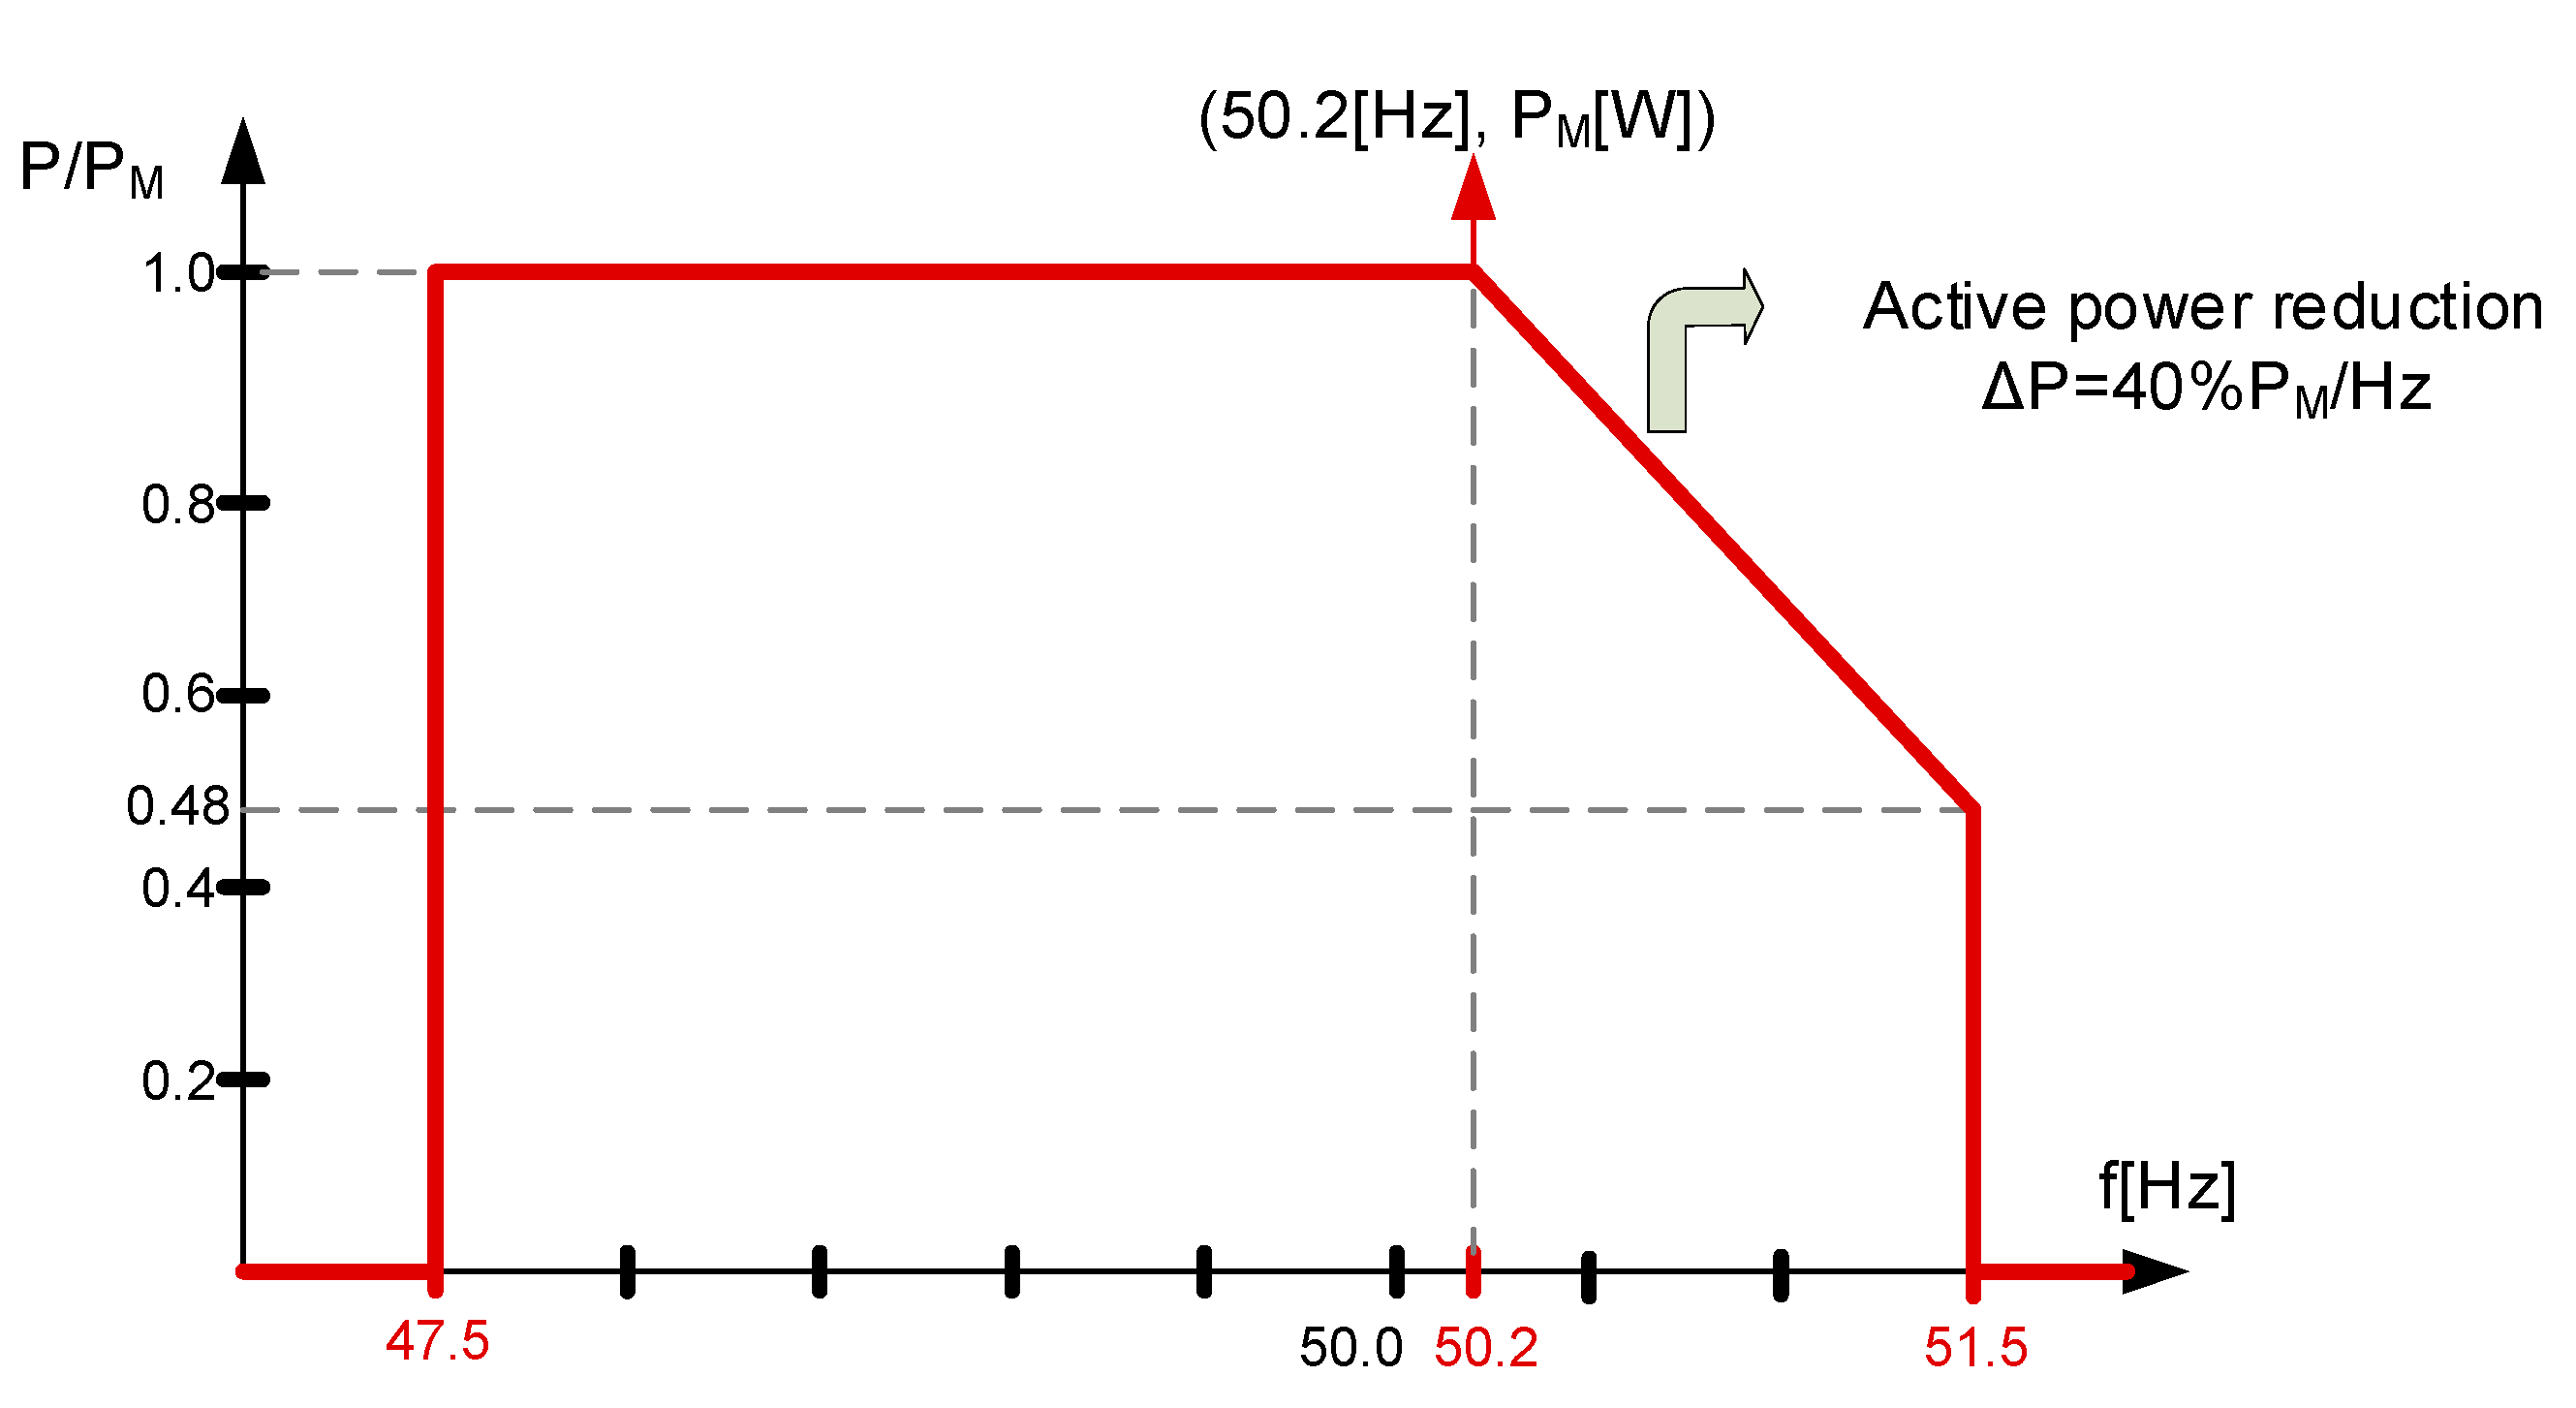
  • the active power frequency response capability that regards a limited frequency sensitive mode (overfrequency), as well as the maximum power capability reduction with a falling frequency concerning the limited frequency sensitive mode (underfrequency—selected parameters consider active power range, frequency response insensitivity, frequency response deadband, droop),
  • pre-fault, post-fault circumstances for the fault-ride-through capability (voltage and time parameters),
  • voltage and reactive power profiles in relation to the level of the actual value of the ratio of reactive and active power for consumption and generation scenarios (the characteristic coordinates of the (U–Q)/Pmax profile consists of the maximum range of Q/Pmax, which demonstrates the maximum range of cosϕ or tgϕ regulation, as well as the maximum range of the steady-state voltage level).
The mentioned types of power generating modules are subject to predefined compliance simulations. Additionally, the network operators define the scheme and settings that are necessary to protect the network, taking into account the profiles of the generation units. The network code [55] mentions the following aspects of protection schemes: ” [55]
  • external and internal short circuit,
  • asymmetric load (negative phase sequence),
  • stator and rotor overload,
  • over/under excitation,
  • over/under voltage at the connection point,
  • over/under voltage at the alternator terminals,
  • inter-area oscillations,
  • inrush current,
  • asynchronous operation (pole slip),
  • protection against inadmissible shaft torsions (for example, subsynchronous resonance),
  • power generating module line protection,
  • unit transformer protection,
  • backup schemes against protection and switchgear malfunction,
  • overfluxing (U/f),
  • inverse power,
  • rate of change of frequency,
  • neutral voltage displacement.”
All the mentioned aspects have been listed in order to highlight the technical aspects which should be taken into consideration when VPP concepts are created. The presented paper considers a case study of a VPP concept which uses resources that are localized in the distribution network. Some general studies about standards related to small generators are presented in Reference [56]. In order to highlight the details of the control strategy applied for small generators in the following subsections, selected issues are described in detail, including active power reduction strategies and voltage profile requirements. The described elements are used in the further investigations, which concentrate on the identification of the maximum capacity of the network for the energy storage connection and assessment of the losses of active power capacity in a photovoltaic power plant regarding reactive power control strategy.

3.2. Active Power Control Strategy Applied in DERs

When highlighting the active power control strategy implemented in small generators, it is worth pointing out existing standards, such as VDE-AR-N-4105 [52]. When referring to this standard, the active power frequency response characteristic P(f) and standard characteristic of the Q/Pmax (known also as cosφ(P) or tgϕ(P)) for the generation unit directly connected to a low voltage (LV) network can be revealed. These characteristics are presented in Figure 1 and Figure 2, respectively. The power frequency response characteristic assumes that for power system frequency between 50.2 Hz and 51.5 Hz. When the exceedance of frequency is detected, it is recommended to reduce active power generation from PM with a gradient of 40% PM per Hertz. At system frequencies higher than 51.5 Hz and lower than 47.5 Hz, the power generation unit will be disconnected immediately.
When discussing relations between active power and reactive power, the characteristic of the Q/Pmax (known also as cosφ(P) or tgϕ(P)) for the generation unit can be introduced. This characteristic is presented in Figure 2. It can be concluded that up to 20% of the maximum power capacity Pmax, both generation and consumption of reactive power is recommended. In the range of (0.2–0.5) Pmax, the active power generation is accepted. When exceeding half of Pmax, both generations of the active power and reactive power consumption are recommended. It may be used as a model with the capacitive power factor cosφcap. The reactive power level consumption relays on a range of Pmax. The application of reactive power consumption aims to reduce the increase in voltage that is because of the noticeable active power generation. levels.

3.3. Power Quality Voltage Profile

A common area that can be related to the mentioned control and regulation strategies and protection schemes, is the power quality. The most crucial power quality parameters are frequency variations, voltage variation, voltage fluctuation, voltage unbalance (asymmetry), voltage harmonics, interhamonics, subharmonics, direct current injection (DC) and rapid voltage changes [58,59]. A general standard related to public electrical networks is EN 50160 [60]. In conjunction with quoted standards related to the DER, it is possible to define permissible limits of voltage changes in the connection points of the DER, as well as in other nodes of the network.
One of the critical requirements states that rapid voltage changes caused by switching operation with maximum power capacity cannot be more than 3% of the nominal voltage.
d c = | Δ U c | U a 100 3 % ,
where:
  • ΔUc—steady state voltage change
  • Ua—nominal voltage
  • dc—relative steady state voltage change as a parameter of rapid voltage change
Additionally, a slow voltage changes (voltage level) in every node of distribution network consisting of DERs cannot exceed 10% of nominal voltage considering every DERs working simultaneously with maximum power capacity for 10-min aggregating time recommended by standard EN50160 [60]. Recently, in the last update of the mentioned standard [60], measurements with an aggregation time of 1-min instead of 10-min were suggested. Some investigations of the influence to aggregation interval on the assessment of photovoltaic power plant belonging to discussed VPP topology has been discussed in Reference [61].

3.4. Protection Schemes

In addition to the control and regulation characteristics, the aspects of protection schemes should also be considered. Table 1 consists of the over/under voltage and over/under frequency protection schemes at the connection point of DERs that are connected to an LV electrical network. The schemes are required by the DSO in selected European countries on the basis of References [52,56].

3.5. Control of EES, Charging and Discharging Characteristics

Among energy storage devices, chemical batteries are increasingly used in professional power engineering [62]. The desirable features of batteries are their high energy density, high charge and discharge power and long life cycle. Other aspects are also relevant, such as the methods of determining the state of charge (SoC) and the possibilities of recycling [63]. For this reason, lithium-ion batteries are the most commonly used in battery energy storage (BES). The advantages of this type of battery include the fact that they have an energy density of 160 Wh/kg, a power density of up to 350 W/kg and a lifetime greater than 1000 charging and discharging cycles. The disadvantages of a lithium-ion battery include its high cost and the need for a heating and cooling system.
The main issue connected with controlling energy flow to and from an energy storage device is the correct determination of its operating characteristics [64]. Characteristics are defined by the manufacturer and they depend on the storage design. Furthermore, the system operator can control the storage operation using them. The rate of charging or discharging energy storage (also called C-rate) when using lithium-ion batteries can be determined as the value of the current at which the energy storage is discharged [65]. It is often expressed as the ratio of the battery capacity to the time of discharge. For example, a discharge rate of 1C means that storage will be completely discharged in 1 h. On the other hand, a discharge rate of 0.5C means that the same storage will be completely discharged in 2 h. [66] The storage charging or discharging rate is also determined by the remaining energy. The relative value of the remaining energy in relation to the rated capacity is called the state of charge (SoC) [67]. The characteristics of the dependence of the storage charging and discharging power on the SoC level should be provided by the manufacturer. The operator can change the shape of the characteristics within certain limits, for example, by preferring quick or slow charging or discharging in a specific SoC range [68]. In some cases, such shaping of characteristics can optimize storage efficiency and increase its lifetime and safety.
An important aspect of modeling energy storage operation is its lifetime and the decrease in capacity when using the battery. Reference [69] describes the impact of the ambient temperature and depth of discharge on the wear and tear and degradation cost of storage.
To ensure that each cell operates correctly within a certain voltage, temperature and current range during charging and discharging, the battery requires a built-in controller that communicates with the battery management system (BMS). The power value regulated by the BMS takes into account both the technical limitations of the technology and the safety conditions of the storage. The BMS is designed to maintain the efficient operation of the storage. The control is based on the current state of battery operation, that is, state of charge (SoC), temperature, counted discharge cycles and so forth.
The storage charging and discharging rate are especially affected by:
  • Design—when designing batteries, manufacturers need to choose the size, weight, cost, lifetime and performance of the storage. Depending on needs, storage power and capacity can be lower due to cost and weight.
  • State of Charge (SoC)—when the battery is almost fully charged, the charging speed decreases. The reason is that BMS prevents the cells from overheating. At 80–90% SoC, the charging speed usually drops significantly and slows down to almost zero at 100% SoC. Charging speed is most effective between 0% and 80% SoC.
  • Temperature—lithium-ion battery cells work most effectively in the 20–30 degree Celsius range. When the battery temperature is too low or too high, the BMS reduces the current in order to protect the battery cells. If the storage is equipped with a heating and cooling system, the BMS controls the temperature of the storage cells by thermal management of the battery. The temperature of the battery depends on the ambient temperature and on the value of the charging or discharging power.
For the selected type of storage system, the dependence of charging and discharging power on the degree of SoC (modified Ragone plot) can be determined. The speed of charging (discharging) is determined by the power and is expressed in Watts or as a relative value in relation to the nominal power of the container. However, the SoC can also be defined as energy in Watt-hours or as a relative value in relation to the nominal capacity of the storage tank. Exemplary charging (discharging) of typical storage based on lithium-ion batteries is shown in Figure 3. An appropriate sign of the battery power was assumed for charging (positive-red) and discharging (negative-blue). The presented characteristics are typical for the lithium-ion batteries. Characteristics express the limitations of available power depending on the current SoC level. In discussed VPP, the storage unit has a power of 500 kW and is composed of lithium-ion batteries. It requires individual investigations to reveal the “real” charging/discharging characteristic, which may differ from that presented in Figure 3.

4. Investigation of the Impact of the DER and ESS on VPP Planning and Operating Conditions—A Case Study

Discussed technical aspects related to the impact of DERs on the operating condition of the network or power control strategy applied in DERs are primarily addressed to the integration of DER with the power systems. However, the revealed aspects can be treated as boundary conditions in terms of VPP planning and operation strategies. This section aims to present methods that can be used to solve three formulated in the problem statement topics. These issues are investigated based on a real VPP project. The obtained results are associated with the investigated localization of the VPP however can be treated as an example of a method for the assessment of formulated topics. These topics are as follows:
  • Investigation of the cooperation of a 1 MW hydro power plant with 0.5 MW battery energy storage that is connected to the same node of medium voltage distribution network and also the impact of their operating conditions on the power flow and voltage level for analyzed network belonging to the VPP,
  • identification of maximal power capacity of battery energy storage which may be connected to considered node of analyzed VPP as well as identification of general grid capacity of the investigated fragment of the distribution network to connect possible DERs/ESSs,
  • identification of the impact of power control strategy applied in a PV power plant on other DER available for the VPP.

4.1. Description of the Case Study—Topology of the Planned VPP

The planned virtual power plant is based on the fragment of the distribution network in Poland. The topology of the VPP on the distribution network scheme is presented in Figure 4. The VPP area consists of two parts of distribution networks supplied from two HV/MV main stations—110/20 kV R-J and R-Z. The supplied stations are connected to the 110 kV electrical power system (EPS). The 20 kV network, fed from R-J station, is an overhead-cable network. The 20 kV network, fed from R-Z station, is mainly an urban cable network. Both networks work with earth fault current compensation.
Inside the mentioned distribution networks, there are several distributed energy sources and energy storage systems. Planned VPP consists of hydro power plant, photovoltaic power plant, biogas generation units and combined heat and power unit based on combined installation using boiler and steam turbine integrated with generator and heating system in the industry. An integral element of planed VPP is the prosumers mainly using photovoltaic systems. Detailed information about the DERs identified in the area of the VPP is presented in Table 2. The detailed information about ESSs localized in the VPP area is presented in Table 3. In the first part of the distribution network supplied from the station R-J, a crucial element of the planned VPP is the hydro power plant denoted as HPP-L with generating power about 0.94 MW and battery energy storage system ESS-L connected to the same node of MV network as hydro power plant with installed power 0.5 MW. In the second part of the distribution network supplied from the station R-Z, a photovoltaic power plant PV-C with generating power of 0.1 MW and an associated energy storage system can be noted.

4.2. Identification of the Impact of the Active Power Changes Generated by the DER and ESS on the Load Reduction in the Distribution Line, as well as the Voltage Changes in the Nodes of the Grid Covered by the VPP

In order to illustrate the technical aspects related to the integration of DER and ESS with electric power systems and also their impact on resources available to the VPP control, the issue of identifying the maximum power capacity of ESS is presented with regards to network requirements concerning voltage level and rapid voltage changes. The network requirements were described in Section 2. This paper aims to reveal the maximum capacity of the ESS that is planned to be attached to the same node as analyzed HPP. The investigated approach does not consider the valuable aspects of the interaction of ESSs with different RES at respective locations or analyze the advantages and disadvantages of using one ESS vs multiple small ESSs. However, these mentioned issues have been investigated in point of the economic aspects and are presented in associated paper [36]. The presented investigations are performed using Matlab modeling integrated with a database of real measurements of power flows. Referring to the VPP topology presented in Figure 4, the appropriate model was created and simulations were carried out in order to identify:
  • the impact of switching on and off the active power generation of hydro power plant HPP-L on the power flows and on the voltage level in indicated distribution network considered in the VPP topology,
  • the impact of a gradual increase of active power fed into the network jointly by hydro power plant HPP-L and energy storage system ESS-L, which is done to determine the maximum power capacity of ESS-L which is permissible from the point of view of rapid voltage changes parameter. The rapid voltage changes parameter is caused by the sudden shutdown of these energy sources.
Firstly, in order to associate the model with the real operating conditions of the distribution network associated with the VPP a steady state initial condition of power flows was prepared. Power flows were prepared based on the available set of annual real measurements of load demands and power generated by DER. Loads consist of the two main HV/MV transformers and all busbars of the power stations R-J and R-Z. One day of measurements, representing summer maximum peak demand, was selected. The day was selected based on the analysis of the database of the Polish power system load, which is shared by the Polish Transmission System Operator [70]. The presented investigations concern the day 14.07.2017 at 1 PM. A simplified scheme of the electrical connection of the VPP, with denoted instantaneous power flow measurements at the time of the identified summer peak demand value, is presented in Figure 5.
Secondly, a Matlab Simulink model of the VPP topology, consisting of the described 20 kV networks, hydro power plant, battery energy storage and photovoltaic power plant was created and validated. The model is the dynamic model and captures several aspects related to dynamic representations of DERs and BES. In the case of HPP simulation, a standard electro-hydraulic speed controller model was used. The mechanical time constant and the time of waterfall was calculated based on the real parameters and equals 2 s and 3 s, respectively. The static excitation system was chosen according to the IEEE type ST1A excitation system mode in Matlab. The dynamics of the system are determined by the parameters of the voltage regulator and equalizer. Both elements are represented by an inertial element with the following parameters:
  • regulator: G r ( s ) = K a 1 + T a s , with assumed parameters: G r ( s ) = 210 1 + 0.100 s
  • equalizer: G f ( s ) = K f s 1 + T f s , with assumed parameters: G f ( s ) = 0.001 s 1 + s .
In the case of the battery energy storage system, a functional modeling assumption was made that BES works like a controllable source of active and reactive power. The phenomena and processes occurring in the cells as well as in the control and commutation system of the inverter are not taken into consideration in the applied model. Applied limits are connected to restrictions on the discharge and charge current, the battery charge level and the power change speed. An ideal P,Q inverter regulation system, controlled by voltage magnitude and phase, was applied. Simulation of the BES operation in the grid was realized in accordance to the selected scenario, for example, determining the time intervals for energy return and battery charging. In addition, it is necessary to determine the power of exchange with the grid (discharge and charge current) and to also control the battery charge level. For this purpose, the P,Q inverter model was supplemented with a battery charge control system. The condition for the simulations assumed the use of the BES that was planned in the VPP project, with nominal parameters of 0.5 MW of maximal power Pmax and a 0.5 MWh of maximum capacity. Additionally, a limitation for the speed of power change in the simulations was implemented to ± 10%Pmax/s. The numerical values given in the figures refer to BES with a 0.5 MW power and a 0.5 MWh useful capacity. The PV power plant is also modeled using the P,Q inverter model. However, in the performed simulations of short time intervals, fixed values of active and reactive power were used on the basis of real measurements collected for the investigated PV-C. In the applied model of PV-C, the issue of generation changes due to radiation and temperature changes are neglected. Initial condition for the simulation was supported by the real measurement data which represents selected summer peak demand.
Simulation time of 24 min (1440 s) was selected, which allowed all the assumed events in the simulation scenario, while at the same time maintaining the real dynamics of energy sources and storage systems during switching operations, to be performed. Time of the simulation results from the time interval of control and regulations systems. In the simulation model the issue of water turbine response, mechanical constant, limitation of the speed of power changes in the control of BES have been implemented. The particular time interval associated with the planned switching operations, carried out in the generation units and energy storage system, are defined in the scenario of the simulated events. The simulations use the algorithm for solving differential Equations known as ode24tb, which works with a variable integration step. The maximum integration step was 10−4 s, while the actual step was selected automatically. The accuracy of the timestamp is not worse than 10−4 s.
With regards to the scheme of the electrical power network in the area of the planned VPP (Figure 4), the presented simulations are focused on the active power changes and voltage changes of particular VPP elements, including:
  • the hydropower plant HPP-L, which is connected in the distribution network that is supplied from the main station R-J,
  • the battery energy storage, which is connected to the same node as the hydro power plant ESS-L,
  • the main transformer T1 in the main power station R-J,
  • the distribution line L-62 associated with main statin R-J and hydropower plant HPP-L with battery storage system ESS-L. ESS-L serves for supplying the energy consumers and for power transmission from the HPP-L and ESS-L to the main station R-J,
  • the photovoltaic power plant PV-C.
The scenario of events consists of several switching operations carried out in the generation units and energy storage system:
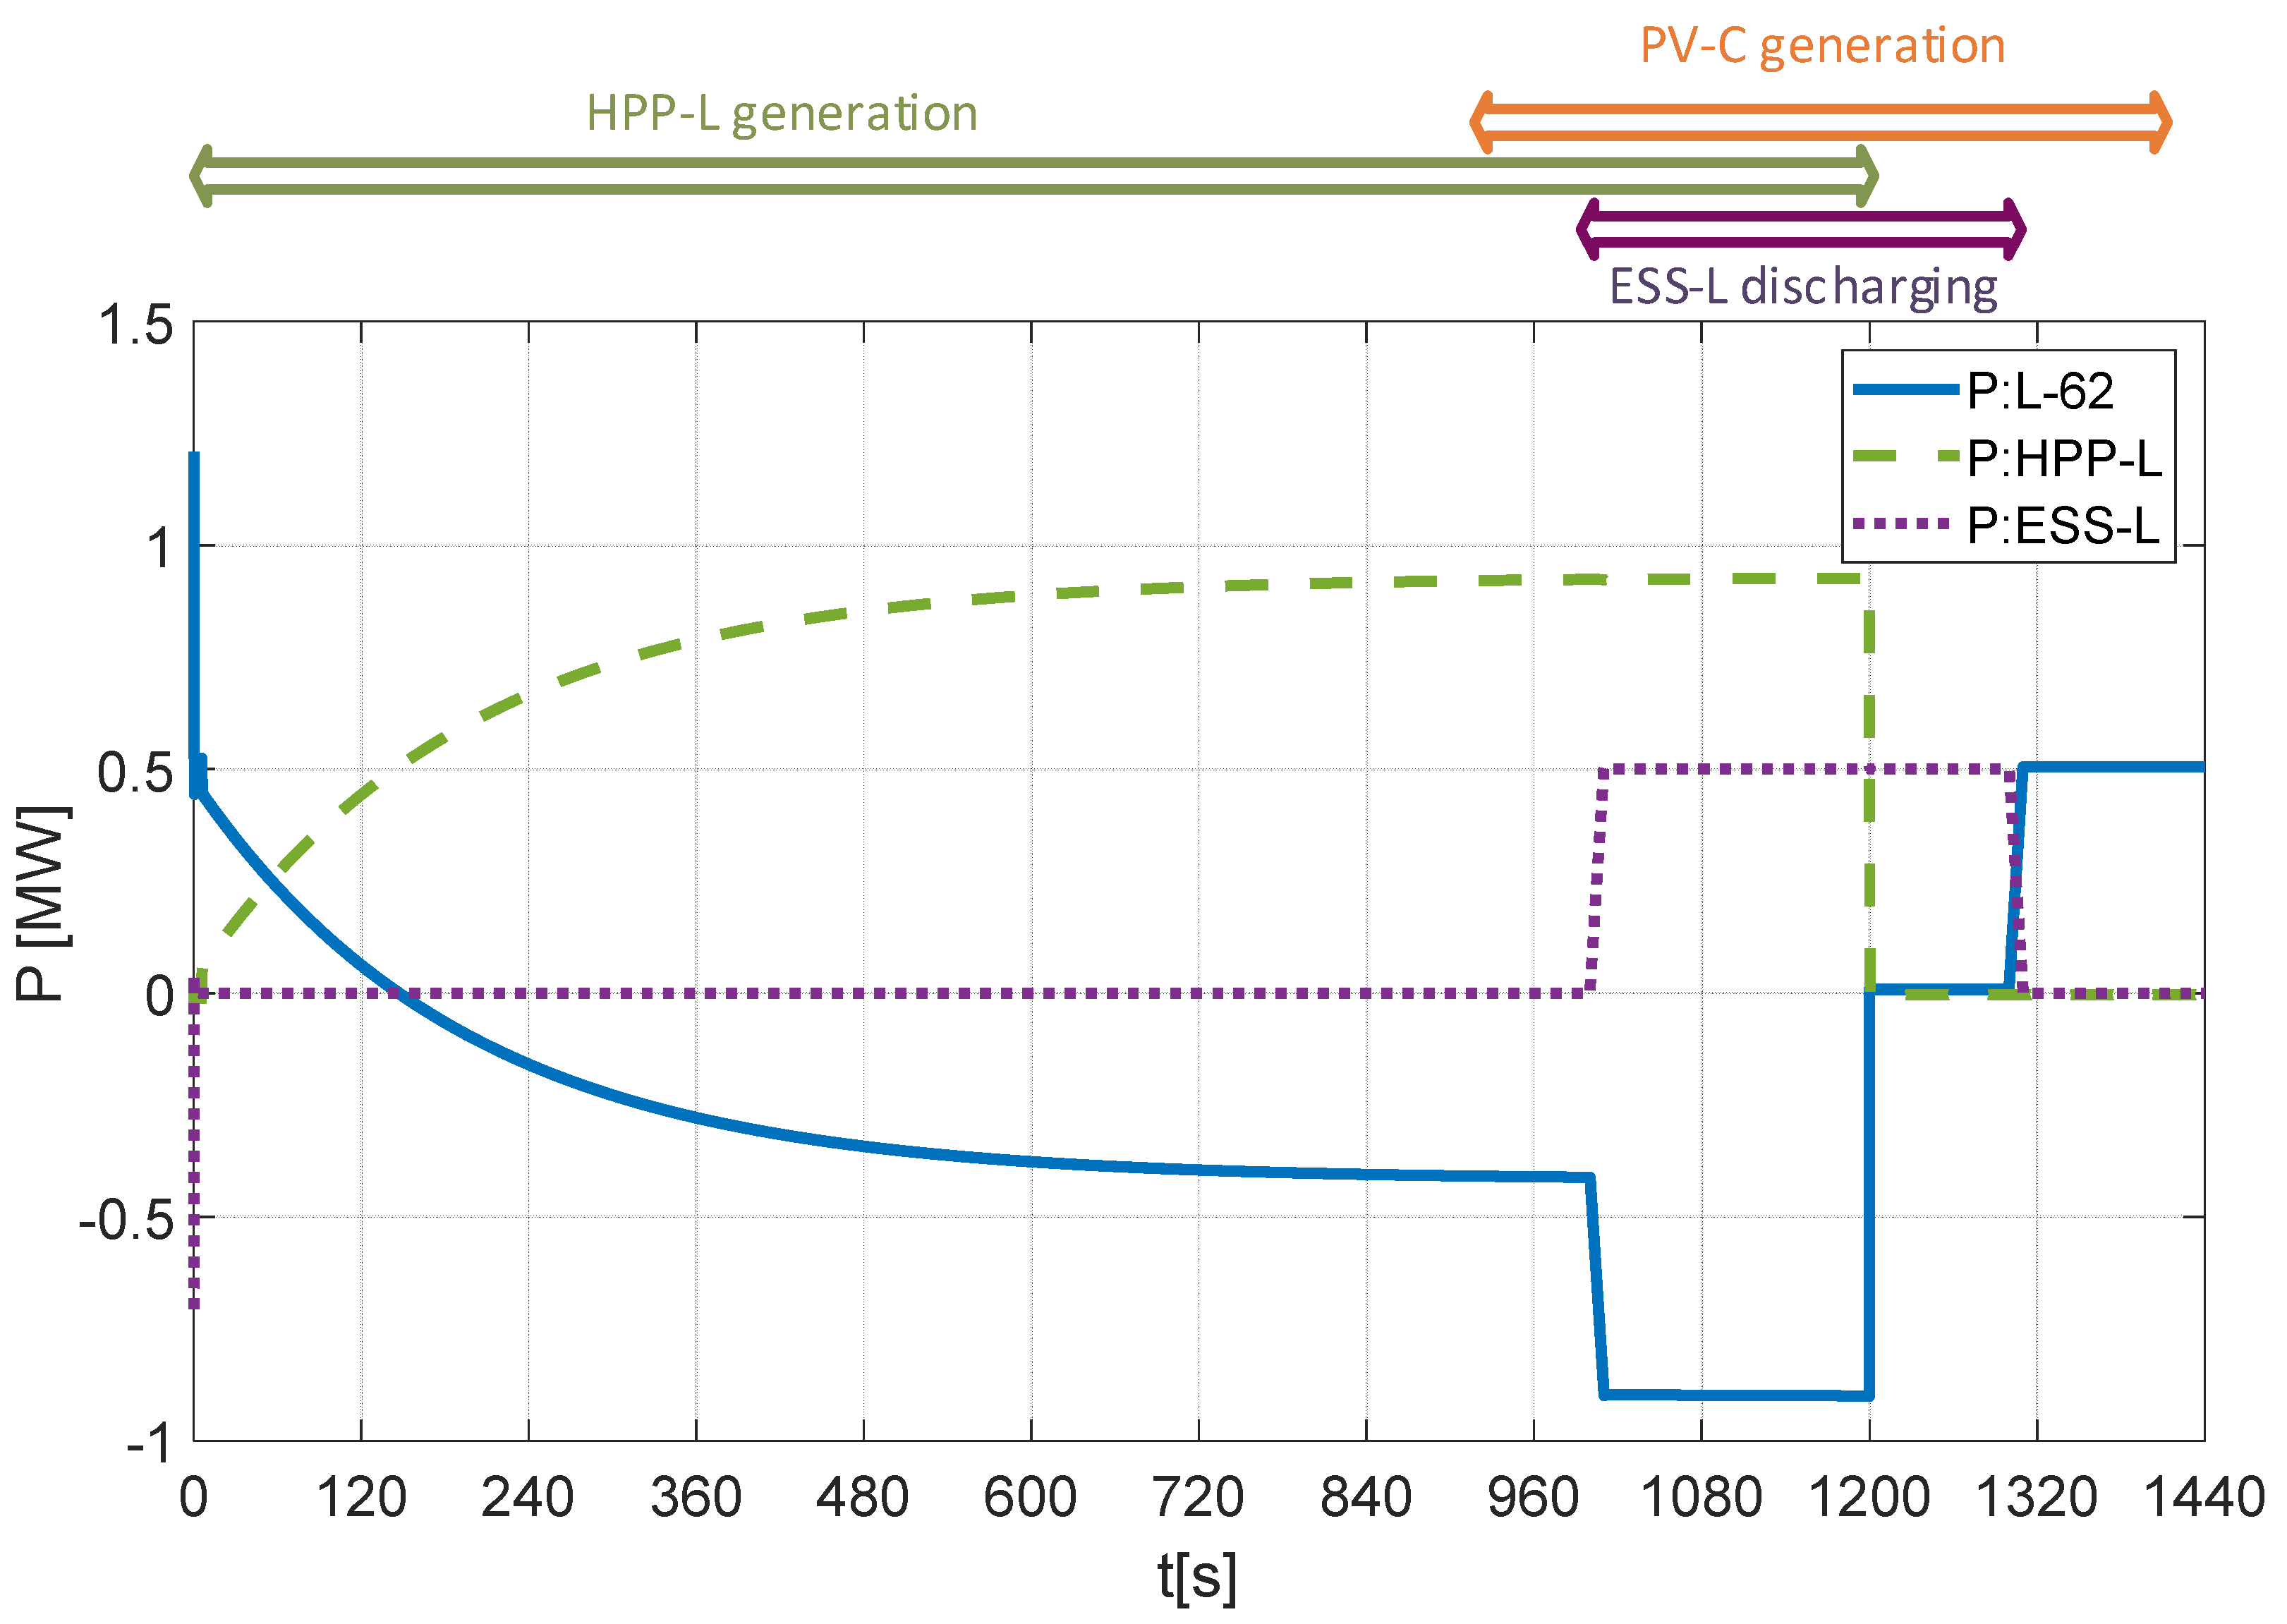
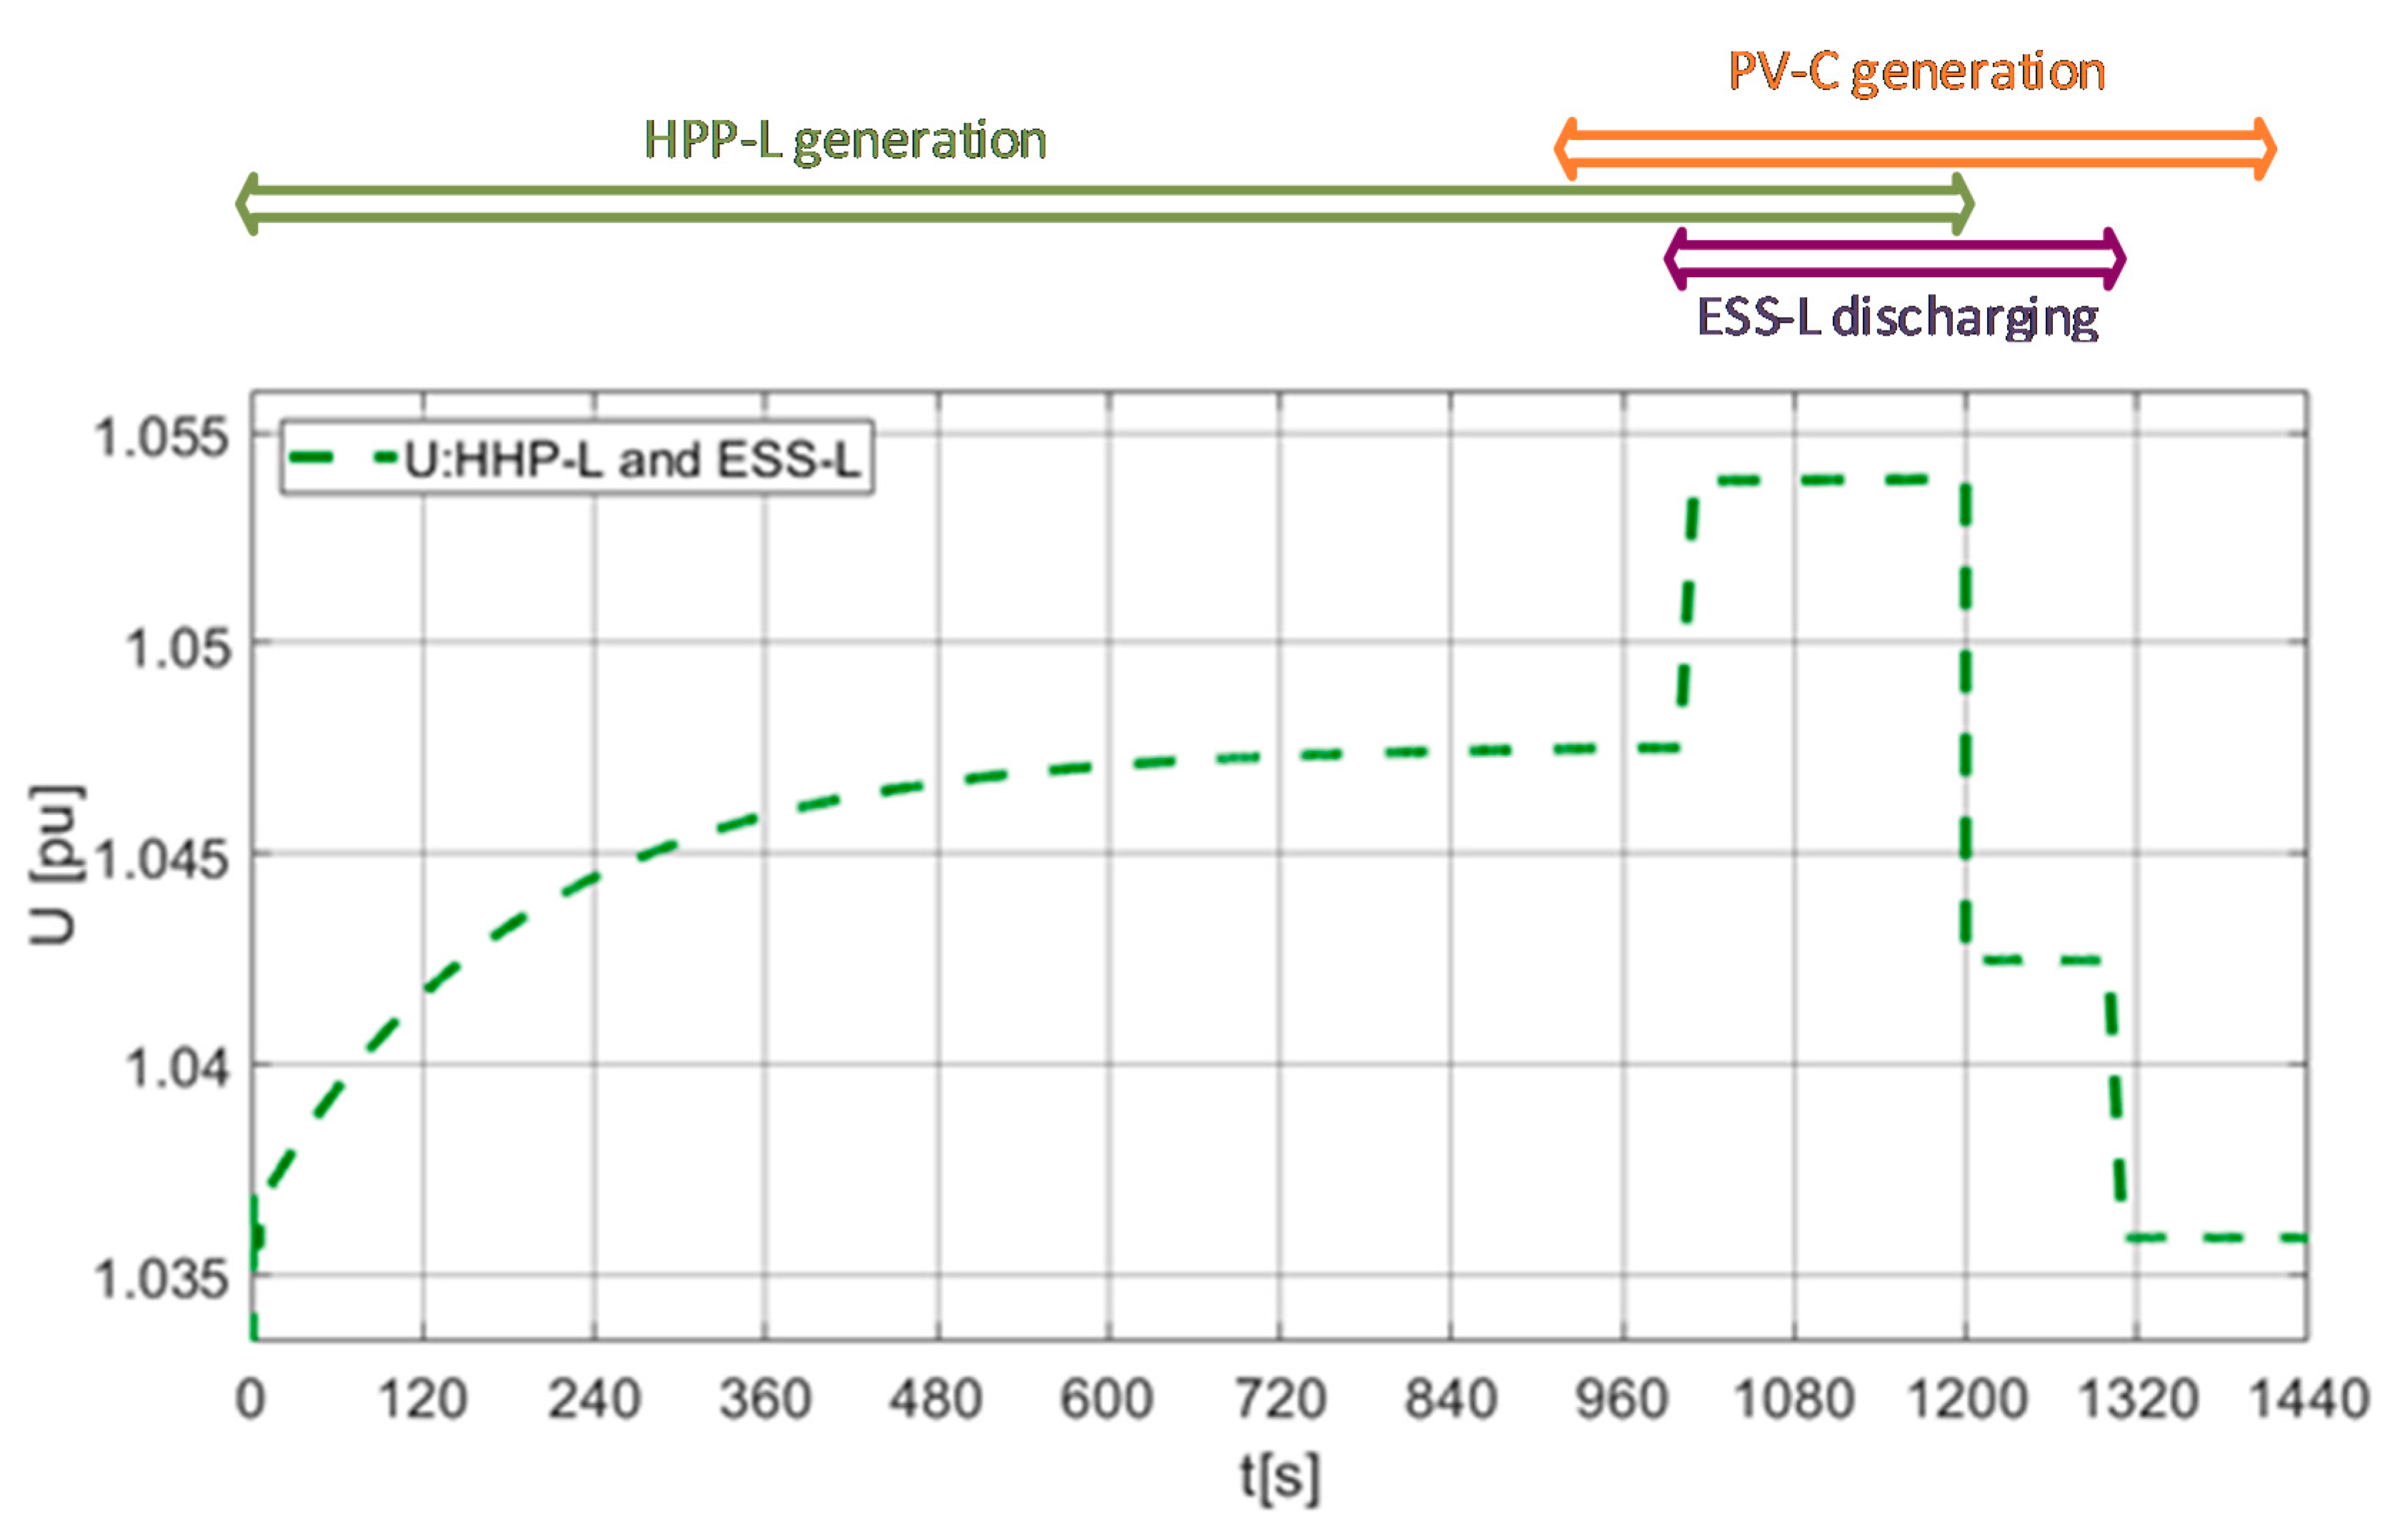
  • 5th s—switching on the hydro power plant HPP-L with presets: active power generation PG = 940 kW and reactive power QG = 0.0 kVAr,
  • 5th–900th s (15 min)—time interval for the HPP-L to reach the setpoints of the HPP-L control and regulation systems HPP-L,
  • 900th s (15th min)—switching on the photovoltaic power plant PV-C with parameters: active power generation PG = 100 kW and reactive QG = 0.0 kVAr,
  • 1000th s (approx. 17th min)—switching on the full load battery energy storage ESS-L in the discharge mode with presets: active power generation PG = 500 kW and reactive power QG = 0.0 kVAr,
  • 1200th s (20th min)—switching off the hydropower plant HPP-L,
  • 1300th s (approx. 22nd min)—switching off the battery energy storage ESS-L,
  • 1400th s (approx. 23rd min)—switching off the photovoltaic power plant PV-C,
  • 1440th second (24th min)—end of the simulation.
Active power changes in the distribution line L-62, associated with main statin R-J and hydropower plant HPP-L with battery storage system ESS-L during series of switching operations of HPP-L, PV-C and ESS-L are presented in Figure 6. It can be seen that the gradual increase of active power generated by the hydro power plant HPP-L from zero to the assumed setup of 940 kW generating power decreases the load demand in line L-62 which connects HPP-L with the main station R-J. The achieving by HPP-L a preset of 940 kW takes 1000 s but it can be concluded that the power flow of the observed line L-62 changes the direction from load demand to generation after approximately 150 s when the generation of the HPP-L obtains a level of 500 kW. Switching on the battery energy storage ESS-L additionally increases the level of transmitted generation power by the observed line. Naturally, the observed process has a positive impact on decreasing the load demand of the transformer in the main station R-J. Figure 7 presents active power changes in the high voltage/medium voltage (HV/MV) transformer in the main station R-J during the switching operation series of HPP-L, PV-C and ESS-L.
With regards to the network requirements for the voltage changes caused by the integration of the DERs with the electrical power systems presented in Section 2, the assessment of the influence of the simulated series of the switching operations of HPP-L, PV-C and ESS-L on the voltage changes in the connection point of the DER, as well as on the secondary side of the HV/MV transformer, is presented. When observing Figure 8 and Figure 9, it may be indicated that inserting the active power from HPP-L into the associated line L-62 causes a slow voltage increase at the 20 kV busbar of the hydro power plant on the level of 1%. At the same time, the voltage on the 20 kV busbars at the main station R-J changes by less than 0.1%. When the ESS-L generates about 500 kW, there is an increase in voltage at 20 kV busbar of the connection point of HPP-L and ESS-L approximately on the level of 0.6% and a slight change in voltage. A sudden switching off of the HPP-L and ESS-L causes a rapid voltage change at the connection point of these energy sources on the level of 1.6% and simultaneously a rapid voltage change of less than 0.1% at the 20 kV busbar of the main station R-J.
When observing voltage changes at the secondary side of the HV/MV transformer in the main station R-Z presented in Figure 10, it may be concluded that the generation of active power in analyzed network connected to the main station R-J is slightly noticeable at the busbar of station R-Z which is associated with station R-J by high voltage line. Additionally, switching on the photovoltaic installation PV-C with 100 kW of active power causes a slight change in voltage at the 20 kV busbar of the main station R-Z that is not noticeable in the station R-J. However, it should be emphasized that the observed changes are small and at the level of one-hundredth of a percent of the 20 kV nominal value. Noticed voltage changes can be compared with the quoted requirement of voltage changes on the level of three percentage and permissible value of voltage level not more than 10% of nominal value [60].
The simulations aimed to identify the direct impact of the active power changes generated by the HPP and BES on the load reduction in the distribution line, as well as on the voltage changes in the node of the connection and the substation. Therefore, standard methods of voltage regulations, including the on-load-tap-changer, were not used in the simulations. In reality, the tap-changer control is implemented in the main substations 110/20 kV, denoted as R-J and R-Z. However, the classical regulation strategy for the HV/MV transformer often uses a step of regulation on the level of 1.09–1.10%. In presented simulations indicated changes of voltage level in the main substations caused by BES or PV-C were less than the classical step of on-load-tap-changer regulation.

4.3. Identification of the Maximum Power Capacity of the ESS in the Considered Node of the VPP Regarding the Power Quality Voltage Profile

In terms of VPP efficiency and sensitivity, it is important to identify the maximum level of ESS power capacity that can be connected to the planned node. In order to identify the maximum power capacity of the ESS, it is proposed to conduct investigations with power quality parameters of the grid and requirements for the integration of the generation units with power systems. The impact of ESS power capacity on economic efficiency is considered in paper [36]. In this paper, the maximum power capacity of ESS-L is identified using a simplified analytic derivation, as well as Matlab modeling and simulation.
A rough estimation of the maximum power capacity of the considered battery energy storage ESS-L connected to the same node of MV network as hydro power plant HPP-L can be calculated based on short circuit power related to the connection point of ESS-L and HPP-L. The simplified one-phase Thevenin’s equivalent circuit, which can be used for rough calculations, is presented in Figure 11.
In a simplified estimation of the influence of the selected generation unit on the voltage condition in the connection point, a critical simplification can be considered. Firstly, the investigated network is treated as unloaded so that the decrease of voltage caused by the load is not taken into consideration. Only the direct influence of the considered generation is then revealed. As a result of the mentioned assumption, before the connection of the power unit, the Thevenin’s substitute voltage source magnitude ET in the point of common coupling (PCC) is the equal nominal voltage. The Thevenin’s reactance XT is equal to short circuits reactance XQ addressed to the node of the connection point. The resistance of Thevenin’s equivalent can be neglected in comparison to reactance. The parameters of Thevenin’s equivalent circuits can be calculated as:
E T = U N 3
X T = X Q = c · U N 2 S k Q ,
where:
  • UN—the nominal voltage phase to phase value,
  • SkQ—the short circuit apparent power in the connection node,
  • C—the short circuit factor (c = 1 for minimal short circuit power, c = 1.1 for maximal short circuit power).
Due to the high influence of reactive power on the voltage level, the second critical assumption in the simplified calculation is that the HPP-L and ESS-L only generate a reactive power in the PCC. The voltage change is caused by a voltage associated with the short circuit reactance and current flow IPCC inserted into the network by both generating units connected to the PCC operating at maximum power. The estimated steady state voltage change visible in the PCC can be expressed by:
Δ U C = 3 · I P C C · X Q = 3 · S P C C 3 · U N · c · U N 2 S k Q = c · U N · S P C C S k Q ,
where: SPCC—the maximum power capacity of the power generation unit connected to the PCC, which in the described case study is a sum of generated power HPP and ESS—SPCC = SHHP + SESS.
Combining definition of voltage change dC introduced in Equation (1) with Equation (4) allows deriving a direct relation between maximum power capacity of considered power generation unit connected to the PCC (SPCC) with the short circuit power which characterizes equivalent of the network visible in point of the PCC (SkQ). This relation can be revealed as:
d c = | Δ U C | U N = c · S P C C S k Q .
Equation (5) can be recalculated in order to express the maximum power capacity of the power generating unit connected to the considered PCC which is characterized by short circuit power. Short circuit power depends on the permissible level of rapid voltage change.
S P C C = d c c · S k Q .
Short circuit power in the selected node of the investigated power network, that is, in the busbar of the main station R-J and in the connection point of the hydropower plant HPP-L and battery energy storage system ESS-L, are presented in Table 4. Next, taking into account permitted levels of rapid voltage change dc = 3% and short circuit factor of c = 1.1 as quoted in Section 2, it is possible to use Equation (6) to estimate the maximum capacity of the power generating units that can be connected to the investigated node of the power network from the point of view of rapid voltage change requirement. An example of the calculation, in relation to the main power station R-J and the connection point of the hydropower plant and energy storage system (node L), is compared in Table 4. It can be concluded that the nodes located deep in the power grid are characterized by a lower level of short circuit power which ultimately increases the limitation of the capacity of the generating unit that can be connected in that node. When referring to the connection node of the hydropower plant and energy storage system, which is characterized by short circuit power on the level of 54.2 MVA, the maximum power capacity of the generation unit is limited to 1.48 MW. Assuming the operation of the hydropower plant HPP-L with a maximum power level of 0.94 MW, it can be concluded that the permissible power of the energy storage system ESS-L connected to the same node is limited to 0.54 MW. The presented calculation results of the possible power of the battery energy storage ESS-L should be treated as a rough estimation. The results are extremely limited by the simplification of the network, the unloaded condition, the reactive power consideration and the restricted limit of the rapid voltage change dc = 3%.
In order to obtain a more precise estimation of the desired value of the maximum power capacity of the ESS-L, a simulation of the influence of gradually increasing the power of the ESS-L on the voltage level in the connection point of the HPP-L and ESS-L is proposed. The basic conditions of the simulation are similar to those previously used when the effect of switching on the DER series on the voltage level was simulated. These preliminary assumptions are as follows—the initial power flows relate to summer peak load demand and the HHP-L power generation level is a maximum of around 940 kW. The result of the simulation is presented in Figure 12. The results allow concluding that from the point of view of acceptable rapid voltage changes at the point of connection of HPP-L and ESS-L, the total maximum capacity of these two generating units should be in the range from 2 MW to 2.4 MW. Assuming that the power generated by HPP-L is around 1 MW, it can be concluded that the possible maximum capacity of a given energy storage system ESS-L is limited to 1 MW or 1.4 MW. In comparison with the method based on simplified calculations using short circuit power circuits, the result obtained using more precise simulations is more realistic.
The rough estimation using short circuit power is the fast method, however, usually gives relatively underestimated results. The short-circuit equivalent model is dedicated to the linear electrical components. In addition, the short circuit current is significantly modified in the presence of power electronic inverters used to integrate DERs and ESSs into the power supply system. The results of the calculation of the maximum power of a given ESS using network modeling are more technically realistic but require modeling and computing power. It should be mentioned that the estimation of the maximum power capacity of a considered ESS based on modeling and simulation is more accurate as it includes:
  • regulation of the transformer in main power stations R-J and R-Z,
  • the power exchange between main power stations R-J and R-Z with a 110 kV line,
  • parameters of the individual line sections connecting DER with main stations,
  • parameters of the loads distributed along the lines,
  • parameters of the DERs, especially the contribution of the power inverters in short circuits, possible dynamics during fast load changes, speed limits for power changes.
The presented results were used in the accompanying paper [36] in the point concerning the economic efficiency test where a 0.5 MW or 1 MW battery energy storage system is considered to be used in the VPP topology. In Reference [36] general aspects related to VPP concepts were also examined, including the analysis of the advantages and disadvantages of using one ESS compared to many small ESSs or more RES.

4.4. Study on the Impact of the Power Control Strategy Used in a PV Power Plant on the Resources Available for VPP

Section 3.2 discusses the relationship between active power and reactive power applied to low voltage generation units. It has been shown that such generating units have a standard cosφ(P) characteristic assuming a reactive power consumption for the production of active power above 50% of the maximum power of the generating unit. This regulation strategy serves to reduce of voltage increase. However, from the point of view of the virtual power plant, the regulation introduces certain restrictions which affect the availability of resources integrated into the VPP. In order to highlight this issue, studies of PV power plants belonging to the VPP were carried out. The PV power plant mentioned is a 132 kW PV installation marked as PV-C in Figure 4 and Table 2. This power plant is the facility consisting of several individual photovoltaic power plants PV, three-phase and single-phase installations using different installed power and different photovoltaic technologies but all connected in the same PCC. From a PCC point of view, the combined phase is occupied almost symmetrically but there may be some differences between the phases. The aim of the presented studies is to determine the level of energy, which is redirected to the reactive power consumption instead of the active power generation. In order to achieve this, the actual measurement of changes in active and reactive power in the selected week, which is characterized by similar daily weather conditions, was analyzed. Changes in active and reactive power during the test week due to changes in solar irradiance are shown in Figure 13. It can be seen that a high level of active power generation is accompanied by reactive power consumption, which indicates that PV installations integrated with the PV power plant realize the cosφ(P) characteristic. In order to emphasize the observed correlation, Figure 14 shows the correlation between solar irradiation and active and reactive power. The calculated Pearson correlation coefficients for active and reactive power confirm the high correlation between solar irradiation and the generation of active power and, consequently, reactive power consumption.
Table 5 contains an analysis of active power generation and reactive power consumption over one week to determine the effect of the implemented cosφ(P) characteristic on the reduction of active power generation availability. It was shown that during one observation week, which is characterized by sunny weather, the total amount of active energy produced is 4799.91 [kWh] and at the same time, reactive energy consumed is 53.87 [kvarh]. This leads to the conclusion that during the sunny week 1.11% of the total energy from the considered PV is not available for the VPP planning because it is used for reactive power regulation. The result presented corresponds to a sunny week, therefore a long-term analysis should be carried out to verify this observation.

5. Discussion

This paper formulates a thesis that requirements related to regulation, protection and integration of power generation units and battery storage system with power systems have an impact on the planning and operation strategies of the VPP. After a comprehensive study of the current grid codes, standards and papers, three topics were selected and highlighted in the VPP:
  • identification of an operational condition of the 1 MW hydro power plant and 0.5 MW battery energy storage connected to the same node and its impact on power flow and voltage level in observed network covered by VPP,
  • identification of maximum power capacity of battery energy storage, which can be connected to a given node and identification of the overall capacity of the examined fragment of the distribution network to connect possible DERs/ESSs
  • identification of the impact of power control strategy applied to a PV power plant on resources available for the VPP.
Mentioned issues were investigated based on the real VPP project. The results obtained are distinctive and related to the investigated localization of the VPP, however, the proposed test method and results obtained can be treated more generally. In order to determine indicated aspects, a few test methods using Matlab simulation have been implemented, combining actual load demand measurements with data generated as a prerequisite for simulation and direct analysis of actual measurements. Application of the proposed method to the real case study of the VPP allowed to formulate several observations related to the operational capabilities of the VPP and technical requirements related to the integration of the DER and ESS with the utility grid:
  • Grid capacity for connection of the DERs and ESSs is limited. One of the main limitations is the requirement for rapid voltage changes. In the presented studies it was shown that using modeling of the considered network covered by the planned VPP, it is possible to determine the maximum power capacity of the ESS intended to be connected in the selected node. It has also been proven that the use of the simplified model adopted for short-circuit calculation is extremely simplified and results of rough estimates usually return relatively underestimated results.
  • The implementation of cosφ(P) characteristic for reactive power control in power inverters integrating PVs with the grid reduces the availability of active power generation, which ultimately means restrictions on the use of PV in the VPP planning strategy. The presented results of real PV measurements associated with the considered VPP showed that 1.11% of the total energy from the considered PV is not available for VPP planning in the sunny week because it is designed to regulate reactive power.
  • Representation of the grid covered by the VPP using a simulation model, which is complemented by actual measurements, provides extended opportunities for research into the choice of strategy for planning and operating a VPP. Presented results allowed to determine the impact of power changes of energy storage system or hydropower plant on the reduction of load on lines and transformers and on voltage changes. It can be used to create energy system services provided by VPP.
Obtained results constitute the influence of the technical requirements for DER and ESS integration with the power grid on the VPP operational condition.

6. Conclusions

Technical aspects related to the integration of DER with the power systems can be treated as boundary conditions for the VPP planning and operation strategies. This article presents indicated results obtained for a specific case of a VPP and a broad generalization for another VPP location is not easy to achieve. However, the presented assessment method, the methodology of the studies and investigations, can be adapted and applied to another VPP topology. In addition, the definition of limitations on VPP resources formulated by the technical aspects can be further used as a prerequisite for economic research. For example, based on the studies carried out, it was indicated that planned battery energy storage in the investigated grid covered by the VPP could be increased from the planned capacity of 0.5 MW to 1.0 MW. Therefore, this result allowed us to investigate the impact of the size of the energy storage system to economic efficiency in associated work [36].

Author Contributions

Conceptualization, T.S., E.R.-S., M.W.; methodology of technical aspects, T.S., M.S., W.R.; methodology of economic aspects, E.R.-S., M.W.; software for technical simulation, M.S.,W.R., J.S.; software for economic calculation, E.R.-S.; formal analysis in content of technical aspects, T.S., M.J., R.L., J.R., D.K., P.K.; formal analysis in content of economic aspects, E.R.-S., M.W.; investigation in the range of technical aspects, T.S., W.R., M.S., M.J., B.S.; investigation in the range of economic aspects, E.R.-S., M.W.; resources of technical aspects, D.K., R.L., J.R., M.J., T.S., Z.L., P.K.; resources of economic aspects, E.R.-.S., M.W.; technical data curation, J.S., M.S., D.B., P.J.; economic data curation, E.R.-S., M.W.; visualization of technical aspects, W.R., M.J., D.K., P.K.; visualization of economic aspects E.R.-S., M.W.; writing—original draft preparation, T.S., M.J., D.K., J.R., R.L. and E.R.-S., M.W.; writing—review and editing, T.S., M.J., E.R.-S., M.W.; supervision, T.S., M.W.; project administration, T.S., P.J.; funding acquisition, T.S., P.J. All authors have read and agreed to the publisher version of the manuscript.

Funding

This research was funded by the National Center of Research and Development in Poland, the project “Developing a platform for aggregating generation and regulatory potential of dispersed renewable energy sources, power retention devices and selected categories of controllable load” supported by European Union Operational Programme Smart Growth 2014-2020, Priority Axis I: Supporting R&D carried out by enterprises, Measure 1.2: Sectoral R&D Programmes, POIR.01.02.00-00-0221/16, performed by TAURON Ekoenergia Ltd.

Acknowledgments

The research uses annual weather conditions and power production data of PV power plant provided by Center of Energy Technologies in Świdnica, Poland.

Conflicts of Interest

The authors declare no conflict of interest.

Abbreviations

The following abbreviations are used in the paper:
ACERAgency for the Cooperation of Energy Regulators
BMSbattery management system
cshort circuit factor
CHPcombined heat and power
CIGREConseil International des Grands Réseaux Électriques
CIMcommon information model
DCdirect current
ΔUCsteady state voltage change
dCrelative maximum steady state voltage change
cosϕpower factor
DER, DGdistributed energy resources, distributed generation
DSOdistribution system operator
ENTSO-EEuropean Network of Transmission System Operators for Electricity
EPSelectrical power system
ESSenergy storage system
ffrequency
ggravitational acceleration
Hheight
HPPhydro power plant
HVhigh voltage
ICTinformation and communication technology
IPCCcurrent inserted in the point of common coupling by generation unit
LVlow voltage
MVmedium voltage
NCnetwork code, grid code
ode24function in Matlab for solvation a ordinary differential Equation
Pactive power
Pmaxmaximum power capacity
PMactual power
PCCpoint of common coupling
PQpower quality
Qreactive power
RESrenewable energy sources
SkQshort circuit apparent power
SoCstate of charge
SPCCpower of the generation unit connected to the point of common coupling
ST1AIEEE type ST1A excitation system mode in Matlab
U voltage
UNnominal voltage
UCsteady state voltage
VPPvirtual power plant
XQshort circuit reactance
XTreactance of Thevenin’s circuit equivalent

References

  1. Awerbuch, S.; Preston, A. The Virtual Utility; Awerbuch, S., Preston, A., Eds.; Springer: Boston, MA, USA, 1997; Volume 26, ISBN 978-1-4613-7827-3. [Google Scholar]
  2. Lis, R.; Czechowski, R. Transformation of microgrid to virtual power plant. In Variability, Scalability and Stability of Microgrids; Institution of Engineering and Technology: London, UK, 2019; pp. 99–142. [Google Scholar]
  3. Othman, M.M.; Hegazy, Y.; Abdelaziz, A.Y. A review of virtual power plant definitions, components, framework and optimization. Int. Electr. Eng. J. 2015, 6, 2010–2024. [Google Scholar]
  4. Ghavidel, S.; Li, L.; Aghaei, J.; Yu, T.; Zhu, J. A review on the virtual power plant: Components and operation systems. In Proceedings of the 2016 IEEE International Conference on Power System Technology (POWERCON), Wollongong, Australia, 28 September–1 October 2016; pp. 1–6. [Google Scholar]
  5. Richter, A.; Hauer, I.; Wolter, M. Algorithms for technical integration of virtual power plants into German system operation. Adv. Sci. Technol. Eng. Syst. J. 2018, 3, 135–147. [Google Scholar] [CrossRef] [Green Version]
  6. Yavuz, L.; Önen, A.; Muyeen, S.M.; Kamwa, I. Transformation of microgrid to virtual power plant—A comprehensive review. IET Gener. Transm. Distrib. 2019, 13, 2077–2087. [Google Scholar] [CrossRef]
  7. Etherden, N.; Vyatkin, V.; Bollen, M.H.J. Virtual power plant for grid services using IEC 61850. IEEE Trans. Ind. Inform. 2016, 12, 437–447. [Google Scholar] [CrossRef]
  8. Asmus, P. Microgrids, virtual power plants and our distributed energy future. Electr. J. 2010. [Google Scholar] [CrossRef]
  9. Vergados, D.J.; Mamounakis, I.; Makris, P.; Varvarigos, E. Prosumer clustering into virtual microgrids for cost reduction in renewable energy trading markets. Sustain. Energy Grids Netw. 2016. [Google Scholar] [CrossRef]
  10. Anoh, K.; Maharjan, S.; Ikpehai, A.; Zhang, Y.; Adebisi, B. Energy peer-to-peer trading in virtual microgrids in smart grids: A game-theoretic approach. IEEE Trans. Smart Grid 2020. [Google Scholar] [CrossRef]
  11. Adu-Kankam, K.O.; Camarinha-Matos, L.M. Towards collaborative virtual power plants: Trends and convergence. Sustain. Energy Grids Netw. 2018, 16, 217–230. [Google Scholar] [CrossRef]
  12. Alahyari, A.; Ehsan, M.; Mousavizadeh, M.S. A hybrid storage-wind virtual power plant (VPP) participation in the electricity markets: A self-scheduling optimization considering price, renewable generation, and electric vehicles uncertainties. J. Energy Storage 2019, 25. [Google Scholar] [CrossRef]
  13. Thavlov, A.; Bindner, H.W. Utilization of flexible demand in a virtual power plant set-up. IEEE Trans. Smart Grid 2015, 6, 640–647. [Google Scholar] [CrossRef] [Green Version]
  14. Kardakos, E.G.; Simoglou, C.K.; Bakirtzis, A.G. Optimal offering strategy of a virtual power plant: A stochastic bi-level approach. IEEE Trans. Smart Grid 2016, 7, 794–806. [Google Scholar] [CrossRef]
  15. Tang, W.; Yang, H.T. Optimal operation and bidding strategy of a virtual power plant integrated with energy storage systems and elasticity demand response. IEEE Access 2019, 7, 79798–79809. [Google Scholar] [CrossRef]
  16. Papadaskalopoulos, D.; Pudjianto, D.; Strbac, G. Decentralized coordination of microgrids with flexible demand and energy storage. IEEE Trans. Sustain. Energy 2014, 5, 1406–1414. [Google Scholar] [CrossRef]
  17. Sadeghian, O.; Shotorbani, A.M.; Mohammadi-Ivatloo, B. Generation maintenance scheduling in virtual power plants. IET Gener. Transm. Distrib. 2019, 13, 2584–2596. [Google Scholar] [CrossRef]
  18. Han, N.; Wang, X.; Chen, S.; Cheng, L.; Liu, H.; Liu, Z.; Mao, Y. Optimal configuration of energy storage systems in virtual power plants including large-scale distributed wind power. IOP Conf. Ser. Earth Environ. Sci. 2019, 295, 042072. [Google Scholar] [CrossRef]
  19. Abdolrasol, M.G.M.; Hannan, M.A.; Mohamed, A.; Amiruldin, U.A.U.; Abidin, I.B.Z.; Uddin, M.N. An optimal scheduling controller for virtual power plant and microgrid integration using the binary backtracking search algorithm. IEEE Trans. Ind. Appl. 2018, 54, 2834–2844. [Google Scholar] [CrossRef]
  20. Liang, Z.; Alsafasfeh, Q.; Jin, T.; Pourbabak, H.; Su, W. Risk-constrained optimal energy management for virtual power plants considering correlated demand response. IEEE Trans. Smart Grid 2019, 10, 1577–1587. [Google Scholar] [CrossRef]
  21. Kasaei, M.J.; Gandomkar, M.; Nikoukar, J. Optimal management of renewable energy sources by virtual power plant. Renew. Energy 2017, 114, 1180–1188. [Google Scholar] [CrossRef]
  22. Hannan, M.A.; Abdolrasol, M.G.M.; Faisal, M.; Ker, P.J.; Begum, R.A.; Hussain, A. Binary particle swarm optimization for scheduling mg integrated virtual power plant towards energy saving. IEEE Access 2019, 7, 1. [Google Scholar] [CrossRef]
  23. Koraki, D.; Strunz, K. Wind and solar power integration in electricity markets and distribution networks through service-centric virtual power plants. IEEE Trans. Power Syst. 2018, 33, 473–485. [Google Scholar] [CrossRef]
  24. Bagchi, A.; Goel, L.; Wang, P. Adequacy assessment of generating systems incorporating storage integrated virtual power plants. IEEE Trans. Smart Grid 2019, 10, 3440–3451. [Google Scholar] [CrossRef]
  25. Chen, S.; Zhang, T.; Gooi, H.B.; Masiello, R.D.; Katzenstein, W. Penetration rate and effectiveness studies of aggregated BESS for frequency regulation. IEEE Trans. Smart Grid 2016, 7, 167–177. [Google Scholar] [CrossRef]
  26. Zamani, A.G.; Zakariazadeh, A.; Jadid, S.; Kazemi, A. Stochastic operational scheduling of distributed energy resources in a large scale virtual power plant. Int. J. Electr. Power Energy Syst. 2016, 82, 608–620. [Google Scholar] [CrossRef]
  27. Nosratabadi, S.M.; Hooshmand, R.A.; Gholipour, E. A comprehensive review on microgrid and virtual power plant concepts employed for distributed energy resources scheduling in power systems. Renew. Sustain. Energy Rev. 2017, 67, 341–363. [Google Scholar] [CrossRef]
  28. Yu, S.; Fang, F.; Liu, Y.; Liu, J. Uncertainties of virtual power plant: Problems and countermeasures. Appl. Energy 2019, 239, 454–470. [Google Scholar] [CrossRef]
  29. Survey, P.S.A.; Rakhshani, E.; Rouzbehi, K.; Adolfo, J.S.; Tobar, A.C. Integration of large scale PV-based generation into power systems: A survey. Energies 2019, 12, 1425. [Google Scholar] [CrossRef] [Green Version]
  30. Ribeiro, C.; Pinto, T.; Vale, Z.; Baptista, J. Remuneration and tariffs in the context of virtual power players. In Trends in Cyber-Physical Multi-Agent Systems, Proceedings of the The PAAMS Collection-15th International Conference, PAAMS, Porto, Portugal, 21–23 June 2017; la Prieta, F., Vale, Z., Antunes, L., Pinto, T., Campbell, A.T., Julián, V., Neves, A.J.R., Moreno, M.N., Eds.; Springer International Publishing: Cham, Switzerland, 2018; pp. 284–286. ISBN 978-3-319-61578-3. [Google Scholar]
  31. Boldt, D.; Faria, P.; Vale, Z. Integration of pumping in virtual power players management considering demand response. In Proceedings of the 13th International Conference on the European Energy Market (EEM), Porto, Portugal, 6–9 June 2016; pp. 1–5. [Google Scholar]
  32. Silva, C.; Faria, P.; Vale, Z. Multi-period observation clustering for tariff definition in a weekly basis remuneration of demand response. Energies 2019, 12, 1248. [Google Scholar] [CrossRef] [Green Version]
  33. Faria, P.; Spínola, J.; Vale, Z. Distributed energy resources scheduling and aggregation in the context of demand response programs. Energies 2018, 11, 1987. [Google Scholar] [CrossRef] [Green Version]
  34. Ribeiro, C.; Pinto, T.; Vale, Z.; Baptista, J. Data mining for prosumers aggregation considering the self-generation. In Distributed Computing and Artificial Intelligence, Proceedings of the 14th International Conference, Porto, Portugal, 21–23 June 2017; Omatu, S., Rodríguez, S., Villarrubia, G., Faria, P., Sitek, P., Prieto, J., Eds.; Springer International Publishing: Cham, Switzerland, 2018; pp. 96–103. ISBN 978-3-319-62410-5. [Google Scholar]
  35. Faria, P.; Vale, Z. A demand response approach to scheduling constrained load shifting. Energies 2019, 12, 1752. [Google Scholar] [CrossRef] [Green Version]
  36. Sikorski, T.; Jasiński, M.; Ropuszyńska-Surma, E.; Węglarz, M.; Kaczorowska, D.; Kostyła, P.; Leonowicz, Z.; Lis, R.; Rezmer, J.; Rojewski, W.; et al. A case study on distributed energy resources and energy-storage systems in a virtual power plant concept: Economic aspects. Energies 2019, 12, 4447. [Google Scholar] [CrossRef] [Green Version]
  37. Yang, J.; Huang, Y.; Wang, H.; Ji, Y.; Li, J.; Gao, C. A regulation strategy for virtual power plant. In Proceedings of the 2017 4th International Conference on Systems and Informatics (ICSAI), Hangzhou, China, 11–13 November 2017; pp. 375–379. [Google Scholar] [CrossRef]
  38. Roossien, B.; Hommelberg, M.; Warmer, C.; Turkstra, J.-W. Virtual power plant field experiment using 10 micro-CHP units at consumer premises. IET Conf. Proc. 2008, 5. [Google Scholar] [CrossRef]
  39. Unger, D.; Spitalny, L.; Myrzik, J.M.A. Voltage control by small hydro power plants integrated into a virtual power plant. In Proceedings of the 2012 IEEE Energytech, Cleveland, OH, USA, 29–31 May 2012; pp. 1–6. [Google Scholar] [CrossRef]
  40. Beguin, A.; Nicolet, C.; Kawkabani, B.; Avellan, F. Virtual power plant with pumped storage power plant for renewable energy integration. In Proceedings of the 2014 International Conference on Electrical Machines (ICEM), Berlin, Germany, 2–5 September 2014; pp. 1736–1742. [Google Scholar] [CrossRef]
  41. Bilbao, J.; Bravo, E.; Rebollar, C.; Varela, C.; Garcia, O. Virtual power plants and virtual inertia. In Power Systems; Springer Verlag: Bilbao, Spain, 2020; pp. 87–113. ISBN 16121287. [Google Scholar]
  42. Othman, M.M.; Hegazy, Y.G.; Abdelaziz, A.Y. Electrical energy management in unbalanced distribution networks using virtual power plant concept. Electr. Power Syst. Res. 2017, 145, 157–165. [Google Scholar] [CrossRef]
  43. Nemati, M.; Zöller, T.; Tenbohlen, S.; Tao, L.; Mueller, H.; Braun, M. Optimal energy management system for future microgrids with tight operating constraints. In Proceedings of the 2015 12th International Conference on the European Energy Market (EEM), Lisbon, Portugal, 19–22 May 2015; pp. 1–5. [Google Scholar] [CrossRef]
  44. Ali, J.; Massucco, S.; Silvestro, F.; Vinci, A. Participation of customers to virtual power plants for reactive power provision. In Proceedings of the 2018 53rd International Universities Power Engineering Conference (UPEC), Glasgow, UK, 4–7 September 2018; pp. 1–6. [Google Scholar] [CrossRef]
  45. Dos Santos, T.V., Jr.; Bonatto, B.D.; Ferreira, C.; De Souza, Z.A.C. Impact of harmonic distortion on the energization of energy distribution transformers integrated in virtual power plants. In Proceedings of the 2018 15th International Conference on Control, Automation, Robotics and Vision, ICARCV, Singapore, 18–21 November 2018; pp. 1252–1256. [Google Scholar]
  46. Braun, M. Virtual power plants in real applications-pilot demonstrations in Spain and England as part of the European project FENIX. In Proceedings of the ETG-Fachbericht-Internationaler ETG-Kongress, Düsseldorf, Germany, 27–28 October 2009. [Google Scholar]
  47. Hess, T.; Schegner, P. Power schedule planing and operation algorithm of the local virtual power plant based on uCHP-devices. In Proceedings of the 2015 IEEE Power & Energy Society General Meeting, Denver, CO, USA, 26–30 July 2015; pp. 1–5. [Google Scholar]
  48. Vuthi, P.P.; Lorenzen, P.; Schaefers, H.; Raths, S.; Krengel, S.; Sudeikat, J.; Thomsen, M. Smart power Hamburg: A virtual power plant for Hamburg. In Proceedings of the International ETG Congress-Die Energiewende-Blueprints for the New Energy Age, Bonn, Germany, 17–18 November 2015; pp. 1–8. [Google Scholar]
  49. Binding, C.; Gantenbein, D.; Jansen, B.; Sundstrom, O.; Andersen, P.B.; Marra, F.; Poulsen, B.; Traeholt, C. Electric vehicle fleet integration in the danish EDISON project-a virtual power plant on the island of Bornholm. In Proceedings of the IEEE PES General Meeting, Providence, RI, USA, 25–29 July 2010; pp. 1–8. [Google Scholar]
  50. Stock, A.; Bourne, G.; Brailsford, L.; Stock, P. Fully Charged: Renewables and Storage Powering Australia; Climate Council of Australia Limited: Potts Point, Australia, 2018. [Google Scholar]
  51. CIGRE Conseil International des Grands Réseaux Électriques. Connection Criteria at the Distribution Network for Distributed Generation; CIGRE: Paris, France, 2007. [Google Scholar]
  52. VDE Verband der Elektrotechnik Elektronik. Power Generation Systems Connected to the Low-Voltage Distribution network: Technical Minimum Requirements for the Connection to and Parallel Operation with Low-Voltage Distribution Networks; VDE-AR-N 4105:2011-08; VDE: Frankfurt, Germany, 2011. [Google Scholar]
  53. Commission Regulation. 2016/631 of 14 April 2016 Establishing a Network Code on Requirements for Grid Connection of Generators; The European Commission: Brussels, Belgium, 2016. [Google Scholar]
  54. ACER Agency for the Cooperation of Energy Regulators. Framework Guidelines On Electricity Grid Connections; ACER: Ljubljana, Slovenia, 2011. [Google Scholar]
  55. ENTSO-E European Network of Transmission System Operators for Electricity. Requirements for Grid Connection Applicable to All Generators; ENTSO-E: Brussels, Belgium, 2013. [Google Scholar]
  56. Stadler, I. Study About International Standards for the Connection of Small Distributed Generators to the Power Grid. 2011. Available online: https://energypedia.info/images/temp/c/cf/20140508124849!phpvxPnex.pdf (accessed on 15 February 2020).
  57. Sikorski, T.; Rezmer, J. Distributed generation and its impact on power quality in low-voltage distribution networks. In Power Quality Issues in Distributed Generation; InTech: London, UK, 2015. [Google Scholar]
  58. Jasiński, M.; Rezmer, J.; Sikorski, T.; Szymańda, J. Integration monitoring of on-grid photovoltaic system: Case study. Period. Polytech. Electr. Eng. Comput. Sci. 2019, 63, 99–105. [Google Scholar] [CrossRef]
  59. Klajn, A.; Bątkiewicz-Pantua, M. Application Note-Standard EN 50 160: Voltage Characteristics of Electricity Supplied by Public Electricity Networks. 2017. Available online: https://copperalliance.org.uk/uploads/2018/03/542-standard-en-50160-voltage-characteristics-in.pdf (accessed on 15 February 2020).
  60. CENELEC Comité Européen de Normalisation Electrotechnique. Voltage Characteristics of Electricity Supplied by Public Electricity Networks; CENELEC: Brussels, Belgium, 2010. [Google Scholar]
  61. Jasiński, M.; Sikorski, T.; Kostyła, P.; Kaczorowska, D.; Leonowicz, Z.; Rezmer, J.; Szymańda, J.; Janik, P.; Bejmert, D.; Rybiański, M.; et al. Influence of measurement aggregation algorithms on power quality assessment and correlation analysis in electrical power network with pv power plant. Energies 2019, 12, 3547. [Google Scholar] [CrossRef] [Green Version]
  62. Zarębski, T. Analysis of the efficiency of energy storage systems. In Proceedings of the 2018 Innovative Materials and Technologies in Electrical Engineering (i-MITEL), Sulecin, Poland, 18–20 April 2018. [Google Scholar]
  63. Waśkowicz, B.; Bojarski, J. Energy storage control algorithm for suppression of fluctuation of wind farm output power. In Proceedings of the 2018 Innovative Materials and Technologies in Electrical Engineering (i-MITEL), Sulecin, Poland, 18–20 April 2018; pp. 1–6. [Google Scholar]
  64. Gubański, A.; Kaczorowska, D. Power flow optimization between microgrid and distribution system. In Proceedings of the 2018 Innovative Materials and Technologies in Electrical Engineering, i-MITEL, Sulecin, Poland, 18–20 April 2018; pp. 1–4. [Google Scholar]
  65. Waltrich, G. Energy Management of Fast-Charger Systems for Electric Vehicles: Experimental Investigation of Power Flow Steering Using Bidirectional Three-Phase Three-Port Converters. Ph.D. Thesis, Technische Universiteit, Eindhoven, The Netherlands, 2013. [Google Scholar]
  66. MIT Electric Vehicle Team A Guide to Understanding Battery Specification. Available online: http://web.mit.edu/evt/summary_battery_specifications.pdf (accessed on 15 February 2020).
  67. Waclawek, Z.; Rezmer, J.; Janik, P.; Nanewortor, X. Sizing of photovoltaic power and storage system for optimized hosting capacity. In Proceedings of the 2016 IEEE 16th International Conference on Environment and Electrical Engineering (EEEIC), Florence, Italy, 7–10 June 2016. [Google Scholar] [CrossRef]
  68. Kaczorowska, D.; Rezmer, J. Particle swarm algorithm for microgrid optimization. In Proceedings of the 2018 Innovative Materials and Technologies in Electrical Engineering, i-MITEL 2018, Tenerife, Spain, 10–12 April 2019; pp. 1–4. [Google Scholar]
  69. Zhou, B.; Liu, X.; Cao, Y.; Li, C.; Chung, C.Y.; Chan, K.W. Optimal scheduling of virtual power plant with battery degradation cost. IET Gener. Transm. Distrib. 2016, 10, 712–725. [Google Scholar] [CrossRef]
  70. PSE Polish Transmission System Operator Load of Polish Power System. Available online: https://www.pse.pl/web/pse-eng (accessed on 15 February 2020).
Figure 1. Standard active power frequency response characteristic P(f) applied for DER units integrated with an low voltage (LV) electrical network (based on Reference [52]).
Energies 13 03086 g001
Figure 2. Standard Q/Pmax profile (cosφ(P) characteristic) applied for distributed energy resource (DER) units integrated with a LV electrical network: (a) with regard to units with a maximum power capacity of 3.68 kVA to 13.8 kVA; (b) with regard to units with the maximum power capacity over 13,800 VA (based on References [52,57]).
Energies 13 03086 g002
Figure 3. Dependence of charging and discharging power from the state of charge (SoC): Charging (positive-red) and discharging (negative-blue).
Energies 13 03086 g003
Figure 4. Topology of the planned virtual power plant (VPP).
Energies 13 03086 g004
Figure 5. A simplified scheme of the electrical connection of the VPP, with denoted instantaneous power flow measurements at the time of the identified summer peak demand value.
Energies 13 03086 g005
Figure 6. Active power changes P in the distribution line L-62 associated with main station R-J. Changes of generated power of hydropower plant HPP-L. Changes of generated power of battery storage system ESS-L. Analysis carried out during a series of switching operations of HPP-L, PV-C and ESS-L.
Energies 13 03086 g006
Figure 7. Active power changes P in the high voltage/medium voltage (HV/MV) transformer in the main station R-J during the series of switching operations of HPP-L, PV-C and ESS-L.
Energies 13 03086 g007
Figure 8. Voltage changes U in the connection point of the hydropower plant HPP-L and battery energy storage system ESS-L during the series of switching operations of HPP-L, PV-C and ESS-L.
Energies 13 03086 g008
Figure 9. Voltage changes U at the secondary side of the HV/MV transformer in the main station R-J during the series of switching operations of HPP-L, PV-C and ESS-L.
Energies 13 03086 g009
Figure 10. Voltage changes U at the secondary side of the HV/MV transformer in the main station R-Z during the series of switching operations of HPP-L, PV-C and ESS-L.
Energies 13 03086 g010
Figure 11. Simplified one-phase Thevenin’s equivalent circuit used for a rough estimation of the influence of power capacity of considered hydro power plant and energy storage system on voltage level.
Energies 13 03086 g011
Figure 12. Voltage changes at the point of connection of MV HPP-L and ESS-L during the gradual increase of maximum power of power generators.
Energies 13 03086 g012
Figure 13. Changes in active (PL1, PL2, PL3) and reactive (QL1, QL2, QL3) power in specific phases in point of common coupling (PCC) of PV power plant PV-C and changes in solar irradiation in the examined week.
Energies 13 03086 g013
Figure 14. Correlation analysis between solar irradiation and active power (a) and reactive power (b) in PCC of PV power plant PV-C during the investigated week.
Energies 13 03086 g014
Table 1. Over/under voltage and over/under frequency protection schemes at the connection point of DERs connected to a LV electrical network in selected European countries.
CountryUnder VoltageOver VoltageUnder FrequencyOver Frequency
Germany0.7–1.0 UN;
t ≤ 0.2 s
1.0–1.15 UN;
t ≤ 0.2 s
47 Hz;
t ≤ 0.2 s
52 Hz;
t ≤ 0.2 s
Italy0.8 UN;
t ≤ 0.2 s
1.2 UN;
t ≤ 0.1 s
49–49.7 Hz;
immediately
50.3–51 Hz;
immediately
Spain0.85 UN;
t ≤ 1.2 s
1.1 UN;
t ≤ 0.5 s
48 Hz;
t ≤ 3 s
51 Hz;
t ≤ 0.2 s
Belgium0.5–0.85 UN;
t ≤ 1.5 s
1.06 UN;
immediately
49.5 Hz;
immediately
50.5 Hz;
immediately
Poland0.85 UN;
t ≤ 1.5 s
1.15 UN;
t ≤ 0.2 s
47 Hz;
t ≤ 0.5 s
51 Hz;
t ≤ 0.5s
Table 2. Renewable source of energy (RES) in the area of the planned VPP.
NameTypeInstalled Power [MW]Generating Power [MW]Connection Voltage Level
HPPL-Lhydro 1.2500.94MV
PV-Cphotovoltaic 0.1320.100LV
I-CSindustrial CHP3.9603.600MV
BIO-Sbiogas 1.1001.100MV
BIO-Nbiogas 200.000150.000MV
PV-Sphotovoltaic 0.0290.029LV
PV-Nphotovoltaic 0.0870.087LV
PV-MIphotovoltaic microinstallationLV
Table 3. Energy storage system (ESS) integrated with the VPP.
NameNearest RESInstalled PowerConnection Voltage Level
EES-Lhydro 500 kW/500 kWhMV
EES-Cphotovoltaic 65 kW/65 kWhLV
Table 4. Short circuit power in the selected node of the investigated power network and the estimated maximum power capacity of the power generation unit permissible in terms of rapid voltage change requirements.
Node of the Investigated Power NetworkShort Circuit Power SkQ [MVA]Estimated Maximum Power Capacity of Power Generation Unit SPCC [MW]
Main station R-J209.3 MVA5.71
PCC of HPP-L and ESS-L54.2 MVA1.48
Table 5. Analysis of energy production of the PV power plant during the investigated week in order to determine the impact of reactive power regulation on reducing the availability of the resources integrated into the VPP in the perspective of the observed week.
ParameterPhase L1Phase L2Phase L3Total
Time of active power generation 92.17 [h]93.17 [h]87.50 [h]90.95 [h] (mean)
[h]/[% 168 h of the week]54.86 [%]55.46% [%]52.08 [%]54.13 [%] (mean)
Time of reactive power consumption52.33 [h]51.50 [h]38.00 [h]47.28 (mean)
[h]/[% 168 h of the week]31.15 [%]30.65%22.62 [%]28.14 [%] (mean)
Generated active energy 1666.511509.351624.054799.91 [kWh]
[kWh]/[% of total energy]98.89 [%]
Consumed reactive energy 34.1814.145.5553.87 [kvarh]
[kvarh]/[% of total energy]1.11 [%]

