Author Contributions
Conceptualization, C.M. and B.C.; data curation, C.M., V.R., T.G., T.B. and I.O.; formal analysis, C.M., B.C. and V.R.; funding acquisition, M.J. and L.S.; investigation, C.M., B.C., V.R. and L.S.; Methodology, C.M., B.C., M.J. and L.S.; project administration, B.C., M.J., T.B., I.O., and L.S.; resources, B.C.; software, C.M. and V.R.; supervision, B.C., M.J. and L.S.; validation, B.C., T.G., M.J., T.B., I.O. and L.S.; visualization, B.C., M.J., and L.S.; writing—original draft, C.M. and V.R.; writing—review and editing, B.C., T.G., M.J., T.B., I.O. and L.S. All authors have read and agreed to the published version of the manuscript.
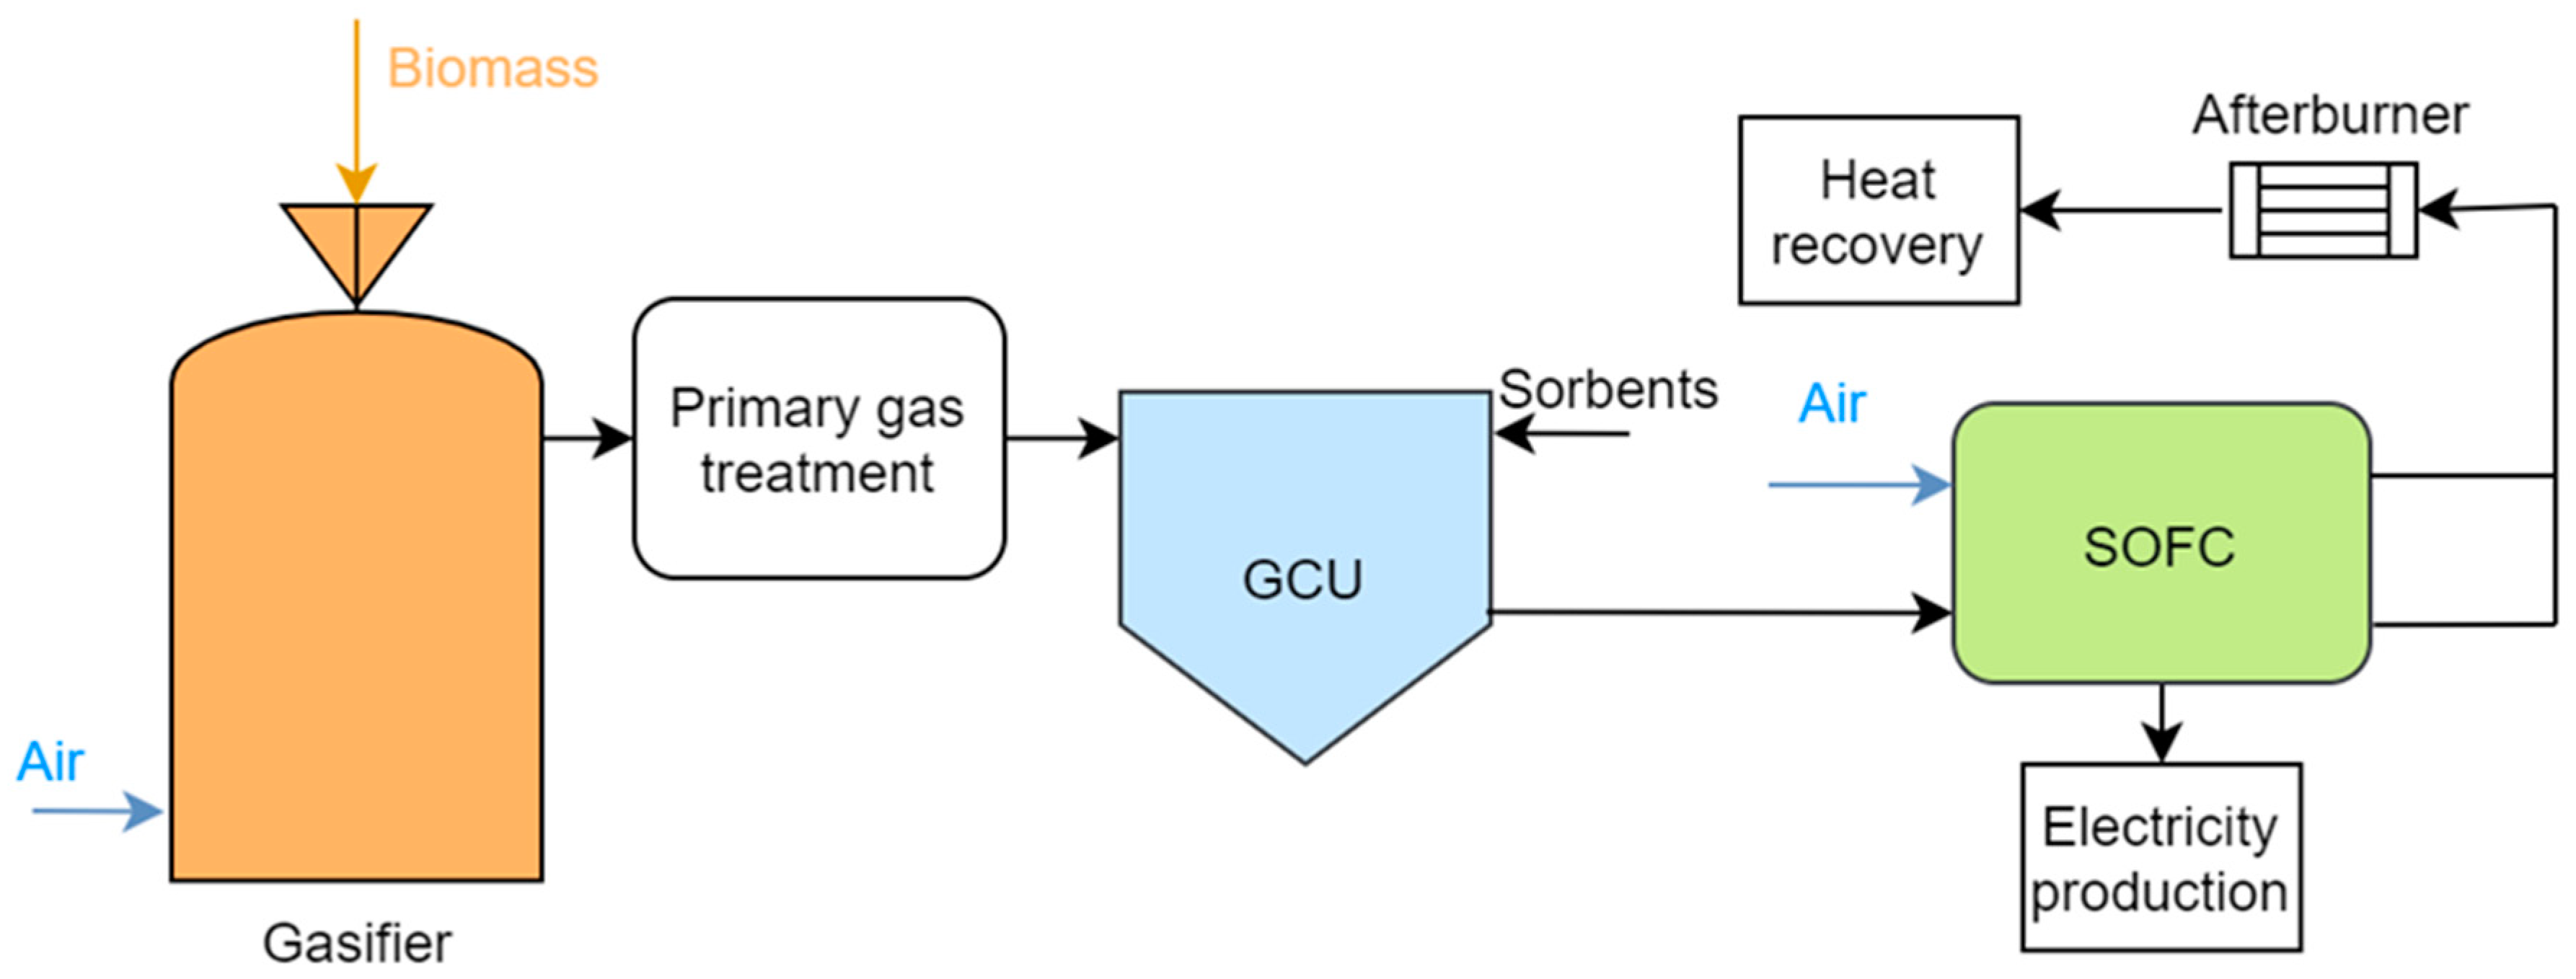
Figure 1.
Concept of high-efficiency bio-based power (HBP) technology. GCU = Gas cleaning unit. SOFC = Solid oxide fuel cell.
Figure 1.
Concept of high-efficiency bio-based power (HBP) technology. GCU = Gas cleaning unit. SOFC = Solid oxide fuel cell.
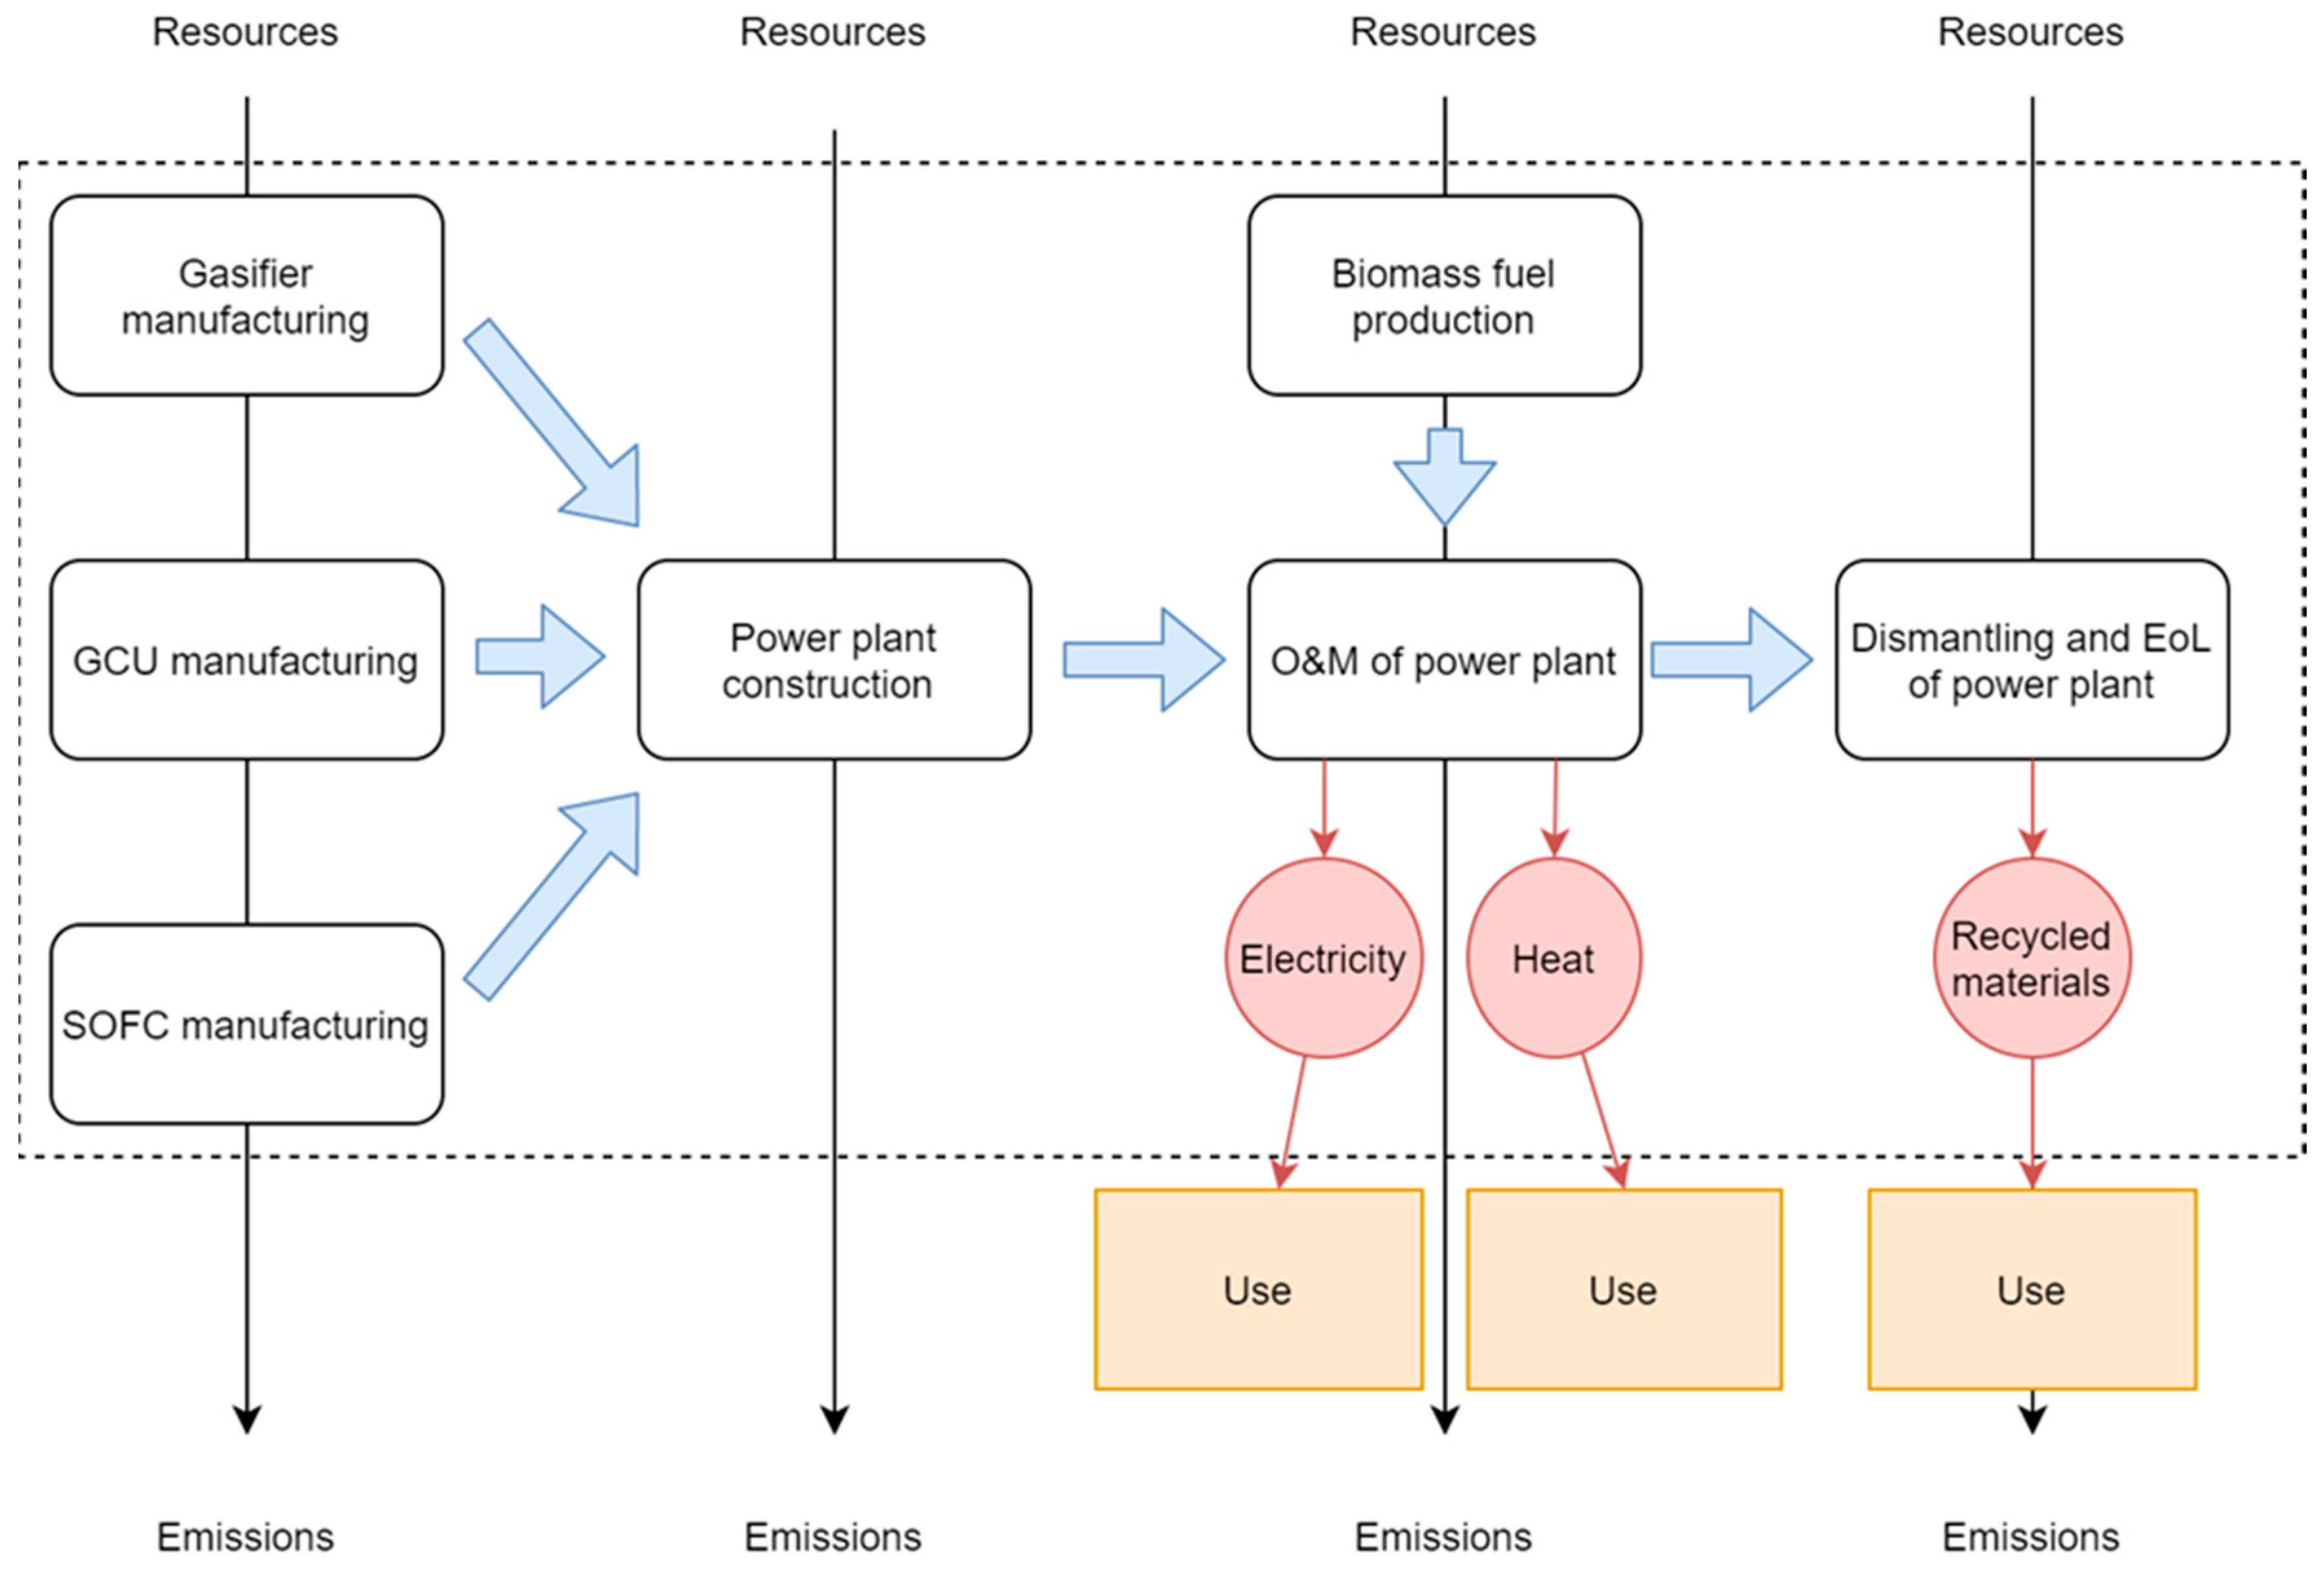
Figure 2.
Flowchart of the HBP product system, including system boundaries (dashed lines).
Figure 2.
Flowchart of the HBP product system, including system boundaries (dashed lines).
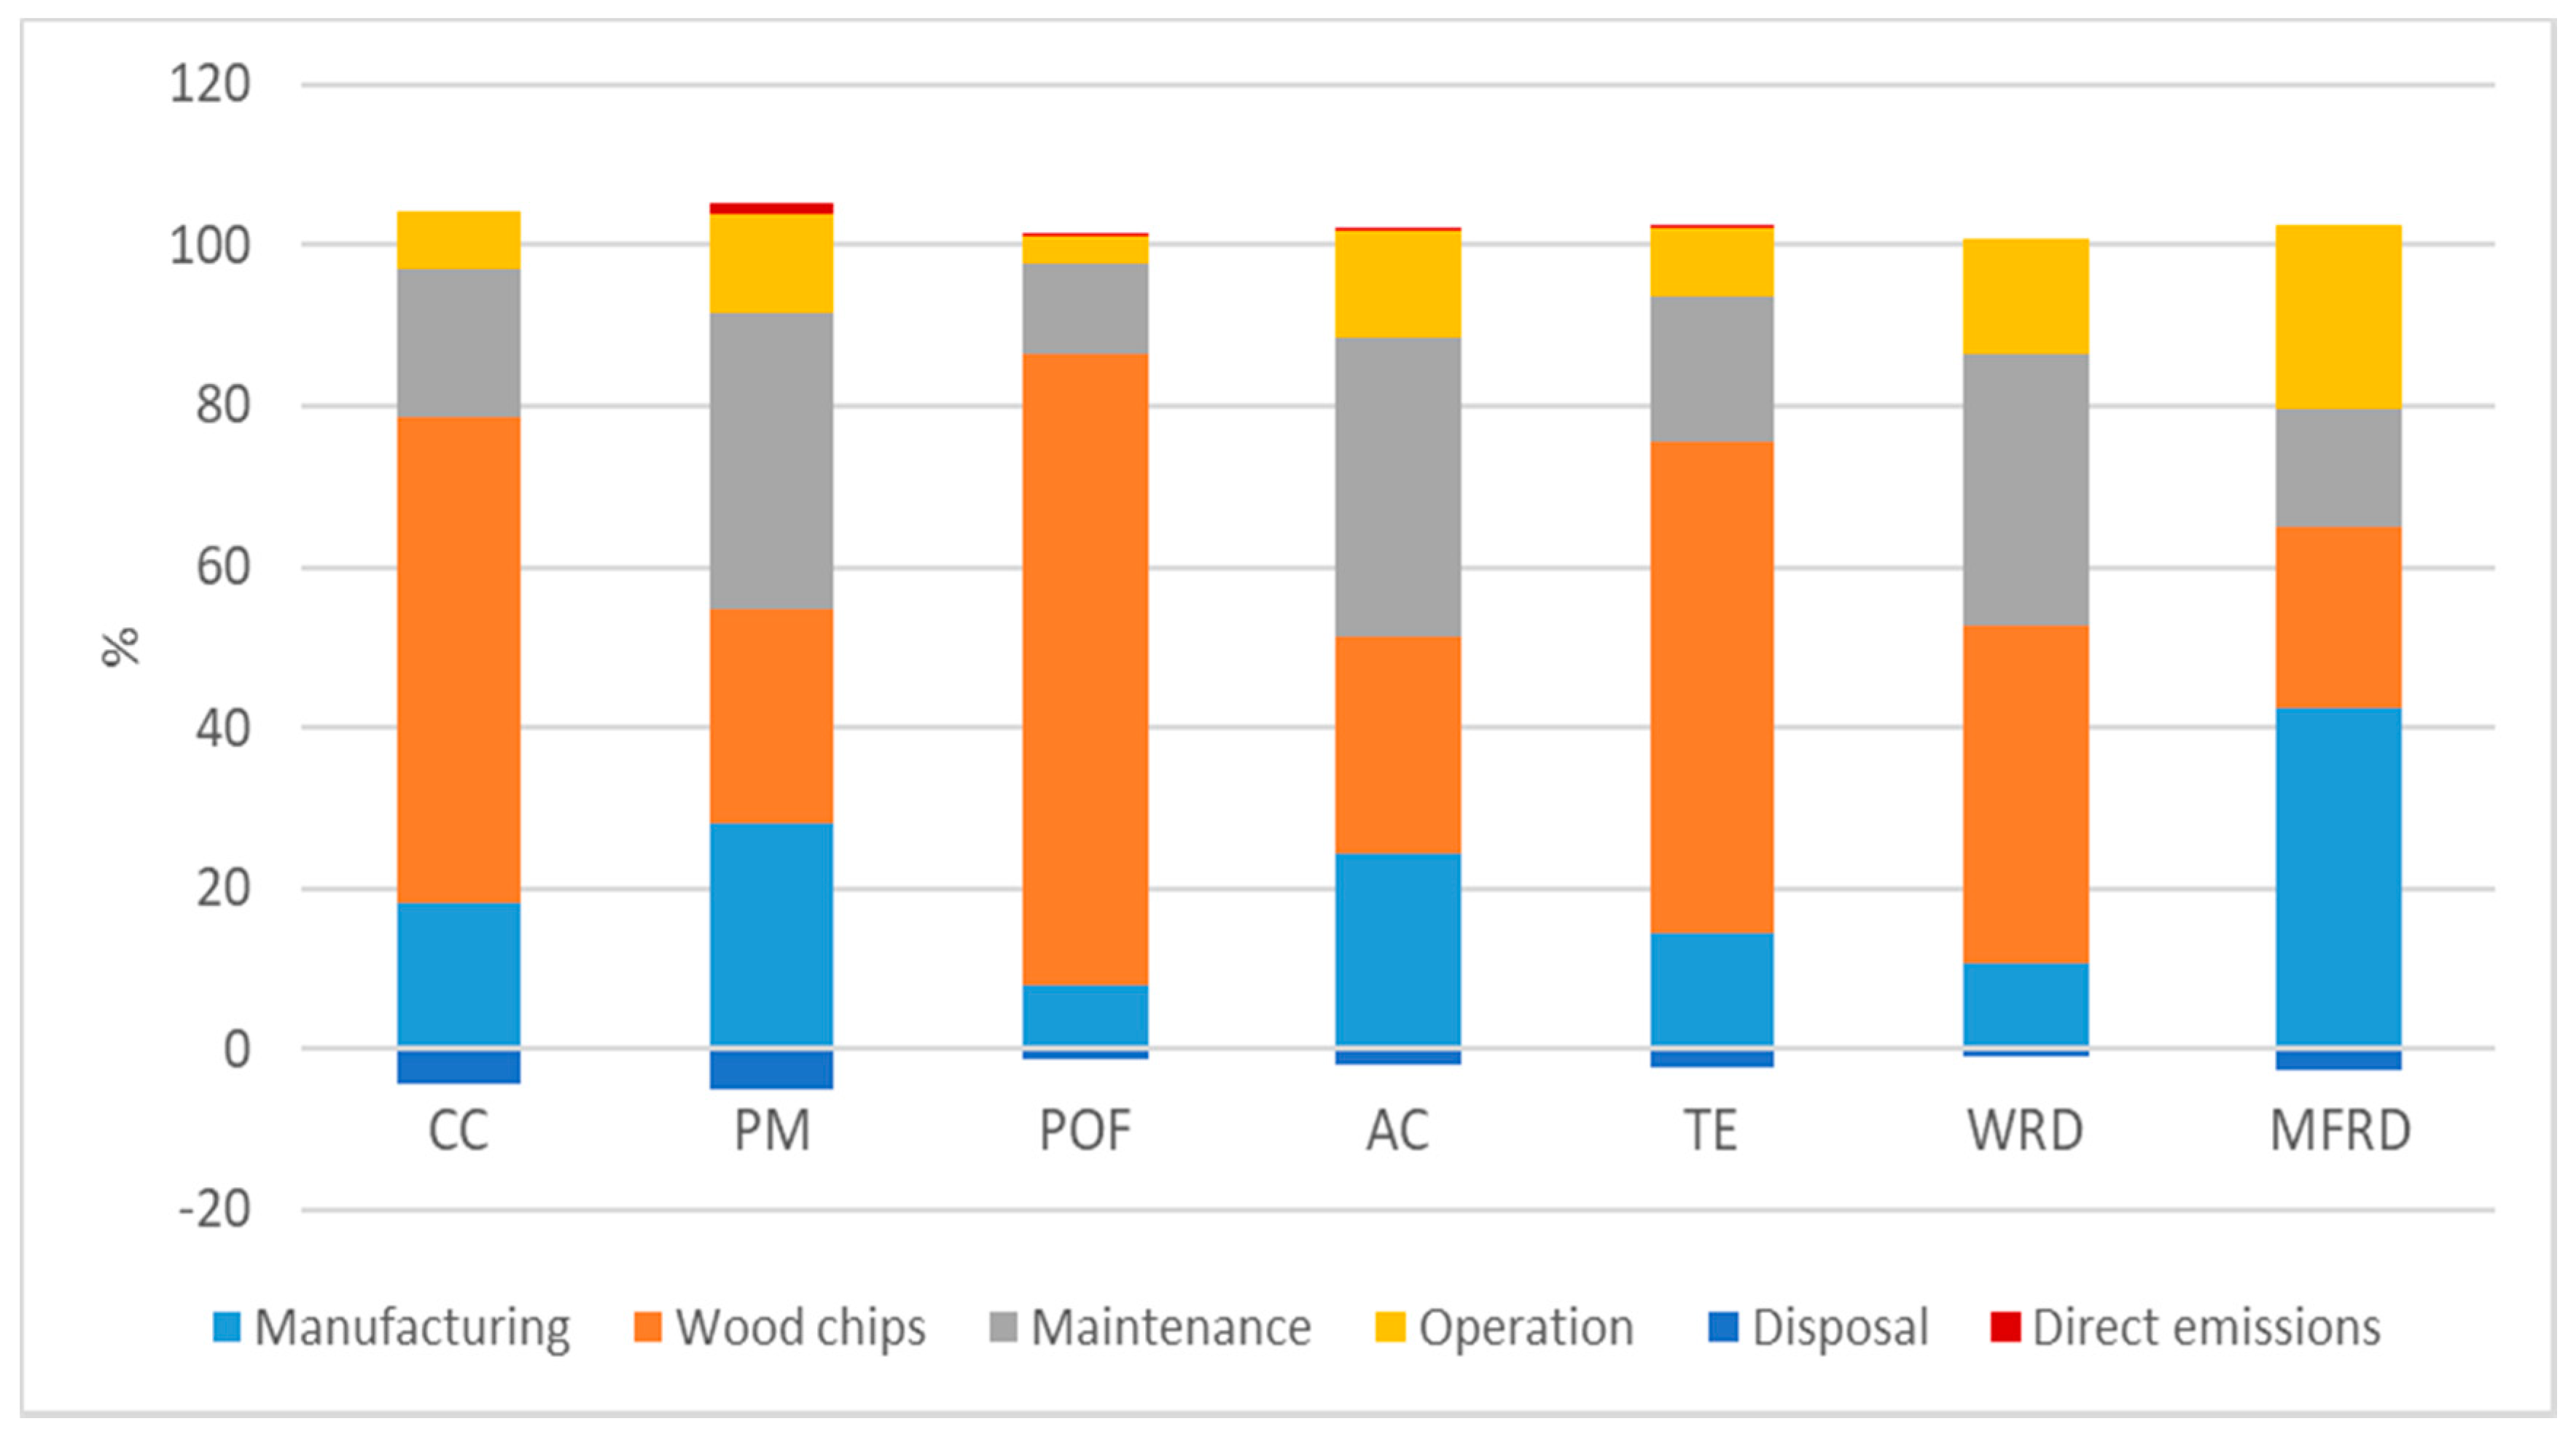
Figure 3.
Main contributions to the cradle-to-grave environmental impact of producing heat and electricity with the HBP technology using wood chips as biomass fuel. The presented breakdown is valid for both functional units. CC = Climate change, PM = Particulate matter, POF = Photochemical ozone formation, AC = Acidification, TE = Terrestrial eutrophication, WRD = Water resource depletion, MFRD = Mineral, fossil, and renewable resource depletion.
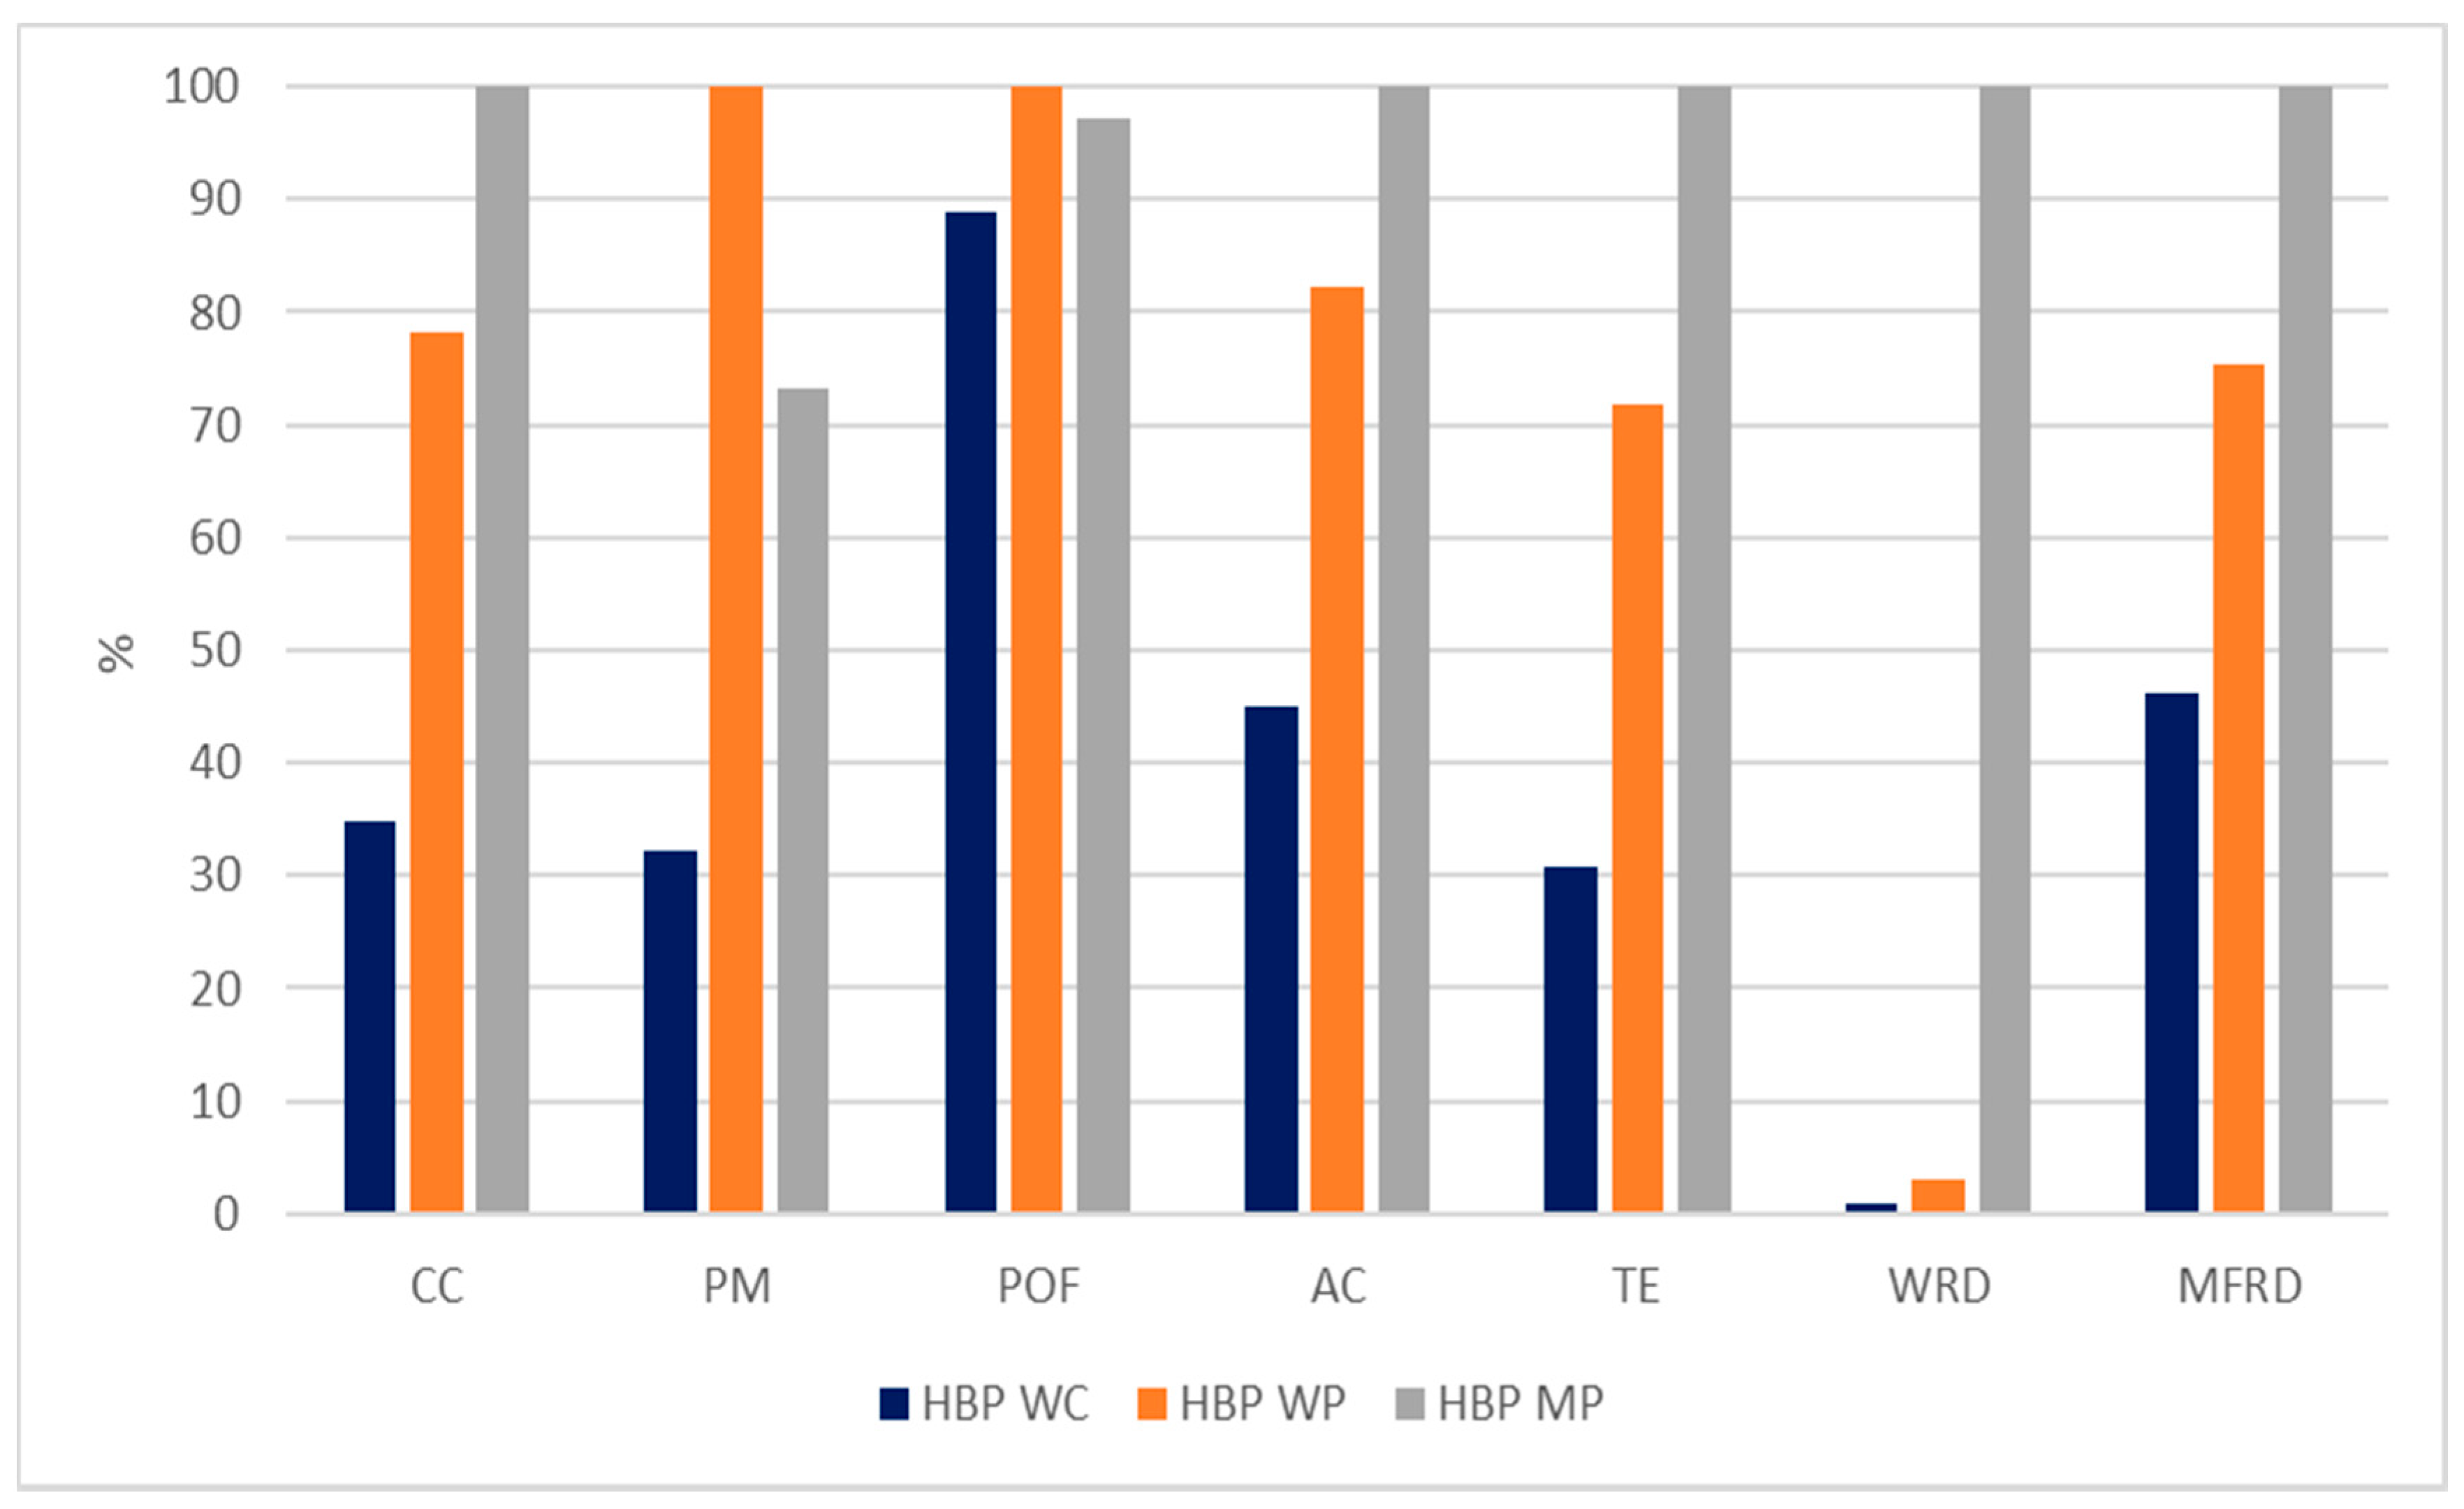
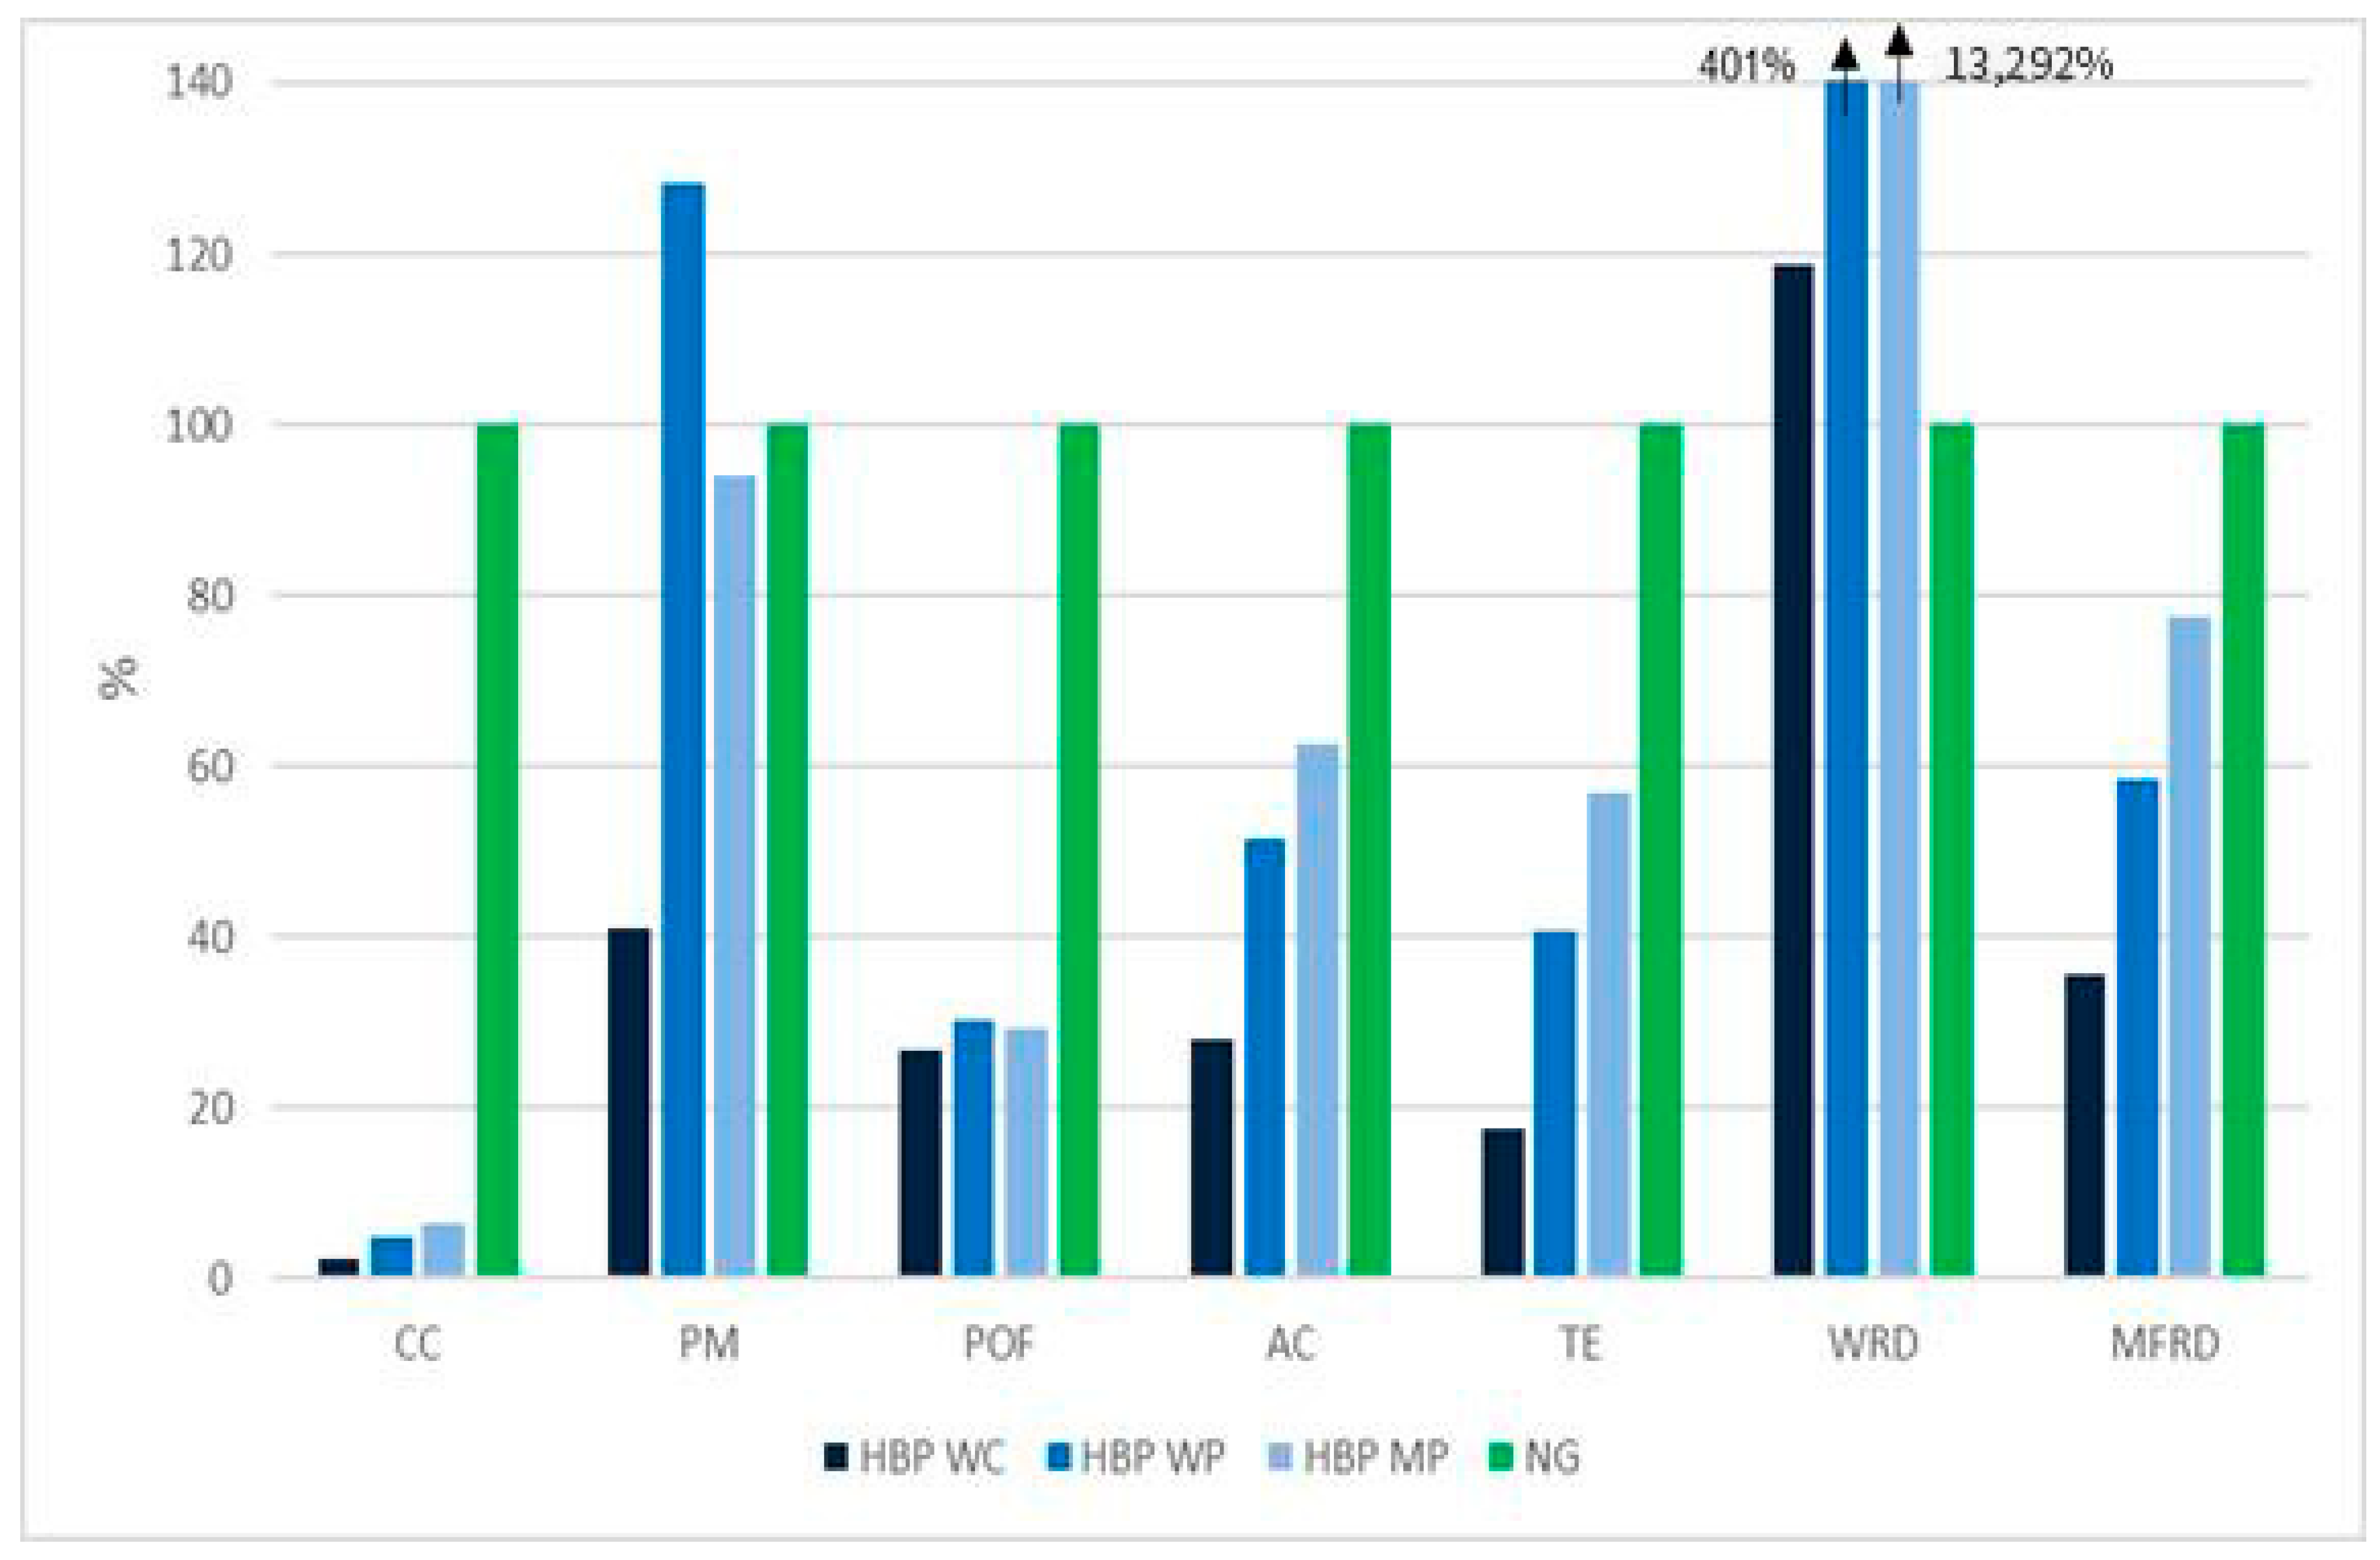
Figure 4.
HBP technology fueled with various biomass fuels (the same graph applies to both 1 MJ heat or 1 kWh electricity). Values are normalized taking as 100% the impacts of the most impacting scenario. CC = Climate change, PM = Particulate matter, POF = Photochemical ozone formation, AC = Acidification, TE = Terrestrial eutrophication, WRD = Water resource depletion, MFRD = Mineral, fossil, and renewable resource depletion. WC = wood chips, WP = wood pellets, MP = Miscanthus pellets.
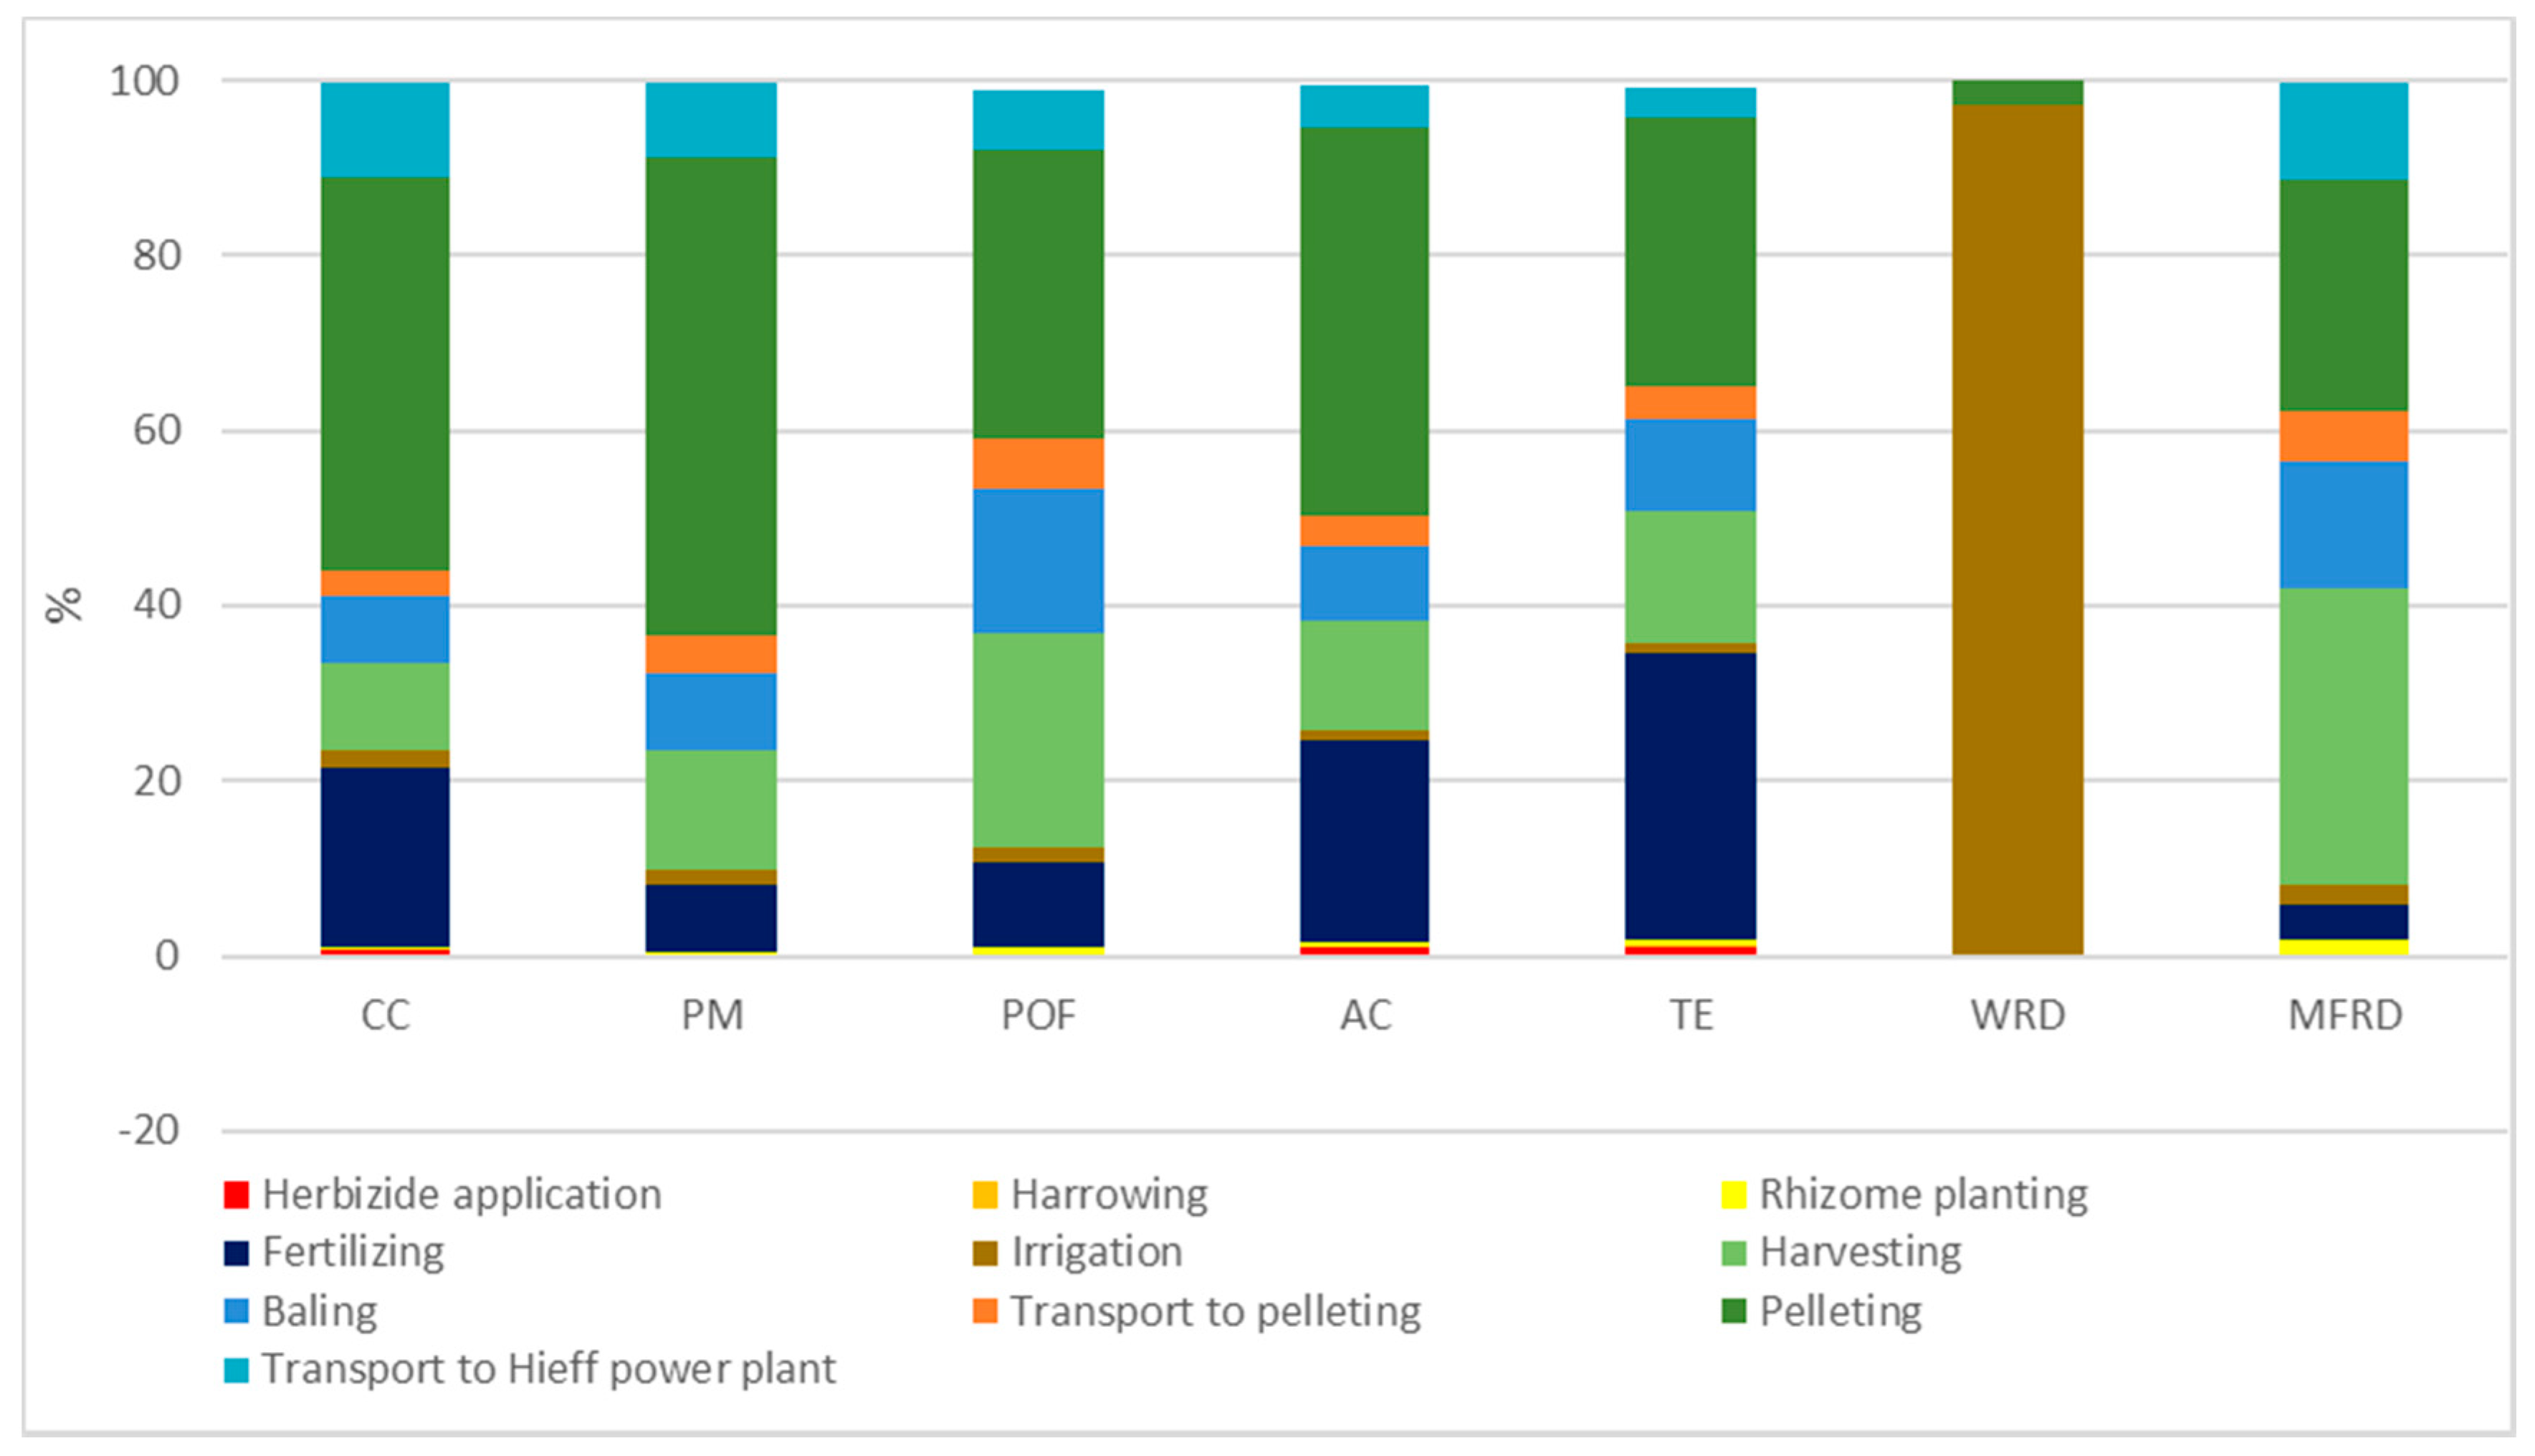
Figure 5.
Main contributions to the environmental impact of Miscanthus pellets supplied to the HBP CHP plant. CC = Climate change, PM = Particulate matter, POF = Photochemical ozone formation, AC = Acidification, TE = Terrestrial eutrophication, WRD = Water resource depletion, MFRD = Mineral, fossil, and renewable resource depletion.
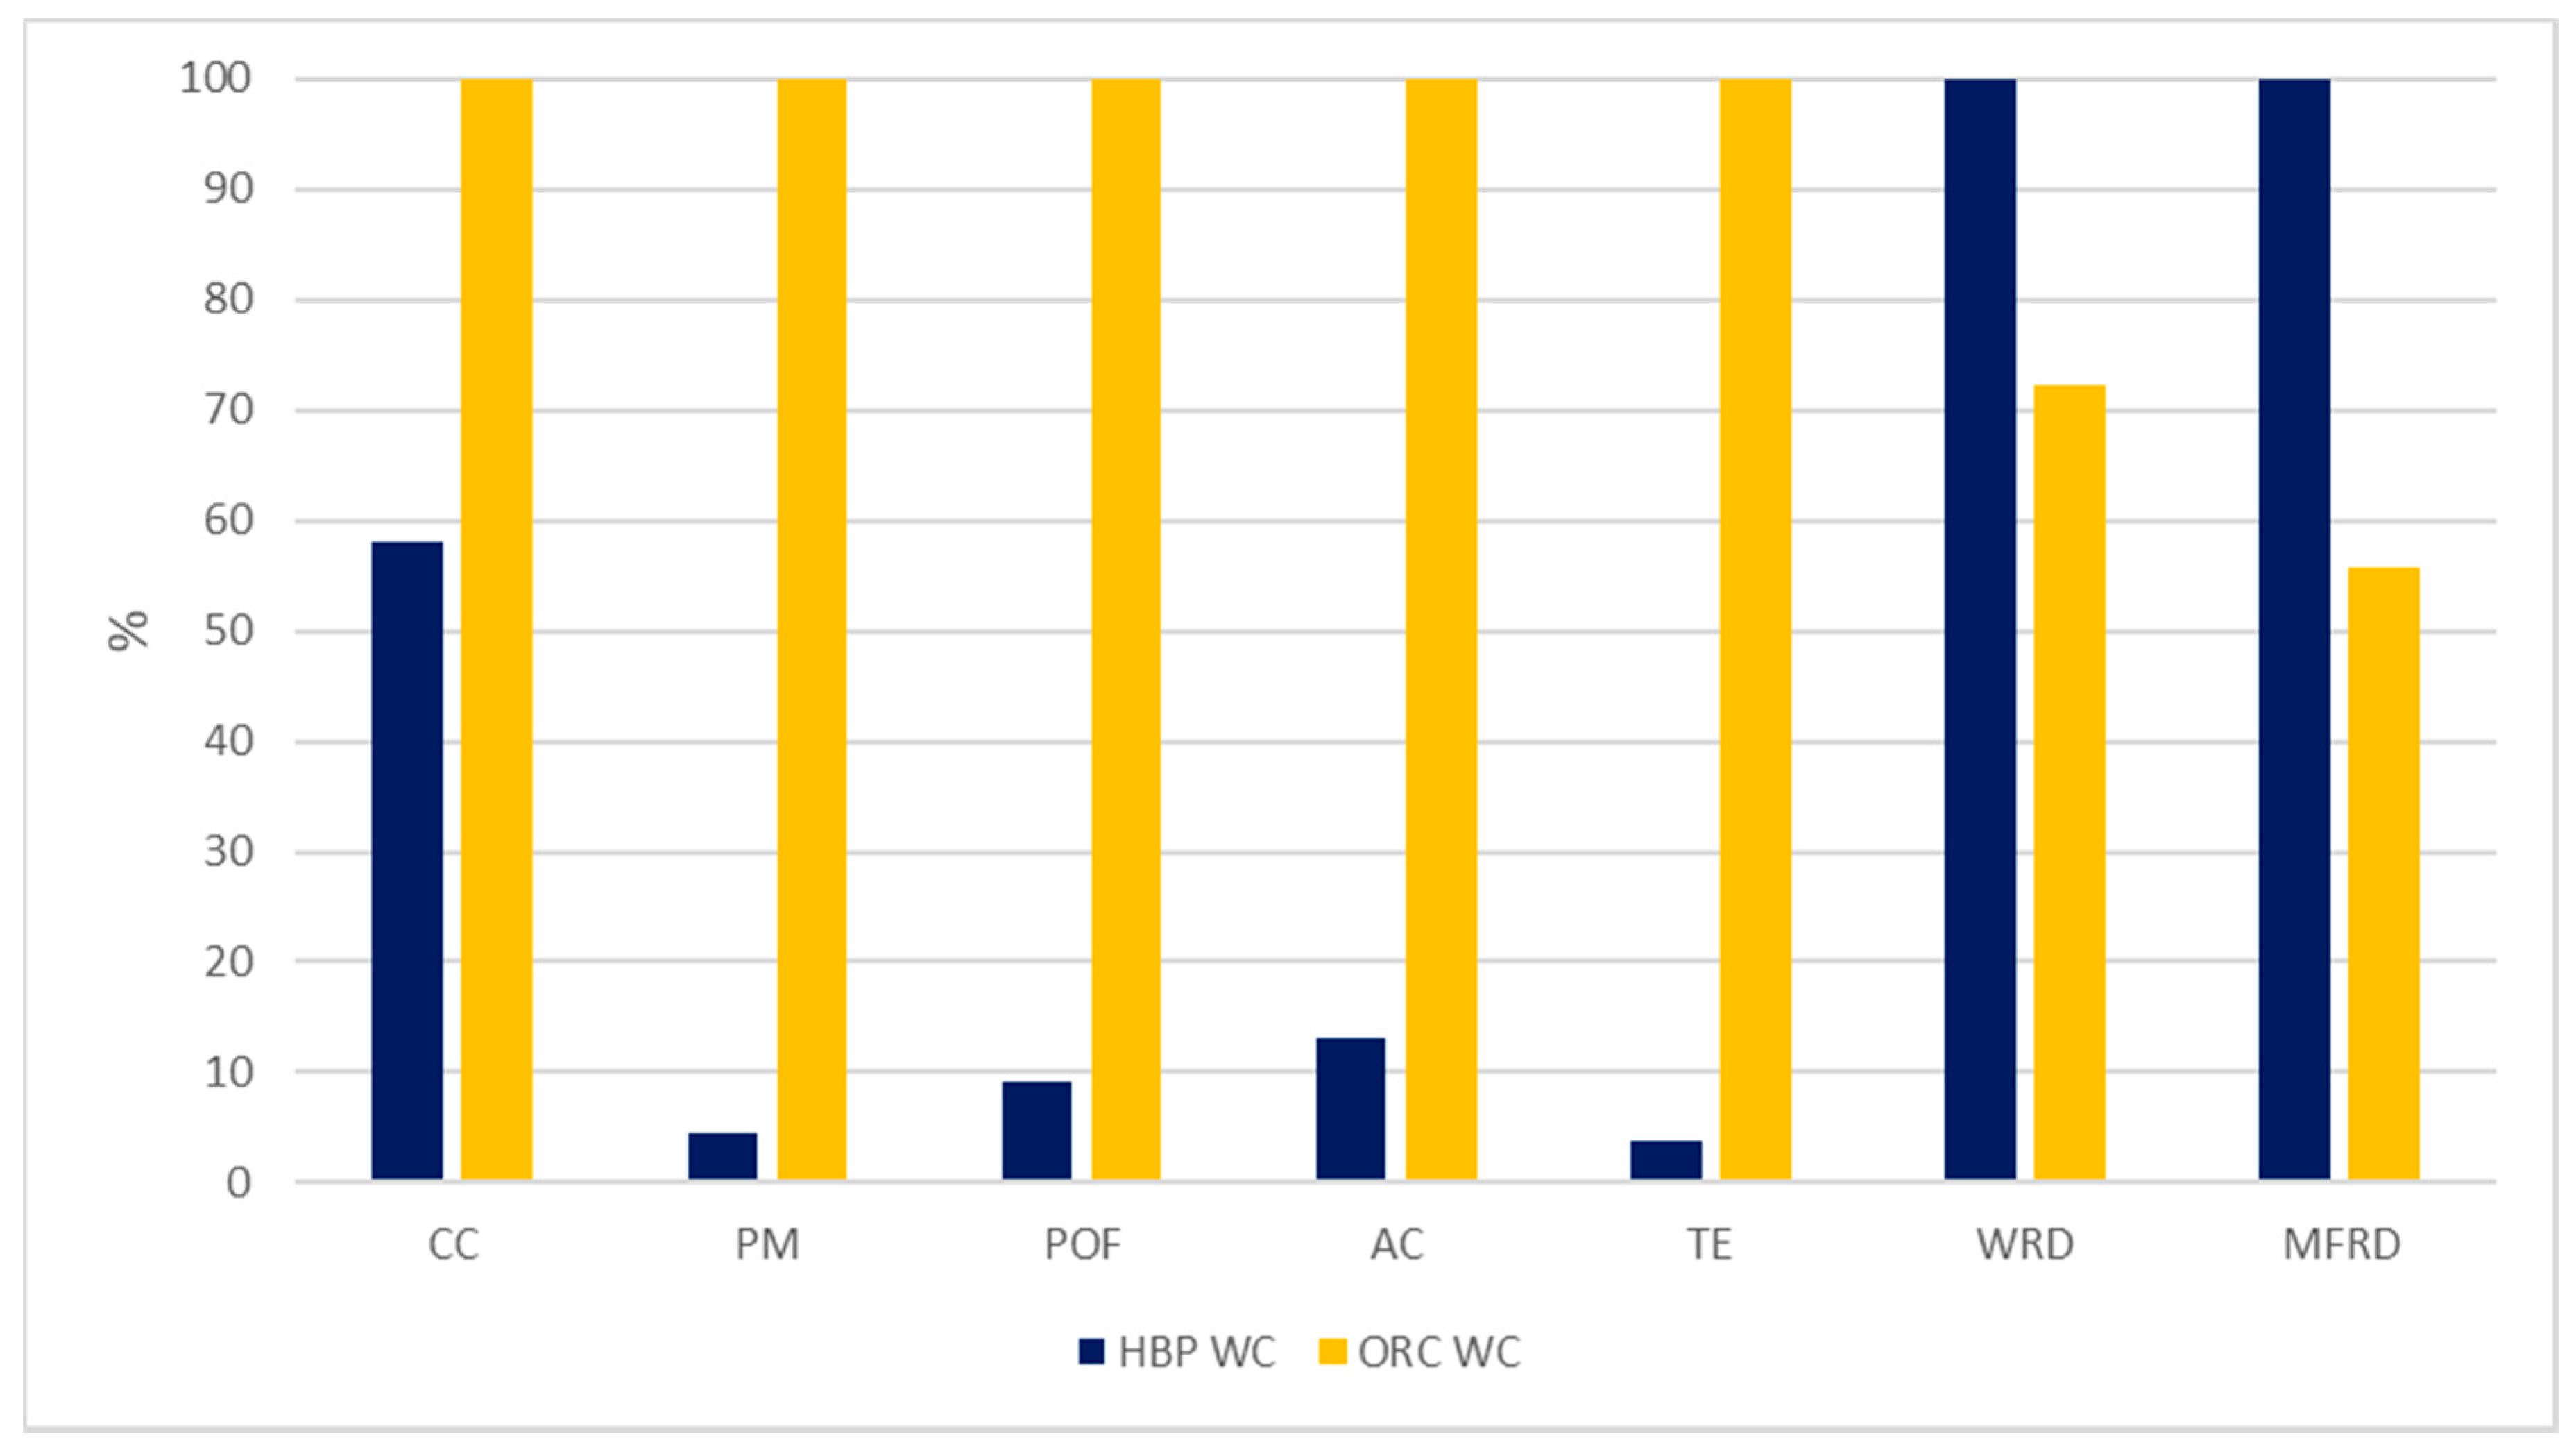
Figure 6.
Comparison of HBP technology with ORC technology for 1 MJ of heat. The graph for 1 kWh electricity shows some minor differences due to a slightly different Carnot factor assumed for ORC technology. Values are normalized with respect to the impacts of the most impacting scenario. CC = Climate change, PM = Particulate matter, POF = Photochemical ozone formation, AC = Acidification, TE = Terrestrial eutrophication, WRD = Water resource depletion, MFRD = Mineral, fossil, and renewable resource depletion. WC = wood chips.
Figure 7.
Comparison of HBP technology with competing technologies (for 1 MJ heat). Values are normalized taking as 100% the impacts of the natural gas boiler. CC = Climate change, PM = Particulate matter, POF = Photochemical ozone formation, AC = Acidification, TE = Terrestrial eutrophication, WRD = Water resource depletion, MFRD = Mineral, fossil, and renewable resource depletion. WC = wood chips, WP = wood pellets, MP = Miscanthus pellets.
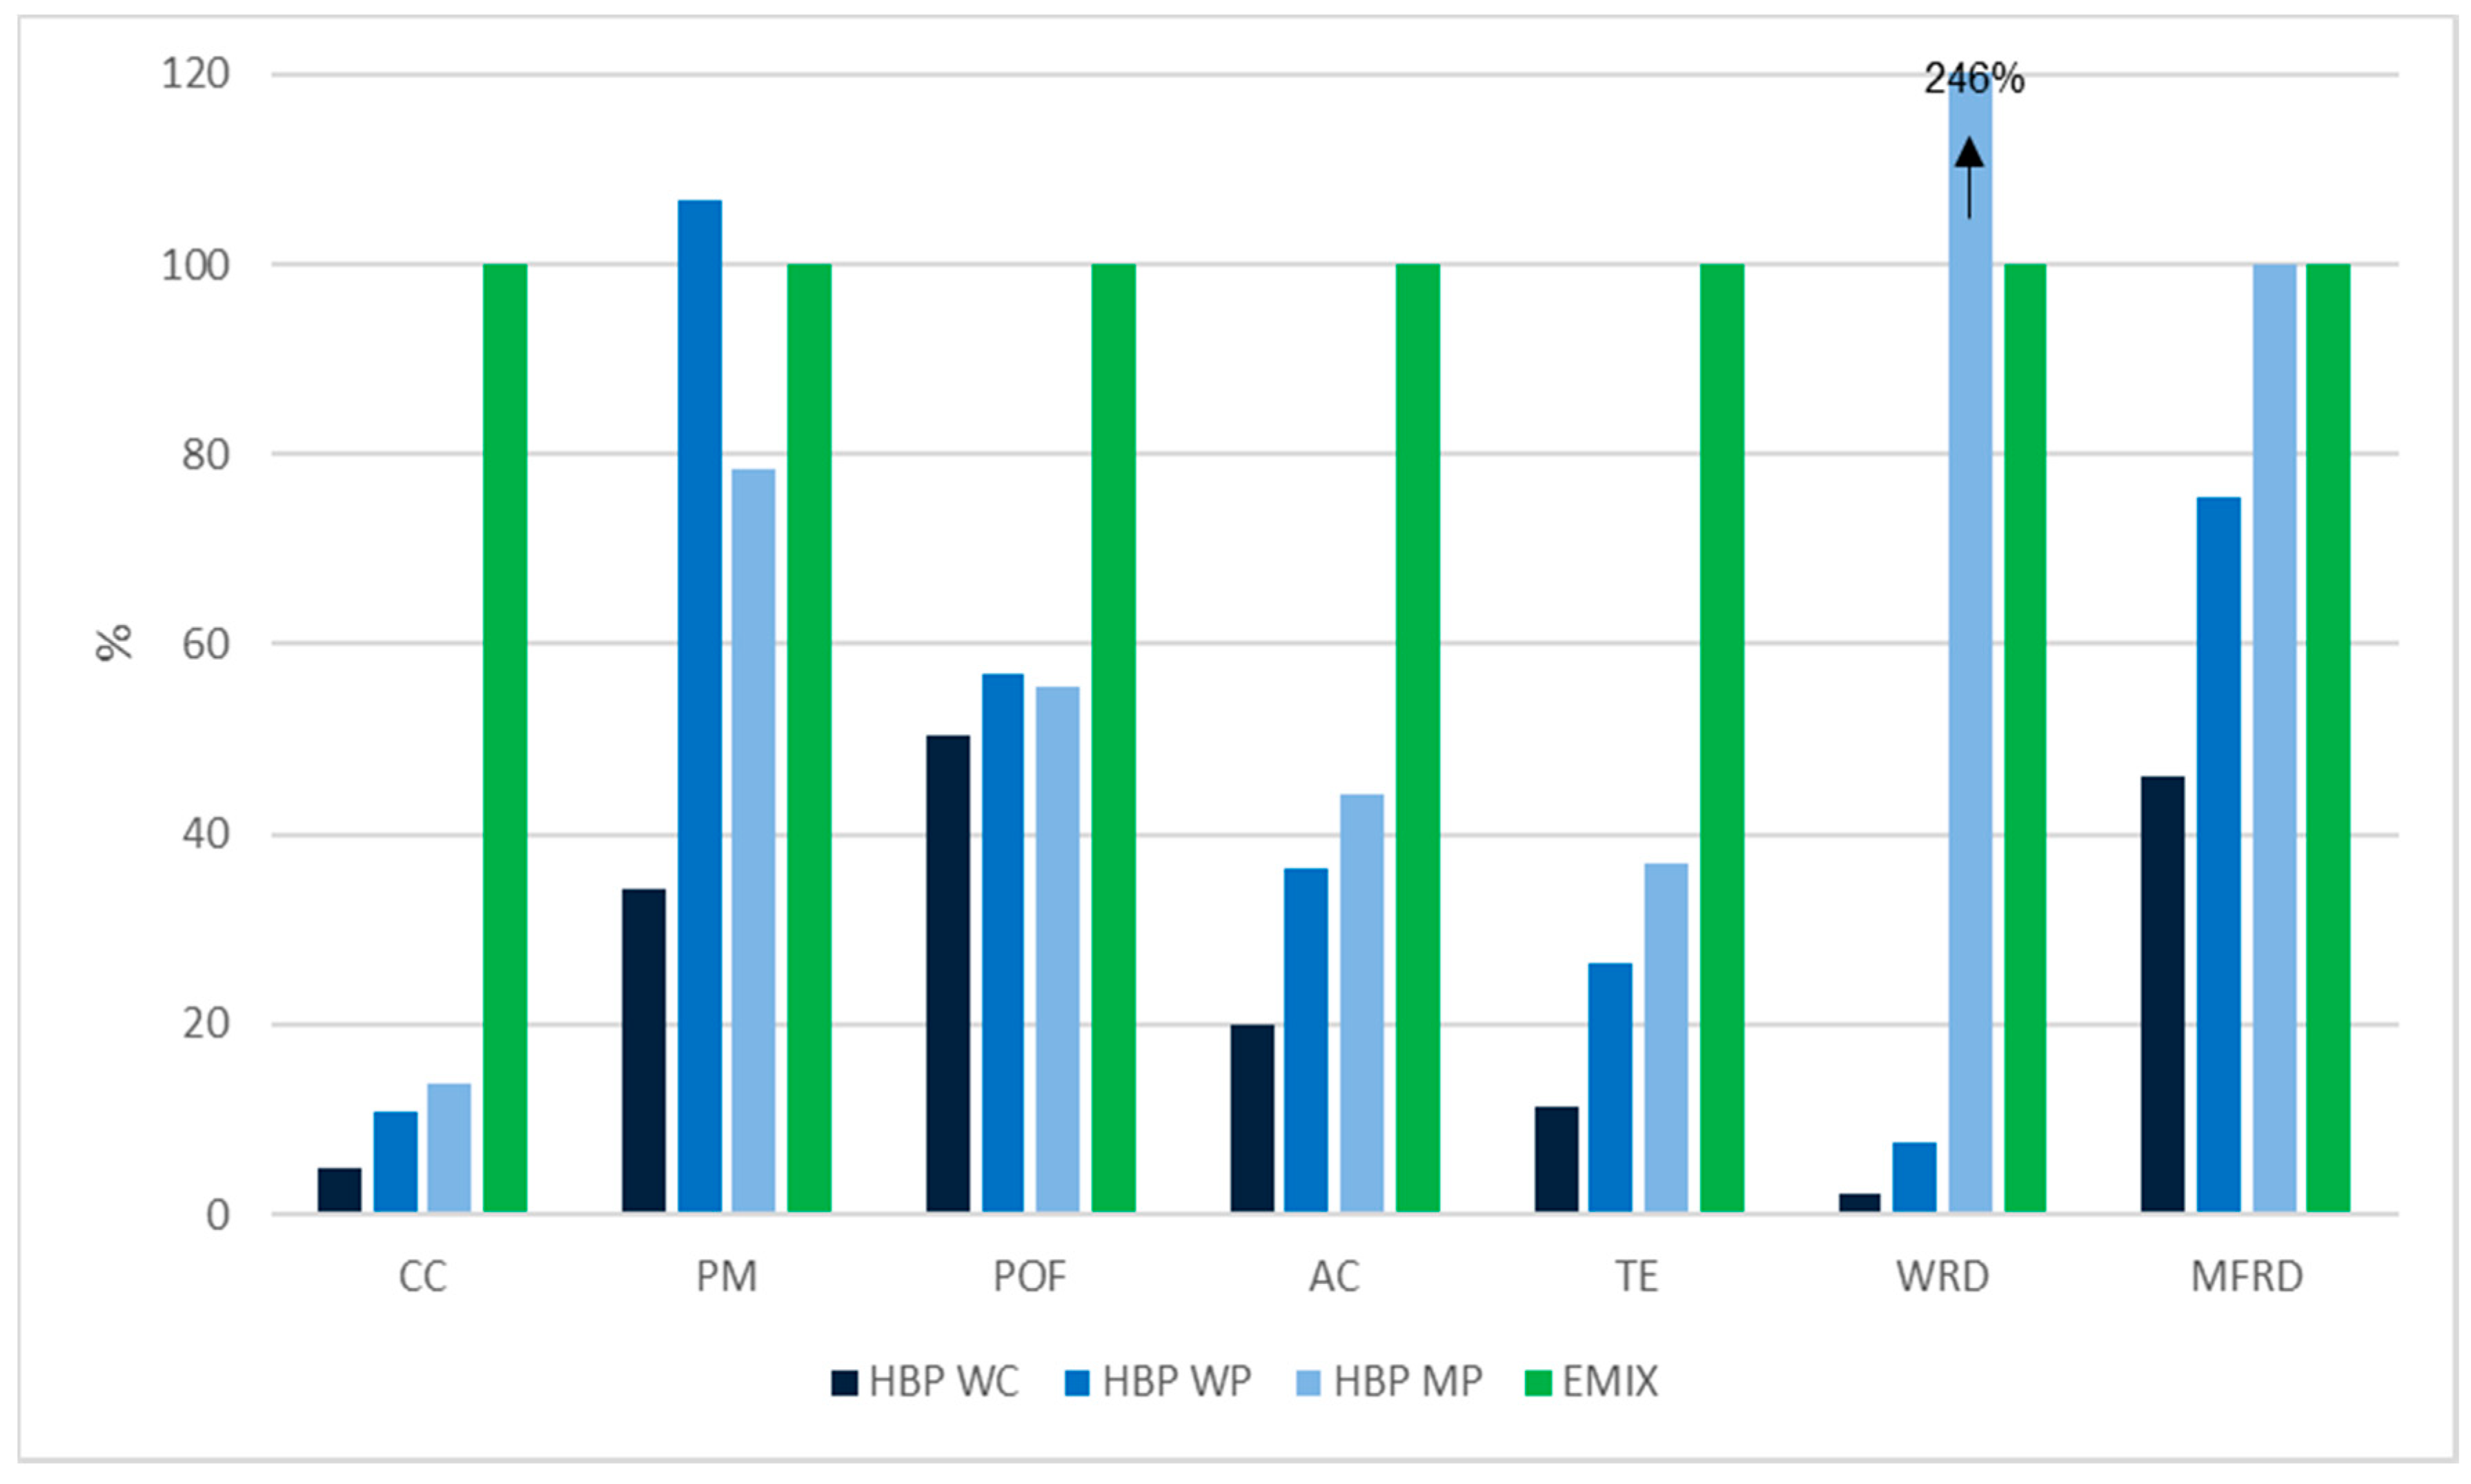
Figure 8.
Comparison of HBP technology with competing technologies (for 1 kWh electricity). Values are normalized taking as 100% the impacts of the German electricity mix. CC=Climate change, PM=Particulate matter, POF = Photochemical ozone formation, AC=Acidification, TE=Terrestrial eutrophication, WRD=Water resource depletion, MFRD = Mineral, fossil, and renewable resource depletion. WC = wood chips, WP = wood pellets, MP = Miscanthus pellets.
Figure 9.
Sensitivity on allocation method for the generation of 1 MJ with HBP technology and competing technologies. Boiler running with natural gas taken as 100%. ORC = Organic Rankine Cycle, NG = Natural gas boiler, (a) = substitution of heat from a biomass boiler.
Figure 9.
Sensitivity on allocation method for the generation of 1 MJ with HBP technology and competing technologies. Boiler running with natural gas taken as 100%. ORC = Organic Rankine Cycle, NG = Natural gas boiler, (a) = substitution of heat from a biomass boiler.
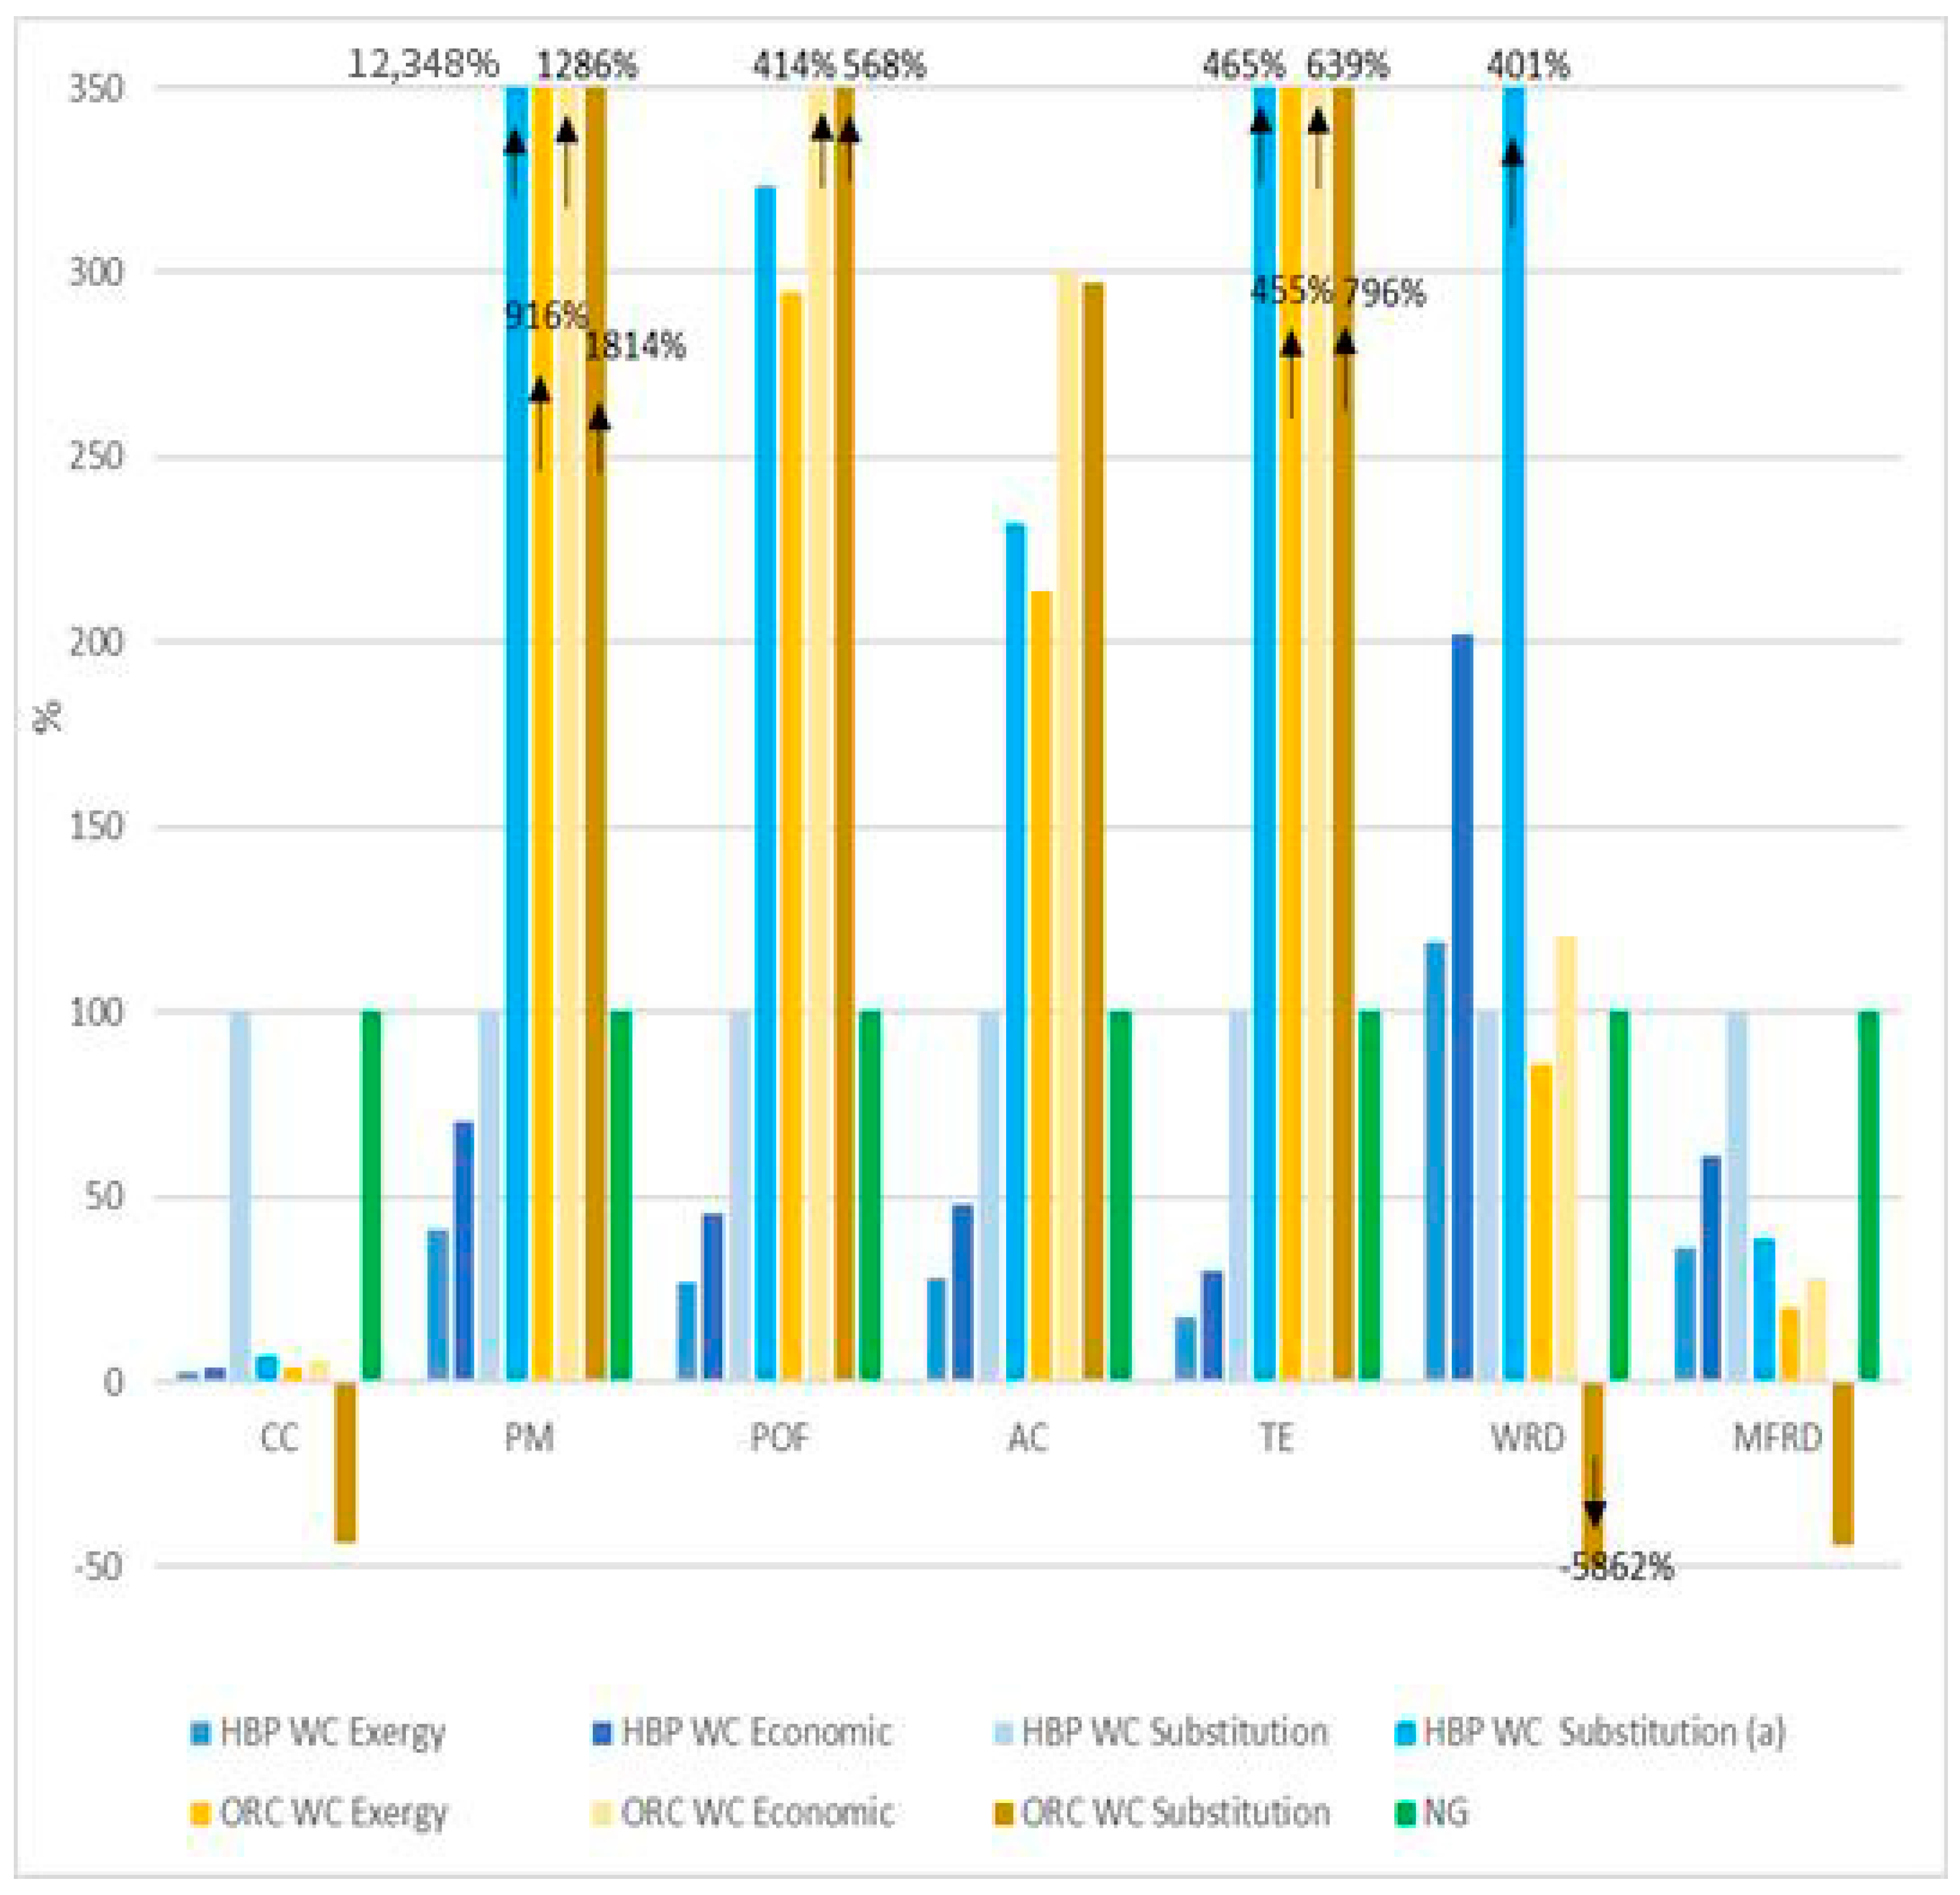
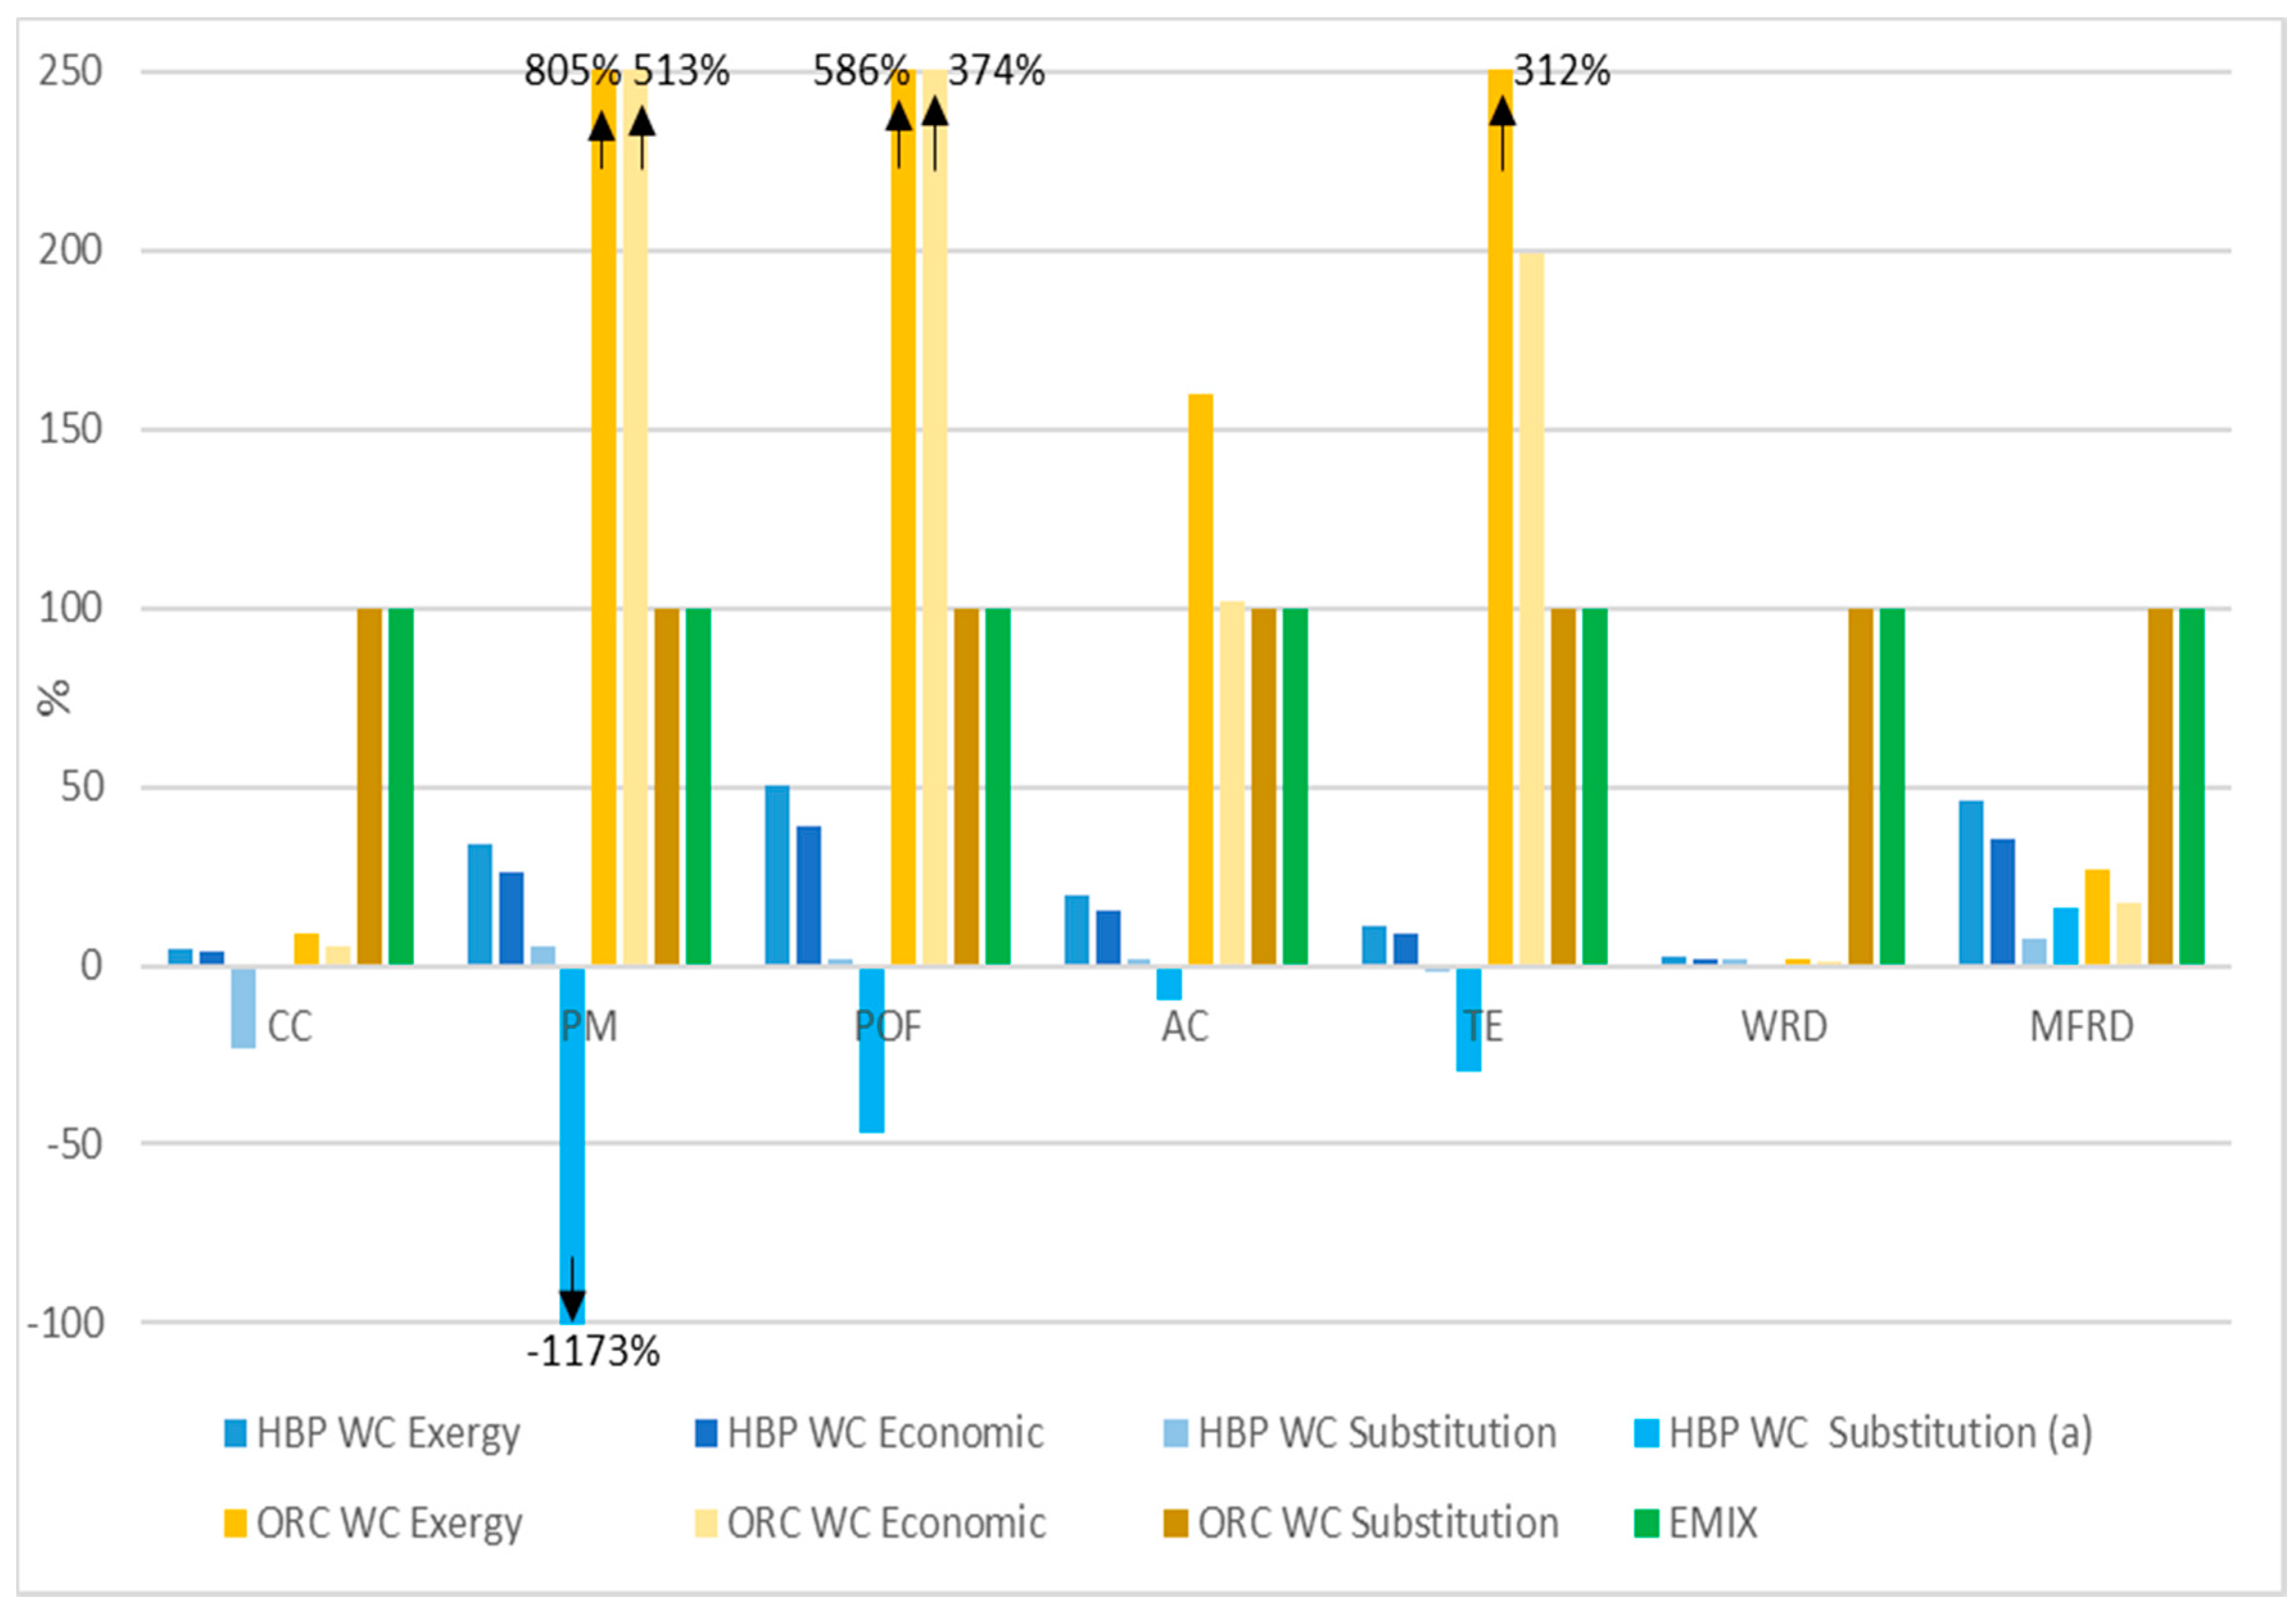
Figure 10.
Sensitivity on allocation method for the generation of 1 kWh with HBP technology and competing technologies (1 kWh electricity). Electricity mix taken as 100%. ORC = Organic Rankine Cycle, EMIX = Electricity mix, (a) = substitution of heat from a biomass boiler.
Figure 10.
Sensitivity on allocation method for the generation of 1 kWh with HBP technology and competing technologies (1 kWh electricity). Electricity mix taken as 100%. ORC = Organic Rankine Cycle, EMIX = Electricity mix, (a) = substitution of heat from a biomass boiler.
Table 1.
Selected impact categories and models.
Table 1.
Selected impact categories and models.
| Impact Category | Unit | Impact Assessment Models |
|---|
| Climate change (CC) | kg CO2eq | IPCC 2013 Global Warming Potential 100 years [30] |
| Particulate matter (PM) | kg PM2.5 eq | Premature death or disability from particulates/respiratory inorganics from [31] |
| Photochemical ozone formation (POF) | kg NMVOC eq | Potential contribution to photochemical ozone formation for Europe from [32] |
| Acidification (AC) | molc H+ eq | Accumulated Exceedance (AE) characterizing the change in critical load exceedance of the sensitive area from [33] |
| Terrestrial eutrophication (TE) | molc N eq | Accumulated Exceedance (AE) characterizing the change in critical load exceedance of the sensitive area from [33] |
| Water resource depletion (WRD) | m3 water eq | Freshwater scarcity: Scarcity-adjusted amount of water used from Swiss Ecoscarcity 2006 [34] |
| Mineral, fossil and renewable resource depletion (MFRD) | kg Sb eq | Depletion of resources based on the scarcity model from [35] |
Table 2.
Characteristics of the small scale HBP technology (8000 h of operations per year). Modeled values.
Table 2.
Characteristics of the small scale HBP technology (8000 h of operations per year). Modeled values.
| Flow (Unit) | Wood Chips (30 wt.%) | Pellets (from Wood and Miscanthus) (5 wt.%) |
|---|
| Biomass fuel (kW) | 548.5 | 570.0 |
| Biomass fuel (kg/h) | 164.1 | 115.7 |
| Gross electric power (kW) | 170.5 | 190.0 |
| Thermal power output (kW) | 288.5 | 292.0 |
| Electrical efficiency gross (%) | 31% | 33% |
| Electrical efficiency net (%) | 30% | 32% |
| Thermal efficiency (%) | 53% | 51% |
| Exergy output as heat (%) | 24.6 | 22.7 |
| Exergy output as electricity (%) | 75.4 | 77.3 |
| Economic output as heat (%) | 41.8 | 39.3 |
| Economic output as electricity (%) | 58.2 | 60.7 |
Table 3.
Materials of the gasifier including the primary gas treatment zone.
Table 3.
Materials of the gasifier including the primary gas treatment zone.
| Material | Amount | Process Dataset |
|---|
| Steel (low alloyed) (kg) | 6770 | Steel, low-alloyed {RER}|steel production, converter, low-alloyed|APOS |
| Stainless steel (kg) | 585 | Steel, chromium steel 18/8, hot rolled {RER}|production|APOS |
| Iron-nickel-chromium alloy (kg) | 220 | Iron-nickel-chromium alloy {RER}|production|APOS |
| Concrete fireproof (kg) | 4480 | Concrete block {DE}|production|APOS |
| insulating material (kg) | 1220 | Glass wool mat {CH}|production|APOS |
Table 4.
Direct emissions (mg) to air per MJ of overall energy output (heat and electricity). OGC = organic gaseous compounds, TSP = total suspended particle, NOX = nitrogen oxides. Maximum values shown in the table were used in the Life Cycle Inventory.
Table 4.
Direct emissions (mg) to air per MJ of overall energy output (heat and electricity). OGC = organic gaseous compounds, TSP = total suspended particle, NOX = nitrogen oxides. Maximum values shown in the table were used in the Life Cycle Inventory.
| Fuel | CO | OGC | TSP | NOX |
|---|
| Wood chips | <20 | <0.01 | <0.01 | <0.01 |
| Pellets | <20 | <0.01 | <0.01 | <0.01 |
Table 5.
Sensitivity analysis on the reduction of the environmental impact of the HBP technology by either increasing the SOFC stack lifetime or using only wood chips produced as industrial by-products.
Table 5.
Sensitivity analysis on the reduction of the environmental impact of the HBP technology by either increasing the SOFC stack lifetime or using only wood chips produced as industrial by-products.
| Impact Category | Industrial Wood Chips Only (Measured in % Variation) | Longer SOFC Stack Lifetime (Measured in % Variation) |
|---|
| Climate change (CC) | −37% | −4% |
| Particulate matter (PM) | −15% | −6% |
| Photochemical ozone formation (POF) | −47% | −2% |
| Acidification (AC) | −16% | −7% |
| Terrestrial eutrophication (TE) | −37% | −4% |
| Water resource depletion (WRD) | +8% | −10% |
| Mineral, fossil, and renewable resource depletion (MFRD) | −10% | −3% |
Table 6.
Sensitivity analysis on the savings of environmental impacts of 1 kWh of electricity produced by the HBP compared to the grid electricity mix (EMIX).
Table 6.
Sensitivity analysis on the savings of environmental impacts of 1 kWh of electricity produced by the HBP compared to the grid electricity mix (EMIX).
| Impact Category | EMIX Germany, Ecoinvent 3.4 | Future EMIX Germany, EU Reference Scenario 2030 | Future EMIX EU, IEA Current Policy Scenario 2030 |
|---|
| 1 kWh Electricity | Savings (%) HBP vs. EMIX | 1 kWh Electricity | Savings (%) HBP vs. EMIX | 1 kWh Electricity | Savings (%) HBP vs. EMIX |
|---|
| Climate change (kg CO2eq) | 6.41 × 10⁻¹ | −95% | 5.61 × 10⁻¹ | −95% | 3.96 × 10⁻¹ | −92% |
| Particulate matter (kg PM2.5 eq) | 7.87 × 10⁻⁵ | −66% | 7.84 × 10⁻⁵ | −66% | 6.74 × 10⁻⁵ | −60% |
| Photochemical ozone formation (kg NMVOC eq) | 6.02 × 10⁻⁴ | −49% | 6.06 × 10⁻⁴ | −50% | 4.98 × 10⁻⁴ | −39% |
| Acidification (molc H+ eq) | 1.58 × 10⁻³ | −80% | 1.35 × 10⁻³ | −77% | 1.12 × 10⁻³ | −72% |
| Terrestrial eutrophication (molc N eq) | 4.33 × 10⁻³ | −89% | 3.86 × 10⁻³ | −87% | 3.49 × 10⁻³ | −86% |
| Water resource depletion (m3 water eq) | 2.75 × 10⁻³ | −98% | 1.32 × 10⁻⁴ | −54% | 4.47 × 10⁻⁴ | −87% |
| Mineral, fossil and renewable resource depletion (kg Sb eq) | 7.47 × 10⁻⁶ | −54% | 7.89 × 10⁻⁶ | −56% | 7.41 × 10⁻⁶ | −54% |

 ,
, 


