Abstract
Using mathematical programming with activity-based costing (ABC) and based on the theory of constraints (TOC), this study proposed a green production model for the traditional paper industry to achieve the purpose of energy saving and carbon emission reduction. The mathematical programming model presented in this paper considers (1) revenue of main products and byproducts, (2) unit-level, batch-level, and product-level activity costs in ABC, (3) labor cost with overtime available, (4) machine cost with capacity expansion, (5) saved electric power and steam costs by using the coal as the main fuel in conjunction with Refuse Derived Fuel (RDF). This model also considers the constraint of the quantity of carbon equivalent of various gases that are allowed to be emitted from the mill paper-making process to conform to the environmental protection policy. A numerical example is used to demonstrate how to apply the model presented in this paper. In addition, sensitivity analysis on the key parameters of the model are used to provide further insights for this research.
1. Introduction
A total of 195 nations signed the Paris Agreement in December 2015 in order to solve the problem of environmental climate change [1]. Green issues have received considerable attentions in many industries worldwide in recent decades [2]. Enterprises have also tried to recover renewable raw materials to achieve profit, as well as to protect the environment [3,4], to actively reduce energy and resource consumption, waste output and virgin material consumption [5].
When implementing environmental strategies, the government should formulate and promote laws and regulations that all industries should comply with, and draw up plans to promote the entire industry, and provide sufficient funds and resources for enterprises [6]. However, when the government faces pressure on limited natural resources and waste disposal, they formulate resource recovery policies [3], and as the public continue to increase pressure on the government in terms of environmental pollution, it forces the government to develop stricter environment regulations and fines for environmental pollution, aiming to reduce the pollution caused by enterprises by adopting environmental management regulations [7]. The purpose of environmental management is to solve the problem of ecological environment pollution during the growth of enterprises [8], and to promote the production efficiency and effective use of raw materials of enterprises, including the use of alternative raw materials, and recycling and reusing raw materials, in order to effectively use raw materials and reduce resource waste [9]. Environmental problems can be considered and solved in the engineering or product development stage, especially through the life cycle assessment (LCA) method [10], where product designers can make a more environmentally friendly design [11]. The solution to environmental pollution largely depends on a combination of pollution prevention technologies and environmental management, which are keys to achieve the goals of environmental protection and pollution reduction. Through process innovations, enterprises can achieve both cost reduction and environment protection [7].
Early paper mills used wood, straw, sugarcane bagasse, and waste paper as raw materials to make pulp, which was used to make paper products. Concern for the environment has forced many enterprises to develop local policies for environment protection. Regarding the paper industry, practicing paper recycling is a cost-reducing choice, as compared to using wood as the raw material [12]. Some paper mills use a variety of waste paper to produce recycled paper, purchase pulp and paper equipment to improve efficiency and reduce the consumption of water and coal by using cogeneration equipment (also known as combined heat and power) in order to efficiently use energy. Then, paper mills can sell excess heat and electricity to recover costs. Coal, given its advantage of low cost, is the main fuel used to power the generator units of the paper industry; however, it greatly influences the environment, for example, the emitted pollutants of Carbon Dioxide (CO2), Sulphur Oxides (SOx), Nitrogen oxides (NOx), and suspended matter, which brings severe harm to the environment. The paper-making process consists of pulping, papermaking, coating, and packing. The waste paper recycling rate in high-income countries is higher than that in less developed countries, meaning that countries with higher economic development need more attention on the problems of waste management and environmental protection [13].
This paper describes the acts related to the environmental management of enterprises, takes the paper industry as an example, and provides feasible pollution prevention and control technologies for the production processes of traditional paper mills. This paper is organized as follows: Section 1 introduces the research background and purposes; Section 2 explores the sustainable management under green paper industry; Section 3 describes the problem statement and model formulation; Section 4 presents a numerical example to demonstrate how to apply the model explored in this paper; Section 5 explains the managerial implications and limitations; and Section 6 offers the conclusions. This study found that enterprises can make full use of production capacity and waste through precise environmentally-friendly production processes to increase profit.
2. Sustainable Management under Green Paper Industry
The consumers and the government have requested companies to achieve a balance between profitability and environmental protection. The demand for integrating environmental awareness and product recycling into supply chain management has become a hot topic [14,15,16]. Sustainable management under green paper industry is described as follows.
2.1. Green Innovation in Paper Industry
Green innovation brings competitive advantages to the paper industry; since it helps enterprises reduce costs and increase income, some analysts have put forward that improving a company’s environmental performance can result in better economic and financial results, instead of increasing costs [17,18,19]. The green innovation modes are described as green manufacturing and contamination control. Green manufacturing helps to reduce waste, control pollution [20], and improve energy efficiency and production processes through the integration of the production value chain, in order to elevate the efficiency of greenhouse gas reduction. Pollution prevention helps enterprises to reduce, transform, and prevent pollutants and wastewater by improving their internal processes, including changing production modes and means of transport [9], redesigning products and manufacturing modes, as well as recycling to prevent enterprise pollution [21]. More and more manufacturing companies are taking the environment into consideration before conducting their activities, a trend that is gaining support from the management level [22]. In fact, enterprise efforts in green manufacturing and pollution prevention will pave their way to a greener economy [23]. As the digital wave has swept across the world in recent years, it has indirectly impacted the traditional papermaking industry. This study analyzes successful cases where green manufacturing and pollution prevention are adopted prior to providing methods for increasing the utilization level of raw materials and effective waste recycling for the traditional paper industry, where coal-fired boilers still prevail.
2.2. MIP Model for Green Paper Industry
A Mix-Integer Programming (MIP) model is used to solve problems in the allocation and disposition of limited resource [24], which can effectively handle the multi-item inventory problem in the periodic replenishment plan (replenishment cycles are scheduled) [25], in order to optimize inventory distribution and production plans [26], solve the multilevel capacitated lot-sizing and scheduling problem [27], and provide enterprises with simultaneous multiple decision-making schemes [28]. Therefore, this model can be used for decision-making evaluations for enterprises to estimate operating costs and maximize profit [29,30]. In order to save costs, while the traditional paper industry still widely uses coal to power its boilers, coal is a major source of environmental pollution. The ideal mode of production for this industry is to make full use of raw materials in the production process and to recycle the waste. Using mixed integer linear programming models to optimize the production plan of the paper industry and reduce inventory is an issue recently discussed by the paper industry; it concludes that the application of activity-based costing (ABC) and theory of constraints (TOC) can solve the above problems [31,32]. The paper industry has used the ABC model for cost modeling, as well as analysis of the production flow [33]. The TOC could reduce the inventory and costs of mills [34], and overcome the bottleneck of resource limitation in the production process, thereby enhancing production efficiency [35]. Enterprises can use the ABC and TOC in their decision-making [36], as well as the linear programming (LP) model, to solve product mix decision problems [37,38]. As their complementary nature has gradually formed a trend, this model is expected to become a future trend; thus, this study adopts ABC and TOC to build an environmentally-friendly process model for the paper industry, and for discussion.
2.3. ABC and TOC
ABC is based on two stages, and is an extension of modern cost accounting in order to increase the accuracy of cost calculations. The common expenditures (e.g., management fees) of a business are assigned to activities, and then activity costs are traced to products [39]. On the other hand, TOC enhances scientific decision-making in production plans. According to the principles of TOC, enterprises can analyze manufacturing obstacles, increase their upper limit profits [40], and deal with the interactions of supply constraints through an improved product-mix [41]. Therefore, prominent business corporations will apply ABC and TOC to production planning in order to increase their total profits [42] and enhance the operational efficiency and immediateness of distribution centers [43]. Hence, ABC, TOC, and MIP can be adopted by enterprises during their decision-making processes on product portfolios [2,37,44,45].
Based on ABC and TOC, a model presented in this paper can be applied to the green supply chain [46] by using the Mathematical Programming Approach. In terms of the green nature of resources, it can also be applied to building municipal waste recycling systems, regional sewage streams [47], as well as solid waste collection and transportation systems [48]. The optimal process of waste collection and transportation to an incinerator can thus be planned [49]. In this study, the raw materials for green recycled paper are pulp substitutes, clean waste paper, and ordinary waste paper. The products of recycling paper mills are discussed according to the direct combinations of the aforesaid three materials, while ABC, TOC, and the Mathematical Programming Approach are used to plan new types of energy saving and carbon emission reduction activities for enterprises, in order to maximize profit.
3. Problem Statement and Model Formulation
This section takes the paper industry as an example. The green production flow for recycled paper is shown in Figure 1.
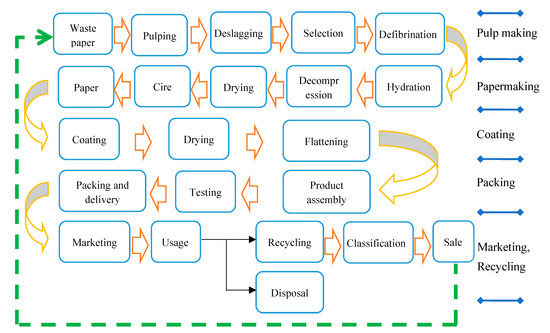
Figure 1.
The papermaking process.
The recycled paper company of this case uses purchased pulp and waste paper as raw materials to produce paper products. The manufacturing process consists of pulping, papermaking, coating, and packing. In consideration of costs, in addition to saving water, coal and RDF-5 are used as the main fuels, and the cogeneration equipment integrates steam and electric energy for efficient energy use. The efficient application of waste could increase the profit for enterprises. The optimum mathematical programming decision model, as employed by the recycled paper mill, combines its processes with ABC to meet environmental protection requirements, while considering the maximization of corporate profit.
3.1. The Objective Function
The objective of this model is to maximize the total profit; the total corporate profit function is as follows:
In Equation (1), the total corporate profit is calculated by subtracting various costs/expenses from main products revenue, relevant byproducts revenue, and electric power and steam costs saved. The revenues and costs/expenses and their associated constraints will be described in the following subsections.
3.2. Revenue of Main Products and Byproducts
In the product manufacturing process, the mill uses an Electrostatic Precipitator (ESP) and a Flue-Gas Desulfurization (FGD) to reduce the environmental pollution of the production processes, and to recover any waste byproducts for resale. If the price of the main products and relevant byproducts are represented by and cs, respectively, and the quantity of byproduct s of product i is bisXi, then the revenue of main products and relevant byproducts are expressed as and , respectively.
3.3. Direct Material and Expense
In the preparation phase of papermaking, the purchase unit preliminarily sets the prices of various raw materials () for each product () after investigating the market prices. There are one to n products and one to s raw materials. The total direct material cost is the fifth term of Equation (1), . The decision-maker decides the maximum resources () available for each raw material according to the actual cost information previously provided by the accounting division, expressed as Equation (2).
3.4. Unit-Level Activity Cost
Unit-level activity is executed one time for each unit of a product. Thus, the total unit-level activity cost is the sixth term of Equation (1), , where is the activity driver demand of unit-level activity j (j ∈ U) of one unit product i and is the running activity cost per activity driver for activity j.
3.5. Direct Labor Cost
In mill operation, employee operation modes are divided into normal work and overtime work, as shown in Figure 2. The labor hours of normal work are in the range of [0, ], and the cost is at . When the mill receives a large order, and must complete the work quickly, the employees may work overtime. At this point, labor hours are in the range of [, ], and the cost increases from to . The total labor cost is the seventh term of Equation (1), ( ), and the associated constraints are expressed as Equations (3) to (8), where TL in Equation (3) is the total labor hours needed for the company.
is a SOS1 set of 0–1 variables, within which exactly one variable must be non-zero; is a SOS2 set of non-negative variables, within which at most two adjacent variables, in the order given to the set, can be non-zero. When the papermaking activities are completed by normal work, then and (from Equation (9), and it is in the first segment of Figure 2; (from Equations (4) and (5)) and (from Equation (6)); and (from Equation (7)). Thus, the total direct labor hours required is (from Equation (3)), and is the linear combination of 0 and . Similarly, when the papermaking activities need overtime work, then , , , , , and the total direct labor hours () required will be the linear combination of and .
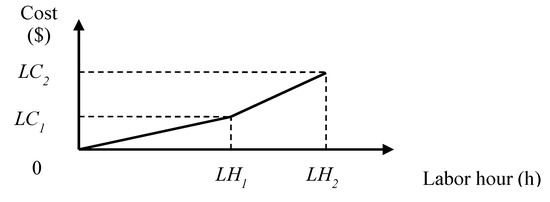
Figure 2.
Piecewise direct labor cost.
3.6. Batch-Level Activity Cost
In ABC, batch-level activity is executed one time for each batch of a product. The total batch-level activity cost is the eighth term of Equation (1), , and the associated constraints are Equations (9) and (10):
Equation (9) is the constraint of the quantity of product i, and Equation (10) is the constraint of resource available for batch-level activity j. If the batch-level activity is the activity “Setup”, then Equation (10) may mean that the setup hour available for the batch-level activity “Setup” is .
3.7. Product-Level Activity Cost
In ABC, the product-level activity is the activity consumed by a specific product. The total product-level activity cost is the ninth term of Equation (1), , and the associated constraints are expressed in Equations (11) and (12).
Equation (11) is the constraint of the quantity of product i, and Equation (12) is the constraint of resource available for product-level activity j. If the product-level activity is the activity “Product Design”, then Equation (12) may mean that the Computer-Aided Design (CAD) hour available for the product-level activity “Product Design” is .
3.8. Machine Cost
In this paper, it is assumed that machine capacity can be expanded to various levels, as shown in Figure 3 [50]. Assume that the current machine hours available for use are , and the machine cost is , i.e., the depreciation of machines. If the machine hours increase to , the machine cost will be after buying or renting additional machines. When the machine hours exceed the upper limit of and reach the range of ,, the machine cost will increase to .
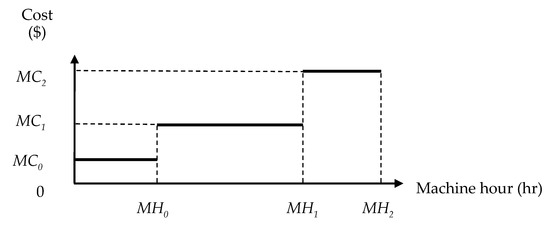
Figure 3.
Stepwise machine cost.
Total machine cost is the tenth term of Equation (1), , and the associated constraints are expressed as Equations (13) and (14).
is the total machine hours needed for all products; is a special ordered set of type 1 (SOS1) of 0–1 variables, within which exactly one variable must be non-zero. If = 1, then it is within the current level of machine capacity, i.e., . Then, (from Equation (13)) and total machine cost is (from Equation (1)). If = 1, then the machine hours increase to the interval , ; it is in the first expansion level of machine capacity, i.e., . Then, (from Equation (13)) and total machine cost is (from Equation (1)). Similarly, if = 1, then the machine hours increase to the interval ,, within the kth expansion level of machine capacity, i.e., . Then, (from Equation (13)) and total machine cost is (from Equation (1)).
3.9. Benefit of Using RDF-5
The mill uses cogeneration equipment to take advantage of steam and electric energies; therefore, when the consumption of coal and RDF-5 reaches a certain level, per unit steam energy and electric energy costs decrease. Given the power supply, steam supply, and heat supply benefits, RDF-5 can be used in mechanical bed boilers and fluidized bed furnaces as the main or auxiliary fuel for multifuel combustion. Therefore, the electric power and steam costs saved by using RDF-5 are considered in this paper.
First, the saved electric power cost is the sum of saved steam costs () at m power rates, i.e., the third term of Equation (1), . In the paper-making process, the steam cost saved by using RDF has different conversion benefits due to different degrees of saving electric costs, expressed as Equation (15). The mill adopts the appropriate type of the aforesaid m rates according to the actual state of saving, or allocates according to appropriate proportions in two adjacent schemes, where the sum of the allocation proportions is 1, expressed as Equation (16).
Constraints:
The steam cost saved is the sum of the saved electric costs () at t power rates, i.e., the fourth term of Equation (1), . In the paper-making process, the steam cost saved by using RDF has different conversion benefits due to different degrees of electric costs savings, expressed as Equation (17). The mill adopts an appropriate type of the aforesaid n rates according to the actual state of saving, or allocates according to appropriate proportions in two adjacent schemes, where the sum of allocation proportions is 1, expressed as Equation (18).
The quantity of carbon equivalent of various gases allowed to be emitted from the mill paper-making process is G in order to conform to the environmental protection policy, as shown in Equation (19).
4. Numerical Example
This section provides an example that describes how to apply ABC and TOC to the Mathematical Programming Approach, in order to determine the optimal product mix.
4.1. Description of the Case Problem
In response to environmental protection, Company A of the paper industry has recently used recycled pulp substitutes, clean waste paper, and ordinary waste paper, as the raw materials for paper products. The mixture of the three raw materials can be used to make three kinds of products. Considering the cost, coal remains in use for power generation, and the cogeneration coal-fired machine is used to take full advantage of electric energy and heat energy. The sewage and waste in the production process are properly treated, and a part of the waste is made into RDF-5, which is used together with the coal for cogeneration in the coal-fired machine. In order to take full advantage of resources and exploit financial resources, Company A sells the surplus electric energy of the process to the power company, while the heat energy is sold to nearby residential buildings. In response to environmental protection, the sludge treated from sewage is made into organic compost, while the ash from the incineration treatment is made into cement products. The residual fly ash from the power generation of the coal-fired machine is made into construction materials, the bottom ash is made into structural building materials, and the FGD gypsum is made into fire plate materials. In order to simplify the computing model, the machine costs and labor costs in this section are equally allocated to the unit-level activity of the main products. The costs in the production process include: (1) unit-level activity: including the costs of the three direct materials, direct expenses, required machine hours, and labor hours in the production process; (2) batch-level activity: including pulping costs, papermaking costs, coating costs, and packing costs of the general paper making process; (3) product-level activity: i.e., product design cost; (4) facility-level cost: the environmental management cost refers to the costs related to routine inspections, effluence, and ensuring the process conforms to the environmental standard assessment specifications as regulated by local government; and the benefit of using RDF-5 is provided.
This paper uses Company A to describe that the present productive capacity determines the maximum profit of products. The aforesaid data are listed in Table 1, and the manufacturing process of Company A is shown in Figure 4. Company A sells three kinds of paper products. In terms of selling price, (Product1, Product2, Product3) = (320, 280, 250), where each product has its allocated cost during the production run. Under ABC, reasonable operating activity analysis and cost driver allocation can increase the correctness of cost information; and the electric energy and heat energy costs, as saved by using RDF-5, are included in the analysis. In order to meet the practical situation, the overtime problem in the production process is considered. The machine hours have three stepwise costs: mill works on demand, general activity, and frequent overtime. The electric and heat energy benefits saved by using RDF-5 are processed piecewise, and the maximum demand for the product is shown at the bottom of Table 1.

Table 1.
(a) Example data; (b) Example data—facility level cost.
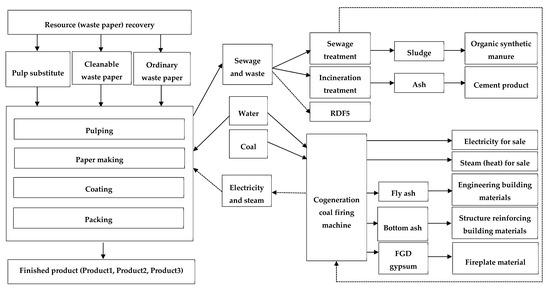
Figure 4.
Manufacturing process of Company A.
Company A uses three raw materials effectively: recycled pulp substitute (), clean waste paper () and ordinary waste paper (), and generates revenue from seven byproducts of the production process: electricity, steam heat, sludge organic compost, ash cement products, fly ash building materials, bottom ash reinforced structural building materials, and FGD gypsum fire plates. After the optimum production (), preparation (), treatment (), and cutting () of the batch-level activities, the emissions meet the environmental policy, that CO2 should not exceed 80,000 units, and the numerical values of NOx, CO2, SO2, CO, COD, BOD, SS, AOX, and product-level constraints () are obtained. The most important cost is calculated using LINGO software, based on the machine, labor, electricity, and steam costs. The left part of Figure 4 shows the process of paper-making; the middle part shows the required water, coal, electricity, and steam for the paper-making process, as well as the sewage and waste remaining from the production process; the right part shows the utilization of waste from the paper-making process, which can be used as byproducts. The excess electric and heat energies are sold, thereby turning waste into resources, and creating extra profit for the company. Based on Equations (1) to (19), the aforesaid green product mix decision model is described in Appendix A.
4.2. Analysis
This MIP model uses LINGO 15.0 [51] software to obtain the optimal solution to the variables of the proposed decision-making model, as shown in Table 2. While decision-makers intend to determine the optimal solutions with limited resources, such optimal solutions are conditional and depend on the preset target structure. This paper suggests using the LINGO model to determine the final target structure and solutions, as LINGO is fast, easy to use, and more effective in establishing linear, nonlinear, quadratic, quadratic constraint, second-order cone, half-definite, stochastic, and integral optimization models.
Table 2.
The optimal solution of numerical example *.
According to the results, the optimal profit of the product mix of the recycled paper mill is (, , ) = (1940, 2500, 480), which requires 11,300 units of the first raw material (=3 × 1940 + 2 × 2500 + 1 × 480), 16,220 units of the second raw material (=4 × 1940 + 3 × 2500 + 2 × 480), 17,240 units of the third raw material (=2 × 1940 + 4 × 2500 + 7 × 480), 56,600 units of water (=10 × 1940 + 12 × 2500 + 15 × 480), 121,520 units of coal (=23 × 1940 + 25 × 2500 + 305 × 480), 32,980 machine hours (=6 × 1940 + 7 × 2500 + 8 × 480), and 23,140 direct labor hours (=4 × 1940 + 5 × 2500 + 6 × 480). The total profit Z is $643,193.80. In terms of byproducts: (1) revenue from selling electricity is $22,448; (2) revenue from selling steam (heat) is $4190; (3) revenue from organic compost is $1981; (4) revenue from cement products is $1132; (5) revenue from building materials is $24,304; (6) revenue from reinforced structural building materials is $6076; (7) revenue from fire plates is $85,064. The total revenue from the aforesaid byproducts is $145,195.
As seen from the above table, through the combination of mathematical programming and accurate cost analysis, cost apportionments of the terminal products, as well as the analytic results of basic operation system, business managers can reference the data for optimal operational decision-making, leading the enterprise towards maximized operating profit before conducting production and business activities. Through the application of this model, enterprises can make decisions regarding whether to continue processing. Moreover, in the decision-making process, enterprises can find the best way to obtain the optimal solution, even under the unfavorable situation of limited resources. Due to its convenience and understandability, calculation tools are based on ABC and TOC, provide a practical method for rendering decisions of a product portfolio which can assist enterprises to use raw materials efficiently in the product mix decisions of GMTs, thereby meeting environmental goals and increasing corporate profit.
4.3. Sensitivity Analysis
Sensitivity analysis on the key parameters of the model provide further insights for this study. This study conducts sensitivity analysis on the cost and available capacity of 3 raw materials: pulp substitute, clean waste paper, and ordinary waste paper, with the unit being 5%. Regarding the unit costs of raw materials (pulp substitute, clean waste paper, and ordinary waste paper = $20, $15, $5 respectively); when all the purchase costs of the three are items decreased by 5%, the increase in the company profit will be (pulp substitute, cleanable waste paper, ordinary waste paper = 1.76%, 1.89%, 0.67%, respectively). When the costs are further decreased by 5%, namely, the decreasing rate changes from 5% to 10% (5% + 5% = 10%), the increase in the company profit will be (pulp substitute, cleanable waste paper, and ordinary waste paper = 3.51%, 3.78%, 1.34%, respectively). As the test results show, when all the purchase costs of the three items are decreased by 5%, the increase in the company profit will be (pulp substitute, cleanable waste paper, and ordinary waste paper = 1.76%, 1.89%, 0.67%, respectively).
Additionally, this study conducts an in-depth exploration into the influence of cost increase on enterprise profit. In terms of the unit cost of raw material, when the three purchase costs are increased by 5%, the reduction in the profit of enterprises will be (pulp substitute, cleanable waste paper, and ordinary waste paper = −1.76%, −1.89%, −0.67%, respectively); when the three purchase costs are increased by another 5% or 10%, the reduction in the profit of enterprises will be (pulp substitute, cleanable waste paper, and ordinary waste paper = −3.51%, −3.78%, −1.34%, respectively). As the test shows, when all the purchase costs of the three items are decreased by 5%, the increase in the profit of enterprises will be (pulp substitute, cleanable waste paper, and ordinary waste paper = 1.76%, 1.89%, 0.67%, respectively). Table 3, Table 4 and Table 5 show the relationship between the purchase costs and profits of pulp substitute, cleanable waste paper, and ordinary waste paper. The contents of Table 3, Table 4 and Table 5 are illustrated in Figure 5, which displays the cost decrease and capacity increase over profit increase. As shown in Figure 5, as the cost of the raw materials procured by enterprises gradually decreases, the quantity of the raw materials that can be procured will gradually increase, and enterprises will make more profit. Specifically, cleanable waste paper and ordinary waste paper have a great influence on enterprises, with the former having the greater influence; while the pulp substitute has less influence on the revenue of enterprises.
Table 3.
Sensitivity analysis on the cost of pulp substitute.
Table 4.
Sensitivity analysis on the cost of clean waste paper.
Table 5.
Sensitivity analysis on the cost of ordinary waste paper.
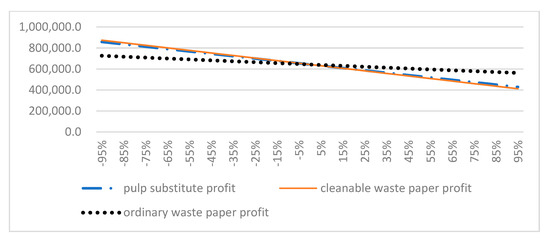
Figure 5.
The impacts of cost decrease and capacity increase on profit (unit: thousand dollars).
In terms of available capacity, (pulp substitute, cleanable waste paper, and ordinary waste paper = 11,310, 17,020, 24,750, respectively). The sensitivity analysis showed that when the available capacities of pulp substitute and clean waste paper increased by 5%, respectively, the profit increased by 1.76%. However, when the available capacities further increased by 5%, the profit ceased to increase beyond the 1.76%. Table 6 and Table 7 show the relationships between pulp substitute, clean waste paper, and the company profit. When the available capacity of ordinary waste paper increased by 5%, the profit of the company did not increase. If it further increased by 5%, the profit still did not change. Table 8 shows the relationship between cleanable waste paper and the company profit. The sensitivity analysis indicated that the company can further increase its current 5% available capacity of cleanable waste paper to gain more profit.
Table 6.
Sensitivity analysis on the available capacity of pulp substitute.
Table 7.
Sensitivity analysis on the available capacity of clean waste paper.
Table 8.
Sensitivity analysis on the available capacity of ordinary waste paper.
5. Discussion
Recent literature regarding the costs and processes of manufacturing applied ABC and TOC to the allocation of resources [17], and combined ABC and sensitivity analysis [52]; however, few studies have combined all three approaches; thus, this study can serve as reference for future studies regarding costs and resource allocation. The sensitivity analysis of this study implies that although the purchase cost of cleanable waste paper is ranked second among the three raw materials, it has the highest influence on company profit as it accounts for the highest percentage of production costs. The test on available capacity indicates that if the current 5% available capacity of cleanable waste paper can be further increased, the factory will produce more products, thereby obtaining more profit. After providing the findings to the case factory, the Purchasing Department of the case company discovered that the purchase cost of cleanable waste paper has the greatest influence on company profit. As the international price of paper is reduced in the future, the case company can negotiate with their suppliers to reduce their price. Previously, the case company thought that it had already taken full advantage of the available capacity of the raw material; however, after being informed of the findings, it plans to increase its application of cleanable waste paper.
5.1. Managerial Implications
Preliminary research has found that the adoption of ABC can help management to identify purchase behaviors [53] while greatly improving organizational performance, productivity, and profitability; hence, this technique has been widely promoted to enhance enterprise profitability [54,55]. However, as many industries continue to use old production technologies, which consume resources and energy at a rate of more than triple that of new environmental technologies, enterprise pollution cannot be effectively controlled, quality of life is affected, and environmental damage is continuously aggravated [6]. Therefore, when internal environmental technologies of enterprises are enhanced by internal environmental management, pollution is effectively controlled. When new training schemes can be imported into environmental management systems to strengthen employees’ environmental awareness and environmental problem-handling modes, the performance of environmental management systems will be significantly influenced [56].
An environmental management system also uses the internal innovations of process innovation, technology innovation, and product innovation for improvement [9]. With the rise of environmental awareness, enterprises actively conduct internal green innovation, which has a significantly positive influence on increasing enterprises’ competitive advantages. When the innovation ability of competitors is low, applied innovation can double the competitive advantage of an enterprise [16]. With increased consumer environmental considerations, retailers and manufacturers will benefit by providing extraordinary green business practices [57]. Numerical application and sensitivity analysis demonstrate the applicability of the proposed model and emphasize management insights [58]. The main purpose of business operations is to obtain profit for a company; decreased production costs and increased available capacity are the two most common approaches. Sensitivity analysis shows the proportion of each raw material against production costs. On the basis of changing the procurement environment, a company can negotiate with raw material suppliers to reduce the price of raw materials in order to save purchase costs. During reproduction, the available capacity of raw materials with production potential can be increased to facilitate the company’s production of more products, and thereby, create more profits.
5.2. Limitations
This study provides a reference model for energy conservation and carbon emission reduction through a case study, based on the operational procedures of the traditional paper-making industry. The values in the case are all represented by virtual numbers. Paper mills can apply this model to make effective use of their wastes, as based on a power generation method that uses its own fuel and raw materials after obtaining the data of discharged wastes through the testing process. Generalizability to other industries is problematic.
6. Conclusions
Using sustainable operations research to enhance the innovation of environmental technology can help enterprises to improve their environmental problems by reducing environmental pollution [6] within a short time by classifying pollutants and waste; thus, the performance of enterprises in solving environmental problems can be effectively improved [59]. Corporate competitiveness and the usability of managerial accounting information have significant correlation [60]. Therefore, this study combines ABC with TOC, and uses the Mathematical Programming Approach to provide paper-making enterprises with a production mode that includes environmental protection, while taking full advantage of the byproducts of process wastes. This study explores the cost of the production process with ABC. The TOC is adopted to help managers note the restricted resources of production processing and remove any bottlenecks.
In order to be practical, regarding the situation of occasional overtime work hours, this study handles it with stepwise machine costs and piecewise direct labor costs. The former considers the different rates of plants according to the different electricity consumption rates during production; while the latter considers overtime work in production. In addition to the saved costs of electric and thermal energies of several plants, through the implementation of energy-saving operations, the company expressed their saved costs due to the energy conservation nature of the model. When simultaneously considering a winning corporate image and profit, if recycled paper is used as a raw material for production, products with higher value are created according to the characteristics of the different recycled papers, which may be the future direction for enterprises that have not used recycled resources as raw materials. While coal firing pollutes ambient air, many mills continue to use it to generate power in order to save costs; water, as the industrial blood, is usually wasted without proper recycling. Therefore, this study especially introduces the application of coal and wastewater, and suggests the combination of a boiler and cogeneration for the construction of most resources. Subsequent mills can effectively take full advantage of the waste from boilers, meaning enterprises can become excellent benchmarking enterprises, and find a balance between profitability and energy efficiency through their gradual growing awareness of environmental protection.
Author Contributions
Conceptualization, W.-H.T.; methodology, C.-L.H.; software, Y.-C.C.; formal analysis, C.-L.H. and Y.-C.C.; investigation, C.-L.H. and Y.-C.C.; resources, W.-H.T.; writing—original draft preparation, C.-L.H., W.-H.T., and Y.-C.C.; writing—review and editing, C.-L.H., W.-H.T., and Y.-C.C.; project administration, W.-H.T.; funding acquisition, W.-H.T. All authors have read and agreed to the published version of the manuscript.
Funding
This research was funded by the Ministry of Science and Technology of Taiwan under Grant No. MOST106-2410-H-008-020-MY3.
Acknowledgments
The author is extremely grateful to the energies journal editorial team and reviewers who provided valuable comments for improving the quality of this article. The author also would like to thank the Ministry of Science and Technology of Taiwan for financial support of this research under Grant No. MOST106-2410-H-008-020-MY3.
Conflicts of Interest
The authors declare no conflict of interest.
Notations
The main symbols of variables and parameters used in this model are defined as follows:
| Corporate profit; | |
| Xi | Quantity of product i; |
| Unit price of product i; | |
| cs | Unit price of byproduct s |
| bis | The quantity of byproduct s of one unit of product i |
| Saved pth steam costs, when p = 1, the preferential rate is applicable; when p = 2, the basic preferential rate is applicable; when p = 3, the excess rate is applicable; | |
| Saved pth steam machine hours, when p = 1, the preferential rate is applicable; when p = 2, the basic preferential rate is applicable; when p = 3, the excess rate is applicable; | |
| Saved qth electric power costs, when q = 1, the preferential rate is applicable; when q = 2, the basic preferential rate is applicable; when q = 3, the excess rate is applicable; | |
| Saved qth generating machine hours, when q = 1, the preferential rate is applicable; when q = 2, the basic preferential rate is applicable; when q = 3, the excess rate is applicable; | |
| Saved activity driver demands of unit-level activity j (j ∈ U) for steam machine hours of one-unit product i; | |
| Saved activity driver demand of unit-level activity j (j ∈ U) for generating machine hours of one-unit product i; | |
| Unit cost of mth raw material; | |
| Unit cost of mth raw material; mth raw material demand of one-unit product I; | |
| Available quantity of raw material Q. | |
| Running activity cost per activity driver for activity j; | |
| Activity driver demand of unit-level activity j (j ∈ U) of one-unit product i; | |
| Total direct labor cost in (see Figure 2); | |
| Total direct labor cost in (see Figure 2); | |
| Total labor hours needed for the company; | |
| Upper limit of total direct labor hours of normal work (see Figure 2); | |
| Upper limit of total direct labor hours including overtime work (see Figure 2); | |
| The quantity of resource used by each batch-level activity j (j ∈ B) for product i; | |
| The number of batches for batch-level activity j (j ∈ B) used by product i; | |
| The quantity of product i for each batch-level activity j (j ∈ B); | |
| The quantity available for the activity driver of batch-level activity j (j ∈ B). | |
| Demand of activity driver needed by product-level activity j (j ∈ P) for product i; | |
| Production indicator of product i; If (Ri = 1), then product i will be produced. Otherwise, (Ri = 0); | |
| Maximum demand for product i; | |
| The quantity available for the activity driver of activity j (j ∈ P). | |
| Total machine cost in (see Figure 3); | |
| Machine hours of kth level capacity (see Figure 3); | |
| SOS1 set of 0–1 variables (special order of the first kind), where one and only one variable must be nonzero; = 1 means that machine hour is expanded to . | |
| Machine hour demand for one unit of product i; | |
| Environmental management cost; | |
| Processed gas p; | |
| The total quantity of gas p from product i.; | |
| G | The quantity of carbon equivalent of various gases allowed to be emitted from the mill paper-making process. |
Appendix A
Company A introduces ABC and TOC into the mathematical programming of the production process.
Table A1.
The mathematical programming model with the example data of Table 1.
Table A1.
The mathematical programming model with the example data of Table 1.
| Z = [(income from main paper products) + (relevant byproducts) + (saved electric power cost) + (saved steam cost)] − [(unit-level activity cost: total material cost + total expense + total direct labor cost+ total machine cost) + (batch-level activity cost) + (product-level activity cost) + (total facility-level activity cost) + environmental management cost] | ||
| =(320 + 280 + 250) + {[0.8*(5 + 6 + 7)] + [0.5*( + 2 + 3)] + [0.035*(10 + 12 + 15)] + [0.02*(10 + 12 + 15)] + [0.2*(23 + 25 + 30)] + [0.05*(23 + 25 + 30)] + [0.7*(23 + 25 + 30)]} + (92,000 + 101,200 + 108,100) + (32,000 + 35,200 + 37,600) − {[(20*3 + 15*4 + 5*2) + (20*2 + 15*3 + 5*4) + (20*1 + 15*2 + 5*7)] + [(1*10 + 2*23) + (1*12 + 2*25) + (1*15 + 2*30)] + (38,204 + 62,082) + [(6*1) + (6*2) + (6*3)] + [(14*2) + (14*3) + (14*4)] + (2*3) + (2*4) + (2*5)] + [(1*2) + (1*2) + (1*3)] + [(100*15) + (100*12) + (100*18)] + (85,600 + 98,975 + 115,025) + 20,000 = 160.9 + 143.21 + 126.425 + 92,000 + 101,200 + 108,100 + 32,000 + 35,200 + 37,600 − 38,204 − 62,082 − 85,600 − 98,975 − 115,025 − 6 − 12 − 18 − 28 − 42 − 56 − 6 − 8 − 10 − 2 − 2 − 3 − 1500 − 1200 − 1800 − 20,000 | ||
| Subject to: | ||
| Raw material and expense constraints: | Stepwise facility-level machine hour constraints: Direct labor constraints: | Batch-level production activity constraints: Batch-level preparation activity constraints: |
| Batch-level treatment activity constraints: | Batch-level cutting activity constraints: Product-level constraints: Saved electric power cost = Constraints: Saved steam cost = Constraints: | Estimated data of different gases emitted from the mill paper-making process: NOx: 0.0006*(23 + 25 + 30) CO2: 0.54*(23 + 25 + 30) SO2: 0.0000024*(23 + 25 + 30) CO: 0.00012*(23 + 25 + 30) COD: 0.0009*(23 + 25 + 30) BOD: 0.00006*(23 + 25 + 30) SS: 0.000075*(23 + 25 + 30) AOX: 0.0000009*(23 + 25 + 30) In order to conform to the environmental protection policy, the carbon equivalent of the company should not exceed 80,000 units. |
References
- United Nations Framework on Climate Change (UNFCC). Adoption of the Paris Agreement. In the Report of the Conference of the Parties on its twenty-first session (held in Paris from 30 November to 13 December 2015), Addendum, Report No. FCCC/CP/2015/10/Add.1. United Nations, 29 January 2016. Available online: http://unfccc.int/resource/docs/2015/cop21/eng/10a01.pdf (accessed on 29 April 2020).
- Tsai, W.-H.; Yang, C.-H.; Chang, J.-C.; Lee, H.-L. An Activity-Based Costing decision model for life cycle assessment in green building projects. Eur. J. Oper. Res. 2014, 238, 607–619. [Google Scholar] [CrossRef]
- Georgiadis, P.; Vlachos, D. The effect of environmental parameters on product recovery. Eur. J. Oper. Res. 2004, 157, 449–464. [Google Scholar] [CrossRef]
- Chen, W.Y.; Jim, C.Y. Resident valuation and expectation of the urban greening project in Zhuhai, China. J. Environ. Plan. Manag. 2011, 54, 851–869. [Google Scholar] [CrossRef]
- Srivastava, S. Green Supply Chain Management: A State-of-The-Art Literature Review. Int. J. Manag. Rev. 2007, 9, 53–80. [Google Scholar] [CrossRef]
- Liu, L.; Ma, X. Technology-based industrial environmental management: A case study of electroplating in Shenzhen, China. J. Clean. Prod. 2010, 18, 1731–1739. [Google Scholar] [CrossRef]
- Christmann, P. Effects of “Best Practices” of Environmental Management on Cost Advantage: The Role of Complementary Assets. Acad. Manag. J. 2000, 43, 663–680. [Google Scholar]
- Bansal, P.; Roth, K. Why Companies Go Green: A Model of Ecological Responsiveness. Acad. Manag. J. 2000, 43, 717–736. [Google Scholar]
- Majumdar, S.K.; Marcus, A.A. Rules versus Discretion: The Productivity Consequences of Flexible Regulation. Acad. Manag. J. 2001, 44, 170–179. [Google Scholar]
- Collado-Ruiz, D.; Ostad-Ahmad-Ghorabi, H. Comparing LCA results out of competing products: Developing reference ranges from a product family approach. J. Clean. Prod. 2010, 18, 355–364. [Google Scholar] [CrossRef]
- Yu, S.; Zhang, R. Life Cycle Assessment in Different Product Design Stages—A Coffee Pot Case Study. Appl. Mech. Mater. 2010, 34, 988–994. [Google Scholar] [CrossRef]
- Pati, R.K.; Vrat, P.; Kumar, P. Economic analysis of paper recycling vis-a-vis wood as raw material. Int. J. Prod. Econ. 2006, 103, 489–508. [Google Scholar] [CrossRef]
- Berglund, C.; Söderholm, P. An econometric analysis of global waste paper recovery and utilization. Environ. Resour. Econ. 2003, 26, 429–456. [Google Scholar] [CrossRef]
- Brandenburg, M.; Rebs, T. Sustainable supply chain management: A modeling perspective. Ann. Oper. Res. 2015, 229, 213–252. [Google Scholar] [CrossRef]
- Ilgin, M.A.; Gupta, S.M. Environmentally conscious manufacturing and product recovery (ECMPRO): A review of the state of the art. J. Environ. Manag. 2010, 91, 563–591. [Google Scholar] [CrossRef] [PubMed]
- Seuring, S. A review of modeling approaches for sustainable supply chain management. Decis. Support Syst. 2013, 54, 1513–1520. [Google Scholar] [CrossRef]
- Chen, Y.-S. The Driver of Green Innovation and Green Image – Green Core Competence. J. Bus. Ethics 2008, 81, 531–543. [Google Scholar] [CrossRef]
- Chen, Y.-S.; Lai, S.-B.; Wen, C.-T. The Influence of Green Innovation Performance on Corporate Advantage in Taiwan. J. Bus. Ethics 2006, 67, 331–339. [Google Scholar] [CrossRef]
- Alsmadi, M.; Almani, A. Implementing an integrated ABC and TOC approach to enhance decision making in a Lean context. Int. J. Qual. Reliab. Manag. 2014, 31, 906–920. [Google Scholar] [CrossRef]
- Hui, I.K.; Chan, A.H.S.; Pun, K.F. A study of the Environmental Management System implementation practices. J. Clean. Prod. 2001, 9, 269–276. [Google Scholar] [CrossRef]
- Ambec, S.; Lanoie, P. Does it pay to be green? A systematic overview. Acad. Manag. Perspect. 2008, 22, 45–62. [Google Scholar]
- Gavronski, I.; Klassen, R.D.; Vachon, S.; do Nascimento, L.F.M. A resource-based view of green supply management. Transp. Res. Part E Logist. Transp. Rev. 2011, 47, 872–885. [Google Scholar] [CrossRef]
- Granek, F. Business value of toxics reduction and pollution prevention planning. J. Clean. Prod. 2011, 19, 559–560. [Google Scholar] [CrossRef]
- Repoussis, P.P.; Paraskevopoulos, D.C.; Vazacopoulos, A.; Hupert, N. Optimizing emergency preparedness and resource utilization in mass-casualty incidents. Eur. J. Oper. Res. 2016, 255, 531–544. [Google Scholar] [CrossRef]
- Russell, R.A.; Urban, T.L. Offsetting inventory replenishment cycles. Eur. J. Oper. Res. 2016, 254, 105–112. [Google Scholar] [CrossRef]
- Lei, L.; Lee, K.; Dong, H. A heuristic for emergency operations scheduling with lead times and tardiness penalties. Eur. J. Oper. Res. 2016, 250, 726–736. [Google Scholar] [CrossRef]
- Boonmee, A.; Sethanan, K. A GLNPSO for multi-level capacitated lot-sizing and scheduling problem in the poultry industry. Eur. J. Oper. Res. 2016, 250, 652–665. [Google Scholar] [CrossRef]
- Esmaeilbeigi, R.; Charkhgard, P.; Charkhgard, H. Order acceptance and scheduling problems in two-machine flow shops: New mixed integer programming formulations. Eur. J. Oper. Res. 2016, 251, 419–431. [Google Scholar] [CrossRef]
- Todosijević, R.; Benmansour, R.; Hanafi, S.; Mladenović, N.; Artiba, A. Nested general variable neighborhood search for the periodic maintenance problem. Eur. J. Oper. Res. 2016, 252, 385–396. [Google Scholar] [CrossRef]
- Amorim, P.; Curcio, E.; Almada-Lobo, B.; Barbosa-Póvoa, A.P.; Grossmann, I.E. Supplier selection in the processed food industry under uncertainty. Eur. J. Oper. Res. 2016, 252, 801–814. [Google Scholar] [CrossRef]
- Hästbacka, M.; Westerlund, J.; Westerlund, T. MISPT: A user friendly MILP mixed-time based production planning tool. In Computer Aided Chemical Engineering; Elsevier: Amsterdam, The Netherlands, 2007; Volume 24, pp. 637–642. [Google Scholar]
- Björk, K.-M.; Carlsson, C. The effect of flexible lead times on a paper producer. Int. J. Prod. Econ. 2007, 107, 139–150. [Google Scholar] [CrossRef]
- Korpunen, H.; Paltakari, J. Testing an activity-based costing model with a virtual paper mill. Nord. Pulp Pap. Res. J. 2013, 28, 146–155. [Google Scholar] [CrossRef]
- Jiang, X.-Y.; Wu, H.-H. Optimization of setup frequency for TOC supply chain replenishment system with capacity constraints. Neural Comput. Appl. 2013, 23, 1831–1838. [Google Scholar] [CrossRef]
- Andelkovic, P.; Andelkovic, A.; Dasic, P. The theory of constraints as a basis for production process improvement model. Актуальні Прoблеми Екoнoміки 2013, 10, 251–260. [Google Scholar]
- Lockhart, J.; Taylor, A. Environmental considerations in product mix decisions using ABC and TOC. Manag. Account. Q. 2007, 9, 13. [Google Scholar]
- Tsai, W.-H.; Chen, H.-C.; Leu, J.-D.; Chang, Y.-C.; Lin, T.W. A product-mix decision model using green manufacturing technologies under activity-based costing. J. Clean. Prod. 2013, 57, 178–187. [Google Scholar] [CrossRef]
- Tsai, W.-H.; Chang, Y.-C.; Lin, S.-J.; Chen, H.-C.; Chu, P.-Y. A green approach to the weight reduction of aircraft cabins. J. Air Transp. Manag. 2014, 40, 65–77. [Google Scholar] [CrossRef]
- Dessureault, S.; Benito, R. Data mining and activity based costing for equipment replacement decisions Part 1–establishing the information infrastructure. Min. Technol. 2012, 121, 73–82. [Google Scholar] [CrossRef]
- Baptista, E.A.; Lucato, W.C.; Coppini, N.L.; Fortunato, F.A.D.S. Profit optimization in machining service providers using principles of the Theory of Constraints. J. Braz. Soc. Mech. Sci. Eng. 2013, 35, 347–355. [Google Scholar] [CrossRef]
- Cannon, J.N.; Cannon, H.M.; Low, J.T. Modeling tactical product-mix decisions: A theory-of-constraints approach. Simul. Gaming 2013, 44, 624–644. [Google Scholar] [CrossRef]
- Huang, S.-Y.; Chen, H.-J.; Chiu, A.-A.; Chen, C.-P. The application of the theory of constraints and activity-based costing to business excellence: The case of automotive electronics manufacture firms. Total Qual. Manag. Bus. Excell. 2014, 25, 532–545. [Google Scholar] [CrossRef]
- Yang, H.-L.; Chen, Z.-J.; Ji, Y.-F.; Zhang, Y. Operation optimization of distribution center based on time-driven activity-based costing. J. Dalian Marit. Univ. 2012, 4, 26. [Google Scholar]
- Tsai, W.-H. Green production planning and control for the textile industry by using mathematical programming and industry 4.0 techniques. Energies 2018, 11, 2072. [Google Scholar] [CrossRef]
- Tsai, W.-H. Carbon Taxes and Carbon Right Costs Analysis for the Tire Industry. Energies 2018, 11, 2121. [Google Scholar] [CrossRef]
- Tsai, W.-H.; Hung, S.-J. A fuzzy goal programming approach for green supply chain optimisation under activity-based costing and performance evaluation with a value-chain structure. Int. J. Prod. Res. 2009, 47, 4991–5017. [Google Scholar] [CrossRef]
- Zeferino, J.A.; Antunes, A.P.; Cunha, M.C. Multi-objective model for regional wastewater systems planning. Civ. Eng. Environ. Syst. 2010, 27, 95–106. [Google Scholar] [CrossRef]
- Arribas, C.A.; Blazquez, C.A.; Lamas, A. Urban solid waste collection system using mathematical modelling and tools of geographic information systems. Waste Manag. Res. 2010, 28, 355–363. [Google Scholar] [CrossRef]
- Galante, G.; Aiello, G.; Enea, M.; Panascia, E. A multi-objective approach to solid waste management. Waste Manag. 2010, 30, 1720–1728. [Google Scholar] [CrossRef]
- Tsai, W.-H. A Green Quality Management Decision Model with Carbon Tax and Capacity Expansion under Activity-Based Costing (ABC)—A Case Study in the Tire Manufacturing Industry. Energies 2018, 11, 1858. [Google Scholar] [CrossRef]
- LINDO SYSTEMS INC. Archives—LINGO 15.0. Available online: https://www.lindo.com/index.php/2-uncategorised/160-archives-lingo-15-0 (accessed on 22 April 2020).
- Kim, Y.-W.; Han, S.-H.; Yi, J.-S.; Chang, S. Supply chain cost model for prefabricated building material based on time-driven activity-based costing. Can. J. Civ. Eng. 2016, 43, 287–293. [Google Scholar] [CrossRef]
- Mark, T.; Niraj, R.; Dawar, N. Uncovering customer profitability segments for business customers. J. Bus. Bus. Mark. 2012, 19, 1–32. [Google Scholar] [CrossRef]
- Askarany, D.; Yazdifar, H. An investigation into the mixed reported adoption rates for ABC: Evidence from Australia, New Zealand and the UK. Int. J. Prod. Econ. 2012, 135, 430–439. [Google Scholar] [CrossRef]
- Salim, I. Analyzing usage of activity based costing in commercial banking institutions of Tripoli Libya: A technological acceptance model approach. J. Appl. Sci. Res. 2012, 8, 414–419. [Google Scholar]
- Dwyer, R.; Lamond, D.; Lee, K.H. Why and how to adopt green management into business organizations? Manag. Decis. 2009, 47, 1101–1121. [Google Scholar]
- Liu, Z.L.; Anderson, T.D.; Cruz, J.M. Consumer environmental awareness and competition in two-stage supply chains. Eur. J. Oper. Res. 2012, 218, 602–613. [Google Scholar] [CrossRef]
- Muriana, C. An EOQ model for perishable products with fixed shelf life under stochastic demand conditions. Eur. J. Oper. Res. 2016, 255, 388–396. [Google Scholar] [CrossRef]
- Tanskanen, J.-H. Strategic planning of municipal solid waste management. Resour. Conserv. Recycl. 2000, 30, 111–133. [Google Scholar] [CrossRef]
- Zhu, D.-S.; Lin, Y.-P.; Huang, S.-Y.; Lu, C.-T. The effect of competitive strategy, task uncertainty and organisation structure on the usefulness and performance of management accounting system (MAS). Int. J. Bus. Perform. Manag. 2009, 11, 336–363. [Google Scholar] [CrossRef]


© 2020 by the authors. Licensee MDPI, Basel, Switzerland. This article is an open access article distributed under the terms and conditions of the Creative Commons Attribution (CC BY) license (http://creativecommons.org/licenses/by/4.0/).