Article

Advanced Lithium-Ion Battery Model for Power System Performance Analysis

by
Szymon Potrykus
1,2,*,
Filip Kutt
1,
Janusz Nieznański
1 and
Francisco Jesús Fernández Morales
2
1
Faculty of Electrical and Control Engineering, Gdańsk University of Technology, 80-233 Gdańsk, Poland
2
Department of Chemical Engineering, Instituto de Tecnología Química y Medioambiental, University of Castilla-La Mancha, 13071 Ciudad Real, Spain
*
Author to whom correspondence should be addressed.
Energies 2020, 13(10), 2411; https://doi.org/10.3390/en13102411
Submission received: 24 March 2020 / Accepted: 4 May 2020 / Published: 12 May 2020
(This article belongs to the Section D1: Advanced Energy Materials)

Abstract

:
The paper describes a novel approach in battery storage system modelling. Different types of lithium-ion batteries exhibit differences in performance due to the battery anode and cathode materials being the determining factors in the storage system performance. Because of this, the influence of model parameters on the model accuracy can be different for different battery types. These models are used in battery management system development for increasing the accuracy of SoC and SoH estimation. The model proposed in this work is based on Tremblay model of the lithium-ion battery. The novelty of the model lies in the approach used for parameter estimation as a function of battery physical properties. To make the model perform more accurately, the diffusion resistance dependency on the battery current and the Peukert effect were also included in the model. The proposed battery model was validated using laboratory measurements with a LG JP 1.5 lithium-ion battery. Additionally, the proposed model incorporates the influence of the battery charge and discharge current level on battery performance.

Graphical Abstract

1. Introduction

The development of modern distributed power systems is oriented toward environmental issues. There is a global consensus to reduce, and even eliminate, fossil fuels as an energy source. The tendency towards more energy-efficient components and the reduction of carbon emissions has set new standards for system designers and manufacturers. One of the most significant challenges in such systems is the dependency of energy generation on weather conditions. In order to meet modern standards of power network reliability, distributed Energy Storage Systems (ESS) have to be incorporated into the modern power distribution system. For electrical energy storage systems, the most commonly used are Battery Energy Storage Systems (BESS) [1,2]. In recent years, the number of grid-connected stationary BESS installations has rapidly increased. The capacity of a single stationary BESS ranges from 20 kWh up to 1 MWh. Energy storage systems have become a subject of investigation and source of challenges in smart grid design. For the evaluation of BESS in specific applications, accurate models and appropriate simulation scenarios are required. These tools can be used for system analysis to reach expected system performance. For large BESS, charging and discharging efficiency is one of the key aspects [3]. One of the problems faced by the designers of BESS is how to control and optimise BESS in grid applications. In addition, it is necessary to answer the question of whether and how other power system components influence BESS performance.
Modern BESS are mainly based on ambient temperature operating lithium-ion (Li-ion) charge carrier cells. They use either liquid electrolyte, in which case they are commonly named Lithium-ion Batteries (LiB), or polymer electrolyte, in which case they are dubbed Lithium-ion Polymer Batteries (LiPB). For BESS purposes, the most common shape of LiB or LiPB cells is the pouch shape. This is because regular electrode shapes are better for high capacity values and increase the maximum charge and discharge cycle count of the battery [4]. Due to the high demand for LiB BESS systems, a lot of research in this field is conducted by major manufacturers and tends to be confidential [5,6].
There are several types of LiB and LiPB cells. The most common types of batteries used in industry are presented in Table 1. Figure 1 shows the cell voltage and energy density of different types of lithium-ion cells presented in Table 1.
LiBs are widespread energy storage systems used in tandem with distributed energy sources such as photovoltaic (PV) power plants and wind turbines. As with any other BESS, they are capable of transforming chemical energy into electric energy via the process called battery discharge. The opposite process of converting electrical energy into chemical energy is called battery charging. Both discharging and charging processes are possible through an electrochemical process. LiBs are complex non-linear electrochemical systems strongly dependent on thermodynamic laws, electrodes, chemical reactions and mass transport phenomena [4,5,7,8,9]. For the power system analysis, the LiB models can be divided into two categories:
  • Online models used to extract in real time the parameters that are not directly measurable, such as the State of Charge (SoC) or the State of Health (SoH) of the battery. These parameters are indirectly determined from measurement data and used in a Battery Management System (BMS);
  • Offline models used for exploratory simulations or system design [10].
Both offline and the online models can be described using a variety of approaches. There are four main types of battery models differing in complexity, typical accuracy and number of parameters used for their description [7,11]. The physical model uses a multi-physical approach in the description of the battery behaviour. It is based on principles of intercalation at the multidimensional scale and takes into account all thermodynamic phenomena. Although the physical model offers very high accuracy, it requires detailed information on the materials used in the battery. Physical models can be used for battery design and performance validation purposes [4,5,7,11]. The second type of model is the empirical model. This type of model is based on the terminal behaviour of the battery and is also known as a black box model [9,11]. The third type of model is the abstract model. In this type of model, the battery is described using parameters dependent on certain physical properties of the battery, like, for example, the battery SoC. This model offers high accuracy with medium complexity [7,11]. The main disadvantage of this type of model is the requirement for parameter estimation by means of Electrochemical Impedance Spectroscopy (EIS) in which expensive spectrometry instrumentation has to be used. According to the literature [7], all described modelling methods can be mixed.
The most common methods of SoC estimation are look-up table methods, which can be divided into the Open Circuit Voltage (OCV) method and/or the Coulomb Counting (C-C) method. The OCV method is very accurate if the OCV is measured correctly in transient states. In this work, the general approach of the C-C method was used. This method allows accurate calculation of the changes in the battery SoC if the maximum battery capacity is well known. Thanks to this, it yields better estimations of the electrical power that can be delivered by the battery. The weakness of this method is the need to incorporate the influence of the Peukert effect on the battery maximum capacity in the model. In addition, the initial SoC has to be well known and this may require the use of the OCV method with an Extended Kalman Filter (EKF). The use of an EKF increases the accuracy of SoC estimation; however, the error can still be as high as 2% [12]. An alternative to the abovementioned methods of SoC estimation can be a data-driven estimation method. This method is based on battery performance mapping using acquired data and such tools as the fuzzy controller, the neural network, the support vector machine and a combination of these algorithms. The weakness of this method is the potential error accumulation when the battery is operating in unforeseen states in the mapping process [6,13,14]. Because of this, the battery system model of the LiPB battery with LiNi0.5Mn1.5O4 electrodes proposed in this paper uses a combination of OCV and C-C methods.
In this context, the aim of this paper was to propose a behavioural model of a lithium battery for a stationary BESS. A review of the literature on battery technology in the area of modelling of electrochemical cells was carried out. The model base of this research was proposed by [15,16] and developed by [13]; however, according to [12] this model was not accurate enough. In order to enhance the accuracy, the abstract level model should incorporate specific physical properties of the battery and represent them through selected parameters. Open challenges also include increasing model accuracy and the ability to process more complex battery simulations in a wide variety of domains and industry applications. Because of this, the authors decided to develop a model incorporating such physical phenomena as diffusion resistance (Rd) dependency on the battery current and the Peukert effect. The key aspect of accurate system modelling is model parameter estimation. For this estimation, the terminal behaviour of the battery was used instead of the EIS approach. The main contribution of the model presented in this work is the approach to the estimation of parameters as functions of battery physical properties. This approach has been validated by laboratory measurements in a LiPB battery with LiNi0.5Mn1.5O4, commercialized as the LG JP 1.5 battery.

2. Model Development

As stated above, the developed model is based on the model proposed in [15,16]. In this model, a semi-empirical approach was used. Two voltage equations for charge and discharge performance of the battery were proposed. This model was further developed in [9,13,17] where parameter scaling was used for multicell battery system modelling. In addition, battery ageing and internal temperature influence were incorporated into the model [18]. However, semi-empirical models presented in [9,13,15,16,17,18] were designed for battery systems with cell electrodes in a two-phase system. The Gibbs energy distribution is based on electric potential changes [5], and, therefore, the two-phase system model will fit well for an LFP type cell. Tremblay’s model is not sufficiently accurate [12] for systems with three or more phases. The proposed model has been verified using an LiNi0.5Mn1.5O4 cathode battery, which exhibits three phases in the Gibbs energy distribution.

2.1. Model Assumptions

The following simplifying assumptions have been made in the development of the proposed model:
  • The open circuit voltage temperature-dependent hysteresis phenomena is not taken into account [19].
  • The ageing phenomena [17] are neglected.
  • The self-discharge of the battery is neglected.
  • Internal ohmic resistance (Ri) is assumed constant.
  • Diffusion resistance (Rd) is only dependent on the battery current.

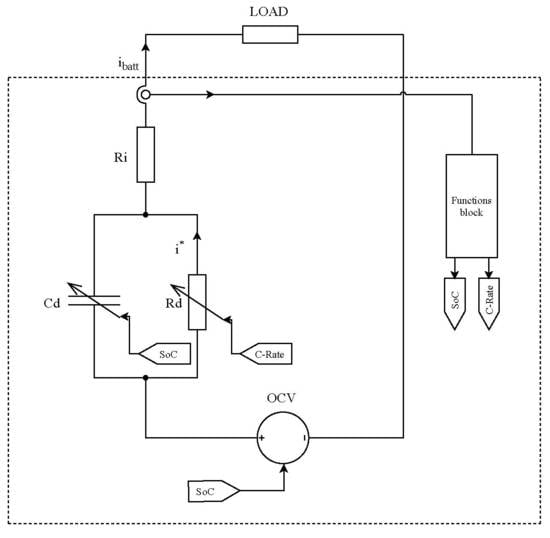
2.2. Battery Voltage Equation

The battery performance can be described with the lumped-parameter circuit model (T-D model) presented in Figure 2.
The main voltage equation is a function dependent on the SoC [14,15,19]:
v b a t t ( S o C , i b a t t ) = O C V   ( S o C ) v i v d ( i b a t t ) ,
where vbatt is the battery terminal voltage, OCV is the open circuit voltage, vi is the ohmic voltage drop and vd is the diffusion voltage drop.
The OCV, which is the representation of battery terminal voltage measured in a no-load relaxed battery, is a function of SoC:
O C V ( S o C ) = E 0 + A e B Q ( 1 S o C ) K Q ( 1 S o C 1 ) ,  
where E0 is battery constant specific voltage, A is exponential zone voltage, B is exponential zone capacity, K is the polarization constant and Q is the maximum battery charge.
The diffusion resistance represents the battery behaviour in dynamic states [20,21]:
v d = R d ( S o C , i b a t t )   ·   i * ,  
where Rd is the diffusion resistance, ibatt is the battery current and i* is the filtered low-frequency battery current. The internal ohmic resistance Ri corresponds to the voltage drop due to the battery current:
v i = R i ( S o C )   ·   i b a t t .  

2.3. SoC Estimation

The SoC value is a relative parameter describing the charge inside of the battery, where SoC = 1 means that the battery is fully charged and SoC = 0 means that the battery is fully discharged (the minimum non-destructive voltage level has been reached). The SoC estimation is the key aspect of accurate battery modelling and determines the value of parameters such as Ri and Rd and also the OCV function. For the SoC estimation in the proposed model, the Coulomb Counting (C-C) method [9,19,22] was used:
S o C = Q r e m Q m ,  
where Qrem is the remaining battery charge and Qm is the available capacity. For the discharging and charging of the battery, the SoC value is calculated as:
S o C = S o C 0 Δ Q Q m   ,  
S o C = S o C 0 + Δ Q Q m   ,
where SoC0 is the initial value of the SoC and Δ Q is the change in battery charge, calculated as:
Δ Q = t S o C 0 t S o C f i n a l i d t ,

2.4. Available Battery Capacity

The battery capacity depends on the value of charging or discharging current (current range 0–60 A) [23,24]. The change in the available battery capacity for a low current rate (0.1–1) is linear and depends on the current [5]. The authors decided to approximate the Peukert effect as a charging or a discharging efficiency. For the discharging of the battery, the Q m value is calculated as:
Q m = η d i s c h · Q ,  
And for the charging process, the Q m value is calculated as:
Q m = η c h · Q ,
where ηdisch is the discharge efficiency and ηch is the charge efficiency.

2.5. Charging and Discharging Efficiency

The charging and discharging efficiencies are defined based on energy losses in ohmic and diffusion resistances. Specifically, the discharging efficiency is defined as:
η d i s c h = E b a t t E b a t t + E ,
And the charging efficiency is given by:
η c h = E b a t t E E b a t t ,
where Ebatt is the battery energy calculated or measured at battery terminals and ∆E represents the energy losses inside the battery. The battery terminal energy is calculated as:
E b a t t = t 0 t 1 ( v b a t t · i b a t t ) d t ,
And the battery energy losses are evaluated from:
E = ( i b a t t 2 · R i + i b a t t 2 · R d ) ,

2.6. Current Filter

The diffusion capacitance is responsible for filtering the diffusion resistance current, which represents the influence of the battery diffusion on the battery voltage. Based on [4,9,10,15], this current filtering is described as:
i * = i b a t t 4 τ d d t i b a t t = i b a t t 4 R d C d d d t i b a t t ,
where τ is the battery relaxation time constant and Cd is the diffusion capacitance.

3. Results

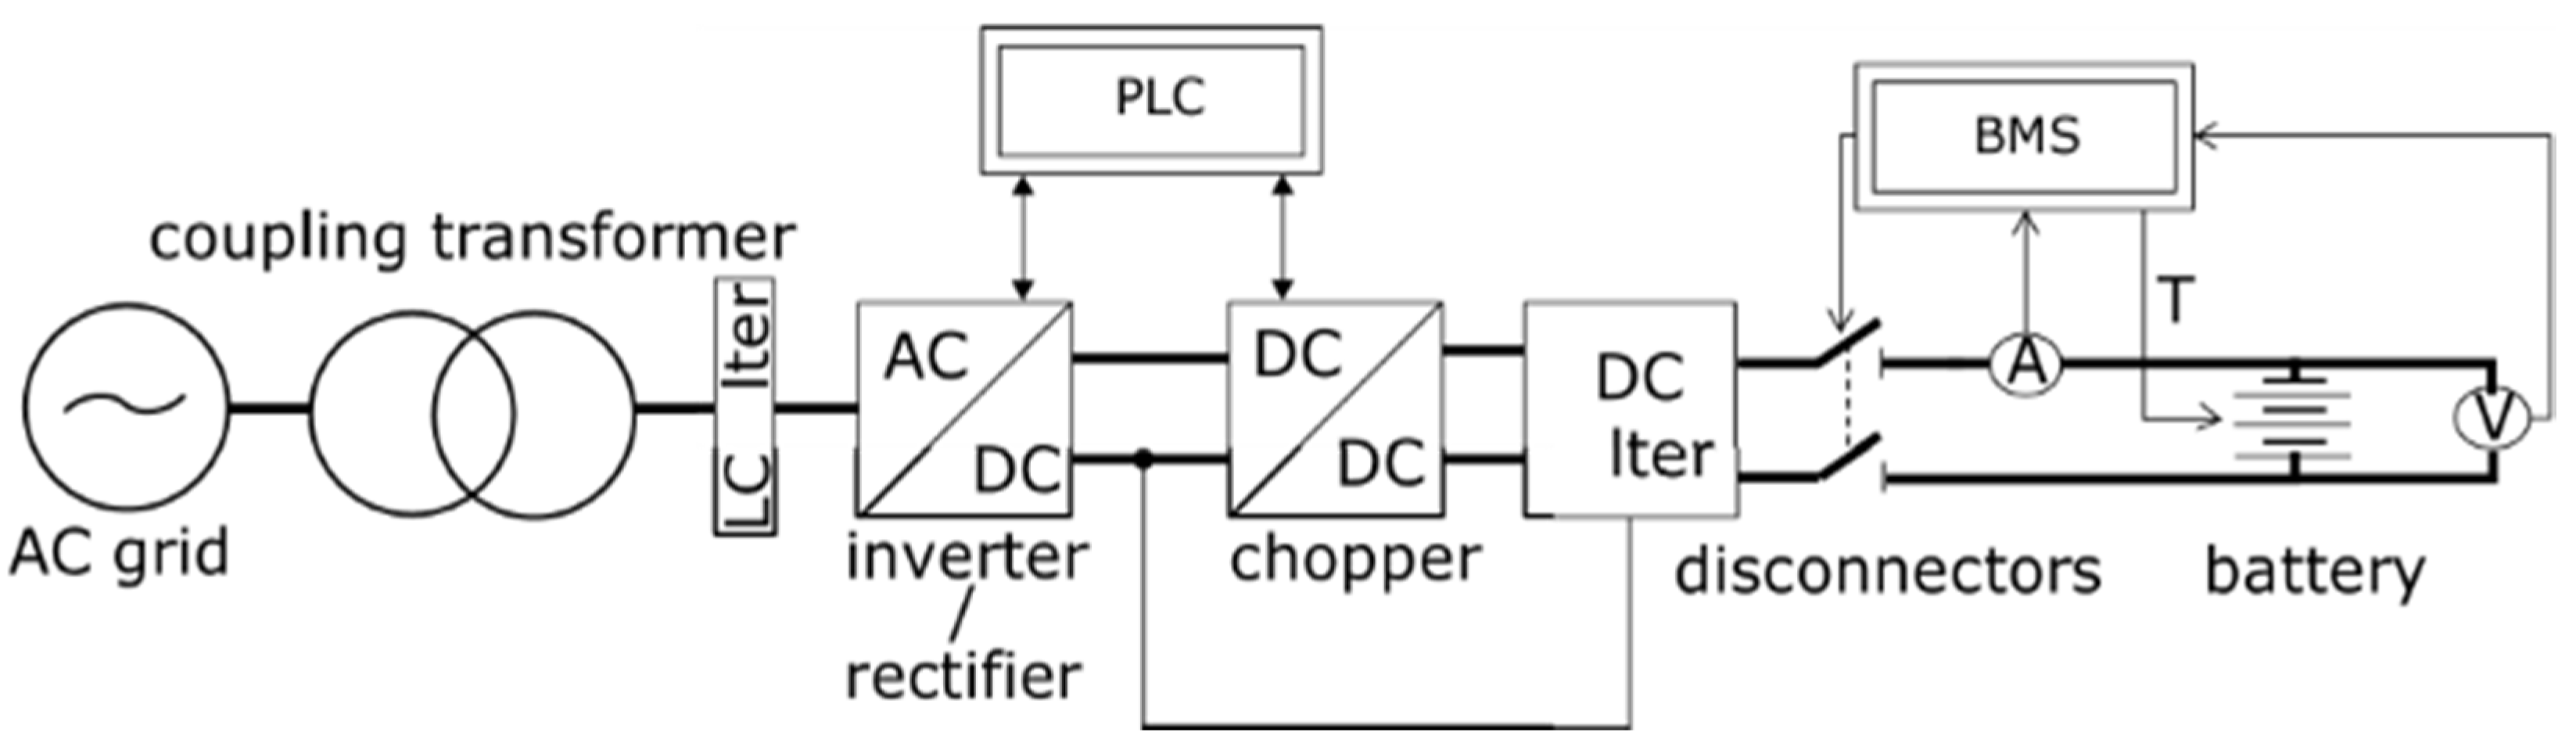
3.1. Experimental Setup for Parameter Estimation

The experimental setup was controllable by PLC (Siemens-s7-1200), and used an inverter (Vacon NXP0061), chopper (Vacon NXI0045), air-conditioned container (temperature 25 °C), and battery rack with 10 battery modules (LG Chem UPB 4860 with JP 1.5 cells) connected in series. The module parameters are taken from [25], while individual cell parameters are calculated for the module structure type 14S4P (4 parallel chains, each made of 14 cells in series). Table 2 shows the characteristic of the UPB 4860 module and the LG JP 1.5 battery. To adjust charge and discharge profiles, and for data storage, a computer with the Python 3® and Matlab R2019b application were used.
The battery voltage ( U m e s ) between battery terminals of the grid was continuously monitored by the chopper and the integrated BMS internal measurements (frequency resolution 0.01 Hz and accuracy ± 1%). For thermal control, Figure 3 shows the test bench view.

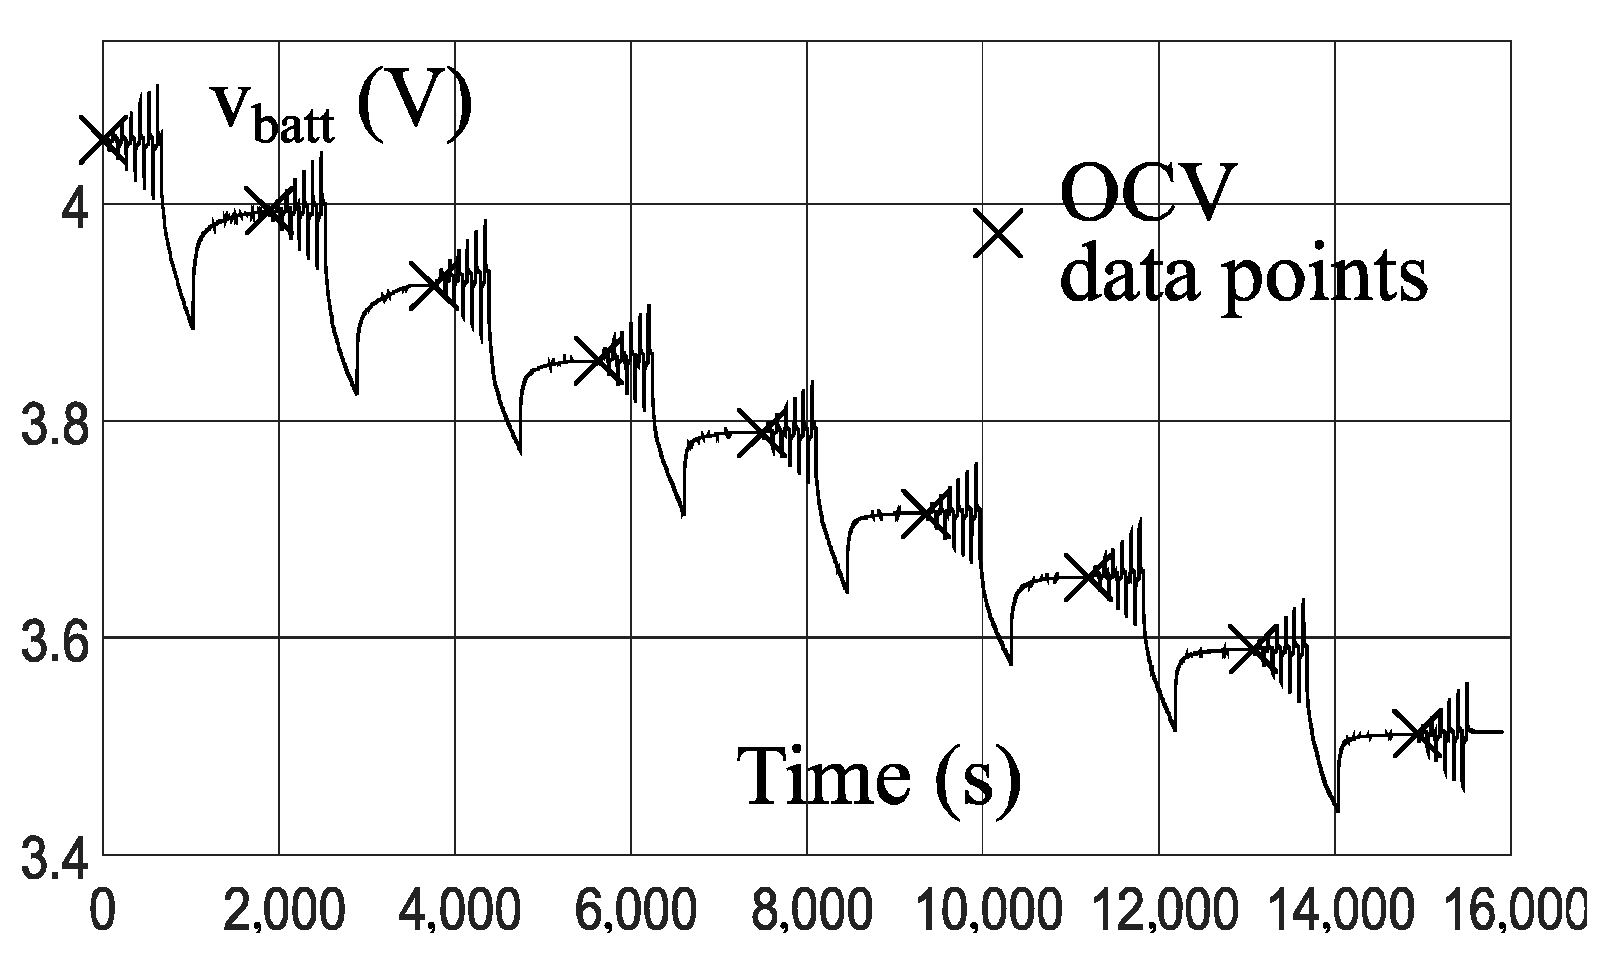
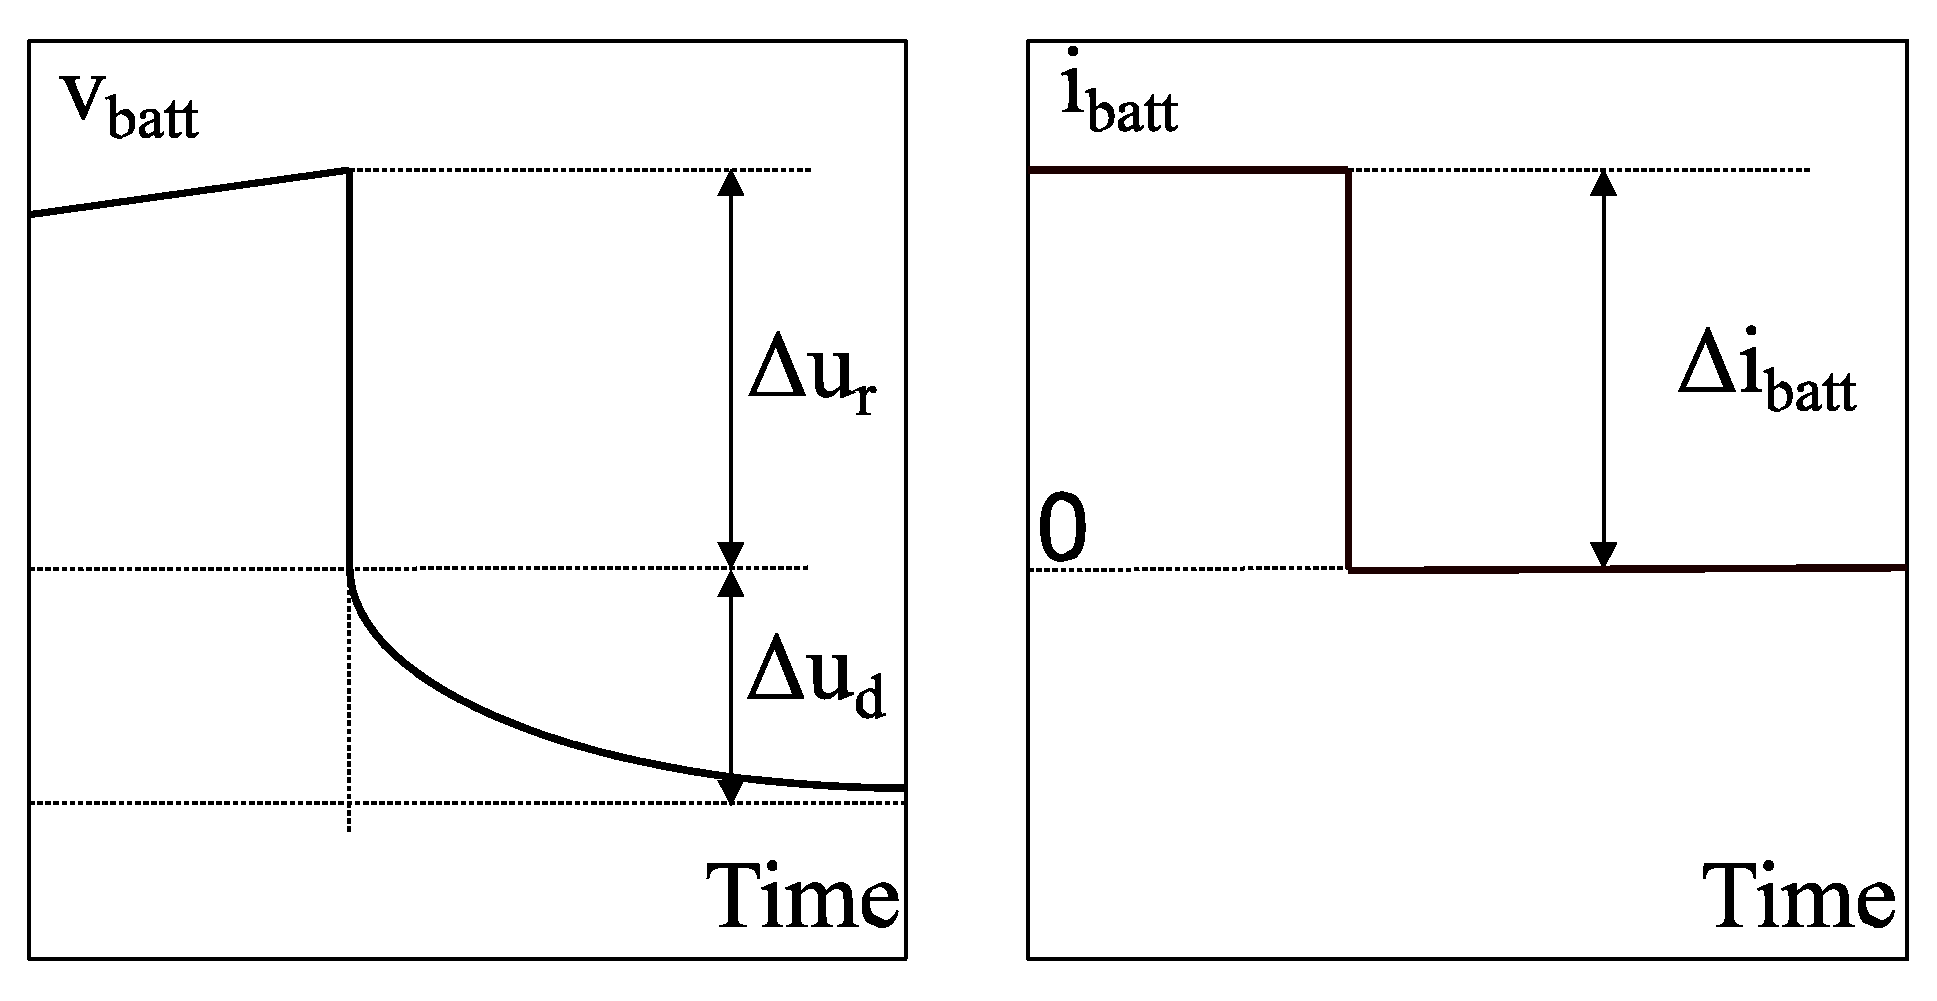
3.2. Battery Parameter Estimation

The basic test conducted in order to estimate the proposed model parameters was the Hybrid Pulse Power Characterization (HPPC) test, a standard in battery parameter estimation. The novelty of the approach is the repetition of the HPPC test with relatively short time intervals between each step. Due to the asymmetric nature of the voltage curve for the charge and discharge modes, the parameters have been divided into two sets: OCV parameters and dynamic parameters like Ri and Rd. Nine discharge and three charge HPPC tests for different levels of SoC were performed. The test methodology was previously described in the literature [4,9,20,26]. The OCV data points’ collection accuracy increased with the battery relaxation time. Because the HPPC test was carried out in the air-conditioned container, the authors decided to reduce the battery relaxation time to 15 min. [26]. The analysis of the voltage-relaxation waveform, showed in Figure 4, indicates that results are accurate to within 0.33% SoC (the difference of about 1 mV per 15 min of relaxation time). For the HPPC test, the test bench was configured as presented in Figure 5.
During the HPPC test, the algorithm presented in Figure 6 was used. Current and voltage waveforms of one of the tests are presented in Figure 7. Due to the lack of reliable manufacturer data, the following two actions were used to calculate the OCV curve of the battery. One action was focused on the estimation of OCV curve points, as in [26], and the other action—conducted in parallel with the first—was the HPPC test for different SoC values.
Moreover, for the OCV measurement, the voltage points after 15 min of relaxation time were measured for each 10% change in battery SoC. Figure 8 shows the battery voltage waveform during the entire test procedure. Based on the OCV test, the voltage waveform data points were approximated using a nonlinear trust region least-squares method. The maximum battery charge was equal to 15.75 Ah, the maximum charge voltage was equal to 4.2 V, and the minimum discharge voltage was equal to 3.0 V, according to the manufacturer’s data. Table 3 shows the estimated OCV curve parameters of the LG JP 1.5 battery.
The ohmic and diffusion resistances and diffusion capacitance were estimated based on HPPC tests for different SoC and charge/discharge current values. Due to the asymmetric nature of the voltage curve for charge and discharge modes, the coefficients have been divided into the two sets. The ohmic and diffusion resistances and the diffusion capacitance are defined based on [4,8,9,20] as:
R i = u r I ,  
R d = u d I ,
C d = τ R d ,
where ∆ur and ∆ud are quantities evaluated from the HPPC test voltage, as shown in Figure 9.
Figure 10 shows the ohmic (Ri) and diffusion (Rd) resistance as a function of SoC and the C-rate, which is the battery current (A) in reference to the battery capacity (Ah) (the positive value of the C-rate is the discharging current and the negative value is the charging current).
While the influence of the SoC on both the ohmic and the diffusion resistances is negligible, the C-rate influence on the diffusion resistance cannot be neglected. The authors decided to approximate the ohmic resistance as a constant independent from the SoC and the C-rate and the diffusing resistance as a function of the C-rate of the battery current. The diffusion resistance is defined as:
R d ( i b a t t ) = p R d 1 · | i b a t t i n | + p R d 0 ,
where in is the battery nominal current (C-rate = 1), pRd0 = 0 is the approximation constant and pRd1 = 0.003 represents the influence of the C-rate on the diffusion resistance.
In order to calculate diffusion capacitance, Cp, a relaxation time constant approximation as a function of SoC was used:
τ ( S o C ) = p τ 1   ·   S o C + p τ 0 ,
where pτ0 = 68 is the constant component of the relaxation time constant and 1 = 121 represents the SoC influence on the relaxation time of the battery. Based on the value of diffusion resistance Rd and relaxation time constant τ, presented in Figure 8, the diffusion capacitance is defined as:
C d ( S o C , i b a t t ) = C d · τ ( S o C )   R d ( i b a t t ) ,

3.3. Electrical Scaling of the Battery Model

In order to analyse the performance of the BESS and to validate the proposed modelling approach, a cell model has to be scaled up to simulate the entire multicell system [2]. It is necessary to consider the connection configuration of the number of cells in series (nseries) and in parallel (nparallel). Table 4 shows the scaling of model parameters according to [8].
The values presented in Table 4 do not take into account manufacturer-dependent variation in cell parameters, which can differ from nominal values by ± 2.5% according to the UPB 4860 module datasheet.

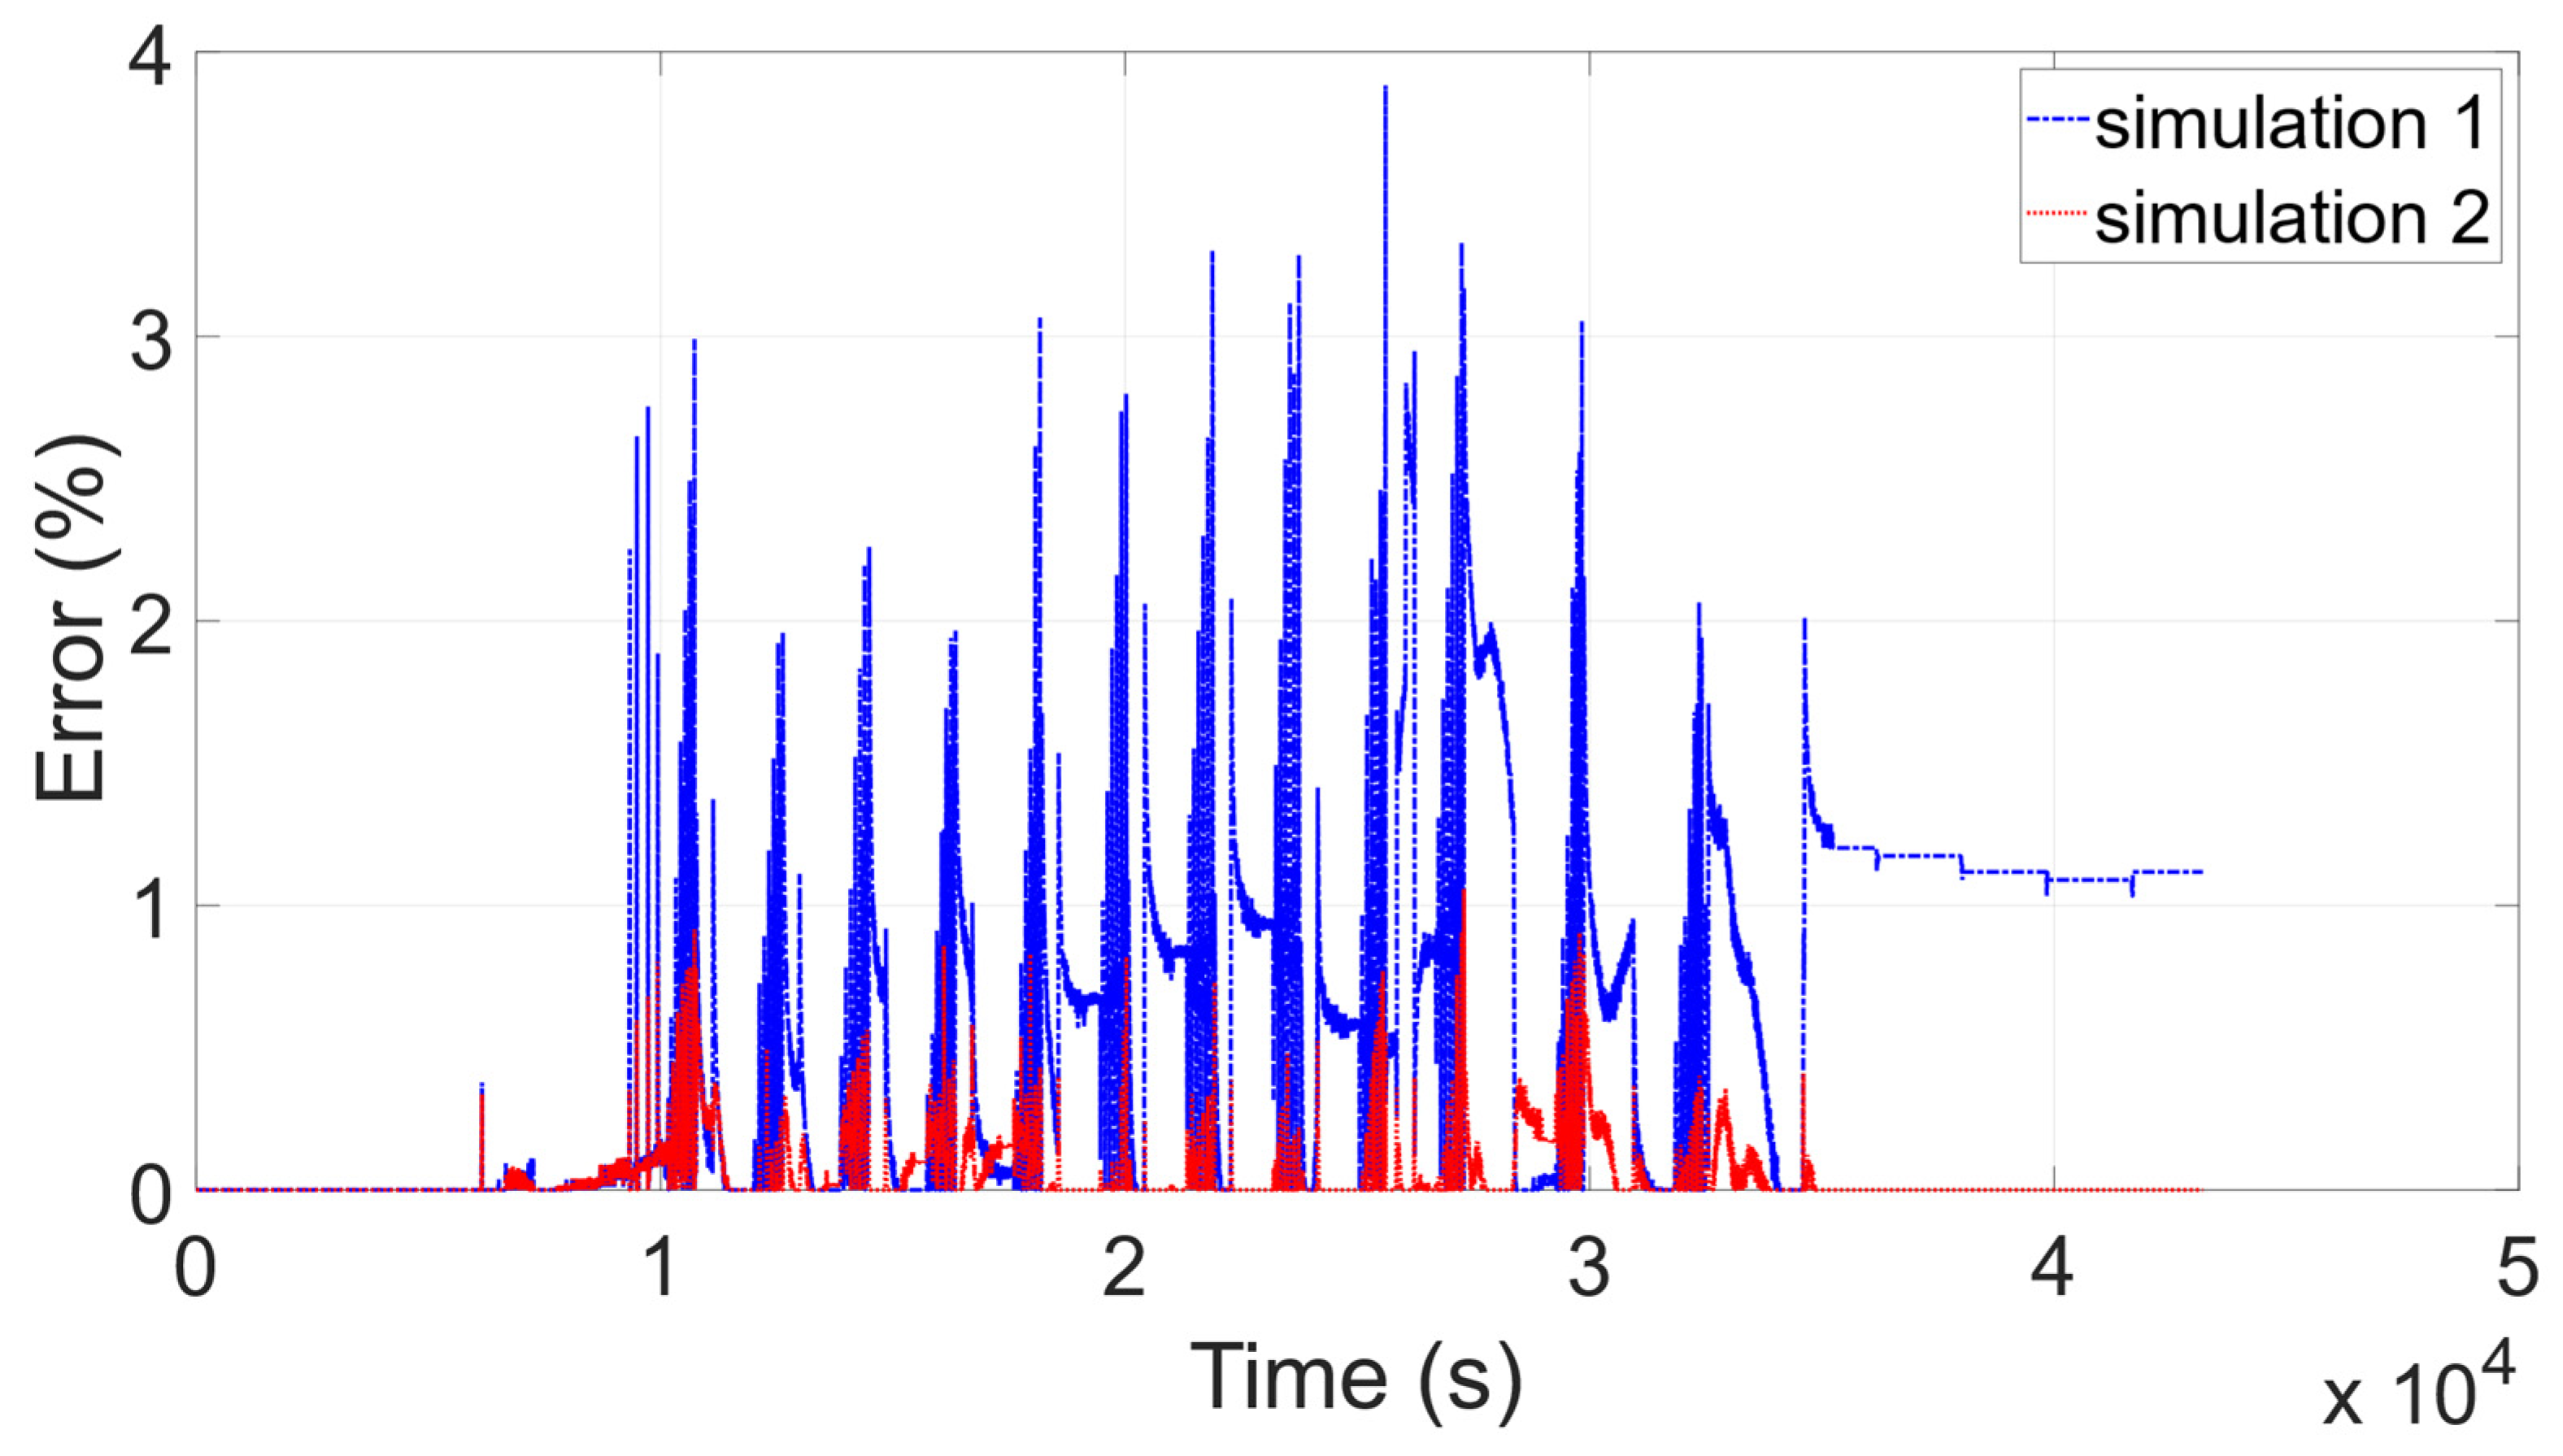
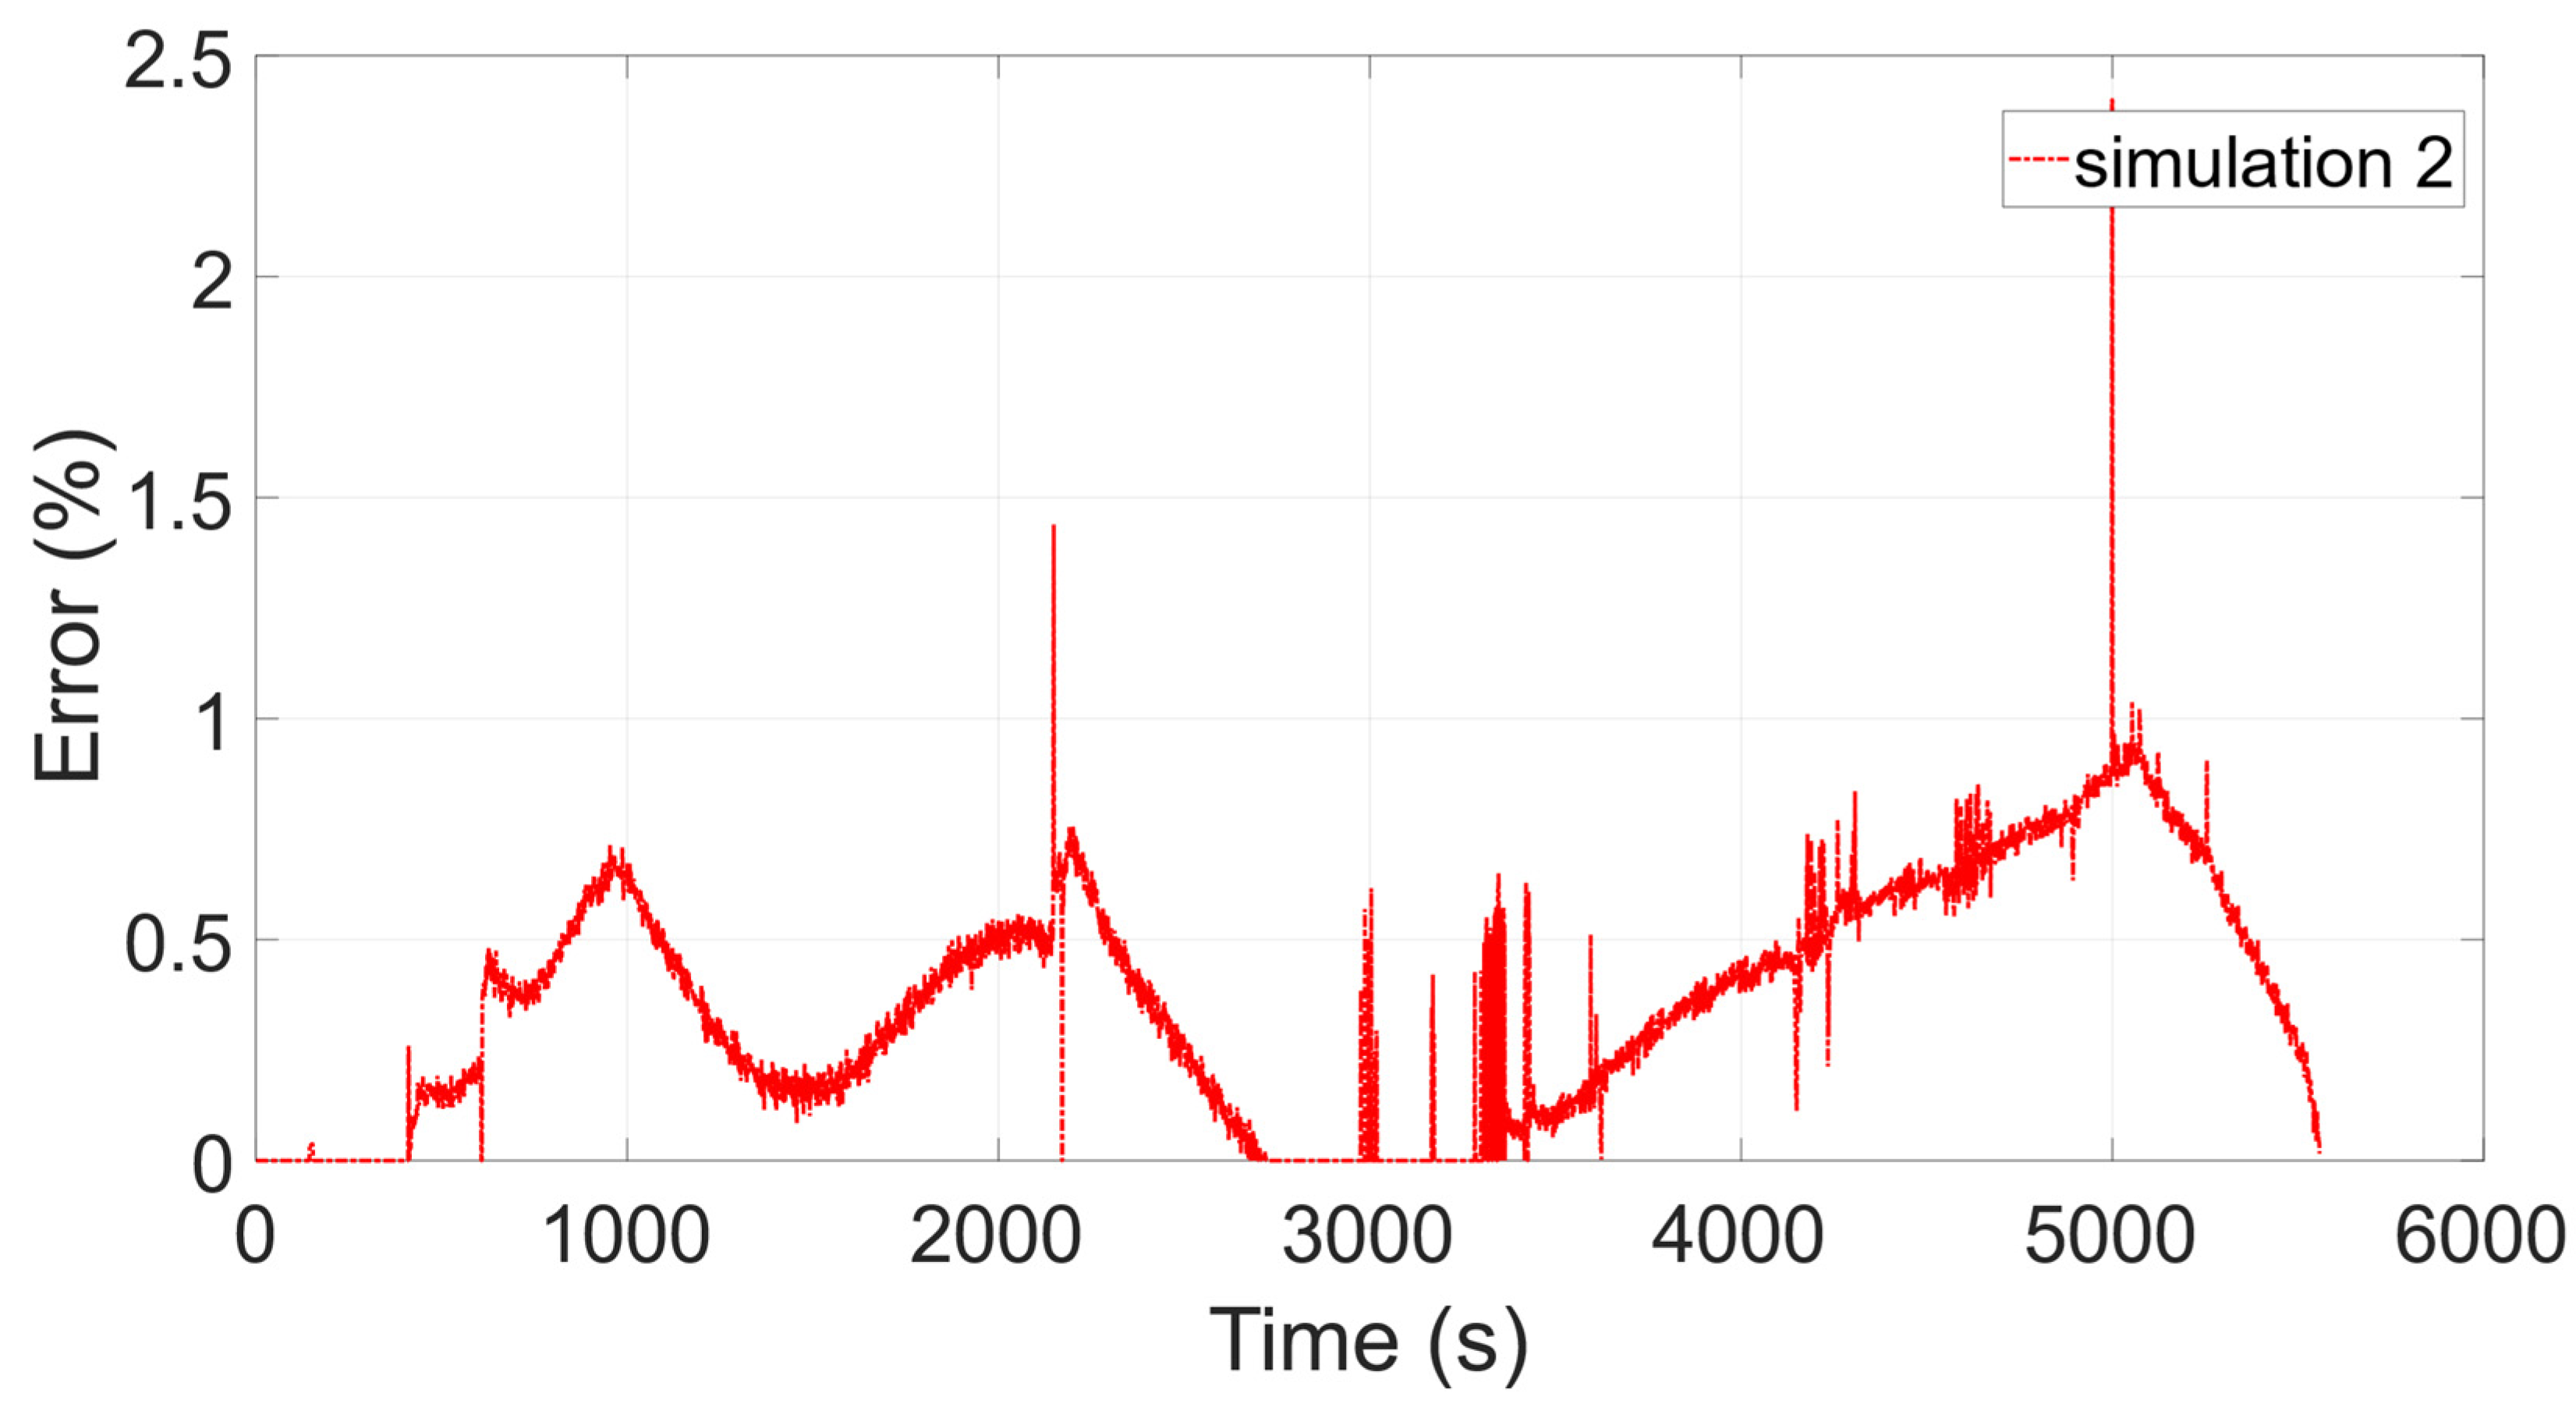
3.4. Model Validation

The starting point for the model validation was the estimation of initial SoC. For this purpose, the OCV(SoC) relationship was used. The tested battery had an initial value of SoC = 84%. Figure 11 and Figure 12 show the voltage and current waveforms during the battery simulation and laboratory test. The measurements and simulations are presented, where “simulation 1” refers to the model described in [9], incorporating constant values of ohmic and diffusion resistance, and “simulation 2” refers to the results of the model proposed in this work. Both models were scaled with reference to Table 4.
Figure 13 shows the efficiency of the battery and Figure 14 shows the relative voltage error of the battery model calculated for the test shown in Figure 11. According to (9), (10) and (12), the efficiency of the battery depends on the ohmic and diffusion resistances, and, because of the increase in diffusion resistance with the C-rate, the battery efficiency is highly dependent on the latter parameter.
The relative error between simulations and measurements was calculated according to:
E r r o r = | U m o d e l U m e s | U m e s · 100 % ,

3.5. Model Robustness Analysis

In order to assess the model robustness and parameter estimation process, a real validation profile was used. The current profile presented in Figure 15 is based on real battery charging with overcharging failure. The battery configuration and experiment setup used in this analysis had the same configuration as described in Section 3.1. The tested battery had an initial value of SoC = 10% and was charged up to value SoC = 100.5%. When the battery reached the SoC value, 100.5%, the BMS urgently cut off the power flow. The proposed model has been checked with a simulation profile over the SoC scale. A comparison between the measurements and simulations of proposed in this work model (simulation 2) is presented in Figure 16. The relative error between simulations and measurements was calculated according to (21), and results are shown in Figure 17.

4. Conclusions

During the simulation, some differences in SoC between the model and the LG JP 1.5 BMS were observed. These were due to different calculation methods used by the authors and in the LG system. The ohmic resistance Ri in the proposed LG JP1.5 battery model is constant. The diffusion resistance Rd value depends on the battery current. The polarisation capacitance depends on the relaxation time and the diffusion resistance of the battery. The lower efficiency that is observed while the higher current value is applied to the battery might be due to the accumulation of electrons at the collectors during charging and the shortage of electrons around the collectors during discharging. The results of Ri and Rd estimation from tests for the battery being charged and discharged are comparable for the same SoC, meaning that it should be sufficient to only carry out either charge or discharge tests for adequate parameterization of the T-D model. It is worth noting that different battery relaxation times were observed during battery charging and discharging. The battery after the charge cycle needs more time to relax than the battery after the discharge cycle.

Author Contributions

Conceptualization, S.P., F.K., J.N.; methodology, S.P. and F.K.; software, S.P.; validation, S.P., F.K., J.N. and F.J.F.M.; formal analysis, S.P.; investigation, S.P.; resources, S.P.; data curation, S.P.; writing—original draft preparation, S.P. and F.K.; writing—review and editing, J.N., F.J.F.M.; visualization, S.P. and F.K.; supervision, S.P., All authors have read and agreed to the published version of the manuscript.

Funding

This work was supported in part by the SCLE SFE Toulouse, 25, Chemin de Paléficat, Toulouse, Occitanie 31200, France.

Acknowledgments

The hardware and software infrastructure used in this research were a part of SCLE SFE company subsidiary ENGIE INEO Group. The authors would like to thank SCLE SFE Company for the special internship program, which enabled experimental validation of the proposed model.

Conflicts of Interest

The authors declare no conflict of interest.

References

  1. Faisal, M.; Hannan, M.A.; Ker, P.J.; Hussain, A.; Mansor, M.B.; Blaabjerg, F. Review of Energy Storage System Technologies in Microgrid Applications: Issues and Challenges. IEEE Access 2018, 6, 35143–35164. [Google Scholar] [CrossRef]
  2. Horiba, T. Lithium-Ion Battery Systems. Proc. IEEE 2014, 102, 939–950. [Google Scholar] [CrossRef]
  3. Schimpe, M.; Naumann, M.; Truong, N.; Hesse, H.C.; Santhanagopalan, S.; Saxon, A.; Jossen, A. Energy efficiency evaluation of a stationary lithium-ion battery container storage system via electro-thermal modeling and detailed component analysis. Appl. Energy 2018, 210, 211–229. [Google Scholar] [CrossRef]
  4. Plett, G.L. Battery Management Systems: Battery Modeling; Artech House: Boston, MA, USA, 2015; ISBN 978-1-63081-023-8. [Google Scholar]
  5. Julien, C.; Mauger, A.; Vijh, A.; Zaghib, K. Lithium Batteries: Science and Technology. Available online: https://www.springer.com/gp/book/9781402069444 (accessed on 16 April 2020).
  6. Arya, A.; Sharma, A.L. Polymer electrolytes for lithium ion batteries: A critical study. Ionics 2017, 23, 497–540. [Google Scholar] [CrossRef]
  7. Barreras, J.V.; Pinto, C.; de Castro, R.; Schaltz, E.; Swierczynski, M.; Andreasen, S.J.; Araújo, R.E. An improved parametrization method for Li-ion linear static Equivalent Circuit battery Models based on direct current resistance measurement. In Proceedings of the 2015 International Conference on Sustainable Mobility Applications, Renewables and Technology (SMART), Renewables and Technology (SMART), Kuwait City, Kuwait, 23–25 November 2015. [Google Scholar] [CrossRef] [Green Version]
  8. Mathematical Modeling of Lithium Batteries; Springer: Berlin/Heidelberg, Germany, 2017; ISBN 978-3-319-03526-0.
  9. Lacressonniere, F.; Varais, A.; Roboam, X. Scaling Electro-Thermal Model of a Lithium-Ion Battery for Time-Accelerated Experiments in a HIL System. In Proceedings of the Symposium De Genie Electrique (SGE 2018), Nancy, France, 3–5 July 2018. [Google Scholar]
  10. Cheng, C.-S.; Chung, H.S.-H.; Lau, R.W.-H.; Hong, K.Y.-W. Time-Domain Modeling of Constant Phase Elements for Simulation of Lithium Battery Behavior. IEEE Trans. Power Electron. 2019, 34, 7573–7587. [Google Scholar] [CrossRef]
  11. Saidani, F.; Hutter, F.X.; Scurtu, R.-G.; Braunwarth, W.; Burghartz, J.N. Lithium-ion battery models: A comparative study and a model-based powerline communication. Adv. Radio Sci. 2017, 15, 83–91. [Google Scholar] [CrossRef] [Green Version]
  12. Xiong, R.; Cao, J.; Yu, Q.; He, H.; Sun, F. Critical Review on the Battery State of Charge Estimation Methods for Electric Vehicles. IEEE Access 2018, 6, 1832–1843. [Google Scholar] [CrossRef]
  13. Cabello, J.M.; Roboam, X.; Junco, S.; Bru, E.; Lacressonniere, F. Scaling Electrochemical Battery Models for Time-Accelerated and Size-Scaled Experiments on Test-Benches. IEEE Trans. Power Syst. 2017, 32, 4233–4240. [Google Scholar] [CrossRef]
  14. Rivera-Barrera, J.; Muñoz-Galeano, N.; Sarmiento-Maldonado, H. SoC Estimation for Lithium-ion Batteries: Review and Future Challenges. Electronics 2017, 6, 102. [Google Scholar] [CrossRef] [Green Version]
  15. Tremblay, O.; Dessaint, L.-A.; Dekkiche, A.-I. A Generic Battery Model for the Dynamic Simulation of Hybrid Electric Vehicles. In Proceedings of the 2007 IEEE Vehicle Power and Propulsion Conference, Arlington, TX, USA, 9–12 September 2007; pp. 284–289. [Google Scholar] [CrossRef]
  16. Tremblay, O.; Dessaint, L.-A. Experimental Validation of a Battery Dynamic Model for EV Applications. WEVJ 2009, 3, 289–298. [Google Scholar] [CrossRef] [Green Version]
  17. Hernandez-Torres, D.; Turpin, C.; Roboam, X.; Sareni, B. Modélisation en Flux d’énergie d’une Batterie Li-Ion en vue d’une optimisation technico économique d’un Micro-réseau Intelligent. Available online: https://hal.archives-ouvertes.fr/hal-01361618/ (accessed on 16 April 2020).
  18. Zhang, Y.; Lyden, S.; de la Barra, B.A.L.; Haque, M.E. Optimization of Tremblay’s battery model parameters for plug-in hybrid electric vehicle applications. In Proceedings of the 2017 Australasian Universities Power Engineering Conference (AUPEC), Melbourne, Australia, 19–22 November 2017; pp. 1–6. [Google Scholar]
  19. Baccouche, I.; Jemmali, S.; Manai, B.; Omar, N.; Amara, N. Improved OCV Model of a Li-Ion NMC Battery for Online SOC Estimation Using the Extended Kalman Filter. Energies 2017, 10, 764. [Google Scholar] [CrossRef] [Green Version]
  20. Kim, J.H.; Lee, S.J.; Lee, J.M.; Cho, B.H. A new direct current internal resistance and state of charge relationship for the Li-ion battery pulse power estimation. In Proceedings of the 2007 7th Internatonal Conference on Power Electronics, Daegu, South Korea, 22–26 October 2007; pp. 1173–1178. [Google Scholar] [CrossRef]
  21. Locorotondo, E.; Pugi, L.; Berzi, L.; Pierini, M.; Lutzemberger, G. Online Identification of Thevenin Equivalent Circuit Model Parameters and Estimation State of Charge of Lithium-Ion Batteries. In Proceedings of the 2018 IEEE International Conference on Environment and Electrical Engineering and 2018 IEEE Industrial and Commercial Power Systems Europe (EEEIC / I&CPS Europe), Palermo, Italy, 12–15 June 2018; pp. 1–6. [Google Scholar]
  22. Cabello, J.M.; Bru, E.; Roboam, X.; Lacressonniere, F.; Junco, S. Battery Dynamic Model Improvement with Parameters Estimation and Experimental Validation. In Proceedings of the International Conference on Integrated Modeling and Analysis in Applied Control and Automation, Bergeggi, Italy, 21–23 September 2015; ISBN 978-88-97999-63-8. [Google Scholar]
  23. Wu, G.; Li, C.; Jiao, D.; Liu, Y.; Hao, C.; Zhang, Y.; Yu, H.; Zhang, M. State of Charge Estimation for Li-Ion Battery Based on an Improved Peukert’s Equation with Temperature Correction Factor. In Proceedings of the 2016 IEEE Vehicle Power and Propulsion Conference (VPPC), Hangzhou, China, 17–20 October 2016; pp. 1–4. [Google Scholar]
  24. Lee, J.; Kim, Y.; Cha, H. A new battery parameter identification considering current, SOC and Peukert’s effect for hybrid electric vehicles. In Proceedings of the 2011 IEEE Energy Conversion Congress and Exposition, Phoenix, AZ, USA, 16–21 September 2011; pp. 1489–1494. [Google Scholar]
  25. LGChem Catalog Global 2018. Available online: https://www.lgchem.com/upload/file/product/LGChem_Catalog_Global_2018.pdf (accessed on 16 April 2020).
  26. Battery Management Systems: Accurate State-of-Charge Indication for Battery Powered Applications; Pop, V. (Ed.) Philips research book series; Springer: Dordrecht, The Netherlands, 2008; ISBN 978-1-4020-6944-4. [Google Scholar]
Figure 1. Lithium-ion cells’ voltage and energy density [5].
Energies 13 02411 g001
Figure 2. The general structure of the battery circuit model [9].
Energies 13 02411 g002
Figure 3. Test devices with measurements, the view of the test.
Energies 13 02411 g003
Figure 4. Comparison of different relaxation times sufficient for accurate determination of a battery’s OCV.
Energies 13 02411 g004
Figure 5. Test bench configuration during the HPPC test.
Energies 13 02411 g005
Figure 6. HPPC test algorithm.
Energies 13 02411 g006
Figure 7. HPPC test. (a) current waveform (b) voltage waveform.
Energies 13 02411 g007
Figure 8. Voltage waveform during the OCV and multiple HPPC tests.
Energies 13 02411 g008
Figure 9. Voltage waveform during the HPPC used for parameter calculation.
Energies 13 02411 g009
Figure 10. Ohmic resistance and diffusion resistance in the function of SoC and C-rate of the battery: (a) ohmic resistance (b) diffusion resistance.
Energies 13 02411 g010
Figure 11. Battery voltage waveform during the battery discharge test—measurements and simulations.
Energies 13 02411 g011
Figure 12. Battery current (C-rate) waveform during the battery discharge test—measurements and simulations.
Energies 13 02411 g012
Figure 13. Battery efficiency during the charge and discharge test—simulation 2 results.
Energies 13 02411 g013
Figure 14. Simulation results: the model’s relative error.
Energies 13 02411 g014
Figure 15. Battery current (C-rate) waveform profile during the battery charge test—measurements and simulation.
Energies 13 02411 g015
Figure 16. Battery voltage waveform during the battery charge test—measurements and simulation.
Energies 13 02411 g016
Figure 17. Simulation results: the model’s relative error (charge test).
Energies 13 02411 g017
Table 1. Most common LiB cell technologies text near to the first time they are cited.
Cathode MaterialShort Name of Cathode Material Anode Material
LiCoO2LCOGraphite
LiNiO2LNOGraphite
LiNi0.8Co0.15Al0.05O2NCAGraphite
LiNixMnyCo1–x–yO2NMCGraphite
LiMn2O4LMOGraphite
LiNi1/2Mn3/2O4LNMGraphite
LiFePO4LFPLi4Ti5O12
Table 2. Characteristic of battery module and cell [25].
ModuleCell
ModelUPB 4860 (14S4P)JP 1.5
Energy (kWh)3.10.22
Capacity (Ah)6015.75
Voltage Range (V)42-593-4.2
Max current (A)240 A60 A
Dimension (W × H × D, mm)445 × 122 × 550-
Technology-NMC1
1 The probable cell technology identified from OCV measurements.
Table 3. Estimated OCV curve parameters.
SymbolValueUnit
E02.721V
A1.459V
B0.04013A−1
K0.0004589A−1
Q15.75Ah
Vmaxch4.2V
Vmindisch3.0V
Table 4. Scaling of the model parameters for the multicell system.
CoefficientConfiguration Variables
Constant specific voltage E0 E 0 ( m o d ) = E 0 c e l l · n s e r i e s
Exponential zone voltage A A ( m o d ) = A · n s e r i e s
Exponential zone capacity B B ( m o d ) = B · 1 n p a r a l l e l
Polarisation constant K K ( m o d ) = K · n s e r i e s n p a r a l l e l
Capacity Q Q ( m o d ) = Q · n p a r a l l e l
Ohmic resistance R i R i ( m o d ) = R i · n s e r i e s n p a r a l l e l
Diffusion resistance R d R d ( m o d ) = R d · n s e r i e s n p a r a l l e l
Diffusion capacitance C d C d ( m o d ) = C d · n p a r a l l e l n s e r i e s

