1. Introduction
Recent years have seen significant developments in the technology used to convert solar energy into a reliable power source [
1,
2,
3,
4]. Photovoltaic (PV) modules, which allow the direct production of electricity, are the most commonly used technology, and many new developments have focused on increasing the efficiency of such devices, particularly in terms of power generation from the surface of solar generators [
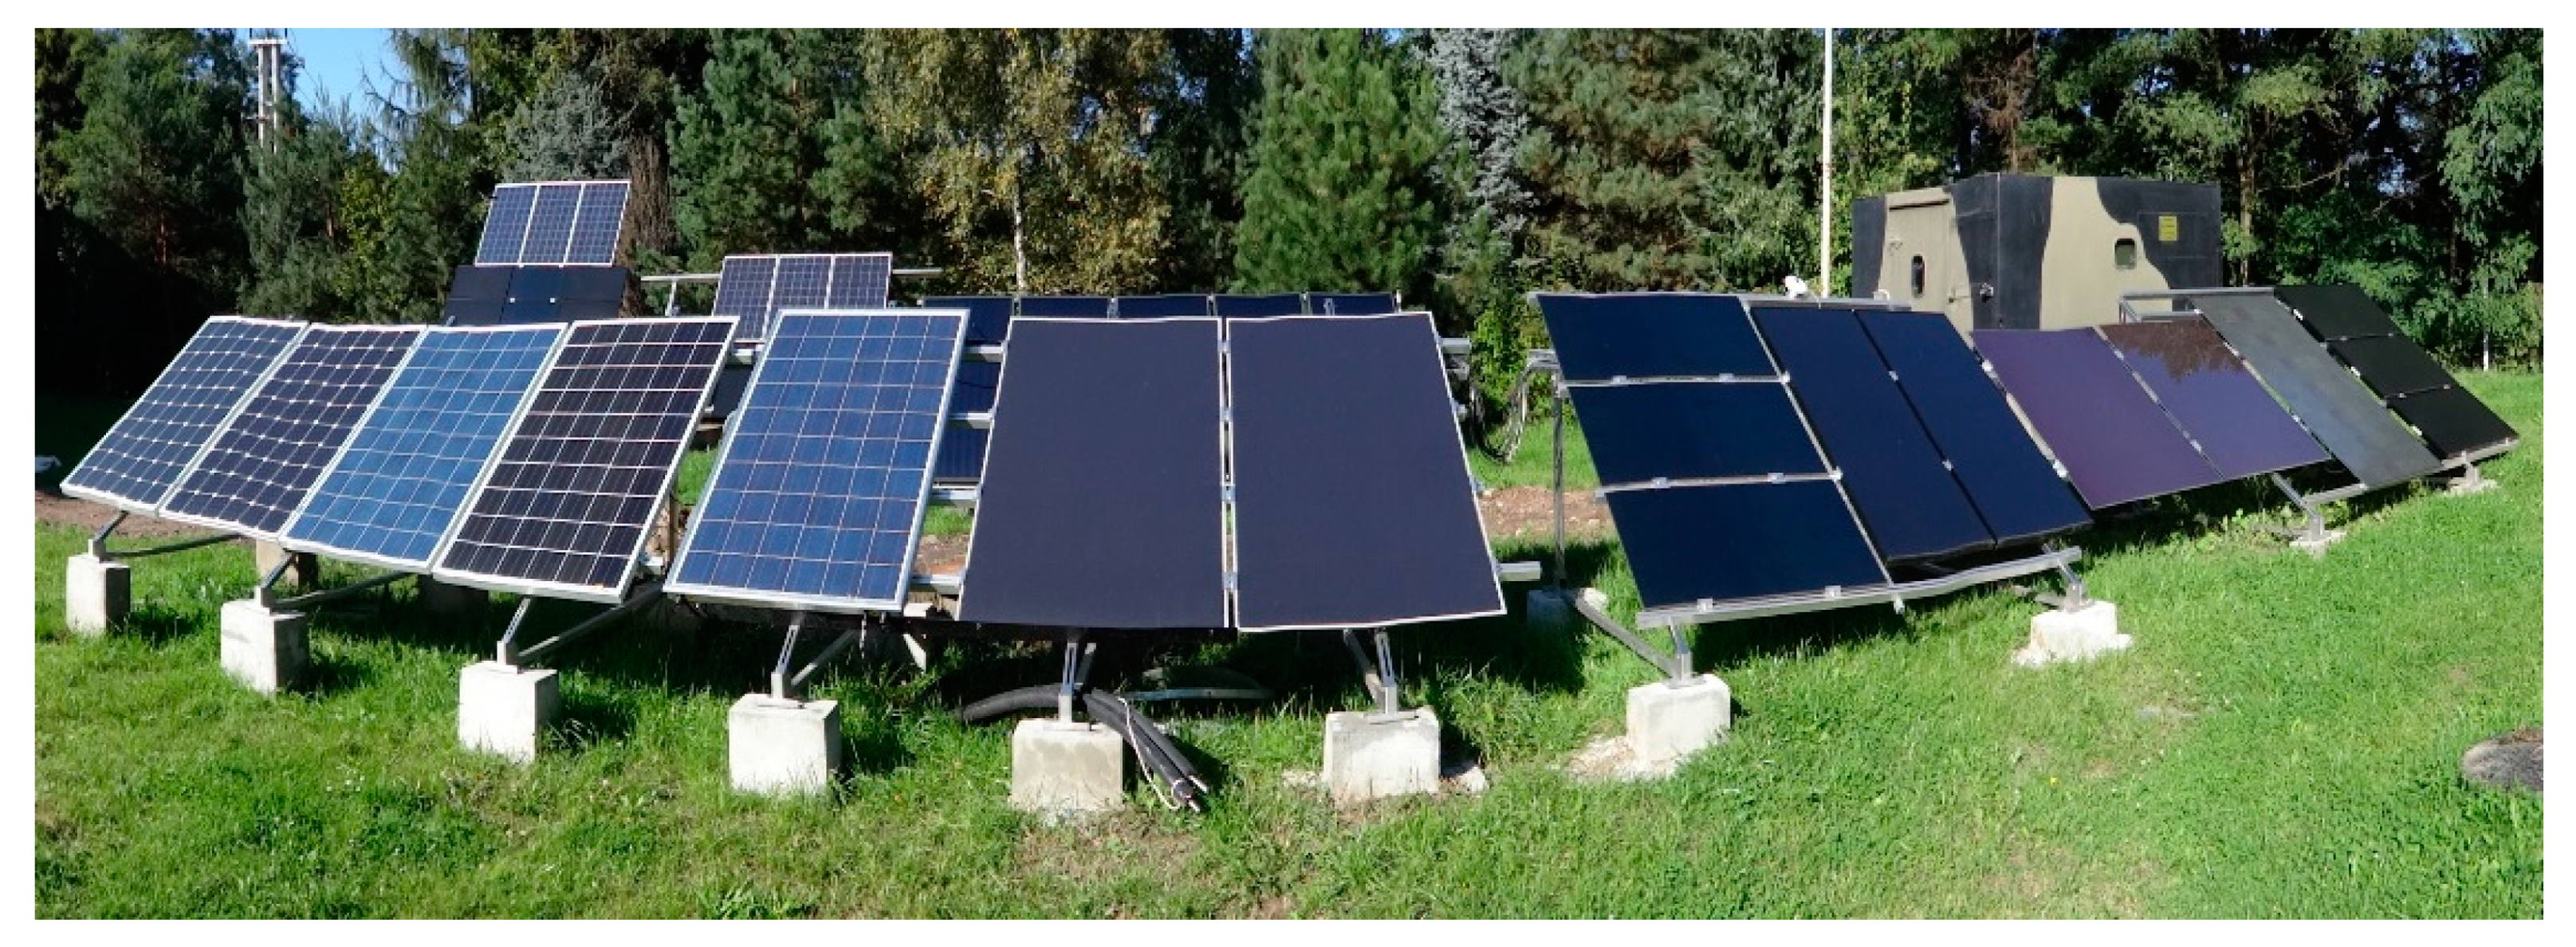
5]. A side effect of PV modules is their slight but unavoidable degradation caused by solar radiation. The study was conducted in the AGH-UST Educational and Research Laboratory of Renewable Energy Sources and Energy Saving in Miękinia near Krzeszowice (50°09′37.4”N 19°36′04.7”E), where an installation with different PV modules was constructed, as shown in
Figure 1. The laboratory offered substantive and technical support, which allowed the experiment to be conducted.
A sizable amount of analyzed research has been devoted to PV cooling technologies in hot climatic conditions under high irradiance and ambient temperature. However it is also important to see whether the effect of PV cooling is also discernible in colder conditions. This is why the purpose of our research and analyses was to determine if cooling PV modules can improve their work parameters and maximize the energy yields achieved during the operation of PV panels under central European weather conditions. The aim was also to test and select the most efficient form PV cooling method, i.e., the one which allows the greatest power production density to be attained. It is important to bear in mind the discrepancy between the power obtained when a panel works in real conditions and its nominal power, given in kWp, which is a standardized parameter for all solar modules [
6]. The nominal power of the PV module is achieved in standard test conditions (STC) by laboratory testing, in which the most important parameters are:
solar radiation intensity—1000 W/m2;
temperature of photovoltaic cells exposed to light—25 °C;
spectrum of solar radiation—AM 1.5
During the operation of the PV installation in real conditions, it is extremely difficult to achieve low temperature (as in STC conditions), especially when the device generates electricity under the full intensity of solar radiation. Such conditions occur during winter, when the outside temperature is very low and solar radiation is high (e.g., in the uppermost parts of mountainous areas). However, the periods in which a photovoltaic installation generates the largest amount of energy and the highest power are characterized by both high values of solar radiation and an ambient temperature, which makes it impossible to maintain a low temperature value for the PV panels [
7]. The effect of sunlight on the dark blue or black surface of the device (with a relatively high radiation absorption coefficient) determines the increase in its temperature. PV modules are made from semiconductors, which have changing resistance values depending on temperature. For example, an increase in temperature reduces the band gap of a semiconductor, and this leads to the decrease of the open-circuit voltage generated by the module. While voltage drops noticeably with a temperature increase, the current generated only increases slightly. The power of the photovoltaic module is expressed as the product of instantaneous current and voltage values of the PV module, whereby the voltage parameter has a much greater significance [
8]. Therefore, it is important to take into consideration changes in ambient temperatures during their operation when photovoltaic installations are designed. Most of the research on cooling PV modules is based on thermal photovoltaic devices (PVT). In the research of Bianchini et al., the installation with PVT modules was monitored and it was determined that the cooling of PV modules in this way causes a slight increase in electrical efficiency (about 1%–3%) [
9]. Research on cooling PV modules via water flowing over the photovoltaic panels was made by Krauter, where he showed that the efficiency of energy conversion throughout the day increased by approximately 10% [
10]. Another way to reduce the temperature of the PV module is back surface water cooling. This method was also used by Bahaidarah et al., and they obtained an increase in efficiency of 9% in their research [
11]. It is also possible to cool a PV module using fans and forced air, as shown by Amelia et al. They attained an increase of about 44%, an excellent result and also very interesting, given that it was achieved by reducing the temperature of the PV module by only about 22% [
12]. For photovoltaics, the problem of humid conditions and dust deposits on the surface of PV modules is well-known and can lead to the cementation process. The problem of cementation was described by Klemens [
13]. He wrote that in humid conditions, soluble fractions of the deposited dust are partly or completely dissolved by water present on the surface, especially by water condensed from humid air. In the same paper, Klemens refers to Jamil et al. [
14], who suggested the water cleaning method as a one way of mitigating soiling. Also of importance is the fact that the cooling of PV modules by means of constantly flowing water also removes dust from the surface, and this helps PV modules work with greater efficiency. In recent years, considerable attention has been paid to research on the impact of dust accumulation on module parameters [
15].
2. Materials and Methods
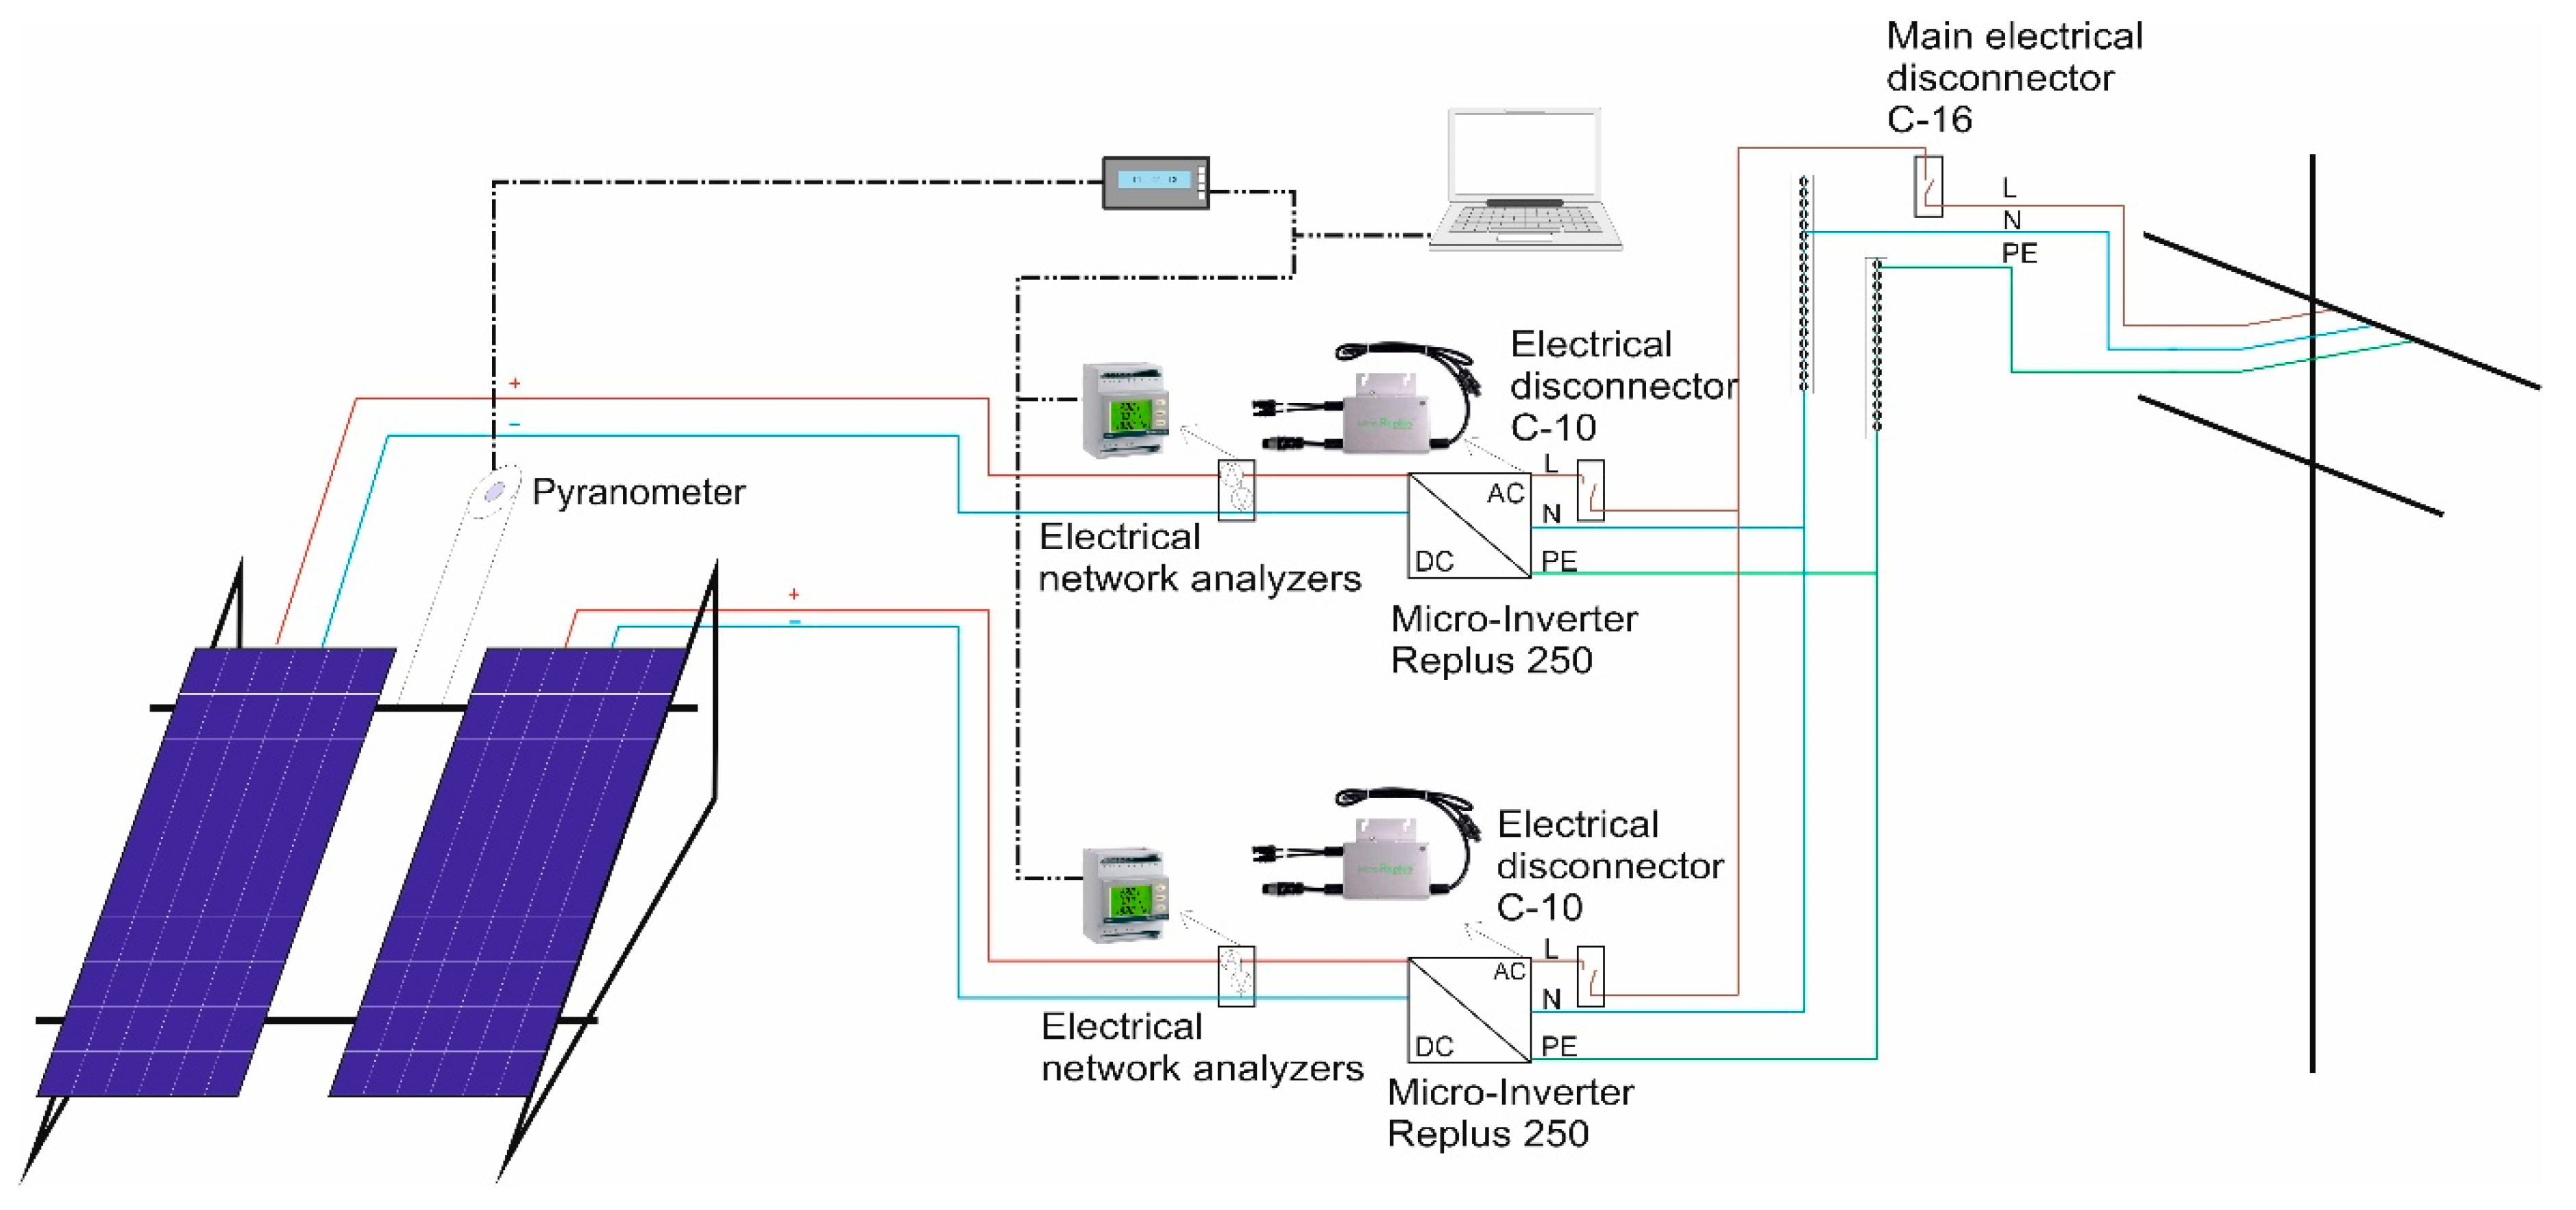
The research was conducted using 240 Wp polycrystalline solar PV modules GermanSolar GSP5 240-SI60 (GermanSolar AG, Germany), connected to an electrical grid with 220-Watt microinverters ReneSola Micro Replus-250 (Renesola Deutschland GmbH, Germany). The area of the investigated module is 1.6335 m
2. The stand included a pair of PV modules, one of which was a reference device, with the other being the research subject. Both PV modules were mounted at a 30-degree angle relative to the horizontal ground surface and faced south. The measuring system consisted of a DC network parameters meter Nemo D4 DC (IME, Italy), which read the instantaneous parameters of the electrical voltage, current and power of each PV module. The temperature of the PV module was measured by means of a PT1000 sensor (Heraeus Nexensos GmbH, Germany), which was attached to the back of the module. The intensity of solar radiation was measured using a Kipp & Zonen CMP6 pyranometer (Kipp & Zonen, The Netherlands). All data was saved on a computer using the mLog program (Metronic AKP Ltd., Poland). The scheme of the test stand with all equipment used during the experiment is shown in
Figure 2.
The main aim of the research was to reduce the temperature of the photovoltaic modules during the generation of electricity, as this was supposed to lead to an increase in the power of the solar generators. To reduce the temperature of the device, it was decided to use cold tap water, which is a good way of cooling photovoltaic modules [
16,
17,
18,
19,
20]. The water used in cooling the PV modules was taken from a regular water supply network, as the investigation was unable to secure a closed circuit source. At the beginning of the experiment, the cooling water that flowed over the surface of the module was captured in a 1.5 L container as run off in order to estimate the water flow, which is equal about 0.11 L/s. This water flow was maintained as a constant throughout the tests. As a result, to cool the PV module, almost 400 L per hour were used. Further tests are required to establish the efficiency of a system when PV modules are cooled by water in a closed circuit.
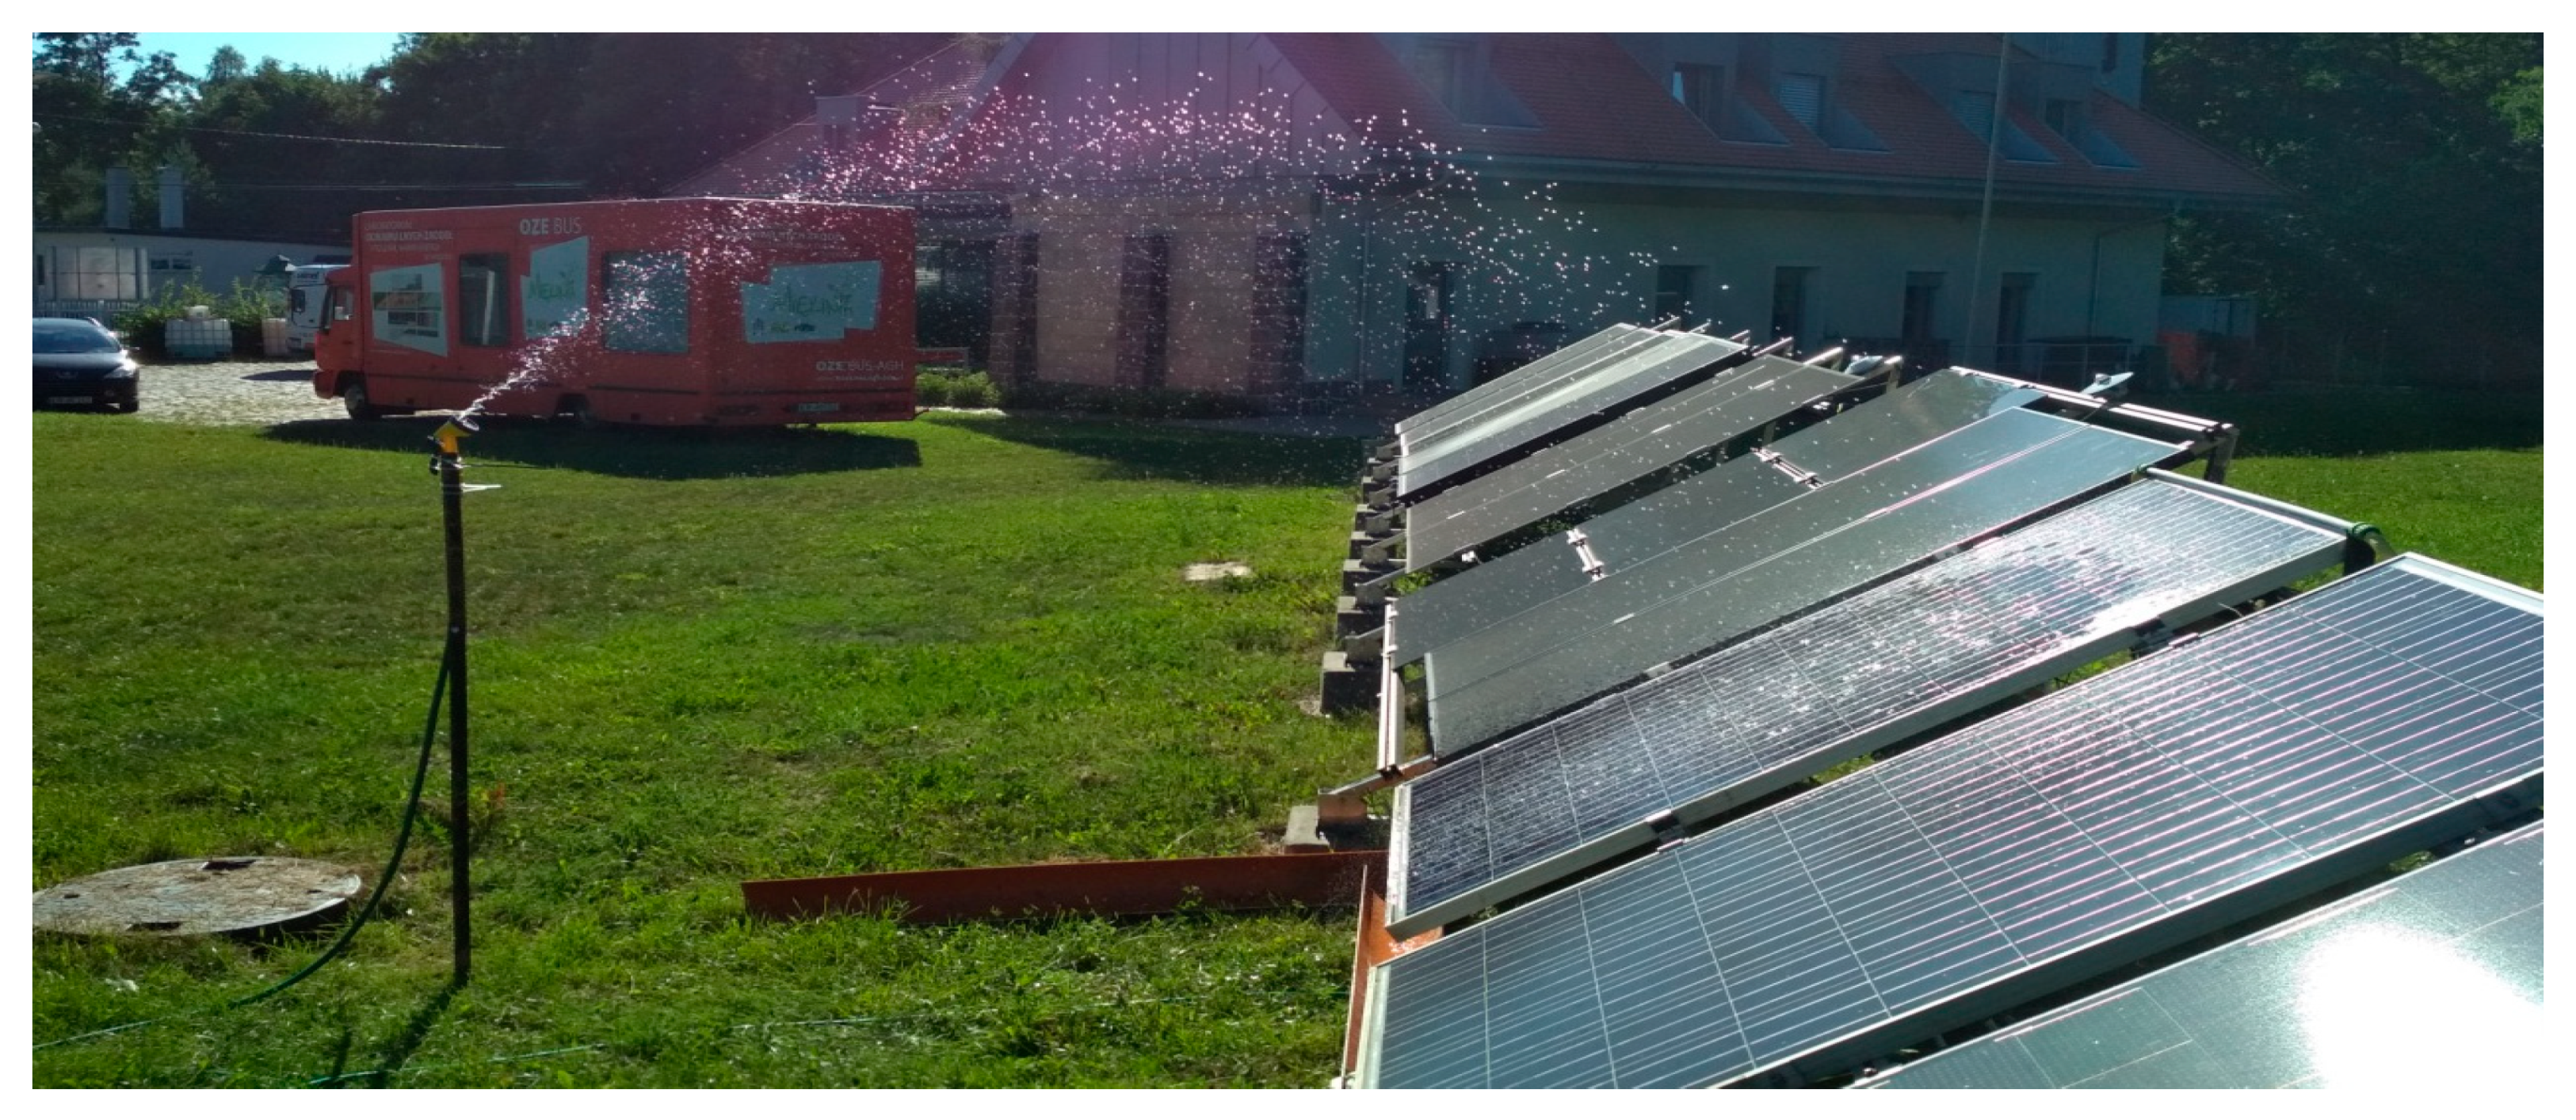
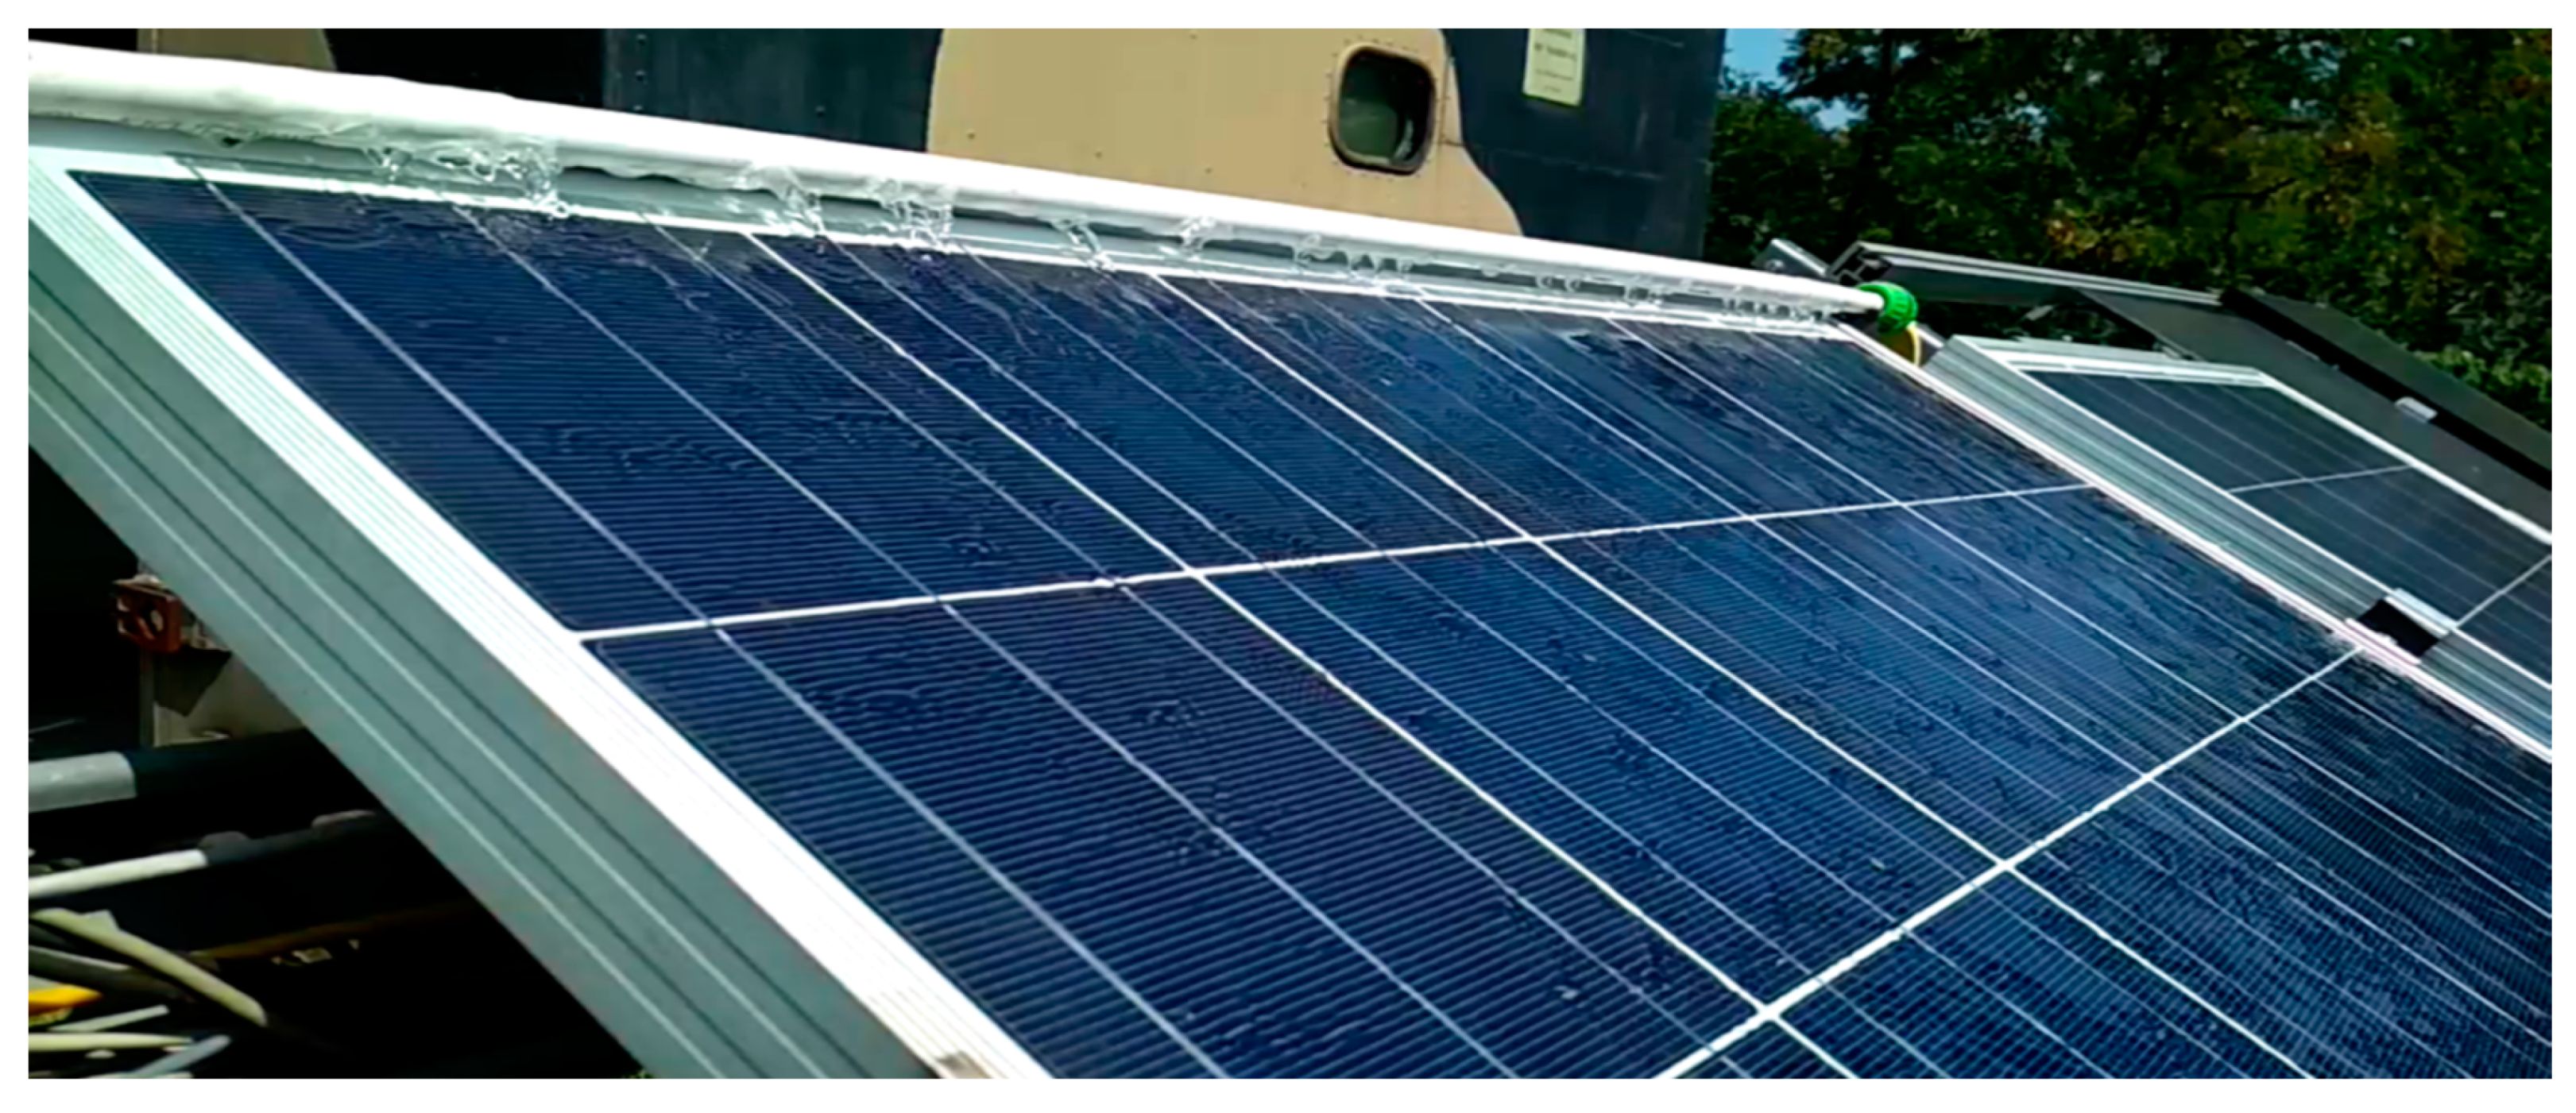
Two solutions were used—imitation of rain (
Figure 3) and water film (
Figure 4), the latter being a thin layer of water flowing over the surface of the module, akin to a river in a wide shallow riverbed. During the cooling of the PV module, the water film completely covered the module. According to the literature survey, the creation of a water film on the front or back of a photovoltaic module is a popular method for cooling PV modules [
10,
11]. Having reviewed other papers on the matter, the authors were unable to find any information about cooling with rain imitation. As a result, this research was designed to compare both methods.
The first stage of research was made to determine which solar module cooling method would bring about the better effect. For this purpose, a test was carried out during which one of the photovoltaic modules was cooled in the two ways under real operating conditions. The investigated photovoltaic module had water poured over it in imitation of rain for the first 15 min, and by water in the form of a film water for the next 15 min. The cooling method was changed by switching off the system with rain imitation, while at the same time, a water film system was launched. The results were compared to the reference module, which was not cooled. When the results were obtained, the second stage of research was carried out using the best cooling method. The aim of the second stage of the research was to maximize the efficiency of the PV module as a result of cooling. The second stage of research lasted for an hour, and the cooling was continuous during both stages of the research.
3. Results
During the first comparative 30-min test, favorable atmospheric conditions occurred. The ambient temperature was 28 °C with slight cloud cover, which caused the sun to be covered twice during the experiment. The relative air humidity during the test was measured by the Polish Institute of Meteorology and Water Management National Research Institute at the nearest station, which is located 20 km from the research stand. The figure provided was 66.6% [
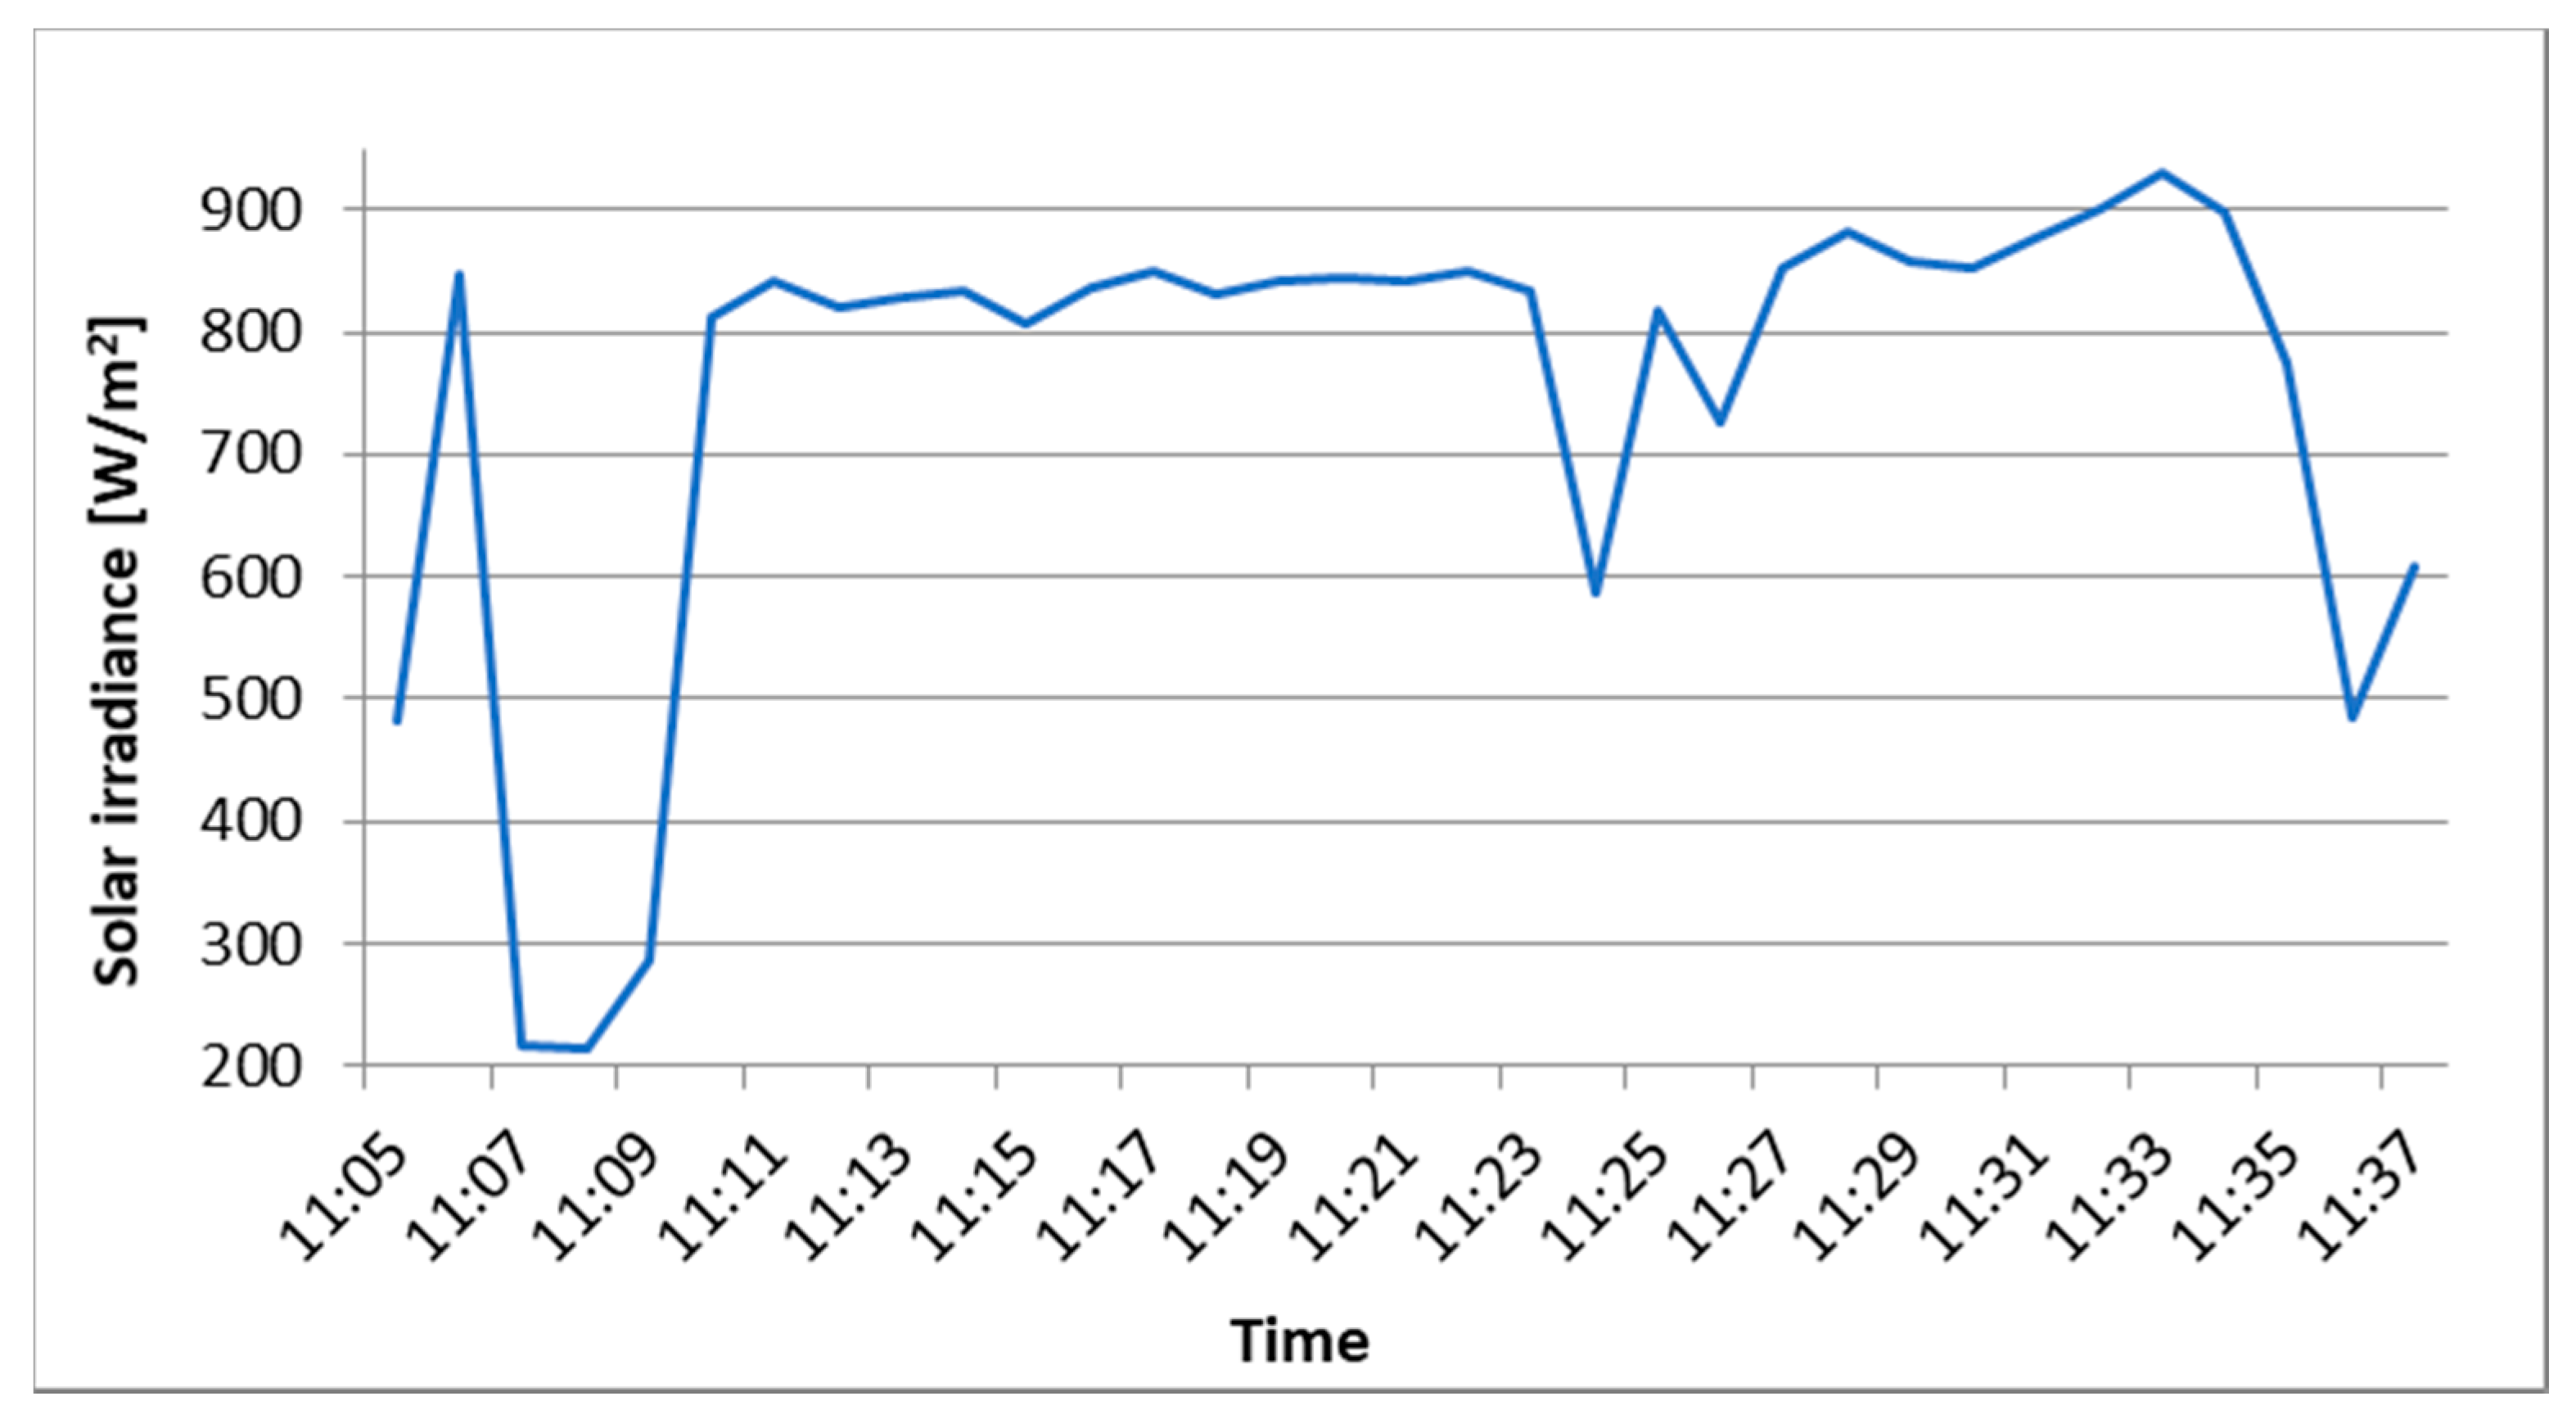
21]. Wind conditions were moderate, characterized by an average wind speed of 0.7 m/s, with a temporary maximum value of 5.8 m/s. The moments when clouds shaded the modules are visible in the graphs in
Figure 5. Especially at the beginning of the research, the cloud cover was so extensive that the value of solar irradiance dropped from the level of 800–900 W/m
2 to almost 200 W/m
2, which clearly influenced the instantaneous power of the devices. The changes in solar radiation during the 30-min experiment are shown in
Figure 5.
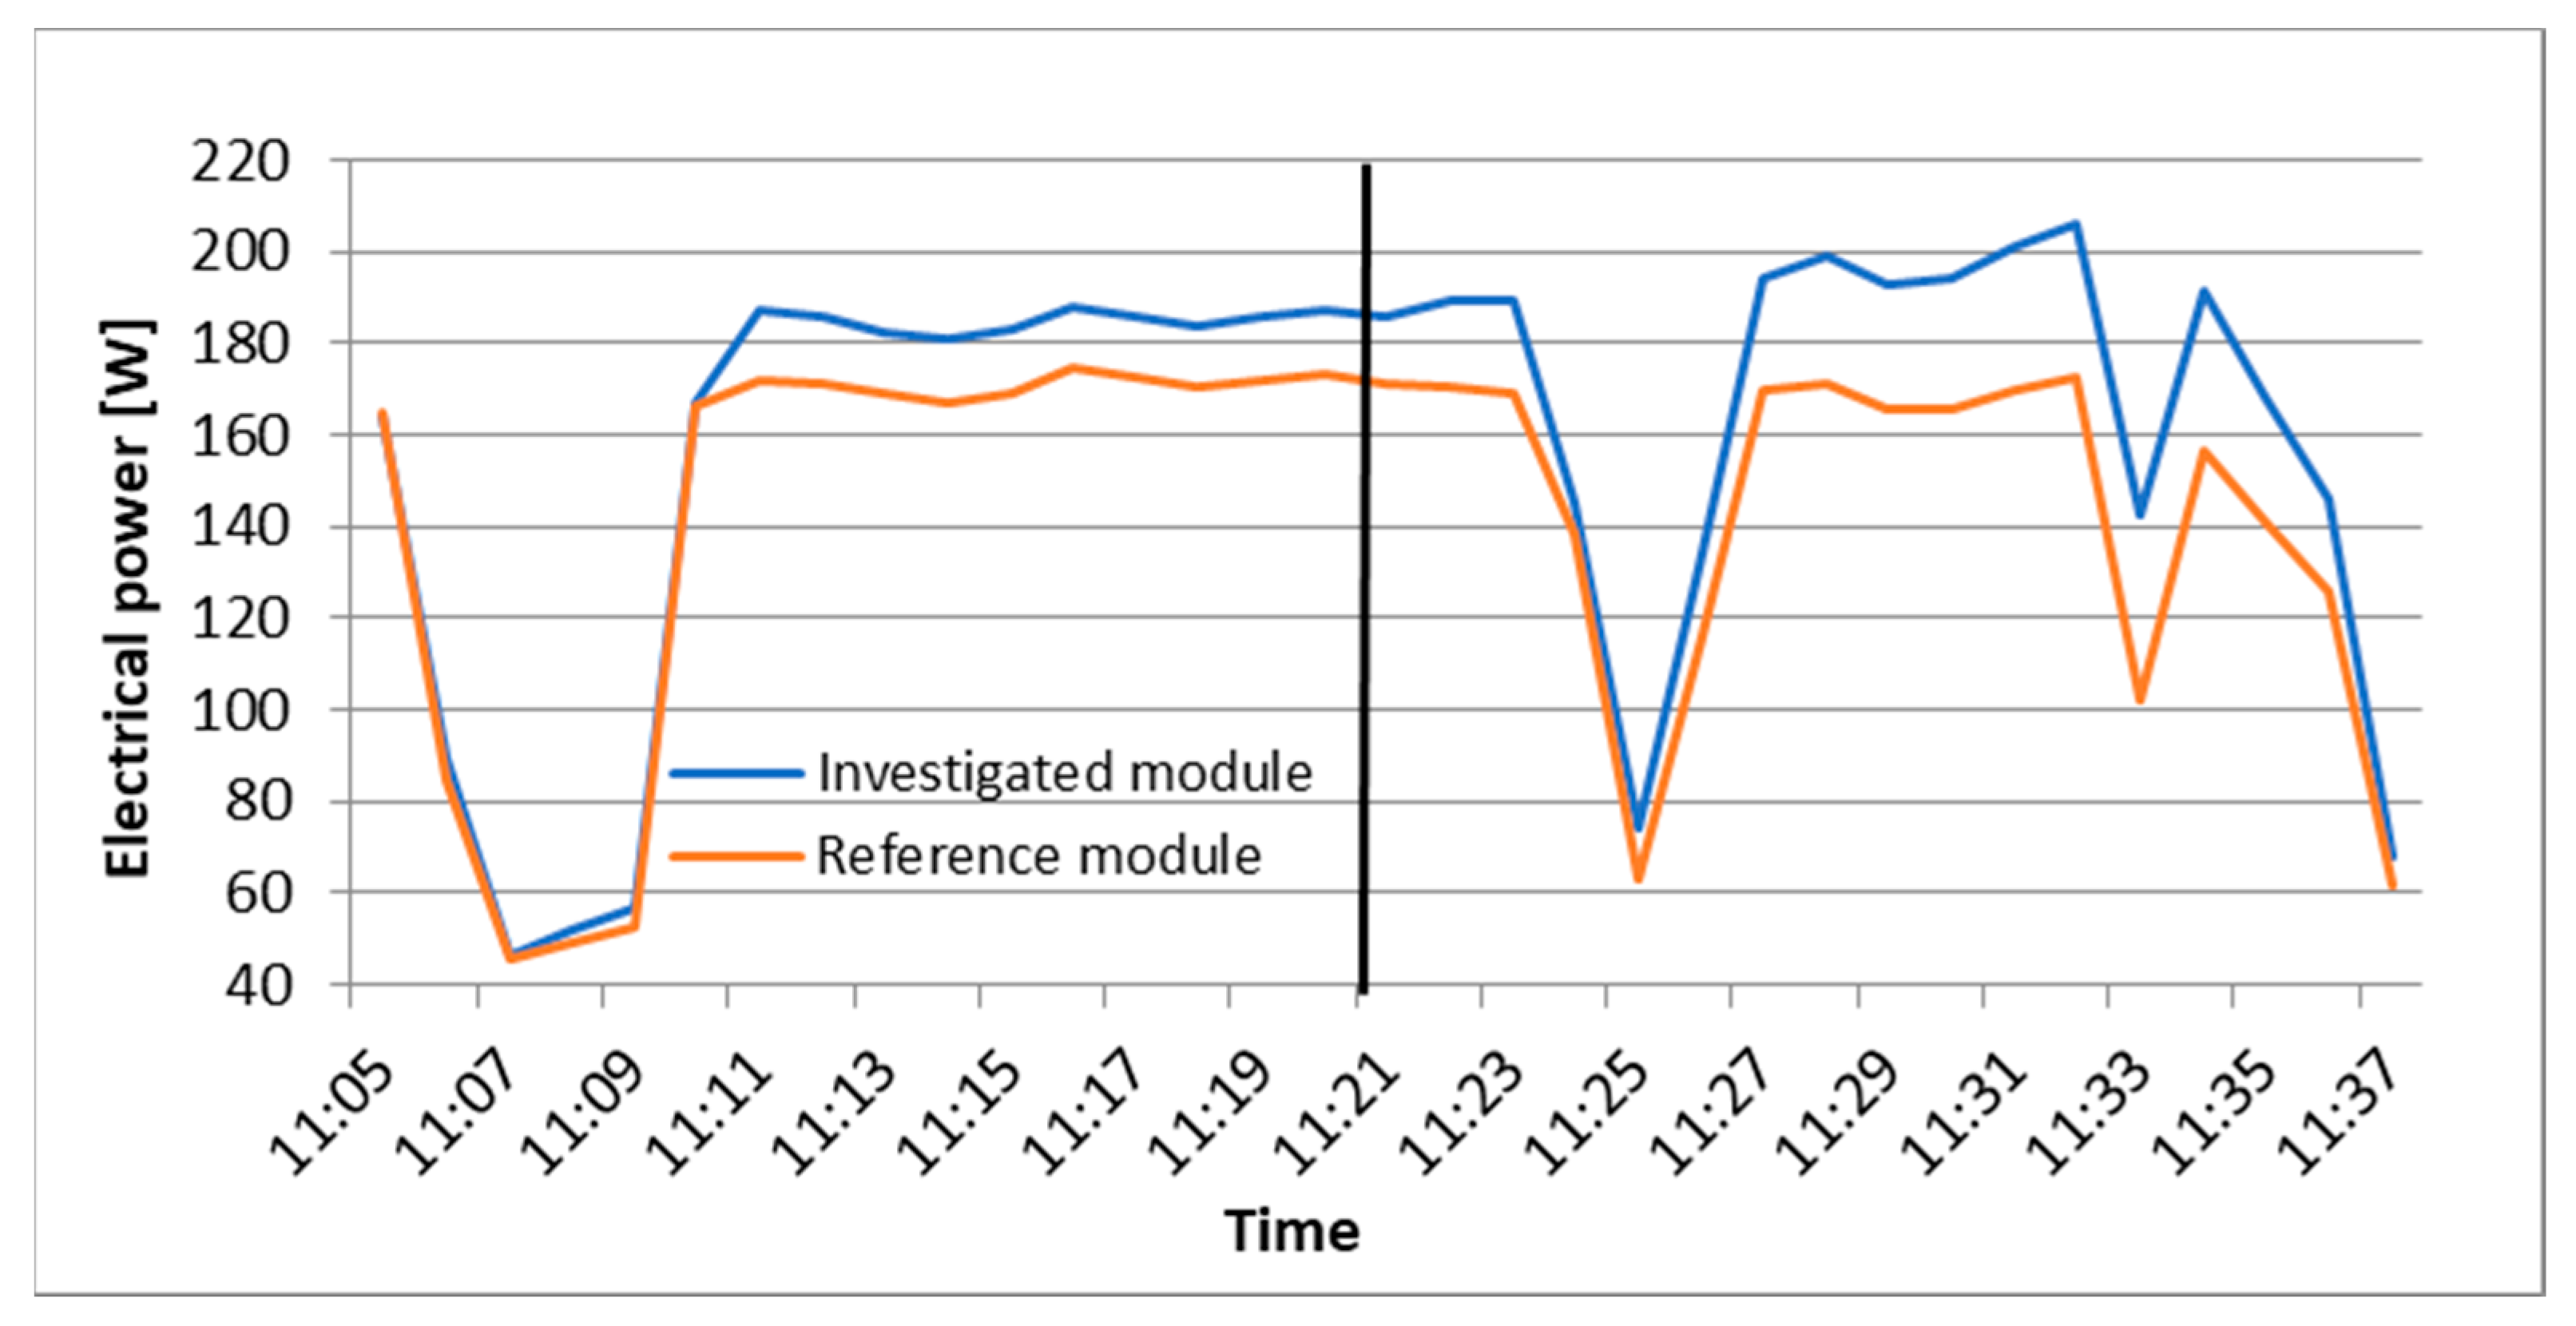
The graph shown in
Figure 6 clearly confirms the influence of cloud cover. However, once the solar conditions stabilize, the effect of cooling starts to be noticeable and has a clear influence on the improvement of the tested module’s power compared with the power of the reference module. The use of rain imitation in these atmospheric conditions meant that 15 W of extra power was obtained in the cooled device. The attached chart shows the time from 11:05:39 to 11:21:30, when the investigated module was cooled by rain imitation. Then, the cooling system changed and water in the form of a water film started to flow as shown in the chart from11:21:30 to 11:37:09. The cooling effect is immediately noticeable. In the graph (
Figure 6), the power lines of both devices clearly start to diverge. Then, momentary cloudiness causes the power of the solar generators to fall by almost the same value, but when favorable conditions returned, the excess power in the cooled module gradually increased. It ranges from 20 W at the beginning of the water film to over 30 W at its peak.
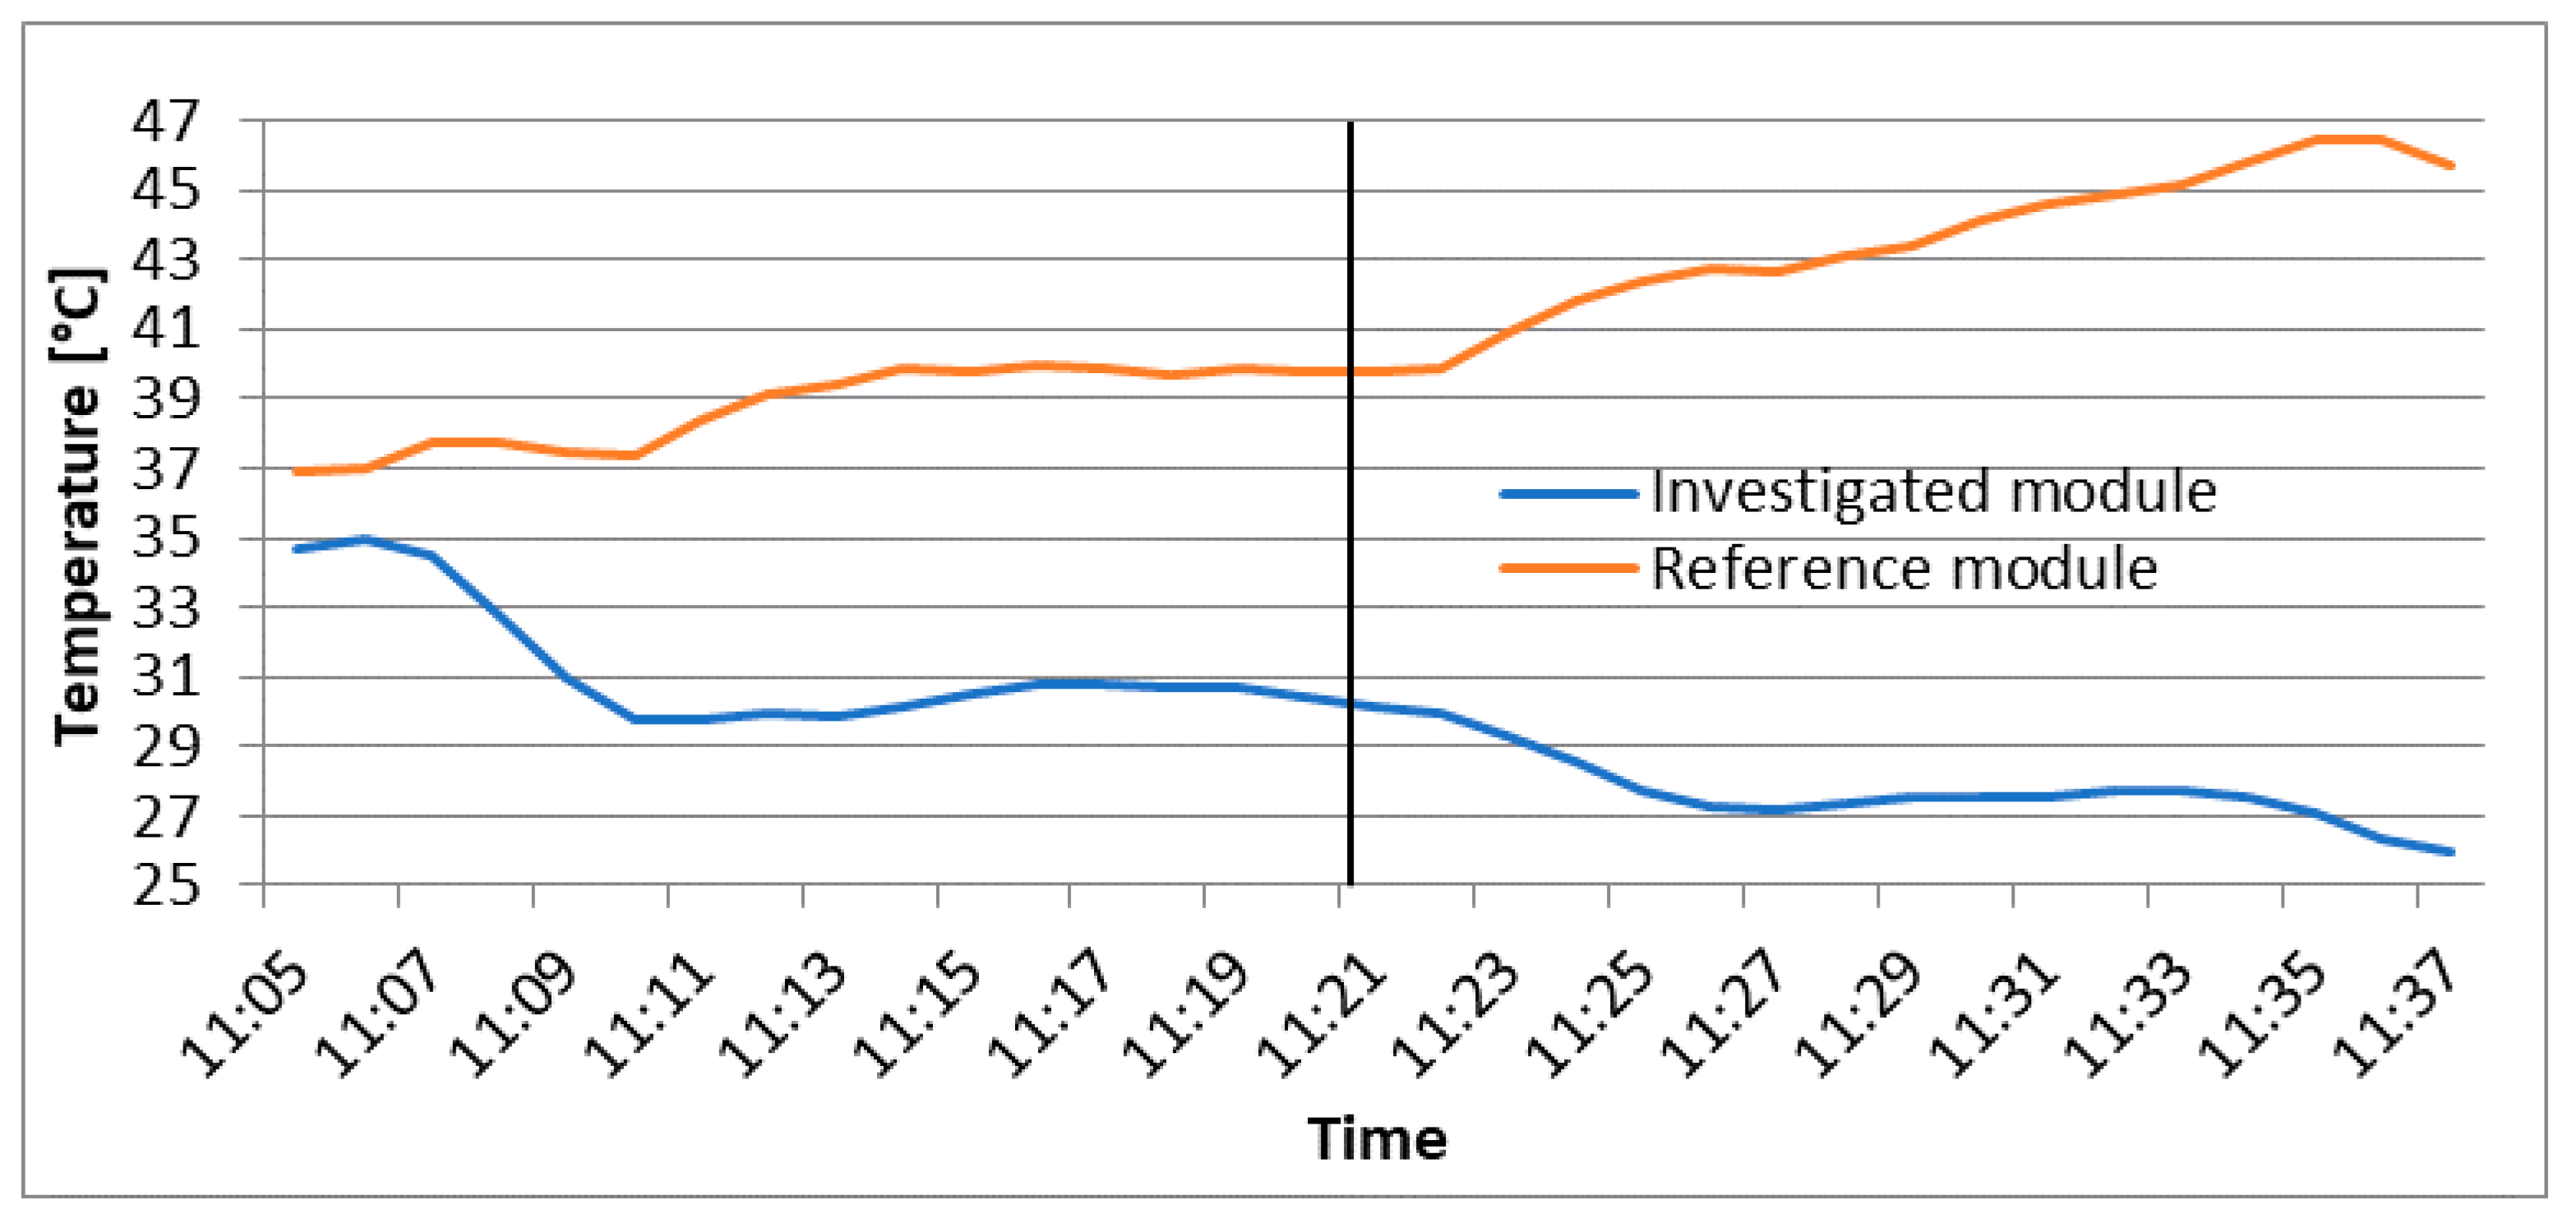
The diagram of temperature changes for the cooled PV module and the reference module is shown in
Figure 7. It clearly shows the differences in the cooling efficiency of each of the systems used. At the peak of cooling by means of a water film, it achieves twice the difference in temperature, lowering the device’s temperature by 20 °C, in comparison with only 10 °C when cooling with a rain imitation. It is extremely interesting to be able to bring the temperature of the modules of the tested module to 25 °C, that is the same as when these devices are tested in STC conditions (of course, only for temperature, while other parameters like solar radiation and air mass are not taken into consideration). It means that one laboratory condition parameter was obtained in real conditions, which seemed unlikely while maintaining other measurement parameters. Achieving such a working temperature of the modules brings the actual power of the device to its maximum power. The average temperature of the water used to cool the PV module was approximately 21.1 °C. It was observed during the study that the temperature of the reference module gradually increased due to the constant operation of the sun on its surface, at a relatively high ambient temperature. In
Figure 7, it can be observed that the temperature of the investigated module (which had water poured on it) fell in the first 5 min (from 11:05 to 11:10) and then stabilized at a constant level. Also, in the second part, the same can be observed: the temperature fell from 11:21 to 11:26 and then stabilized at a constant level.
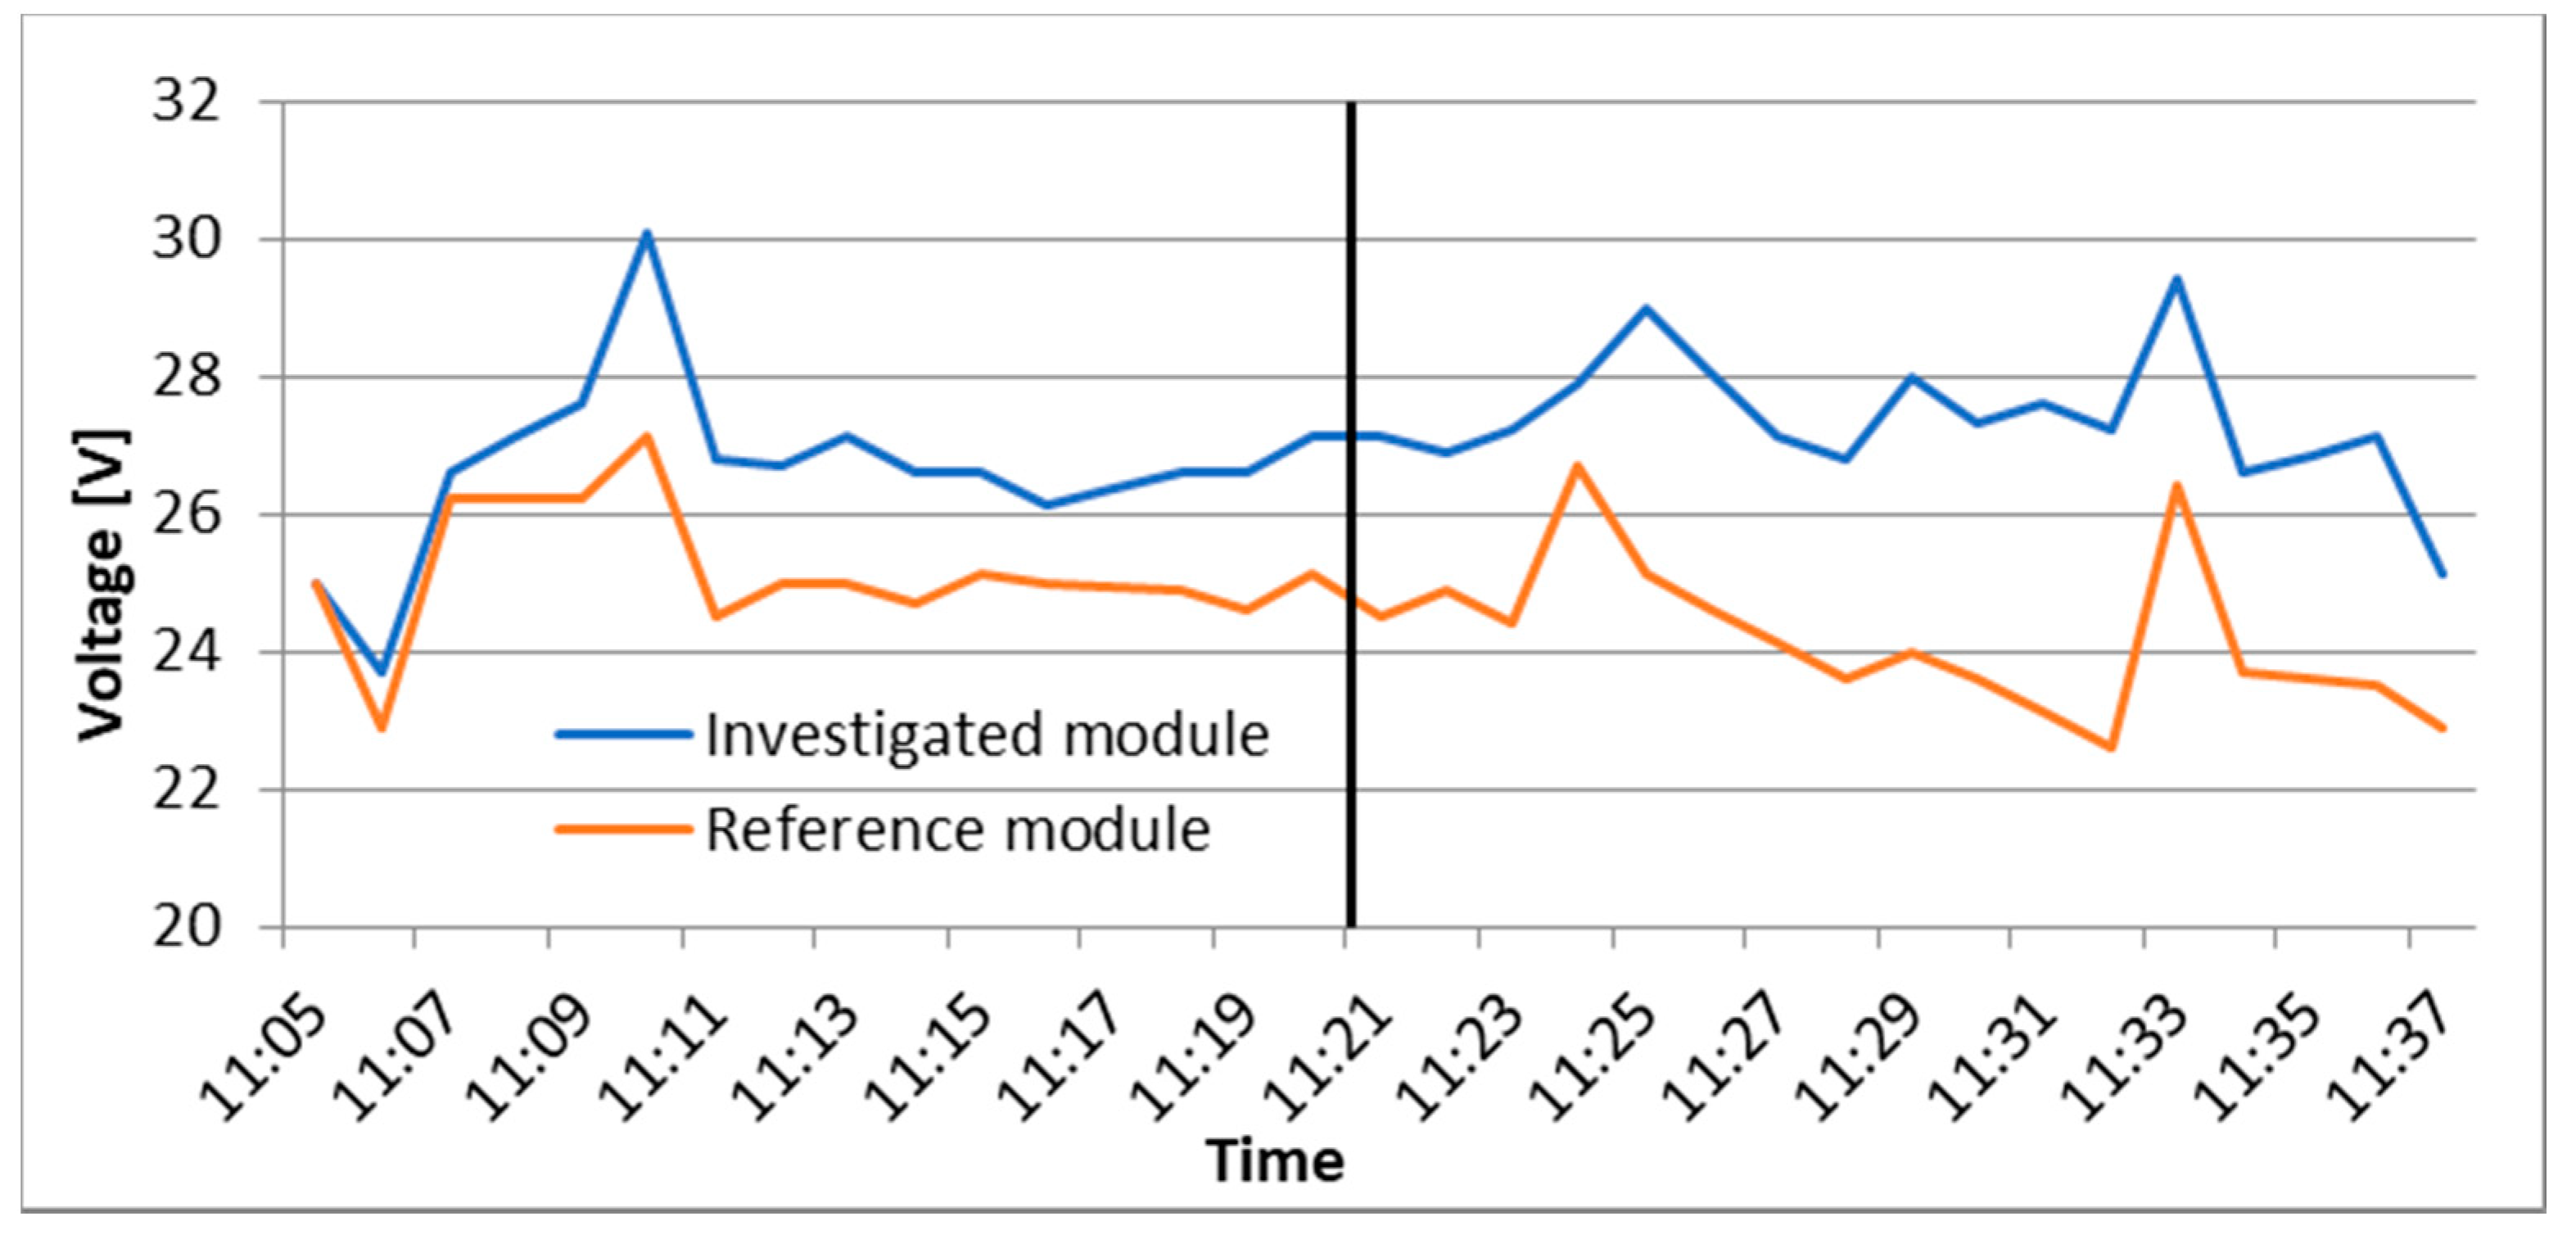
The parameter that directly translates into the power of the device from the physical point of view is electrical voltage, and this was measured at the maximal power point of the PV modules. The graph presented on the diagram in
Figure 8 presents changes in the magnitude of voltage in the investigated and reference modules during the two stages of the test. By reducing the temperature of the modules, a higher voltage is generated on the cooled solar generator. In
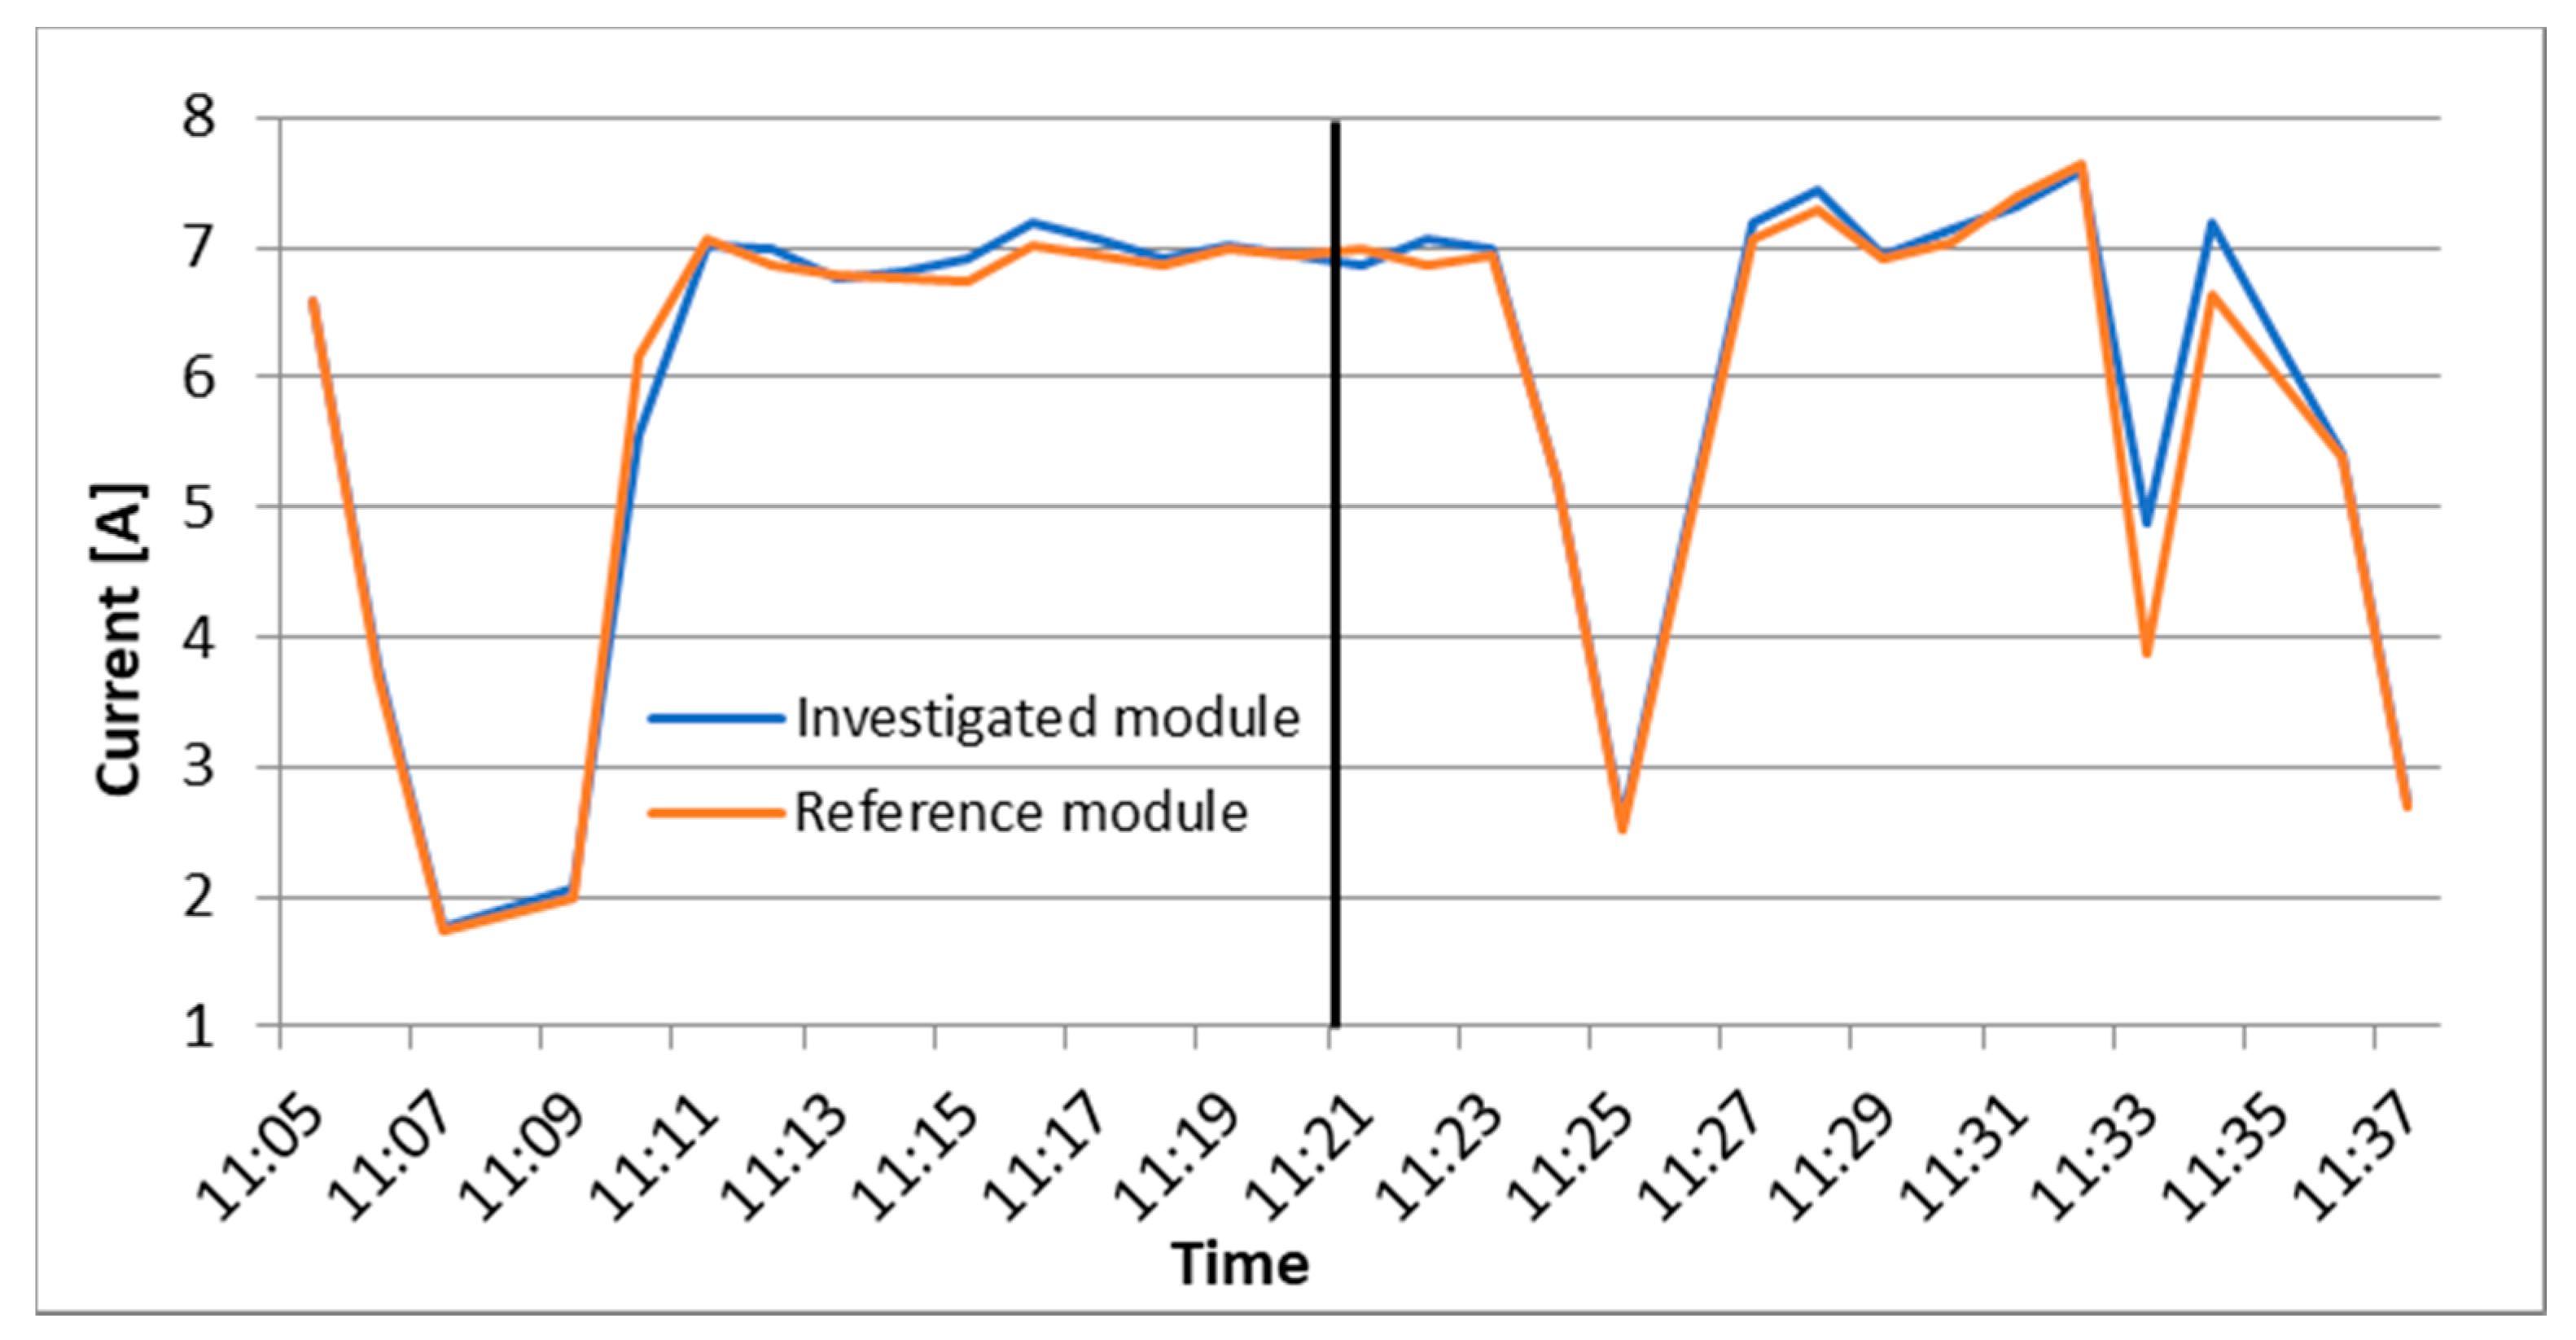
Figure 9, the graph shows changes to the current of both devices during the comparative 30-min tests. It can be seen that both lines are almost the same, and this confirms that the change of PV module temperature has little effect on the current.
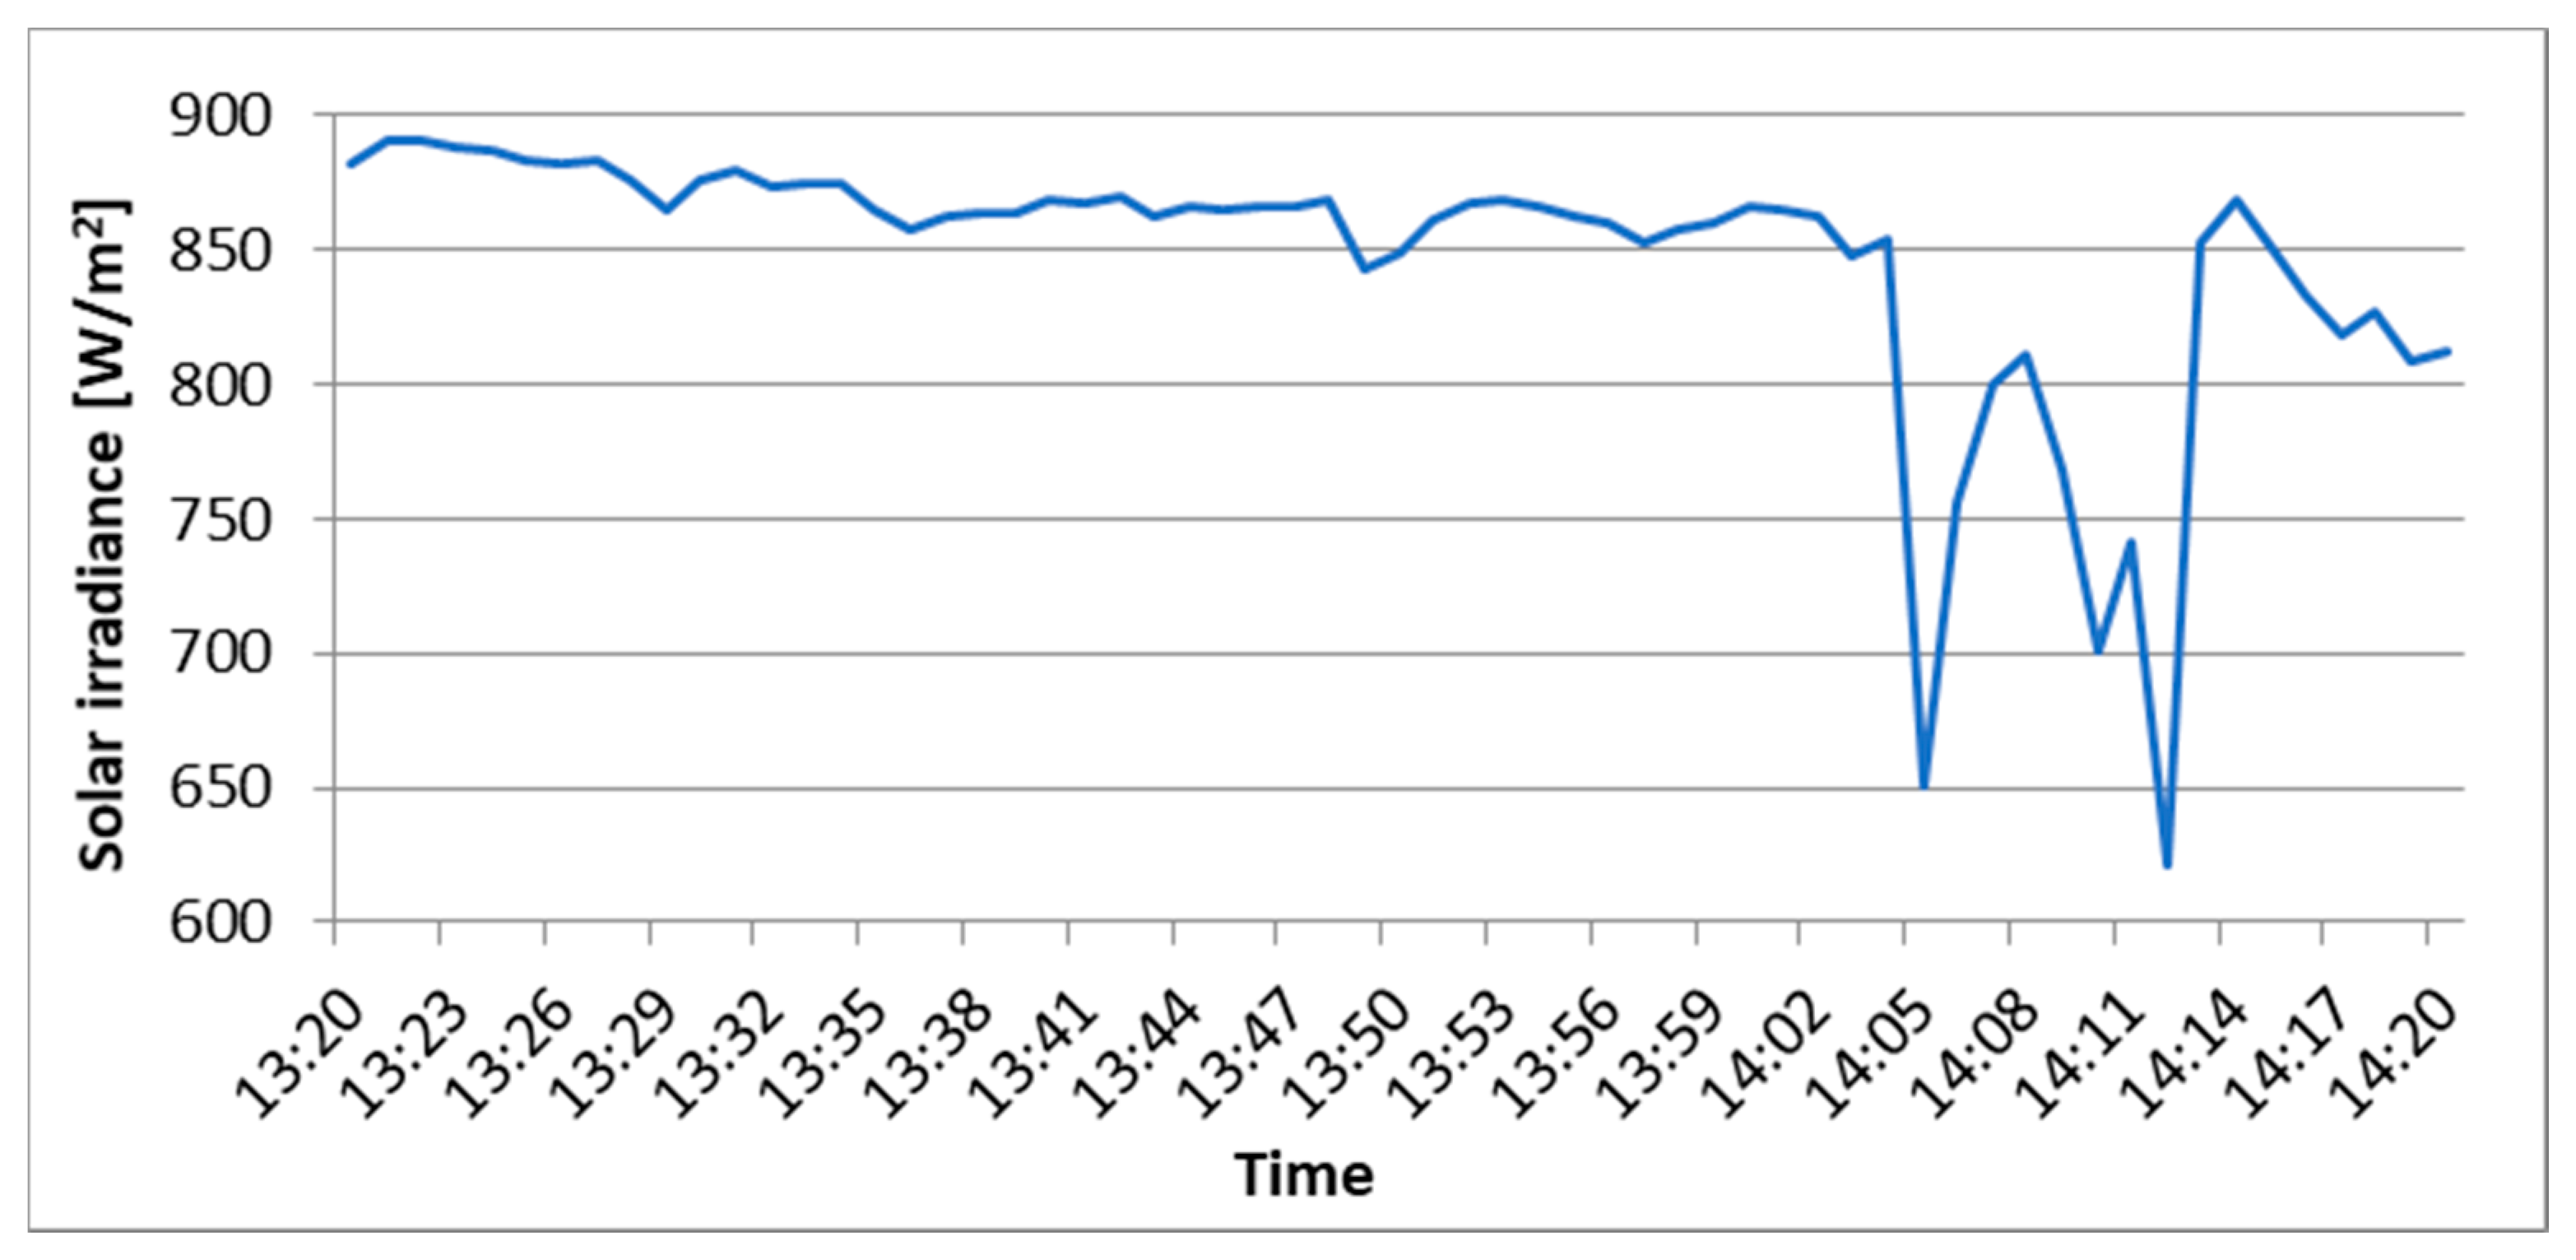
In the next step, research was conducted to achieve the maximum effect of PV cooling. To cool the PV module, the water film method was chosen. The test was made by continuously pouring water over the PV module. The ambient temperature was 32 °C, and wind conditions were stable. The average wind speed was 0.3 m/s, and at one point, the maximal wind speed was 3.7 m/s. The relative air humidity was 74.5% [
21]. The test was run for one hour. During the first 45 min of research, weather conditions were favorable, but by the end of the test, slight cloud cover was observed. During the experiment, solar irradiance fluctuated between 800 W/m
2 and 900 W/m
2, and for a moment, it fell to the level of 700 W/m
2. The changes in solar radiation during the maximum power test are shown in
Figure 10.
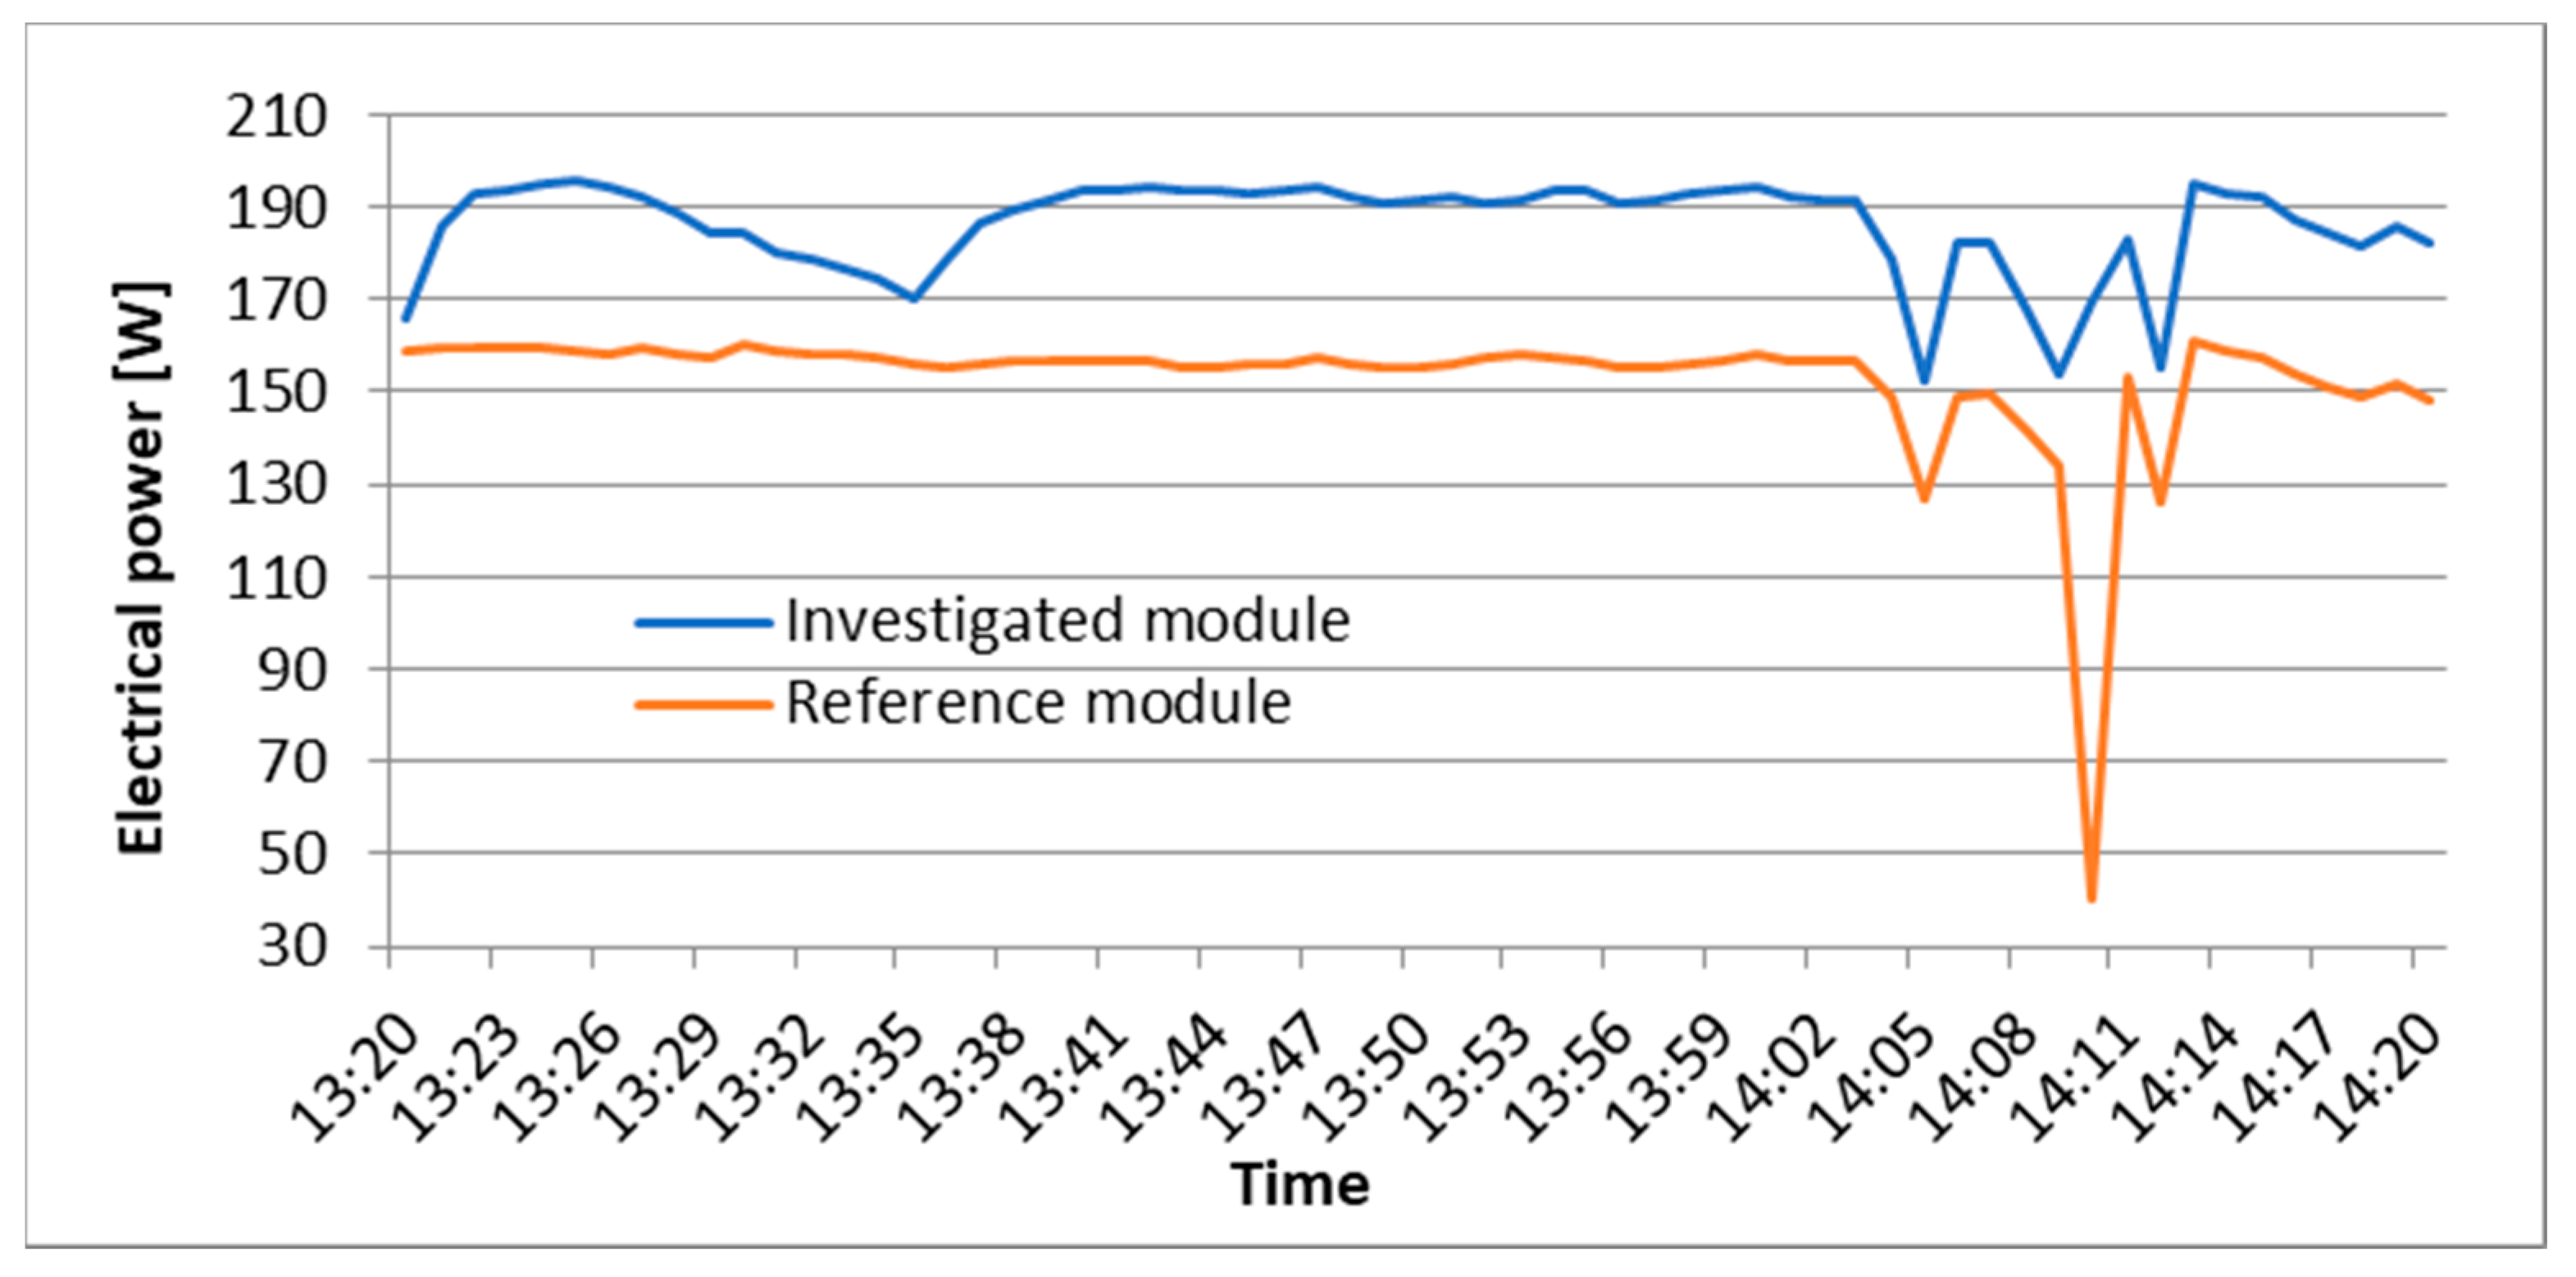
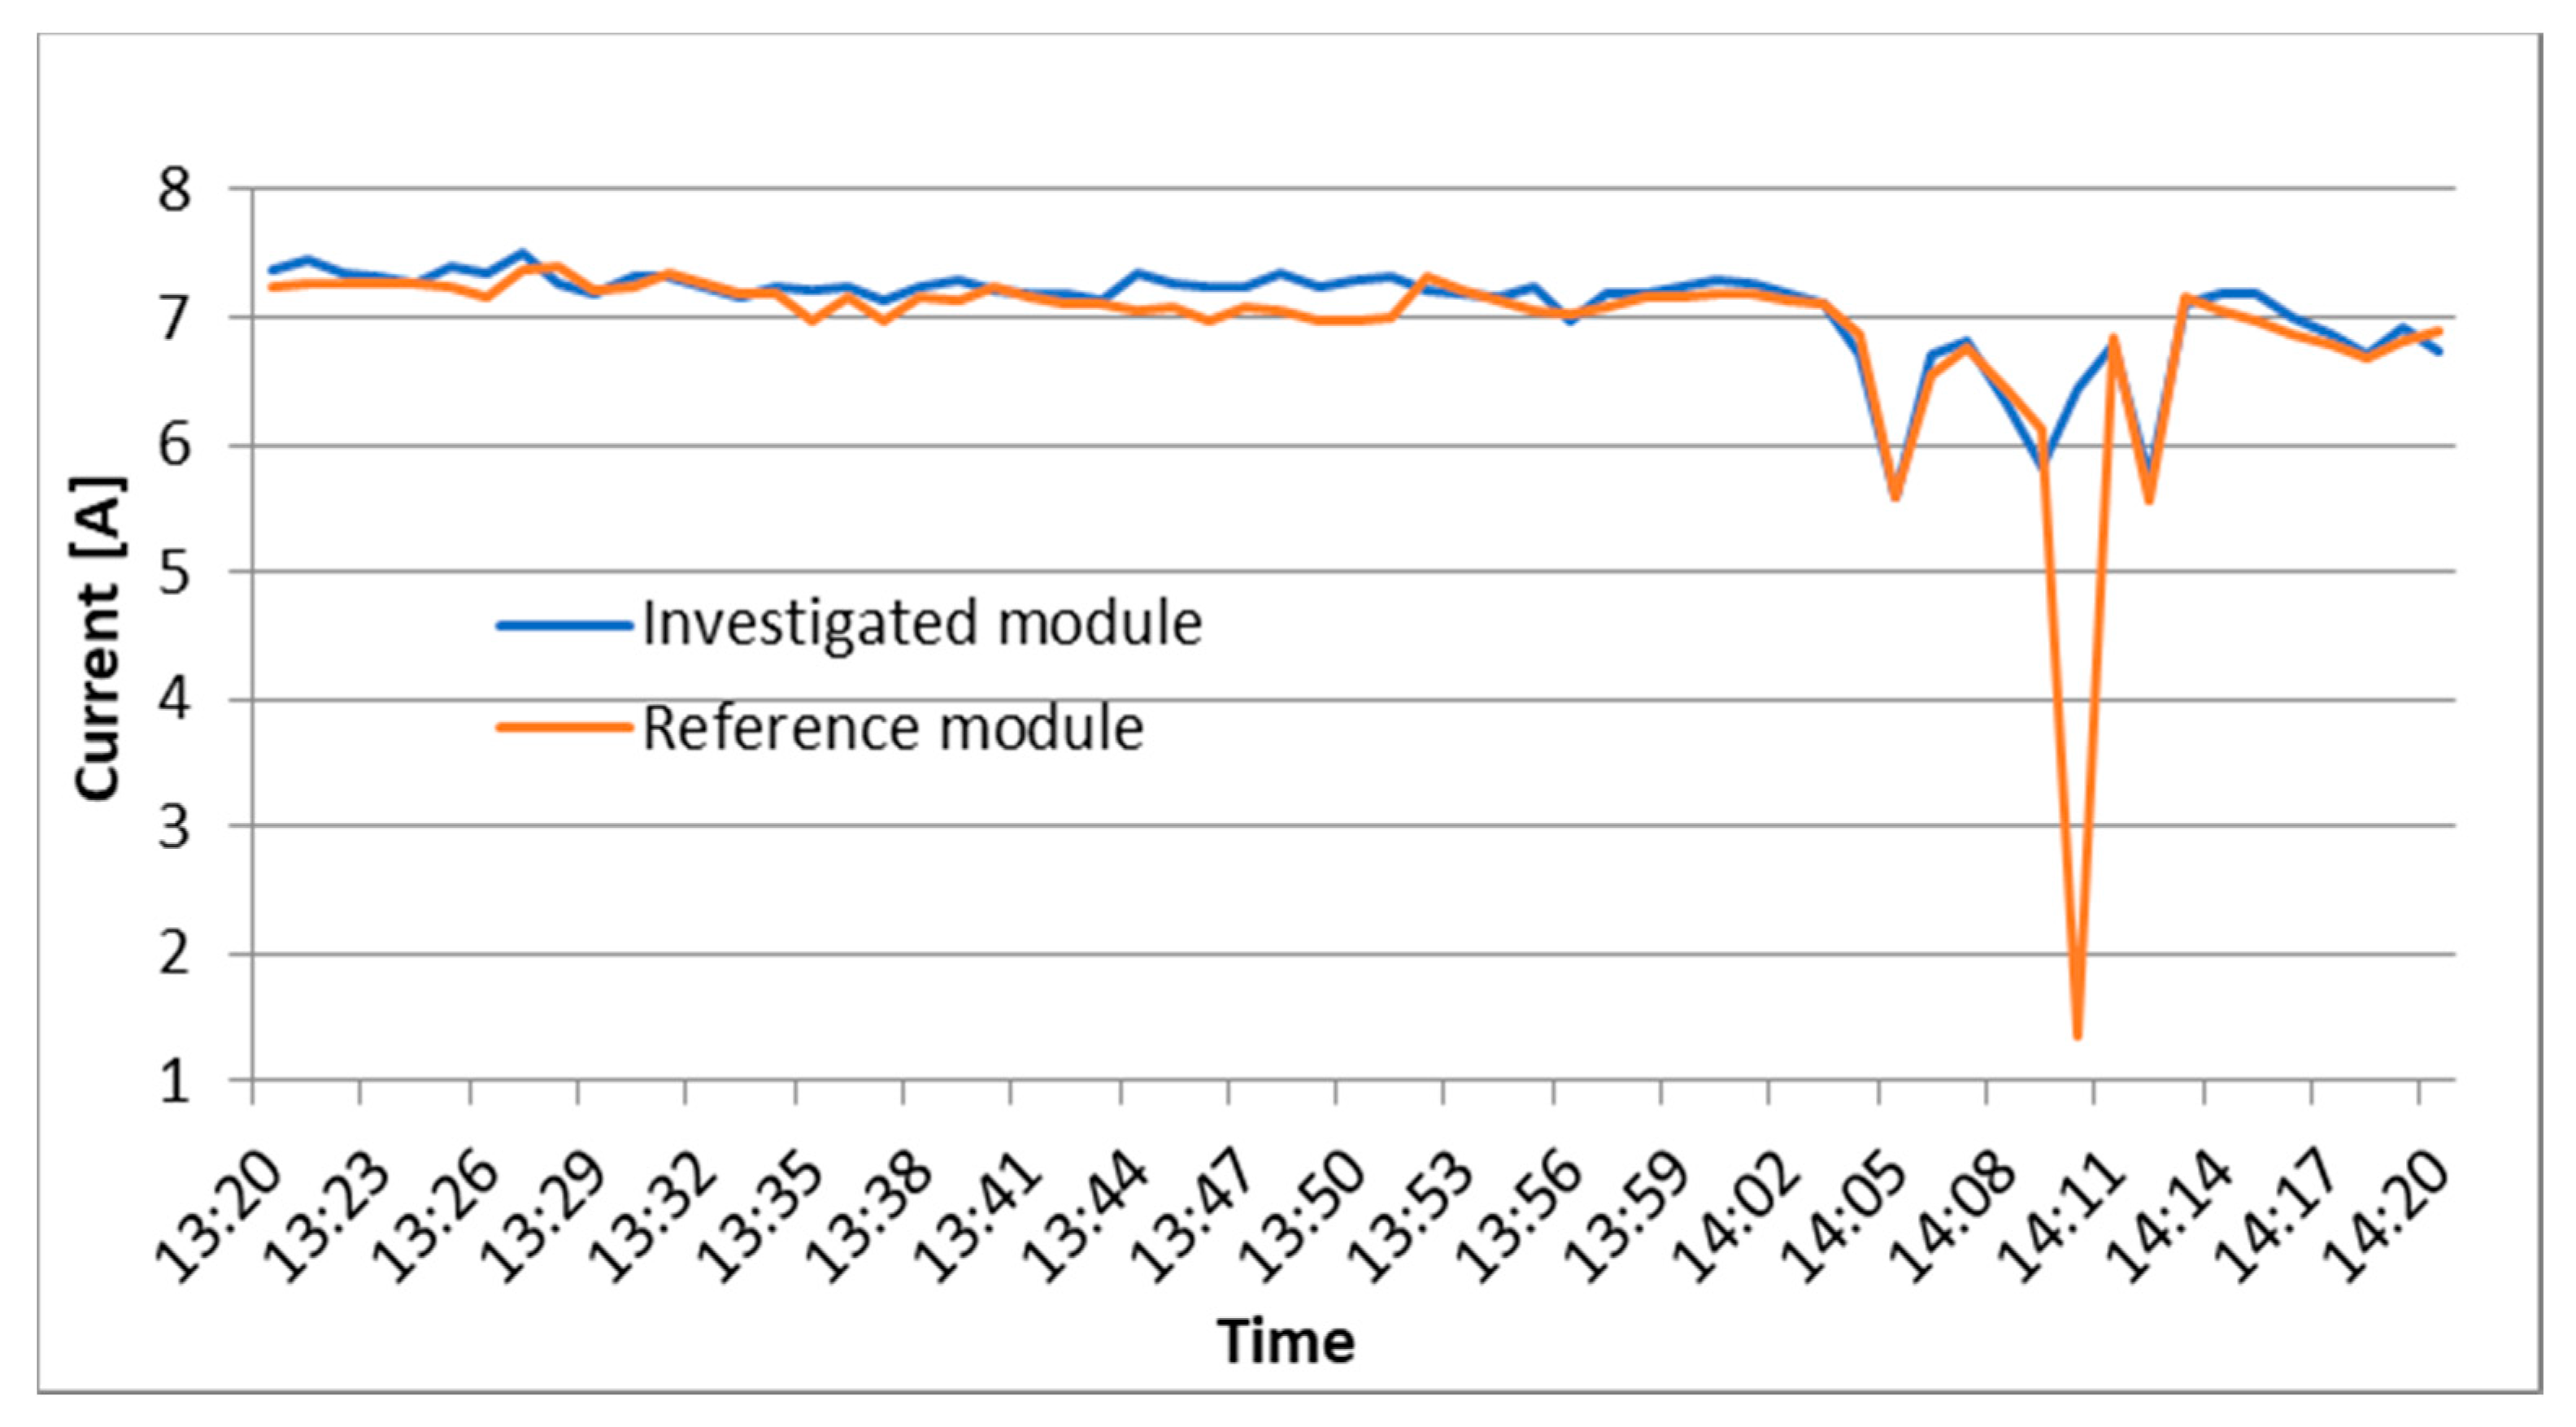
The maximal power test started at 13.20 and lasted until 14.20. In the beginning, the power of the tested module increased relative to the power of the reference module. In the fifth minute of the test, the cooling was stopped because of a technical problem—the flow of water had stopped. The break in cooling lasted for 10 min. During this technical problem, the temperatures and generated powers of both PV modules were similar. This can be observed at 13:36. When the technical problem was eliminated, the power of the tested module rose, up to the moment when it stabilized. The stabile difference between the PV modules lasted until the moment when the weather conditions changed. This can be seen from 14:05 to 14:14. Unfortunately, at 14:11, the reference module was shaded by people for a while, but it had no consequences for the results. During the maximal power test, when the tested module was cooled, the difference of power in regard to reference module was approximately 38 W. This means that the cooled PV module generated power at a 22% higher rate than the reference PV module. This experiment has shown that the constant cooling of the PV modules has a tremendous influence on the power generation. The power lines of both devices (tested and reference PV modules) are shown in
Figure 11.
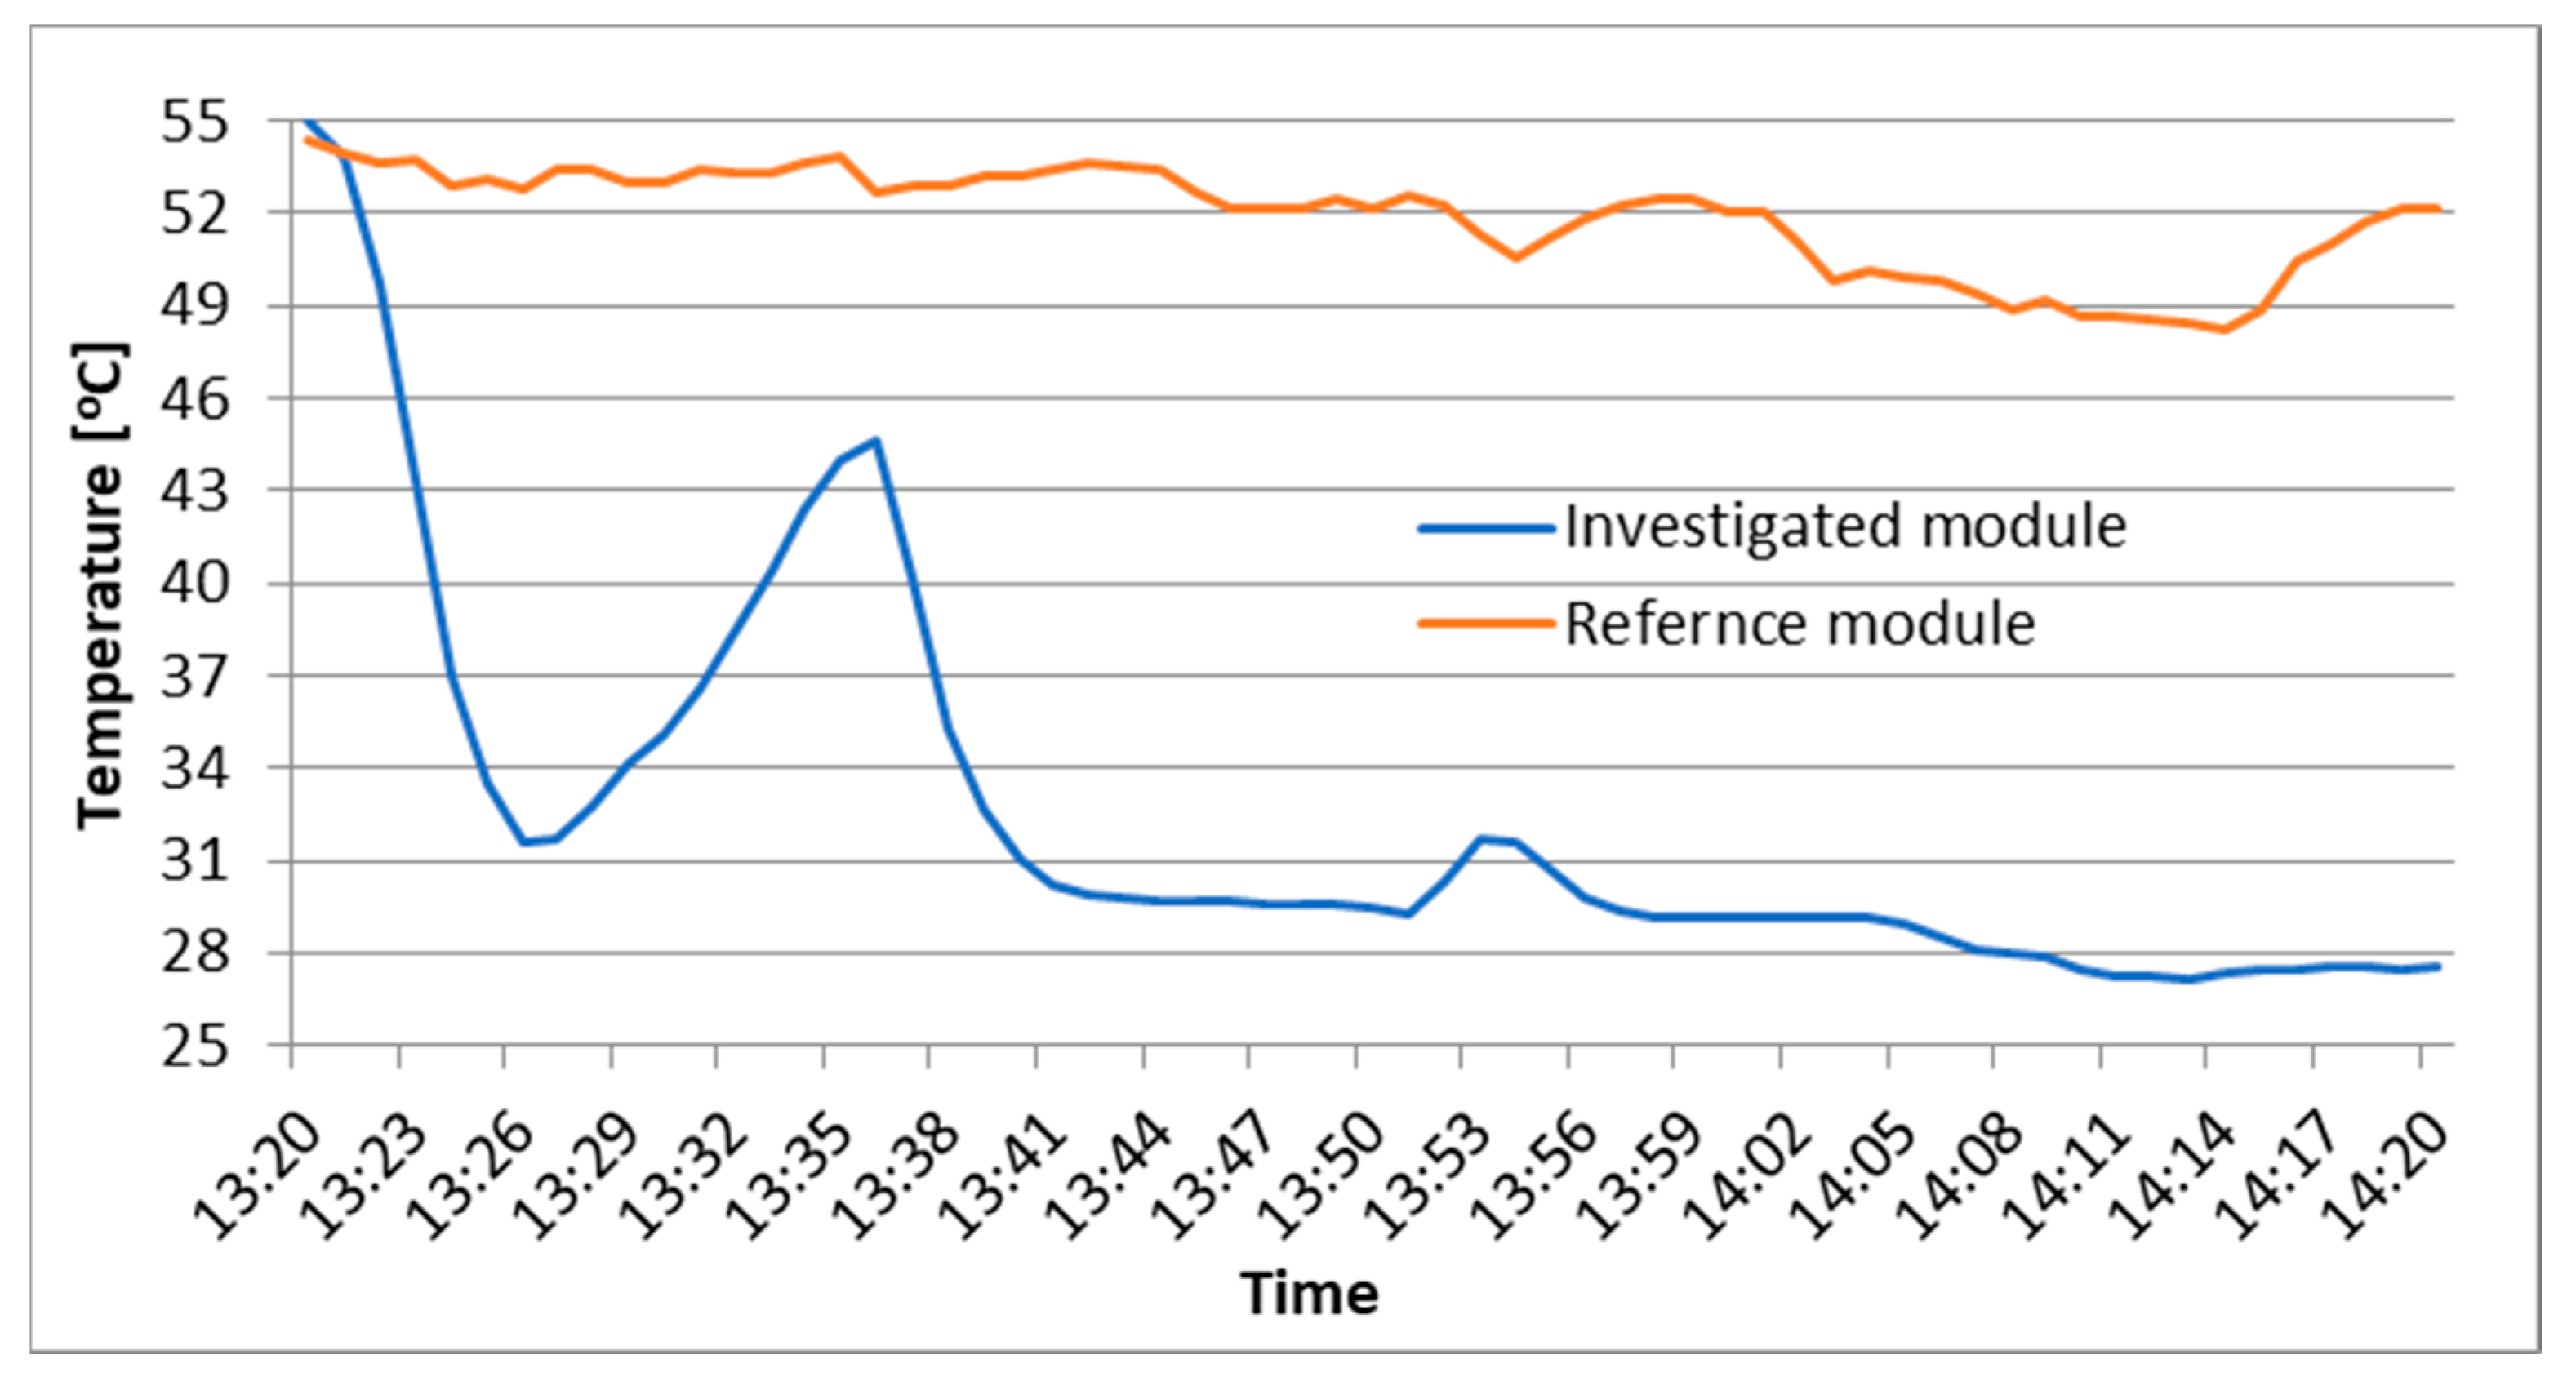
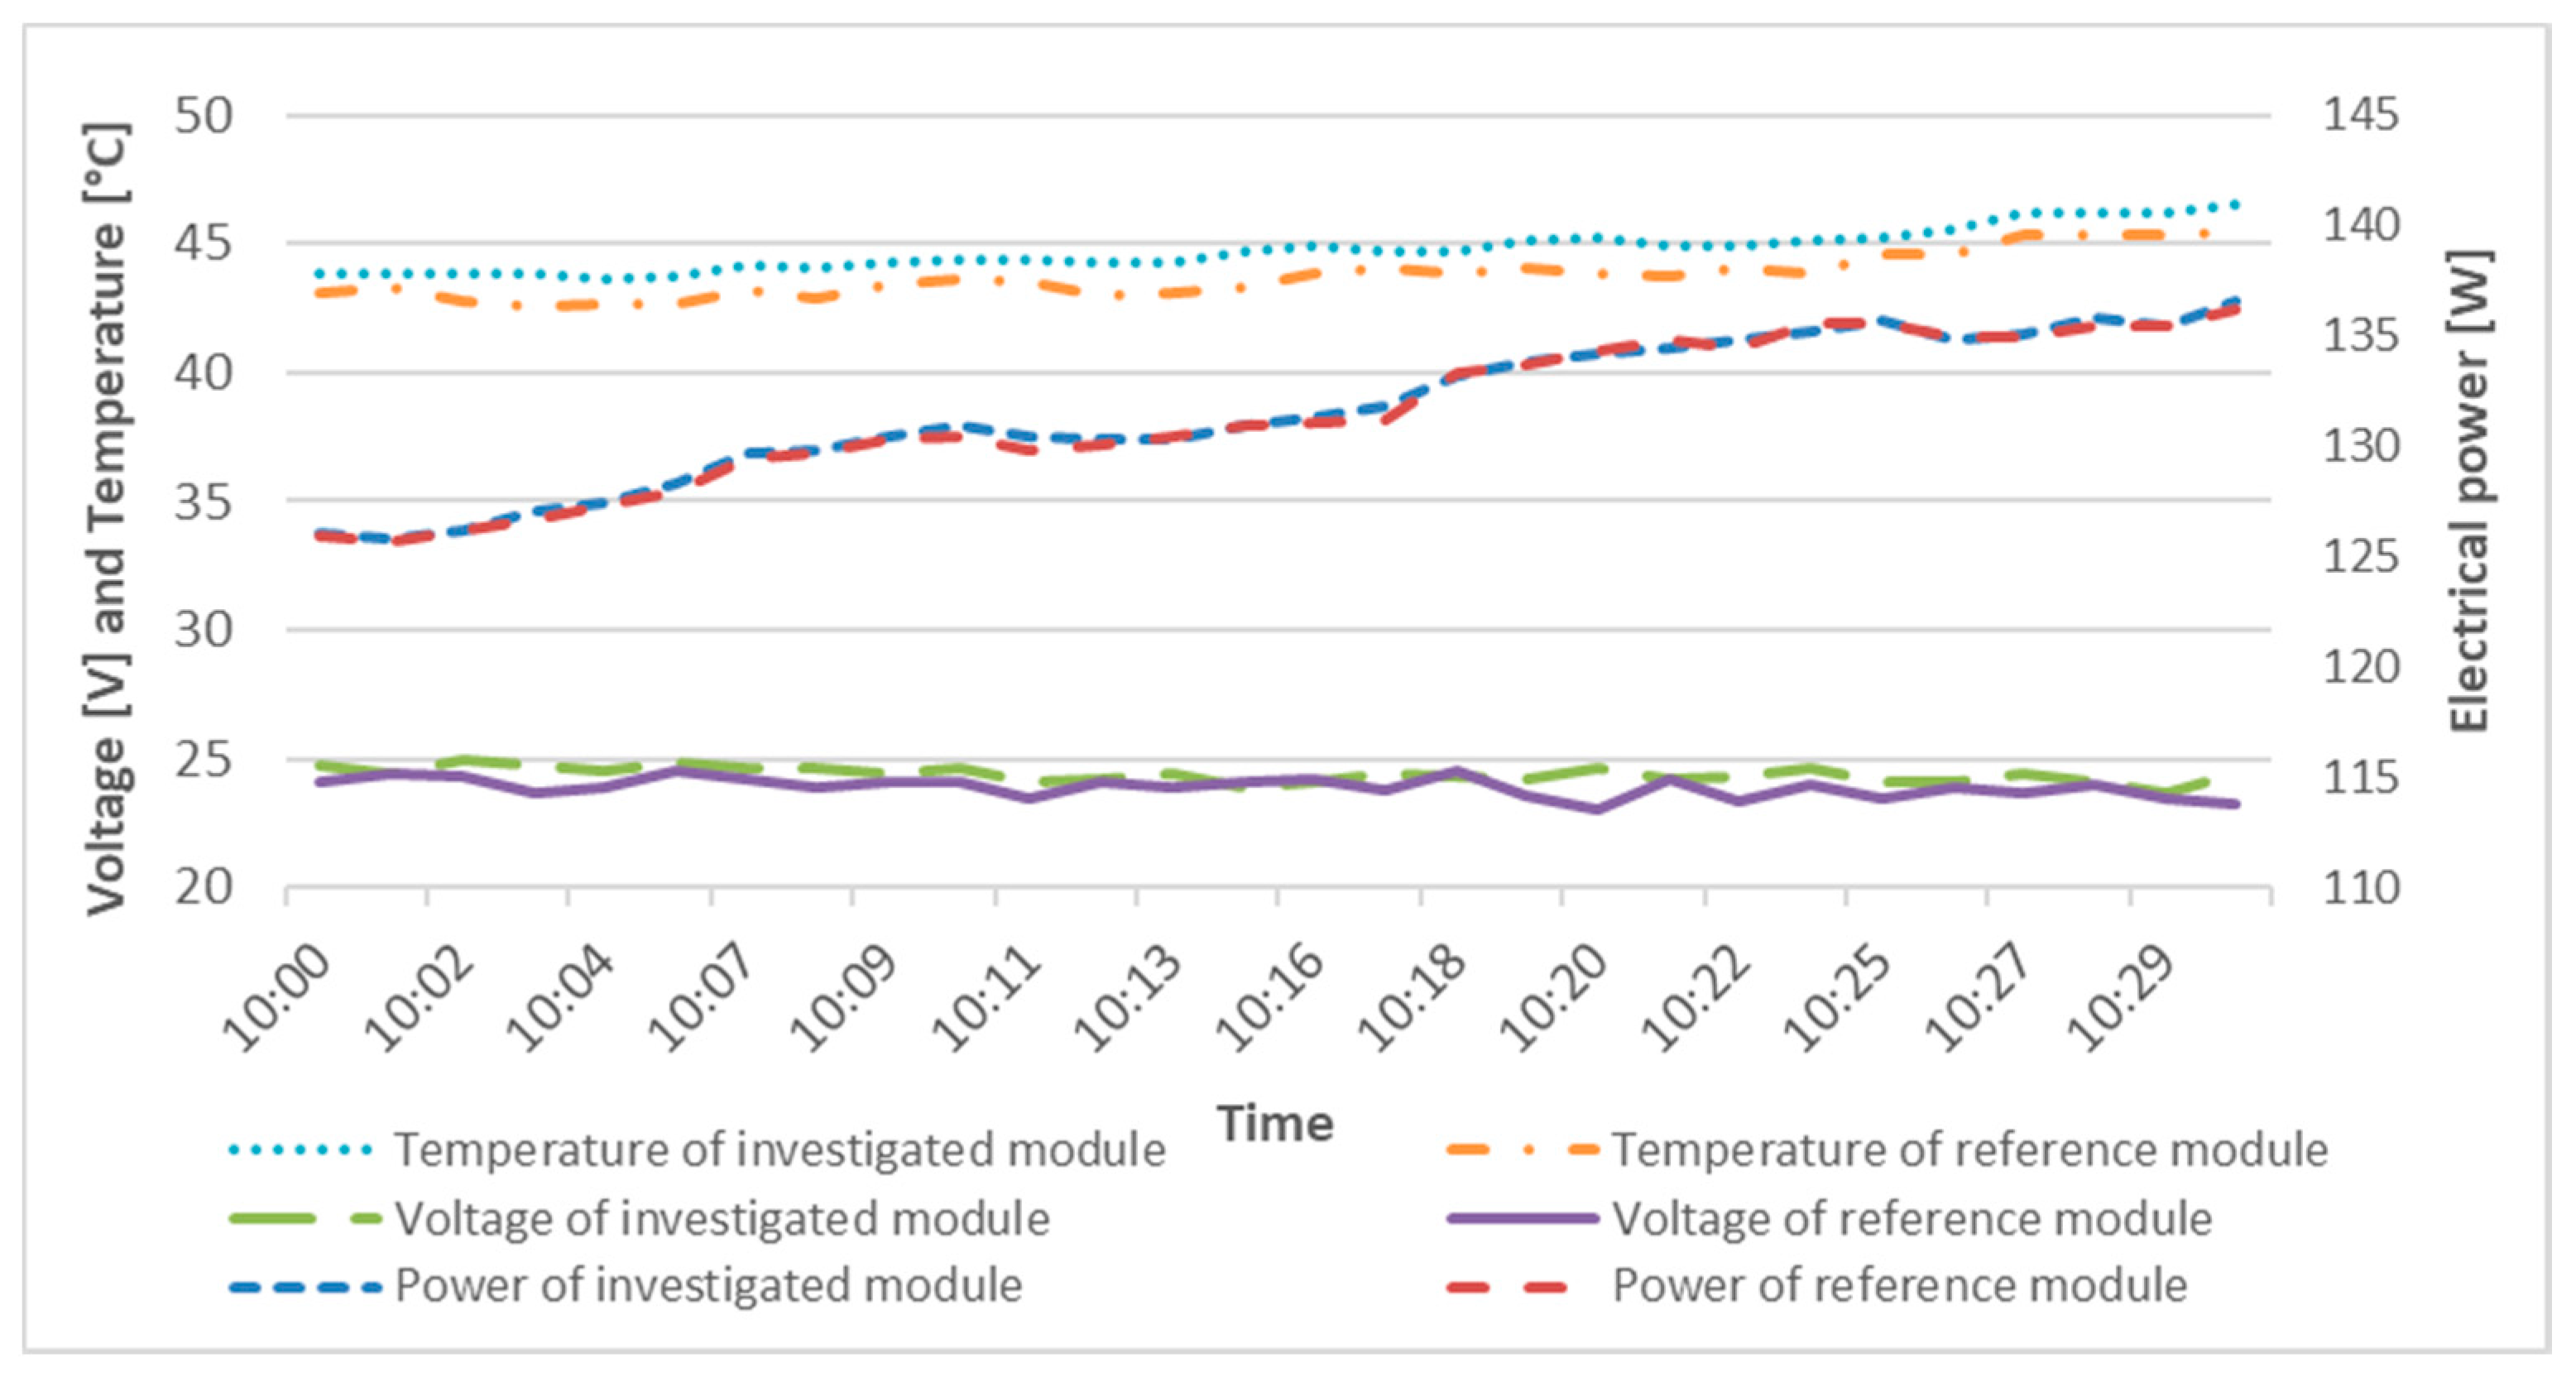
During the maximal power test, the temperature of both PV modules were measured. The average temperature of water using to cool PV modules during this test was 20.7 °C. It allowed us to determine the maximum temperature difference between both devices. The temperature of the investigated module decreased to almost 32 °C and, by the end of the test, even to 28 °C. At the same time, the reference module had a temperature of above 50 °C. When the technical problem occurred, the temperature of the investigated module rose quickly. During the test, the temperature difference between both devices was stable at the level of almost 24 °C. All changes in temperatures can be seen in
Figure 12.
During the maximal power test, the voltage and current of both PV modules were measured. Both modules had the same temperature coefficient: the temperature coefficient of the open circuit voltage (Voc) is −0.334%/K and the temperature coefficient of the short-circuit current (Isc) is +0.069%/K. The voltage of the reference module was stable and approximately 22 V. When the investigated module was cooled, its voltage was at the level of 27 V, or 5 V higher. The voltage and current peak observed at 14:11 was caused by the momentary shading of the reference PV module. In this situation, the voltage of the shaded module increased considerably [
22,
23]. The current of the investigated PV module was almost the same as that of the reference PV module, apart from when a technical problem occurred (at 14:10, when the reference module was shaded by people for a period). The changes of voltage and current curves are shown in
Figure 13 and
Figure 14.
4. Discussion
A summary of the results is shown in
Table 1, where the maximum values for the generated voltage and power of the tested modules and their respective increases resulting from the cooling of the module are presented. It can be observed that, despite the higher value of solar radiation intensity when using a water film, the power of the reference module did not reach a higher value. Therefore, it can be concluded that this is related to the voltage drop in the reference module due to the increased temperature. However, thanks to the use of water film cooling, the greatest amount of power was received at the level of 186 W, giving a power increase of 38.6 W, or 22%, similar to the research of Alami [
19], who obtained results of about a 19% increase in electrical power.
It is also important that all tests were made on the same PV modules, which work under real conditions with very similar parameters of power, voltage, and surface temperature outside the testing period. These parameters are presented in
Figure 15, where it can be seen that all of the measured parameters were almost the same.
The water pouring tests allowed the verification of the efficiency of the cooling process. It transpired that for the effective reduction in heat, the surface of the module has to be continuously cooled with water. The research conducted on 9 and 10 August 2018 showed that the reflection of sunlight from the module surfaces caused by the water is not significant enough to noticeably limit the amount of solar energy supplied to the devices. Measurements with a constant water supply to the surface of the module proved to be very effective. During the course of the 30 min of testing, the solar generator was cooled by an imitation of rain for the first 15 min, and for the next 15 min by means of a water film. This test also allowed the comparison of the efficiency of both cooling systems in very similar conditions, in order to choose the optimal solution of cooling. The cooling by water film system results in higher power production.
The daily amount of energy produced by the uncooled module amounted to 1.3 kWh. The cooled module produced electric energy with a power approximately 20% higher than the uncooled module. It can by assumed that the cooled PV module produced extra energy equal to 0.26 kWh. Production of energy in the weather conditions analyzed was from about 06:00 to about 19:00. This means that energy was produced for 13 h, and approximately 5.2 m3 of water would be used to cool the PV module. In the test location the cost of water is approximately 1 Euro/m3. The total daily cost of cooling PV module would therefore be 5.2 Euros. This calculation allows one to conclude that even if effect of cooling is spectacular, this way of cooling is not necessarily profitable, and this type of research requires additional tests dedicated to the use of stored water or reduced water consumption.
A positive side of this method is the simplicity of the cooling system, because the installation does not require any extra elements for catching and storing water. In the south of Poland, near the Tatra Mountains, there are places where houses are supplied with gravity flowing water, and thus, in such places, the system can be used for free. Nevertheless, it is still use of potable water, and thus, a better way would be the storage and use of rainwater. An alternative way to use water used for cooling photovoltaic modules is collecting it and then using it for gardening purposes. For solar plants installed in private homes, the water can be used to water grass or other plants. Water used for cooling photovoltaic modules must be captured and stored in advance.
It is important to bear in mind that cooling PV modules with water covering the front surface also removes any pollution. This also improves the efficiency of PV modules, as discussed by Menoufi [
15].
5. Conclusions
The measurements carried out during the test gave promising results. It turned out that on sunny days, thanks to a successful attempt to lower the temperature of modules to laboratory requirements of 25 °C (STC conditions), a much higher power of the electricity generation was obtained in the cooled PV case. This means that the parameter that is the least likely to obtain in favorable solar conditions (temperature) is achievable, and the power increase of the device is approximately 20%, which is a very high value.
The cooling system with the use of a water film definitely had greater heat recovery efficiency. During the imitation of rain on the surface of the PV module, there was a smaller amount of water due to the splash and bumping of drops of water from the surface of the device beyond its edges. This was also reflected in the temperature graphs of water flowing down from the PV module, which reached a higher value with the imitation of rain than the water film. Therefore, it is estimated that the most viable cooling system would be based on a linear water film distributor. In order to optimize this technology, it must be subjected to further tests over longer periods of time. This cooling system may be an interesting solution to increase the efficiency of an installation. It may be used in existing installations, where increasing nominal power can be complicated. The cooling system can also be used in newly built installations to improve their efficiency. An additional beneficial factor resulting from the use of PV module cooling is the fact that, after the tests, the tested module was not covered with any dust, as was the case with the reference module. After equalizing the temperature of both modules after the tests, a minimally higher power was generated by the module whose surface was free of pollution.

 ,
, 


