1. Introduction
Fuel cells (FC) are electrochemical devices that transform gaseous fuel’s chemical energy into electricity (usually hydrogen is used). They represent a promising future power source both for stationary and mobile purposes [
1] and promising technology in energy applications. Numerous fuel cell technologies exist—PEMFC, AFC, PAFC, MCFC, and SOFC—each with distinct design, chemistry, and operating conditions [
2]. In recent years, increasingly stringent environmental laws in terms of vehicle emissions have given rise to a growing interest in new powertrain solutions. Full electric powertrains present numerous challenges regarding batteries [
3,
4,
5] and Hybrid vehicles also face important issues integrating thermal and electric power sources [
6,
7,
8]. In this context, PEMFC appears as a potential candidate, mainly due to their elevated power density and zero-emission characteristics [
9].
The performance of FC is therefore altered by important conditions of operation and parameters, for instance temperature, relative pressure of reactants, and products and humidity of the polymeric membrane [
9,
10,
11]. In particular, the humidity has a significant influence in the performance of a PEMFC because the membrane water content is crucial for the ionic resistivity of the electrolyte membrane [
12]. For this reason water management poses one of the main design challenges of a PEMFC, considering that membrane’s hydration dictates its durability and efficiency. Should the membrane not be well hydrated, it will present a larger ionic resistance and the increasing of current density and temperature at some point of the MEA can even cause irreversibly damages. To maintain good proton conductivity, the polymer membrane ought to be hydrated by internal production of water and/or by external humidification.
Different models and approaches have been presented to discuss the importance of the humidity in the performance of PEMFC. The records date from some decades ago [
13] when experimental demonstrations indicate a dependence between inlet gases and proton conductivity, and further investigation presents the mechanisms that might explain this dependence. For instance, Zhang et al. suggest that lower humidity conditions can slow electrode kinetics and high membrane resistance for high-temperature operating PEMFC [
14]. Using an AC Impedance method, Liu et al. managed to show that the jeopardized performance of the FC in low humidity conditions is focused on the proton conductivity, with the Oxygen Reduction Reaction only marginally relevant [
15]. Furthermore, works such as [
9] study the impact of humidity both in the hydrogen and air inlet flows, suggesting that the oxygen hydration state leads to more severe working conditions and compromised the FC performance at lower temperatures.
Simulation can also be used to gain understanding of the underlining phenomena, as done by Shimpalee et al., where a three-dimensional flow simulation is developed to replicate conditions previously found in experiments, and some interesting conclusions are made regarding the increase of current density with high humidification of the membrane (even if the model is not able to fully describe the important effect of flooding, and continues rising for very high humidity) [
12]. More recently, Guvelioglu and Stenger presented a two-dimensional simulation model that can predict fairly accurately the proton conductivity and the flooding phenomena with rather low computational effort [
2].
Apart from the instantaneous performance in terms of proton conductivity and current density, the condition of the membrane in terms of humidity can also cause degradation problems. Bi et al. suggested that very high humidification conditions (100% relative humidity) can accelerate cathode Pt mass degradation in the catalyst [
16]. On the other hand, low humidity conditions are the cause of more brittle and rigid polymers and can lead to faster degradation, mostly due to loss of sulfonic acid groups [
17].
Clearly the literature presents various explanations and models to the phenomena, and many threads are still open to discussion and investigation. One thing remains clear: humidity control is essential to assess the performance of PEMFC and avoid numerous problems, both of instantaneous performance and durability.
A usual FC problem is cathode flooding, generated by a surplus of produced water on the cathode during the working conditions. In this situation the water film (created on the cell’s cathode sector) impedes the diffusion of oxygen to the positive electrode (where oxygen reduction takes place), therefore reducing the voltage of the cell. The phenomenon’s magnitude hinges strongly on the reaction air flow rate and stack’s temperature and current.
Another usual FC problem is anode flooding, when the hydrogen diffusion to the negative electrode (where the hydrogen oxidization takes place) is blocked by the water film, consequently reducing the voltage of the cell.
The worst-case scenario appears when an elevated temperature is unintentionally achieved, and a hole creation takes place (around 70
C). The straight repercussion of this event is once more a minimal voltage (near null voltage); in fact there is the voltage decrease of the cell due to the decelerated hydrogen diffusion from the anode to the cathode side. In the case where a cell presents holes in its membrane, its voltage plunges quickly compared to the usual single-cell normal behavior. The faster the cell voltage reduction, the higher the damages to the MEA [
18,
19].
Given the wide variety of possible issues related to the membrane humidity and temperature, it becomes clear that a suitable control system should be carefully designed to properly run a FC.
To control the air stream conditions, many technologies exist, but they are either not precise, not continuous or very expensive [
20].
In the system presented in this paper, the humidifier is a commercial NTSH that can continuously humidify the inlet air stream, without moving parts and no power operating under a wide range of conditions, providing consistent humidification.
More specifically, an external humidification method that allows the improvement of the membrane hydration by controlling the humidity content without the risk of membrane flooding is discussed. In fact, in the PEMFC, the water excess ought to be removed to avoid flooding that can damage the membrane and drop the output voltage. Literature experimental results [
2,
9,
14,
16,
21,
22] suggest that at elevated humidity condition the average current density degrades with respect to slightly lower humidity conditions. This happens because the liquid water (that condensates at some sections of fuel cell) blocks the pores in the diffusion layer, impeding the reaction in these sections and consequently jeopardizing the performance of the PEMFC [
12]. Therefore, the membrane hydration mechanism depends on the inlet gas condition, the water transport phenomena in the membrane, and operating parameters of the FC and [
9].
In particular, this paper has been developed around a case study, described in the next section, in which a lightweight automotive application is considered. The challenge undertaken by the proposed system is to provide humidity to the low-current and low-temperature FC that feeds the electric motors of a three-wheeler prototype.
The low-current assumption comes from the overall objective of the vehicle: to reduce hydrogen consumption, and by consequence operate at the average lowest possible current. Furthermore, the necessity of adding humidity to the membrane is more evident in lower current FC because the total water production is lower. Indeed, high-current applications usually face bigger issues trying to avoid water excess and flooding, and are therefore not ideal to evaluate the performance of a humidification system.
The low-temperature condition, on the other hand, comes from the very limits of the membrane and fuel cell studied. The limit defined by the manufacturer states that the FC should not operate at temperatures higher than 60 C continuously, at the risk of irreversible damage to the membrane. Additionally, this low temperature range suits well the packaging constrains in the vehicle, where the powertrain is placed close to the driver, due to rigid space limits.
It is highlighted that this paper does not have the intention to exhaustively put the system into extreme conditions, nor does it contain a scientific breakthrough aimed to change the state of the art of FC and their humidification controls. Conversely, it builds upon rather consolidated theoretical and experimental knowledge and contributes to the scientific community by providing a real-life complete design description that reinforces the importance of membrane humidity control and confirms the effectiveness of the NTHS when lightweight energy-efficient automotive application is taken into account.
2. Case Study
To hydrate the membranes and control its temperature by providing external humidification, a NTHS was designed and built. The system can simultaneously increase the inlet air humidity and decrease the temperatures of the inlet air and membranes of the FC. This aspect is particularly relevant if the FC operates in an enclosed volume where the temperature increases not only due to the environmental conditions but also for the heat generated by the stack itself. The system has been experimentally tested in the laboratory and used in a vehicle prototype, as described by the next sections.
2.1. The Nafion® Tubing Humidification System
Nafion
® is a material widely used in FC membranes; however, this paper studies a particular application of the material, Nafion
® tubing. Nafion
® tubing is a shell and tube moisture exchanger that allows water vapor transfer [
23]. The setup of such humidifiers can be both water-to-gas or gas-to-gas. The molecules of water are
absorbed into the Nafion
® tube walls and
conveyed to dry gas flow.
This transportation is caused by the
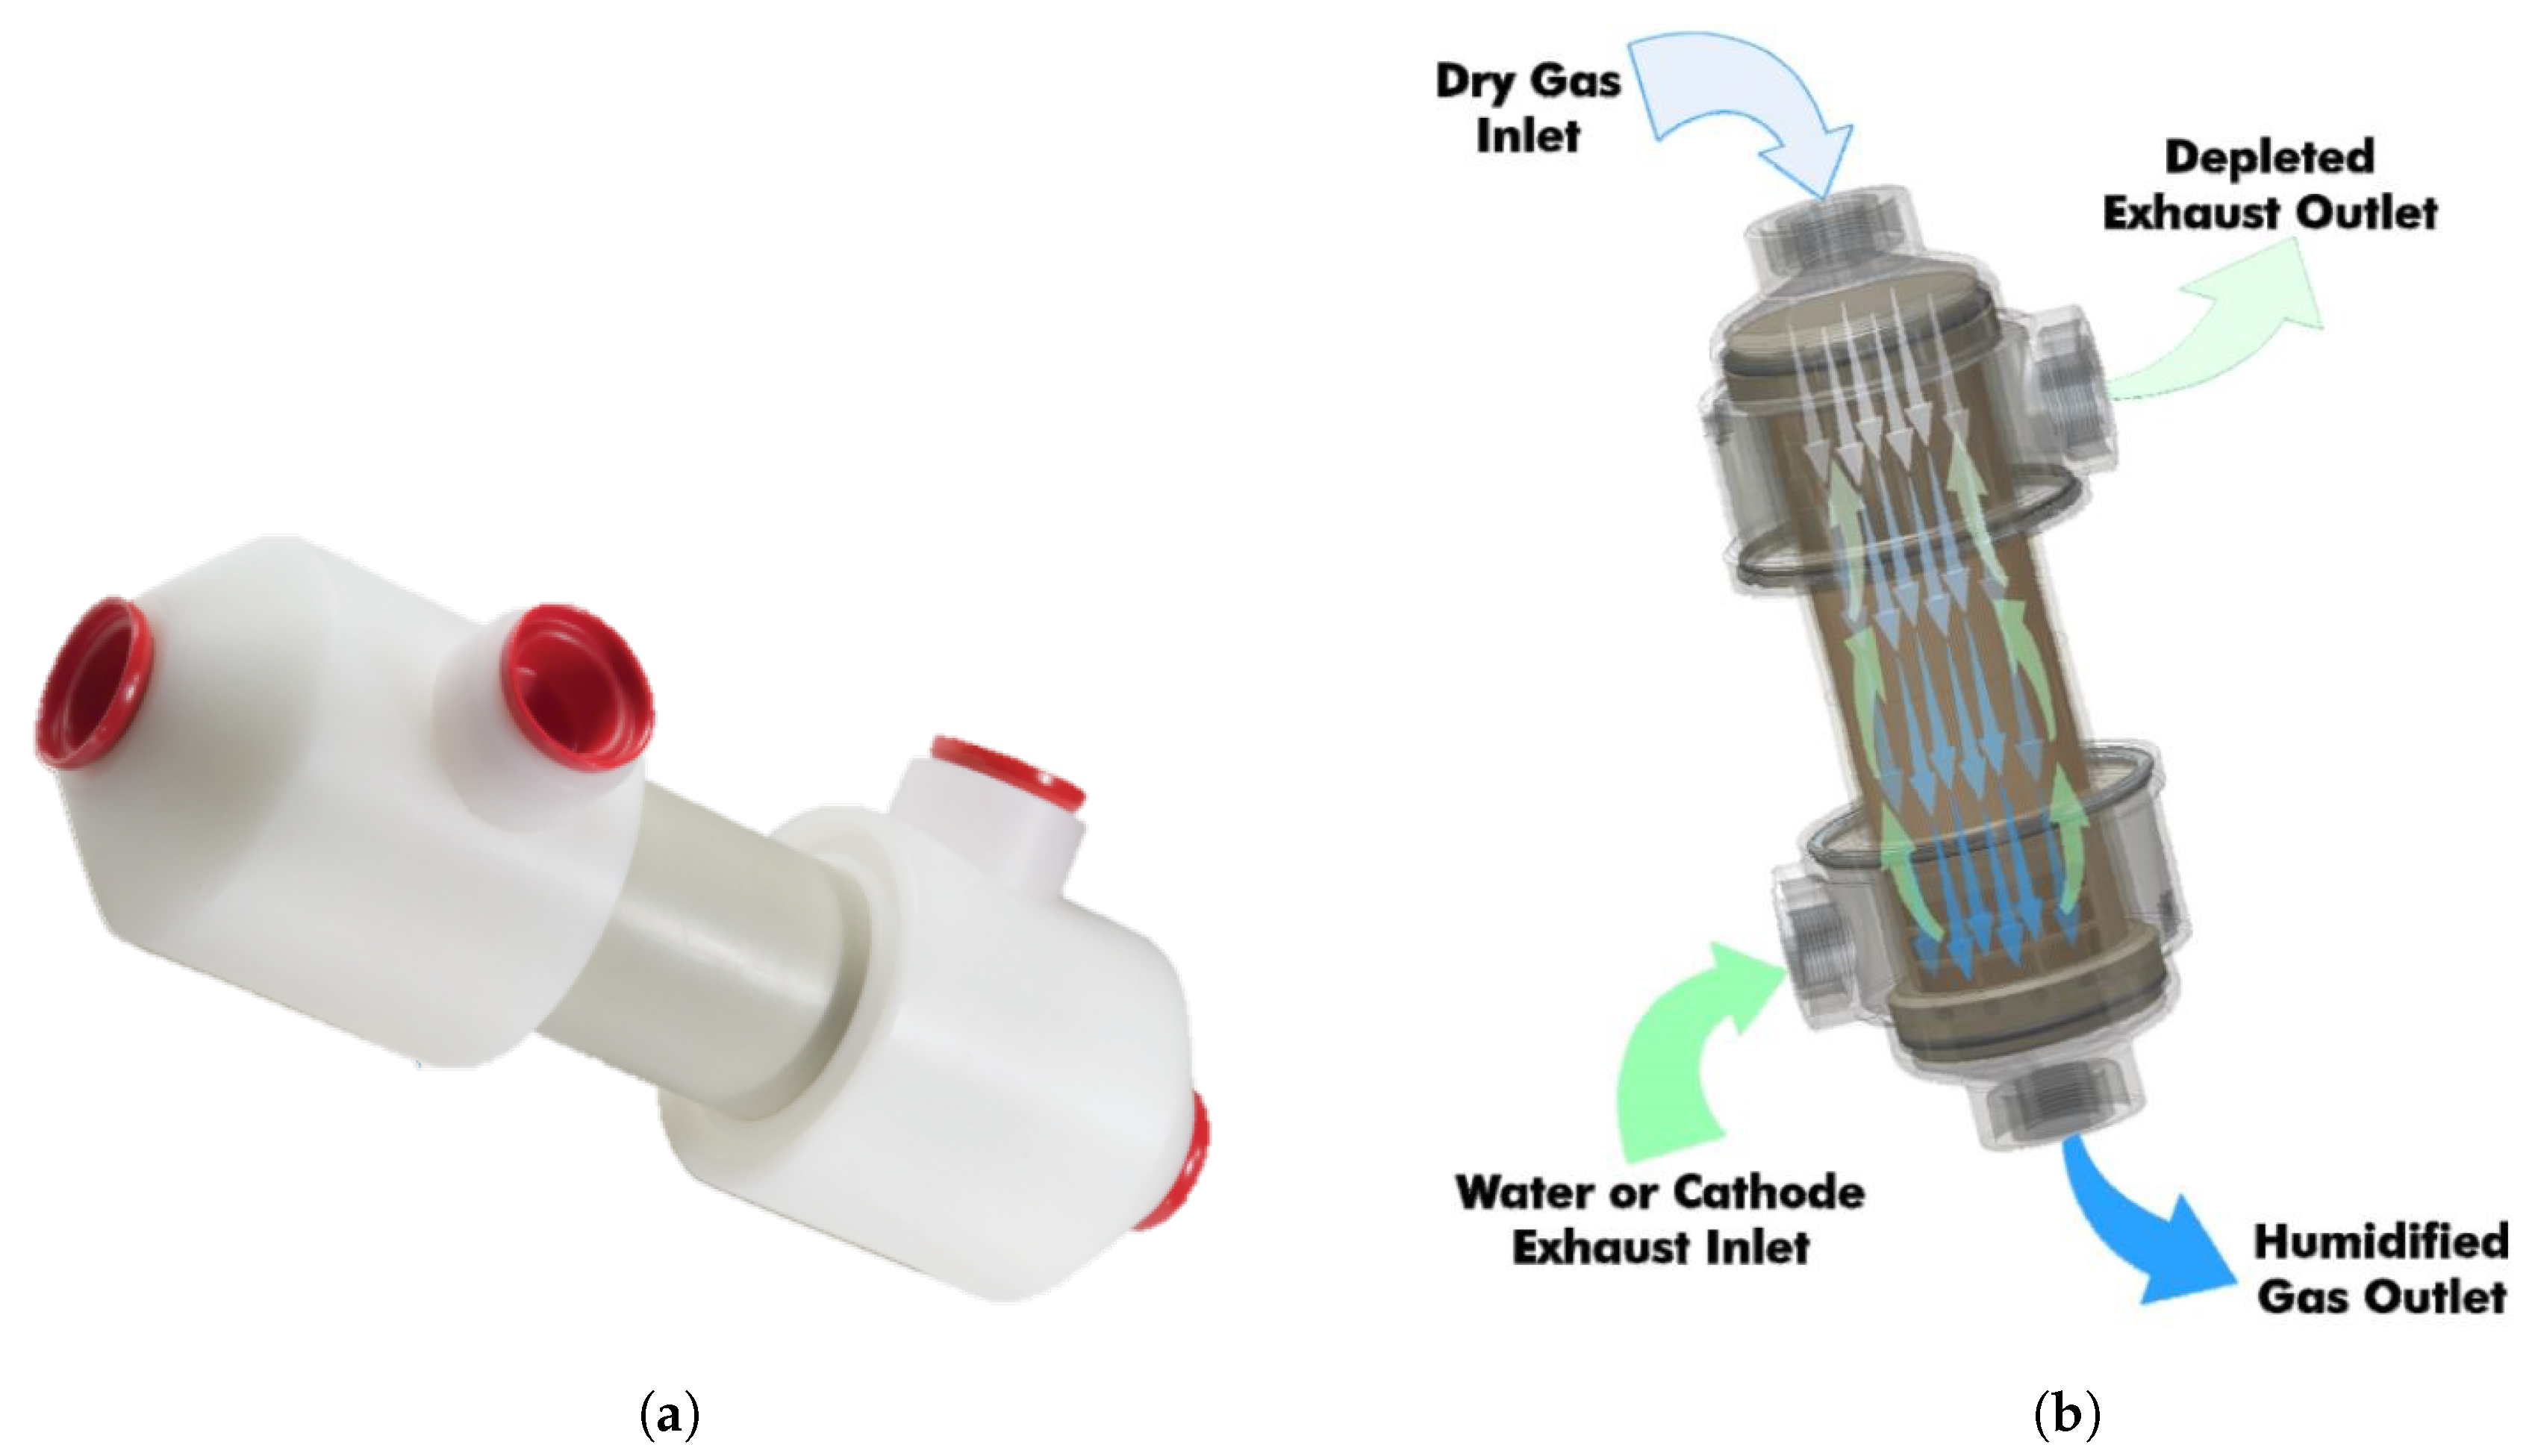
partial pressures difference between water vapor on opposing sides. In the system proposed by this paper, this component (
Figure 1a) is used in water-to-gas configuration with dry gas on one side of the tube wall and liquid water on the opposite.
This structure provides the highest quantity of humidification.
Figure 1b shows, schematically, the main flows going through the tubing system, with the green arrows referring to the humidification flow (in this case liquid water) and the blue ones the inflow gas fed to the FC with added humidity.
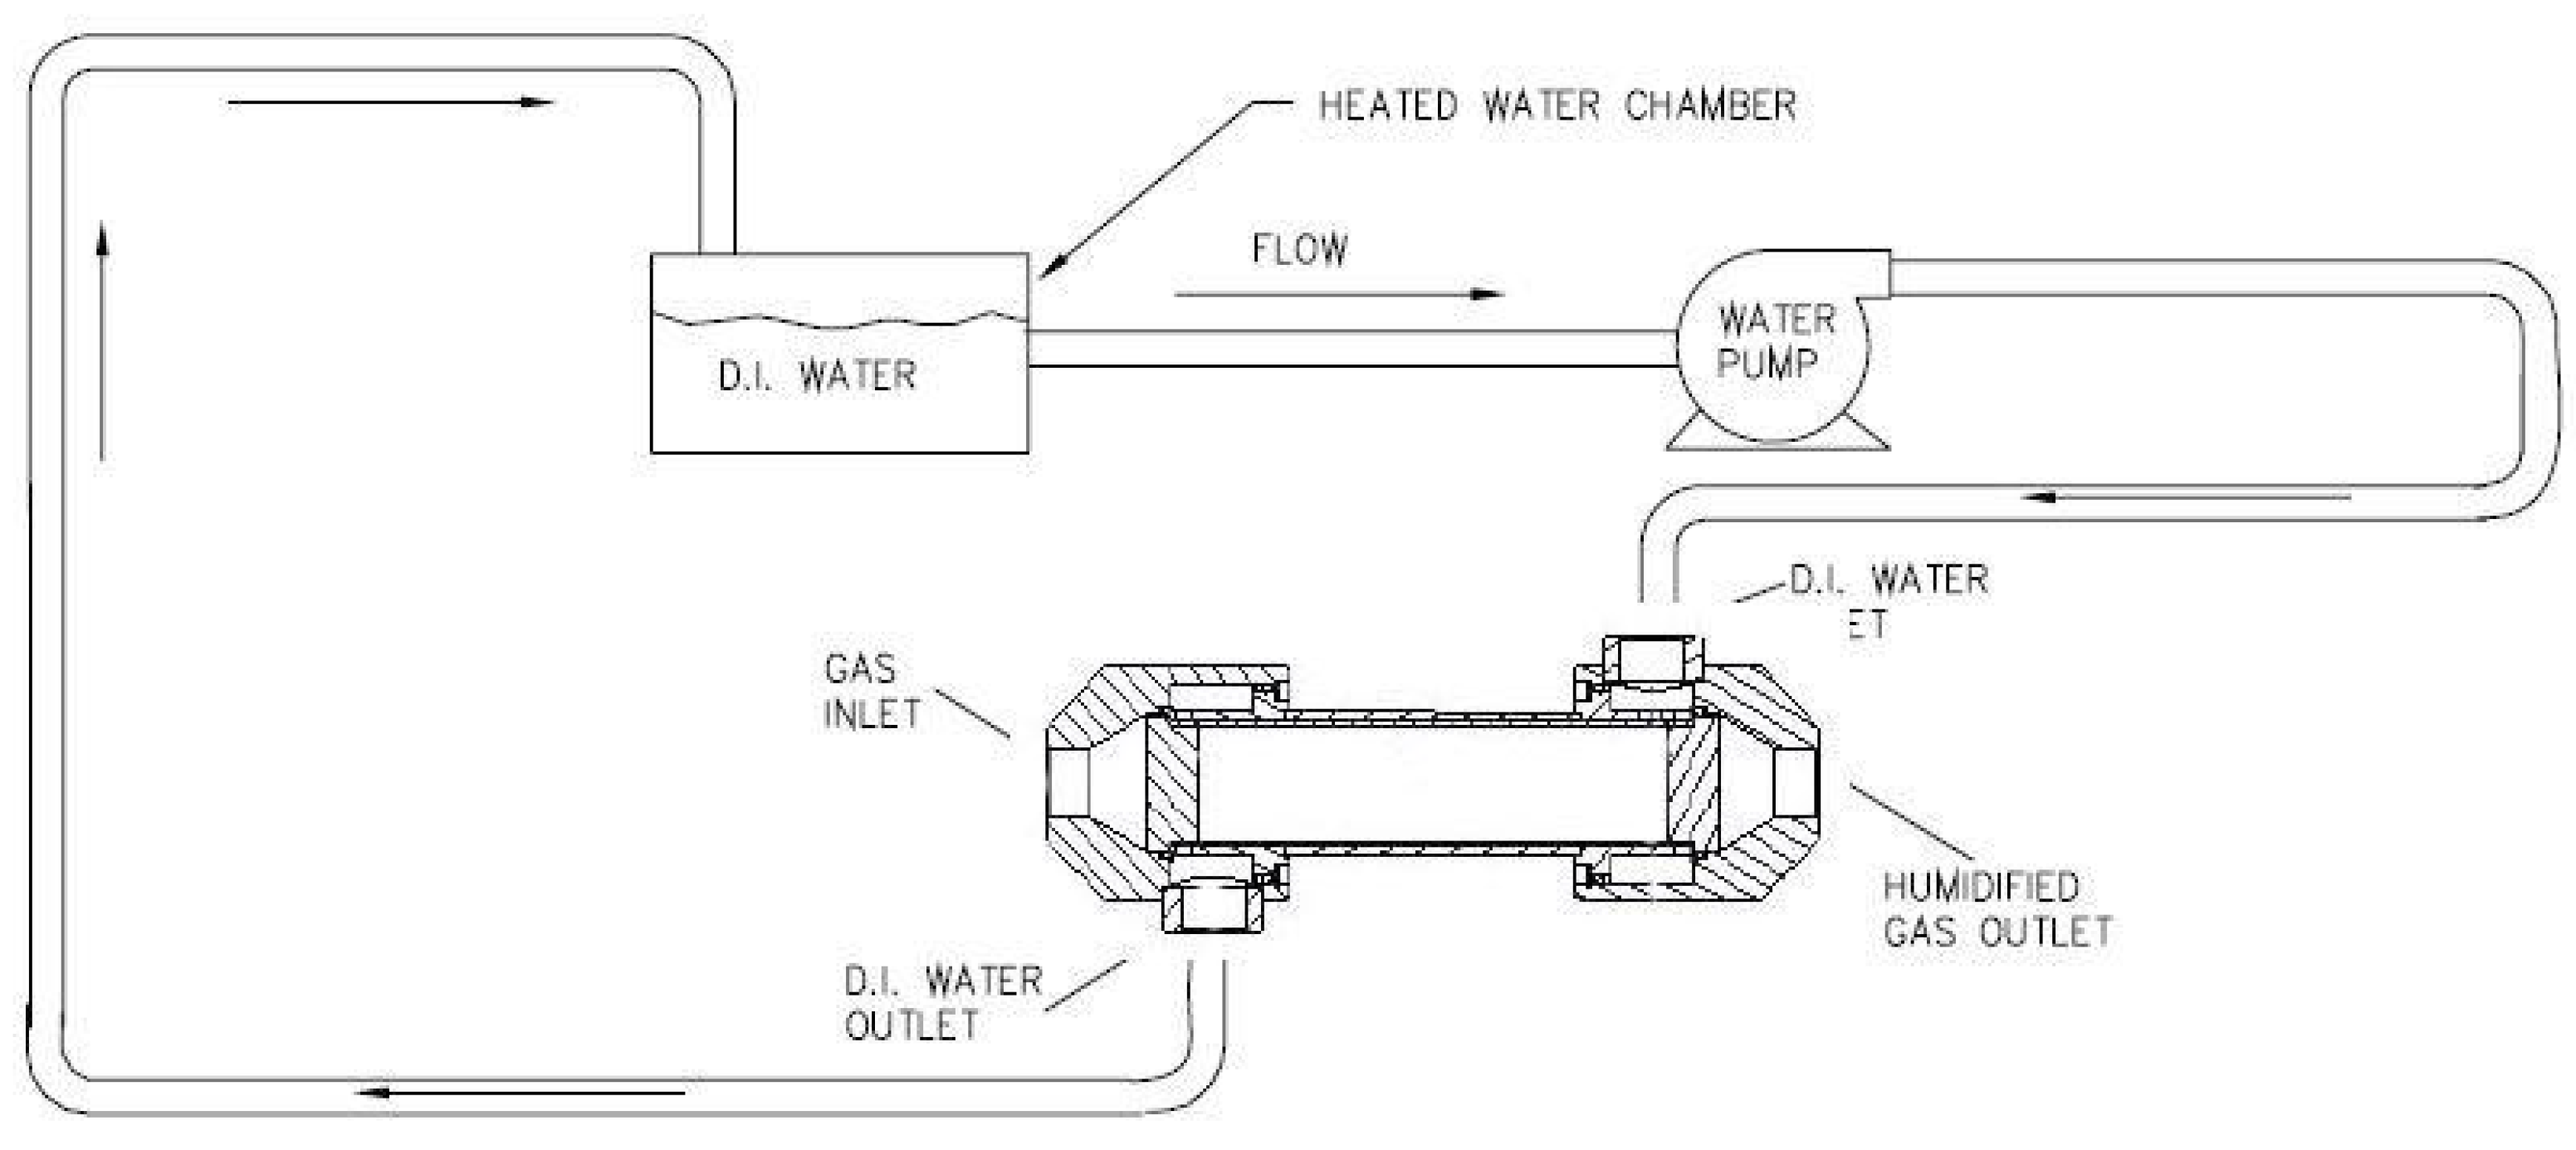
More in detail, it is possible to appreciate the internal details of the specific component in
Figure 2. The middle cylindrical zone (around the ‘B’ dimension) is dedicated to the water exchange, where a thin layer of the Nafion is applied between the two flows.
The Nafion® surface behaves (chemically speaking) similarly to liquid water in a water-to-gas arrangement, and if there is something in the gas stream that would react with liquid water it shall be also true for the tubing surface. Moreover, losses can be observed with humidifying gases soluble in water. It is possible that pressurized liquid water passes through the membrane maintaining liquid state, and action must be taken to transform it into gas downstream of the gas outlet as required.
The systems available on the market (
Figure 3) use a pump to recirculate the water inside the Nafion
® tubing shell side [
20]. In the system proposed in this paper there is
no water pump because the water is fed in a stagnant condition into the tube shell side. Thus, there is
less auxiliary power consumption, a decisive feature for automotive application to improve energy efficiency and increase the vehicle range. With increasing heat or decreasing sample flow, the performance of the system is controlled.
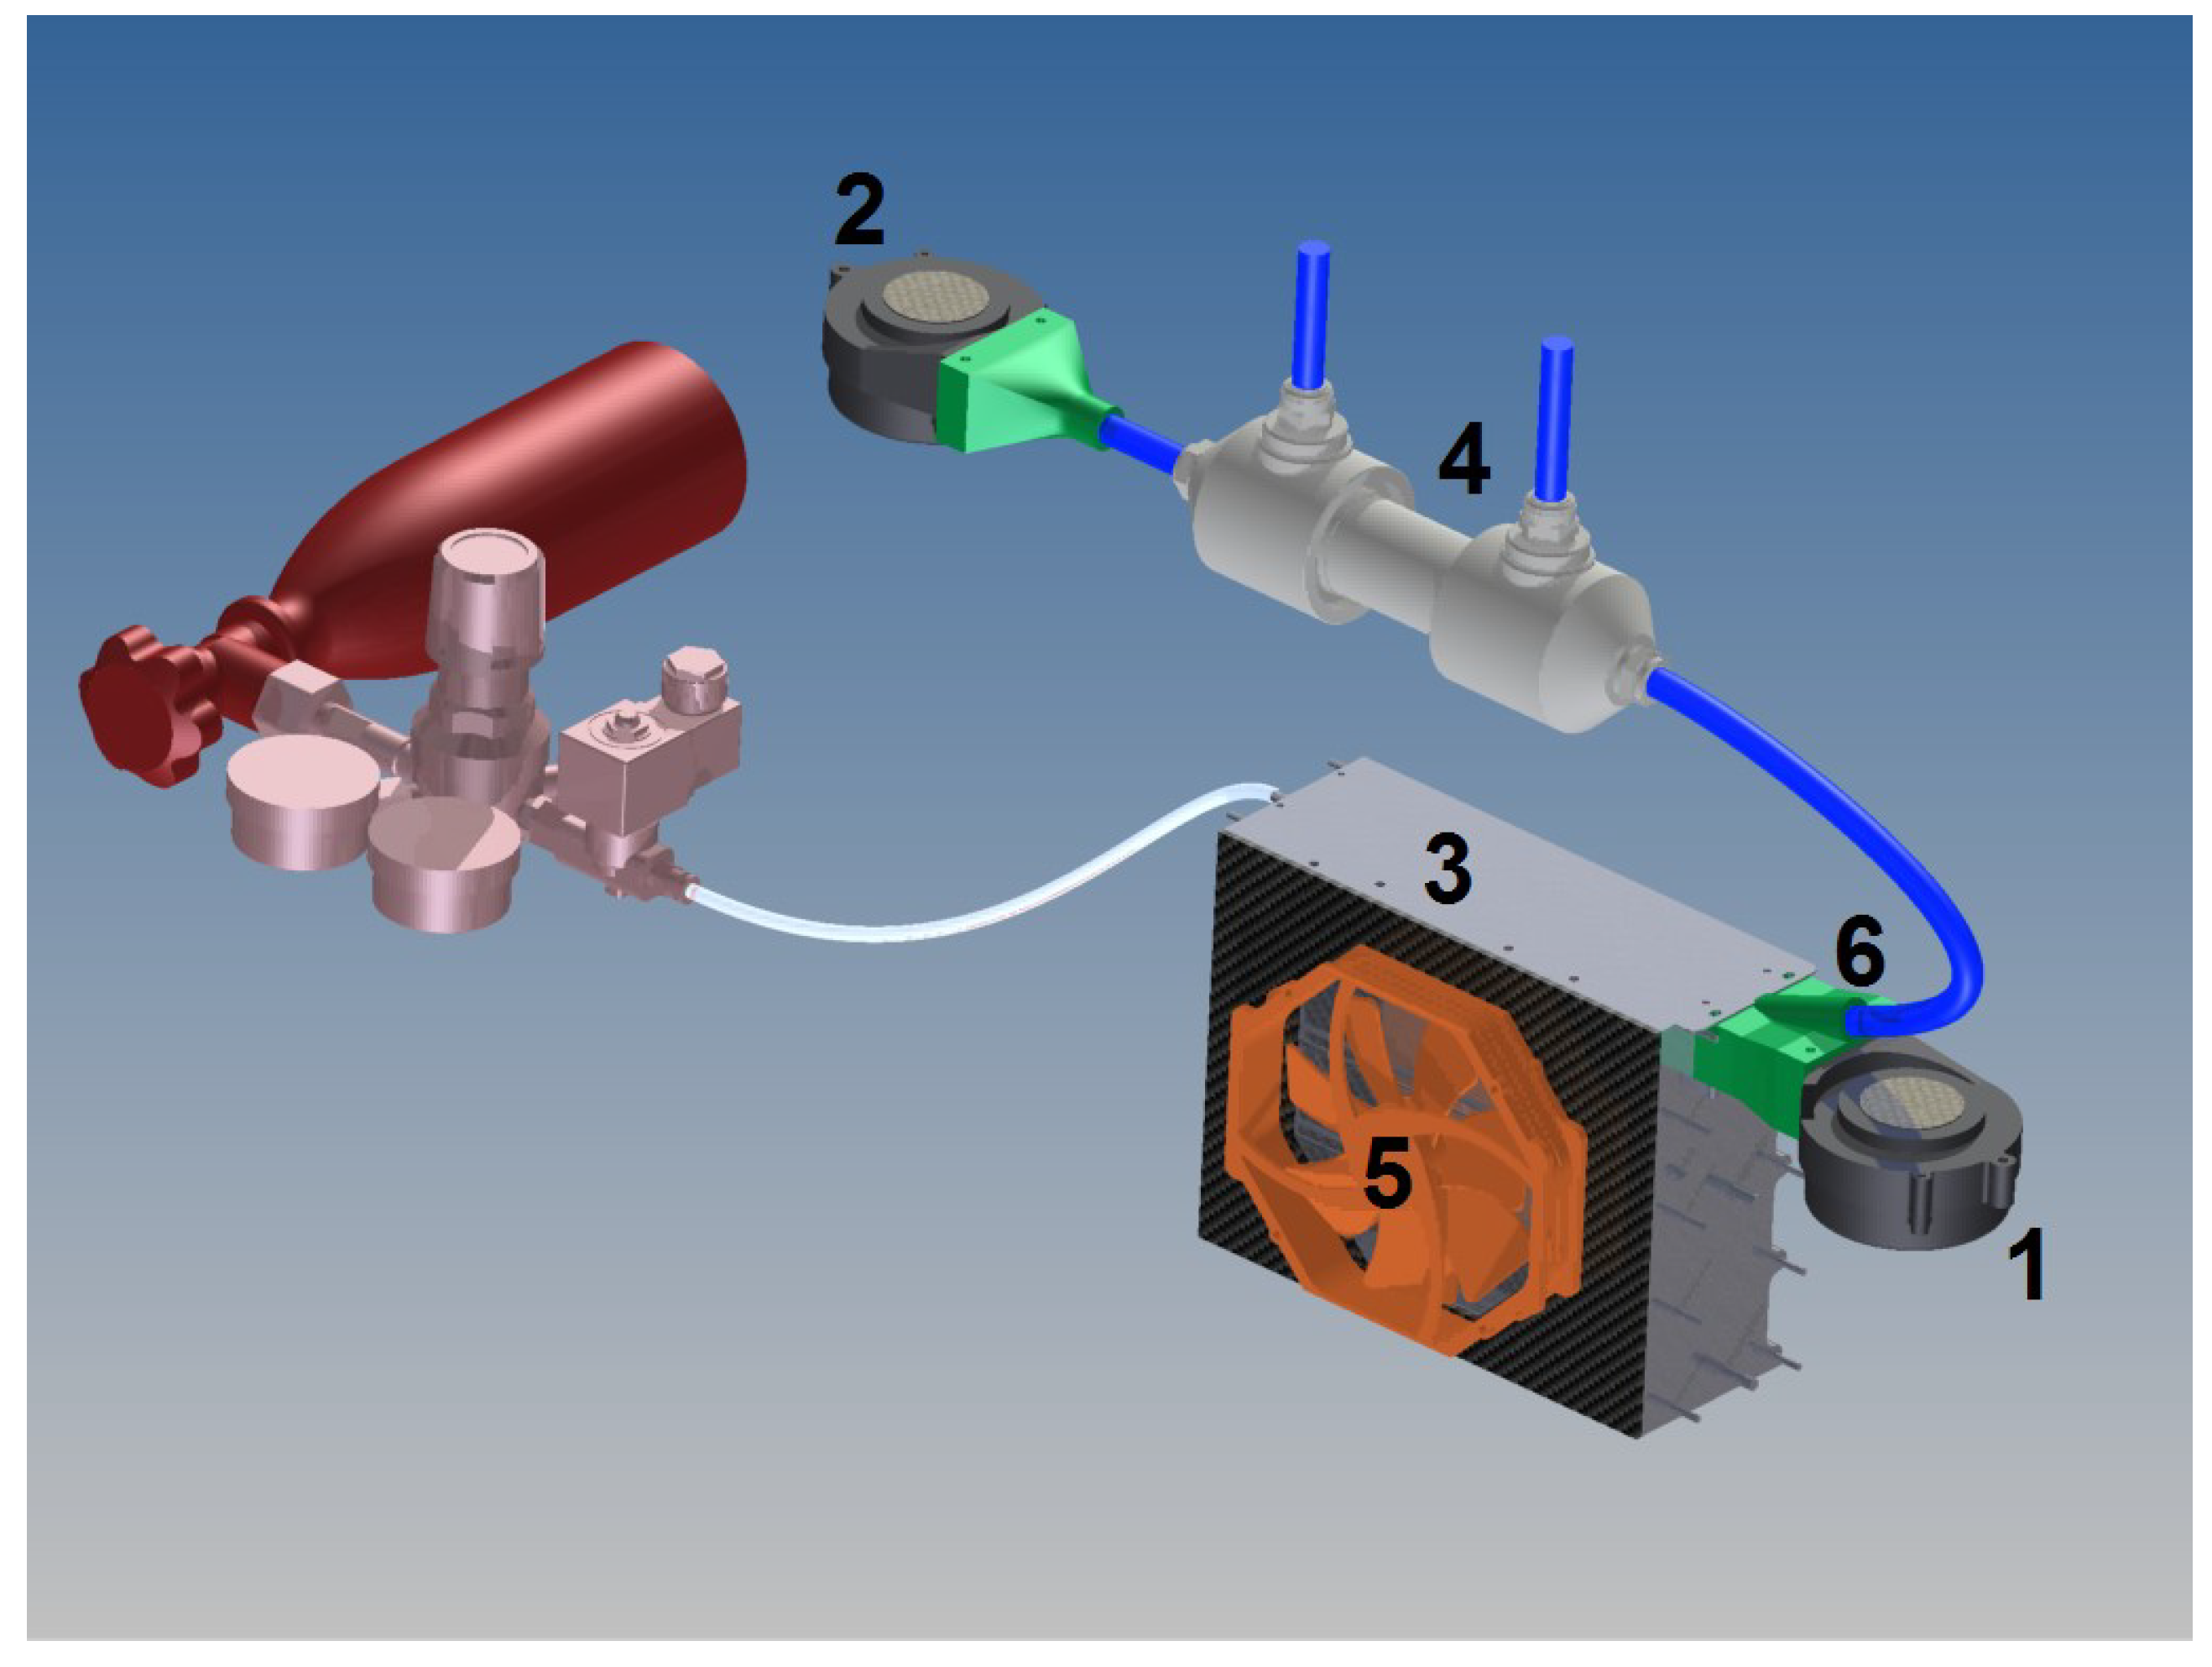
A scheme of the proposed system shown in
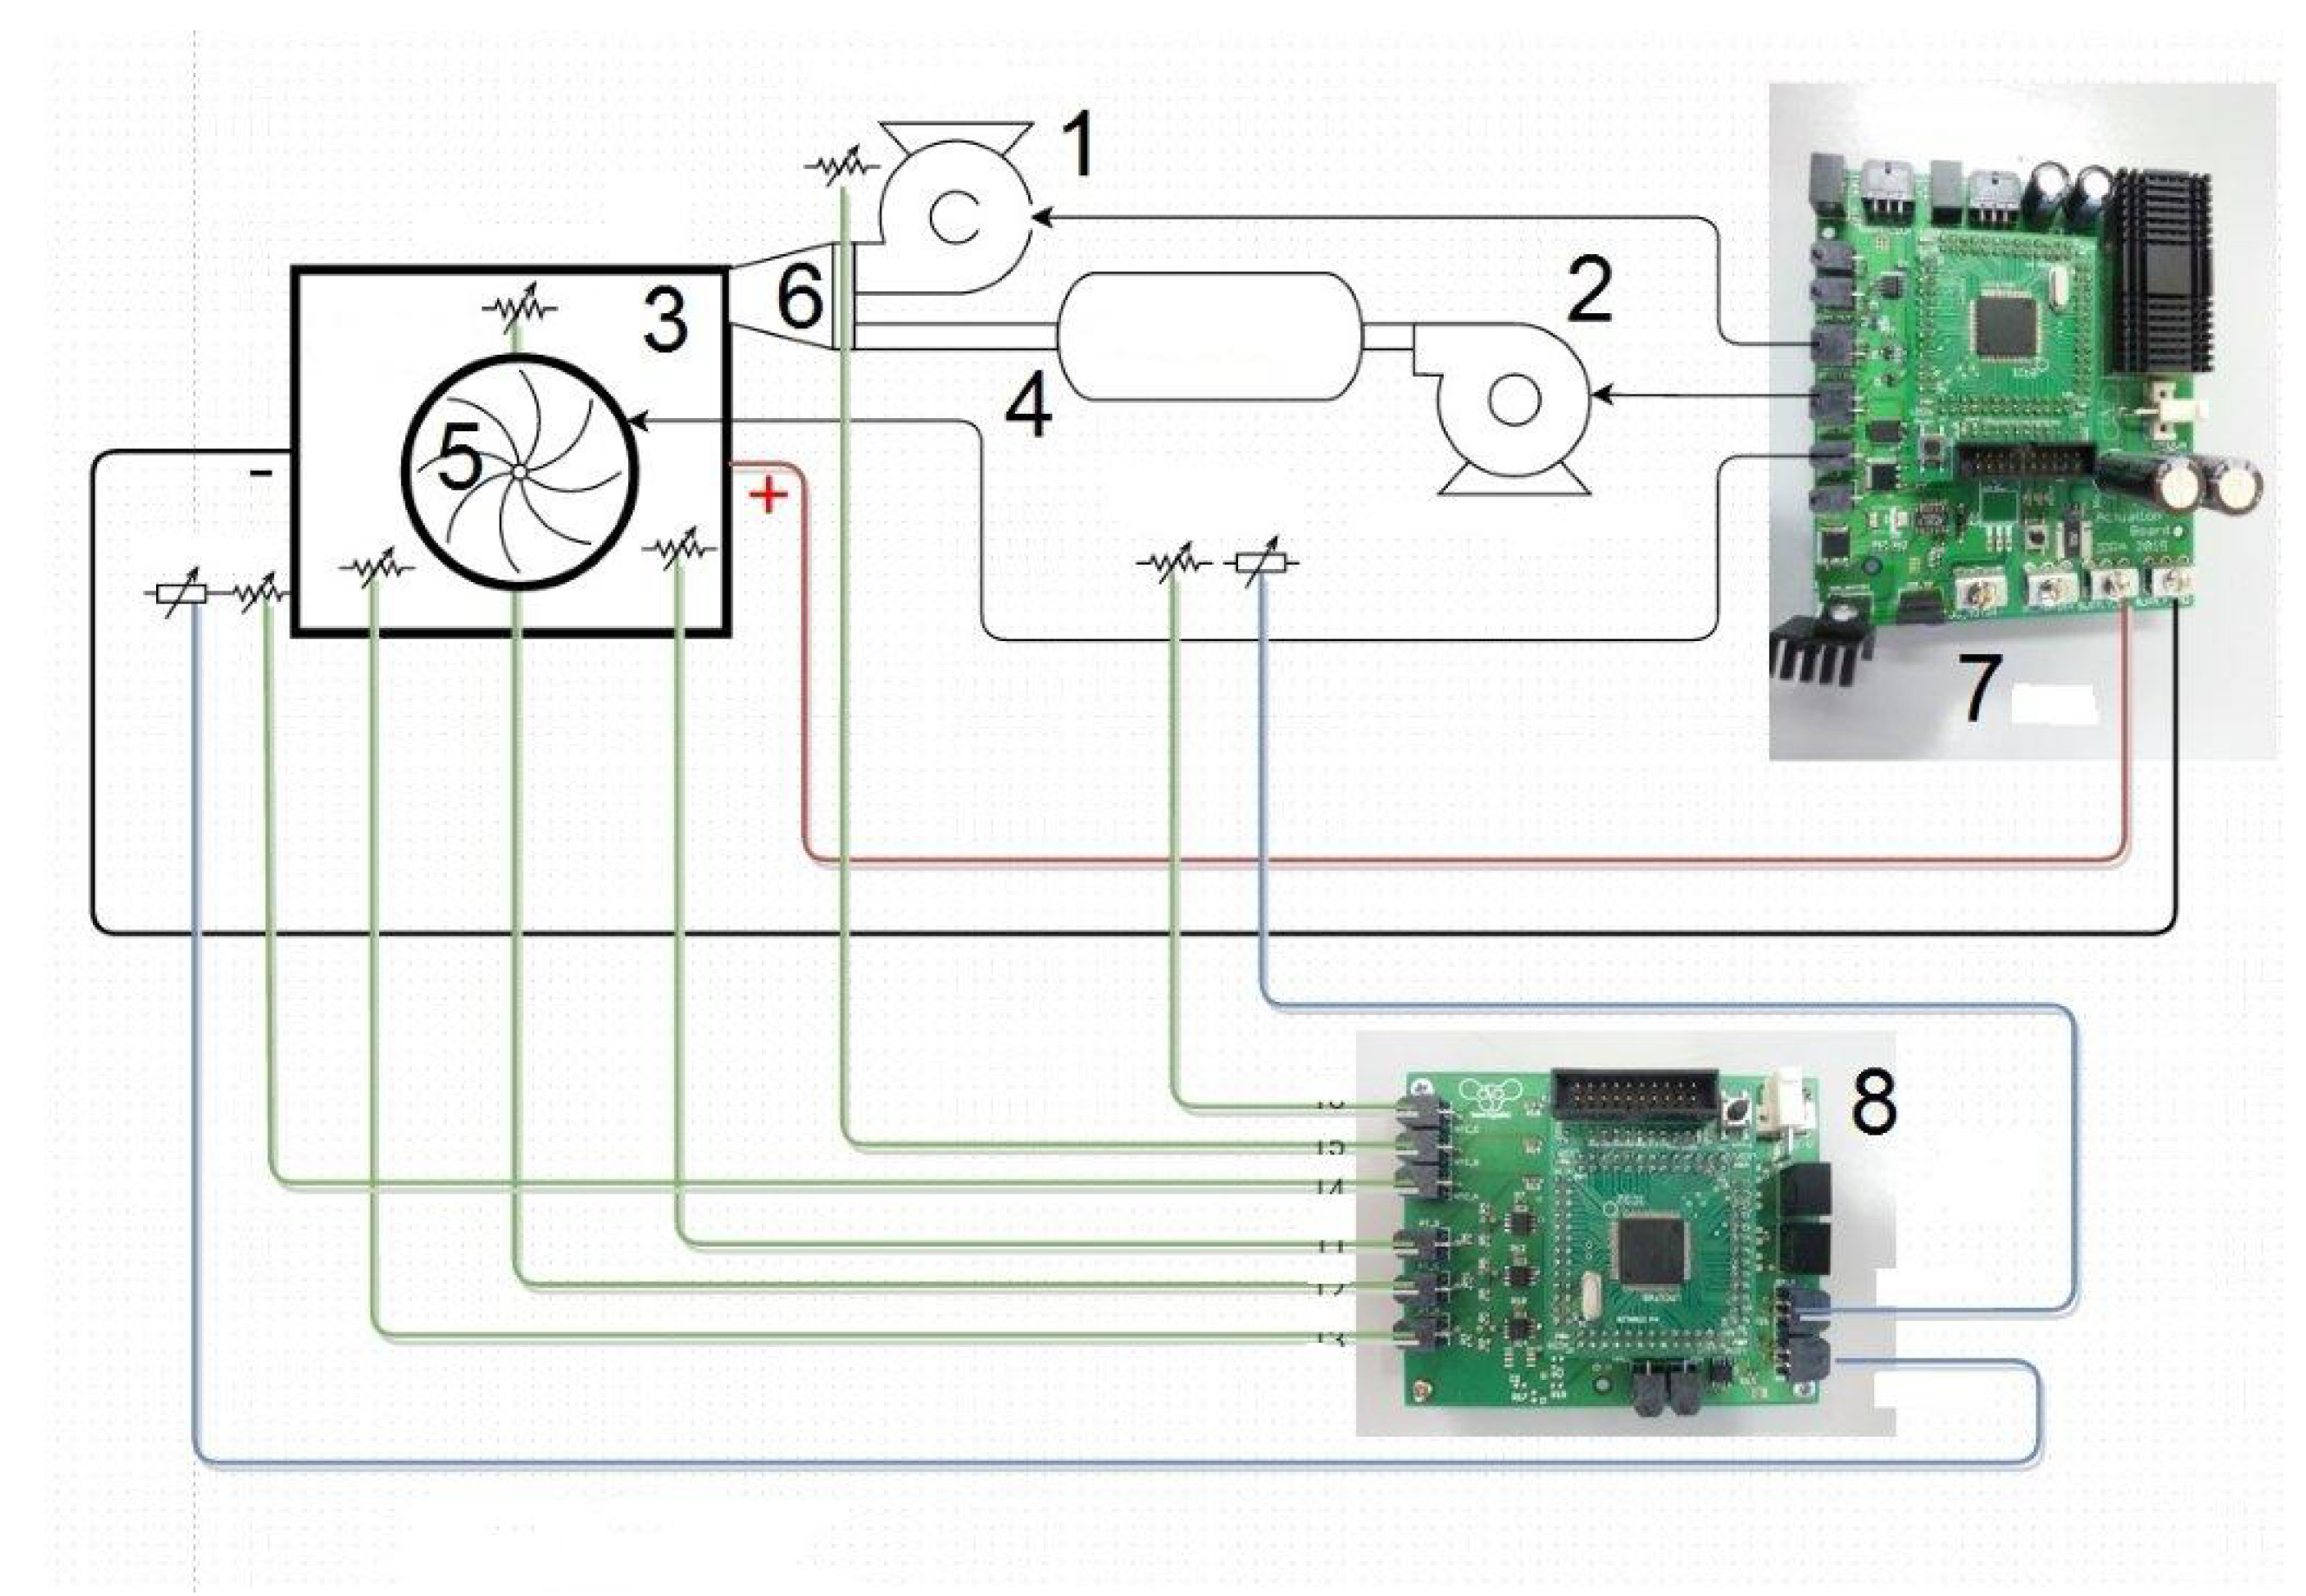
Figure 4. It cools the gas stream slightly and avoids the water evaporation in the membranes. It is composed of: two blowers (1) and (2) used in order to deliver the oxidant required to the reaction in the FC (3), they provide this air that has to be correctly cooled and humidified, in two flows. The first blower (1)—fixed directly on the FC (3) by a collector (6)—manages the pressure drops and supplies the fraction of primary air that represents the greater amount of oxidant for the reaction. One Nafion
® tubing (4) connects the blower (2) to the collector (6).
The secondary flow, supplied by the blower (2) manages the pressure drops inside the tubing side, going through the Nafion® tubing (4) where the water contained within it evaporates and increases the air’s water content. Since the water is going from the liquid phase to the vapor phase, there is an important energy loss and the tubing is cooled. The reduction of air temperature is beneficial for two important reasons: the thermal control of the FC and the reduction of water evaporation within the membranes.
The control of the stack temperature is done by a commercial axial cooling fan (5), which is installed beside the membranes and managed by a properly made ECU in order to reduce the water evaporation into the stack and stop the membranes drying. In fact, if the water produced by the reaction evaporates, it is partially removed by the outlet air flow.
The humidified stream, then, is mixed with the primary dry air to augment the quantity of water in the inlet air by a properly designed collector (
Figure 5) fixed on the fuel cell. Mixing of two air streams is often used in air conditioning systems (e.g., mixing air from outdoors with air returned from the air-conditioned system).
The water molecule reaction when passing through the Nafion® wall absorbs heat, because the humidification process is endothermic. One possibility to oppose the cooling effect is to provide warm inlet water. To optimize efficiency, hot, circulated, deionized water will be applied. One important characteristic of the Nafion® tubing is that it needs to function with a pressure inside the tubes higher than the shell to prevent the tubes collapsing. The driving pressure is simply the difference in water concentration on opposite sides of the tubing wall.
2.2. Application and Operation Conditions
The NTHS was tested and optimized in HySy-Lab laboratory and afterwards implemented on the vehicle prototype IDRA [
12,
24] that participated at the Shell Eco-Marathon competition [
25] (Rotterdam-May 2015) achieving good results in terms of consumption. IDRA [
26,
27,
28] (
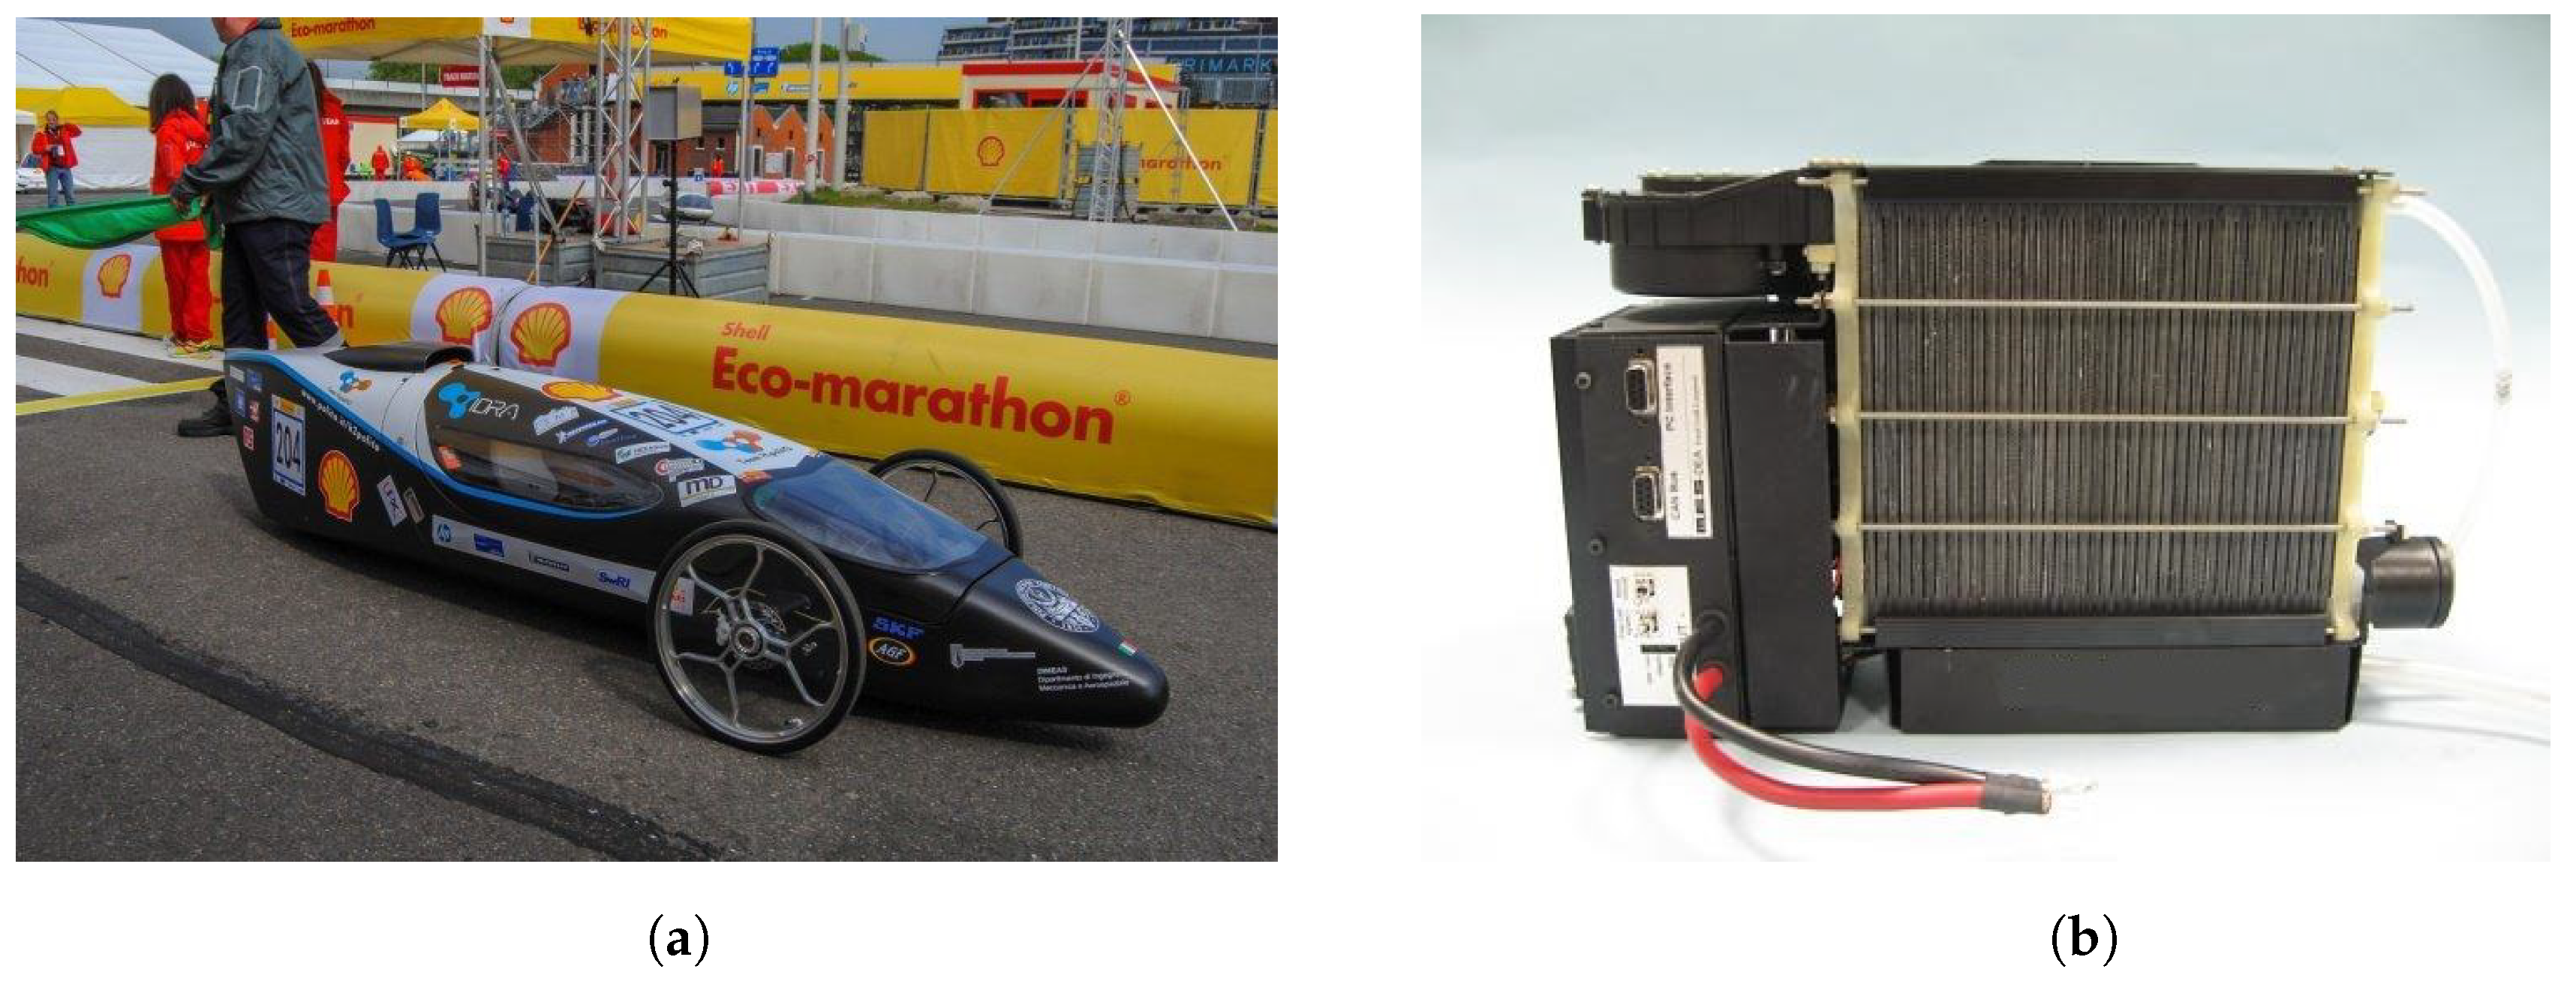
Figure 6a) is a carbon-fiber monocoque prototype [
29,
30] of 38 kg, 3 m length, 0.6 m height and 0.95 m width. The FCEV has a 200 W brushed electric motor and a 1 kW [
31] closed cathode FC (
Figure 6b) supplied, through a pressure reducer, by a 0.4 L at 200 bar hydrogen cylinder.
During the competition in Rotterdam the external temperature was about 20 C and the race (and then the working requisites of the PEM) is organized to complete 10 laps of a circuit of 1.6 km, in a maximum of 39 min.
The NTHS was tested on a PEM of 40 cells (61 cm active area) with dimensions mm3 (), mass of 2.2 kg and the following characteristics:
Maximum Power Output: Electrical: 1 kW and Thermal: 1 kW;
Voltage range: 24.0–38.0 V Unregulated DC Output;
Hydrogen consumption: 13 L/min (0.06 kg/h) @ full load;
Stack specific power: 450 W/kg; Stack power density: 330 W/L.
The operating conditions for the correct use of the stack are:
Maximum stack temperature: 63 C;
Hydrogen management: Circulation;
Ambient temperature: >0 C up to +35 C;
Cooling: forced air cooling.
In the method proposed in this paper the air humidity in the FC should be closely controlled. The air ought to be sufficiently dry to evaporate the water produced; however, not too much that it excessively dries the membrane, knowing that it is fundamental that the electrolyte membrane maintain an elevated water content. Therefore, the humidity must be above 80% to avoid excess drying, but should remain limited to 100%, otherwise liquid water can be present in the electrodes [
18].
When the PEMFC works at equal pressure on anode and cathode sides, only two processes govern water transport in the membrane: the diffusion of water from higher to lower concentrations, and the flow of water from anode to cathode caused by electro-osmotic drag.
In automotive applications, the operating conditions of the PEMFC is not optimal because the temperature of the powertrain compartment is high and the humidity is low. Furthermore, the load in these non-stationary conditions is also variable, creating a challenge to design efficient systems.
The proposed method tries to solve the problem of drying effect of air at high temperatures where, during the low-current-density operation, the cathode’s water production is insufficient to humidify the anode through back-diffusion mechanism, and at elevated temperatures a more severe membrane dry-out problem is observed [
21].
The NTHS must increase the humidity and decrease the temperature of the membranes to avoid voltage drop during the race and consequently a lower performance and efficiency of the vehicle. The proposed system is installed in the rear part of the prototype that is a closed compartment with only an air intake on the top, which is black on the side and white on the top to reduce the heat flux for the solar radiation.
3. Experimental Setup
Figure 7 shows the electronic scheme of the NTHS, with the elements (1) to (6) the same previously reported in
Figure 4.
The mass of the primary air is set with a curve that is managed with a correct function by the designed ECU (7) with a sensor board (8), which has six sensors of temperature and two sensors of humidity. It acquires the temperatures of three points on the stack, primary reaction air, and other two points to correct the measures of two humidity sensors for the environment conditions and for the outlet air cathode flow. The actuation board, powered by the FC, manages the current request by the driver and controls the electric motor (24 V and 200 W) of the vehicle, the sensor board, the two blowers and the cooling fan. At high temperature, the relative humidity plunges quickly. If the relative humidity of the outlet air is significantly lower than 80%, the cell will dry out, the PEM will cease working and the membranes can be damaged.
The measurement and control of the outlet cathode air humidity is very important for the correct management of the FC system, because this parameter, observed by humidity and temperature sensors, gives feedback to the ECU of the water content into the membrane, thus allowing the correct air regulation of the blowers. The optimal air humidity is between 70% and 95% to avoid both drying and flooding conditions. Therefore, the ECU manages the temperature and humidity sensors, keeping under control the outlet humidity airflow; when it becomes <70% the ECU switch on the Nafion® tubing blower, increasing the moisture air content. In addition, the ECU controls the blowers and the cooling fan.
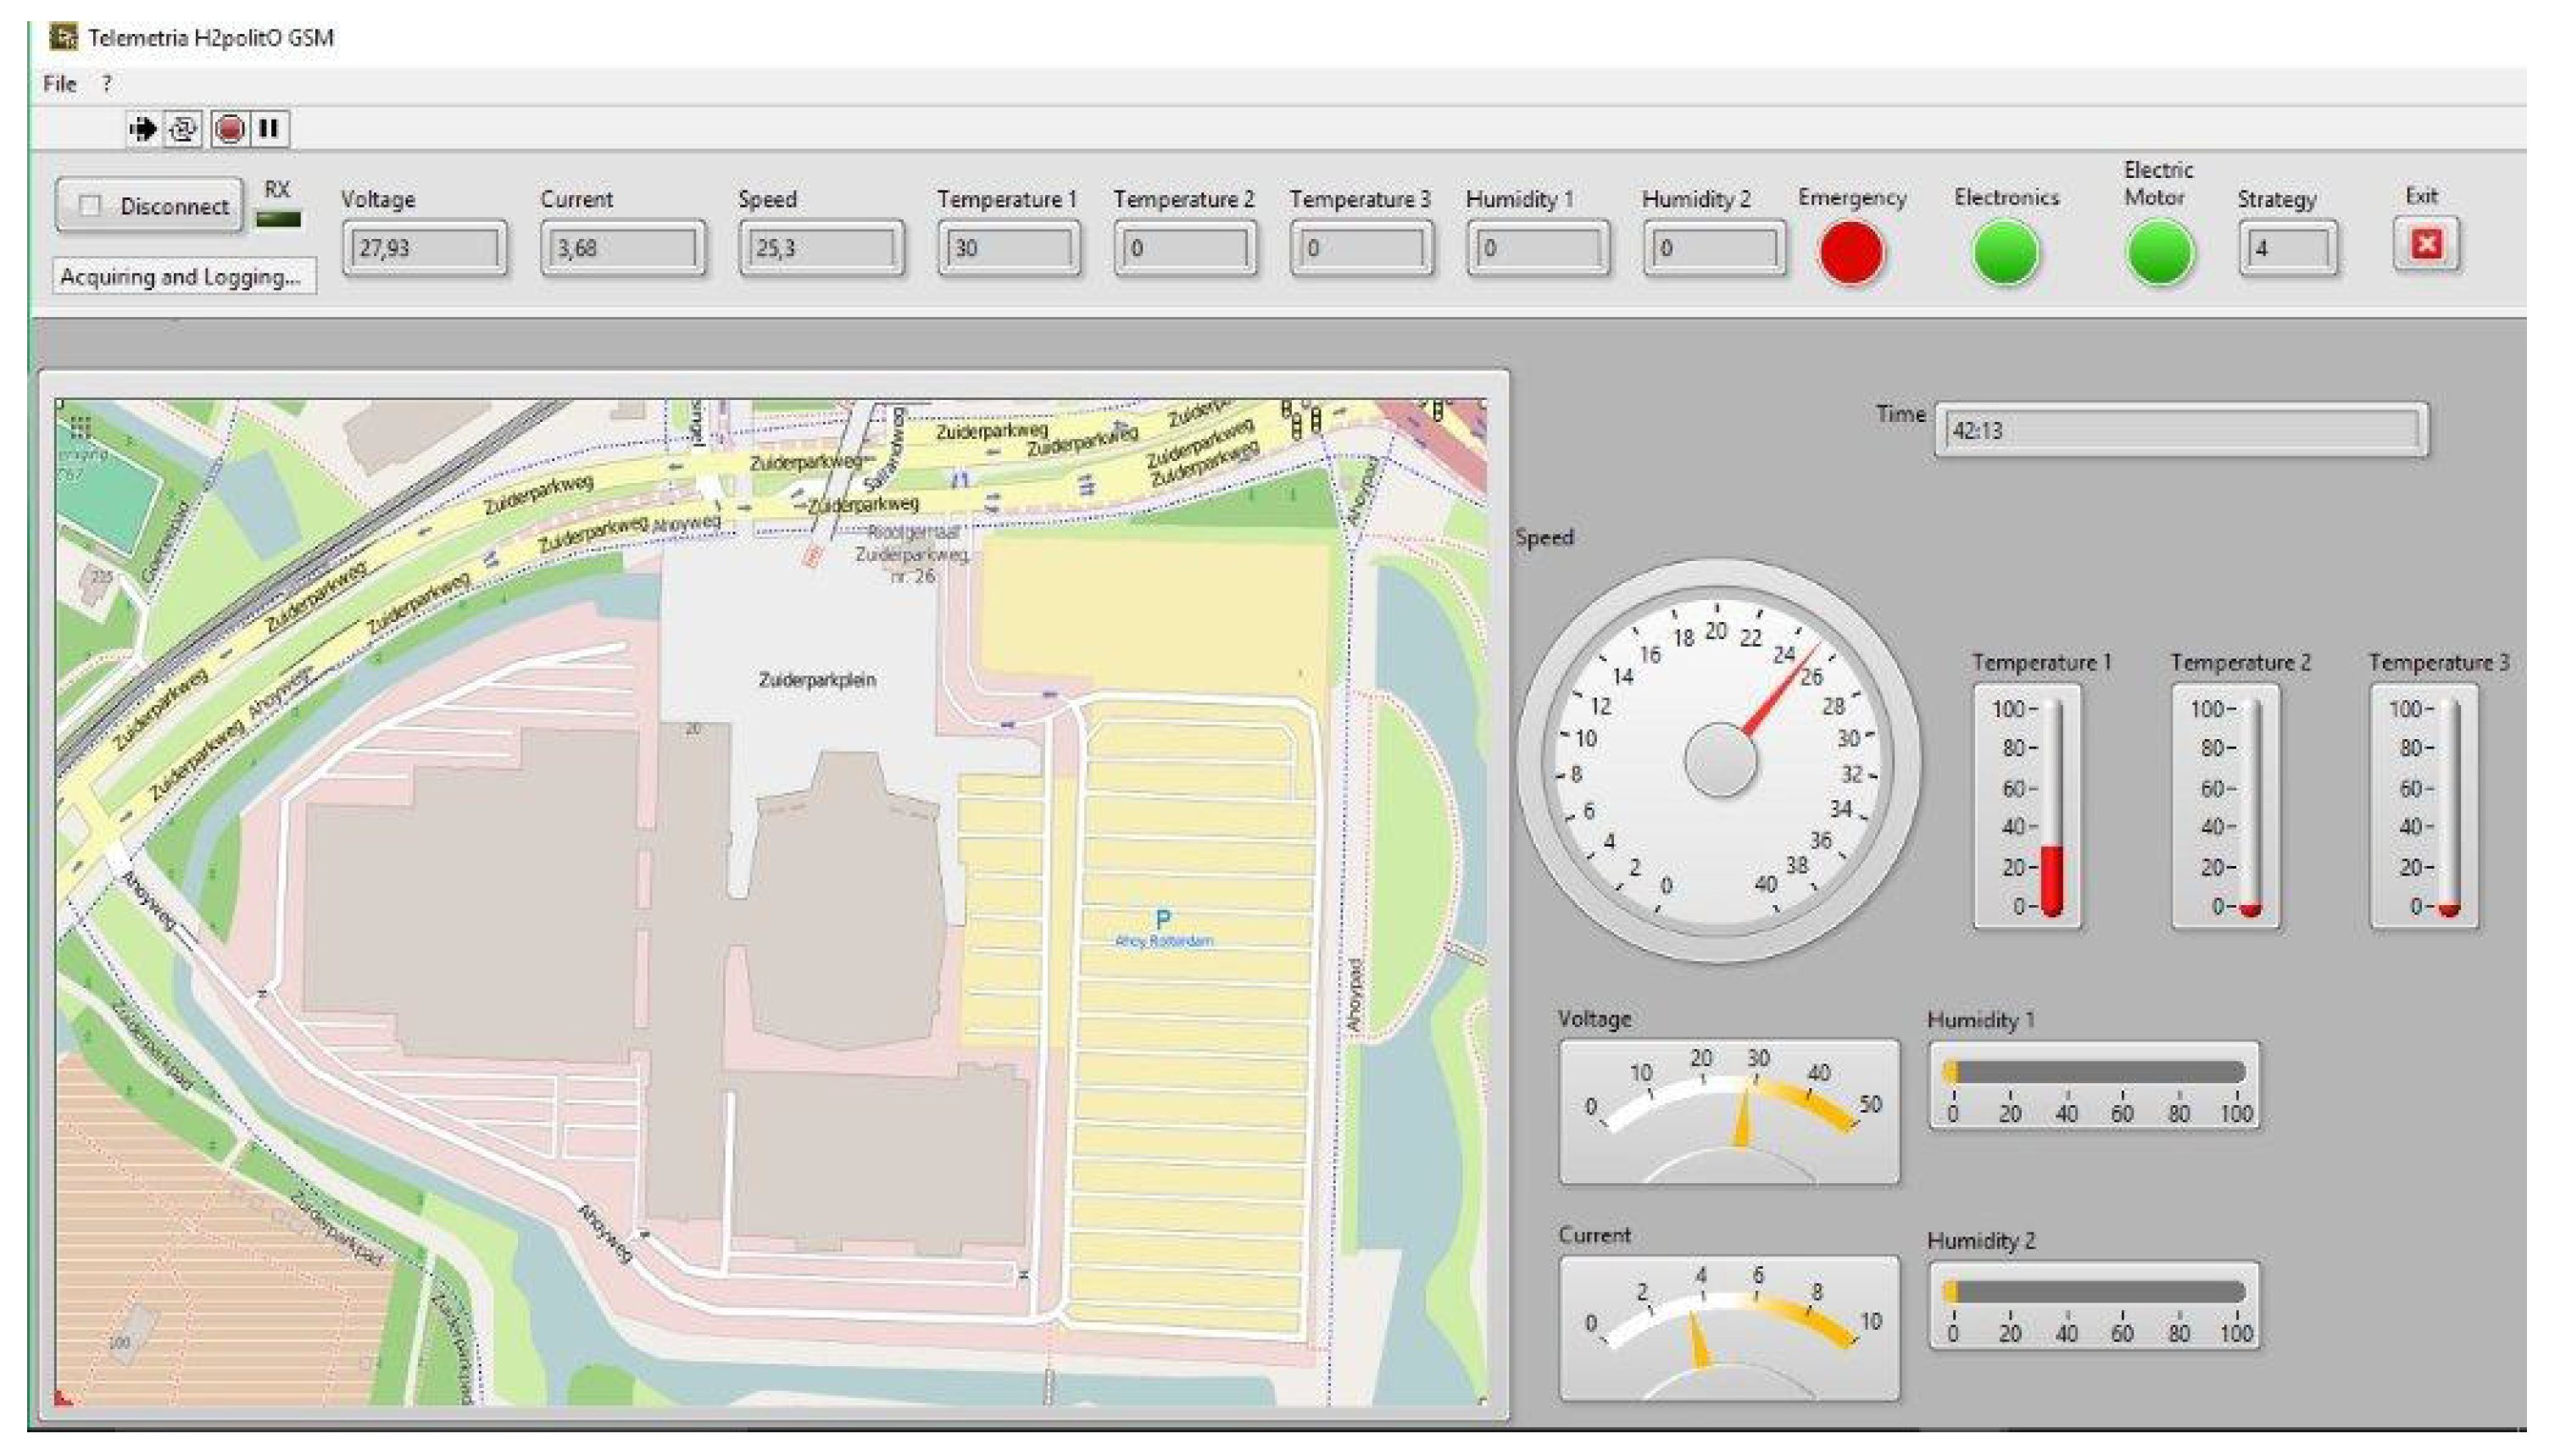
To control in real time and save all the parameters of the system on the vehicle prototype, IDRA are implemented on two boards: a telemetry system and a datalogger. The telemetry (
Figure 8) allows all the parameters controlled by the boards to be display in real time, during the SEM competition, and to be analyzed afterwards. Namely they are:
Fuel cell current and voltage;
Vehicle speed;
Prototype position on the circuit map;
Average temperature in three different points of the stack;
Temperature of environment air and rear compartment;
Humidity of outlet cathode fuel cell air and of environment air;
Strategy;
ON/OFF motor;
ON/OFF electronics;
ON/OFF emergency;
Time elapsed.
The observation of these parameters is very important to manage the system, and allows the changing of the race strategy during the run to have the better working conditions of the FC and to increase the global efficiency of the powertrain. The Datalogger allows saving, and afterwards analysis with graphs, with all the parameters controlled by the ECU. After the race, it is possible to choose the more significant parameters to organize and analyze the results.
The most important parameters are saved by datalogger and analyzed, referring to the Results chapter, are:
Current (red line) and voltage (black line) of the FC,
Outlet cathode air humidity (cyan line),
Three temperatures (brown line) of the FC (measured by three temperature sensors at three different points inside the stack).
This paper presents the results of the application of the proposed NHTS system, comparing, in particular, the results obtained during two runs: The first without NTHS (Run 1); and the second with NTHS (Run 2), so that the influence of the proposed system can be clearly identified.
4. Results and Discussion
4.1. Laboratory Tests
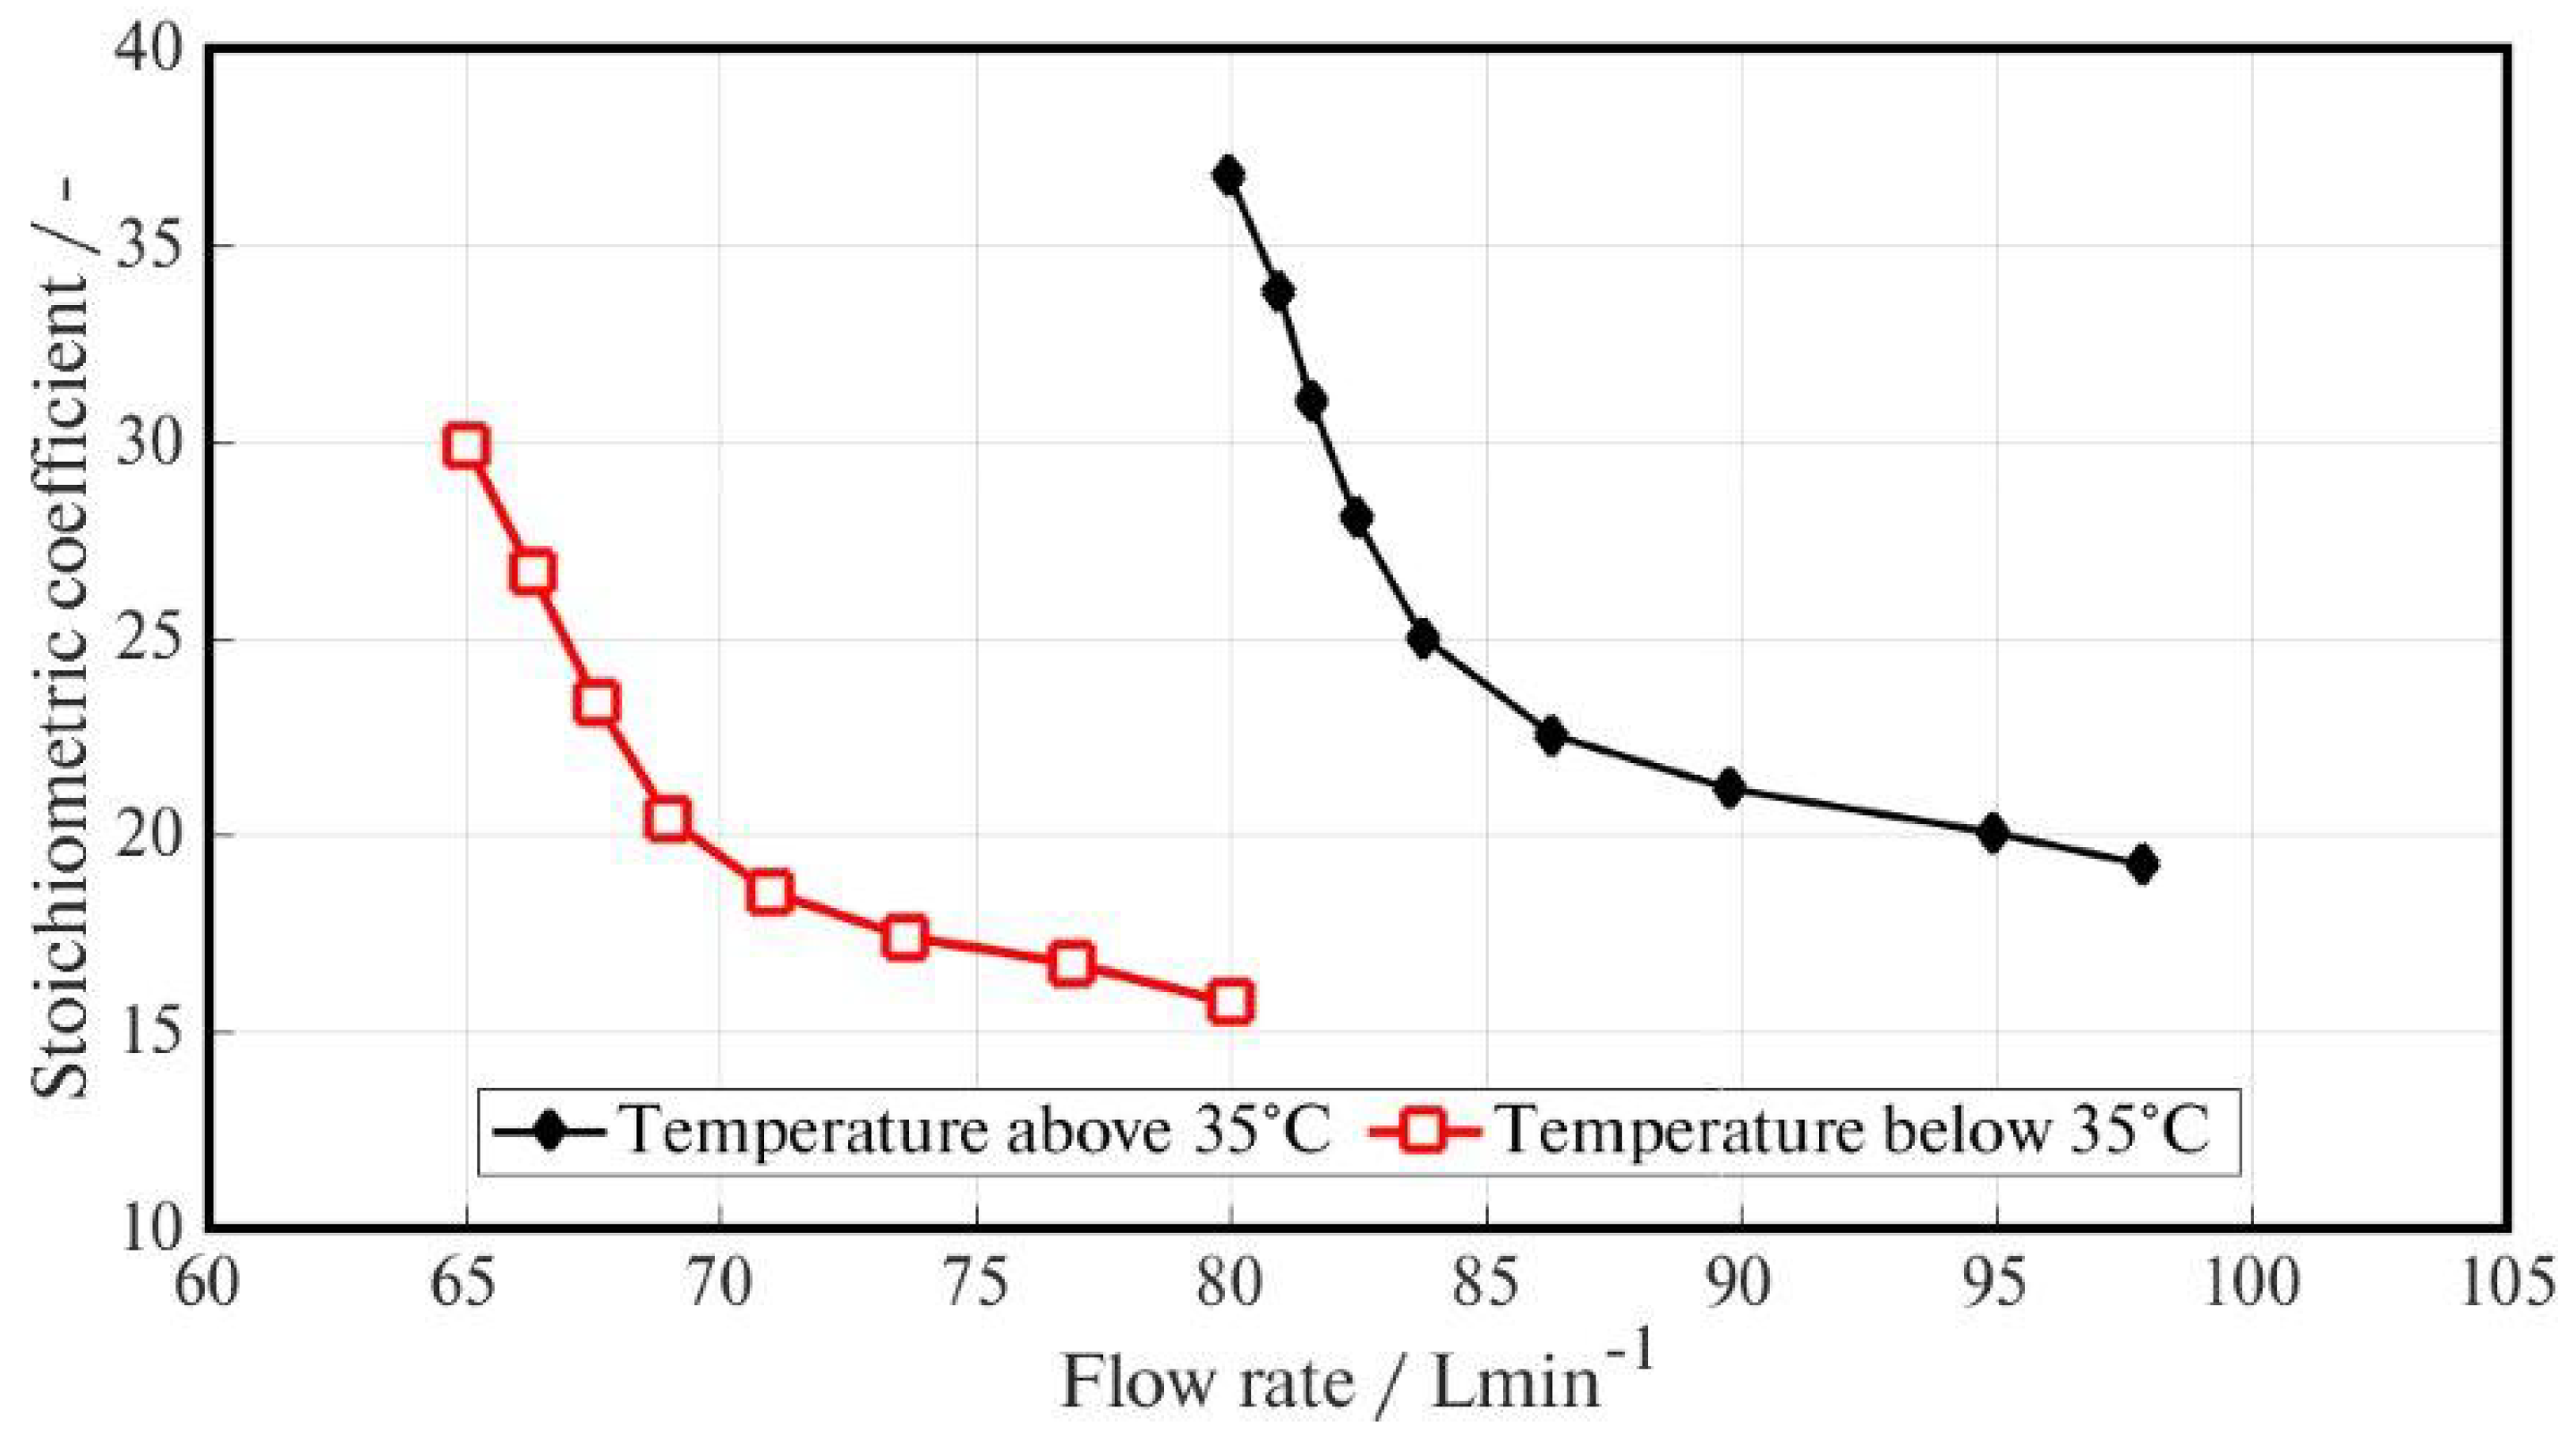
The first test performed in the HySy-Lab was designed to determine the stoichiometric coefficient of the FC for a range of flow rates. These values are essential to tune the control system, so that it can achieve the desired values of humidity during the real application [
19]. It is important to highlight that with the stack temperature lower than 35
C, the blowers provide only the humidified air to accomplish the reaction. If the temperature rises above this value, the ECU increases the blower flow rate. This difference in the source of the flow, and therefore of the average humidity of the inlet air, will directly impact the stoichiometric coefficient, as shown in the results reported in
Figure 9.
The optimal stoichiometric coefficient
is obtained considering both the increasing temperature data and the equation:
where:
is the mass flow rate (Nafion
® tubing blower + reaction blower flow rate),
n is the number of cells stack (40 cells in our case), and
I the fuel cell current request [
18,
19].
One would expect the FC humidity to be lower at greater airflow, but this situation does not happen with the NTHS. Thanks to the high relative humidity in the Nafion® tubing outlet air flow, it is possible to increase the FC inlet flow rate and consequently cool down the FC itself.
In fact, the main NTSH advantage concerns the Nafion® outlet humidity because it is always in saturated conditions over a wide range of flow rates, even with a high Nafion® tubing blower flow rate (about 70 L/min), and can use either liquid water (water-to-gas) or a humid gas stream (gas-to-gas) as a source of humidity.
The FC system is also equipped with an external cooling fan. In very warm conditions (ambient temperature higher than 35 C) it could be necessary to turn on the cooling fan to decrease the temperature; this is done by the ECU if the FC temperature rises above 40 C.
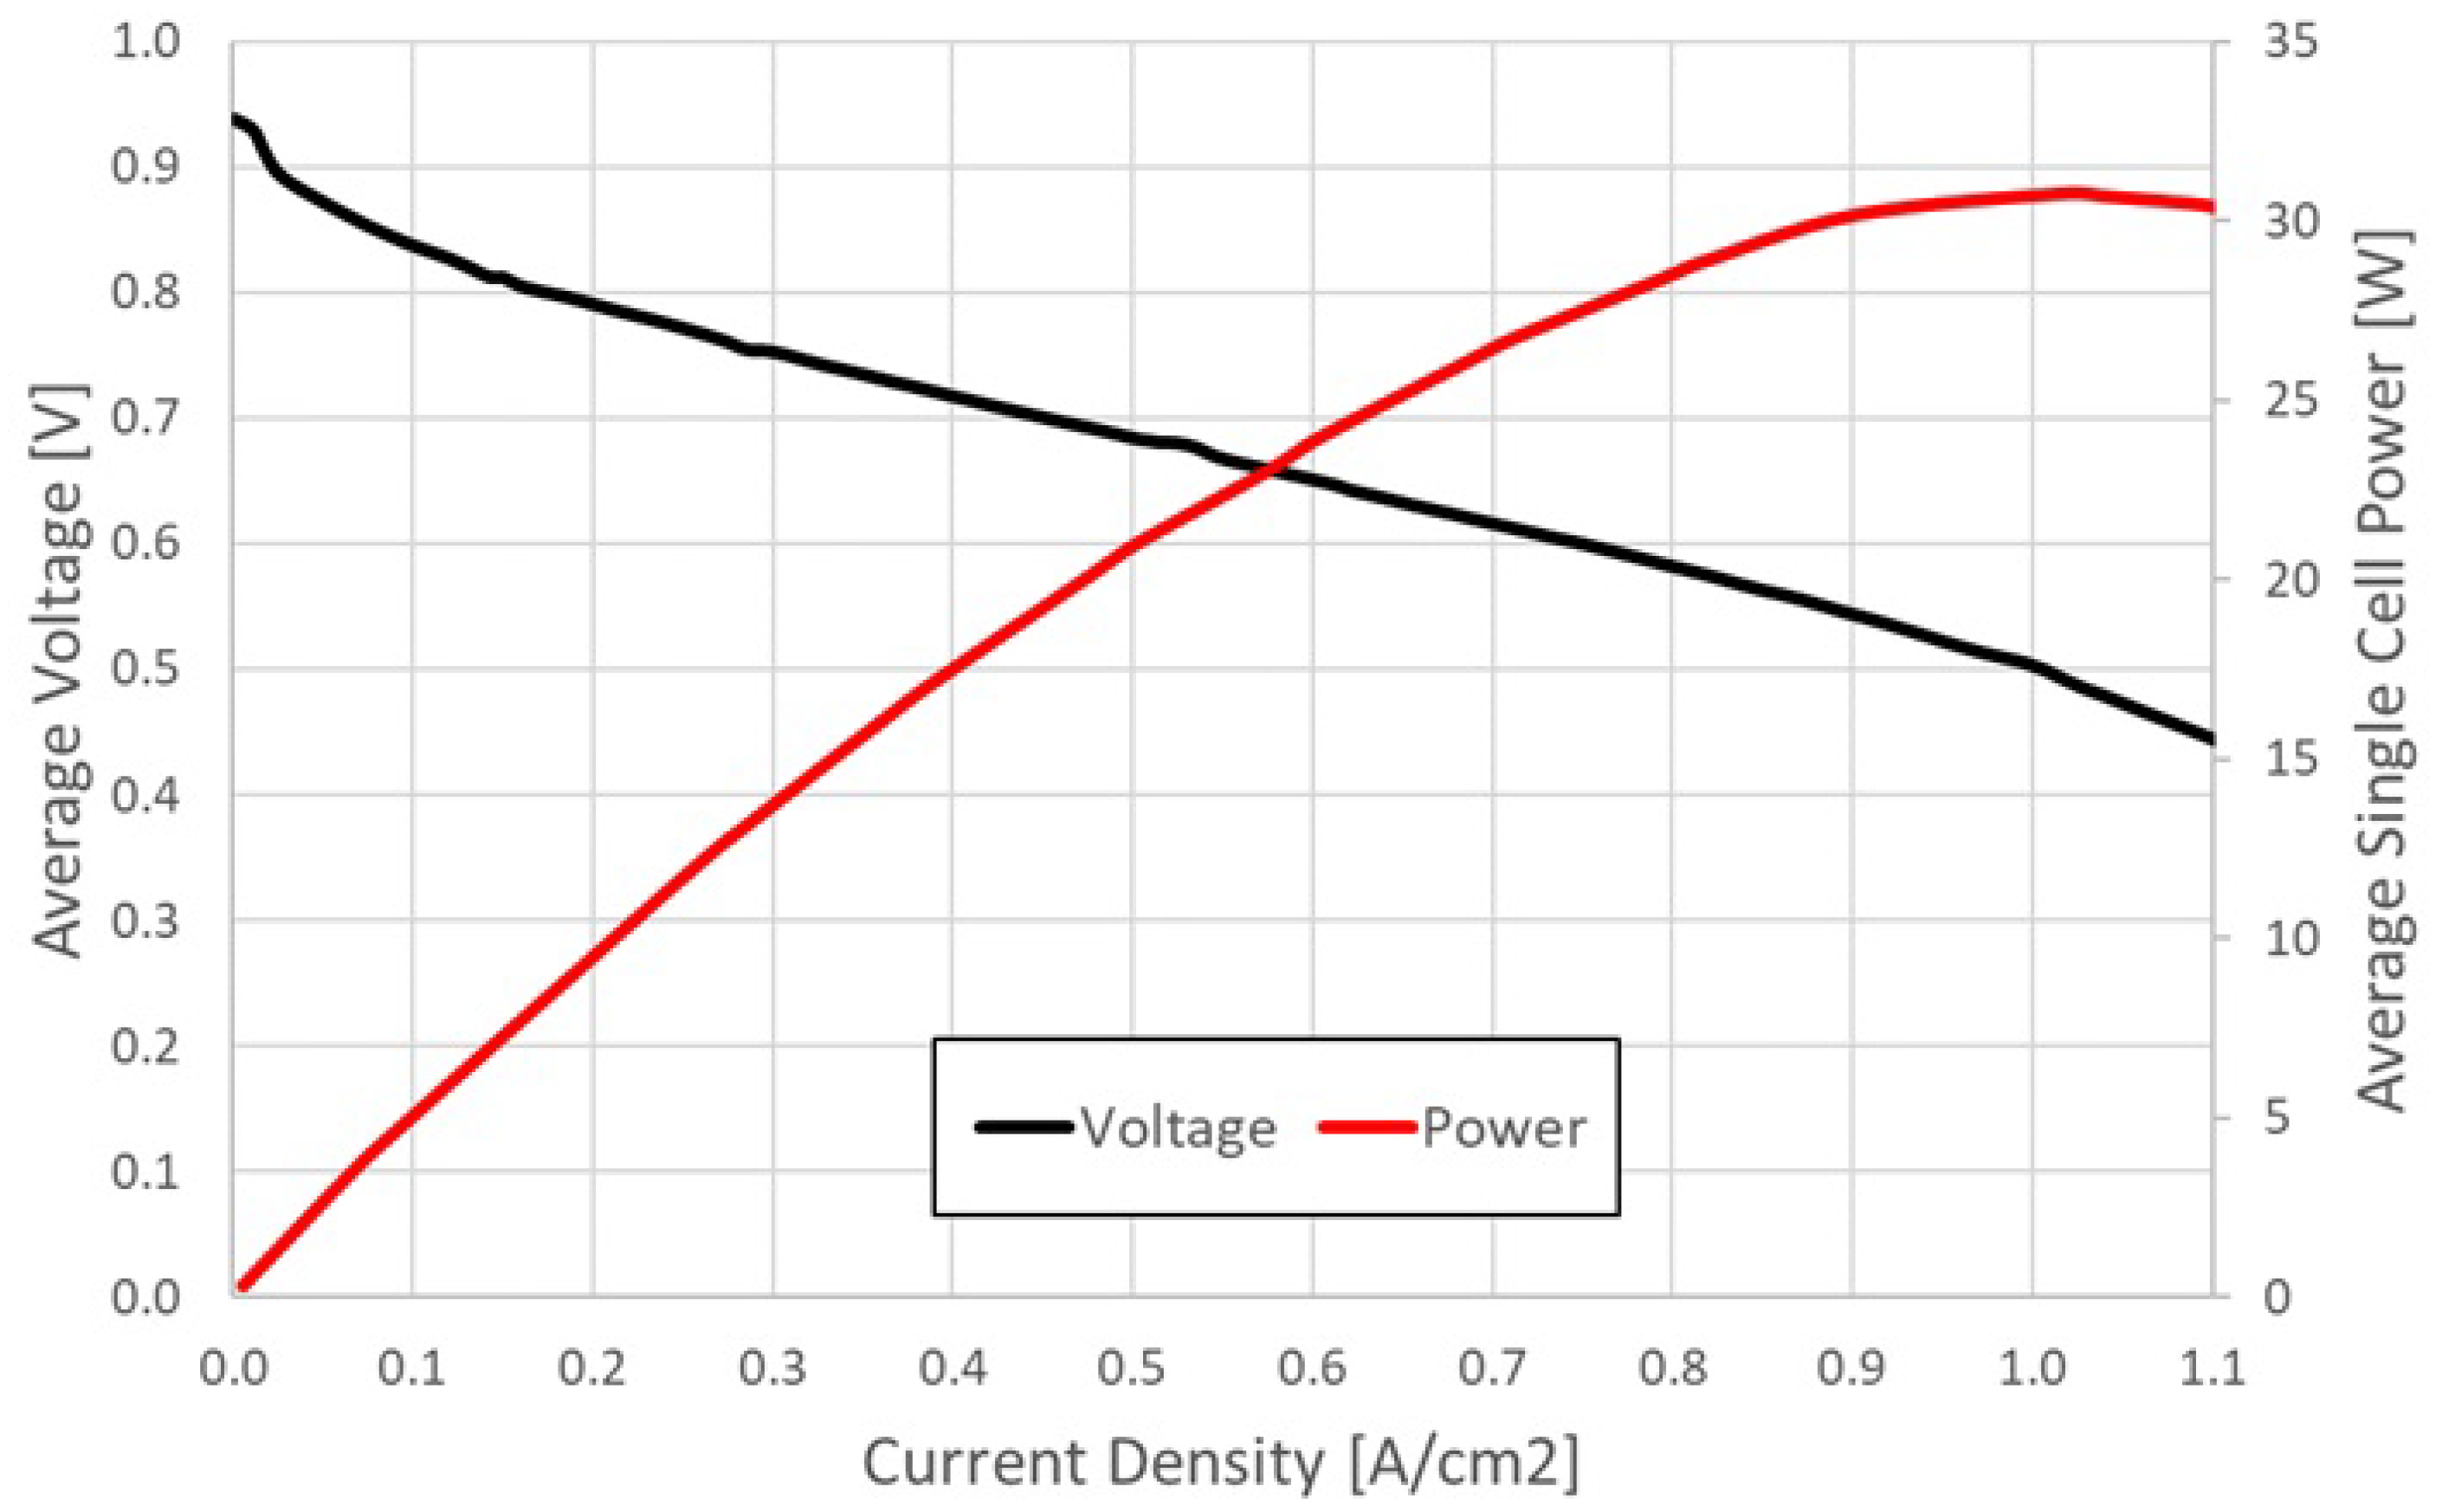
After that, the polarization and power curves of the FC were obtained by experimental laboratory tests [
32] and are shown in
Figure 10.
These are the potential performance curves in optimal operating conditions, but during the operation this set of conditions may change and some elementary faults of the FC system or single cell might happen, causing a decreasing of FC performance. Thus, when analyzing the overall results of the applied tests, the reference values can provide valuable insight about the proximity to ideal laboratory efficiency.
Please note that the typical performance of state-of-the-art FC can reach up to 0.7 V for a current density of 1 A/cm, higher than the final result obtained by the FC under investigation. It is worth mentioning, though, that the aim of this paper is not to discuss nor to propose improvements into the FC best-condition behavior, but to create the conditions to achieve this results in a real-life application by means of the NTHS.
The results obtained through the testing of the cell are similar to the ones reported by the manufacturer of the cell (MES Fuel Cell Technology). The stack model is the 2011 edition of the DEA 1.5-A60-36, and it is composed of 60 cells, each one with active area of 61 cm
. As previously reported, the stack Specific Power is 450 W/kg while the Power Density is 330 W/L [
33].
4.2. Applied Tests
Once the FC and the NTHS are characterized and tuned based on the laboratory tests, it is time to put the system through an applied test. As cited above, this happened during two independent runs in the same circuit of the 2015 SEM competition, with and without the NTHS to highlight its influence. It is worth reminding ourselves that current (red line) and voltage (black line) of the FC, outlet cathode air humidity (cyan line), and three temperatures (brown line) of the FC were acquired by the datalogger system, as follows:
In Run 1, without NTHS, reported in
Figure 11, the current request is about 5 A and it is more or less constant during the entire run. It is possible to note that the voltage begins to decrease after 15 min, and even though the power request (therefore current request) trend is constant, it continues to decrease from 30 V at the start to 24 V at the end of the run.
This voltage drop produces, with constant power request, an increase of the current needed, and therefore an increase of hydrogen consumption with the decrease of global efficiency. This voltage drop can be seen easily in the second graph of
Figure 11 and this effect is due to the decrease of the cell performance during the run. This decrease of performance happens because during the run the water content in the polymeric membranes diminishes. This phenomenon can be seen in the third part of
Figure 11 where it shows the humidity trend of the outlet cathode air stream during the race where at minute 0 there are saturated conditions (
) but this goes down until the end of the run, where it is about
. At the same time, the temperature of the FC increases a lot during the run. In fact, if the temperature at time 0 is equal to the environment condition temperature (20
C) after 39 min, this parameter is over 6
C. This condition, in addition to being able to damage the membranes, promotes the evaporation of water and the drying of the MEA then the decreasing of the outlet cathode air humidity. The two effects are therefore correlated, and they are both mutually cause and effect.
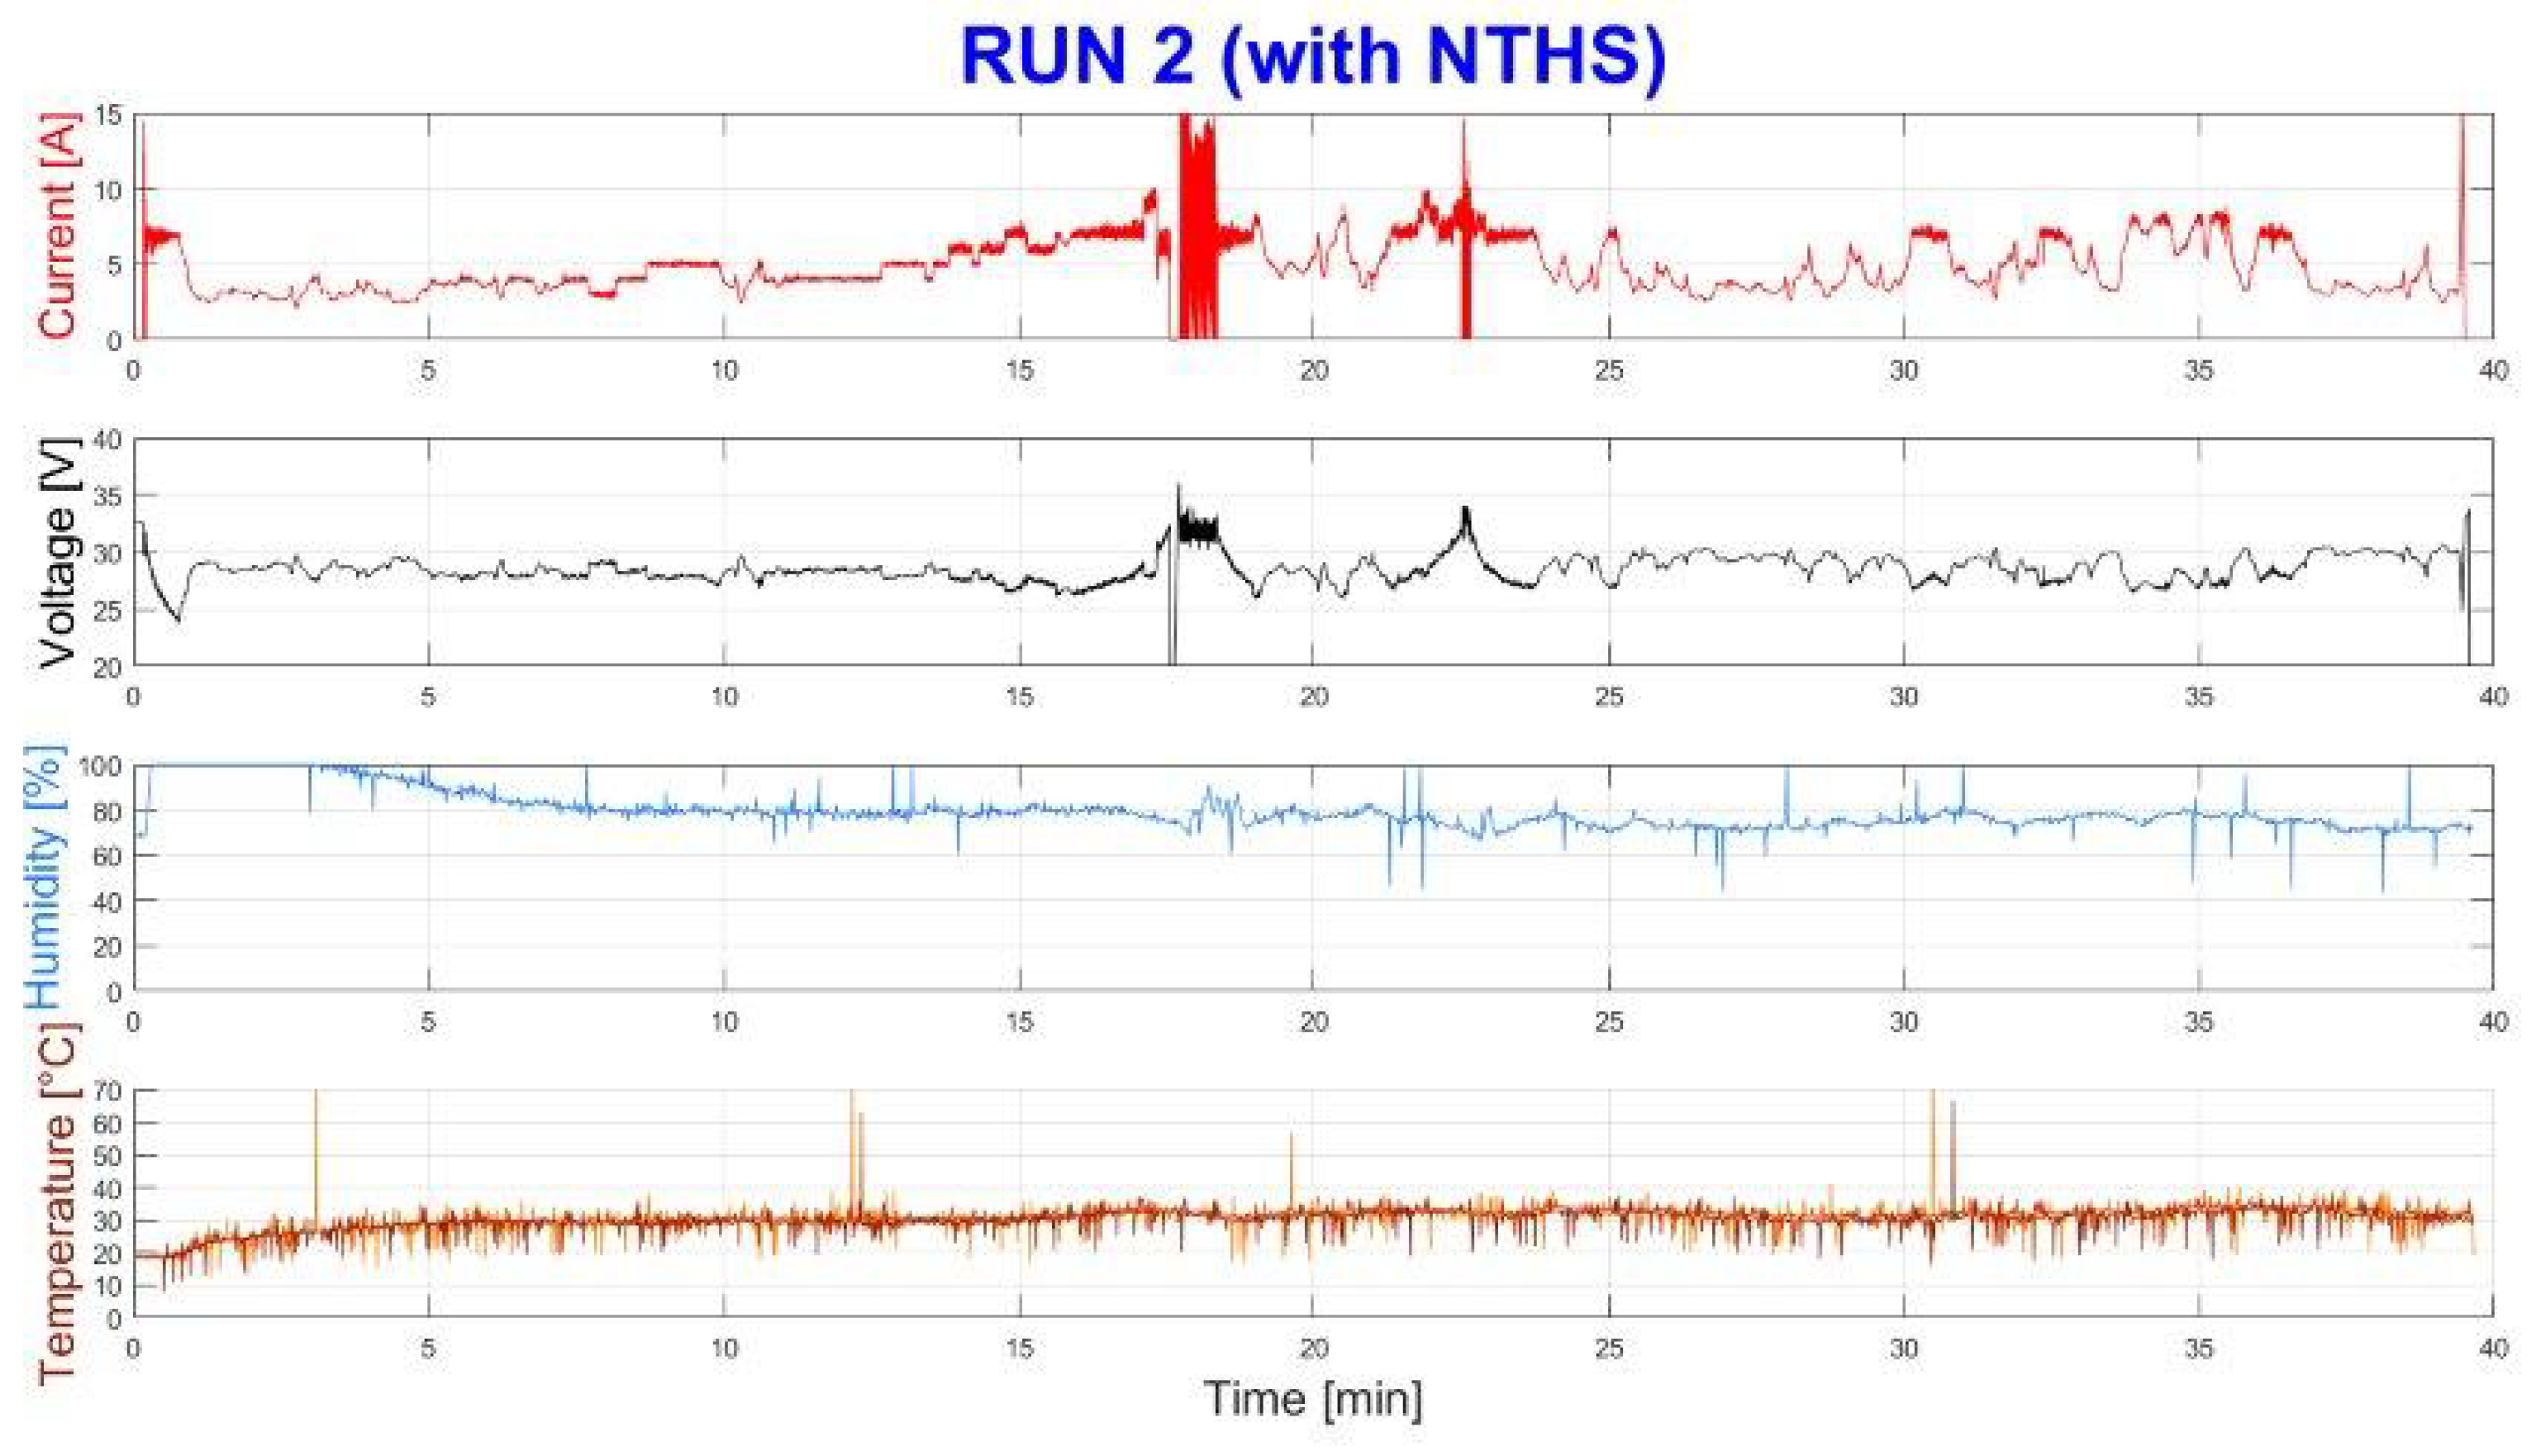
In the same race conditions, Run 2 was made using the NTHS system, and it is possible to see some difference in
Figure 12. The current request is comparable to Run 1. Nevertheless, in Run 2 with NTHS, results were better than Run 1. The temperature, indeed, increased little and remained constant and low (30
C during the entire run) and the humidity, similarly, decreased slightly and was very high (
) for the entire race.
The result was a good proton conduction and then the voltage remained constant for the whole run (while without NTHS the voltage dropped) so the performance increased compared to the system without NTHS. In fact, during Run 2, the voltage at the end of the race was about 30 V, compared to the 24 V in the case of Run 1.
Because the NTHS is a humidification system that must work continuously, in order to consider the aim of this system applied in a PEMFC vehicle prototype that can be used for a long time it is necessary to compare the results in stationary conditions. The voltage considered for the comparison is then the voltage after 39 min, so at the end of the race. In Run 1 the final voltage was
= 24 V, whereas in Run 2 it was
= 30 V. Then it is possible to define a performance improvement factor
with the equation:
IDRA’s electrical motor consumes about 200 W of power in nominal conditions. The power consumption of the FC blowers at 7 A (current request by the electrical motor in nominal conditions) corresponds approximately to 17 W. Taking into account also the cooling fun power consumption, the overall auxiliary power consumption
is equal to 20 W. The auxiliary power efficiency
is defined as the power supply to the motor
over the power produced by the fuel cell
, thus:
Considering the auxiliary used with NTHS (reaction blower, Nafion
® tubing blower and cooling fan) and the auxiliary used without NTHS (reaction blower only) the power increase of the auxiliary is:
The NTHS auxiliary power increase factor is then:
Comparing the performance auxiliary improvement factor with the NTHS auxiliary power increase factor, it was possible to establish that the NTHS gives a good improvement of performance with a small cost in terms of auxiliary power consumption (
Figure 13).
Based on the results of the test, it is possible to say that the benefits of the NTHS include: very high humidification efficiency; negligible power consumption (if compared with the standard humidification systems); no moving parts; real-time parameter control; possibility of regulation in a wide range of conditions; reliable system; self-limiting humidification; compact and robust system; low weight and size.
