Article

Parametric Compact Thermal Models of Power LEDs

1
Department Microelectronics and Computer Science, Lodz University of Technology, Łódź, Wólczańska 221/223, 90-924 Łódź, Poland
2
Department of Marine Electronics, Gdynia Maritime University, Gdynia, Morska 81-87, 81-225 Gdynia, Poland
*
Author to whom correspondence should be addressed.
Energies 2019, 12(9), 1724; https://doi.org/10.3390/en12091724
Submission received: 1 April 2019 / Revised: 26 April 2019 / Accepted: 30 April 2019 / Published: 7 May 2019
(This article belongs to the Special Issue Thermal and Electro-thermal System Simulation)

Abstract

:
Light-emitting diodes are nowadays the most dynamically developing type of light sources. Considering that temperature is the main factor affecting the electrical and lighting parameters of these devices, thermal models are essential subcomponents of the multidomain models commonly used for simulation of their operation. The authors investigated white power light-emitting diodes soldered to Metal Core Printed Circuit Boards (MCPCBs). The tested devices were placed in a light-tight box on a cold plate and their cooling curves were registered for different diode heating current values and various preset cold plate temperatures. These data allowed the computation of optical and real heating power values and consequently the generation of compact thermal models in the form of Foster and Cauer RC ladders. This also rendered possible the analysis of the influence of the considered factors on the compact model element values and their parametrization. The resulting models yield accurate values of diode junction temperature in most realistic operating conditions and they can be easily included in multidomain compact models of power light emitting diodes.

1. Introduction

Power light emitting diodes are nowadays rapidly replacing traditional incandescent bulbs and they are ever more and more frequently being used in numerous lighting applications [1]. From the consumer point of view, the most important parameter describing the performance of LEDs is the emitted optical power. However, its value is a function of many different factors, such as the device operating point or the cooling conditions [2,3,4]. Thus, the analysis of LED operation involves various coupled phenomena of different nature: electrical, optical and thermal. Especially important for the operation of these devices is temperature, which affects all other physical domains. Consequently, the thermal management of LED applications is currently the objective of extensive research [5].
For these reasons, thermal simulations of either individual devices or their luminaries together with cooling assemblies are always carried out during the design phase. These simulations could be performed using software based on some numerical method, such as the finite element one [6,7,8]. Unfortunately, numerical methods require the knowledge of exact structure geometry and material thermal properties, which might not be readily available. Additional problems poses the complexity of structure discretization mesh which could render the simulation time unacceptably long [9].
Thus, when the knowledge of detailed temperature field distribution in space is not required and the main goal of simulations is the determination of device junction temperature, an attractive alternative to detailed 3D thermal models are Compact Thermal Models (CTMs), which typically consist of a very limited number of thermal resistors and capacitors, yet they provide satisfactory simulation accuracy. An additional advantage of CTMs is that, using the electro-thermal analogy, they render possible the execution of multidomain simulations in some ordinary SPICE-like circuit simulators [10,11,12]. Obviously, a standardized form of CTMs are the DELPHI style ones, which are boundary condition independent and do not disclose any proprietary information, but again the data necessary to generate them can be provided only by device manufacturers [13,14].
Another form of CTMs are the RC ladder models which can be obtained directly from system dynamic thermal responses using different model order reduction methods [15,16]. Unfortunately, compared to the DELPHI style models, the ladder ones are not boundary condition independent and they can be employed only in a specific LED operating point and cooling conditions. Hence, the main goal of the research presented in this paper was to develop a methodology for the generation of parametrized ladder models, which could be applied in a wide range of LED operating and cooling conditions. Such thermal networks might be included then in more complex compact multidomain models taking into account also mutual dependencies between multiple LEDs contained in a single luminaire or those capable of determining the heating and optical power for a given operating point and cooling conditions [5,17,18,19]. However, the research on the development of such models for LEDs is still ongoing, e.g. in the frames of the Delphi4LED European project [20].
The following section presents the experimental setup as well as the results of device thermal and optical measurements which allowed the determination of the optical and real heating power. Then, the computed spectra of thermal time constants for the recorded cooling curves are analyzed in order to generate device CTMs in the form of Cauer ladders. Next, parametric expressions for the computation of model element values are proposed. Finally, the cooling curves simulated with these models are compared with the measured ones.

2. Measurement Results

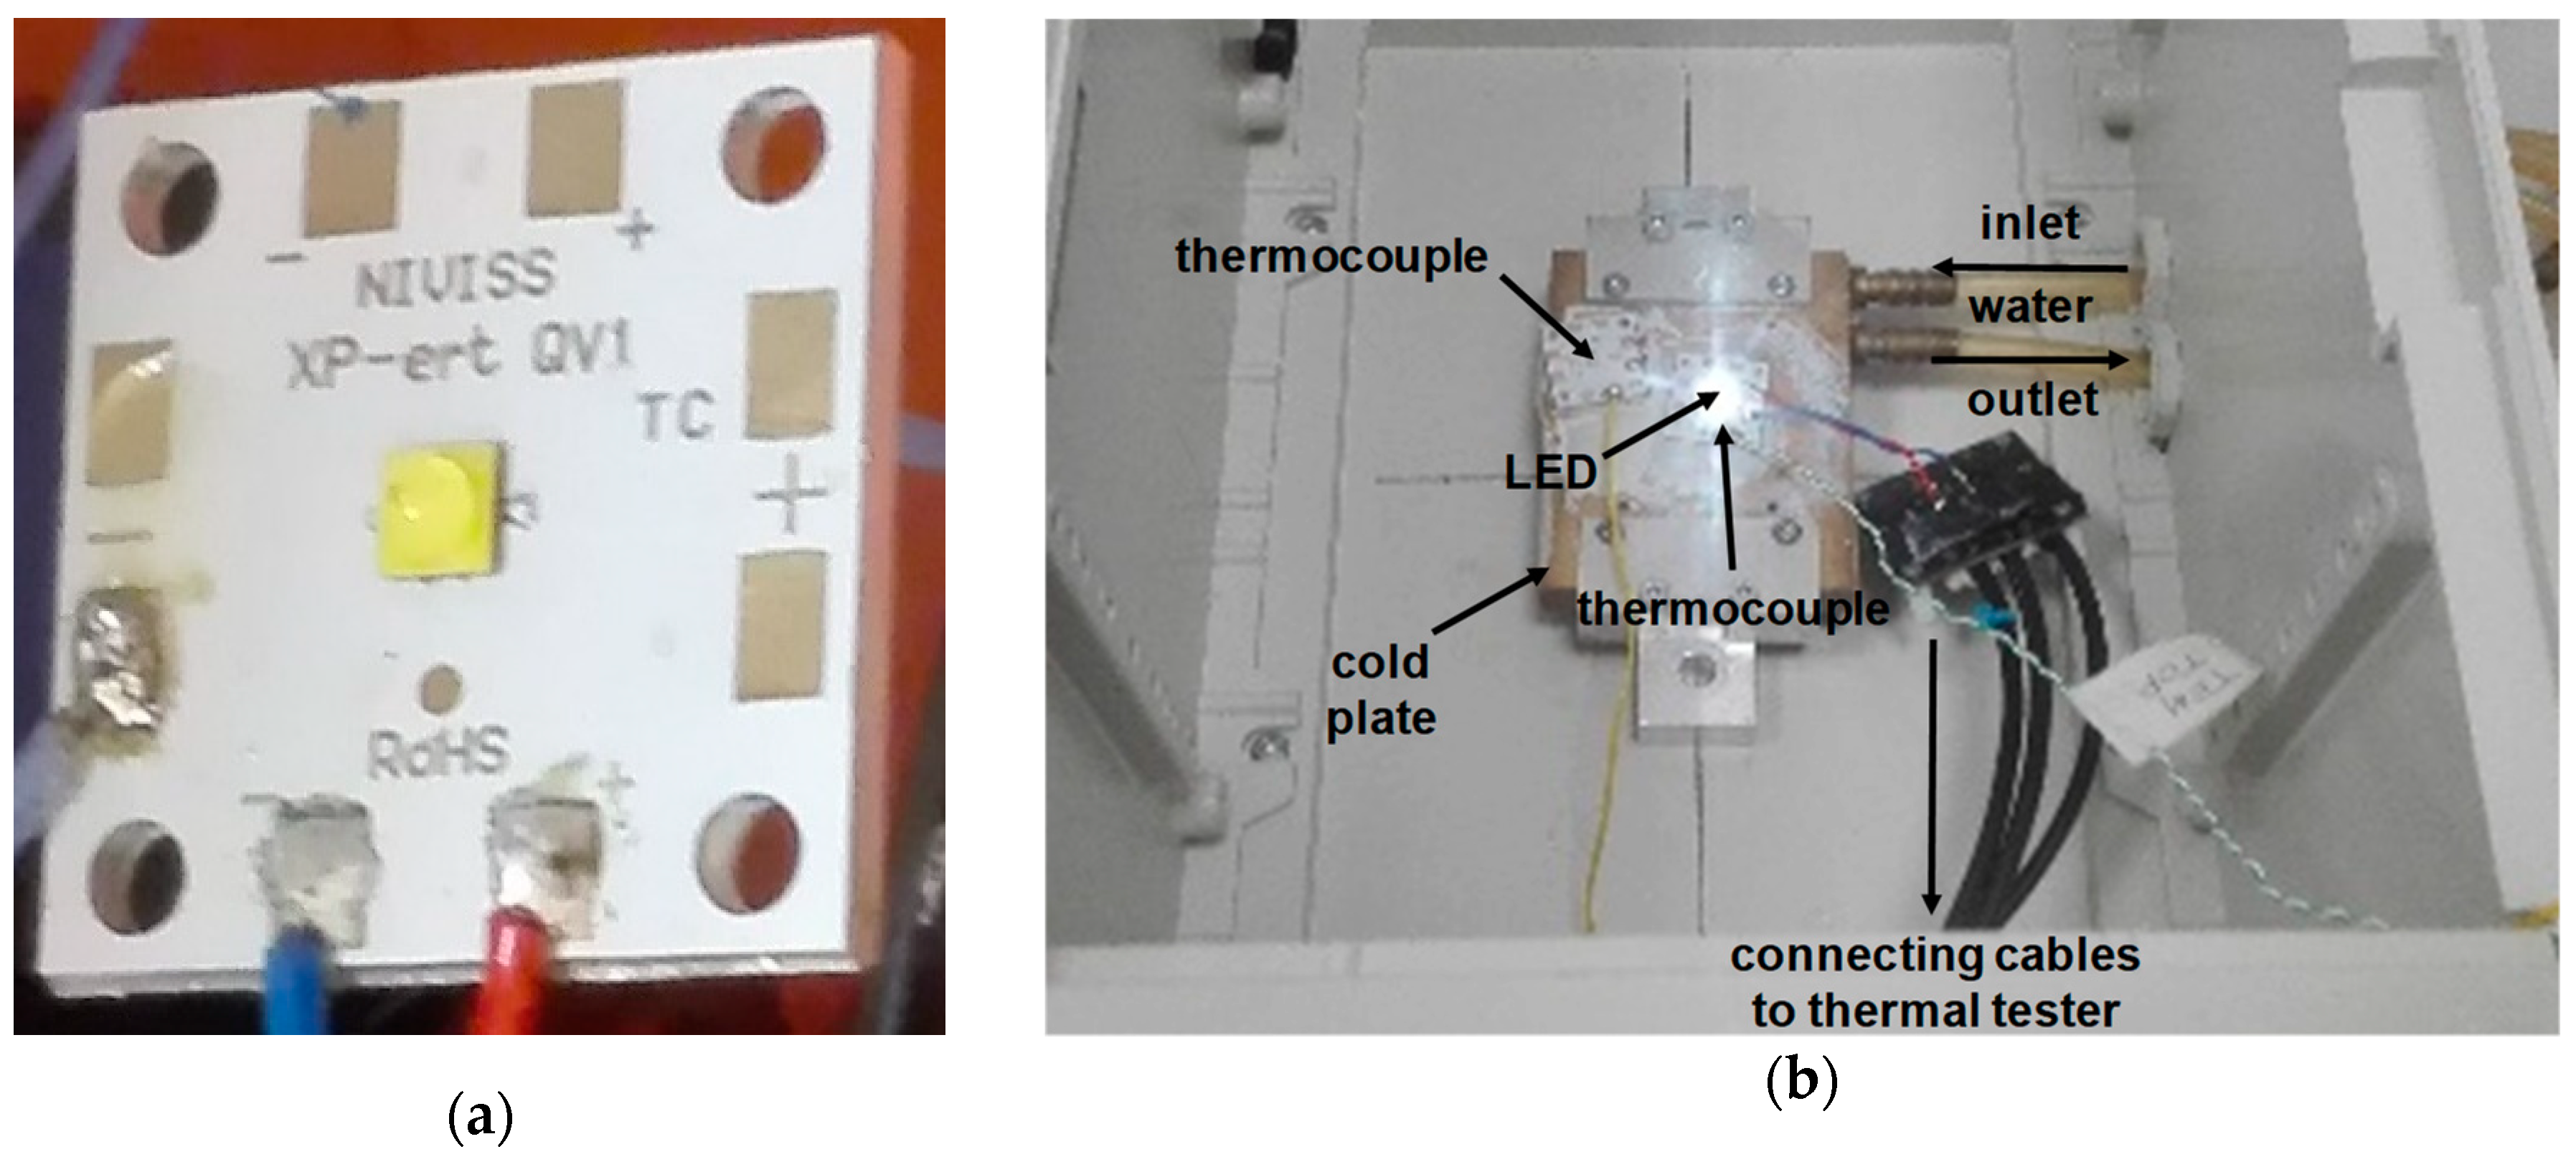
2.1. Measurement Equipment and Experimental Setup

The devices investigated in this paper were commercially available white power LEDs from the XLamp® XP-L family manufactured by the Cree Company (Durham, North Carolina, USA). The diodes were soldered to the MCPCBs made of an aluminum alloy having the dimensions of 2.5 cm × 2.5 cm × 0.2 cm and pictured in Figure 1a. During all measurements the substrates were attached with the application of thermal grease to the 10.0 cm × 8.0 cm × 1.8 cm copper cold plate through which continuous water flow was forced as shown in Figure 1b. The temperature values of the cold plate and the MCPCB were measured by thermocouples whose locations are indicated in the figure. Based on the temperature values provided by the thermocouples the water temperature was automatically adjusted to maintain the preset cold plate temperature. The LED, which is lit-on in the figure, was positioned on the cold plate at the bottom of the box exactly in its middle.
Initially, the investigated LEDs were calibrated on a cold plate for the forward current of 10 mA. The measured voltage drop across the diode junction decreased linearly with temperature at the rate of –1.34 mV/K. During the actual measurements, first the diode was heated with a preset current value until the thermal steady state was reached. Then, the power was switched off and the device cooling curves were measured by forcing the constant current value for which the diodes were previously calibrated. Each time the heating and cooling phases lasted 30 s. All measurements were taken with the thermal transient tester T3Ster®, manufactured by Mentor Graphics (Wilsonville, OR USA), which renders possible the recording of thermal responses with a microsecond resolution. Besides, this equipment provides also an entire range of software thermal analysis tools used extensively later on in this paper.
The electrical power supplied to LED terminals is the sum of the emitted optical radiant power and the real heating power. The ratio of the optical power to the electrical one, expressed in percent, is known as the radiant efficiency. Consequently, the measurement of the optical power is required in order to carry out any thermal analysis because it allows also the determination of the real heating power, which should be used as an input quantity for an LED thermal model [21].
The JEDEC standard recommends that the value of this power should be found by performing the measurements of the total emitted radiant flux in an integrating sphere [22]. However, in this paper the optical power was computed based on the irradiance value measured with the Delta OHM HD2302 photoradiometer (Caselle di Selvazzano, Italy), which was placed in the lid of the light-tight box directly over the diode at the distance of 17 cm. This distance, which is 50 times greater than the size of the LED, is large enough so as to consider the diode as a point light source for geometrical analyses. Then, the optical power emitted by the diode was evaluated, as outlined in [23], using the radiation spatial distribution chart provided in the datasheet by the LED manufacturer.

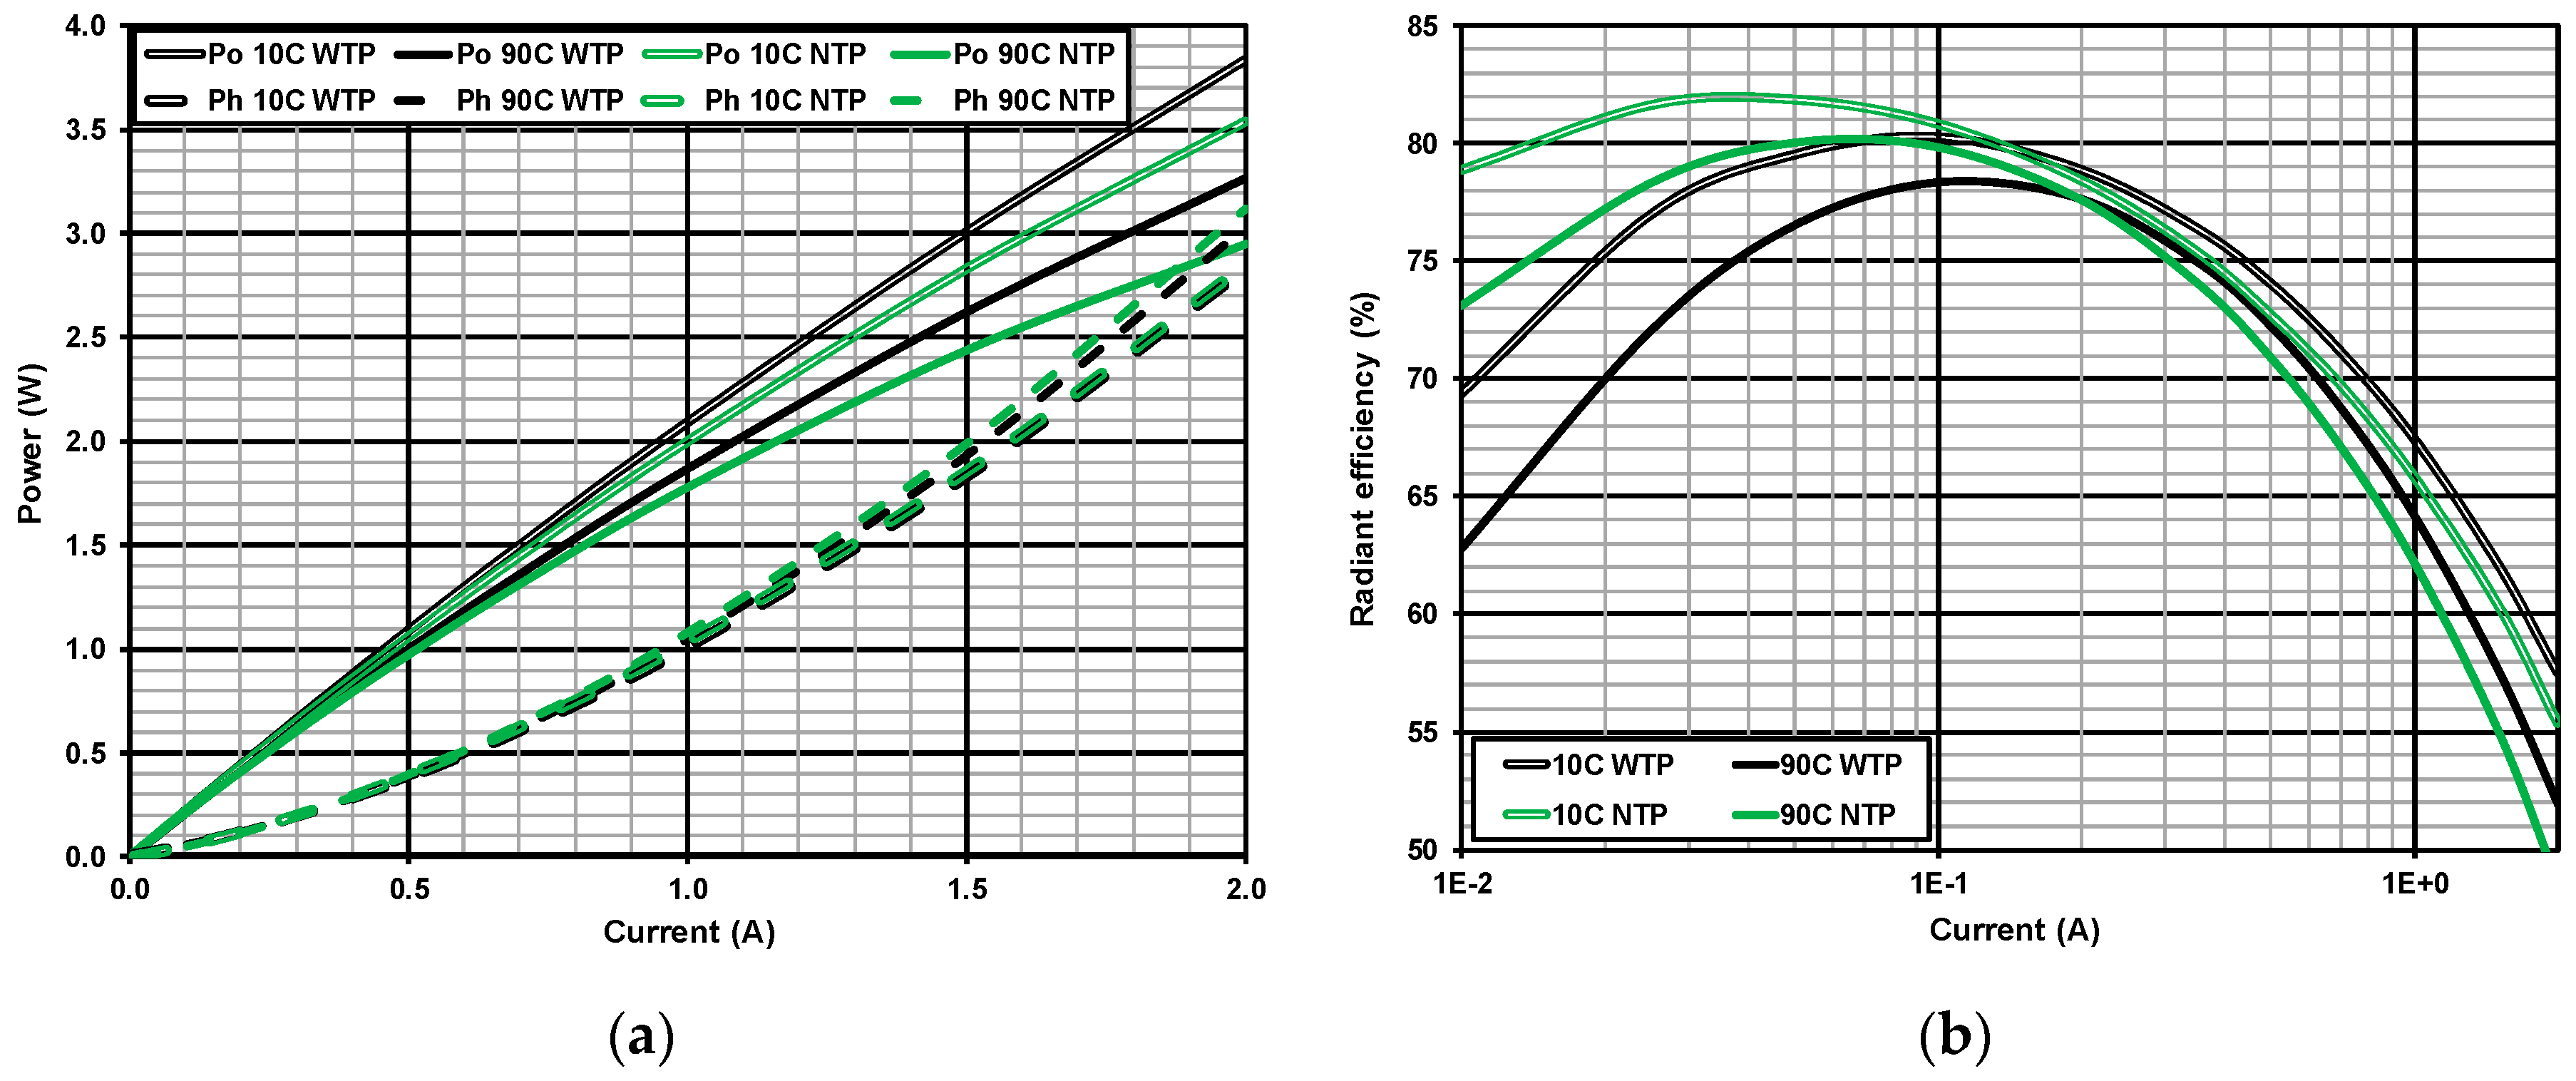
2.2. Results of Electrical Measurements

The diode thermal responses were recorded for 8 different forward current values ranging from 0.1 A to 2.0 A and 9 preset cold plate temperature varying between 10ºC and 90ºC with the step of 10ºC. Each time the measurements were repeated with the LED thermal pad not soldered and then again with the pad properly soldered. This procedure is similar to the dual interface measurement method suggested for the identification of the junction-to-case thermal resistance in the JEDEC standard [24]. Altogether, 144 diode cooling curves were measured. Selected measurement results, shown in Figure 2, are represented as the diode heating curves, which were obtained by subtracting the measured values from the respective steady state values.
This approach is correct if material thermal properties can be considered temperature independent, what was justified here taking into account that the junction temperature rise values were relatively small because of the forced water cooling. Figure 2 presents the curves recorded for the LED heating current of 1.5 A and the cold plate temperature maintained at 10 °C and 90 °C, whereas Figure 2b shows the curves registered for the current values of 0.7 A and 1.5 A when the cold plate temperature was maintained at 50 °C. The black lines represent the measurement results obtained with the thermal pad soldered (WTP) and the lighter ones when the thermal pad was not soldered (NTP). The double lines refer either to lower current or temperature values. The curves, as can be seen in the charts, are only moderately affected by the cold plate temperature and the junction steady state temperature rise value increases with temperature by less than 10%. On the other hand, the soldering of the thermal pad reduces effectively the temperature rise value by approximately 40%, but any effect is visible only after some 0.5 s.

2.3. Optical Measurements

The optical (Po) and real heating (Ph) power values as well as the radiant efficiency computed for the two limit temperature values using the earlier described methodology are shown in Figure 3. The optical power is plotted in Figure 3a using the solid lines, whereas the dashed ones represent the heating power. Similarly as previously, the cases when the thermal pad is not soldered are denoted by the double lines. The heating power, as can be seen, is fairly independent from temperature, but its value increases rapidly for high current values, reaching even 2 W. On the other hand, the increase of the optical power is less important for high diode currents and its value is visibly affected both by the cold plate temperature and the device soldering manner. For the heating current of 2.0 A, the optical power is reduced by 15% because of the higher cold temperature and another 10% when the thermal pad is not soldered. Therefore, the radiant efficiency curves plotted in Figure 3b have their distinct maxima, which correspond to the LED forward current values ranging from 40 mA to 120 mA. Both the proper soldering of the thermal pad and the increase of cold plate temperature shift the maxima towards higher current values and reduce the efficiency.

3. Thermal Modeling and Simulations

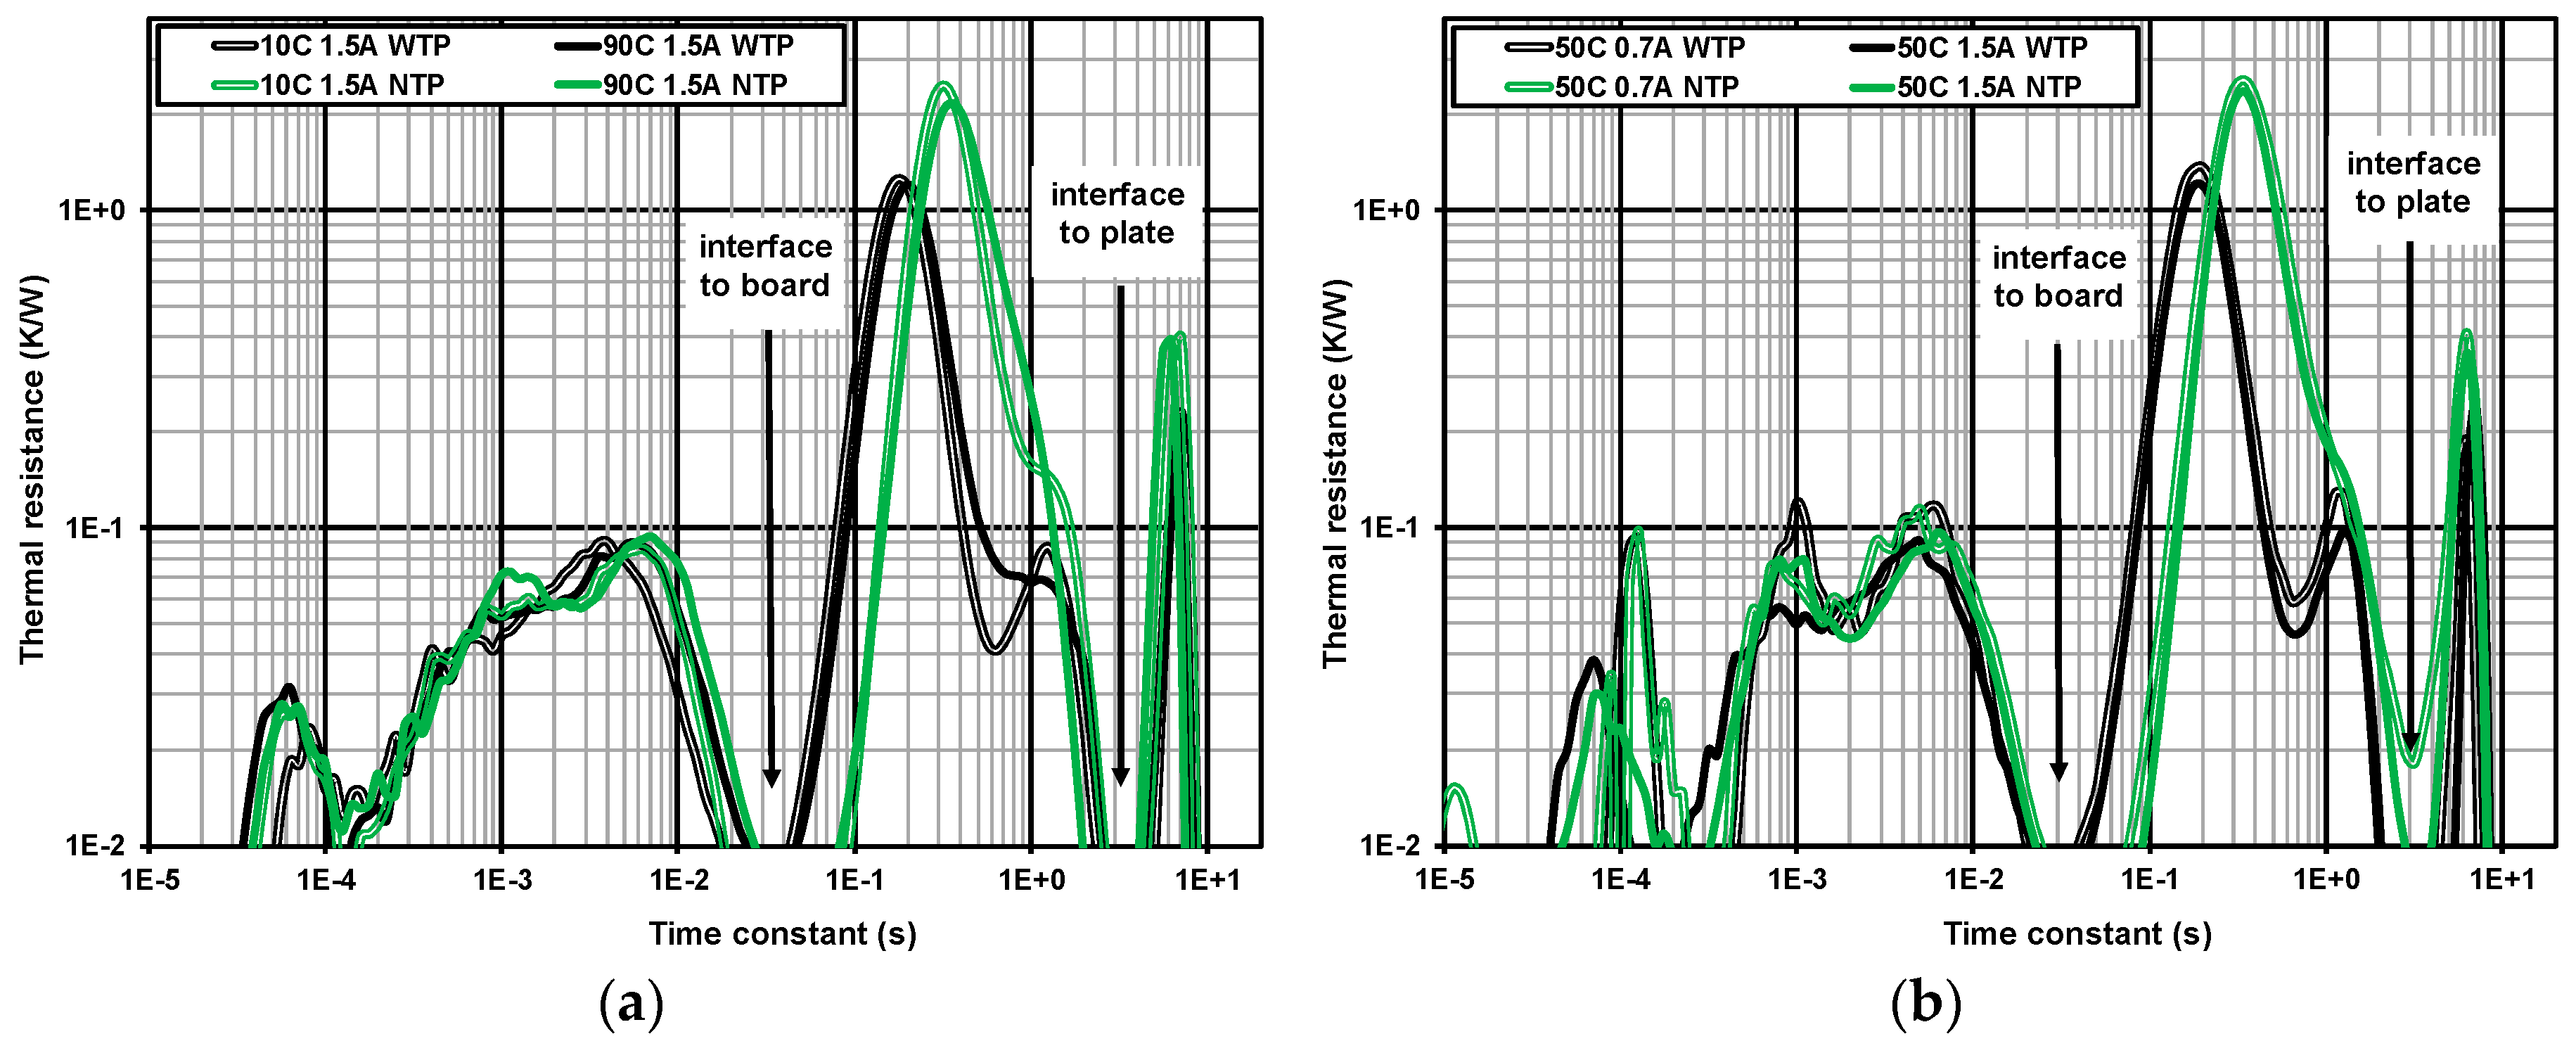
3.1. Time Constant Spectra

The measurements of the optical power emitted by the investigated device, as stated previously, allowed the computation of the heating power and the application of the Network Identification by Deconvolution (NID) thermal analysis method. According to this method, the device responses to power step excitations, sampled at time instants equidistant on the logarithmic time scale, are numerically differentiated and then the frequency spectra of thermal time constants contained in the responses can be computed by performing the numerical deconvolution [25]. The spectra obtained for the previously presented heating curves using the software implementing the NID method and provided together with the thermal tester are shown in Figure 4.
According to the theory, the minima in the spectra indicate the locations where heat diffuses into another material. Here, there are two distinct minima located around 30 ms and 3 s, which are marked in the charts by arrows. These minima, as discussed in [26], correspond to the time instants when heat diffuses from the LED package to the MCPCB and then to the cold plate. Consequently, the thermal resistance of the leftmost section characterizes the heat flow from the junction through the package. The middle part of the spectra corresponds to the interface with the MCPCB. Therefore, leaving the thermal pad unsoldered visibly increases the magnitude of these peaks and shifts them to the right, hence delaying thermal responses. Finally, the rightmost tiny peaks reflect the heat exchange with the cold plate.

3.2. Compact Thermal Models

The division of the time constant spectra into individual sections in the locations of the minima indicated in Figure 4 leads directly to the three-stage compact models in the form of the Foster RC ladder, pictured in Figure 5a. In this circuit the real heating power dissipated in the junction (the current source) flows through three consecutive RC stages towards the ambient (the thermal ground). The time constants of these three stages are equal to the products of the respective thermal resistances and capacitances. The currents represent the heat flow and the voltages correspond to the temperature rise over the ambient.
The division of the spectra directly determined the resistor values of the Foster RC ladder. Then, the thermal time constant values were found employing the built-in Matlab® Levenberg-Marquardt constrained optimization routine [27]. The optimal time constant values within each of the allowable ranges, delimited by the earlier discussed minima located at some 30 ms and 3 s, were computed by minimizing the error between simulations and measurements. Finally, the thermal capacitor values were found by dividing the respective time constant and resistor values.
Unfortunately, the element values of CTMs in the form of Foster RC ladders cannot have any physical interpretation since capacitors form a direct path from the junction to the ambient. Hence, heat dissipated in the source can be instantaneously sensed as a non-zero heat flux (capacitor current) virtually at any location in this thermal network, thus implying the infinite speed of heat diffusion. A physically correct CTM can be obtained by converting the Foster RC ladder into the mathematically equivalent Cauer RC network shown in Figure 5b. The element values of this model could already have physical interpretation since all the capacitors are connected to the thermal ground. Consequently, heat does not reach remote locations of the network until the thermal capacitors are charged, so the speed of heat diffusion is limited. This conversion can be carried out by executing the continued fraction algorithm, which for a low number of RC components is numerically stable [28].

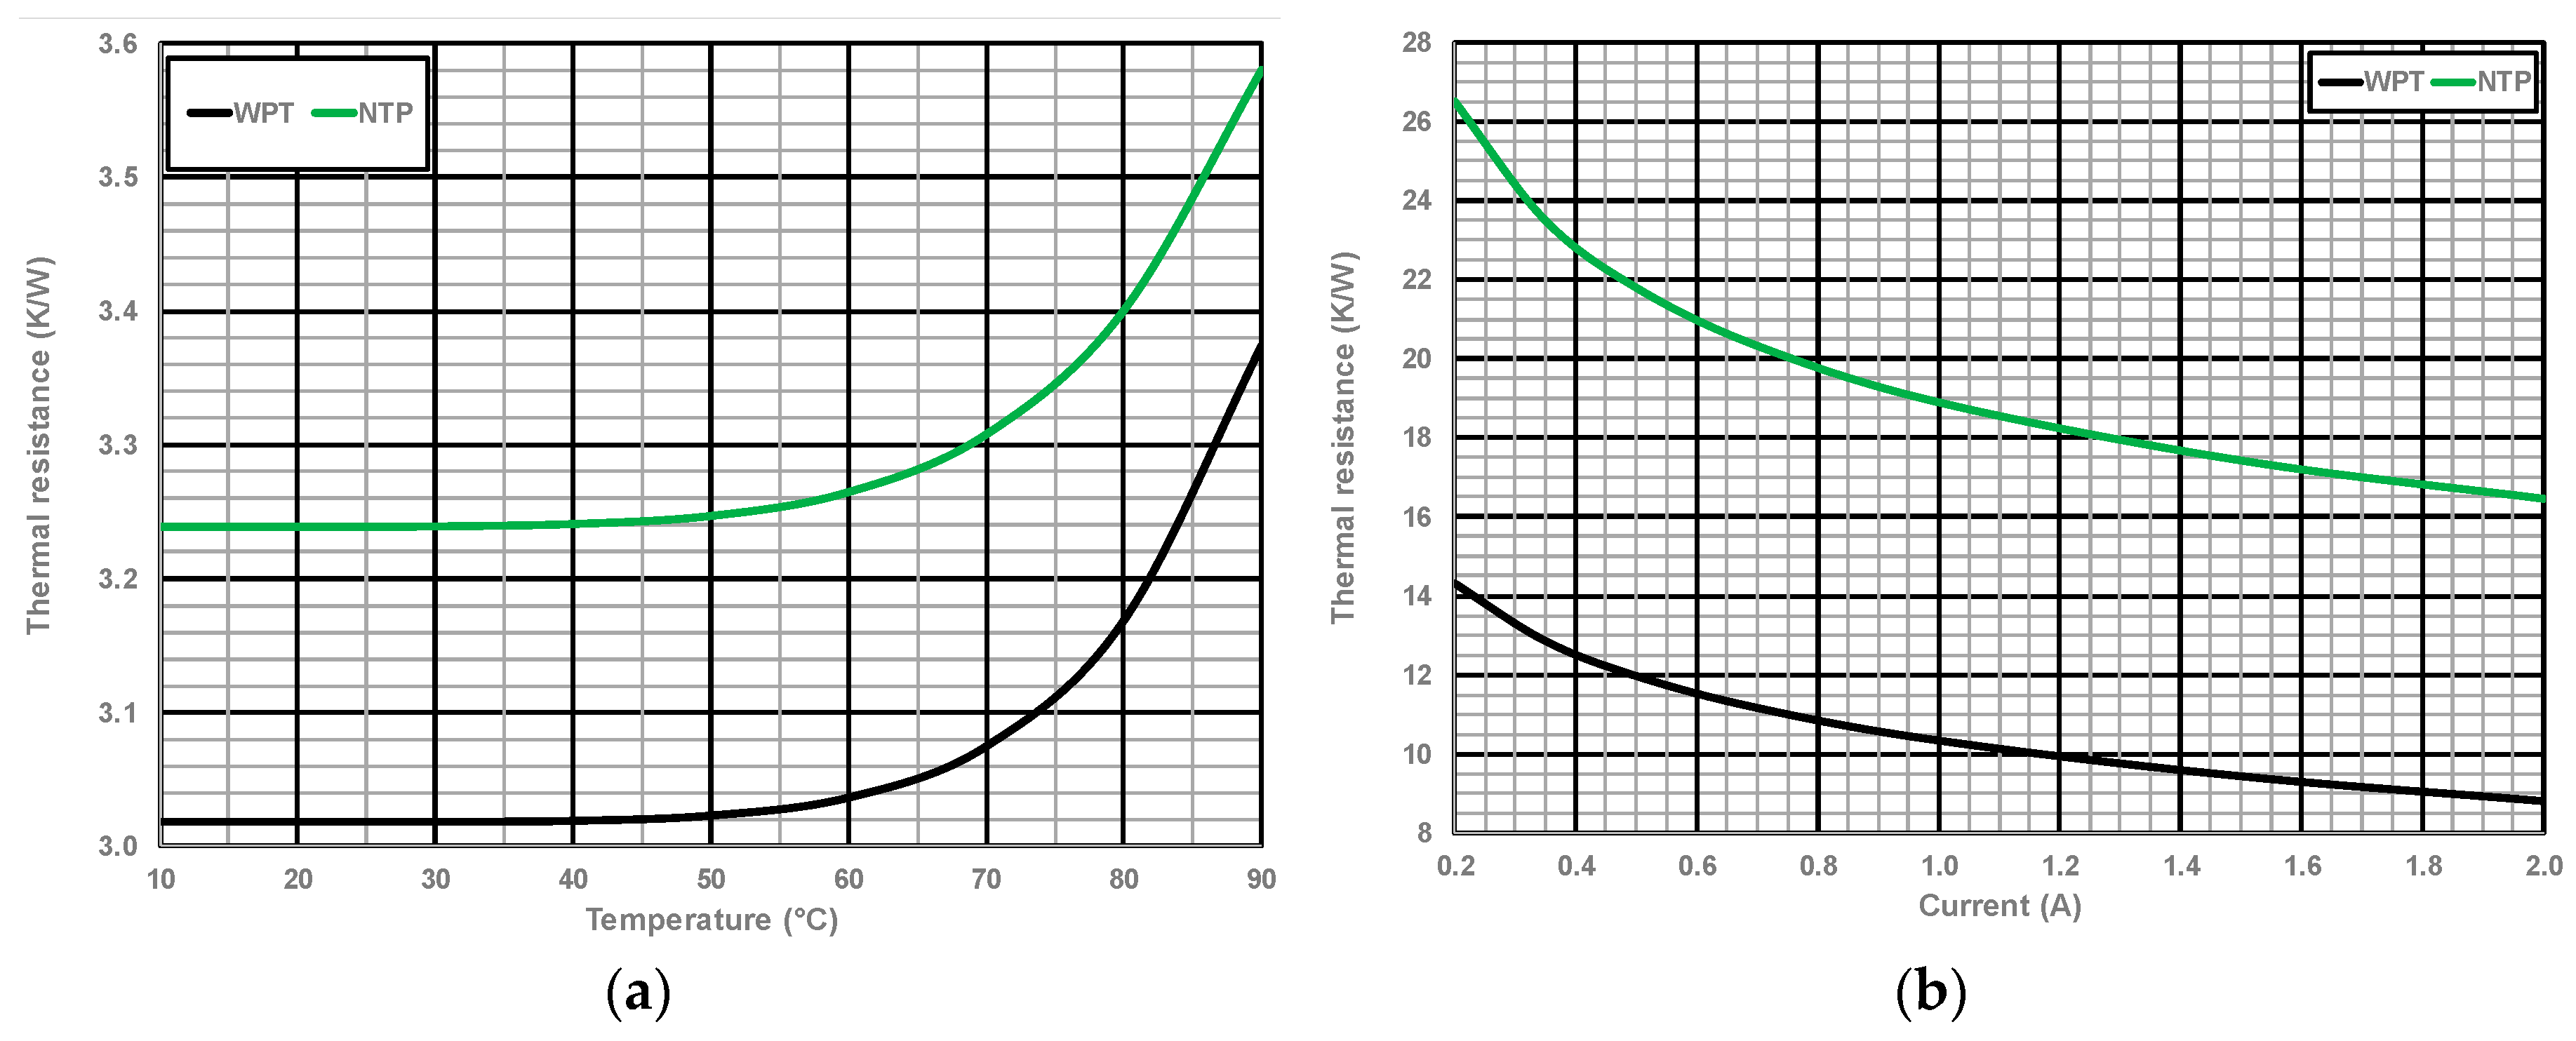
3.3. Parametric Model

The Cauer RC ladder CTMs generated for different heating current and cold plate temperature values were analyzed so as to identify the influence of these factors on the CTM element values. The results showed that only the resistances R1, R2 and the capacitance C2 vary noticeably, but unlike in the case discussed in [29], they depend only on one of the considered factors at a time. Thus, it was possible to use the following simple parametric formulas to compute model element values:
Y (X) = a × Xb + c,
where Y is either a resistor or capacitor value and X is a heating current or cold plate temperature value. The values of coefficients a, b, c were determined again using the built-in Matlab® optimization routines (The MathWorks, Natick, Massachusetts USA).
The final expressions obtained for the computation of the parametrized RC Cauer ladder CTM element values are provided in Table 1 and Table 2, separately for each manner of diode soldering considered here. The current should be expressed here in amperes and the temperature in degrees Celsius. Moreover, the variable resistor values computed with the models are plotted in Figure 6 and the variable capacitance in Figure 7a. As can be seen in the tables, it was assumed that the value of resistor R1 depends on temperature and the values of the elements in the middle RC stage depend on the current. In all the considered cases very high values of the determination coefficient R2 were attained what proves a reasonable goodness of fit.
Analyzing the thermal resistances, the resistor R1, which corresponds to the standard junction-to-case resistance, has a fairly constant value up to the cold plate temperature of 50 °C. Then this value gradually increases, by approximately 10% at 90 °C. Referring to the value of 2.2 K/W given in the datasheet as the typical junction to the solder point resistance, the value of slightly more than 3.0 K/W seems very realistic, since the manufacturer did not specify any measurement conditions or the type of thermal model applied. The resistance values in the case when the thermal pad is not soldered are always by some 0.2 K/W higher, what is justified by the fact that in this case the heat diffusion to the MCPB is impeded and the resistance increases.
The value of the resistor R2, which represents the resistance of the interface between the package and the MCPCB, decreases significantly with the current and falls in the range from 8.8 to 14.2 K/W in the case when the thermal pad is soldered. In the other case this value is much higher, and ranges from 16.5 to 26.5 K/W, what demonstrates the importance of the proper use of the thermal pad. Owing to the forced water cooling, the value of the resistor R3 is the smallest one and it is equal to 0.48 K/W in the first case or 0.95 K/W in the latter one. This discrepancy will be discussed later on during the analysis of capacitance values.
Looking now at the capacitances, the capacitor C1 values, though constant, differ significantly for the two considered soldering cases and amount to 1.4 mJ/K and 2.0 mJ/K. This time again it can be explained by the fact that generated heat, when it is not properly sunk into the substrate spreads throughout a relatively larger volume of the package, hence the capacitance value of the heated volume is higher. The modeled value of capacitance C2, plotted in Figure 7a, slightly increases with current and at the value of 2.0 A is equal to some 20 mJ/K and 40 mJ/K. This time again the higher capacitance value for the case when the thermal pad is not soldered can be explained by the existence of a poor thermal contact, which is characterized also by a higher capacitance. Finally, the values of the capacitance C3 differ significantly, similarly as the ones for the resistor R3, however it should be pointed that they both correspond to virtually the same thermal time constant value of around 7 s. Looking at Figure 4, one can notice that the black peaks, which correspond to the thermal pad soldered, are indeed visibly lower, so probably this difference results from the identification errors introduced by the NID method which has a limited resolution.

3.4. Thermal Simulations

Considering that the detailed thermal model of the LED was not available, the parametric CTMs were validated by simulating the diode heating curves and comparing them with the measured ones. The resulting curves are plotted in Figure 7b for the two extreme cold plate temperature values and the heating currents of 0.5 A and 2.0 A. This time the measured curves are represented with black lines the simulated ones with lighter lines. Unlike in Figure 2, the double logarithmic scale was used in order to assess better the simulation errors for short heating times. As can be seen, the simulated curves follow accurately the measured ones at all the time instants over 1 ms. This relatively simple CTM provided in all cases an excellent accuracy with simulation errors remaining under 3% of the steady state temperature rise.
Undoubtedly, the simulation accuracy for short time instants could be improved by the addition of the fourth RC stage inserted next to the LED junction and corresponding to the peaks located to the left of the tiny minima at around 0.1±0.2 ms visible in Figure 4, which probably could be attributed to the die attach. However, taking into account that the details of the internal package structure are unknown, this stage was not included in the present model because it would increase greatly the computational effort of parametrization.

4. Conclusions

This paper demonstrated, based on a practical example, that with the proper determination of the real heating power and the division of thermal time constant spectra in the locations of their minima it is possible to obtain compact thermal models in the form of Cauer ladders with physically meaningful element values. Furthermore, it was shown that in the case of LEDs repeating the thermal measurements with the thermal pad soldered and left unsoldered might constitute an interesting alternative to the dual interface measurement method suggested in the JEDEC standard [24], where the thermal contact resistance with the heat sink is changed by applying thermal grease or loosening the attaching screw.
Moreover, extending the research presented by the authors in [26], the parametric relations describing the dependence of thermal resistances and capacitances on device operating current and temperature were proposed for the computation of CTM element values. The diode heating curves simulated with these parametric models showed very good agreement with the experimental results. Such models could become then thermal components of larger multidomain LED compact models coupling electrical, thermal and optical phenomena.
The parametrization of ladder CTMs rendered such models more versatile because now they could be used in different ambient conditions, similarly as the Delphi-style boundary condition independent models. Furthermore, the generation of such models does not require any proprietary information from a manufacturer because it is carried out based only on the knowledge of measured dynamic thermal responses. Finally, considering that the ladder thermal model components have physical meaning, i.e., they correspond to the semiconductor die, the package or the heat sink, the change of a certain component requires the replacement of only one RC stage in the model without the necessity to regenerate the entire model.

Author Contributions

The measurements presented in this manuscript and their evaluation was carried out by T.T. and P.P. The research on the generation of compact thermal models and their parametrization was done by A.S. and T.R. Finally, M.J. and K.G. supervised the research and prepared the manuscript.

Funding

This research was founded from the Polish Ministry of Science and Higher Education programme "Regional Excellence Initiative" 2019-2022 project No. 006/RID/2018/19, the sum of financing 11 870 000 PLN.

Conflicts of Interest

The authors declare no conflict of interest.

References

  1. Weir, B. Driving the 21st century’s lights. IEEE Spectr. 2012, 49, 42–47. [Google Scholar] [CrossRef]
  2. Schubert, E.F. Light Emitting Diodes, 3rd ed.; Rensselaer Polytechnic Institute: Troy, NY, USA, 2018. [Google Scholar]
  3. Biber, C. LED Light Emission as A Function of Thermal Conditions. In Proceedings of the 24th IEEE Semiconductor Thermal Measurement and Management Symposium, San Jose, CA, USA, 16–20 March 2008; pp. 180–184. [Google Scholar] [CrossRef]
  4. Górecki, K.; Ptak, P.; Janicki, M.; Torzewicz, T. Influence of Cooling Conditions of Power LEDs on Their Electrical, Thermal and Optical Parameters. In Proceedings of the 25th International Conference Mixed Design of Integrated Circuits and Systems, Gdynia, Poland, 21–23 June 2018; pp. 237–242. [Google Scholar]
  5. Lasance, C.J.M.; Poppe, A. (Eds.) Thermal Management for LED Applications; Springer: Dordrecht, Holland, 2014. [Google Scholar]
  6. Bender, V.C.; Iaronka, O.; Marchesan, T.B. Study on The Thermal Performance of LED Luminaire using Finite Element Method. In Proceedings of the 39th Annual Conference of the IEEE Industrial Electronics Society IECON, Vienna, Austria, 10–13 November 2013; pp. 6099–6104. [Google Scholar] [CrossRef]
  7. Leng, L.S.; Retnasamy, V.; Sauli, Z.; Vairavan, R.; Shahimin, M.M.; Ong, N.R.; Kirtsaeng, S. Finite Element Modelling of Thermal Performance of LED Lamp using Open Source Software - Salome and Elmer. In Proceedings of the IEEE Symposium on Computer Applications & Industrial Electronics ISCAIE, Langkawi, Malaysia, 24–25 April 2017; pp. 65–68. [Google Scholar] [CrossRef]
  8. Lee, H.E.; Lee, D.; Lee, T.I.; Shin, J.H.; Choi, G.M.; Kim, C.; Lee, S.H.; Lee, J.H.; Kim, Y.H.; Kang, S.M.; et al. Wireless powered wearable micro light-emitting diodes. Nano Energy 2019, 55, 454–462. [Google Scholar] [CrossRef]
  9. Tandon, S.; Liu, E.; Zahner, T.; Besold, S.; Kalb, W.; Elger, G. Transient Thermal Simulation of High Power LEDs and Its Challenges. In Proceedings of the 18th International Conference on Thermal, Mechanical and Multi-Physics Simulation and Experiments in Microelectronics and Microsystems, Dresden, Germany, 3–5 April 2017; pp. 45–52. [Google Scholar] [CrossRef]
  10. Sabry, M.N. Compact thermal models for electronic systems. IEEE Trans. Compon. Packag. 2003, 26, 179–185. [Google Scholar] [CrossRef]
  11. Mawby, P.A.; Igic, P.M.; Towers, M.S. Physically based compact device models for circuit modelling applications. Microelectr. J. 2001, 32, 433–447. [Google Scholar] [CrossRef]
  12. Menozzi, R.; Cova, P.; Delmonte, N.; Giuliani, F.; Sozzi, G. Thermal and electrothermal modeling of components and systems: Review of the research at the University of Parma. Facta Univ. Ser.: Electron. Energetics 2015, 28, 325–344. [Google Scholar] [CrossRef]
  13. Lasance, C.J.M. Ten years of BCI compact thermal modeling of electronic parts: Review. Heat Transf. Eng. 2008, 29, 149–168. [Google Scholar] [CrossRef]
  14. Standard JESD15-4. DELPHI Compact Thermal Model Guideline; JEDEC: Arlington, VA, USA, 2008. [Google Scholar]
  15. Sofia, J.W. Analysis of thermal transient data with synthesized dynamic models for semiconductor devices. IEEE Trans. Compon. Packag. A 1995, 18, 39–47. [Google Scholar] [CrossRef]
  16. Masana, F.N. A new approach to the dynamic thermal modelling of semiconductor packages. Microelectron. Reliab. 2001, 41, 901–912. [Google Scholar] [CrossRef]
  17. Górecki, K. Modelling mutual thermal interactions between power LEDs in SPICE. Microelectron. Reliab. 2015, 55, 389–395. [Google Scholar] [CrossRef]
  18. Górecki, K.; Ptak, P. Modelling mutual thermal coupling in LED modules. Microelectron. Int. 2015, 32, 152–157. [Google Scholar] [CrossRef]
  19. Górecki, K.; Ptak, P. Modeling LED lamps in SPICE with thermal phenomena taken into account. Microelectron. Reliab. 2017, 79, 440–447. [Google Scholar] [CrossRef]
  20. Poppe, A. Simulation of LED based luminaires by using multi-domain compact models of LEDs and compact thermal models of their thermal environment. Microelectron. Reliab. 2017, 72, 65–74. [Google Scholar] [CrossRef]
  21. Standard JESD51-51. Implementation of the Electrical Test Method for the Measurement of Real Thermal Resistance and Impedance of Light-Emitting Diodes with Exposed Cooling Surface; JEDEC: Arlington, VA, USA, 2012. [Google Scholar]
  22. Standard JESD51-52. Guidelines for Combining CIE 127-2007 Total Flux Measurement with Thermal Measurement of LED with Exposed Cooling Surface; JEDEC: Arlington, VA, USA, 2012. [Google Scholar]
  23. Górecki, K.; Ptak, P. Simple Method of Measuring Photometric and Radiometry Parameters of Power LEDs. In Proceedings of the 2018 Baltic URSI Symposium (URSI), Poznan, Poland, 15–17 May 2018; pp. 121–124. [Google Scholar] [CrossRef]
  24. Standard JESD51-14. Transient Dual Interface Test Method for The Measurement of The Thermal Resistance Junction-to-Case of Semiconductor Devices with Heat Flow through A Single Path; JEDEC: Arlington, VA, USA, 2010. [Google Scholar]
  25. Szekely, V. A new evaluation method of thermal transient measurement results. Microelectr. J. 1997, 28, 277–292. [Google Scholar] [CrossRef]
  26. Janicki, M.; Torzewicz, T.; Samson, A.; Raszkowski, T.; Napieralski, A. Experimental identification of LED compact thermal model element values. Microelectron. Reliab. 2018, 86, 20–26. [Google Scholar] [CrossRef]
  27. Marquardt, D. Algorithm for least-squares estimation of non-linear parameters. SIAM J. Appl. Math. 1963, 11, 431–441. [Google Scholar] [CrossRef]
  28. Gerstenmaier, Y.C.; Kiffe, W.; Wachutka, G. Combination of Thermal Subsystem Modeled by Rapid Circuit Transformation. In Proceedings of the 13th International Workshop on Thermal Investigation of ICs and Systems, Budapest, Hungary, 17–19 September 2007; pp. 115–120. [Google Scholar] [CrossRef]
  29. Torzewicz, T.; Ptak, P.; Samson, A.; Raszkowski, T.; Janicki, M.; Górecki, K. Parametric Compact Thermal Modeling of Power LEDs. In Proceedings of the 18th Intersociety Conference on Thermal and Thermo-mechanical Phenomena in Electronic Systems, Las Vegas, NV, USA, 28–31 May 2019. in press. [Google Scholar]
Figure 1. Photos of the experimental setup: (a) the investigated LED soldered to the MCPCB; (b) the MCPCB placed on a cold plate inside the light tight box.
Energies 12 01724 g001
Figure 2. Recorded LED heating curves: (a) results for heating current of 1500 mA and cold plate temperature values 10 °C and 90 °C; (b) results for heating currents of 700 mA and1500 mA for cold plate temperature 50 °C.
Energies 12 01724 g002
Figure 3. Measured LED power and radiant efficiency for cold plate temperature values of 10 °C and 90 °C: (a) heating and optical power; (b) radiant efficiency.
Energies 12 01724 g003
Figure 4. Computed thermal time constant spectra: (a) results for heating current of 1500 mA and cold plate temperature values 10 °C and 90 °C; (b) results for heating currents of 700 mA and1500 mA for cold plate temperature 50 °C.
Energies 12 01724 g004
Figure 5. RC ladder compact thermal models: (a) Foster ladder; (b) Cauer ladder.
Energies 12 01724 g005
Figure 6. Modeling and simulation with Cauer RC ladder: (a) modeled values of the junction to solder point thermal resistance R1; (b) modeled values of the solder point to cold plate thermal resistance R2.
Energies 12 01724 g006
Figure 7. Modeling and simulation with Cauer RC ladder: (a) modeled values of the capacitance C2; (b) comparison of measured and simulated LED heating curves.
Energies 12 01724 g007
Table 1. Element values of the parametrized Cauer CTM for LED with the thermal pad soldered.
Thermal Resistances R (K/W)Thermal Capacitances C (J/K)
R 1 = 1.757 × 10 15 · T 7.321 + 3.018 C1 = 0.00144
R 2 = 23.3277 · I 0.0976 12.9997 C 2 = 0.005074 · I 0.6914 + 0.01149
R3 = 0.48C3 = 14.71
Table 2. Element values of the parametrized Cauer CTM for LED with the thermal not connected.
Thermal Resistances R (K/W)Thermal Capacitances C (J/K)
R 1 = 1.252 × 10 13 · T 6.361 + 3.239 C1 = 0.002
R 2 = 15.12 · I 0.2534 + 3.786 C 2 = 0.2071 · I 0.01749 + 0.223
R3 = 0.95C3 = 7.07

