Article

Extraction of Boundary Condition Independent Dynamic Compact Thermal Models of LEDs—A Delphi4LED Methodology

Mentor–A Siemens Business, 81 Bridge Rd, Molesey, East Molesey KT8 9HH, UK
Energies 2019, 12(9), 1628; https://doi.org/10.3390/en12091628
Submission received: 28 March 2019 / Revised: 15 April 2019 / Accepted: 23 April 2019 / Published: 29 April 2019
(This article belongs to the Special Issue Thermal and Electro-thermal System Simulation)

Abstract

:
Multi-domain electro-thermal-optical models of LEDs are required so that their thermal and optical behavior may be predicted during a luminaire design process. Today, no standardized approach exists for the extraction of such models. Therefore, models are not readily provided by LED suppliers to end-users. This results in designers of LED-based luminaires wasting time on LED characterization and ad hoc model extraction themselves. The Delphi4LED project aims to address these deficiencies by identifying standardizable methodologies to extract both electro-optical and thermal compact models of LEDs that together can be used in a multi-domain simulation context. This article describes a methodology to extract compact thermal models of LEDs that are dynamic, in that they accommodate transient thermal effects, and are boundary condition-independent, in that their accuracy is independent of their thermal operating environment. Such models are achieved by first proposing an equivalent thermal nodal network topology. The thermal resistances and capacitances of that network are identified by means of optimization so that the transient thermal response of the network matches that of either an equivalent calibrated 3D thermal model or a transient thermal measurement of a physical sample. The accuracy of the thermal network is then verified by comparing the thermal compact model with a 3D detailed model, which predicts thermal responses within a 3D system-level model.

1. Introduction

The DELPHI project (Development of Libraries of Physical models for an Integrated design environment) was a European community-funded 3-year research program that ran from 1993 to 1996. It was instrumental in both coining the term ‘compact thermal model’ (CTM) and elaborating a methodology to extract such models to accurately represent packaged integrated circuits thermally, regardless of the thermal operating environment in which they operated [1,2,3]. A follow-up project, SEED (Supplier Evaluation and Exploitation of DELPHI), saw an evaluation of the DELPHI methodology by component suppliers [4]. A final project, PROFIT (Prediction of Temperature Gradients Influencing the Quality of Electronic Products), extended the DELPHI methodology to the transient domain [5]. Compact thermal models need to satisfy thermal predictive accuracy requirements, as well as obfuscate any IP regarding their construction, materials and processes used in their manufacture. The abstracting of the complex conductive 3D heat flow paths within an IC package into an equivalent thermal network implicitly achieves the obfuscation of the IP but presents challenges in terms of retaining predictive accuracy. The DELPHI model extraction methodology addresses accuracy by seeking to guarantee that the CTM is accurate in a range of operating environments, specifically with differing peripheral heat transfer coefficients that the IC package might experience in operation. In this, the DELPHI project was successful, and it is an extension of this methodology to represent LEDs that forms the basis of this study. Standardized via JEDEC JESD15-4, the use of so-called DELPHI models has become commonplace when applying thermal simulation in the design of electronic products or products that contain electronics.
The rapid adoption of LEDs by the lighting industry has resulted in a coming-together of the longtime established lighting world and the relatively new semiconductor world. With this comes the need for the lighting industry to adopt processes and technologies that have evolved with the use of semiconductors, e.g., power and digital electronic applications. This adoption requires an understanding of the thermal behavior of semiconductors through the modeling of that behavior and thus the extraction of representative thermal models.
Whereas DELPHI models rely solely on the input of a power dissipation and provide operating junction temperature as an output, thermal models of LEDs cannot be considered from a purely thermal perspective. There is a coupling between the optical, electrical and thermal behavior of an LED to the extent where a model needs to represent all three ‘physics.’ The Delphi4LED project has proposed [4,5] that this multi-domain model be considered in two parts: an opto-electro model that is simulated in conjunction with a thermal model (Figure 1).
The opto-electro model requires forward current and operating chip junction temperature as input and provides power dissipation, voltage drop, emitted optical energy and luminous flux as output. The thermal model requires power dissipation and an ambient temperature as input and provides operating junction temperature (and potentially other temperature points, such as solder temperature) as output. These two models are to be solved in a co-simulation framework until such time as their results converge.
The extraction of the opto-electro model can be achieved via parameter fitting directly from the measurement data [6,7,8]. The method to extract the thermal model is described in this article.

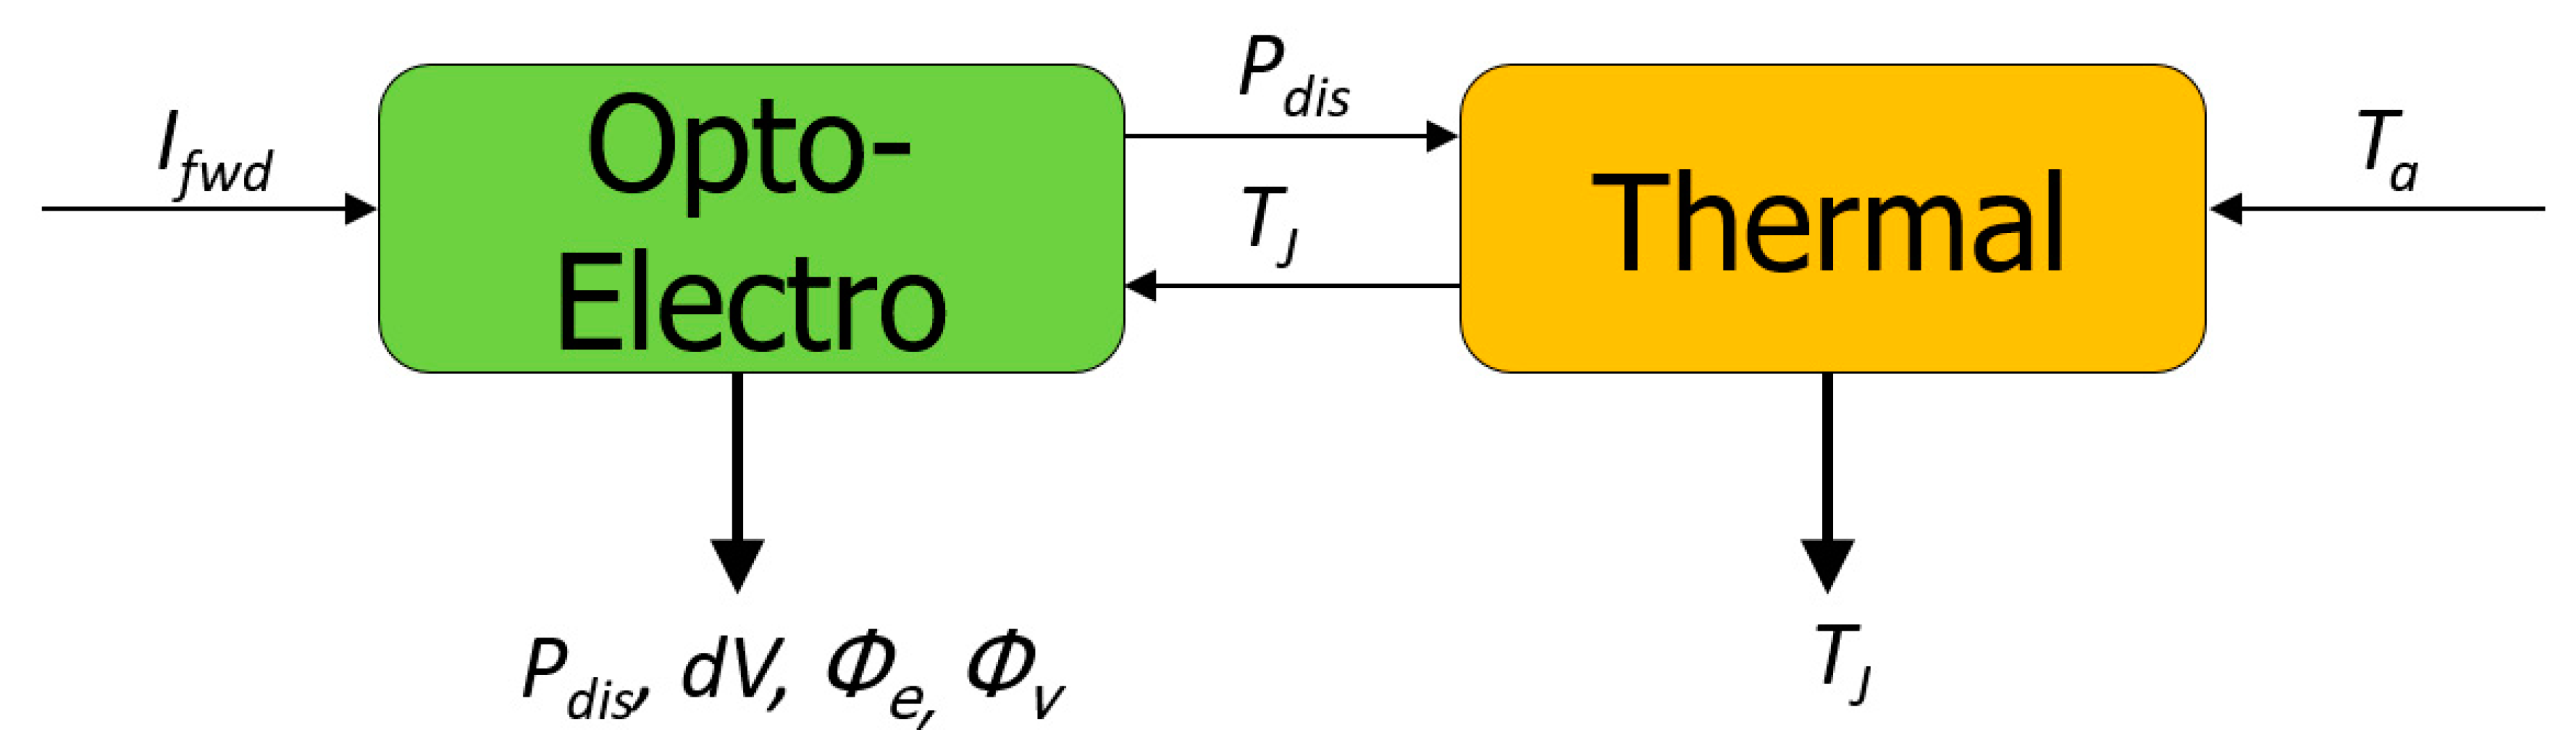
2. Materials and Methods

The DELPHI methodology can be described by the following steps:
  • Perform thermal measurements of an IC package.
  • Calibrate a ‘detailed’ 3D thermal model of the IC package so that it replicates the measurements.
  • Simulate the detailed model in several different expected thermal operating environments (peripheral heat transfer coefficient boundary conditions) and note the resulting junction temperatures and surface heat fluxes.
  • Propose a CTM nodal network topology with assumed inter-node thermal resistance values.
  • Define an objective cost function that quantifies the difference between detailed model and compact model predicted junction temperatures and surface heat fluxes.
  • Optimize the CTM thermal resistance values until such time as the objective cost function has been minimized for all heat transfer coefficient conditions.
  • Quantify the accuracy of the CTM by validation.
The Delphi4LED methodology is based on the DELPHI methodology but extended in the following ways:
  • To accommodate transient effects by the inclusion of thermal capacitances in the CTM network.
  • To allow for the possibility of multiple heat sources due to additional phosphor conversion and optical reflection losses.
  • To consider an objective cost function that quantifies the difference in transient Zth thermal response curves (responses to a step change in power dissipation).
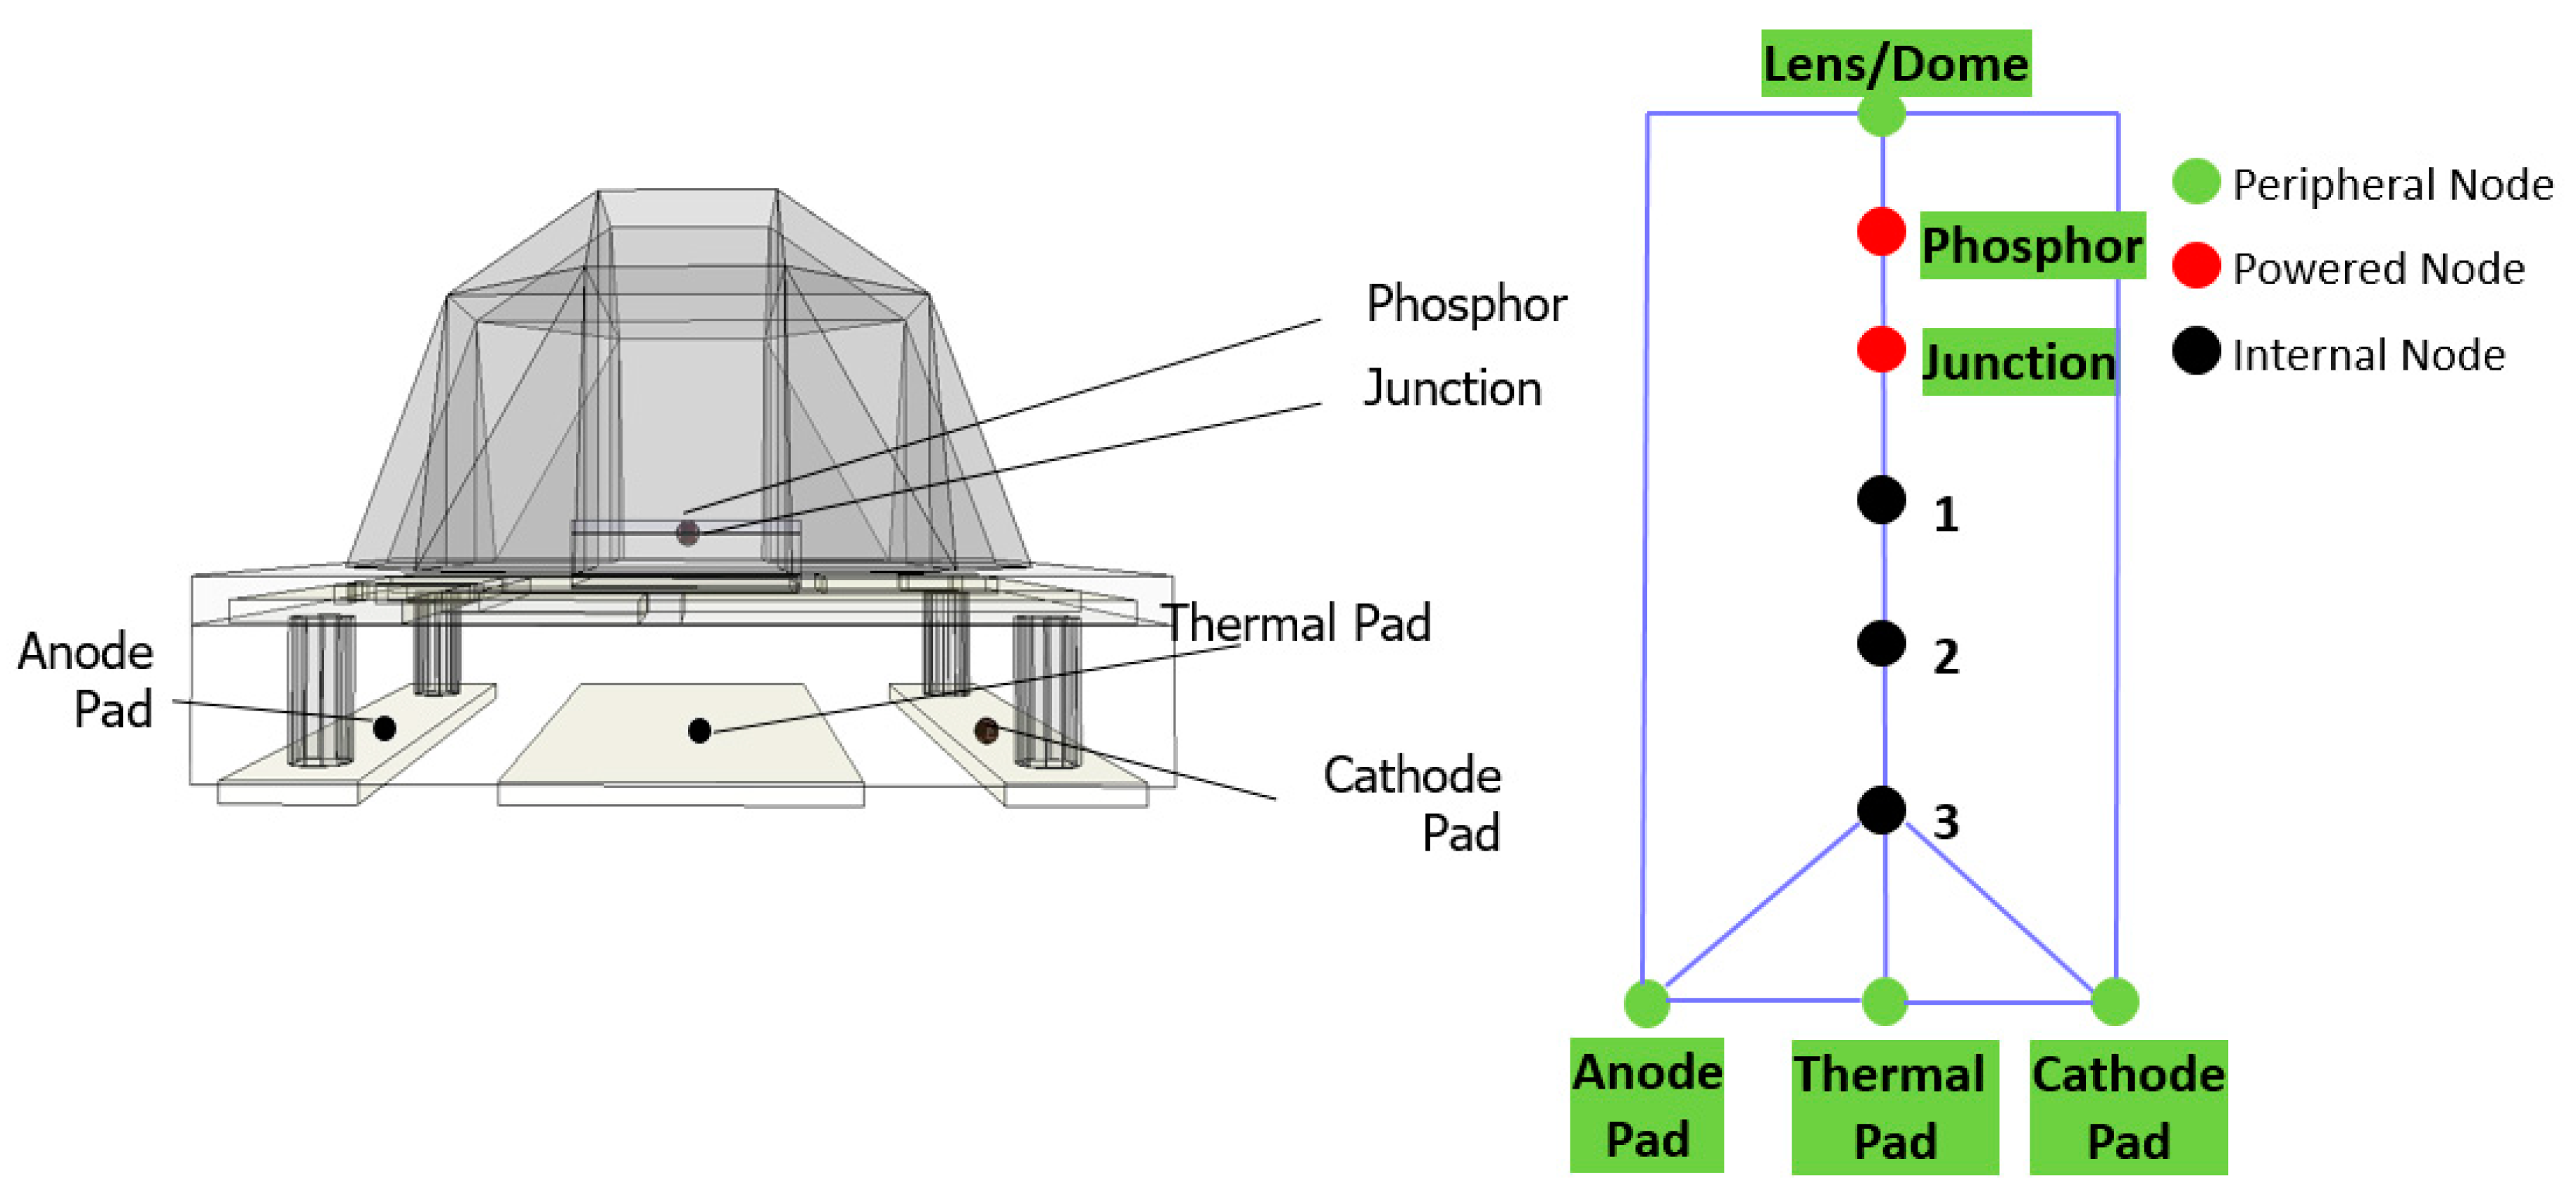
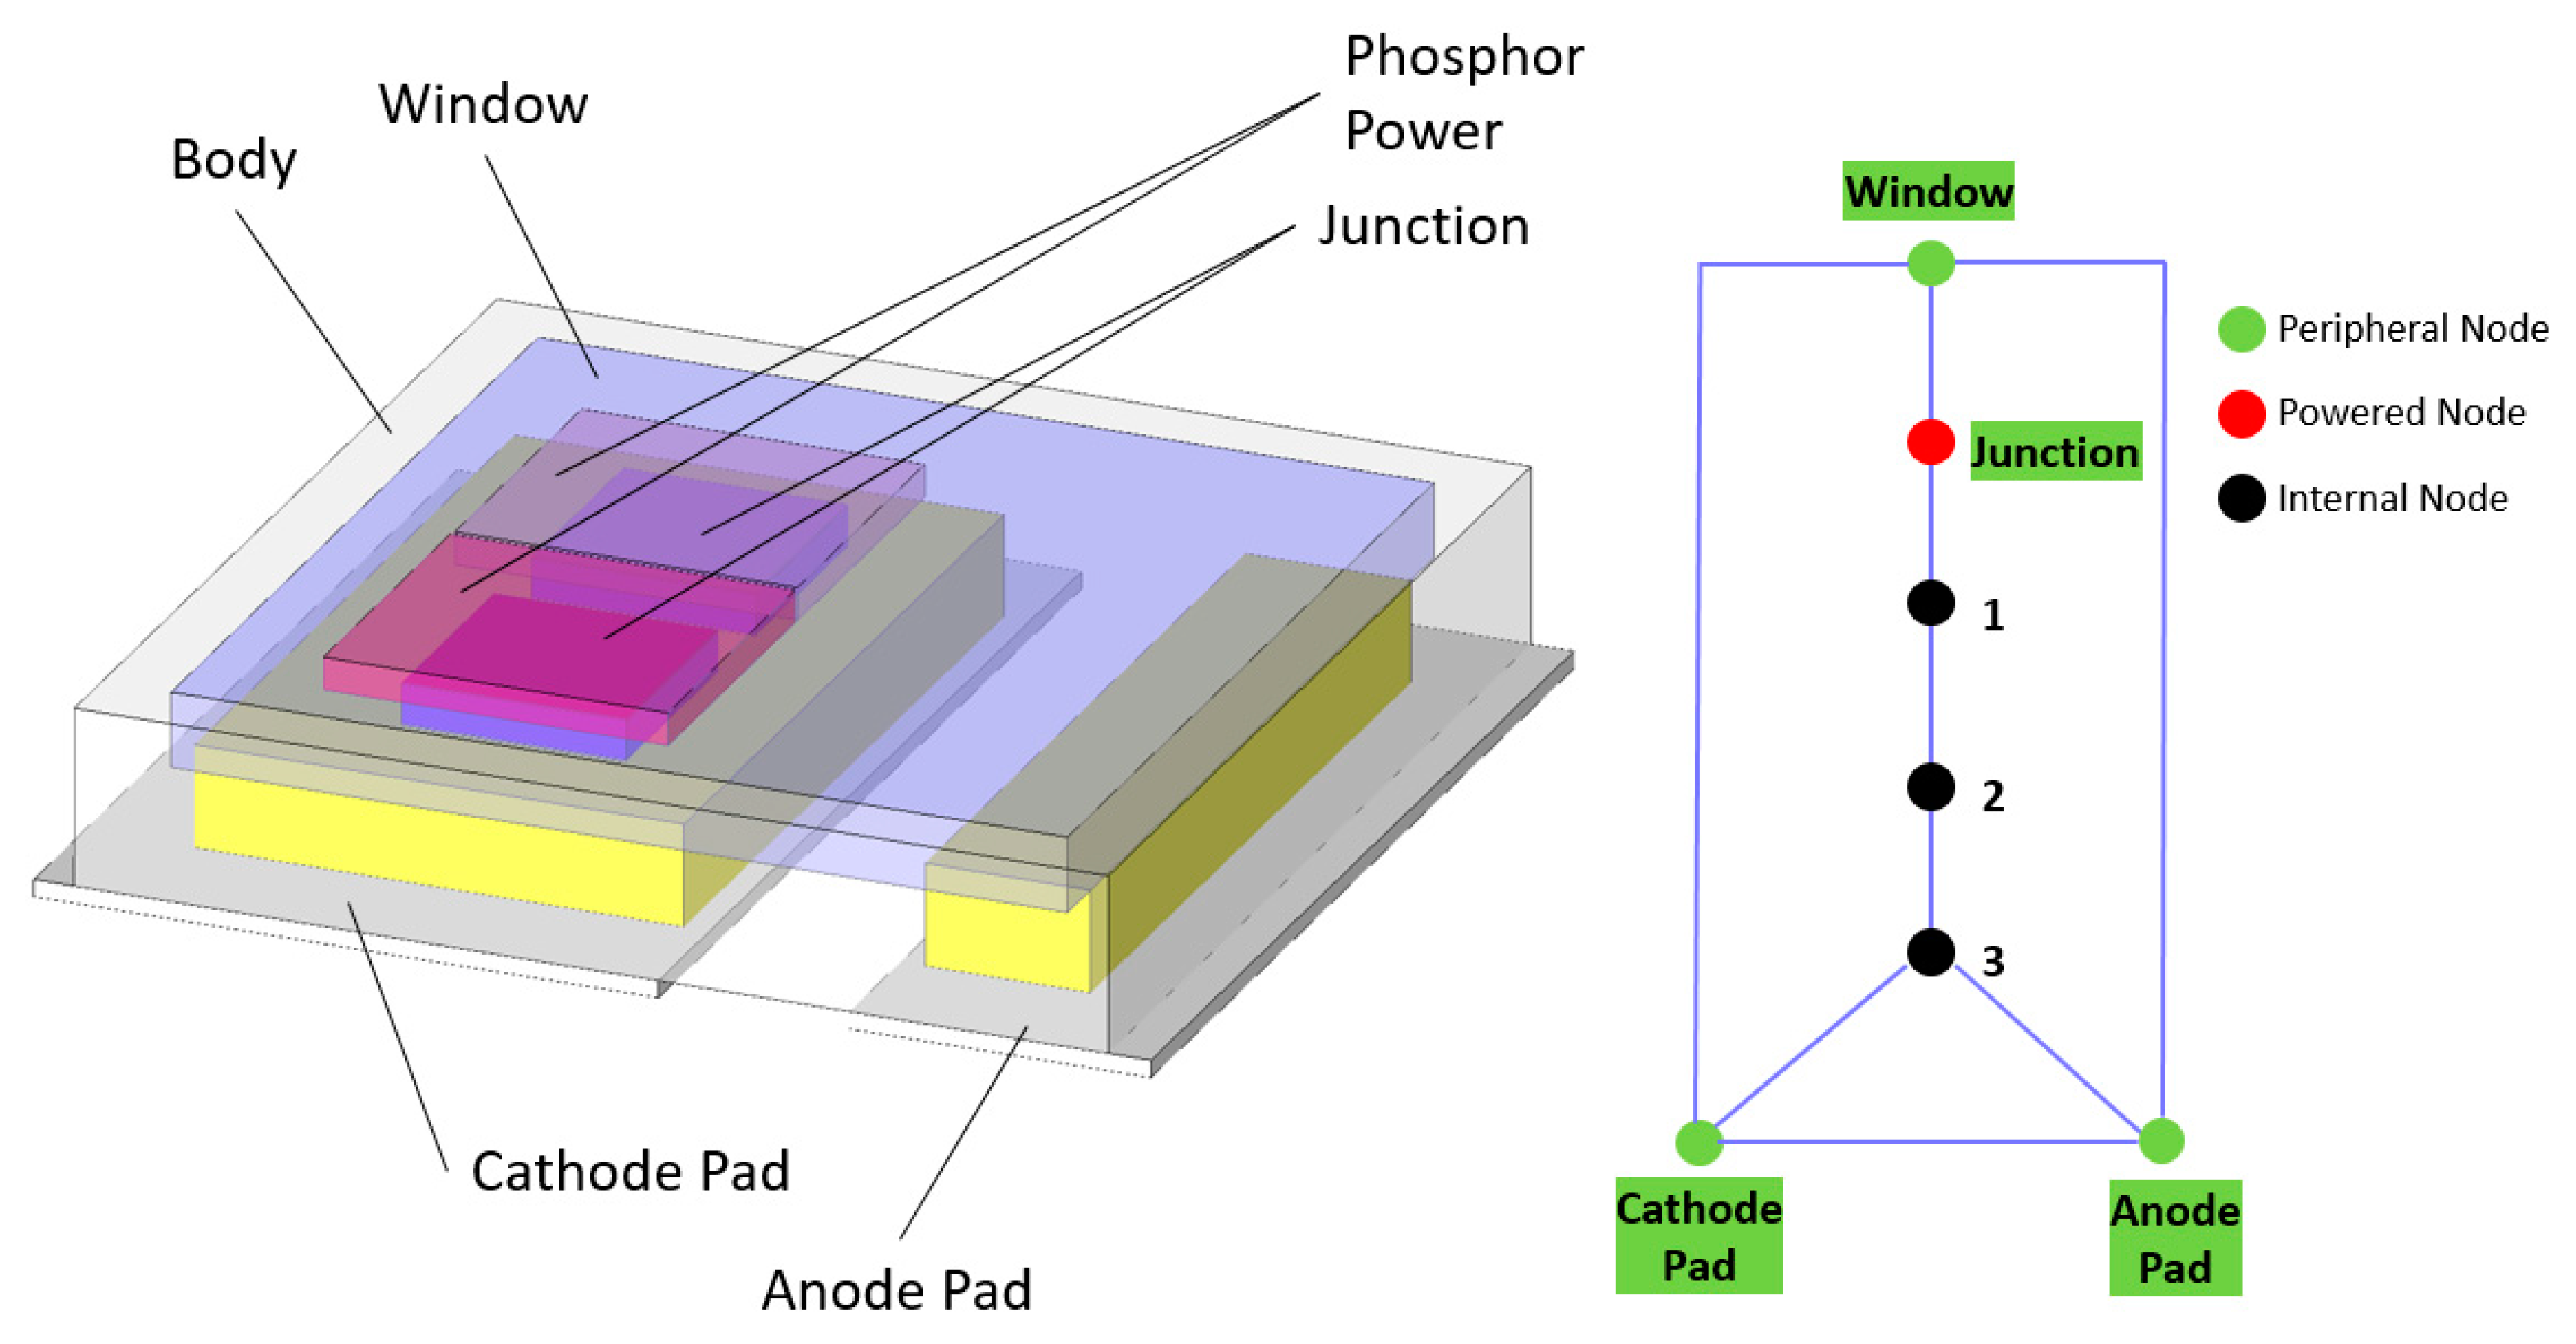
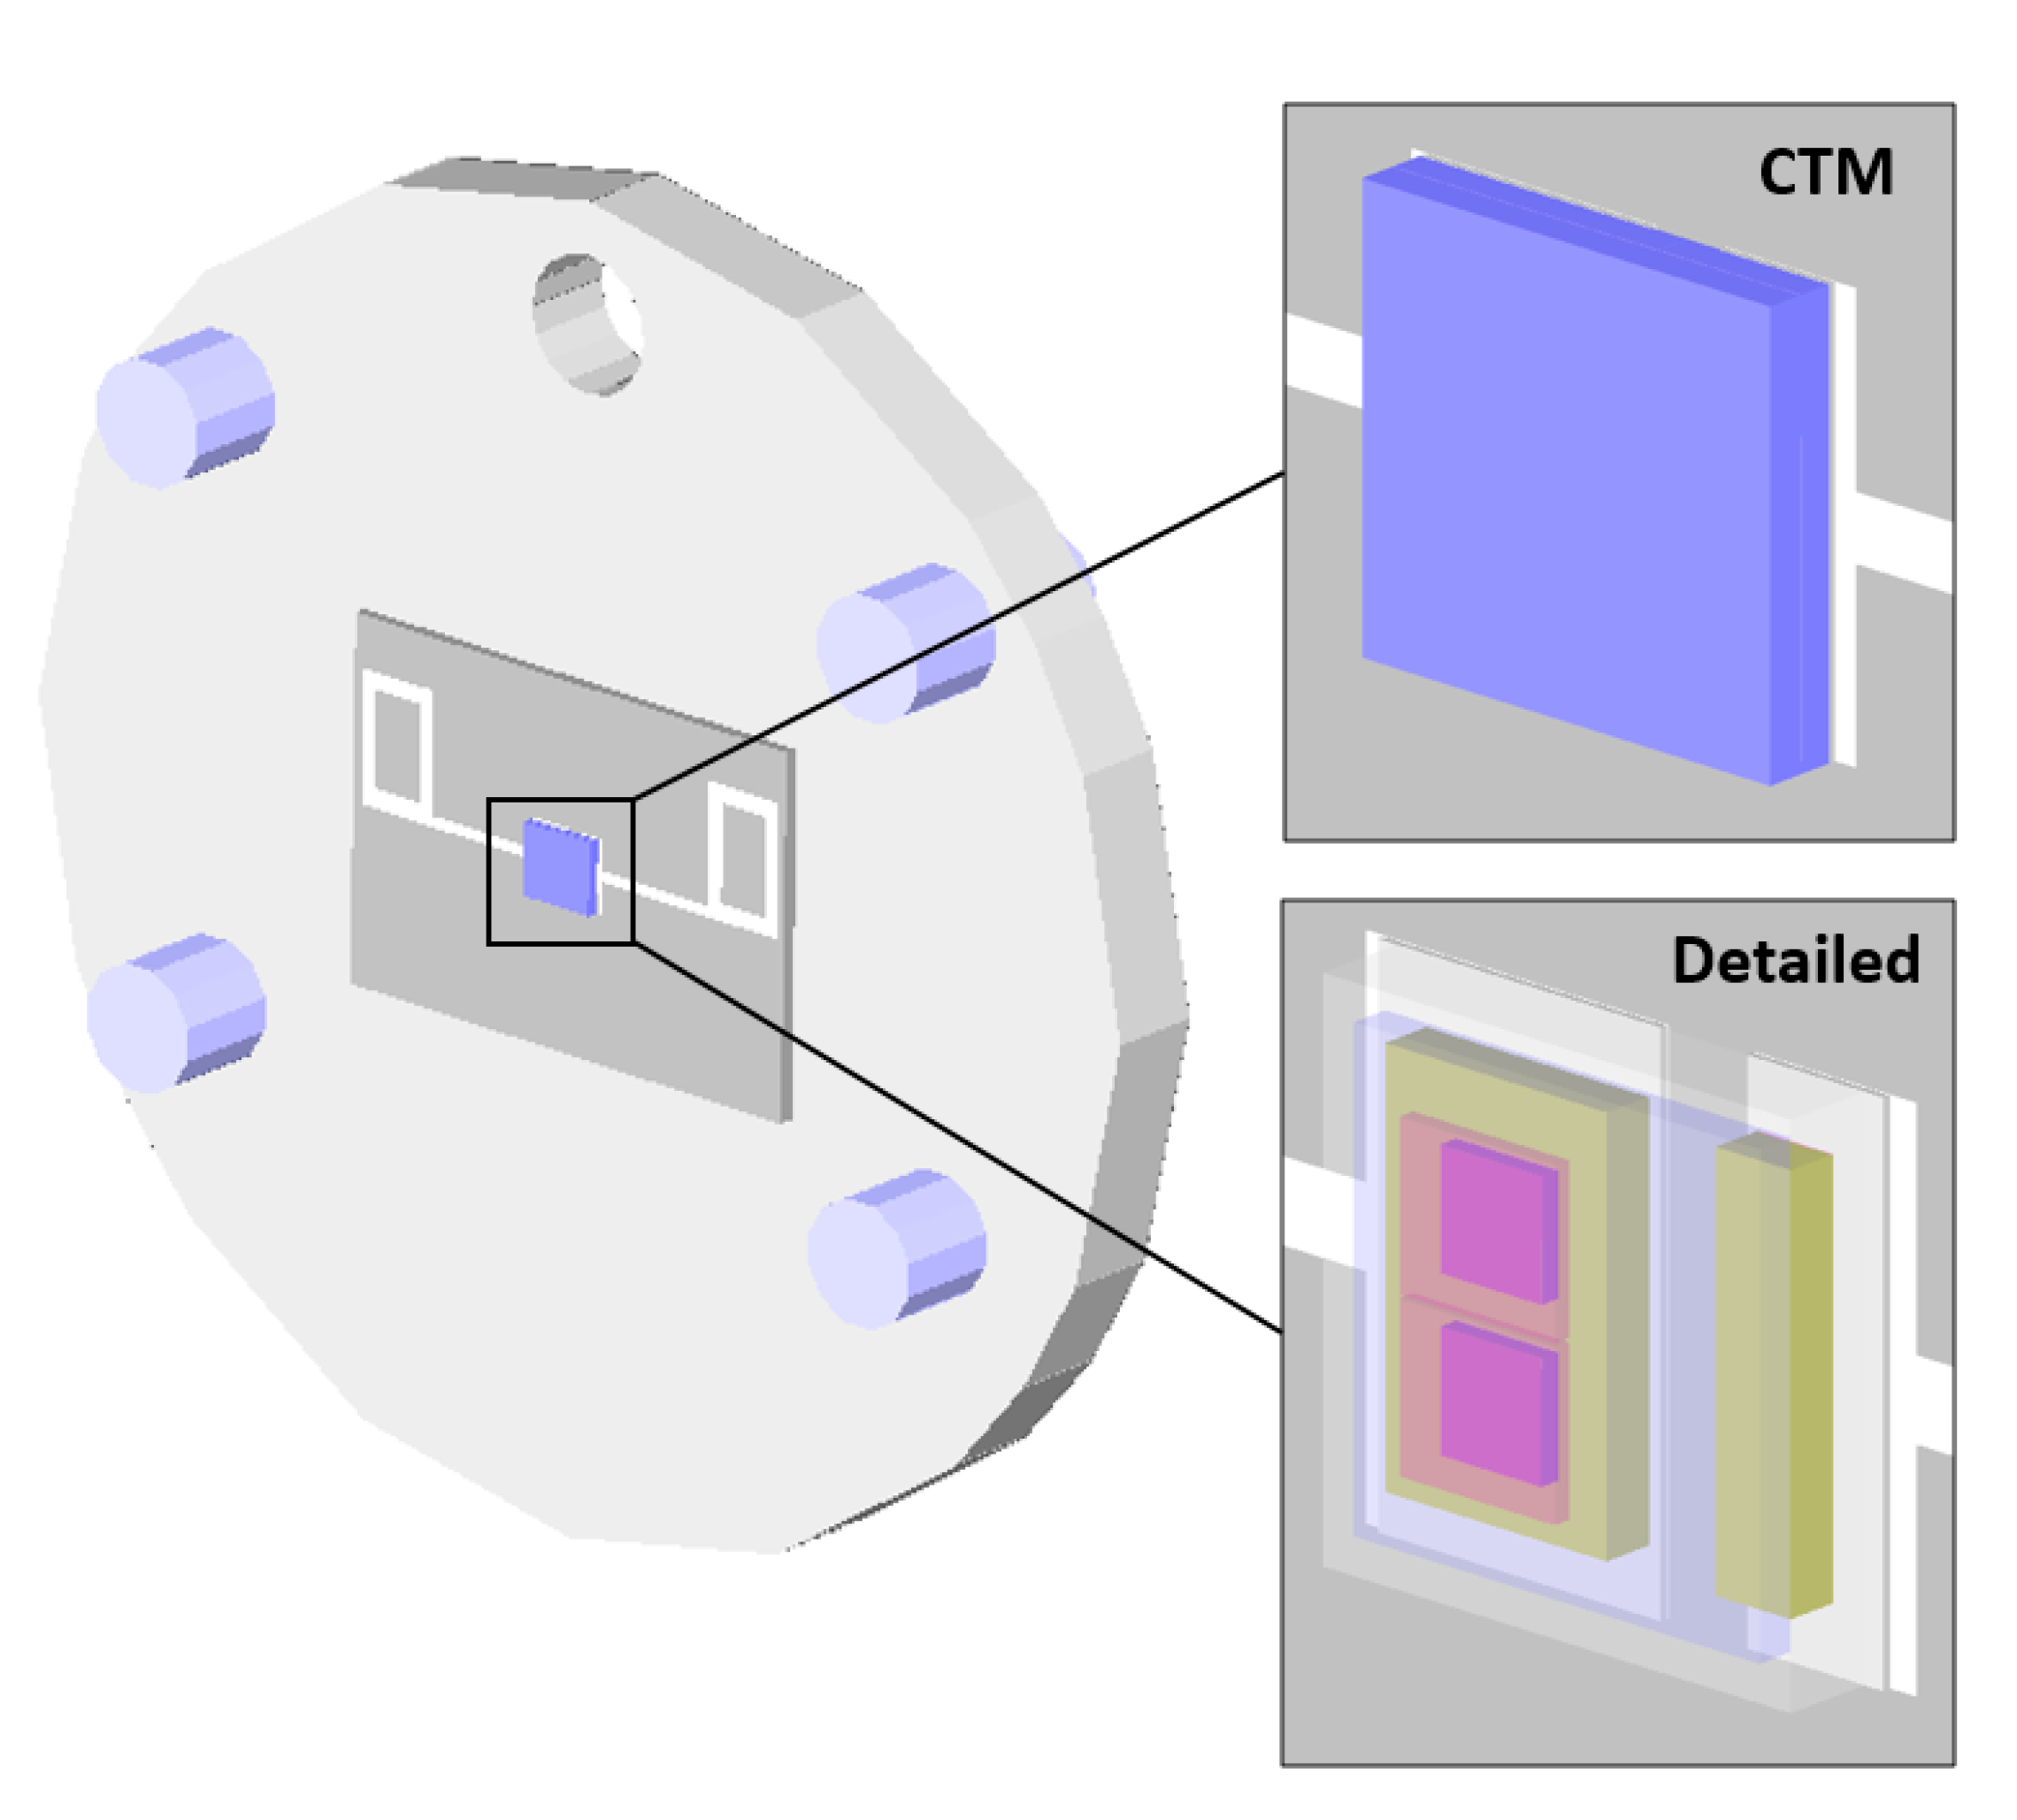
  • To propose a nodal network topology that is tailored to and representative of LED devices (Figure 2).
This article focuses on stage 3 and onward of the Delphi4LED methodology, applied to a mid-power Nichia NF2L757GRT-V1 warm white LED part. Stages 1 and 2 of the process, the optically corrected thermal transient measurement of the LED—measured in compliance with JESD51-51, JESD51-52 and CIE 225:2017—and the calibration of an equivalent 3D detailed thermal model, are described in [9].
As this part had no thermal pad, and prediction of the Phosphor temperature was not required by the intended design requirements, the nodal topology displayed in Figure 3 was used.
The initial portion of the heat flow path, represented in Figure 3 by the Junction, Node 1, Node 2 and Node 3, was considered to be independent of the thermal operating environment into which the CTM was placed. As such, the thermal capacitances at these nodes, as well as the thermal resistances between, were extracted directly from the structure function, which was derived directly from the measured thermal response [10]. The remaining thermal resistances and capacitances were determined by a process of optimization. First, the thermal response of junction and cathode pad of the 3D detailed model were simulated in three differing heat transfer coefficient (HTC) environments. These were realized by applying differing HTCs at the cathode and anode pad peripheral faces of the 3D detailed model (Table 1). These were intended to cover a range of possible operating environments—in this case, differing substrate types and substrate circuitry onto which the LED part may be placed. Note that the high HTC values were due to the very small areas involved in the physical size of the pads.
Due to the predominantly 1D nature of the heat flow, where most of the dissipated power was conducted down through the package and into the substrate, the relatively low value of HTC on the top and sides of the LED was ignored.
With assumed initial values of those thermal resistances and capacitances of nodes lying on the periphery of the package (i.e., Window, Cathode and Anode nodes) and the already-extracted values for all other nodes, the CTM was then simulated in the same three HTC environments, and the thermal response of the Junction and Cathode were recorded. The objective cost function was calculated as the sum of the areas between 3D detailed and CTM-predicted Zth responses. With three environments and two temperature points, this cost function quantified the separation between six pairs of thermal responses. An optimization process then used multiple simulations of the CTM, with differing thermal resistance and capacitance values, until the objective cost function was minimized. This was achieved when the thermal resistance and capacitance values of the CTM were found to be the same thermal responses as the calibrated 3D detailed model.
To verify the boundary condition independence of the CTM, its thermal response was compared to that of the 3D detailed model when both were placed in a simulation model whose HTC environment differed from the three sets that were used in the CTM extraction process.
All thermal simulations and optimizations were carried out using Version 12.2 of the ‘Simcenter Flotherm’ software, commercially available from Mentor, a Siemens Business. Flotherm is a 3D CFD simulation software, tailored to thermal applications in electronics, that solves for all modes of heat transfer, i.e., convective, conductive, and radiative. It uses a structured Cartesian mesh to discretize a 3D model, as well as a flexible multi-grid approach for the solution of the linearized equations [11].

3. Results

3.1. Compact Thermal Model Extraction

Although the detailed model was calibrated against a single transient junction temperature thermal response, the 3D model could provide thermal responses at multiple points (control volumes). In addition to the Junction temperature, the maximum solder point temperature is of particular interest, which was the temperature at the Cathode solder point for the LED considered in this study. The method to extract the CTM was similar to that of the calibration of the detailed model against measurement [9]. The CTM was calibrated against the (calibrated) detailed model. Network thermal resistances and capacitances were optimized (calibrated) until the CTM thermal response matched the 3D detailed model.
The thermal resistances between and thermal capacitances at the Junction, Node 1, Node 2, and Node 3 were obtained directly from the thermal transient measurement. The remaining nine degrees of freedom of the rest of the network—six thermal resistances and three thermal capacitances—were identified by 200 computational experiments, followed by a gradient-based sequential optimization that was required to minimize the objective cost function (the sum of the areas between all six curve pairs). The initial comparison Zth and final calibrated Zth, as well as comparisons between the CTM and the detailed model, are shown in Figure 4a,b.
The thermal resistance values of the calibrated CTM are shown in Table 2 and the thermal capacitances are shown in Table 3.

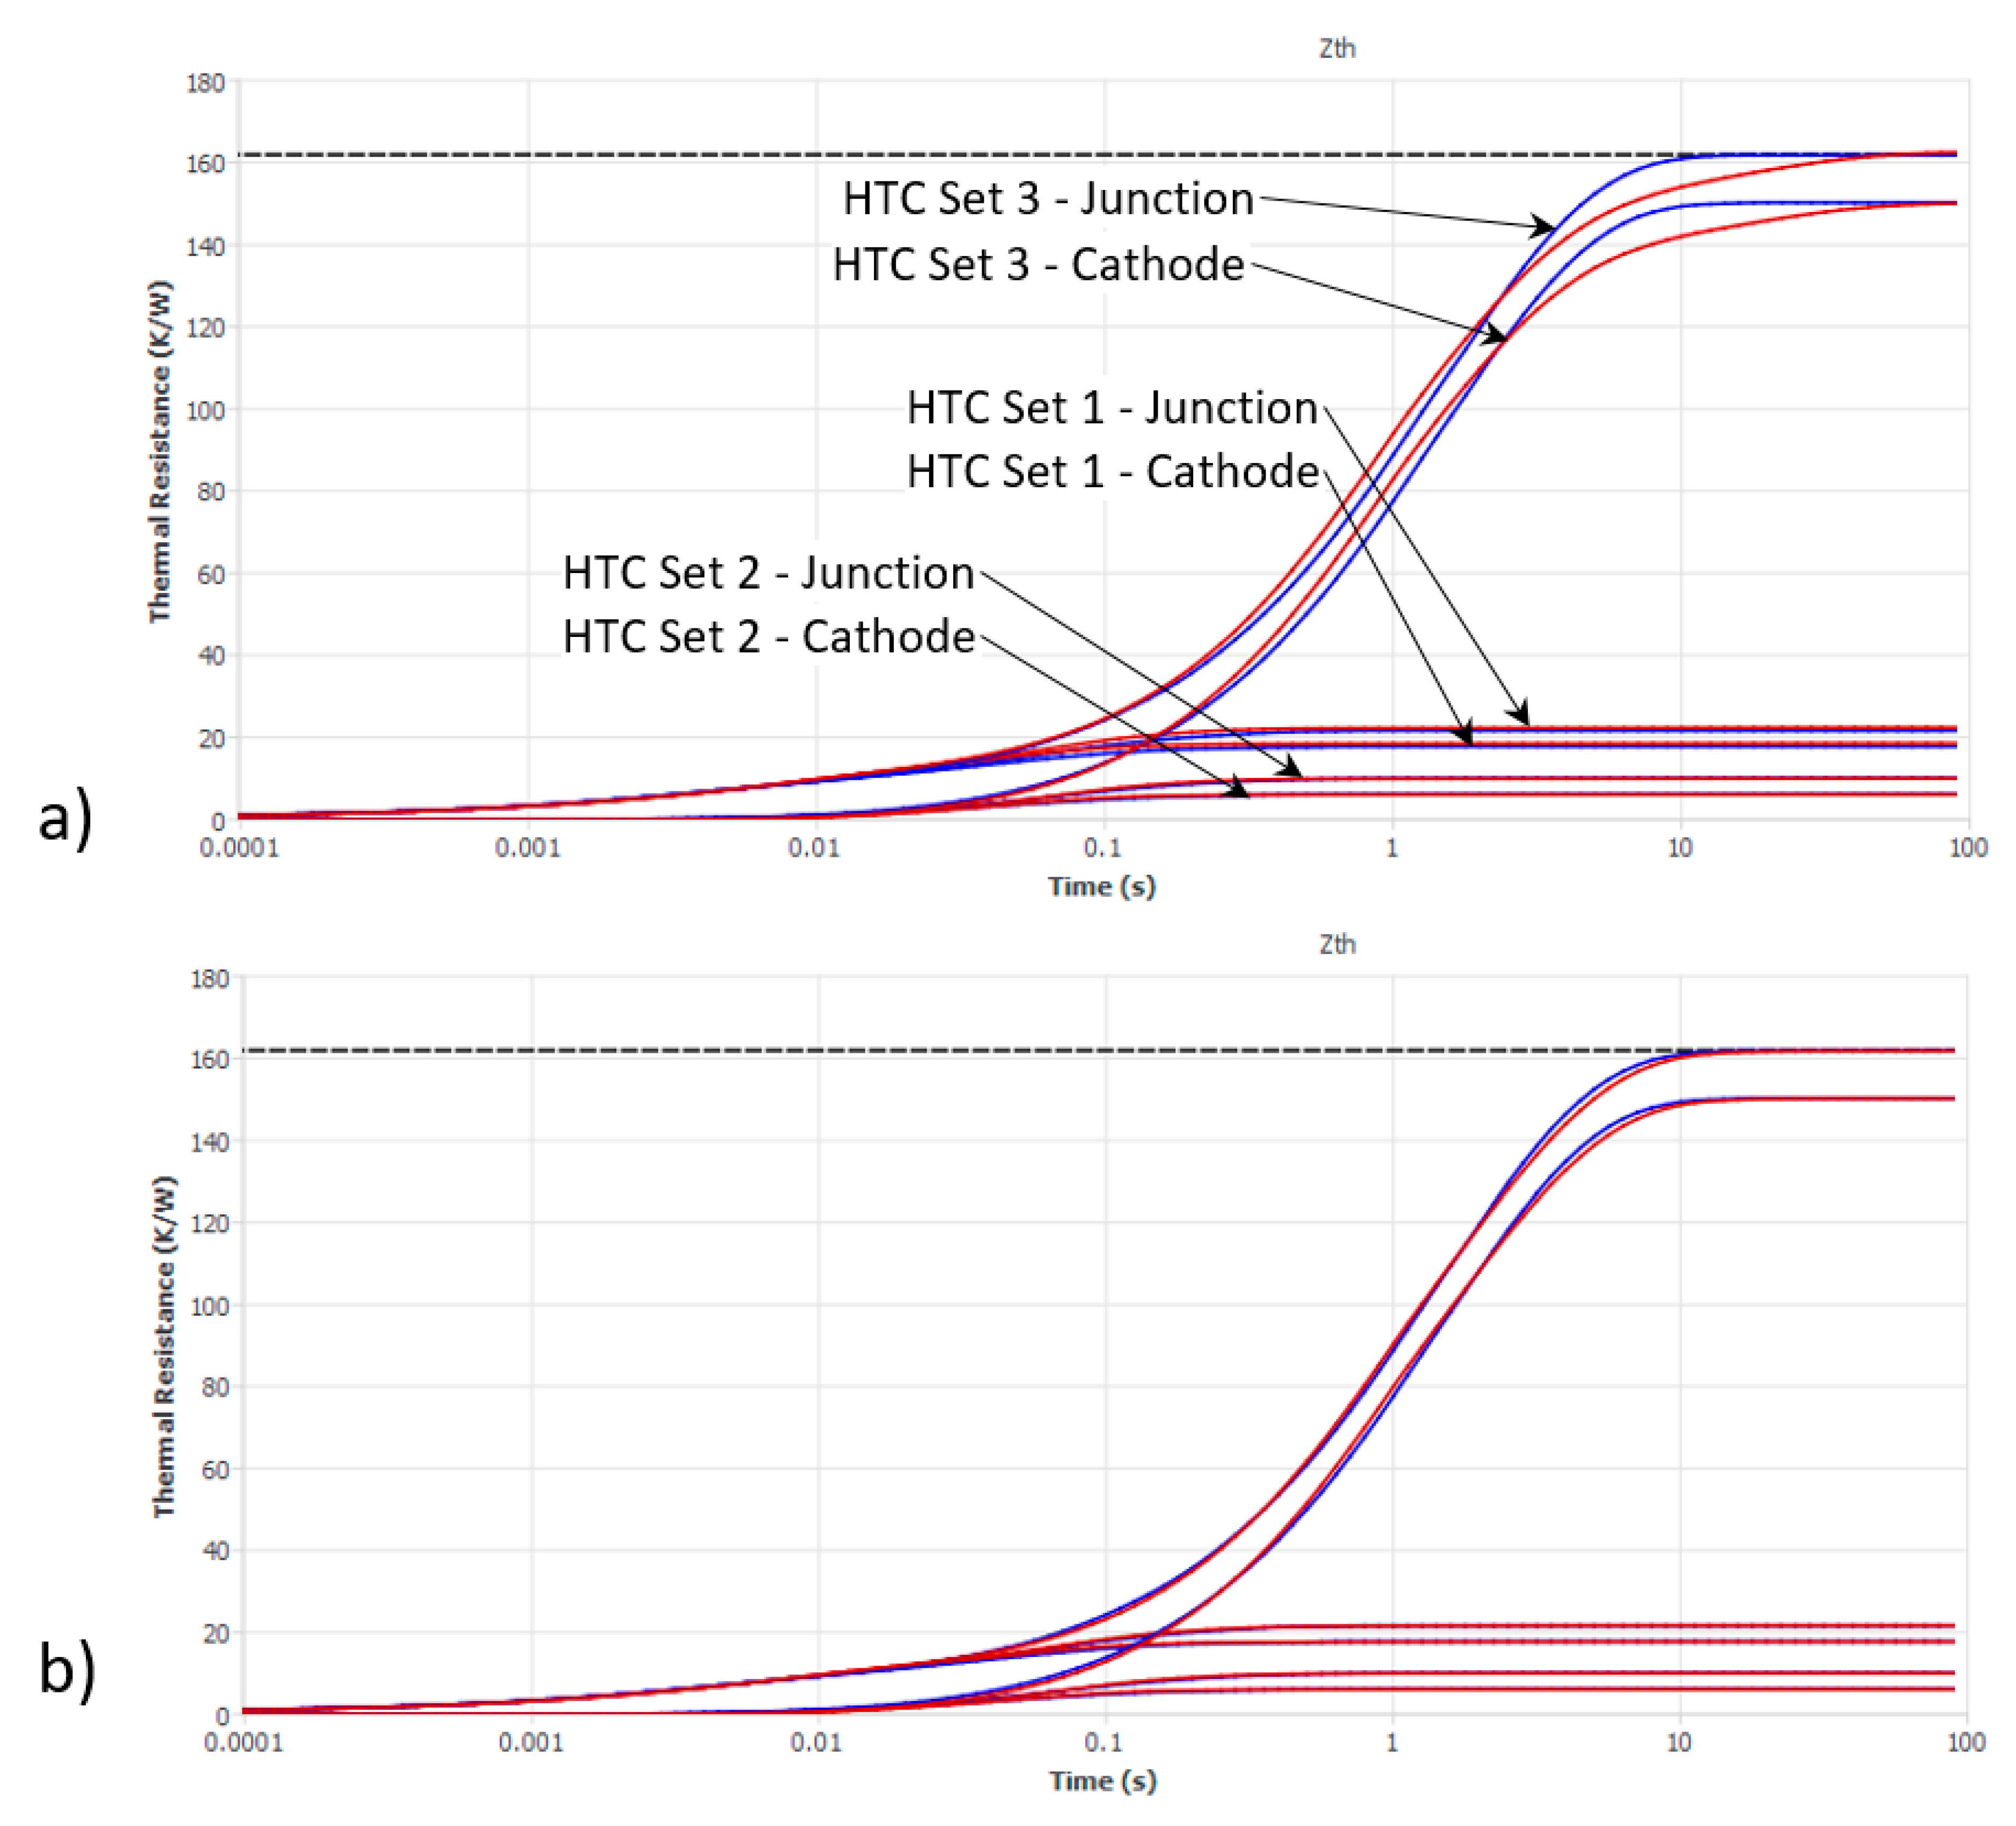
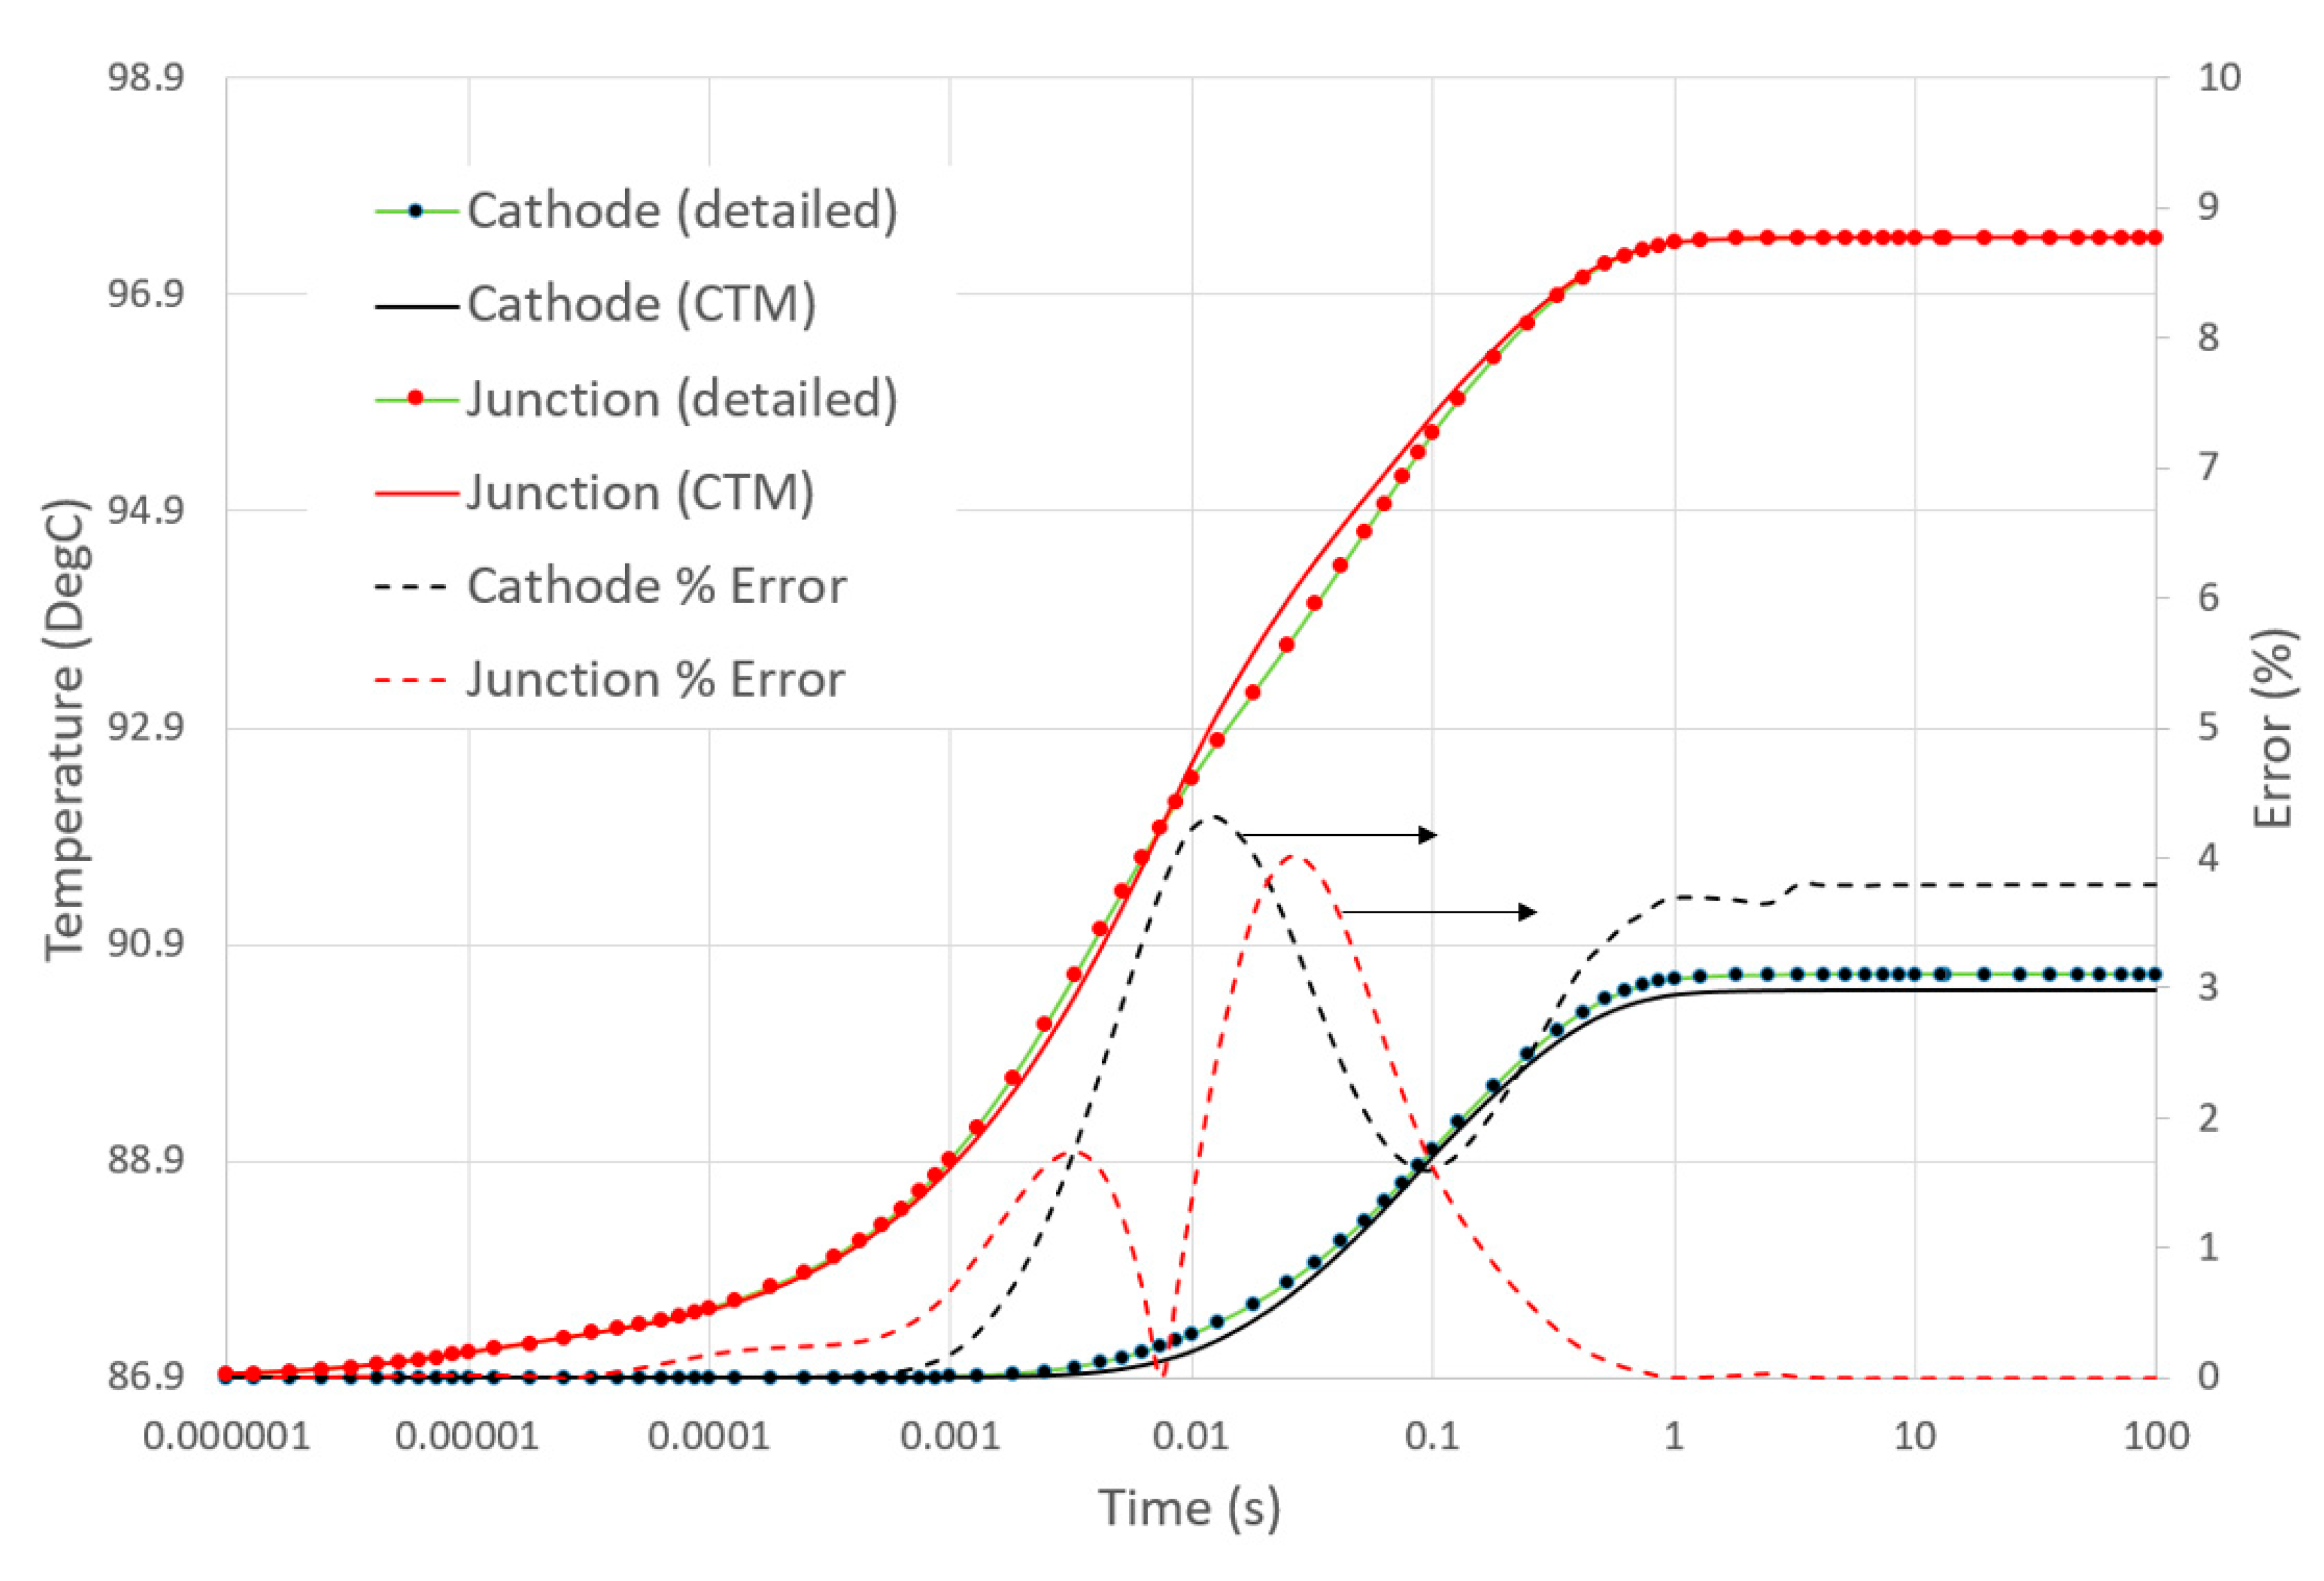
3.2. Validation of the Extracted CTM

The boundary condition independent accuracy of the CTM was implicitly assured for the three HTC sets that were considered during its extraction. To validate its accuracy for an intermediate HTC set, a final comparison was performed. Both CTM and detailed LED models were simulated independently in a 3D model of the environment that was originally used for the measurement (Figure 5). The LED was mounted on a ceramic substrate, which was itself mounted on a coldplate.
Compared to just imposing fixed HTCs on both the Anode and Cathode faces, as was done during the CTM extraction, this was a more complex and realistic operating environment. The HTCs experienced by the Cathode and Anode faces were a function of the effective thermal resistance of the rest of the heat flow path in the substrate, substrate circuitry and coldplate. The resulting Zth thermal responses of both model types were then compared, including the error between detailed and CTM responses, normalized by the final steady-state temperature rise (Figure 6).

4. Discussion

The accuracy of the CTM is dependent on several factors:
  • Having sufficient nodes and inter-nodal resistance links to accommodate changes to the internal heat flow paths that occur due to changes in the peripheral HTCs.
  • Having sufficient nodes to accurately discretize the thermal capacitance of those heat flow paths to ensure the correct transient thermal responses.
  • Extraction of the CTM using a sufficient number of external HTC boundary condition sets to reflect the potential variation of end-user operating environments.
Even with a simple network topology, containing only seven nodes, and extracting the CTM using a training set of only three HTC combinations, the maximum error in the resulting transient thermal response of the CTM was only 4.3%. The original DELPHI methodology proposed up to 44 HTC sets, though they had to cover a wider range of expected operating environment, such as spray cooling and the mounting of heatsinks on the IC package top. Due to the light-emitting nature of an LED, the range of thermal operating conditions is lower, though a set of HTCs representing those environments is yet to be proposed. Discussion of such a set is outside the scope of this paper but will be addressed subsequently.
There can be multiple distinct heat sources within an LED, e.g., at the chip junction(s), where Phosphor conversion occurs (white LEDs only) and at any surface within the package where optical reflection occurs. The amount of power of the latter two can be derived from that at the chip Junction via a Phosphor conversion efficiency and a light extraction efficiency [12]. In the example presented in this article, despite there being two chips with four heat sources represented in the detailed model (two Junctions and two Phosphor powers), the CTM considered only a single Junction node with a single power. This was to simplify the extraction of the CTM (three fewer nodes), to reflect the fact that, for the intended usage of the CTM, Phosphor temperature prediction was not required and to recognize the fact that both chip junctions exhibited very similar thermal responses. The combined two Junctions and two Phosphor powers were dissipated at the single powered Junction node. The CTM extraction process then sought to guarantee that the CTM was capable of predicting the measured thermal response of the junction, which was itself an average of the two chip junctions.
A more complex nodal topology that contained two Junction nodes and two Phosphor power nodes could be considered. The applied CTM extraction methodology would be the same, though more computational experiments would be required to optimize the reduction of the objective cost function, due to there being more nodes and thus more thermal resistance and thermal capacitance values to identify.
The CTM, solved together with an opto-electro model of the LED, is capable of predicting operating chip junction temperature, optical performance in terms of luminous flux and emitted optical energy, as well as voltage drop and thus total consumed power. All such parameters are considered as design goals or constraints which, when predicted during early-stage architecting of a proposed luminaire design, will minimize the risk of identifying that a first physical prototype fails to achieve its designed aim. The use of a luminaire design tool providing the ability to solve such a multi-domain compact model of an LED, including a validation of its accuracy, was described by [13].
Thermal modeling of electronics applications falls into two groups; those that rely on a discretized 3D geometric definition of all objects on the heat flow path (a so-called ‘detailed’ modeling approach) and those that abstract the thermal behavior into a form that obfuscates the application geometry and results in much faster simulation than the detailed approach (a so-called ‘compact’ model). For compact modeling, the use of equivalent thermal networks is well established and supported by a range of 3D thermal simulation tools. However, model order reduction techniques have emerged over the last decade and now form the state of the art in compact modeling [14,15]. Unlike thermal networks, whose accuracy is predicated on the choice of network topology and the effectiveness of an optimizer to identify appropriate thermal resistances and capacitances, a reduced order model may be extracted directly from a detailed model to a defined accuracy and is suited for both multi-heat source and transient applications. Although such reduced order models may be solved as a ‘standalone’ with prescribed peripheral HTCs, their solution in conjunction with a 3D detailed representation of their operating environment has not yet been demonstrated but will form the state of the art once done so.

Funding

This research received funding from the European Union’s Horizon 2020 research and innovation program through the H2020 ECSEL project Delphi4LED (grant agreement 692465).

Acknowledgments

Support from Delphi4LED project partners, especially from Genevieve Martin (Signify), Andras Poppe (Mentor), Lajos Gaál (Mentor), Marta Rencz (Mentor) and Gabor Farkas (Mentor) is acknowledged.

Conflicts of Interest

The author declares no conflict of interest.

Nomenclature

CFDcomputational fluid dynamics
CIECommission internationale de l’éclairage
CTMcompact thermal model
HTCheat transfer coefficient
ICintegrated circuit
Ifwdforward current
IPintellectual property
JEDECJoint Electron Device Engineering Council
LEDlight emitting diode
Pdispower dissipation
Tjjunction temperature
Taambient temperature
dVvoltage drop
Zthtransient thermal impedance curve
Φeemitted optical power
Φvluminous flux

References

  1. Lasance, C.J.M.; Rosten, H.I.; Vinke, H.; Weiner, K.-L. A Novel Approach for the Thermal Characterization of Electronic Parts. In Proceedings of the Eleventh IEEE SEMI-THERM Symposium, San Jose, CA, USA, 7–9 February 1995. [Google Scholar]
  2. Rosten, H.; Parry, J.; Lasance, C.J.M.; Vinke, H.; Temmerman, W.; Nelemans, W.; Assouad, Y.; Gautier, T.; Slattery, O.; Cahill, C.; et al. Final Report to SEMI-THERM XIII on the European-Funded Project DELPHI—The Development of Libraries and Physical Models for an Integrated Design Environment. In Proceedings of the Thirteenth IEEE SEMI-THERM Symposium, Austin, TX, USA, 28–30 January 1997. [Google Scholar]
  3. Rosten, H.; Lasance, C.J.M.; Parry, J. The World of Thermal Characterization According to DELPHI—Part I: Background to DELPHI. IEEE Trans. CHMT 1997, 20, 384–391. [Google Scholar] [CrossRef]
  4. Bornoff, R.; Hildenbrand, V.; Lugten, S.; Martin, G.; Marty, C.; Poppe, A.; Rencz, M.; Schilders, W.; Yu, J. Delphi4LED—From Measurements to Standardized Multi-Domain Compact Models of LEDs: A New European R&D Project for Predictive and Efficient Multidomain Modeling and Simulation of LEDs at all Integration Levels Along the SSL Supply Chain. In Proceedings of the Therminic 2016, Budapest, Hungary, 21–23 September 2016. [Google Scholar]
  5. Poppe, A. Simulation of LED Based Luminaires by Using Multi-Domain Compact Models of LEDs and Compact Thermal Models of their Thermal Environment. Microelectron. Reliab. 2017, 72, 65–74. [Google Scholar] [CrossRef]
  6. Farkas, G.; Gaál, L.; Bein, M.; Poppe, A.; Ress, S.; Rencz, M. LED Characterization within the Delphi4LED Project. In Proceedings of the ITHERM’18, San Diego, CA, USA, 29 May–1 June 2018; p. 393. [Google Scholar]
  7. Farkas, G.; Gaál, L.; Poppe, A.; Rencz, M.; Bornoff, R. LED multiphysics modeling for “Industry 4.0”, an approach proposed by the Delphi4LED European project. In Proceedings of the 2018 IEEE Electronics Packaging Technology Conference (EPTC), Singapore, 4–7 December 2018; p. 268. [Google Scholar]
  8. Farkas, G.; Poppe, A.; Gaál, L.; Hantos, G.; Berényi, C.; Rencz, M. Structural analysis and modelling of packaged light emitting devices by thermal transient measurements at multiple boundaries. In Proceedings of the 24th International Workshop on THERMal INvestigation of ICs and Systems (THERMINIC 2018), Stockholm, Sweden, 26–28 September 2018; p. 152. [Google Scholar]
  9. Bornoff, R.; Farkas, G.; Gaal, L.; Rencz, M.; Poppe, A. LED 3D thermal model calibration against measurement. In Proceedings of the 2018 19th International Conference on Thermal Mechanical and Multi-Physics Simulation and Experiments in Microelectronics and Microsystems (EuroSimE) Toulouse, Toulouse, France, 15–18 April 2018; pp. 1–7. [Google Scholar]
  10. Van Bien, T.; Szekely, V. Fine structure of heat flow path in semiconductor devices: A measurement and identification method. Solid State Electron. 1988, 31, 1363–1368. [Google Scholar]
  11. Technical Specifications. Available online: https://www.mentor.com/products/mechanical/flotherm/flotherm/technical-specifications (accessed on 21 April 2019).
  12. Alexeev, A.; Martin, G.; Onushkin, G.; Linnartz, J. Accurate Thermal Transient Measurements Interpretation of Monochromatic LEDs. In Proceedings of the Thirty Fifth IEEE SEMI-THERM Symposium, San Jose, CA, USA, 18–22 March 2019. [Google Scholar]
  13. Marty, C.; Poppe, A.; Martin, G. LED Luminaire Design Using Virtual Twin: Development of a Multidomain Compact Model in the Delphi4LED European Project. In Proceedings of the Strategies in Light, Las Vegas, NV, USA, 27 February–1 March 2019. [Google Scholar]
  14. Codecasa, L.; d’Alessandro, V.; Magnani, A.; Rinaldi, N. Matrix Reduction Tool for Creating Boundary Condition Independent Dynamic Compact Thermal Models. In Proceedings of the 21st International Workshop on Thermal Investigations of ICs and Systems (THERMINIC 2015), Paris, France, 30 September–2 October 2015. [Google Scholar]
  15. Sabry, M.N. Dynamic Compact Thermal Models Used for Electronic Design: A Review of Recent Progress. In Proceedings of the Interpack, Maui, HI, USA, 6–11 July 2003. [Google Scholar]
Figure 1. Co-simulation framework of a multi-domain LED compact model.
Energies 12 01628 g001
Figure 2. Delphi4LED-proposed compact thermal model (CTM) network topology (thermal resistances between all nodes, thermal capacitances at each node).
Energies 12 01628 g002
Figure 3. Nichia NF2L757GRT-V1 3D detailed model and equivalent CTM nodal topology.
Energies 12 01628 g003
Figure 4. CTM (red curves) and detailed model (blue curves) Junction and Cathode thermal response comparisons for the three HTC sets: (a) for the initial assumed CTM resistance and capacitance values; (b) for the final calibrated CTM.
Energies 12 01628 g004
Figure 5. CTM validation configuration.
Energies 12 01628 g005
Figure 6. CTM vs. detailed error comparison for both Junction and Cathode thermal responses.
Energies 12 01628 g006
Table 1. Three heat transfer coefficient sets.
W/m2KHTC Set 1HTC Set 2HTC Set 3
Anode60005000200
Cathode30,00050,0002000
Table 2. CTM thermal resistance values.
From NodeTo NodeThermal Resistance (K/W)
Junction10.6593
121.8364
234.2061
3Cathode5.0598
3Anode351.1
CathodeAnode12549
JunctionWindow8799
WindowCathode5000
WindowAnode9969
Table 3. CTM thermal capacitance values.
NodeThermal Capacitance (J/K)
Junction1.673 × 10−5
10.0001639
20.000268
30.00075
Cathode0.00588
Anode0.0025
Window0.0005

