1. Introduction
Non-synchronous generations, such as modern renewable energy sources (RES) like variable speed wind turbine (VSWTs) and solar photovoltaics, are increasingly making larger contributions to electricity generation throughout the world. Unlike conventional synchronous generations, these non-synchronous generations do not inherently contribute to the power system inertia, as they are decoupled from the power system through power electronics. This means that a larger displacement of conventional generations by modern RES without any additional frequency inertia control, the lower the power system inertia and the larger frequency deviations can get during power imbalances following large disturbances such as disconnection of a generator. This aspect might be especially pronounced in island power systems (e.g., Irish power system) or an interconnected power system split into islands following cascading events. For example, the average inertia of Ireland power system in 2020 is prognosed to be reduced by around 25% from the average inertia of 2010 [
1]. In [
2], it is indicated that the Irish power system inertia can vary from around 14 s to 2 s depending on the degrees of wind power penetration.
Large disturbances in low inertia power systems can cause fast changes in frequency, making the power system vulnerable to short term frequency instability. Frequency reserves are used to prevent frequency emergencies and instability whenever any power imbalance occurs in power system. In the European Network Transmission System Operator (ENTSO-E) Network Code on Load-Frequency Control and Reserves [
3], the frequency reserves are classified based on their functionalities as frequency containment reserves (FCR), frequency restoration reserves (FRR) and replacement reserves (RR) [
3]. FCR are automatic and expensive reserves activated within seconds following a power imbalance, while FRR and RR are activated within longer time frame from minutes to an hour. The responsibility of FCR is to restrict the sudden rise/decline of frequency, while FRR and RR are activated to release FCR as well as to bring the frequency back to its nominal value [
4,
5]. A fast release of FCR gives to the power system the ability to handle new possible consecutive power imbalances. Frequency reserves are deployed through different types of frequency control processes, viz. frequency containment process (FCP), frequency restoration process (FRP) and replacement process (RP).
This article only deals with FCP and FCR. FCP is employed to limit the frequency from becoming too high (or low) when exceeding the normal operational limits (50 ± 0.050 Hz for Continental Europe(CE)) following a large disturbance. FCP is required to be completely deployed within 30 s after a large disturbance and uses FCR from dedicated generators according to ENTSO-E [
3]. If FCP is either inadequate or not fast enough to contain the frequency, defense plans such as underfrequency load-shedding (UFLS), or overfrequency generation disconnections are employed to prevent frequency instability [
6,
7,
8]. However, these defense plans are only considered to be last resorts since they cause economic losses and discomfort to consumers. Therefore, all the available resources in the power system should be employed before activating these defense plans. Generally, in CE network, UFLS starts around 49 Hz, while overfrequency generation disconnection happens at 51.5 Hz [
6,
7,
8].
It is essential to quantify volume requirements of FCR accurately, more so in continuously changing power system environment. Traditionally volume of FCR is quantified based on n-1 security criterion [
9]. A methodology is proposed in [
5] to quantify volume of FCR and FRR for future power systems with high penetration of wind power to handle wind power forecast error. Availability of FCR volume is a necessary but not sufficient condition to prevent frequency instability. The technology used to deploy FCR plays a crucial role in FCP especially in power systems with low inertia, as it will be the case of future power systems with large share of renewable generators. FCP also-called primary frequency control in the literature is generally provided by speed-droop governors in conventional generators such as steam, hydro or gas turbine-based generators [
10]. These technologies are matured and have been in practice for years; however, the control settings of these technologies such as droop parameters, settling time etc. need to be investigated especially for low inertia power systems, due to fast change in frequency following a disturbance. Recently, several studies have been performed looking at FCP from newer technologies such as demand response, battery storage and wind turbines (WTs). Zhao et al. [
11], Molina-Garcia et al. [
12] investigates the contribution from demand response to FCP (referred as primary control), while Oudalov et al. [
13] and Mercier et al. [
14] focus on methods for optimization the battery storage for FCP. FCP support from WTs is studied in Morren et al. [
15] and Ullah et al. [
16]. A detailed modeling approach for frequency support from WTs is presented in Altin et al. [
17], Margaris et al. [
18] and Sakamuri et al. [
19]. Sun et al. [
20] provides a review of WT support for primary control from power systems point of view. Other technologies have also been investigated as viable sources for FCP. For example, Haileselassie et al. [
21] and Mu et al. [
22] investigates multi-terminal HVDC, electric vehicles for FCP, respectively. All these articles look at the capabilities of these technologies to provide FCR at different grid conditions. Mostly, these articles use simulation-based models for analysis of frequency support. Simulation-based models do not allow for mathematical analytic quantification of frequency response which provides insight about frequency characteristics such as nadir, settling time, ROCOF, time to reach the nadir with respect to controller parameters such as gain, droop, or system parameters such as inertia, volume of imbalance. Catering to the need for a better understanding and extensive quantification of grid stability for different grid conditions and controller settings, this article proposes a novel mathematical methodology to study, compare and perform sensitivity studies for different technologies for different grid conditions; analyzing the stability of the controller.
There have also been papers on the mathematical approach of frequency responses [
23,
24]. Aik [
23] proposed a general-purpose frequency control model considering UFLS. Chavez et al. [
25] proposed a simplified model to assess the adequacy of FCR. However, these models do not allow for performing sensitivity studies for different technologies through mathematical analysis. Proposed mathematical model not only allows the choice of proper technology to provide FCR but also allows assessing the relative stability of the controllers for different values of inertia of the system.
Contributions of this article are as follows:
A novel detailed mathematical analytic approach for FCP is proposed and discussed in this article.
Analysis of frequency characteristics such as time to reach nadir, attenuation, frequency nadir based on controller parameters and power system characteristics such as inertia and imbalance using the proposed model.
Capabilities of different technologies of generation sources in providing FCP can be analyzed through this mathematical analytic approach. A set of simulations has been performed in a power system consisting of generic governor and WT models in order to study the impacts of droop settings and system inertia.
Observations from these simulations are analyzed and explained with the help of analytic approach, which provides a feasible range of droop settings for different values of system inertia.
The efficacy of the proposed mathematical approach is verified on a case study of simulated realistic CE network.
This article is structured as following.
Section 2 derives a mathematical approach for FCP. Several sensitivity studies of different technologies with respect to system inertia and droop settings based on the mathematical model are performed in
Section 3.
Section 4 applies and validates the mathematical model based on case study on simulated CE network. Finally, conclusive remarks are reported, where the track for future work is also proposed.
2. Mathematical Approach of FCP
Turbine technology can be either a turbine-governor-controlled power generator or a converter connected WT represented by a zero(
z)-pole(
p)-gain(
k) transfer function model. The FCP controller is further modeled as droop control with slope of
. The intention of the studies in this article is to study FCP following a large disturbance. Following a large disturbance, frequency goes much beyond the dead-band, consequently dead-band is neglected for the studies. This makes the system linear. There are two other major non-linearities for these kinds of studies. First kind of non-linearity arises from switching events such as UFLS, overfrequency generation disconnection, pump-storage connection/disconnections etc. All these switching events are part of special protection schemes of defense plans during emergency. The intention of the research presented in this article is to prevent emergency. Therefore, these switching events can be safely ignored. Another non-linearity might arise from the different turbine technologies. For example, hydro generators experience non-linear impacts of backlash and hysteresis in the forward path of the servo systems [
26]. Similarly, converter switches in the WTs can also cause non-linearities. However, these non-linearities can also be ignored in lieu of large signal analysis. The advantage of neglecting these non-linearities is that it makes the mathematical model analytically solvable. It should be noted that the methodology is generic for any power system and will give an idea for operators to plan/design/operate their system with low inertia in the event of a large frequency disturbance. Either the non-linearities can be neglected for large signal analysis or parameters of the proposed methodology needs to be tuned for considering the non-linearities. The power system is represented with respect to equation of motion.
representing the change in load reference point for the generator set by FRP. In the considered time period of FCP of a few seconds, this value is basically zero.
represents the power imbalance seen by the power system due to a disturbance. The disturbance can be disconnection of large generator/load or system separation in the case of large interconnected system. In case of system separation into islanded systems,
denotes the loss of import/export to the neighboring islands. Damping of the system can also be neglected since it does not have large and fast impact on FCP, rather has impact on steady-state frequency thereby influencing FRP.
Mathematical formulation for model in
Figure 1 is given as
It can be observed from (
1) that the closed-loop transfer has a zero and 2 poles. The denominator of (
1) can be compared with the denominator of the standard second order transfer function given by
.
Equation (
1) can be therefore be rewritten as
where natural frequency
is given by:
attenuation
is given by:
damping ratio
is given by:
Generally, a disturbance (such as system separation) occurs instantly, therefore,
can be modeled as step response with magnitude
. Equation (
2) can be thus further written as,
By adding and subtracting
to the denominator and algebraic modifications, the (
6) can be written as
where damped frequency can be written as,
Taking inverse Laplace of (
7), gives (
9)
Equation (
9) shows that
oscillates sinusoidally with an exponential decay, which depends on attenuation
.
Main responsibility of the FCP is to contain the frequency peak (or nadir in case of underfrequency) as fast as possible, therefore this peak value and the time to reach this peak value () are of primal interest.
To find the peak of
given by
, the derivative of
should be zero, i.e.,
Notice that time
is independent of disturbance
and depends on characteristics of technology (
), droop settings (
R) and inertia of the power system (
M). This observation is important in designing FCP requirements based on the available energy sources in any specific network. For example, current requirement for full activation time of FCP in CE is 30 s, for Great Britain Network is 10 s, Ireland power system is 15 s and for Northern Europe is 30 s [
3].
Substituting the values of
from (
10) into (
9), we get
Please note that in these studies, the peak frequency considered is the first peak value of the frequency. However, there can be many subsequent peaks if the attenuation is low. If the attenuation is negative, subsequent peaks become even higher than the first peak. Therefore, both first peak and attenuation are taken into consideration in this article.
It can be observed that peak value of is directly proportional to the magnitude of the disturbance, and droop, R. Moreover, it is dependent on generation technology, as is directly proportional to the ratio of pole to gain and zero i.e., . Angular momentum of the system M in p.u. is twice the inertia constant H (M = 2H) and since , hence the frequency and peak frequency (or nadir) are given by ).
Observations from the mathematical model are as follows:
Frequency fluctuates sinusoidally with an exponential damping dependent on attenuation
Peak time is independent of disturbance and dependent on attenuation and damped frequency
Peak frequency mainly depends on droop, disturbance, generation technology . When the inertia of the system is low, rate of change of frequency (RoCoF) following a large disturbance can be high. Response of the generation technology should be fast in such system. This can be obtained by reducing the droop (faster droop). Peak frequency is directly proportional to droop. However, capabilities to respond to faster droop depend on type of generation technology. Faster droop can cause reduction in attenuation and damping ratio. This in turn can cause undamped response resulting in oscillatory instability.
Attenuation depends on generation technology, droop, system inertia, and independent of disturbance
Damped frequency depends on generation technology, droop, system inertia, and independent of disturbance
The summary of the formulae derived from mathematical model expressed based on inertia constant
H are given as (
12). Detailed derivation is given in
Appendix A.
These formulae are used to perform sensitivity studies.
3. Sensitivity Studies
The capabilities of different generation technologies differ by large extent. In this article, 2 main parameters—system inertia and droop are investigated for different generation technologies.
To study different technologies of generation technologies, general-purpose governor block for conventional generators proposed by Anderson and Fouad [
27] (Figure D.13. in Appendix D in [
27]) is used. This general-purpose governor model basically represents “FCP Controller” of
Figure 1. This general-purpose governor has four transfer functions—(i)
representing governor delay (
) and pilot valve time (
); (ii)
representing servo or hydro gate time constant; (iii)
representing steam valve bowl time constant; (iv)
representing steam reheat time constant, where F is per unit shaft output. The parameters
F and
vary for different types of generators and affect the output response for change in frequency. In this article, fossil fuel-based steam generator (820 MW) and cross-compound steam generator (436 MW) among conventional generators are consider for studies whose parameters are given in Appendix D in [
27]. It should be noted that the methodology is generic for all kinds of generators and accordingly the parameters for specific generators should be used for the studies. Sensitivity studies performed for hydro and nuclear plants can be found in [
28].
R is varied from 2% to 6% to study its effects of different
R on frequency.
is the main time constant for the generators. Therefore, T.F.-4 (
) plays the most important role in dictating the output response from these generators.
is relaxed since volume of FCR is assumed sufficient to handle the disturbance.
is assumed constant since it is set by FRP. Considering these assumptions, the generic model is combined with the models presented in
Figure 1 to provide the simplified generic delta model for FCP as shown in
Figure 2.
Generic model of
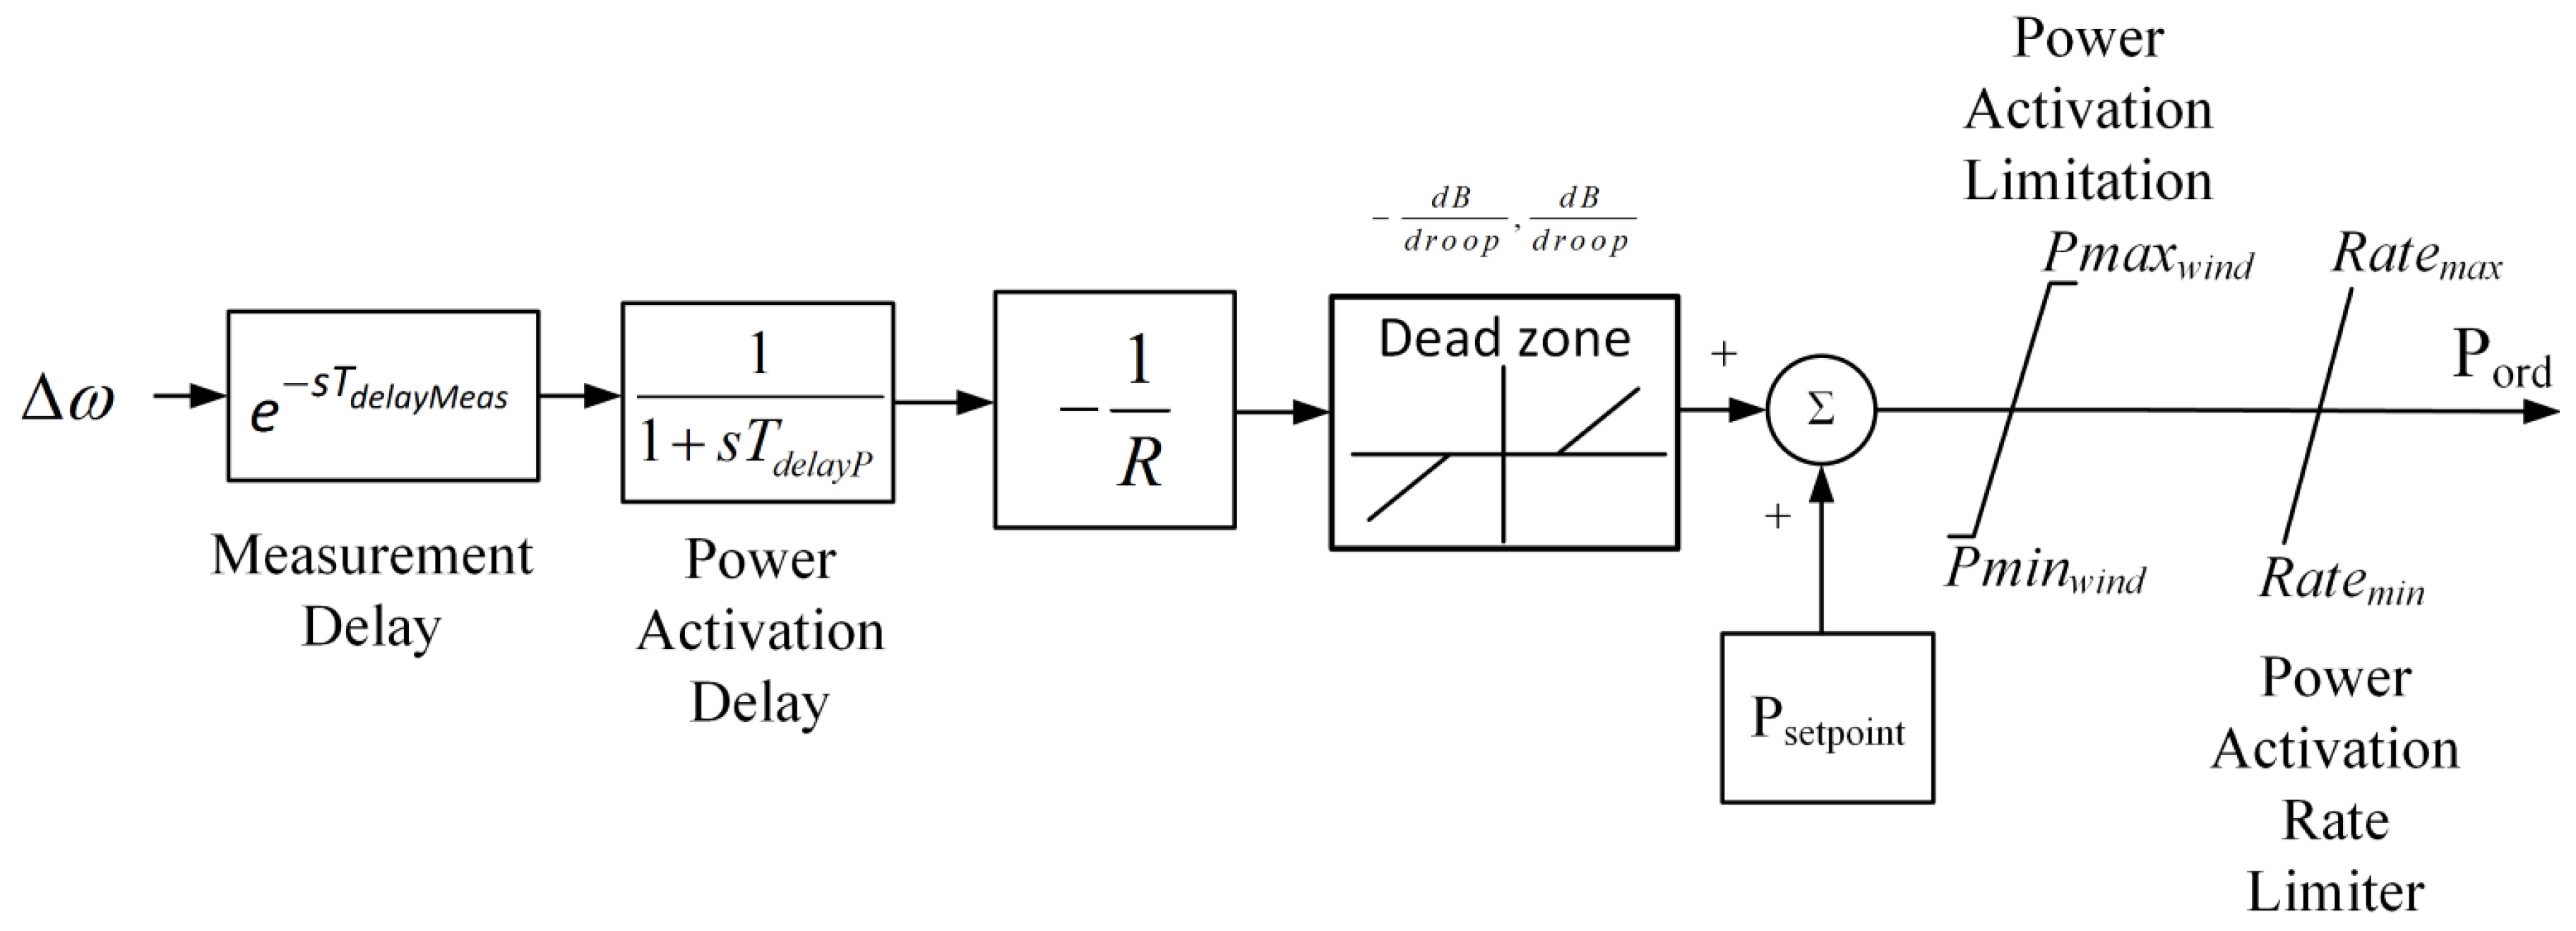
Figure 2 is applicable only for conventional generators and not applicable for WTs. FCP model for WT is shown in
Figure 3. Measurement delay is assumed as 100 ms. Measurement delay is assumed comprising of communication delays, delays due to sampling and computation of frequency and measurement delay. Power activation delay is assumed as 50 ms. It should be noted that all these parameters are configurable and varies for different WPPs. 100 ms may be realistic if the WPP is offshore connected through HVDC connection, where communication delay needs to be incorporated. However, if the frequency measurement is obtained locally from PLL, the delay would be much smaller. Maximum and minimum ramp rates are assumed
p.u./s. It should be noted that the response capability from WT depend largely on ramp rate and delays of WT control and studied in detail in [
28]. These sensitivities are not included in this article because the impact of R & H plays a major role as compared to these other parameters as long as the ramp rates and delay values are within specific limits. However, in future, if technology becomes more flexible, these additional sensitivities must be studied along with R & H.
Power imbalance due to fault (
) is assumed as large as 0.17 p.u. for the underfrequency studies and −0.17 p.u. for overfrequency studies based on the UCTE 4 November 2006 system separation event when North-Eastern island area had 17% excess generation following the split [
29].
To understand the behavior of the generic FCP controller models, equivalent analytical pole-zero-gain model of
Figure 1 is identified based on models of
Figure 2 and
Figure 3 through system identification. This equivalent pole-zero-gain model is used to compute closed-loop poles, attenuation and damping ratio of the frequency response.
To investigate the sensitivities of different technologies of generators following studies are performed:
- (A)
Constant droop, constant inertia
- (B)
Constant droop, varying inertia
- (C)
Varying droop, varying inertia
In all the studies, only one generator technology is considered at a time for FCP model of
Figure 1 since the idea is to compare the response of different technologies independently. However, combinations of different generators are studied in the case study involving UCTE disturbance.
3.1. Constant Droop, Constant Inertia
The goal of this study is to understand the individual capabilities of different types of governors and WT to contain frequency and prevent frequency instabilities. In this regard, it is important to find equivalent pole-zero-gain of the analytical model depicted in
Figure 1. The parameters of the analytical model for each generator for the response for given
and
s is given in
Table 1. Fitness of the frequency response for this analytical model with the simulated generic model is also given in
Table 1.
Closed loop poles give information about stability of the power system. It can be observed from
Table 1 that the power system is stable for all type of generators since real parts of the poles are negatives. However, their distances from origin (i.e., their absolute values) provide relative stabilities. WT poles have no imaginary component inferring and therefore there is no oscillatory component in the output response from WT. Attenuation
and damping ratio
affect the damping of the frequency response. Generally, damping ratio for the controller is chosen between 0.4–0.7 to limit peak overshoot [
30]. Remark that all these results are observed based on certain parameters of specific generation technologies and they can vary for different values of parameters. However, the methodology is generic for analyzing different technologies which is purpose of this article.
Table 2 depicts the comparison between proposed mathematical model and generic model. Calculated values are obtained from the mathematical model while observed values are obtained from simulation using the generic models in
Figure 2 and
Figure 3. It can be noted that error between calculated and observed values is less than 1%. Thus, the confidence on the derived results from the analytical model is quite high.
3.2. Constant Droop, Varying Inertia
With changing penetration of non-synchronous RES replacing conventional generations depending on weather conditions, inertia of the system changes dynamically. Therefore, it is important to choose proper technology for FCP provision in this varying inertia system. In the following studies, it is considered that inertia constant
H is decreased from 6 to 1.5 s while
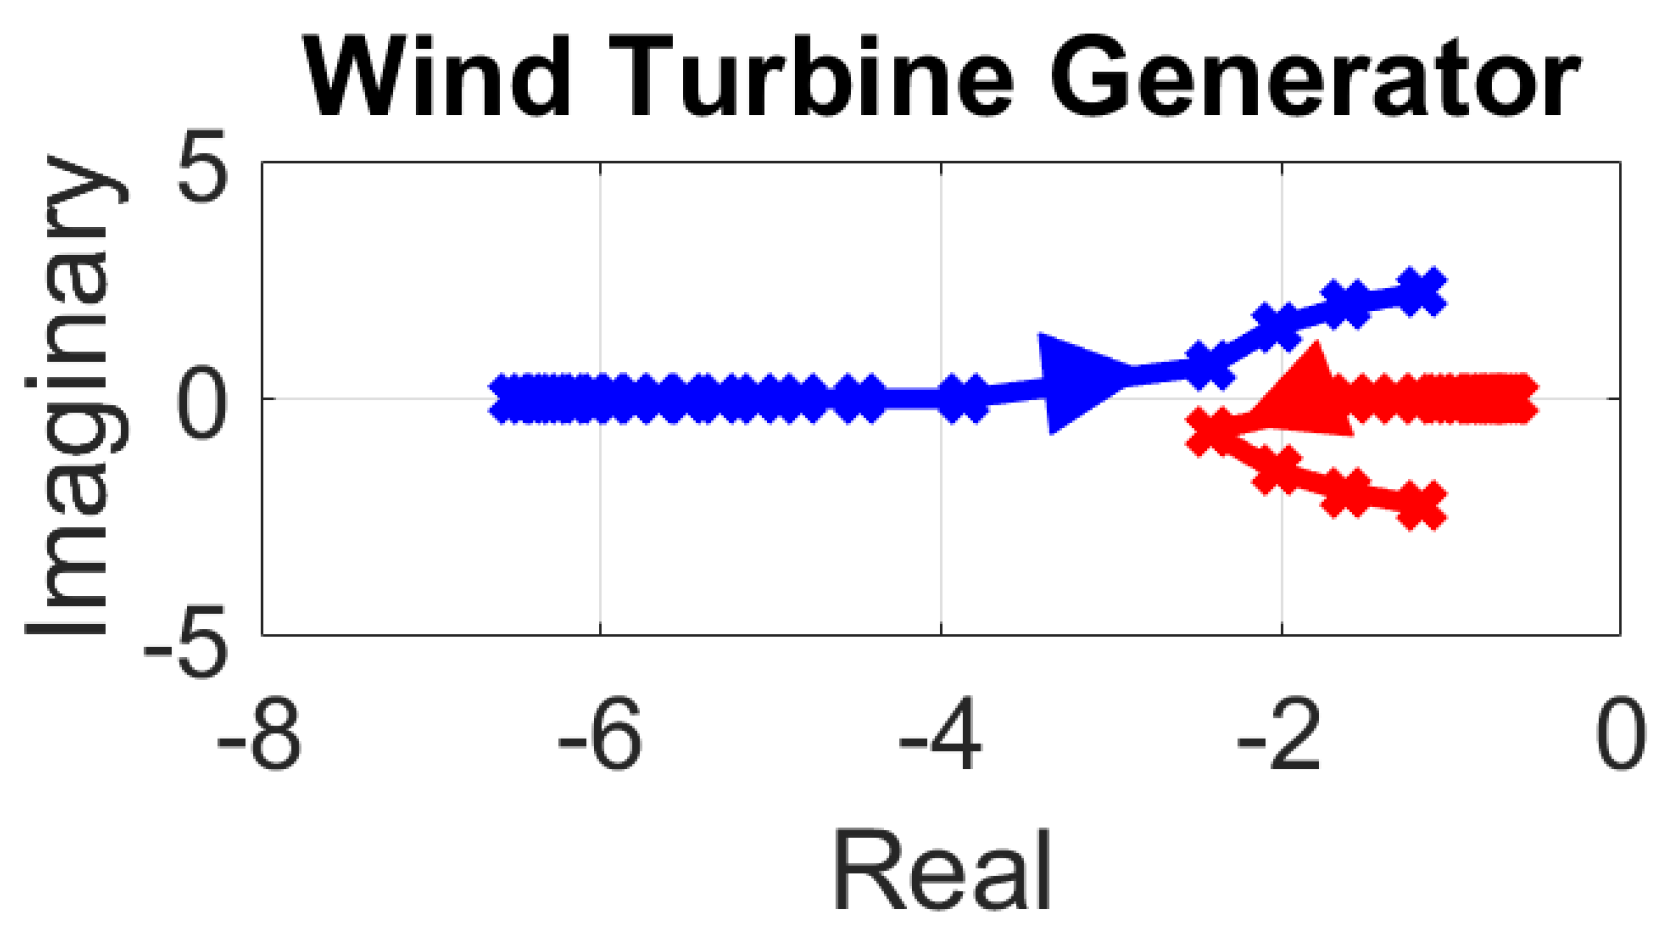
R is kept constant at 4%. Closed-loop poles are computed using analytical method as discussed before. Trajectories for closed-loop poles for decreasing inertia constants are shown in
Figure 4,
Figure 5 and
Figure 6.
Fossil and cross-compound governor systems are quite stable since the real part of the poles is far from origin even with low
H i.e., the ending point of the trajectory. However, lowering the inertia reduces relative stability as the poles start moving towards origin. It should also be noted that the imaginary component of the poles starts increasing with reduction in H, indicating increase in frequency oscillations. It should also be noted that these frequency characteristics depend on the controller parameters (as seen from (
12)), thereby depending on the size and type of generator. Wind turbine also depicts interesting behavior. For WTs, poles lie on real axis for high inertia. These real poles are quite further from imaginary axis implying fast output response. Since these poles have no imaginary component, there is no oscillation in the output response. However, as inertia is decreased, oscillations begin to appear in the output response as there are imaginary components in the complex poles for lower values of inertia. The values of these complex roots are quite far away from the real axis implying high oscillations in the transient response. This might make WTs incapable of providing FCP for low values of inertia. However, in such situations it might be required to change the droop settings of WTs. This issue is investigated later. Notice that the pole trajectory plots provide information on stability, but not information on peak frequency and attenuation. As peak frequency and attenuation depend both on inertia constant and droop, they should be studied together and not independently. This is especially relevant when system inertia is low and faster responses from generators are required. This can be obtained by reducing the droop. Therefore, impacts on frequency with varying inertia and droop are studied.
3.3. Varying Droop and Varying Inertia
In this study, H is varied from 1.5 s to 6 s while the droop R is varied from 2% to 6%. The success criteria for the FCP is considered to be containment of frequency to less than 51 Hz for overfrequency and greater than 49 Hz for underfrequency events.
Impacts of
R and
H on
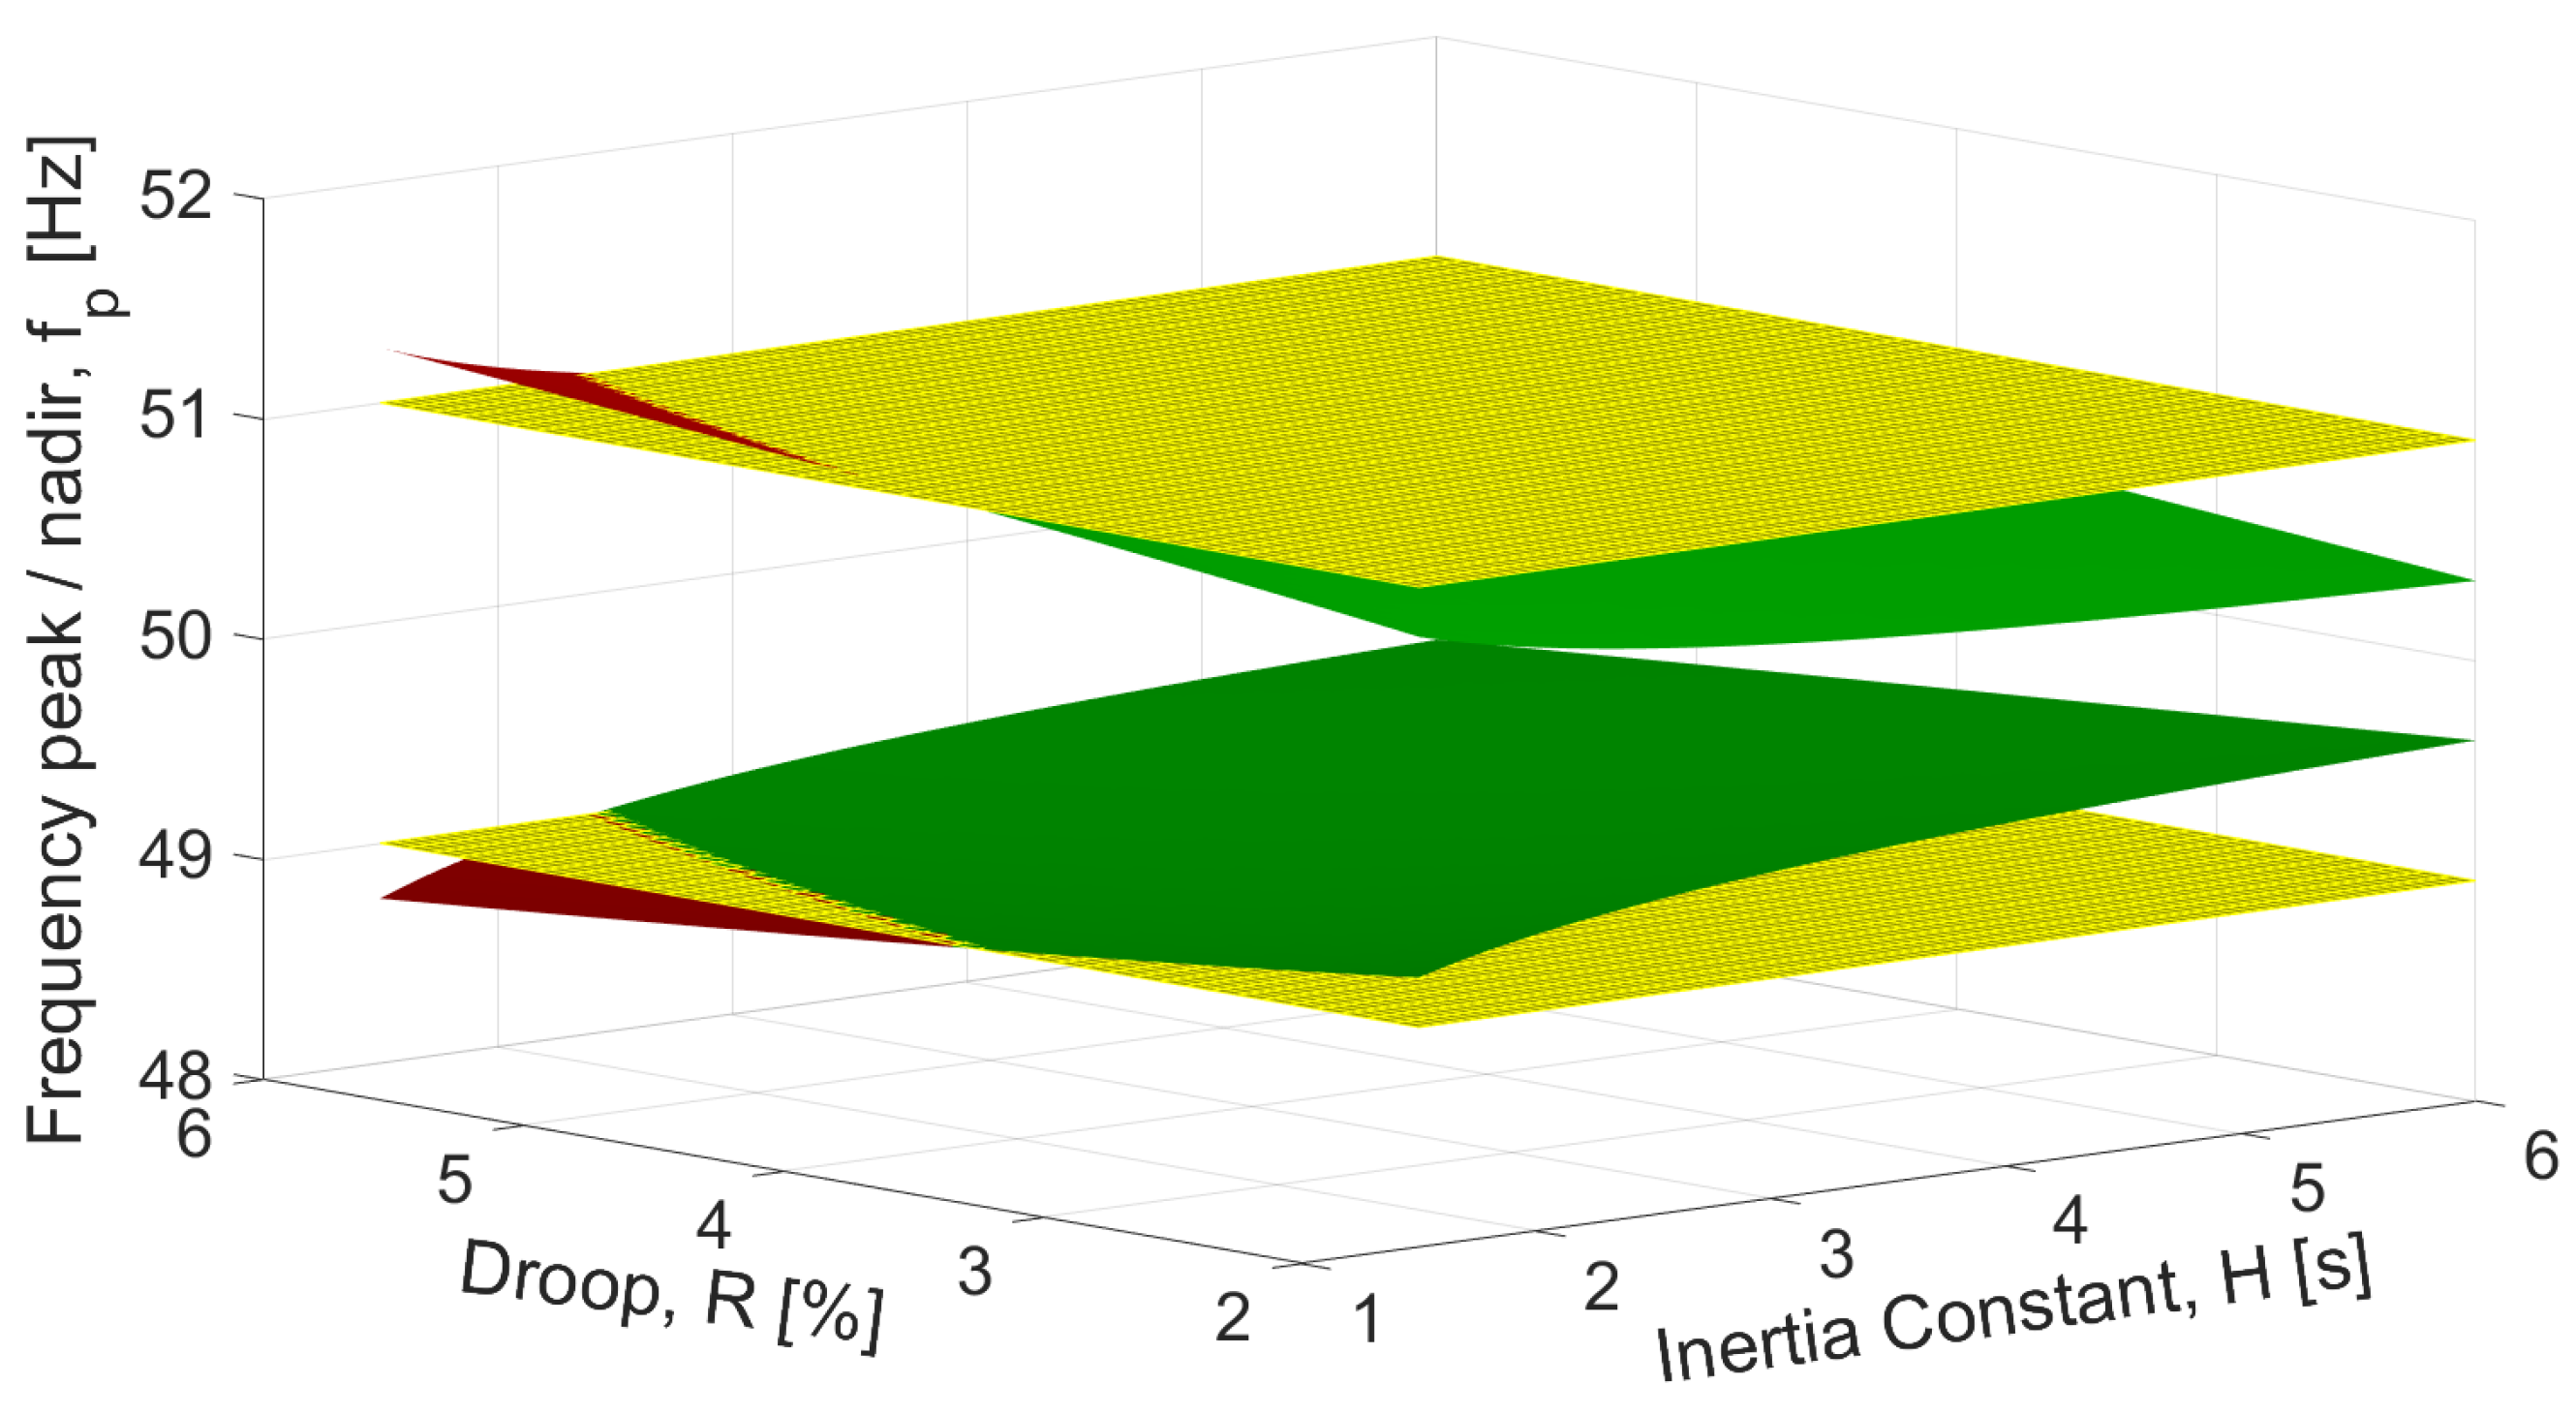
(based on first peak) for fossil steam generator is shown in
Figure 7. The yellow planes in
Figure 7 are the planes of 51 Hz and 49 Hz. Therefore, FCP is deemed successful when the
is between these yellow planes. These points are marked with green color while the points outside these planes are marked in red color. If inertia of the system is high (i.e., H = 6 s), droop of around 5% is enough for successful FCP. Decreasing inertia needs to be handled with decreasing droop. However, when the inertia is too low (i.e.,
) decreasing droop may not be enough to prevent frequency going outside the range of 49–51 Hz. Similar studies are performed for cross-compound steam generator and WT the result is shown in
Figure 8 and
Figure 9 respectively. For droop of 4% or lower, frequency always stays within 49–51 Hz for the studied disturbance of ±0.17 p.u. for cross-compound and for any values of
R for WT.
Impacts of droop and inertia constant on attenuation for cross-compound and fossil steam generators are studied as shown in
Figure 10. Attenuation of cross-compound generator are higher than fossil steam generator for higher droop and higher inertia. Meanwhile for lower droop and lower inertia, attenuation of cross-compound generator is lower than fossil steam generator. Remark that attenuation for cross-compound even can be negative when droop and inertia are lower than 3% and 2 s respectively as denoted by gray region in
Figure 10.
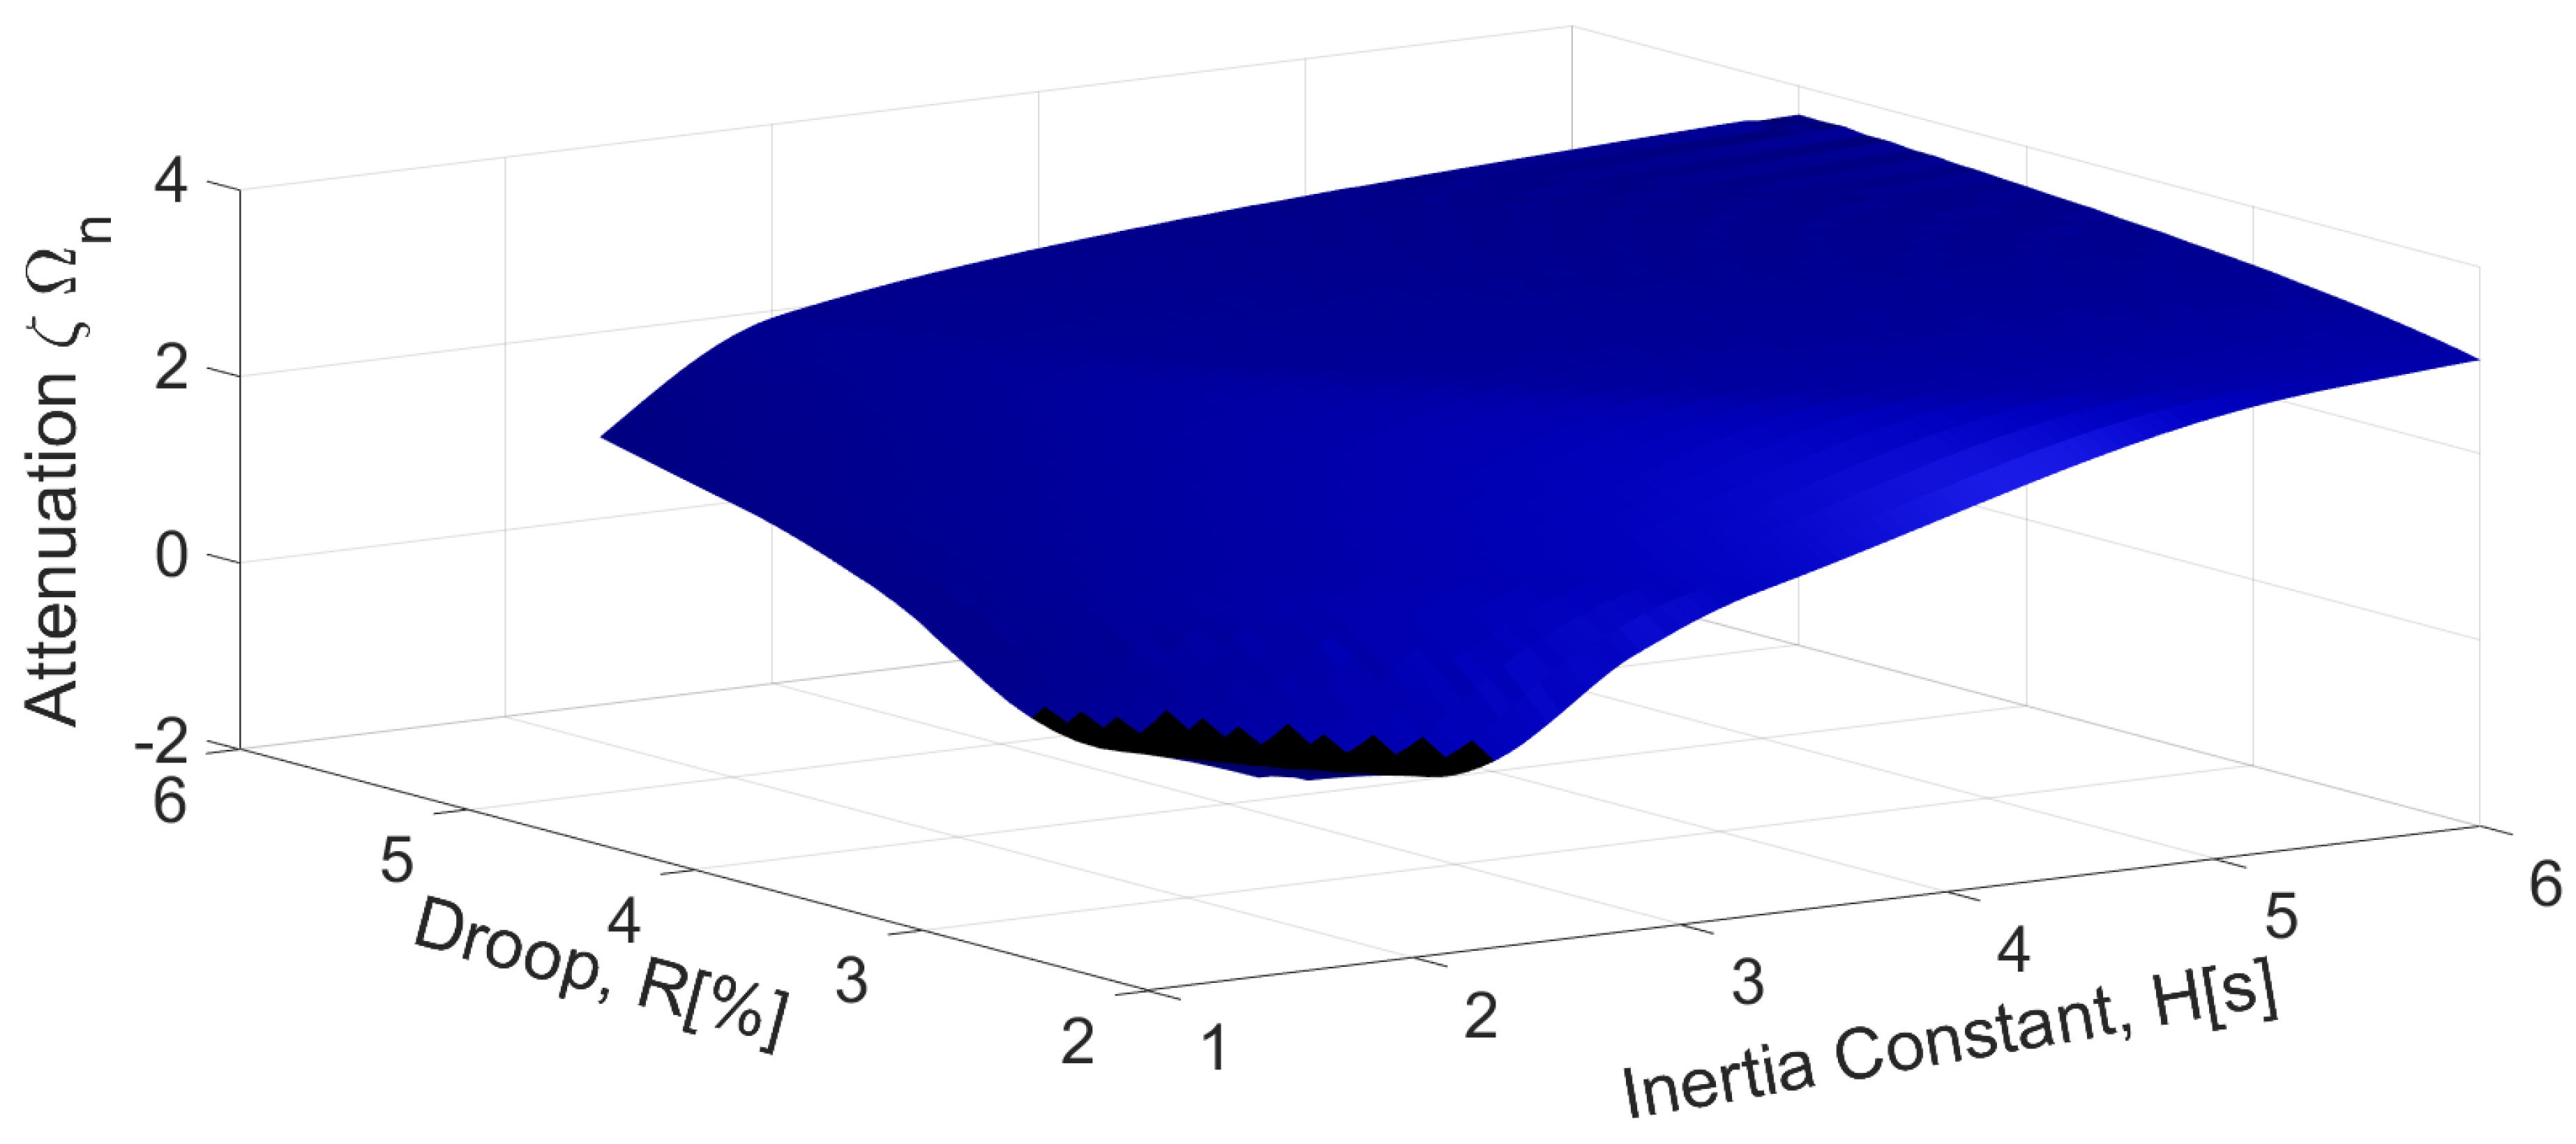
Figure 11 shows impacts of
R and
H on attenuation for WT. Notice that lower the droop and lower the inertia, attenuation is lower. Attenuation even becomes negative for very low value of inertia (
) and low droop (
). These results show that attenuation becomes limiting criteria for deciding droop for different value of inertia for WTs.
From the previous results, it can be understood that peak frequency and attenuation both play crucial role in deciding
R for different
H. Therefore, feasibility of reducing
R with decreasing
H is defined as limiting the first peak frequency
within 49–51 Hz as well as limiting the damping ratio
higher than 0.4.
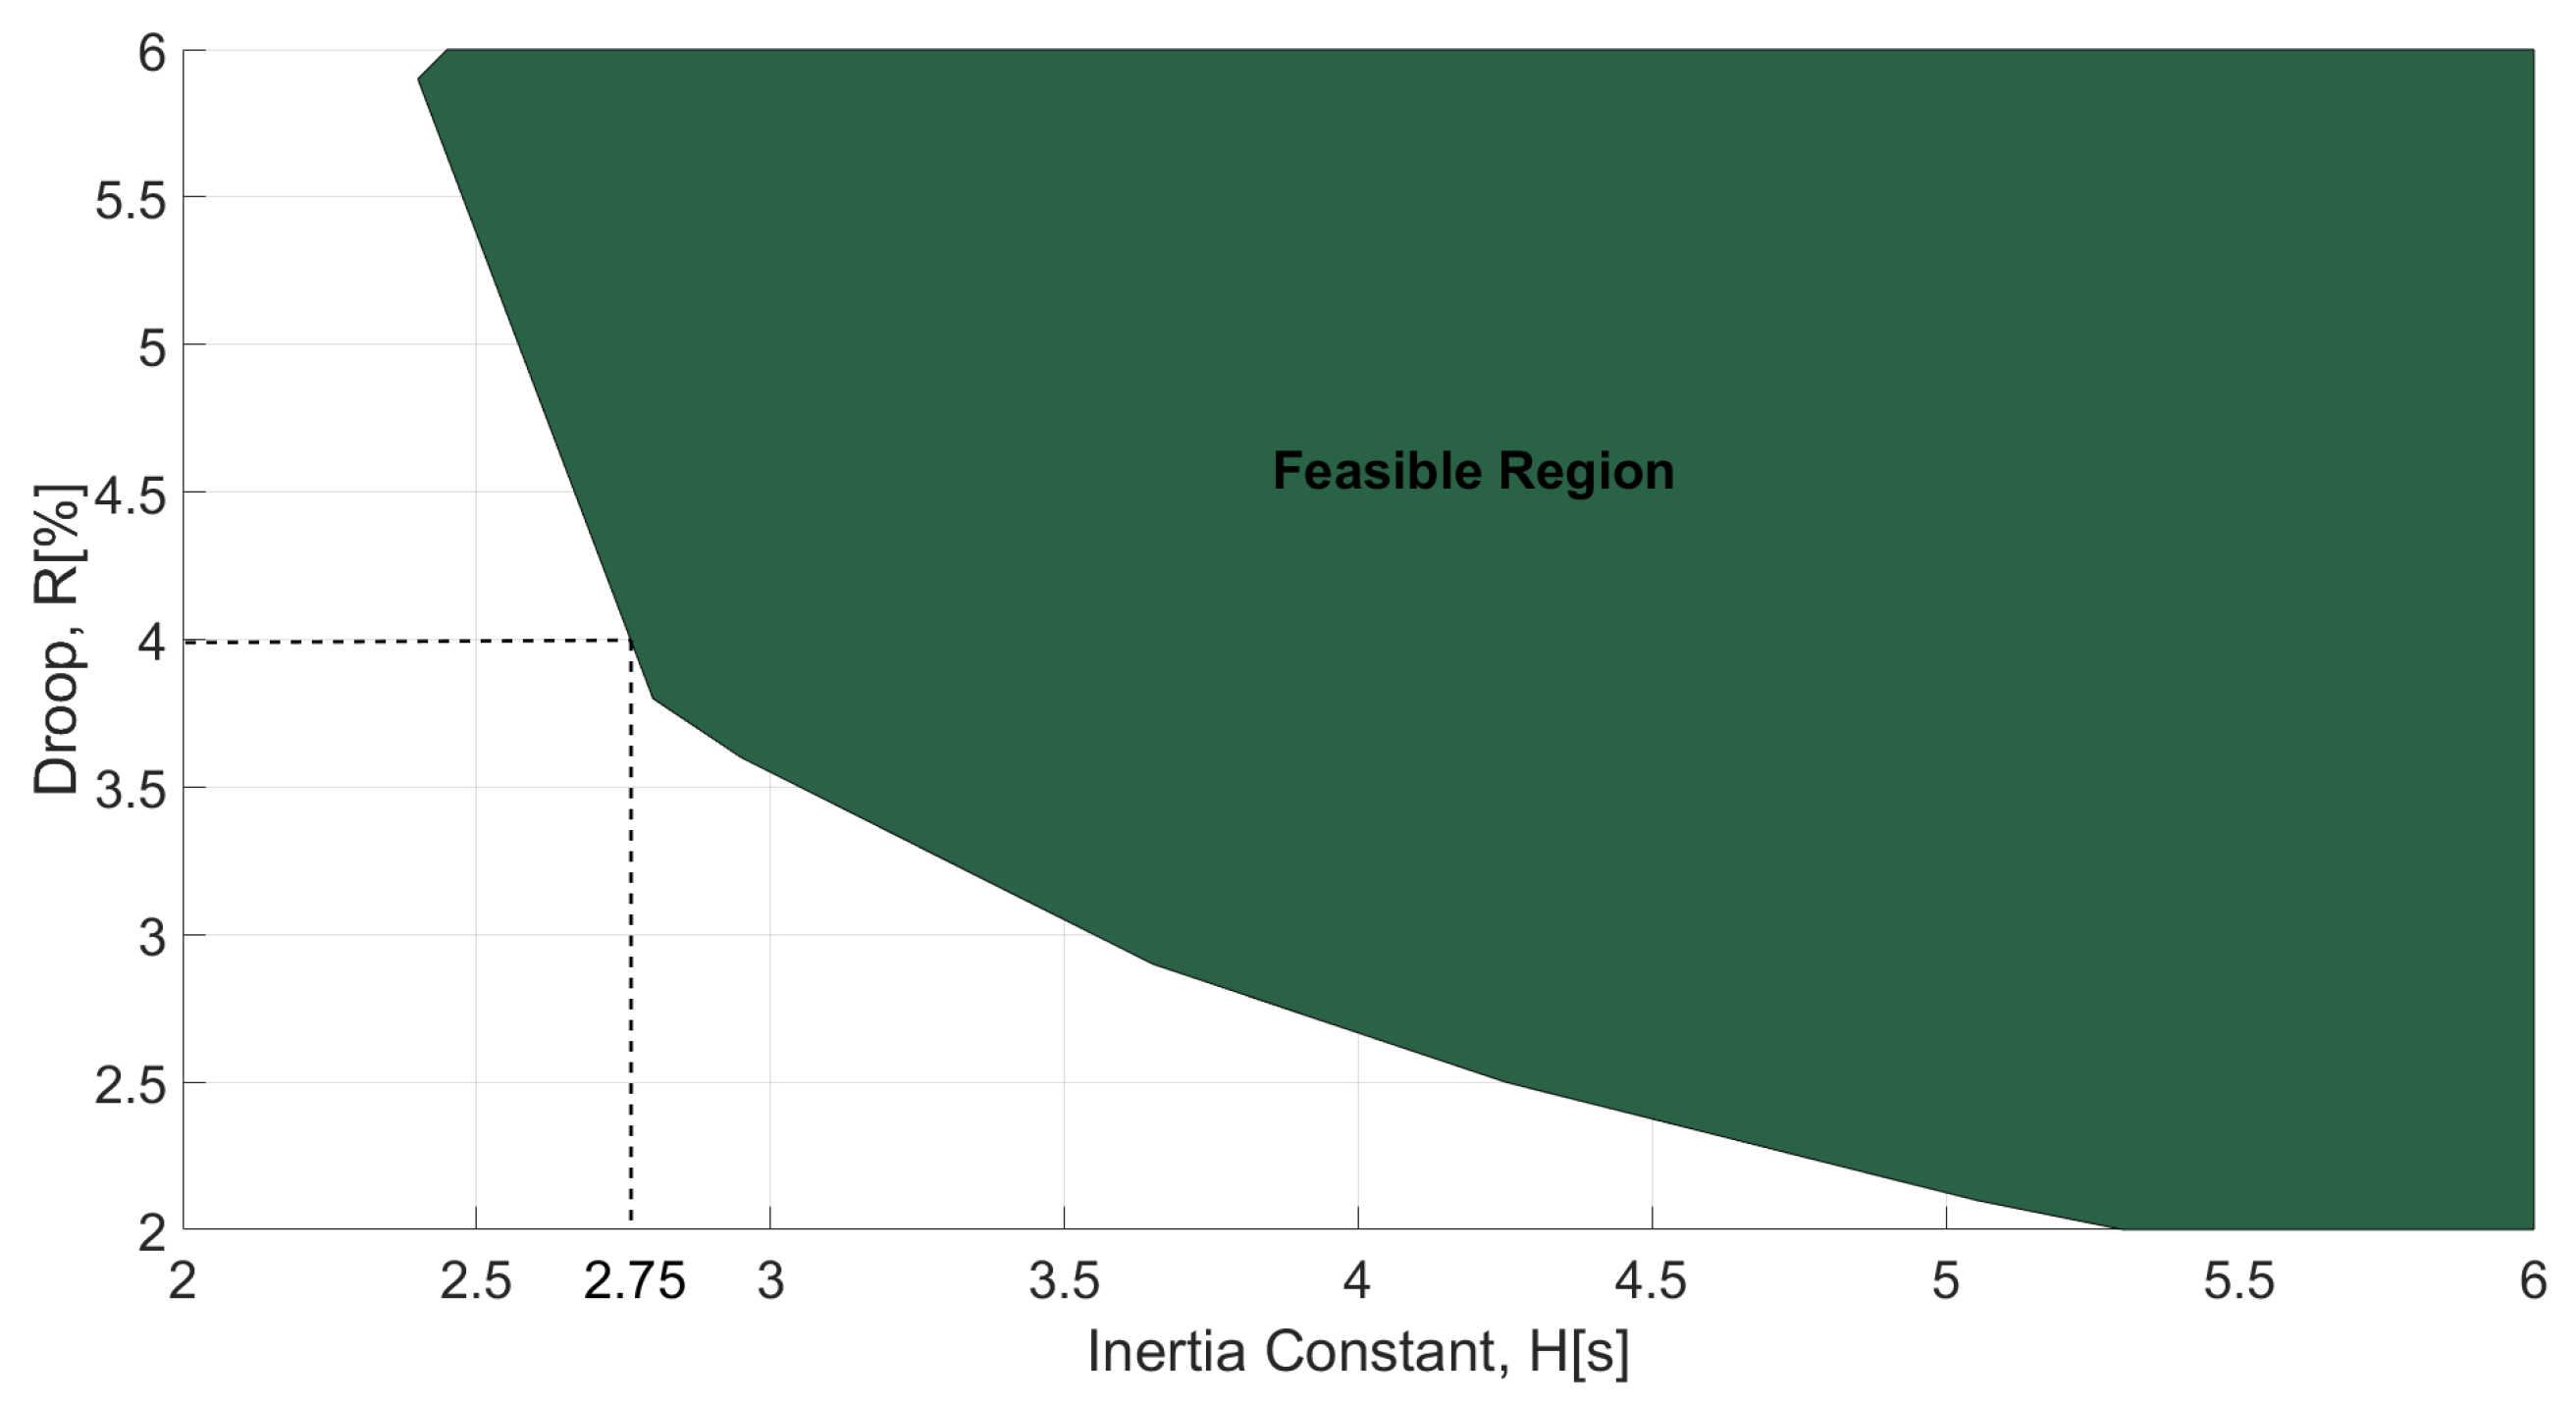
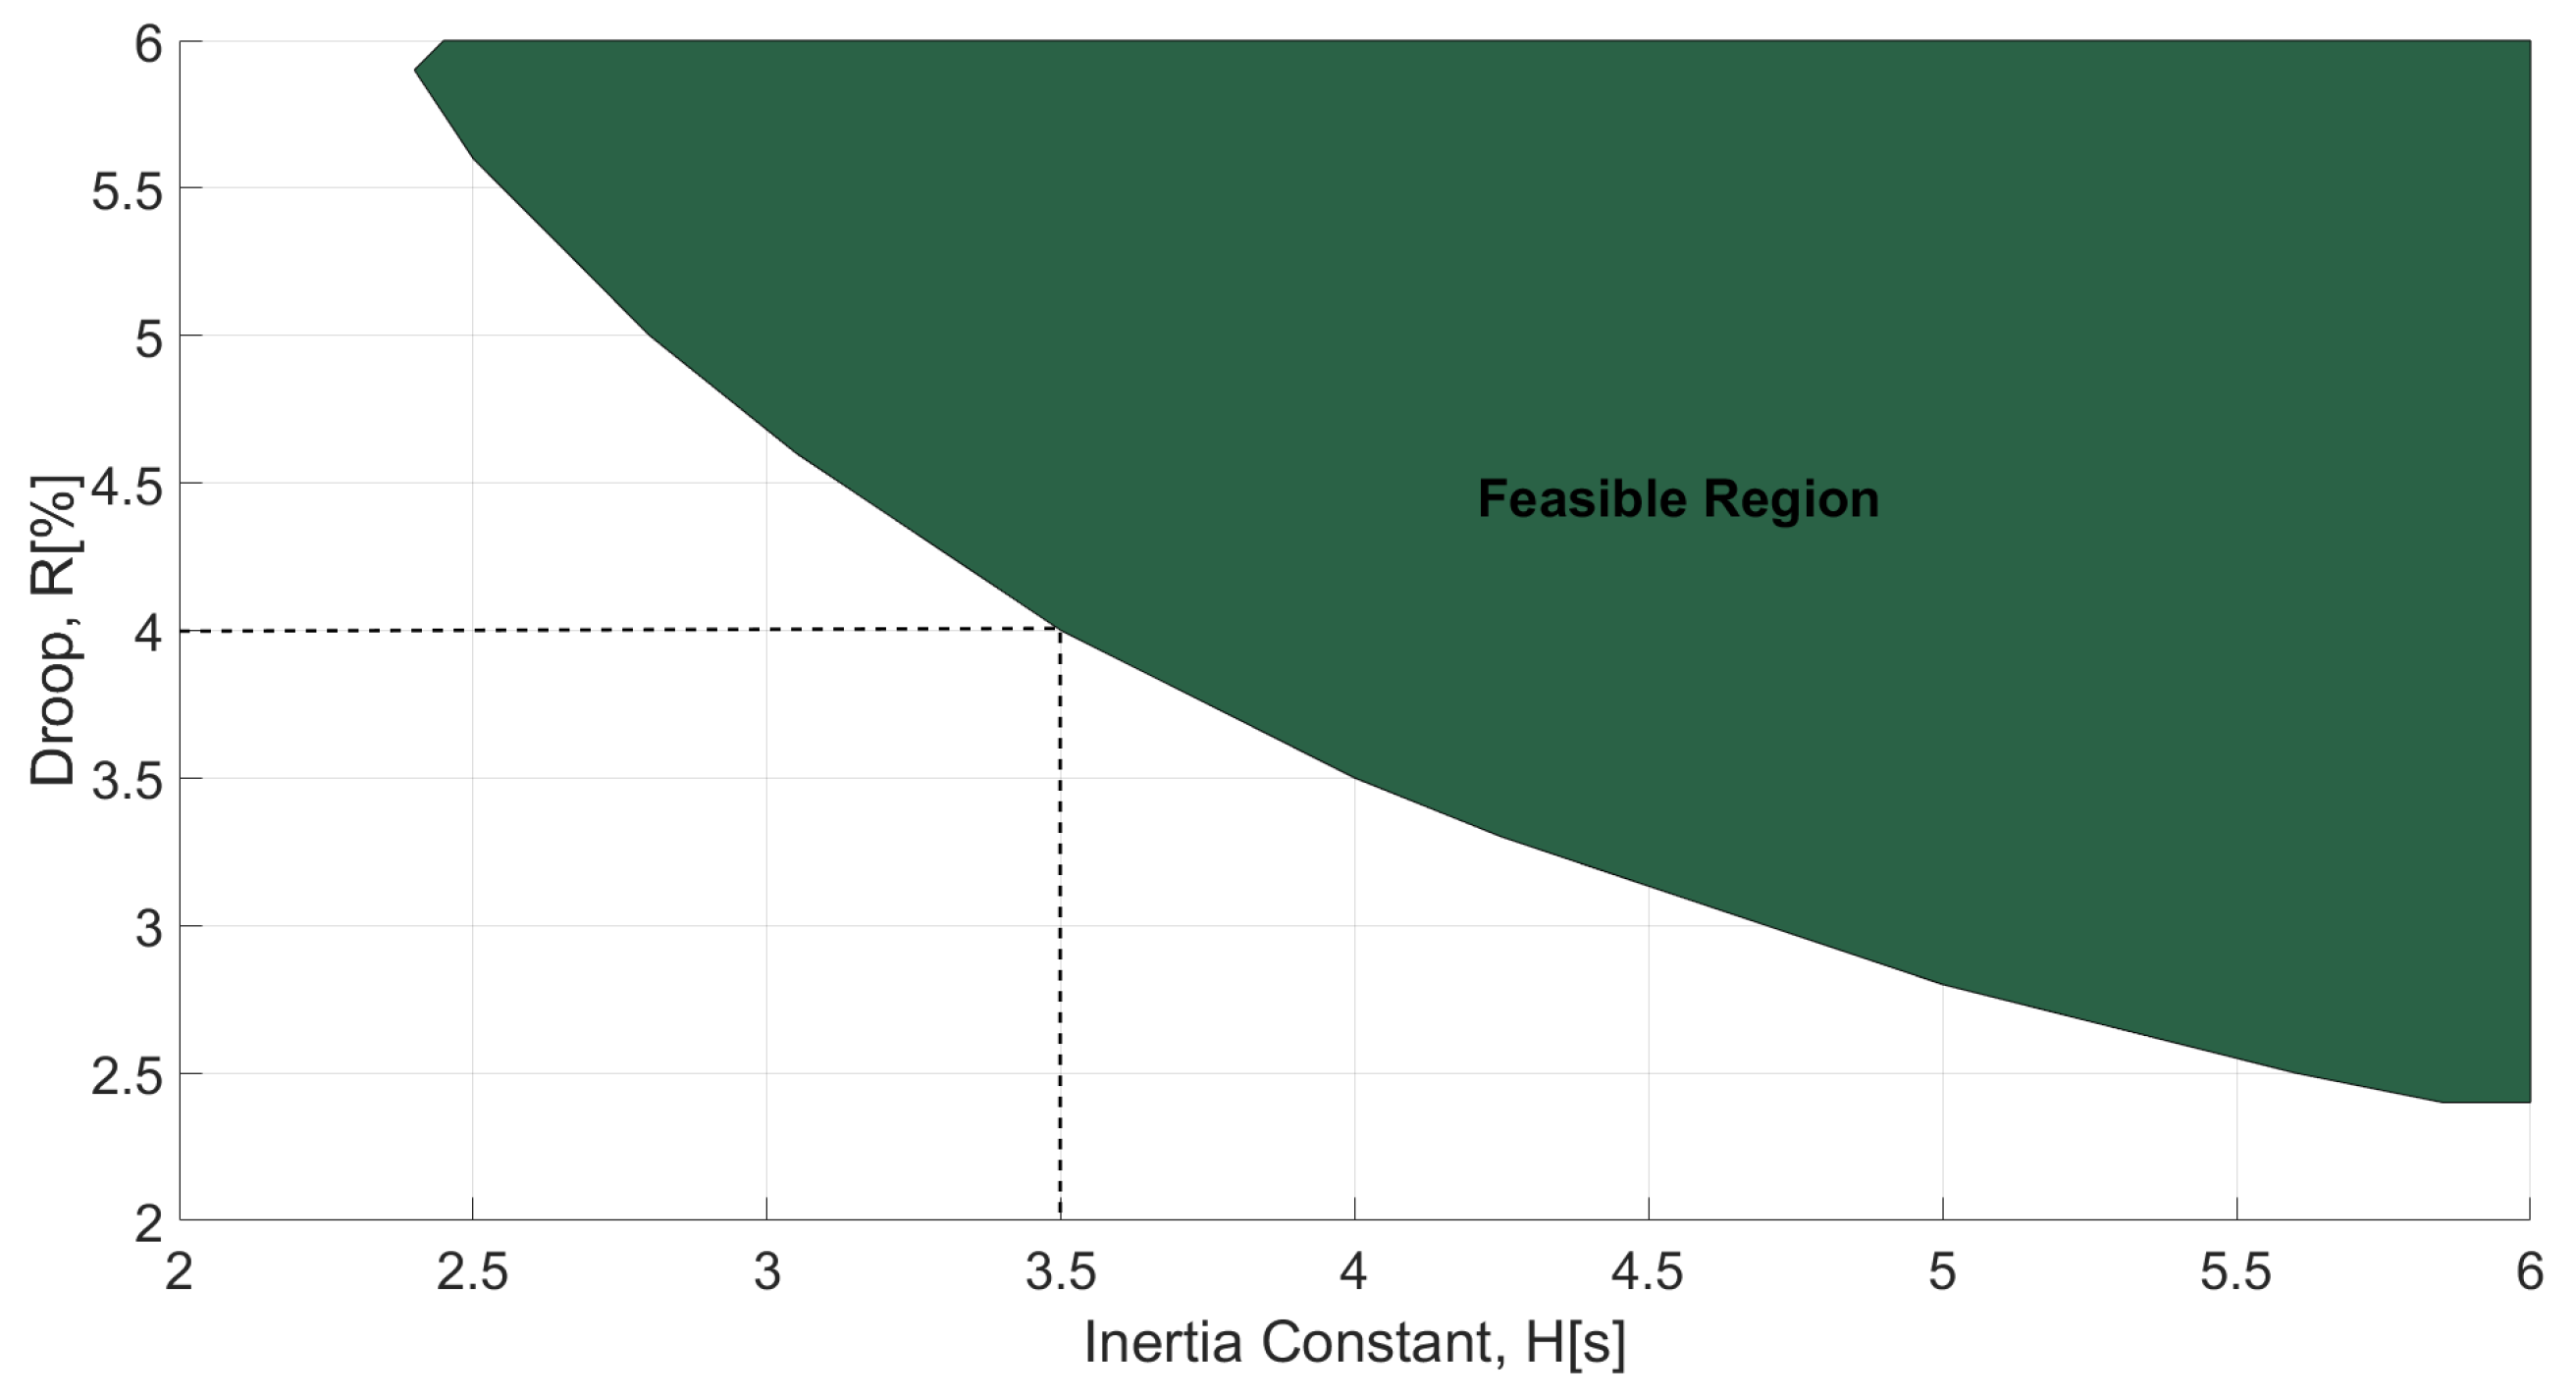
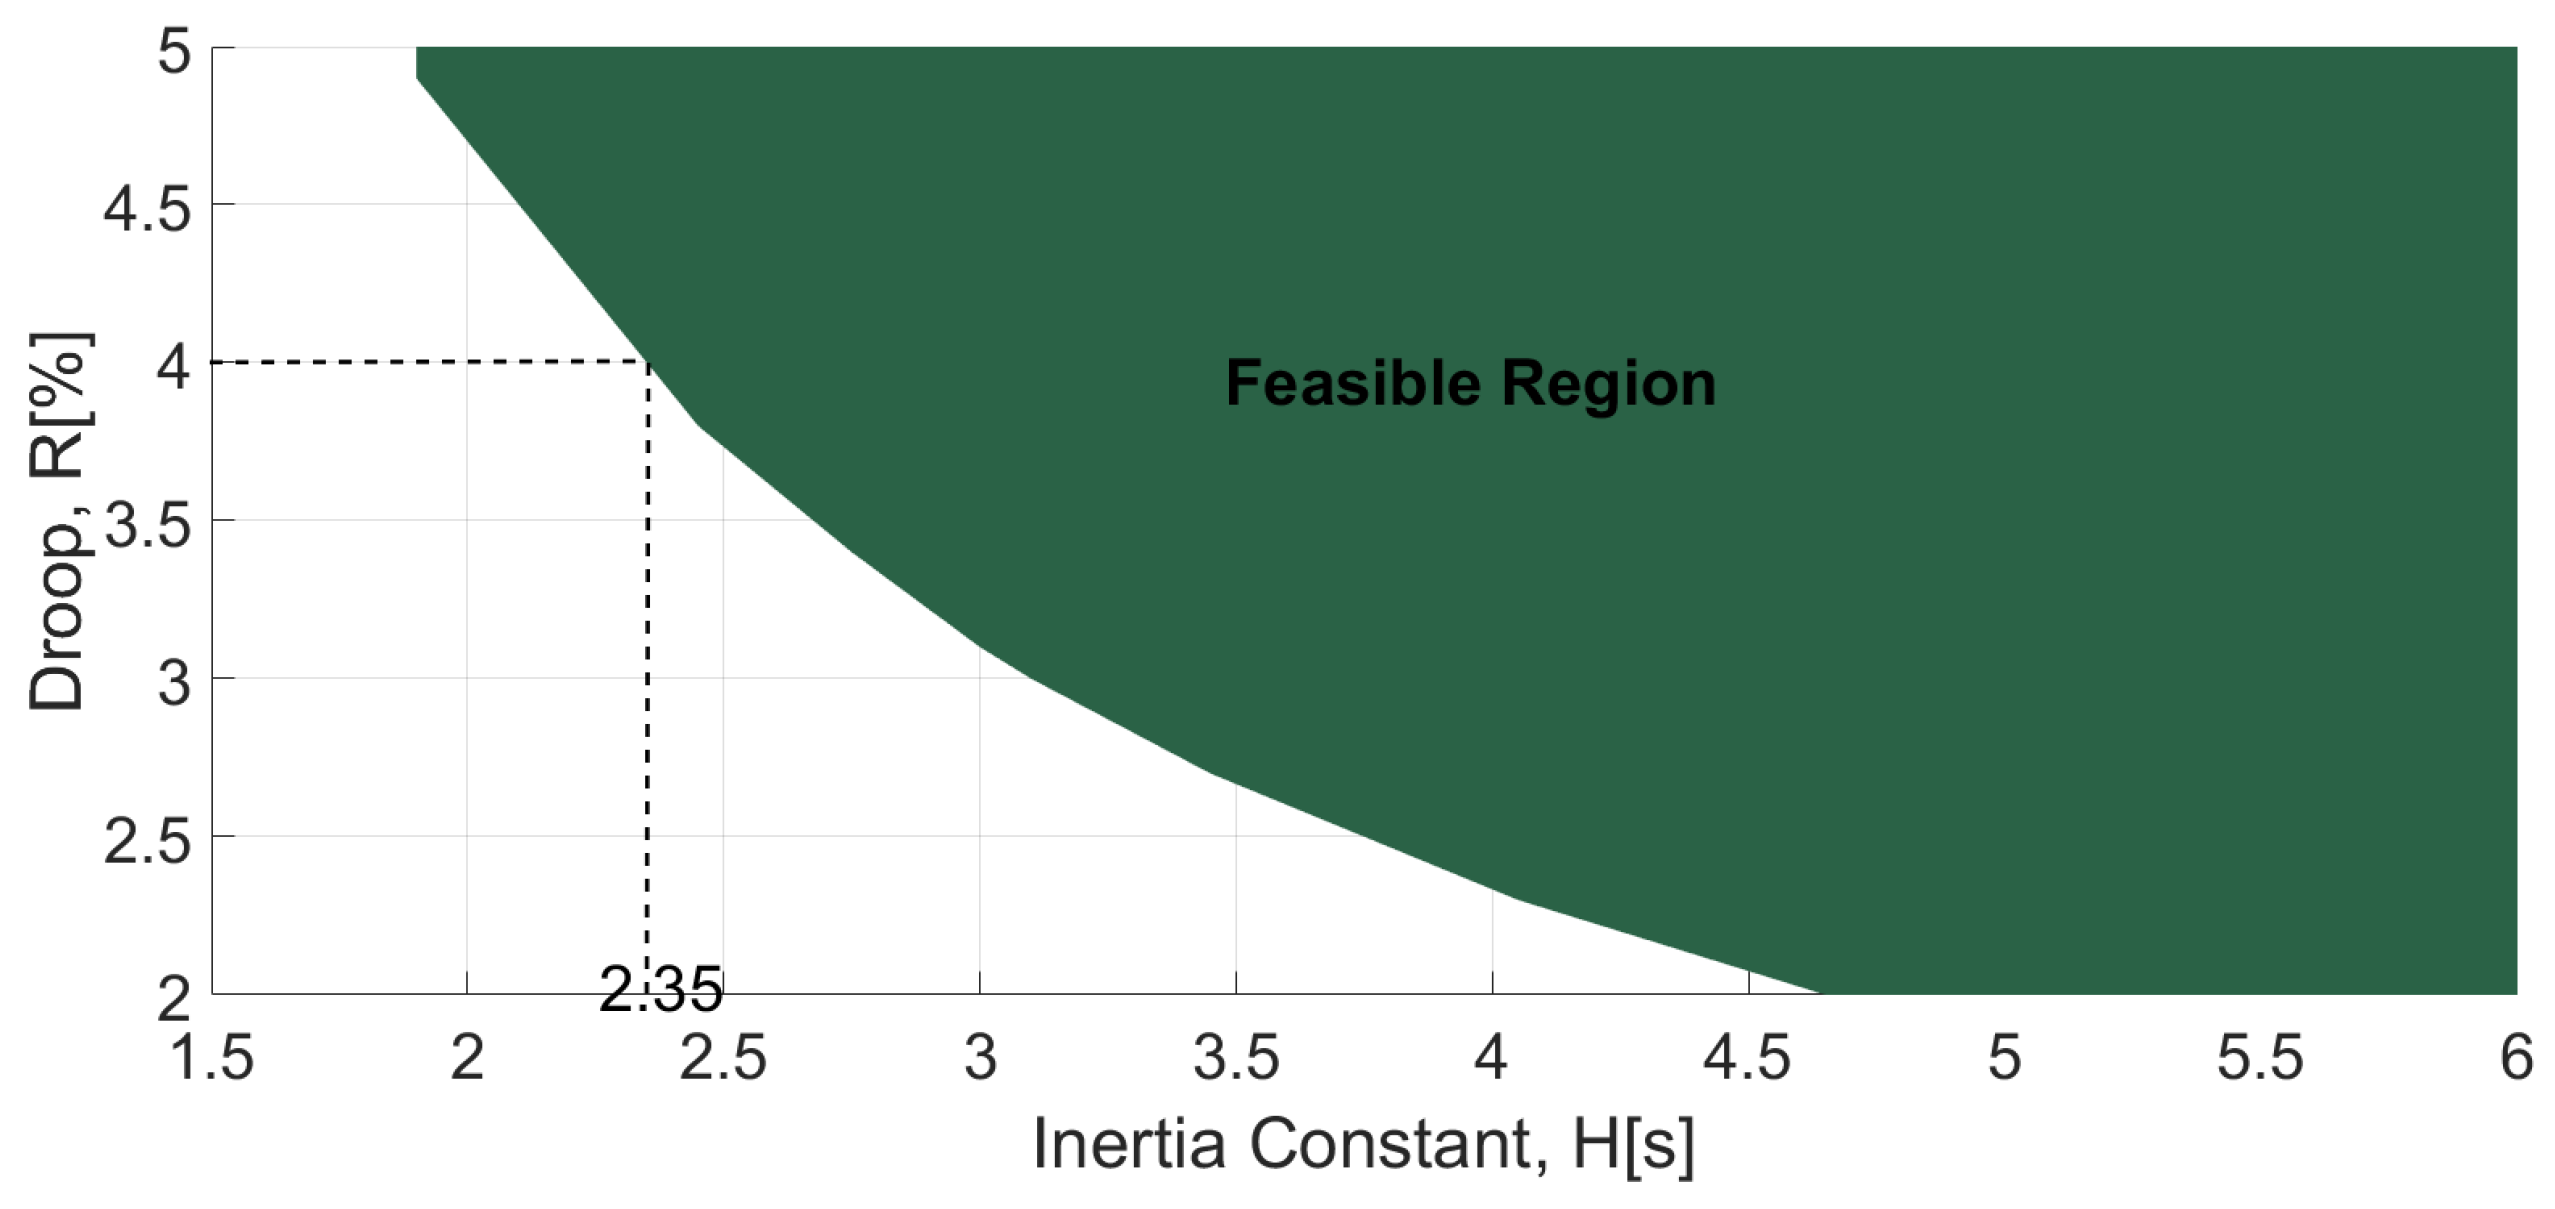
Figure 12,
Figure 13 and
Figure 14 show the feasibility of different
R for different
H for fossil, cross-compound steam generator, and WT. This study is especially important because it gives counter-intuitive result that for lower inertia values the droop should be higher to prevent oscillatory instability. Furthermore, it can be observed that if droop is fixed at 4%, WT can allow for operation with lower
H than the other generators. Operating at 4% droop, minimum
H possible for fossil steam generator is 2.75 s, while for cross-compound steam generator it is 3.5 s. WT allows operation with
H down to 2.35 s for
. This shows that WT can be attractive choice for providing FCP in future system with low inertia.
All the above case studies show the importance of mathematical model for designing of FCP and choosing correct type of technology. This mathematical model also helps in specifying the parameters for different generators for provision of FCP.
4. Case Study—UCTE Disturbance on 4 November 2006
The sensitivity studies described above are meant to compare the feasibility of different technologies for providing FCP. However, in a large power system, many different technologies will provide FCP support at the same time. Another simplification used for better understanding was the use of generic model in the sensitivity studies. Therefore, in the considered case study, detailed generator models are used for a large realistic power system to validate the applicability of the proposed methodology.
The disturbance on 4 November 2006 at the “Union for the Co-ordination of Transmission of Electricity” (UCTE) network is one of the most important phenomena seen related to cascading overload phenomena leading to splitting of the network and large frequency deviations. Tripping of a 380 kV line due to overload and other cascading trippings led to the final separation of the entire UCTE network into three islands [
29]. The countries in the Western part were in power deficiency situation of about 9 GW. That led to a frequency drop down to about 49 Hz stopped by automatic load-shedding and by tripping of pumping storage units. The countries in the North-Eastern area encountered a surplus of generation. The value of frequency was over 50.5 Hz as shown in
Figure 15. This area had around 10% wind power penetration which were being disconnected and reconnected arbitrarily. Conventional generators were mainly responsible for providing frequency support through FCP and emergency control.
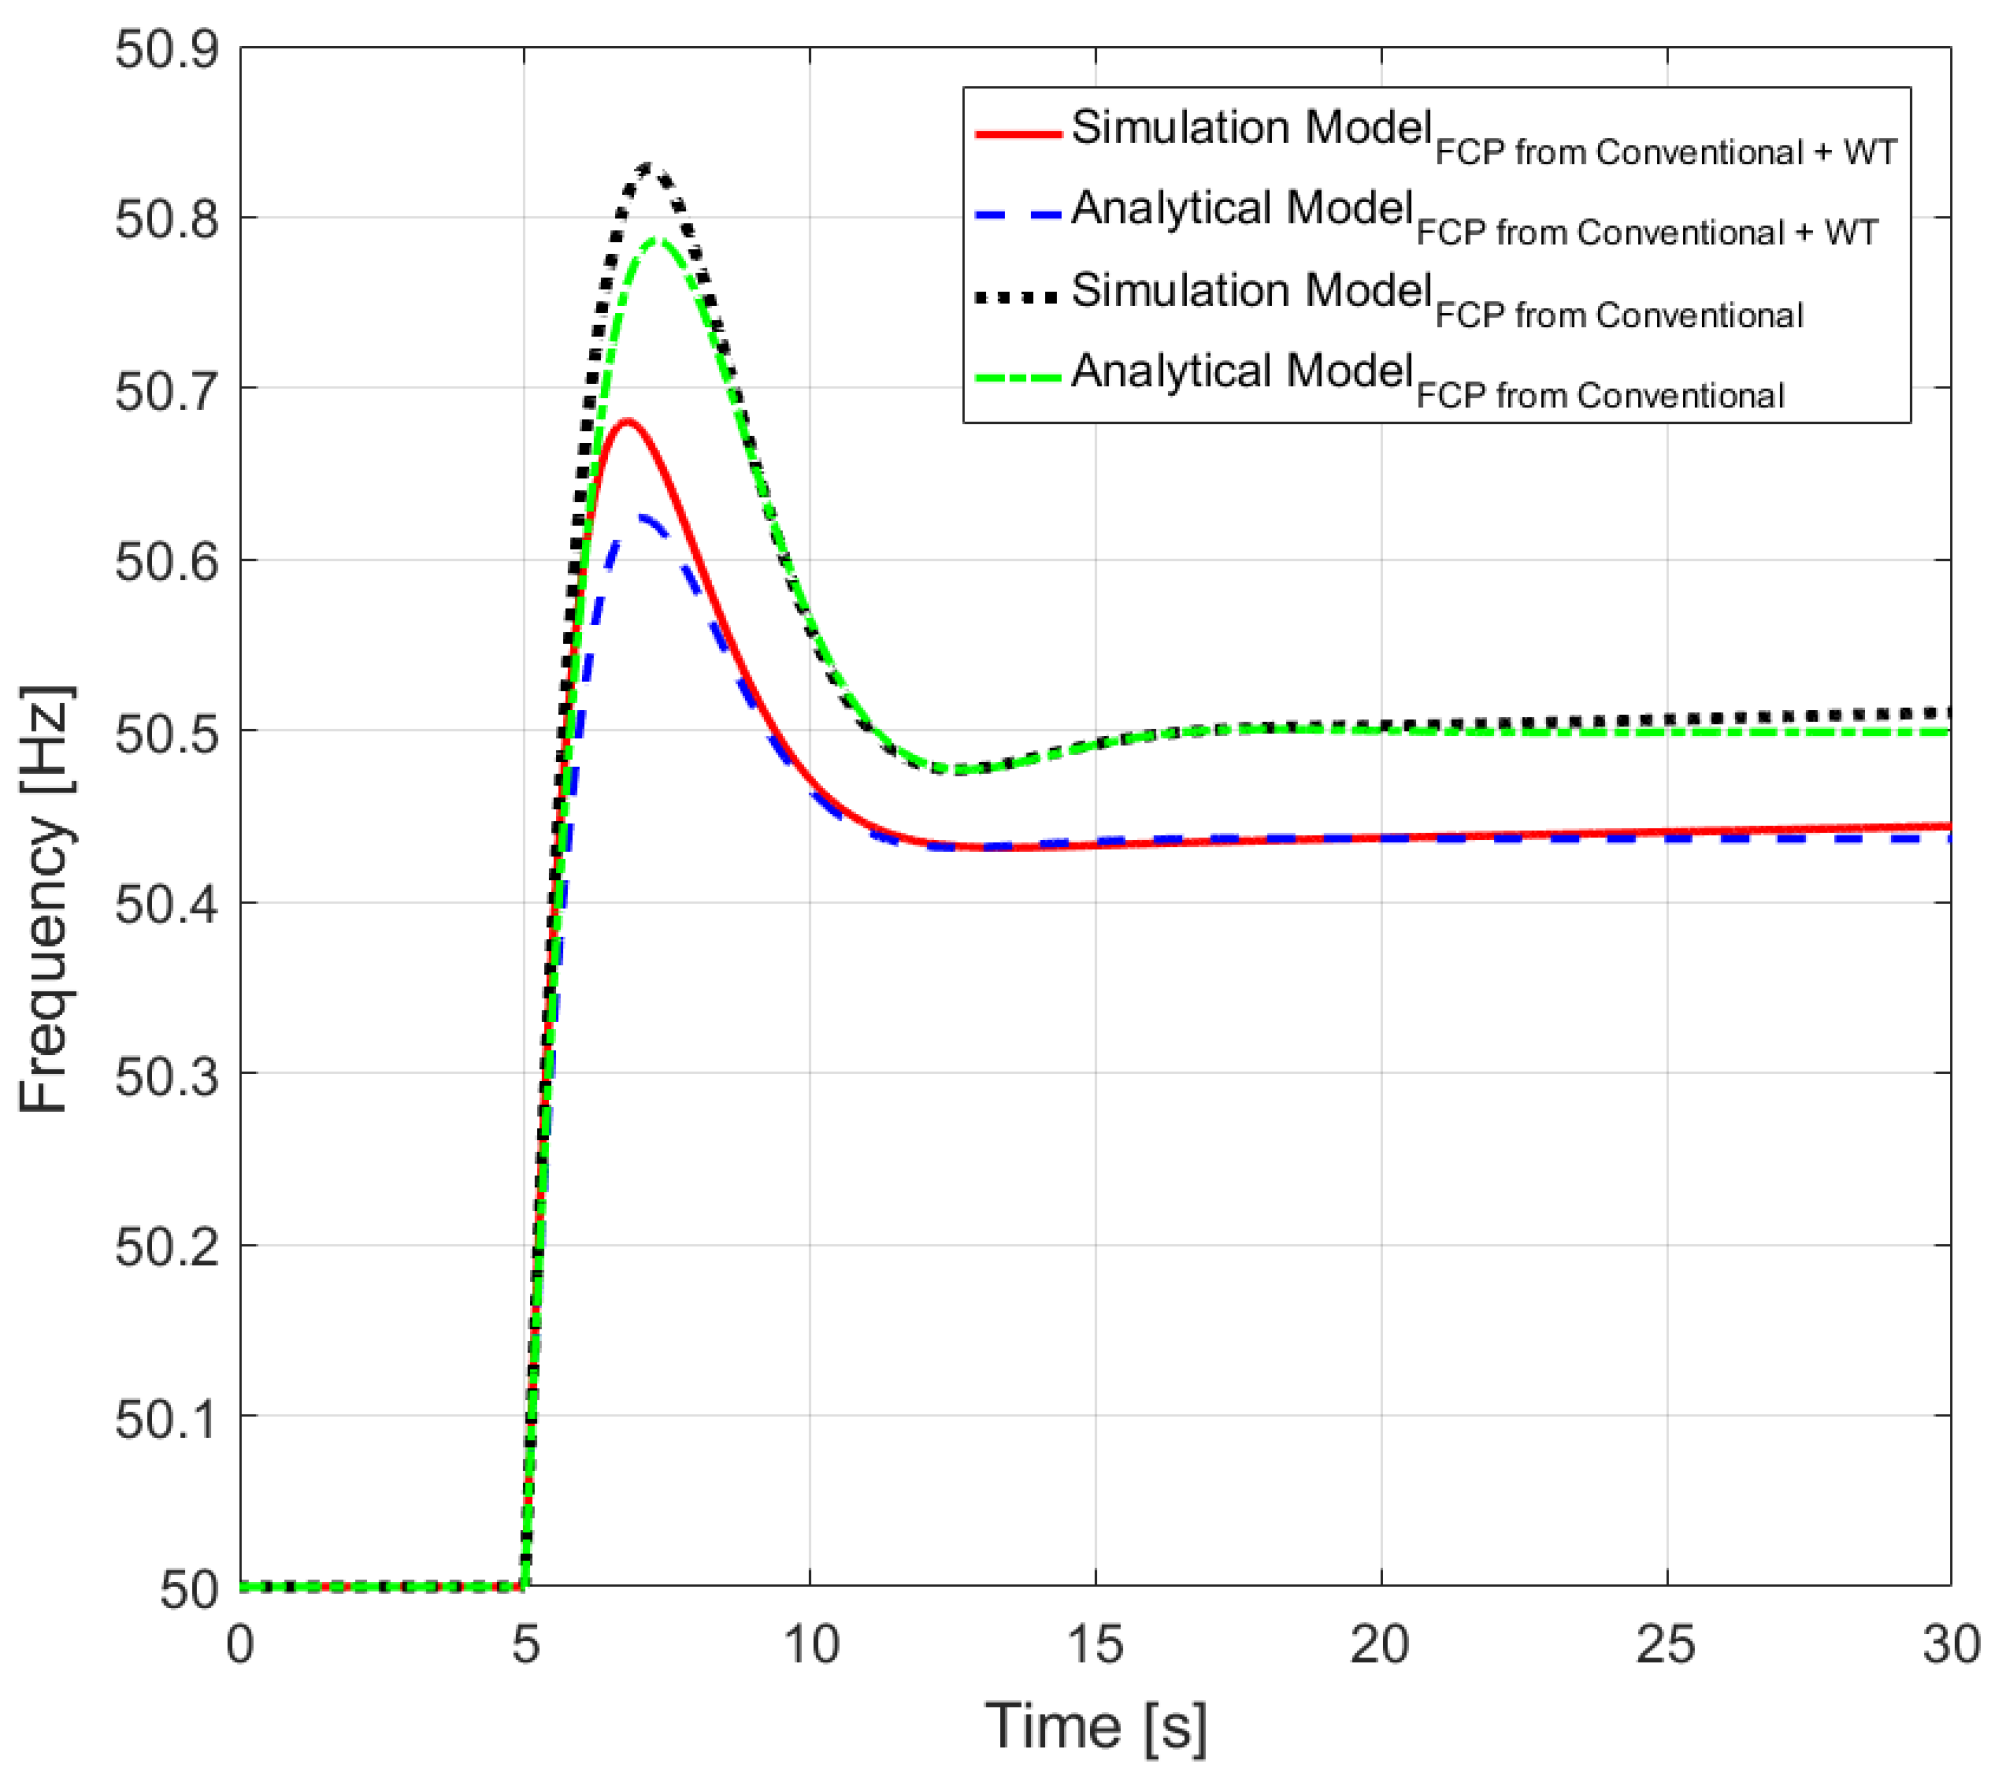
Current grid code requirements require WTs to stay connected up to 51.5 Hz. Therefore, scenario is simulated where WTs are not unintentionally disconnected as shown in
Figure 16.
Figure 16 shows that response from WTs along with conventional generators can improve the frequency response. Peak frequency reaches 50.8 Hz when FCP support is only provided by conventional generators, while peak frequency reduces 50.68 Hz when FCP support is provided from WT together with conventional generators. The reason for this is that FCP support from WTs is much faster than that of conventional generator. It also depicts that analytical model provides similar results as compared to detailed simulation model (PEGASE model [
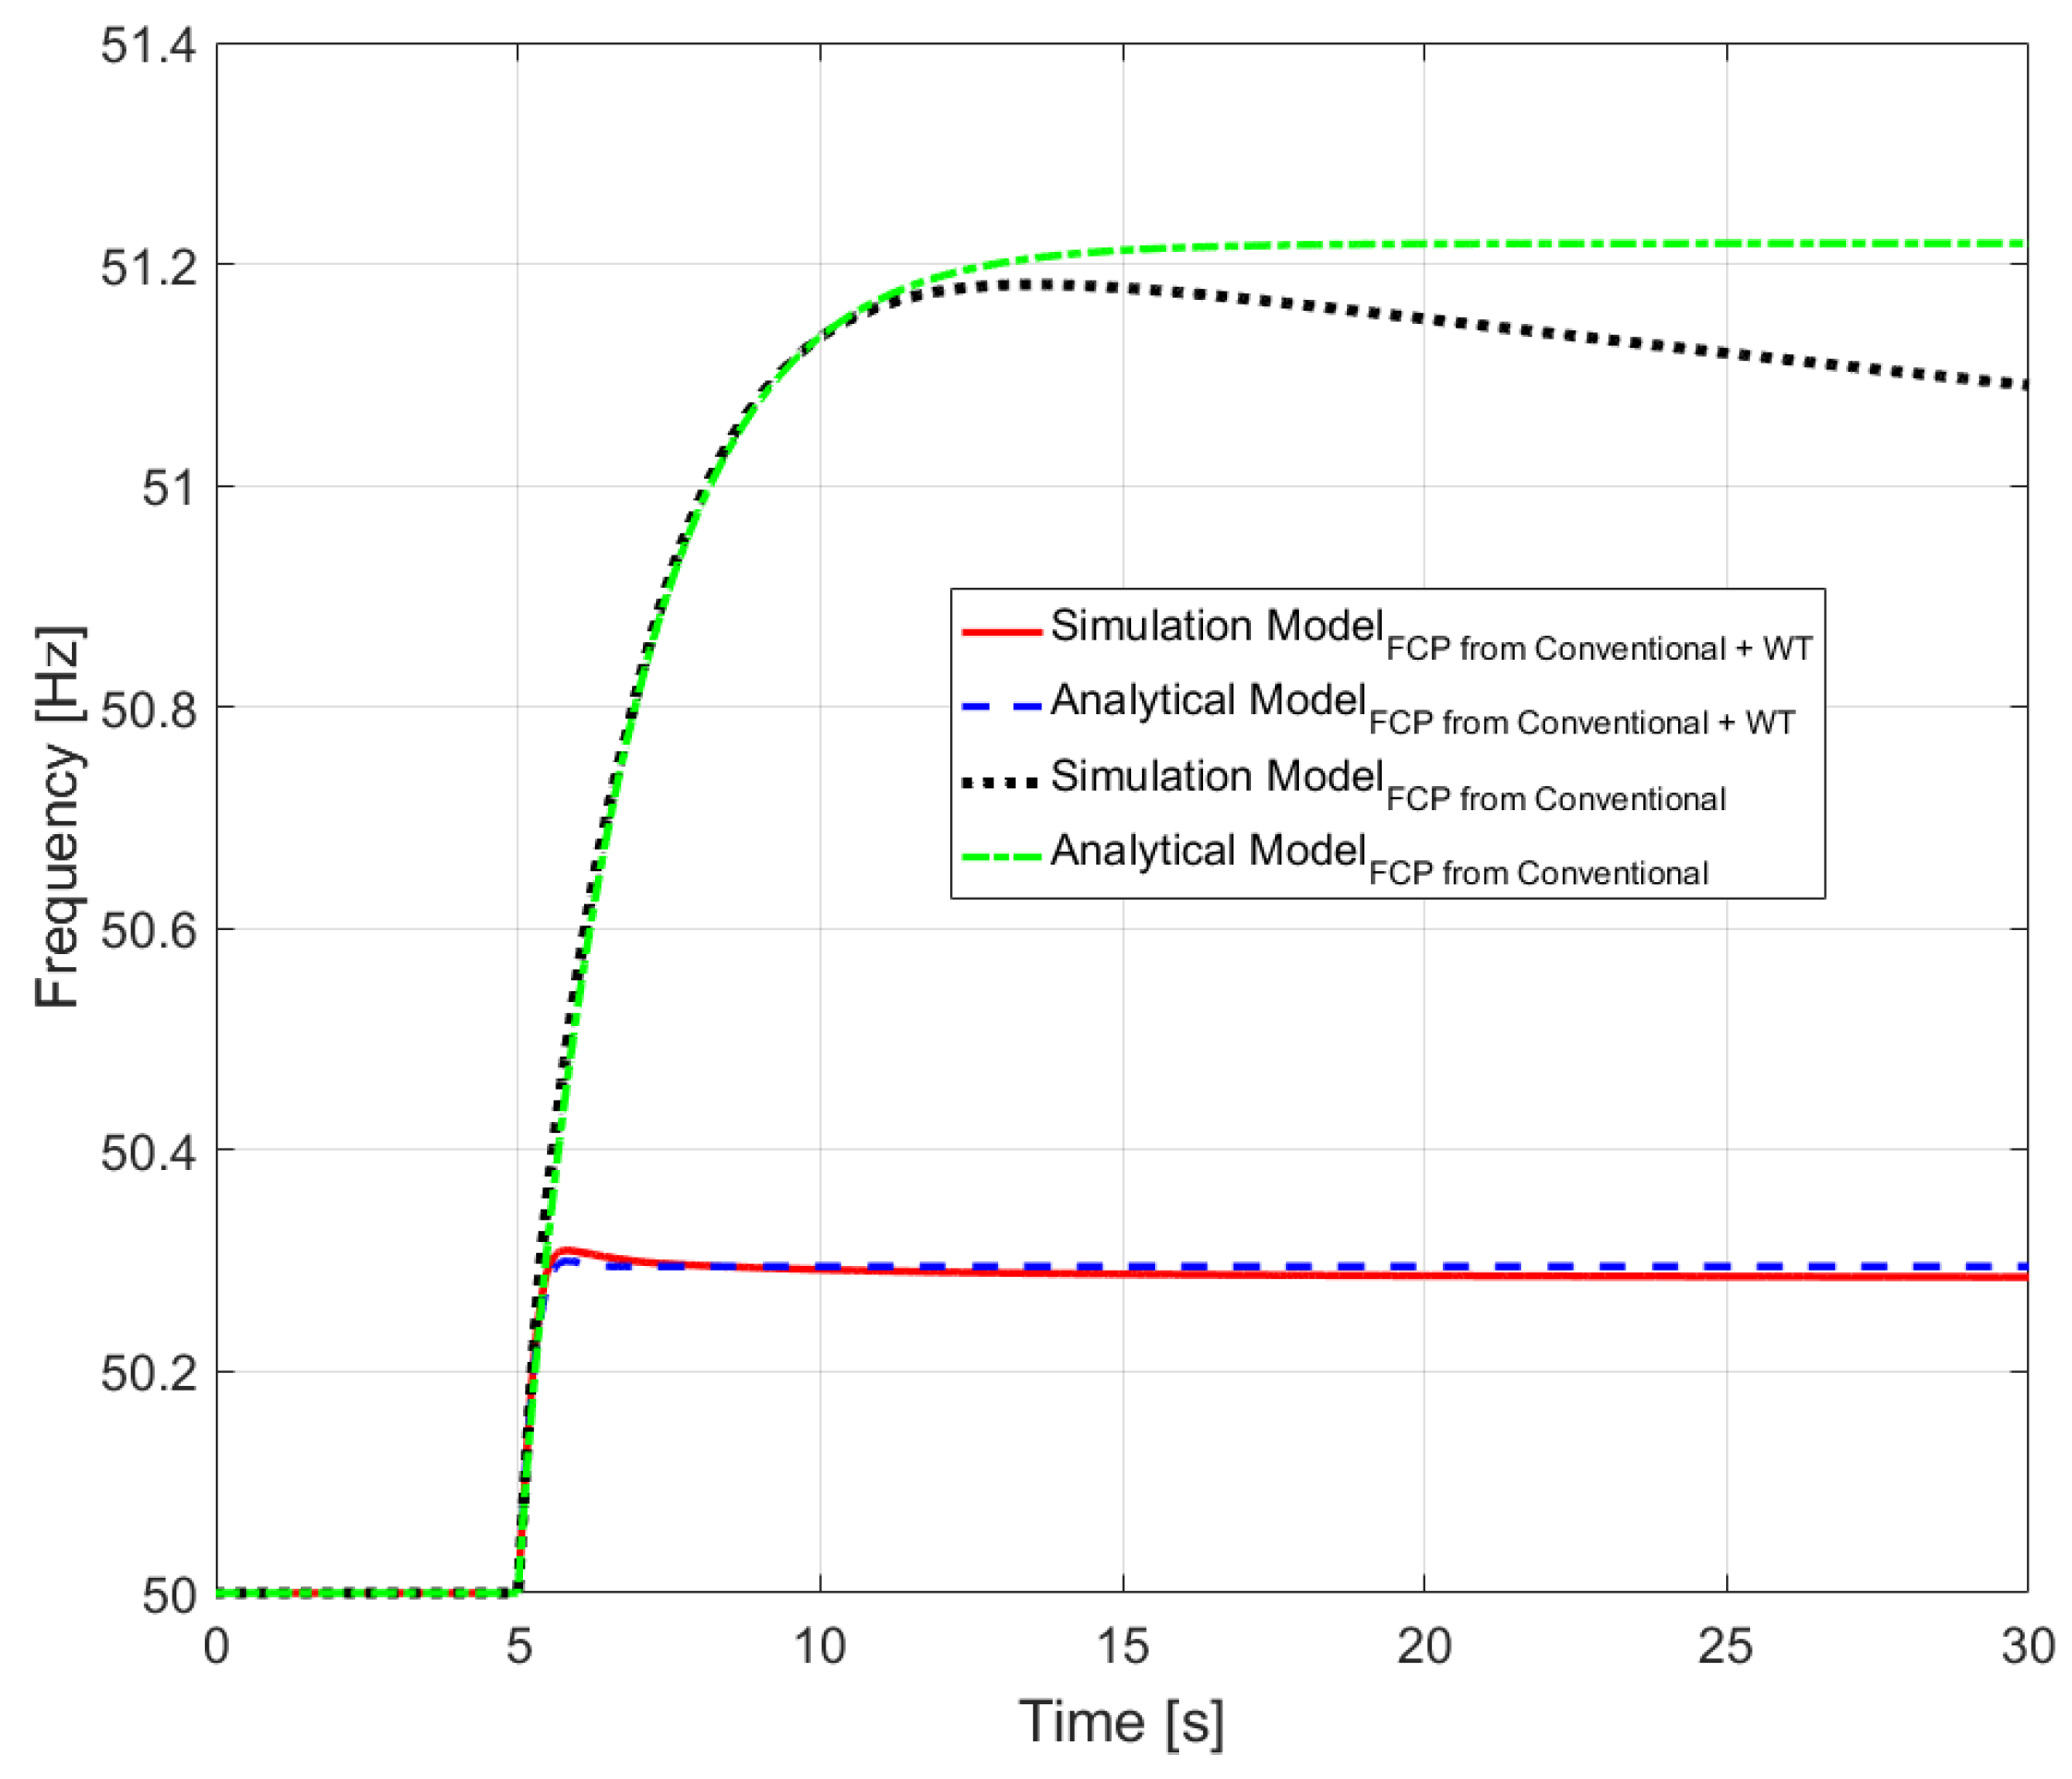
31]). The difference in peak value is due to the impact of frequency dead-band. To study the impact of frequency support from WTs for future power systems, wind power penetration is increased in these models to 40%. Frequency response in the system with 40% wind penetration is shown in
Figure 17. It shows
is substantially reduced with additional FCP support from WTs.Peak frequency reaches 51.2 Hz when FCP support is only provided by conventional generators, while peak frequency reduces 50.3 Hz when FCP support is provided from WT together with conventional generators. However, not only
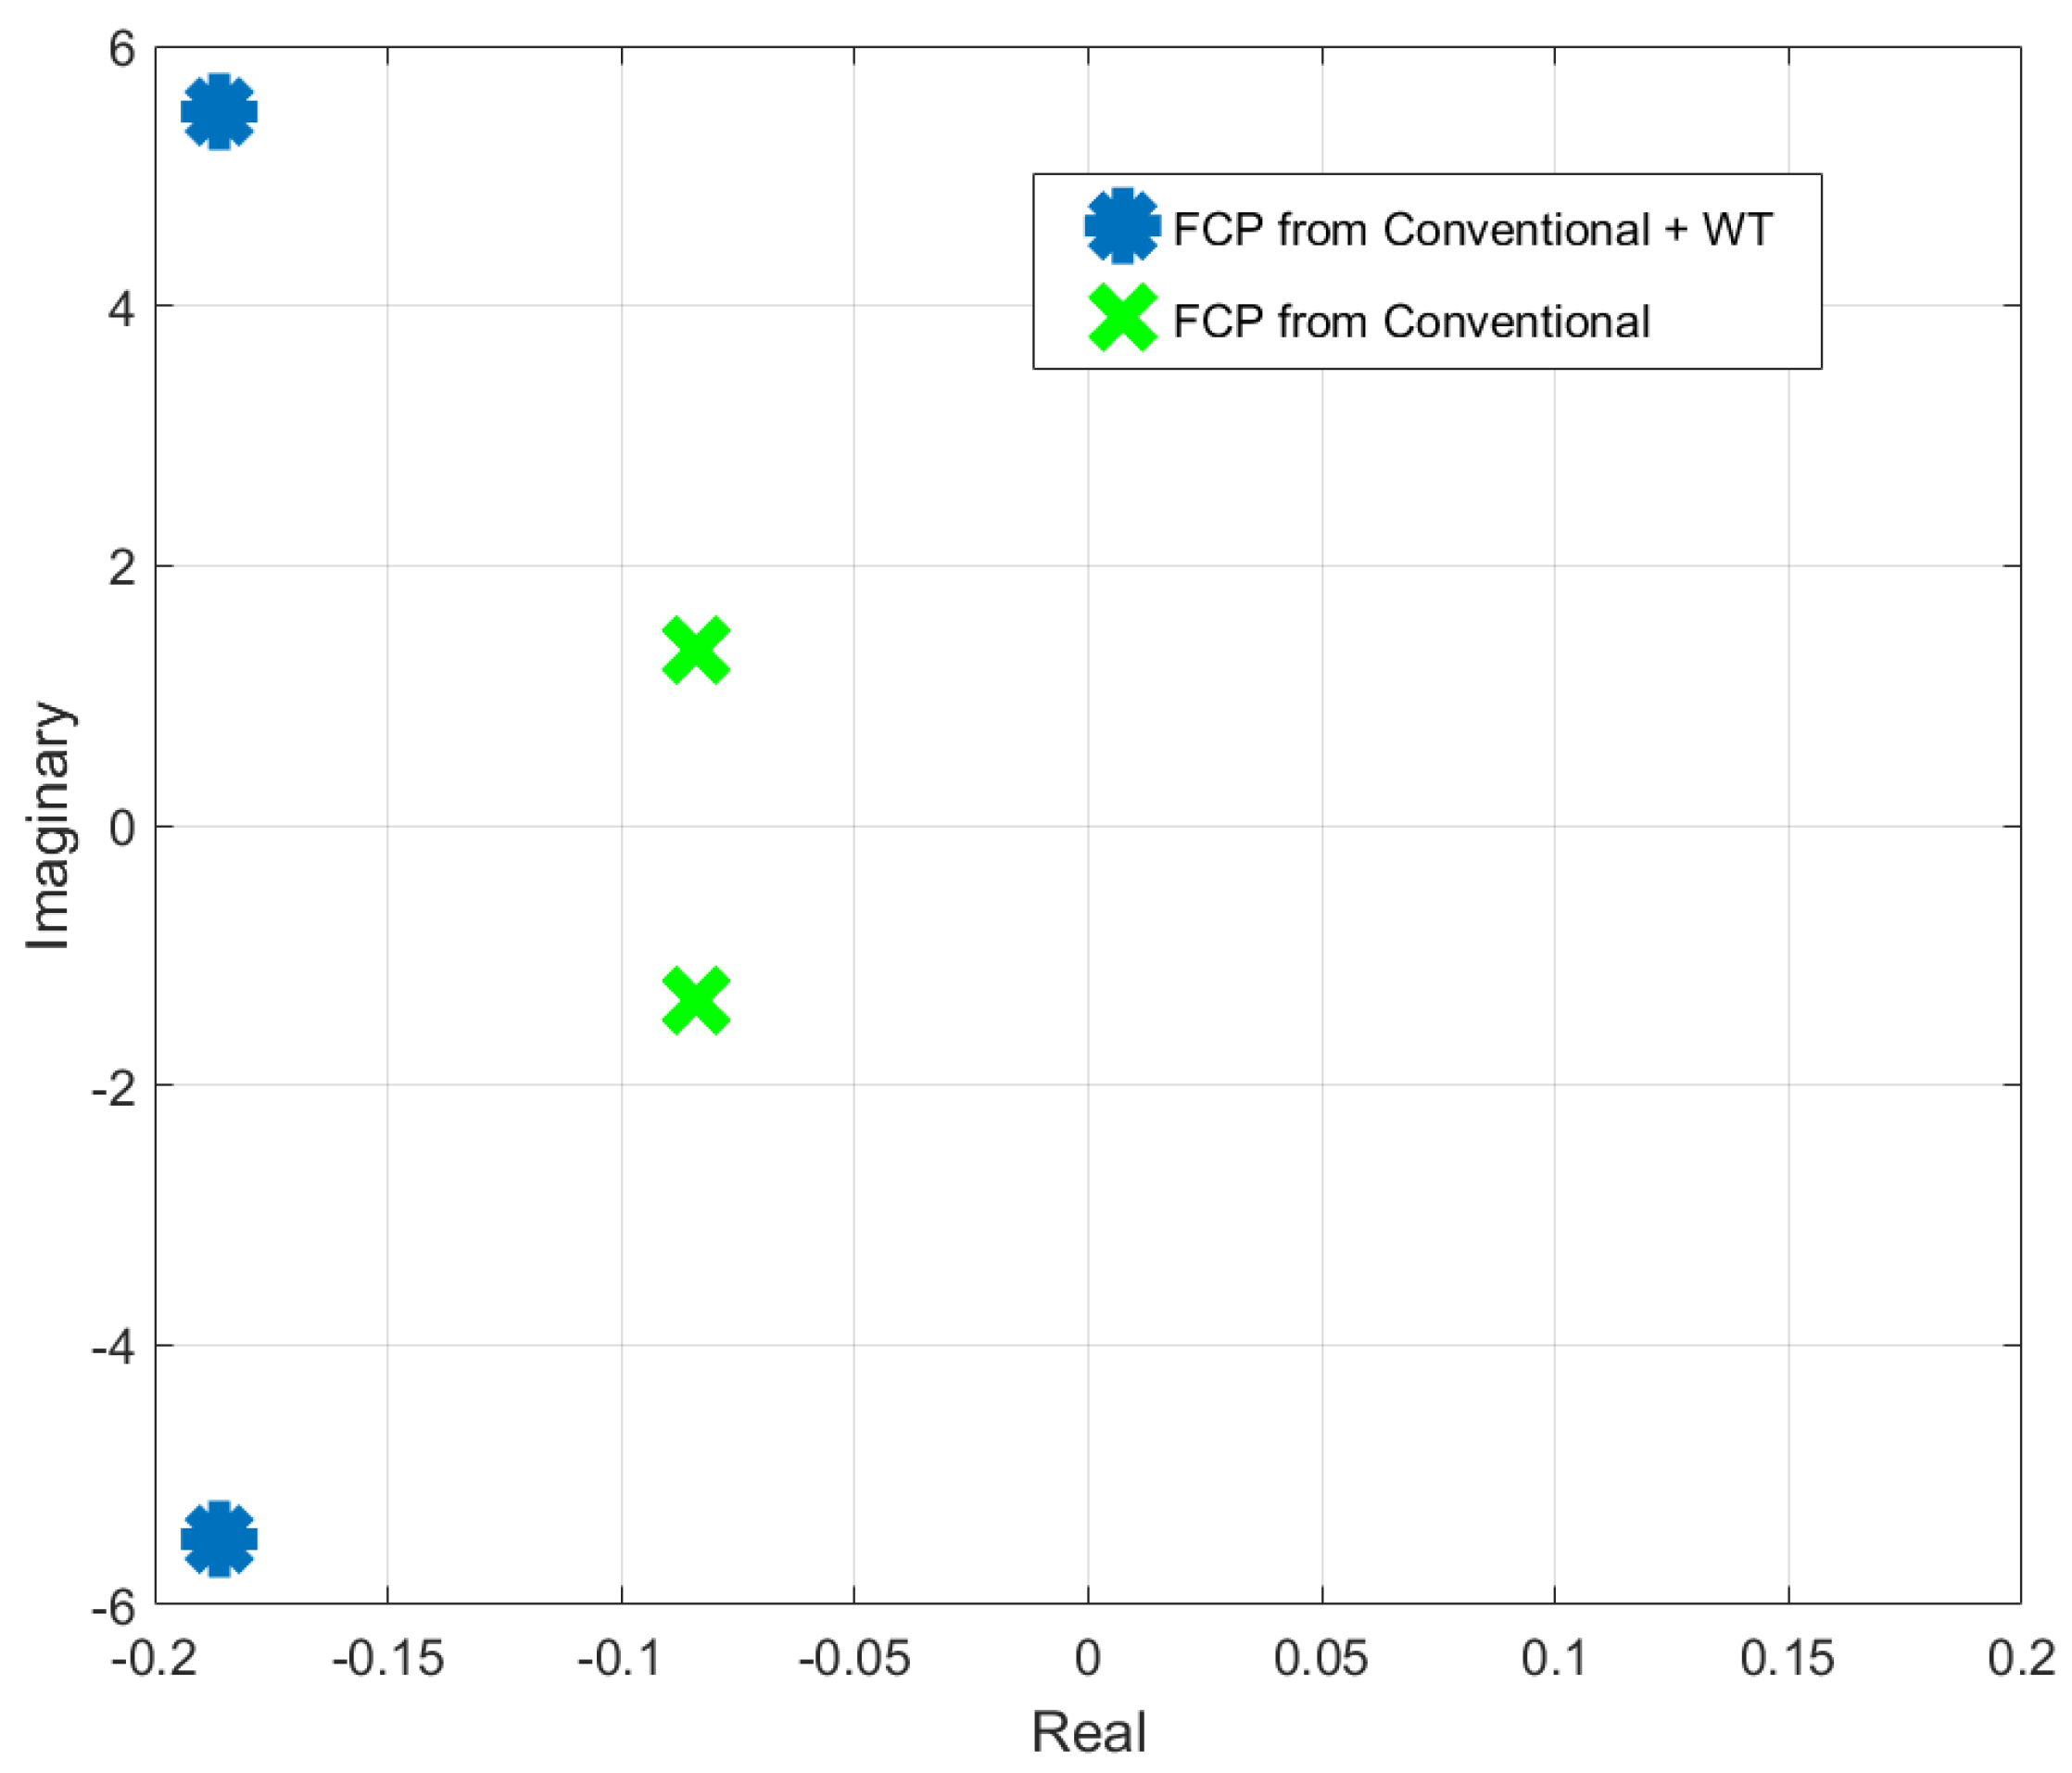
is reduced, but also stability margin is improved as evident from the closed-loop poles in
Figure 18. Closed-loop poles moves more left in the negative real axis of complex plane thereby improving the relative stability of the system. These results evidently supports and validates the importance of the proposed mathematical analytical model.
5. Conclusions
This article presents a developed detailed mathematical approach to study and perform sensitivity studies for the capability of different technologies to provide FCP in different grid conditions. This method allows design of the droop for different technology providing FCP in a power system operating within certain range of inertia. The proposed mathematical approach has been validated on simulated CE network.
Several simulations and comparative studies between FCR provision from conventional generators and WTs have been performed and analyzed in a generic power system with large penetration of WTs in order to study the impacts of droop settings and system inertia. The proposed analytical approach provides a feasible range of droop settings for different values of system inertia.
The results show that providing FCP can become challenging for large disturbances, especially in low inertia systems. The availability of adequate volume of FCR is necessary but not sufficient condition for frequency stability. It has also been observed that time to reach peak response is independent of the size of the disturbance. Furthermore, it has been noticed that the system frequency oscillates sinusoidally with an exponential decay following a large disturbance and that the exponential decay depends on attenuation and damping ratio. Attenuation and damping ratio are independent of size of disturbance and dependent on inertia constant and droop.
The results of this work can be used as a starting base for additional sensitivities studies such as ramp rates and measurement delays and studying future power system scenarios, when the technologies become more flexible.


