Article

Target Setting Outlook for New Residential Building Energy Efficiency Promotion in China: A Frontline Perspective Using Delphi

1
School of Environmental Science and Engineering, Tianjin University, Tianjin 300350, China
2
School of Built Environment, University of Reading, Reading RG6 6AW, UK
*
Author to whom correspondence should be addressed.
Energies 2019, 12(9), 1629; https://doi.org/10.3390/en12091629
Submission received: 13 March 2019 / Revised: 23 April 2019 / Accepted: 26 April 2019 / Published: 29 April 2019
(This article belongs to the Special Issue Recent Research Progress for Energy Policy)

Abstract

:
Promoting energy efficiency (EE) requirements for new residential buildings has been proven to be an effective way to slow down the rapid increase of energy consumption. Its successful implementation relies significantly on the attitudes and participation of various stakeholders within the industry, yet they are normally taken for granted. This paper explores and reports both the consensus among and the diversity of the attitudes of frontline stakeholders toward future EE requirements in the new residential building sector via a nationwide Delphi questionnaire distributed to 29 institutes and 25 experts. Results indicate that promotion of approximately 30% EE every five years until 2030 is suggested and that 20% EE promotion every five years is the most likely to be achieved. In addition, China should progressively adopt the energy intensity index into the current building EE evaluation system. This paper also gives a detailed description of opinions from frontline stakeholders. The findings are expected to help researchers and policymakers better understand the true attitudes of stakeholders, thereby enabling the formation of a proper outlook for new residential building EE promotion.

1. Introduction

Promoting energy efficiency (EE) requirements for new residential buildings has been proven an effective mandatory policy instrument to slow down the increase of energy consumption in residential building sector. During the past fifteen years, China has seen a rapid urbanization process and a substantial increase of living standard. According to National Bureau of Statistics (see Figure 1), the urbanization rate rose to 58.52% in 2017 from 36.22% in 2000 and over the same period, the total Gross Domestic Production (GDP) in China had reached approximately 83 trillion Yuan. According to the data from the Ministry of Housing and Urban-Rural Development in China (see Figure 2), the area of residential buildings has reached 5.67 billion square meters in 2016 from 2.7 billion square meters in 2000. Along with the substantial area increase of residential buildings came the fast increase of energy consumption in residential building sector (see Figure 3a). However, thanks to the promotion of EE requirements, the energy consumption intensity of residential buildings stabilizes at around 55 km standard coal per square meter per year since 2014 (see Figure 3b) [1]. Nevertheless, the question of how EE requirements should be promoted, or what the EE promotion targets should be in the new residential building sector in future years remain unresolved.
In addition to proper target setting, the successful implementation of EE targets of new residential buildings depends not only on the mandatory requirements in the standards and corresponding policies, but also on the attitudes and participation of various stakeholders within the industry. In the new residential building sector, EE promotion involves a few stakeholders with diverse social, environmental, and economic interests [2]. Identifying and understanding stakeholders’ requirements and expectations are fundamental to the successful implementation of strategies aimed at achieving a higher level of EE [3,4]. Making decisions without considering stakeholders’ opinions may lead to confrontations, disputes, disruptions, boycotts, distrust, and public dissatisfaction [5].
However, the current “top-down” policymaking process does not take the attitudes and suggestions from frontline stakeholders sufficiently into consideration, despite their significant influence [6,7]. Contributing to the gap between policy-making and public participation, this paper collected and analyzed the attitudes from frontline institutes and experts toward target setting of new residential building EE promotion in a structured way by using the Delphi method. The authors consider that the frontline stakeholders can provide first-hand, genuine and reliable judgments and expectations about future EE requirements for new residential buildings as they directly participate in propagating or developing high-performance new residential buildings. Additionally, the Delphi method is not only a useful method for seeking consensus among the investigated experts, but also an effective way to forecast the future.
In this paper, both the consensus among and the diversity of these collected opinions were explored in detail. The diversity of stakeholders’ attitudes and judgements toward future EE promotion requirements was described from various perspectives through descriptive statistics. The consensus among experts, namely the most agreed-upon targets, the most possible targets and the most significant targets in respect of EE promotion of new residential buildings in 2020, 2025, and 2030 in China, was determined by using the Delphi method. Specifically, this paper addressed the following issues:
(1)
The detailed profile of attitudes towards the EE promotion targets for new residential buildings in China, from frontline institutes and experts nationwide in different climate zones and of different interests (Governments/ Universities/ Research Institutes/ Enterprises);
(2)
The most agreed-upon EE targets for the new residential building sector in 2020, 2025, and 2030, as forecast by both institutes and experts based on the Delphi Method; and
(3)
The EE targets which most probably could be achieved in 2020, 2025 and 2030, and the one of greatest significance among experts investigated.
By answering the above three questions, this paper not only aimed to identify possible EE promotion targets for new residential buildings from frontline stakeholder’s perspective, but also tried to understand the complexity lying in achieving an agreement among stakeholders in different climate regions and of different interests. Section 2 reviews the current situation of target setting of new residential building EE promotion in China as well as the theory and practice of public participation to emphasize the importance of EE promotion targets and explains why and how the stakeholders’ opinions shall be collected and considered. Section 3 describes the methodology used in collecting opinions and the corresponding data processing based on Delphi. Section 4 presents the profile of the institutes’ and experts’ opinions to understand the complexity of EE promotion within different climate regions in China and identified three types of targets. Considering the advantages and disadvantages of the Delphi method, this section also discussed the reason why and how the study adjusted the original Delphi for a more reliable result. In addition, the rationalities of these consensuses achieved via Delphi were also discussed from the international perspective. Section 5 presented the conclusions and corresponding policy implications of this research.

2. Overview of New Residential Building EE Promotion Trajectory and Public Participation

2.1. Trajectory and Current Situation of New Residential Building EE Promotion in China

China’s unprecedented socio-economic development and fast urbanization (see Figure 1) has driven a great expansion of residential buildings. The area of new residential buildings under construction per year has been increasing by 17% per year on average, compared to the year 2000 level, and reached 12.50 billion square meters in 2014 (see Figure 2). The area of new residential buildings under construction and constructed, after 2014, are levelling out around 12.5 billion square meters and 4.2 square meters, respectively. Building energy consumption has reached 814 million tons of standard coal in 2014, which accounts for 19.10% of total energy consumption (see Figure 4) [8]. The energy consumption of residential buildings has also been increasing dramatically, along with gradual improvement of living quality, fast increase of total population, and rapid urbanization process (see Figure 3) [9,10]. Excluding urban centralized heating in Northern China, the energy consumption in residential buildings increased to 199 million tons of standard coal in 2015, which is approximately three times the amount in 2001. Currently, the energy consumption of residential buildings is still growing rapidly. The World Bank predicts that the Chinese urbanization rate will be 70% by 2030 [11]. Experience from developed countries shows that the building industry will account for 30% of annual global CO2 emissions and 40% of total energy consumption in 2030 [12].
The fast increase of energy consumption has not gone unnoticed and translates into the serious risk of China locking itself into a situation of a large and energy-inefficient housing stock [13]. This realization has brought the EE promotion of new residential buildings onto the national policy agenda since the 1980s. In the “Ninth Five Year Plan and Long-Term Roadmap (1996–2010) of Building Energy Conservation”, the roadmap of targets for new residential building EE promotion was proposed by the Chinese central government and transferred into the mandatory building EE promotion standards enacted in the following fifteen years (see Appendix A Table A1). As illustrated in these standards, the EE requirements focus on the energy consumed by facilities/equipment providing a comfortable indoor environment and take the energy consumption intensity of a reference building in the 1980s in China as the baseline. The EE level of a new residential building is defined and described by the percentage of current designed energy consumption intensity of the new residential building to the baseline. A higher EE level means less energy will be consumed in a new residential building compared with the reference building.
The proposed EE target at each specified time node provides a clear pathway for policy making [14]. Under the guidance of these targets, the corresponding policy package took legislation, implementation standard, fiscal incentives, and so forth, into consideration. These policies have helped the new residential building EE promotion industry in China take off in the past three decades. Also, after four stages of development [15] (see Appendix A Table A2), China has formed a dual system including both building energy conservation and green building development. The EE requirements, i.e., the requirements of building energy conservation, are set as basic and mandatory requirements for new residential buildings, whereas the requirements of green buildings are normally encouraged by incentives. The promotion of EE is the common focus of these two systems.
The reduction in energy intensity in the last three decades has proven the effectiveness of the policy settings in the residential building sector (see Figure 5). In 2015, the intensity of energy consumption caused by centralized heating for residential buildings decreased to 14.1 km of standard coal per square meter from 22.8 km of standard coal per square meter in 2001 [16]. Over the same period, the energy consumed, excluding centralized heating in Northern China, by residential buildings nationwide increased by 1.76 times, and the area of residential buildings increased by 2.08 times.
Currently, China is still faced with a challenging task in improving the energy performance of the new residential buildings. It is important to seek solutions to reduce and delay the peak of total energy consumption in China. In addition, with the signing of “The Paris Agreement” and the “China–U.S. Joint Presidential Statement on Climate Change”, the Chinese government proposed to limit primary energy consumption within 4.8 billion tons of standard coal in the “Energy Development Strategic Action Plan (2014–2020)” issued in November 2015. Taking other countries as examples, the residential building sector should consume no more than 424 million tons of standard coal [16], which is only 0.07 times more than the energy consumption in 2015.

2.2. Public Participatory and its Practice Regarding Policymaking of New Residential Building EE Promotion

As for policy making, the opinions of frontline stakeholders have not been sufficiently taken into consideration, either when making policy or when concluding policy implications [6]. Regarding the EE promotion of new residential buildings in China, the “Top-Down” policy-making process still dominates. The policy decisions depend significantly on the nature of the particular set of political actors, ideas, and institutional rules that are prevalent in the jurisdiction when policy deliberations and decision-making take place [12]. Stakeholders neither have sufficient chances to report their opinions to the decision makers nor have the opportunities to participate in the policy-making process. Although field surveys, interviews, and exhibits are very popular, the target group of these investigations is within the range of pilot projects, most advanced technology solutions, and key experts. The real situation of new residential building EE promotion industry development is investigated usually by the “Annual Special Inspection of Building Energy Efficiency”, launched by the central government in 2008. However, the inspection limits its range to what has been proposed in the “Five Year Plan of Building Energy Conservation and Green Building Development”. The overall and stereo beliefs of the stakeholders within the industry tend to be neglected [17].
Careful consideration of opinions from frontline stakeholders will, on the one hand, help policymakers collect more information and resources, thus enhancing the evidence base of policy instrument selection and policy package development, and, on the other hand, increase compliance and, eventually, render the outcome of the policy implementation process more legitimate. In the new residential building sector, the EE promotion involves a few stakeholders with diverse social, environmental, and economic interests [2]. Li et al. propose that government organizations have the most influence, followed by owners and end-users, with property management companies and NGOs having the least influence [7].
Sixteen popular techniques for facilitating the collection of stakeholders’ opinions have been identified: these compromise interviews, field offices, hotlines, displays or exhibits, newspaper inserts, information bulletins, surveys, participatory television, brochures, contests, mediation, charrettes, Delphi method, simulation games, providing technical assistance to stakeholders, and training programs for stakeholders. No consensus has yet been reached over formulating a universal and effective way of collecting and understanding stakeholders’ opinions after comparing the advantages and disadvantages of each technique [18,19]. Of all these techniques, the Delphi method is the most popular method for collecting opinions and solving complicated problems [20]. The Delphi method can not only maintain the authenticity of respondents’ opinions through giving their true opinions anonymity but also identify the group opinion in a structured way. It is also proposed that the Delphi method is preferable for making forecasts about future development when the objective data are not sufficient and when significant change is not expected [21].

3. Methodology: Collecting Genuine Opinions and Summarizing Significant Opinions

The survey method and data processing are threefold: Part 1 – “Nationwide large-scale institutional questionnaires” are used to collect opinions about building EE level extensively from frontline institutes; Part 2 – “Experts questionnaires” are used to both collect opinions from and seek consensus among frontline experts; and Part 3 – An expert workshop was held to verify, from a technical perspective, the socio-psychological result achieved in the Delphi process. The Delphi process, including Part 1 and Part 2, is a method for collecting opinions in a structured way and seeking consensus among experts. The major difference between Part 1 and Part 2 lies in the governance arrangements in China’s institutes. Once the questionnaire is delivered to a certain institute, managers (college deputies and heads of other government departments and public institutions) will break it down and send them to different departments. Experts in each department will first fill in the questionnaire based on their perceived experiences and their majors. A follow-up workshop, where all the responses from experts and corresponding reasons are stated and discussed, will be conducted to find the most agreed-upon EE level. When approved by the manager of the institute, the most agreed-upon EE level will be the formal response. Therefore, a formal response from an institute could be seen as the result of negotiations among experts of different majors and professional ranks.

3.1. Data Source: Respondents Selection

The selection of institutes took the differences in climate, socio-economic development level, and property of institutes into consideration. New residential buildings constructed in different climate zones achieve the same level of EE at different rates. Climate differences also lead to different technical strategies and solutions for achieving the same EE level. The socio-economic development level represented by GDP indicates the difficulty in sharing/undertaking the incremental cost caused by EE promotion. It further indicates the possibility of massive propagation of residential buildings of higher EE. The consideration of institutes’ properties was mainly based on the role which various institutes play in the industry. The externality of EE promotion of new residential buildings makes it hard for developers to profit from developing new residential buildings of high energy performance. However, it is strongly favored by provincial and municipal authorities due to policy influence and potential benefit, such as increasing job opportunities. Overall, twenty-nine institutes were identified; a detailed description of the institution selection is shown in Table 1.
In addition to climate zones and institutes’ properties, the selection of Delphi experts also took working years and the research domains of experts into consideration. It was assumed that one’s perceived knowledge and corresponding judgments would be influenced mainly by their working experiences and their familiarities with different knowledge domains. At the same time, the EE promotion of new residential buildings is a complex socio-technical industry. Thus, the span of the Delphi expert panel covered both the technology aspect and the management aspect. Finally, twenty-five experts were selected. The detailed composition of the Delphi expert panel is illustrated in the column “No. Invited” in Table 1.

3.2. Investigation and Delphi Adjustment

The Delphi process was adopted in data collection because it is a useful method to collect experts’ opinions in a structured way (see Figure 6). Considering that the purpose of this investigation is to explore as many combinations of EE levels as possible and to seek consensus among investigated experts at the national level, this paper adopted the Traditional Delphi as the major research methodology. The questionnaire, as the major instrument for Delphi implementation, was used in this research. In accordance with the principles of questionnaire design [22], the design of both the institutional questionnaire and the Delphi questionnaire were kept simple, specific, and easy to understand (see Appendix A Table A3). The Specific, Measurable, Achievable, Relevant, and Time-Specific (SMART) criteria were used to optimize the design of questionnaire. Open-ended questions were used in the institutes’ questionnaire so that the maximized flexibility in determining the EE level was reserved. The settings of time nodes, namely the years 2020, 2025, 2030, were in accordance with the pace at which the updated “Five Year Plan of Building Energy Conservation and Green Building Development” is published. The EE level at each time node was determined by investigated institutes.
Despite the many advantages proven by previous studies [23], the Delphi method also has natural deficiencies, as summarized in Appendix A Table A4 [23,24]. Contributing to the deficiency of convergence speed, two major adjustments were made to optimize the Delphi method. These are as follows:
(1)
Instead of an expert questionnaire, the large-scale institutional questionnaire was introduced as the first round of the Delphi process. For each institute, at least three frontline experts will participate in responding the questionnaire. Those experts participating in the following rounds of Delphi questionnaire should all have participated in the institutional questionnaire. Additionality, it is considered by the author that, a consensus achieved among stakeholders of more kinds of interests is more easily and more likely to be achieved by a smaller group of experts of less kinds of interests. Thus, additional requirements were set up, depending on the property of the institutions, to achieve more reliable feedback from different stakeholders. These requirements were: For Government Departments — Advice from same-level departments, such as financial departments, industrialization departments, and quality supervision departments, should also be collected when completing the questionnaire. According to the current governance arrangement in new residential building EE promotion sector, the development of a complete policy package, under the guidance of EE targets in new residential building sector, calls for the cooperation among multiple departments. An agreement among all the related government department regarding target setting means a higher possibility that the EE target can be better implemented accompanied with other policy instrument such financial subsidies. For Other Institutions — Opinions reflected in the questionnaire should be a combination of opinions from high-level decision-makers, frontline workers, and other individuals involved in the industry. Whilst frontline workers can provide a judgement from certain aspect, high-level decision-makers can provide a more comprehensive judgement about the future EE promotion in new residential building sector.
(2)
Instead of keeping the questions in the same form as in the institutes’ questionnaire, we presented the “intentionally improved EE level combination” to the expert panel. Experts were asked to suggest revisions to the proposed combination. To assure the “ambition” of the EE target at each time node, the proposed EE target was improved to the possible highest level at each time node based on the conclusions drawn from the institutional questionnaires according to the current situation in China and targets published by developed countries. By inspecting experts’ responses to the target settings, the robustness of the institutes’ questionnaire result was tested, and the highest EE level of experts’ expectations was explored. If Delphi reached consensus on the result of the large-scale questionnaire in two rounds’ iteration, the result was considered to be convergent, and the process was terminated. Results of the large-scale questionnaire, like those of the Delphi method, were effective. Otherwise, more rounds of questionnaire should be conducted as Delphi required, and the new result, different from that of the large-scale questionnaire, should be adopted.

3.3. Data Processing

Figure 7 summarizes the major steps for the identification of the three types of target setting options, namely the “Most Agreed Option”, the “Most Possible Option” and the “Most Significant Option”.
At each time node, the average value of the EE level was introduced as the evaluation index of consensus in the Delphi process. If the average difference between the last two rounds of Delphi was less than 5%, it was assumed that the consensus has been reached. The corresponding result achieved in the process was defined as “the Most Agreed Option” for building EE promotion in the new residential sector. However, the “Most Agreed Option” is the result of negotiation among institutions and experts. It represents the most reasonable EE requirements/targets in 2020, 2025, and 2030. It can represent neither the possibility of achievement nor the most representative (significant) opinions believed by institutes and experts. Thus, the “Most Possible Option” and the “Most Significant Option” were also explored through different data processing methods.
The “Most Possible Option” refers to the EE levels that are believed to be most likely to be achieved at a specific time node. In both institutes’ and experts’ questionnaires, respondents were required to forecast “proper” EE requirements/targets at various time nodes. The author considers that, if one respondent has given a specific EE value, any EE value lower than that value is considered achievable. Taking 80% agreements on the achievability among all the experts as the baseline, the very first EE level at various time nodes exceeding the base line was identified.
As for the “Most Significant Option”, to ensure that the opinions of more than 50% of institutes were taken into consideration, the accumulative percentage by descending order of percentages was set as the evaluation index and “50%” as the baseline. All the EE levels, of which the accumulative percentage exceeds the baseline at each time nodes, were identified as EE Level of Concentration (EELoCs). To make a thorough distinction between all EELoCs, the average percentage of all EELoCs at respective time nodes are calculated. The EELoCs of higher percentage values than the average is marked as EE Level of High Concentration (EELoC-H). The possible combinations of EELoCs at each time node are explored afterward. The principles used to find the most proper options are as follows: (1) The EE level of a later time node shall not be smaller than that of the previous one, and (2) The option compromising more EELoC-Hs should be preferred. The combinations fulfilling the above requirements and with the most EELoC-Hs are selected as the “the Most Significant Option” among first front institutes, since they are the most representative opinions held by institutes and experts. These combinations indicate the highest level of agreement, from a statistical perspective, in relation to the opinions of institutional/experts at every time node.
A workshop, at which the proposed EE levels are rechecked by a larger group of experts, was conducted to ensure the feasibility and rationality of the results achieved in the Delphi questionnaire from technology perspective. The consensus achieved in the Delphi process is based on the negotiation of experts. There is still possibility that the EE requirements believed by most experts are too ambitious to achieve. If the EE requirements/targets are feasible from the technical perspective, this would prove that the settings of the Delphi method are successful. Regarding the utilization of renewable energy in the building sector, experts proposed that the energy consumption of Heating, Ventilation, and Air-Conditioning (HAVC) systems should be defined separately according to the types of energy utilized. Therefore:
Et = En + Er
in which Et: Total Energy Consumption of HVAC system; En: Non-renewable Energy Consumption of HVAC system; and Er: Renewable Energy Consumption of HVAC system.
Regarding consistency between EE defined by “percentage” and “energy consumption intensity” (absolute value measured in “kWh/m2a”), the following approach was adopted:
ECc = ECp × (1EEp)
in which ECc: Energy Consumption Intensity at the Current Stage; ECp: Energy Consumption Intensity at the Previous Stage; EEp: EE Promotion Compared to the Previous Stage.
Under the policy-making context, the calculation of energy consumed by HVAC system is not project dependent. It is based on the reference building and corresponding key design parameters affecting the performance of the reference building stipulated in the design standards as listed in Appendix A Table A1. The first version of new residential building EE design standard (JGJ 26-1986) defined a reference building with key design parameters were set in accordance with the condition of new residential buildings at the beginning of the 1980s. The corresponding HVAC energy consumption of the reference building is defined as the baseline for evaluating EE of new residential buildings. In the later versions of new residential building EE design standards, the promotion of EE in new residential building sector was accomplished by strengthening the requirement for the key design parameters affecting the performance of buildings. At current stage, the 65% EE level means the reference building with current design requirements shall consume 65% less energy than the reference building at the beginning of the 1980s.

4. Results and Discussion

4.1. Profile of Institutes’ Opinions

On average, opinions collected in the institutes’ questionnaire indicate that the EE requirement of the new residential buildings should be increased to 77%, 82%, and 87% in 2020, 2025, and 2030, respectively, which equals EE improvements of approximately 34%, 21%, and 30%, respectively, over the previous level. However, the variances of institutes’ opinions increase along with the projected length. As shown in Figure 8, the variances in 2020 range from 72.5% to 80.0% while that in 2030 from 80% to 95%. In addition, the increases of variances also lie in the opinions both from governments and non-governmental departments as shown in Figure 9 and Figure 10. These increases of variances also indicate the increasing uncertainty of attitudes to forecasting the future development of new residential building EE promotion from all the institutes.
The EE requirements forecast by various stakeholders are summarized in Figure 11. As for attitudes from different kinds of stakeholders, results indicate that the average attitudes of government departments are closest to the total average value. The overall attitudes of design institutes tend to be conservative, whereas the opinions of universities and research institutes are rather optimistic. The opinions from real estate enterprises are higher than the total average value before 2025 but are a little bit lower by 2030.
The EE requirement forecast given by different types of institutes will reflect the real situation of EE promotion of new residential buildings from the corresponding aspects, since institutes always make decisions based on their main business and their accumulated experience. The main business of universities and research institutes centers on technology innovation. The ambitious EE requirements forecast indicate the technological availability of high-performance buildings. This is also proven by “Passive House” pilot projects in Heilongjiang and Hebei provinces [25]. However, the attitude of design institutes implies that the massive propagation of high-performance buildings is still under development. Real estate enterprises, or developers in this context, have an expectation of higher than average EE requirements. This indicates that, despite externality, the new residential building EE promotion is still an “interesting topic” for developers. Attitudes of governments are neither “too ambitious” nor “too conservative”, which can also be regarded as the results of negotiations among stakeholders. This result, to some extent, explains how the government in China works regarding the new residential building EE promotion industry. The central government normally conducts investigations and consultations to hear opinions from various stakeholders before making decisions. This process helps governments better understand the expectations of various market entities so that ambitious yet achievable targets of both EE promotion and massive propagation of high-performance buildings can be realized with more effort.
As for opinions from different climate zones (see Figure 12), institutes from the Cold and Severe Cold (CSC) climate zone are conservative, whereas those from Summer Hot Winter Cold (SHWC) climate zone expect the highest EE requirements. It is believed that the lack of both technology and policy innovations have lowered the expectations in the CSC climate zone, while the immaturity of technology solutions and policy packages have left more chances for EE promotion of new residential buildings in the other two climate zones. On the one hand, centralized heating has covered all residential buildings in the urban area in northern China, and its energy consumption has increased the total energy consumption of residential buildings by up to 40% [26]. A study of 1726 buildings in northern China has indicated that the heating energy consumption intensity of different buildings varies significantly, ranging from 80 to 140 kWh/ m2. In all, 15% of the investigated buildings have either extremely high or low energy consumption [27]. However, the heating EE remains uninvestigated [28].
On the other hand, the Chinese central government has launched heat reform in Northern China. The heat reform aims to reduce the amount of energy wasted by end users through reform of the heating pricing system and by establishing market mechanisms to increase heat suppliers’ efforts to improve the EE of their heat supply networks, to share the retrofit costs of EE renovation, and to promote retrofitting [29]. However, due to technical and institutional barriers, this reform has progressed slowly in most northern provinces, and the penetration rate of consumption-based pricing policy in most northern cities is still very low [30]. Moreover, the implementation of “Passive houses” in China faces multiple technical problems regarding massive propagation [31].
In contrast, EE promotion in the SHWC Zone and the Summer Hot Winter Warm (SHWW) Zone is gaining more attention from policymakers and engineers. For example, the optimized heating technical strategy and the corresponding policy package design in the SHWC Zone have been hot topics among policy-makers since 2012. Various concepts have been translated into pilot projects, such as “Passive house” in Anhui Province. The immaturity of the technology strategy prompts the interest of stakeholders and engineers in exploring the highest level of EE [32,33,34]. In addition, central governments are paying more attentions on piloting policy settings in these two climate zones, which has further promoted the expectations of the stakeholders for the EE promotion of new residential buildings [35].
There also might be some arguments that the development level in a district will significantly influence the expectation of building EE promotion, since provinces in the SHWC and SHWW climate zones have a higher average GDP value. However, the result of a correlation test between EE requirements and GDPs counters this argument. As indicated in Table 2, the distribution of institutes’ opinions is not significantly correlated with the GDP distribution in 2025 and 2030. As for 2020, the Person Correlation Coefficient between GDP and EE requirement is only 0.382, which also means that these two factors are not strongly correlated.

4.2. Profile of Experts’ Opinions and Consensus

The EE requirement for 2020 was intentionally upgraded to 75%, and those of 2025 and 2030 to 90% and almost 100%, respectively, in the expert questionnaire. A total of 25 experts were invited to fill in the questionnaire, and they all responded to the research team. However, as indicated in “No. Responded” in Table 1, only 18 experts responded with an answer. The remaining seven experts left the whole questionnaire blank, which made it difficult to tell whether they were supportive of the preset EE requirement or wished to reserve their judgments. Thus, the questionnaires that were not responded with any judgments were identified as “ineffective” and were not taken into consideration when the analysis was conducted. Among all those “effective” responses, some experts raised objections for only one time node or two. Under this circumstance, EE requirements with no responses were considered to have been approved by experts. Generally, the trend of these opinions was to decrease the proposed EE requirement, which means that the preset targets in the expert questionnaire are too ambitious and that changes should be made to achieve a more practical requirement.
Specifically, the number of objections and their constitution varies at different time nodes, as summarized in Figure 13. Taking 60% agreement from experts as the baseline for consensus, the proposed EE requirements in 2025 and 2030 were evaluated as being not acceptable. For the time node 2020, only six experts raised objections. Of these objectors, half proposed an EE requirement of 70%, and the other half proposed a requirement of 65% which is in accordance with the current EE requirement. However, the preset EE requirement (75%) was evaluated as acceptable, since two-thirds of the respondents agreed with this setting. For the time node 2025, the EE requirement proposed by the research team is evaluated as “unacceptable”, since 15 experts raised objections. All the objectors proposed EE requirements that are lower than is the preset EE requirement (90%). Seven of the objectors supported an 80% EE requirement, four supported a 75% requirement, and four supported an 85% requirement. For the time node 2030, all the respondents did not support the “around 100% EE requirement”. Meanwhile, respondents gave specific answers. These opinions range from 80% to 95% EE requirements. Most (seven) of these experts supported an EE requirement of 90%, and five of them supported an EE requirement of 95%.
The calculated variances of experts’ opinions (see Table 3) indicate that consensus was reached among the investigated experts, regardless of perspectives. Meanwhile, the average opinions from experts were 81.67% EE in 2025 and 89.17% EE in 2030, which is quite close to the average opinion achieved in the institutional questionnaire.
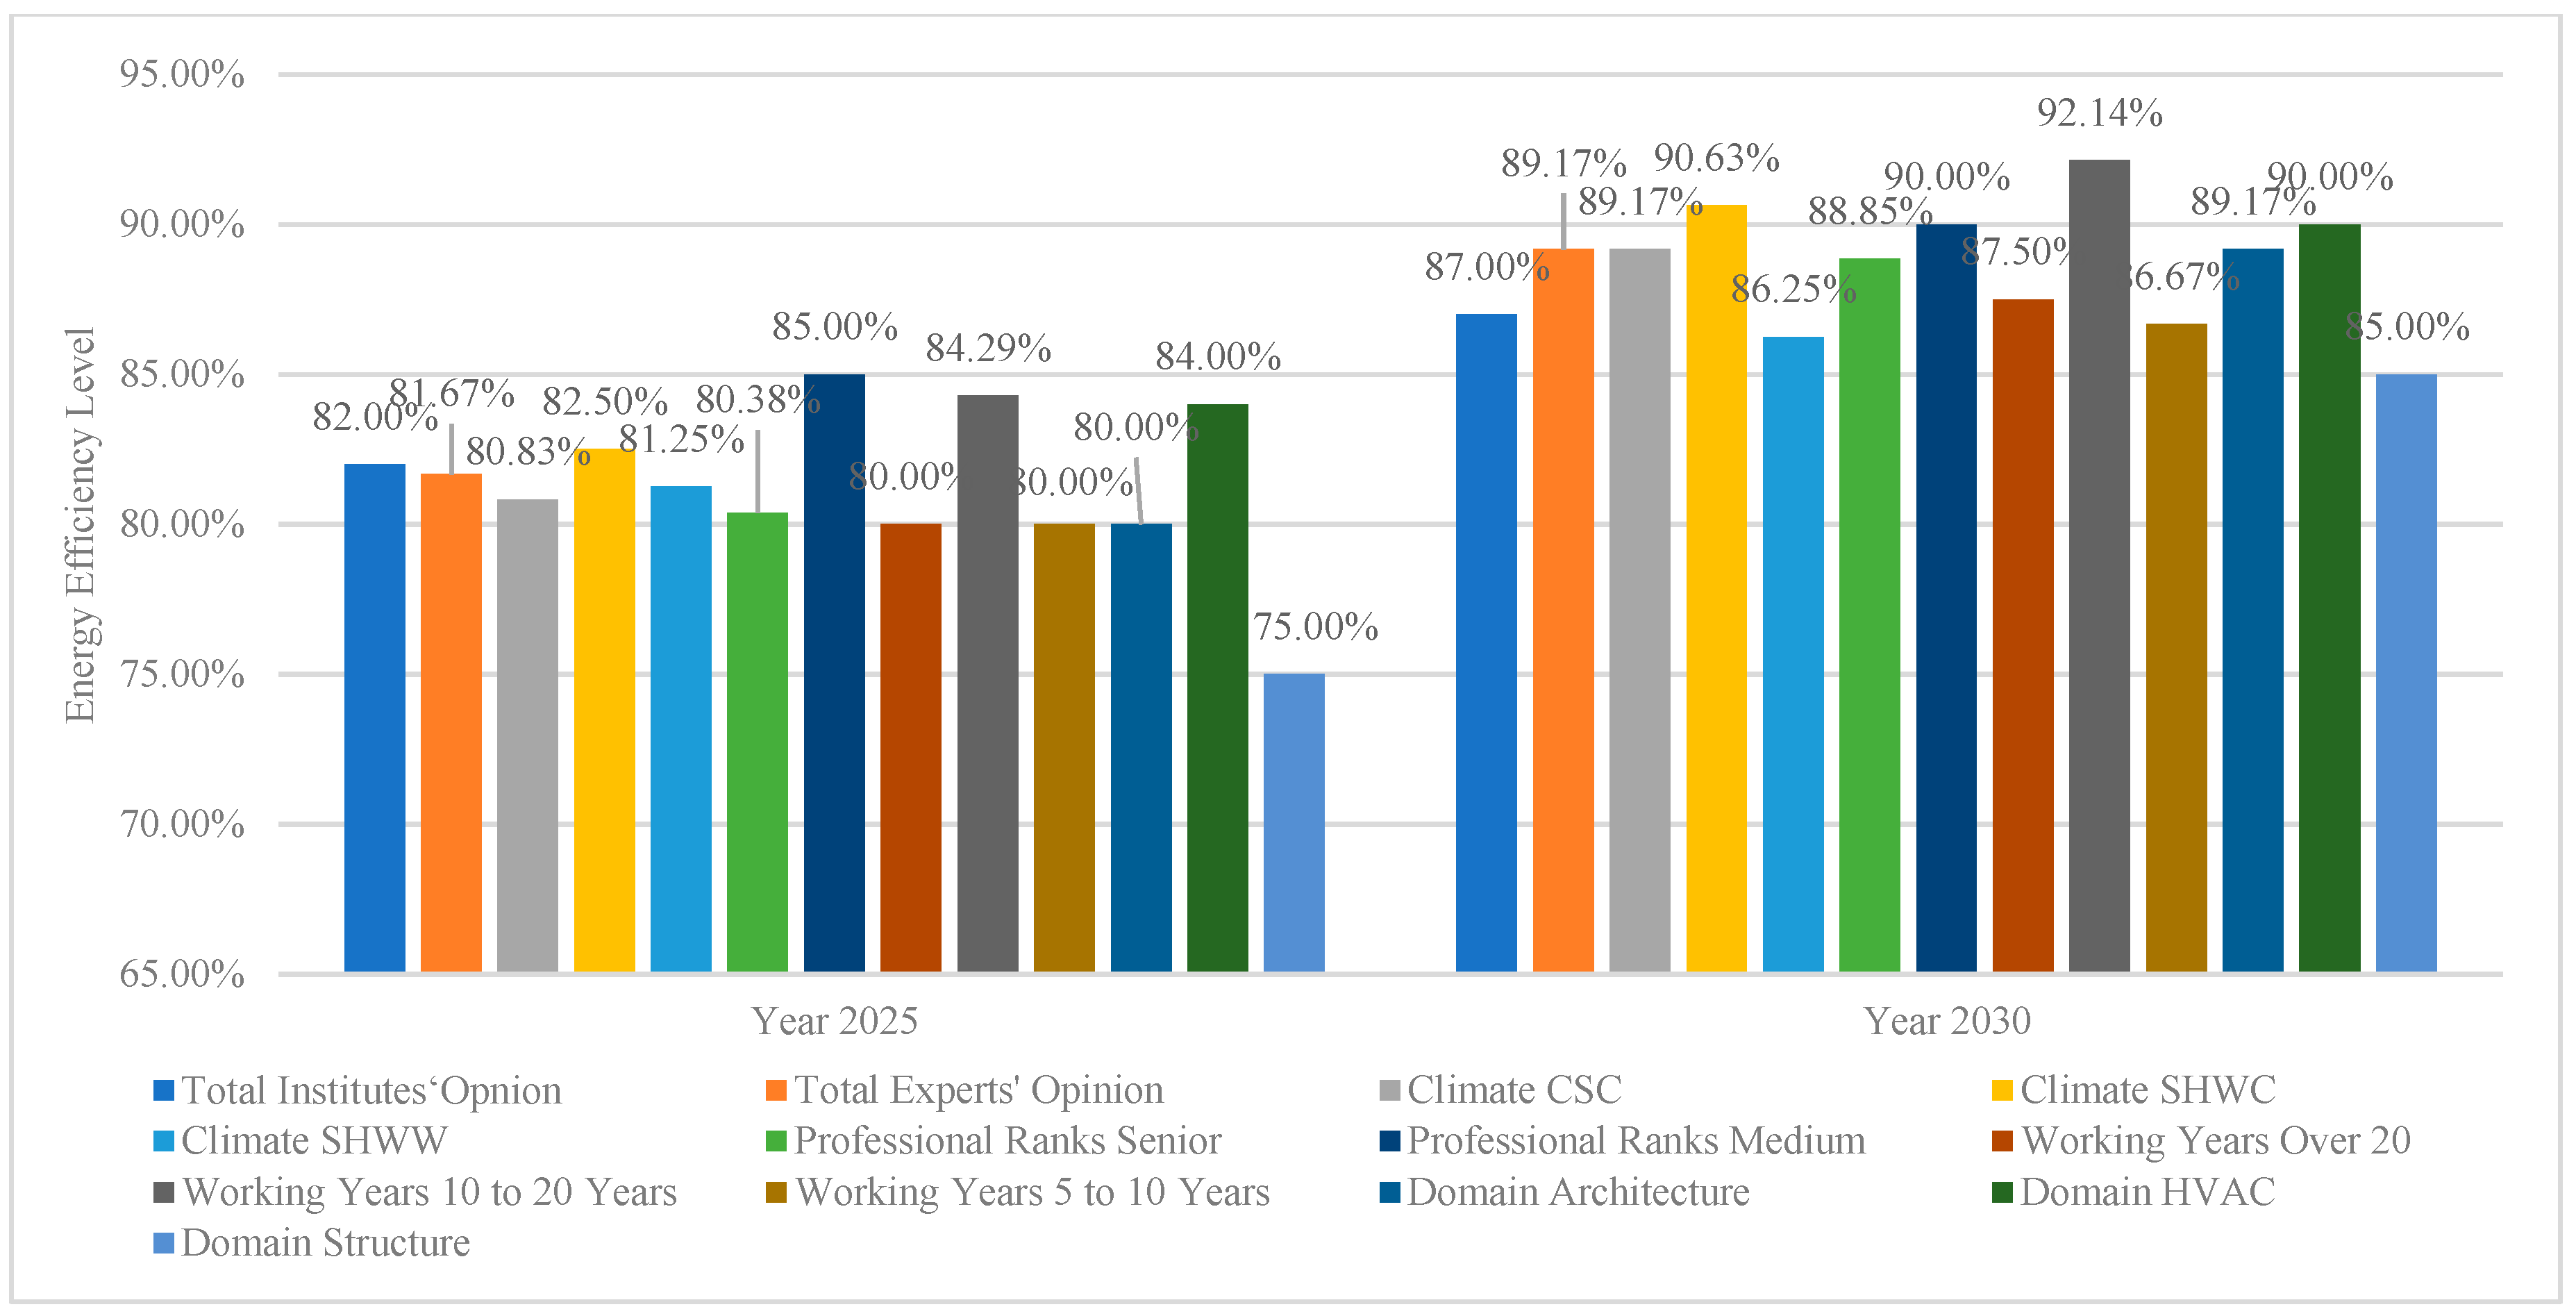
To better characterize the experts’ opinions collected in the first round of the expert questionnaire, the average EE requirement was calculated, taking climate zones, professional ranks, and working years into consideration (see Figure 14). Generally, the distribution pattern of average opinions in 2025 and 2030 are the same. The average opinions from the perspectives of climate, professional ranks, working years, and domain knowledge range from 75% to 85% EE in 2025 and from 85% to 92.14% EE in 2030. The distribution of the average opinions from the climate perspective is in line with that of the distribution of opinions collected in the institutes’ questionnaire. From the perspective of professional ranks, senior experts tend to be more conservative than medium ranked experts. The average values of EE forecast by senior experts are 4.62% and 1.15% lower in 2025 and 2030, respectively, than are those forecast by medium-ranked experts. Since most of the senior ranked experts have worked for more than twenty years, there is a great similarity between the distribution from the perspectives of both professional rank and working years. Experts who have worked for more than ten years and less than twenty years hold the most optimistic attitudes, and those who have worked either for more than twenty years or for less than ten years have similar, and significantly lower, judgments regarding the EE requirement. From the perspective of domain knowledge, more experts in HVAC than in Architecture believe that a high EE level can be reached.
Despite the diversity of average opinions from various perspectives, the consensus according to Delphi is still considered as having been achieved. The direct differences between the institutes’ questionnaire and the experts’ questionnaire range from 0.12% to 3.30%, which are within the requirements for consensus (5% difference), according to the principles set in Section 3.3. Considering the minor level of difference, the average value of the EE requirement at each time node is used to represent the consensus. The results are listed in Table 4, and the approximation for policy implication is marked as “Average Approximation”. This combination is also identified as the “Most Agreed Option”, according to Section 3.3. Correspondingly, it can be concluded that, as agreed by the institutes and experts investigated, the EE requirement in the new residential sector should be promoted to 75% nationwide by 2020, 82% by 2025, and 88% by 2030.

4.3. The “Most Possible Option” and the “Most Significant Options”

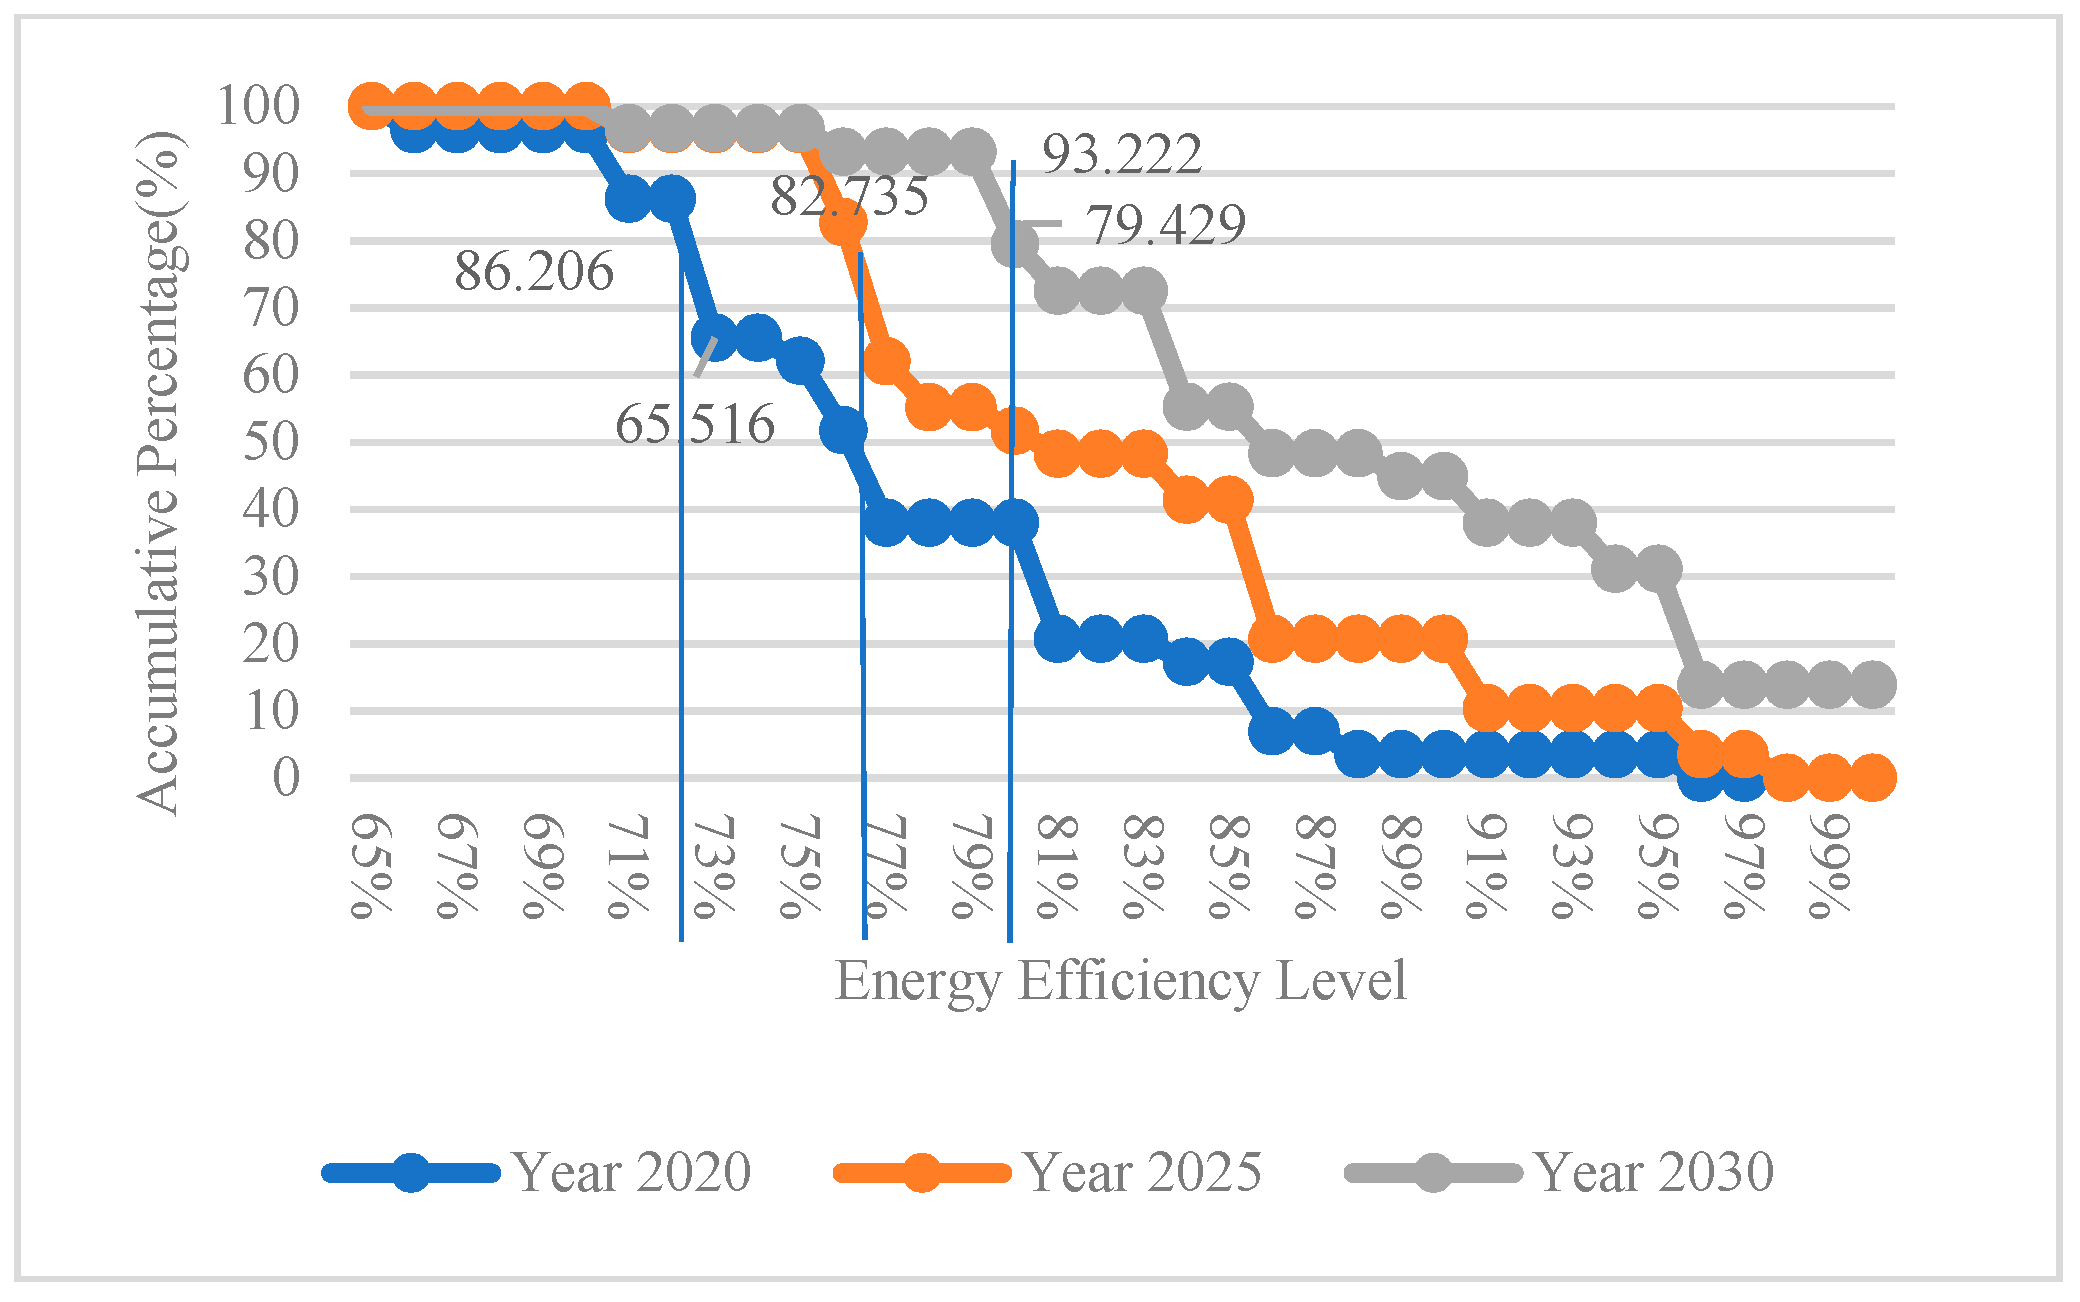
The calculation of the “Most Possible Option” was based on the accumulative percentage of institutes’ and experts’ judgment in a descending order. As the result in Figure 15 indicates, 86.206% of institutes believe that an EE requirement of 72% could be set for 2020. A total of 82.725% of institutes believed that the EE requirement could be further promoted to 76% by 2025, and 93.22% experts held the opinion that the EE requirement should reach 79% by 2030. According to the distribution of experts’ opinions in Figure 16, the identified EE requirements were 70%, 75%, and 85% respectively, which was quite similar to the conclusion drawn from the institutes’ questionnaire.
Despite the minor difference of the EE value in 2020 (72% and 70%) and 2025 (76% and 75%), the great difference in 2030 (79% and 85%) indicated that consensus could not be considered as having been achieved. Therefore, one more round of the questionnaire was conducted. For the third round of the questionnaire, the proposed EE requirements were based on the average opinions from the institutes’ and experts’ questionnaires. To form a stepwise EE promotion roadmap, we improved the EE requirement for 2020 slightly, to 72% and the EE requirement for 2025 slightly, to 78%, so that the EE improvement between each time node was kept as 20%. The Likert 5-Scale was introduced to measure the “achievability” of the proposed EE requirement. The correspondence between the Likert scoring and the actual meaning was indicated in Figure 17.
The result of experts’ scorings, the average values of which exceeded three, indicated that the proposed EE requirements at all time nodes were achievable. Consequently, the proposed EE requirement at each time node was identified as the “Most Possible Option”. Table 5 summarized the results of Likert scoring from experts by indicating the average values. The average values indicated that all the proposed EE requirements were achievable according to Figure 17. Correspondingly, the proposed EE requirements at Year 2020, 2025 and 2030 were identified as the “Most Possible Option”. In addition, it is noteworthy that the average scoring values of the EE requirements in Year 2020 and Year 2025 were quite similar, while there was an obvious decrease occurred at the scoring of the EE requirement in the Year 2030. The former two average values indicated that the EE requirements in 2020 and 2025 were relatively easy to achieve from experts while the last one was only evaluated as achievable. Along with the decrease of average value, the variance of scorings from experts are rising according to the projected length. The increase was also in accordance with the phenomenon found in the institutional questionnaire — that the certainty of forecasting is decreasing with the projected length increasing. Comparatively, the agreement achieved on the target setting of the year 2020 could be considered as unusually strong and the agreement on that of the year 2025 could be considered as strong, whilst the agreement on the year 2030 was not as strong as the previous two.
As for exploring the “Most Significant Option”, probability distributions were calculated at each time node to identify possible combinations of different opinions from institutions. There were 3, 3, and 4 EELoCs in 2020, 2025, and 2030, respectively. Two EELoC-Hs were identified at each time node. Therefore, 14 combinations of these EELoCs were found as summarized in Table 6, according to the principles described in Section 3. Four of them (No. 6, No. 7, No. 9, and No. 13) have been identified as the “Most Significant Option” since they possess EELoC-H at all the time nodes, and they were marked as bold in Table 6.
Among these four options, two EE levels were found at each time node. With respect to the raw data of the institutes’ questionnaire, those who believed that the EE requirement should be 72% by 2020 also tended to believe that the EE requirement should be 76% by 2025 and 83% by 2030 or vice versa. Those who believed that the EE requirement should be 76% by 2025 held the opinion that an EE requirement of 72% is best for 2020. Those who believed that an EE requirement of 85% should be reached by 2030 argued that an EE requirement of 80% was best for 2020. However, dispersion of opinion appeared when it came to an EE requirement of 95% by 2030. Experts did not hold the same opinion regarding determining the EE requirements in 2025 and 2030. This further indicated that the Option No.3 and No.6 didnot exist in the responses from the institutes yet the Option No.4 and No.5 were made up through data processing methods. Correspondingly, options No.3 and No.6 were considered more convincing than are the other two options.
The “Most Significant Options” indicated in the institutes’ and experts’ questionnaires clearly indicated the negotiation process that happened in the Delphi process (see Table 7). In the institutes’ questionnaire, four “Most Significant Options” were identified. As for the experts’ questionnaire, only one “Most Significant Option” was identified. Coincidentally, the most significant opinion of experts was the average opinion of option No.3 and No.6 in the institutes’ questionnaire, despite the minor variance. It was believed by the author that the change of the “Most Significant Option” between these two rounds of questionnaires was also evidence of the negotiation among experts and institutions. Experts supporting Option 3 and Option 6 negotiated in the Delphi process and finally revised their judgements so that consensus over the “Most Significant Option” can be achieved.

4.4. Discussions about the Selection of and Adjustments to the Delphi

The Delphi method was first developed by the RAND Company in the 1940s and was initially applied in the military field [36]. After decryption, it became one of the most well-known and widely used forecasting methods by US companies in the field of industry and public service development forecasting in the 1960s. The method then spread to Europe and Asia, and finally became popular worldwide. The effectiveness of the Delphi method has already been proved by numerous studies in various fields.
The Delphi method can be classified into three categories: the Traditional Delphi method (also known as “Classical Delphi”), the Decision-making Delphi method, and the Policy Delphi method [20]. Whereas the Traditional Delphi method and the Decision-making Delphi method are designed for collecting opinions from experts to form a consensus, the Policy Delphi method is designed for exploring the possibilities of policy settings and solutions by as much as is possible [37,38]. Meanwhile, the Traditional Delphi method and the Policy Delphi method are designed for collecting advice from experts, whereas the Decision-making Delphi method is used to collect advice from the real decision makers to build the future, rather than describing or forecasting it [39]. In brief, A “Policy” Delphi is used when there is a need to devise a strategy to address a specific problem, a “Classical” Delphi is used to establish consensus and forecast the future, and a “Decision-Making” Delphi is used to achieve better decision-making.
The reason why the Traditional Delphi method was selected depends not only on its effectiveness in collecting experts’ opinions and seeking consensus but also on its nature regarding forecasting, which is also in accordance with the essence of this research. In the context of forecasting, many forecasting methods can be used in this paper. These methods are generally separated into three categories: Qualitative Methods, Time Series & Projection methods, and Causal Methods. These forecasting methods provide forecasters with abundant choices in response to various conditions when forecasting. According to Armstrong, the selection of these forecasting methods should follow the proposed selection tree based on the following six principles: Convenience, Market popularity, Structured judgment, Statistical criteria, Relative track records and Guidelines from prior research. To examine these more critically, Convenience, “what is easy,” is inexpensive but risky; Market popularity, “what others do,” sounds appealing but is unlikely to be of value because popularity and success may not be related and because it overlooks some methods; Structured judgment, “what experts advise,” which involves rating methods against prespecified criteria, is promising; Statistical criteria, “what should work,” are widely used and valuable, but they are risky if applied narrowly; and Relative track records, “what has worked in this situation,” are expensive because they depend on conducting evaluation studies [21]. Specifically, in this paper, the Delphi was selected since the existing objective data are not sufficient for rational quantitative forecasting, no large changes are expected, and expert questionnaires are relatively cost-effective. The corresponding process is summarized in Appendix A Figure A1. In addition, the Delphi Process is also preferred due to its superiority in terms of cost, accuracy, turning-point identification, and accuracy [40,41].
Despite numerous advantages proved by previous studies, the Delphi method also has natural deficiencies, as summarized in Appendix A Table A4 [24]. In brief, the result and the effectiveness of the Delphi method are affected significantly by the perceptions of the experts’ participating in the Delphi process and the investigator’s design of the details of implementation. These deficiencies are eliminated by both a better design of the Delphi process and modifications to the methodology. Systematic sampling of experienced frontline experts and a structured questionnaire design were introduced due to Delphi’s sensitivity to design and management characteristics (see No. 1 and No. 2 in Table 8). Disadvantages related to the experts’ participation and judgments (see Nos. 3, 4, 5, and 6 in Table 8) were eliminated by conducting a kick-off meeting. The principles of participation in Delphi—as well as incentives—as approved by all the experts, were introduced. Delphi experts were required to make judgements independently and with careful consideration of their response. As for the convergence speed, many case studies have proven that, if there are significant differences of opinion among the expert panel, it might not be possible for the experts to reach consensus in limited rounds of surveys [42,43].
In response, this paper modified the first round of the Delphi questionnaire to create an institutional questionnaire so that: (1) as many kinds of opinions as possible could be explored, and (2) the following Delphi could test the robustness of all the identified results of the institutes’ questionnaire. It is believed by author that the consensus among experts could be more easily to be achieved by providing less flexibility to investigated experts in giving judgments.
Despite that the Delphi is an effective method for reaching consensus and forecasting the future, it is a method based on psychological and sociological judgments. Although the industry of promoting building EE is a complex socio-technical sector, it is not so convincing if some conclusions relevant to technologies are made without specific technological analysis. A workshop was held after the implementation of the Delphi process, with the aim of checking the feasibility of the results from a technological perspective. The calculation process is summarized in Section 3.3.

4.5. Discussions about the Investigation Outcomes

Via Delphi methods, this paper conducted one round of a nationwide institutes’ questionnaire and two rounds of an experts’ questionnaire to seek consensus and diversity of possibilities among experts regarding target setting of EE promotion of new residential buildings in China. After data processing, the “Most Agreed Option,” the “Most Significant Option,” and the “Most Possible Option” were identified, as listed in Table 9. The “Most Agreed Option,” determined on the basis of the average opinions, is similar to the “Most Significant Option” which is based on descriptive statistics. The “Most Possible Option,” which is agreed by over 80% institutes and experts at each time node, is rather conservative. This option proposes a roadmap in which EE promotion is approximately five years’ behind the other two options. Meanwhile, the average improvements between time nodes are also smaller.
It should also be noticed that the EE improvements in 2025, especially in the “Most Agreed Option” and the “Most Significant Option”, tend to be conservative but rather ambitious by 2030. Considering it took China twelve years to upgrade its national EE requirement by 30%, it seems irrational to realize an EE improvement of the same level in only five years. However, the verification workshop held after the whole Delphi Process presented the explanations by the experts involved in the questionnaire. Currently, China has adopted a percentage system as the index illustrating building EE requirements in the new residential sector. The comparison of the original energy efficiency percentage system and the energy intensity system is summarized in Table 10. This energy efficiency percentage system magnifies the effect of each equal improvement of intensity with the increase in EE requirement. For example, 5 kWh/m2a represents a 10.00% difference in improvement of EE at the 64% level that rises to 33.33% at the 82% level. Under the current system, the 30% improvement of building EE will be increasingly easy to achieve, since it equals increasingly less reduction of energy intensity. Correspondingly, the experts suggested that the current system of evaluating new residential building EE should be substituted by the new system based on energy intensity.
Along with the evaluation system, experts also came to a consensus on the final goal of new residential building EE promotion by 2030, as suggested in the “Most Agreed Option” and the “Most Significant Option”. They believed that the EE level should reach the EE requirement of “Passive House” [44]. In the 1980s, the density of energy consumption for heating in northern China (CSC climate zone) was approximately 0.45 GJ/m2a, on average, in the design phase (excluding heat loss from pipe systems). Based on the energy conversion equation, it can be calculated that the energy consumption density in the 1980s was 125 kWh/m2a. By 2030, the energy intensity of new residential buildings should, and can be reduced to lower than 15 kWh/m2a, according the “Most Agreed Option” and the “Most Significant Option.”
In comparison with many of the proposed new residential building EE promotion targets set by some of the world’s leading countries (see Table 11), either the “Most Agreed Option” or the “Most Significant Option” seems conservative. The European Union has published a formal definition of Nearly Zero Energy Building in 2010, which refers to a “nearly zero energy building” as a building that has very high energy performance. The nearly zero or very low amount of energy required should be covered to a very significant extent by energy from renewable sources, including energy from renewable sources produced either on-site or nearby [45]. Under the framework of Directive 2010/31/EU on the recast of the Energy Performance of Buildings Directive (EPBD), European countries promised to realize the EE requirements proposed in the EPBD by 2020. The “Passive House” concept, developed in Germany, is one of the best technology practices. China, as agreed by the experts investigated, will realize this target nationwide by 2030. Exceptions can also be found in the US and Japan, who also promised to achieve the goal of Net-Zero Energy Building by 2030. The EE promotion targets proposed for China in this paper are more ambitious, since the 2030 goal in America is aimed only at new federal buildings, whereas the Chinese goal is for all new residential buildings.
As stated previously in Section 2, the three identified target setting options provide a clear pathway for policy making. Future mandatory design standards for new residential building EE promotion can adopt these target settings and translate them into more detailed requirements for the key parameters affecting the performance of buildings. In accordance with one specific target setting option, government departments can develop a series of long-term policies, thus improving the confidence of and realizing the expectations from various stakeholders. Market participants in new residential building EE promotion sector can also plan and adjust their strategies for the future development.
However, it shall be also noted that a proper development of long-term policy package should take stakeholders’ opinions into consideration. In this paper, although the Delphi method has provided adequate information about target setting by investigating into frontline stakeholders, the corresponding reason and consideration why the respondents make such judgements are concealed and omitted. For future studies, it is considered by the author that, the foundation for corresponding policy package development - what the stakeholders think regarding the implementation of the targets, or in other words, why they give such forecasts towards future EE promotion, shall be investigated and analyzed.

5. Conclusions

Opinions of frontline stakeholders and their engagement are fundamental to policy-making and policy implementation, yet they are seldom discussed in new residential building EE promotion in the current context of China. By seeking and evaluating the opinions of 29 institutes and 22 experts nationwide through Delphi, this paper explored both the diversity and the consensus in their opinions. In brief, institutes and experts in the CSC Zone tend to be conservative in terms of EE promotion, whereas those in the other two climate zones in China are rather ambitious due to the lack of technology and policy innovations in the last decade. As for the opinions from stakeholders, universities and research institutes believe that EE could be further improved to a higher level, and design institutes are the most conservative. Opinions from governments are right in the middle, which can be considered as being a result of negotiation among market entities.
Despite diversities, those institutes and experts investigated agreed that the EE requirement of new residential buildings should be 75%, 82%, and 88% by 2020, 2025, and 2030, respectively, which equals an approximately 30% improvement in EE at each step (see the “Most Agreed Option” and the “Most Significant Option”). The “Most Possible Option” indicates that the EE requirement that will most likely be achieved at each time node should be a 20% improvement. In addition, the current EE promotion evaluation system using percentages should be substituted by the index of energy intensity in “kWh/ m2a” progressively from 2025.
Although the Delphi method provided a rather useful way for seeking a proper target setting for EE promotion in new residential building sector, the corresponding limitations shall be also carefully dealt with. On the one hand, the Delphi method is based on the comprehensive judgements from expert panel members. It cannot explain directly and exactly why the panel members make such decisions/judgements. As argued in Section 2, stakeholders’ perceptions are fundamental to a successful implementation of the EE targets. It is important to explore the reason why experts made such judgements in future study. The corresponding conclusions are also of significant importance for policy package development under the requirements of the EE promotion targets. On the other hand, the Delphi is basically a psychological and qualitative method. When used in the fields related to technologies, it is suggested by the author that, a verification process for the Delphi outcome is necessary for assuring a “correct” result.
Currently, China is at a crossroads on the way to higher EE in the new residential building sector. The Chinese central government has proposed a 20% EE promotion target in the “13th Five Year Plan of Building EE and Green Building Development.” However, results obtained in this paper indicate that the general agreements by most stakeholders are more optimistic than current policy settings. Many provinces have also published their local EE design standard of 30% promotion (equal to 75% EE level) since 2016. The question of whether China should either continue its “20% strategy,” as suggested in the “Most Possible Option,” or advance to the more ambitious 30% EE improvement suggested in the “Most Agreed Option” is a major problem that should be solved before the beginning of the 14th Five Year Plan. In addition, the questions of how to transform the EE promotion evaluation system based on percentages to the new system based on energy intensity and of how to develop an effective policy package overcoming the existing barriers to EE promotion are also important and in urgent need of being addressed.

Author Contributions

Conceptualization, Y.L. and N.Z.; Data curation, Y.L. and N.Z.; Formal analysis, Y.L. and B.Q.; Funding acquisition, N.Z.; Investigation, Y.L. and Beibei QIN; Methodology, Y.L., N.Z. and B.Q.; Project administration, N.Z.; Resources, Y.L., N.Z. and B.Q.; Supervision, N.Z.; Validation, Y.L. and N.Z.; Visualization, Y.L. and B.Q.; Writing – original draft, Y.L.; Writing – review & editing, N.Z. and B.Q.

Funding

This research was funded by Energy Foundation, grant number G-1402-19981.

Conflicts of Interest

The authors declare no conflict of interest.

Appendix A

Table A1. Building Energy Efficiency Design Codes.
No.YearDesign CodeIdentifierN/EFieldsDistrict
11986Energy Conservation Design Code for Civil Buildings (Heating for Residential Buildings Part)JGJ 26-1986NRBNC
21993Heating, Ventilation, and Air-Conditioning Design Code for Travelling BuildingsGB 50189-93NPBNational
31995Energy Conservation Design Code for Civil Buildings (Heating for Residential Buildings Part)JGJ 26-95NRBNC
42000Technology Specification for Energy Efficiency Renovation of Existing Residential Buildings in Northern ChinaJGJ 129-2000ERBNC
52001Technology Specification for Energy Efficiency Renovation of Existing Residential Buildings in Summer Hot Winter Cold ZoneJGJ 134-2001NRBSHWC
62003Technology Specification for Energy Efficiency Renovation of Existing Residential Buildings in Summer Hot Winter Warm ZoneJGJ 75-2003NRBSHWW
72005Energy Conservation Design Code for Public BuildingsGB 50189-2005NPBNational
82010Energy Conservation Design Code for Residential Buildings in Northern ChinaJGJ 26-2010NRBNC
92009Technology Specification for Energy Efficiency Renovation of Existing Residential BuildingsJGJ 176-2009EPBNational
102010Energy Conservation Design Code for Residential Buildings in Summer Hot Winter Cold ZoneJGJ 134-2010NRBSHWC
112012Energy Conservation Design Code for Residential Buildings in Summer Hot Winter Warm ZoneJGJ 75-2012NRBSHWW
122012Technology Specification for Energy Efficiency Renovation of Existing Residential BuildingsJGJ/T129-2012ERBNational
132015Energy Conservation Design Code for Public BuildingsGB 50189-2015NPBNational
Notes: N/E: N for New Buildings, E for Existing Buildings; NC: Northern China; SHWC: Summer Hot Winter Cold; SHWW: Summer Hot Winter Warm; RB: Residential buildings; PB: Public Buildings.
Table A2. Four Stages of Development of China’s Building Energy Efficiency Promotion.
No.StageDescription
1Research
(Before 1986)
Theoretical Analysis: Comparative studies, which focused on policy framework, pilot projects, technologies, and advanced experience, were conducted between China and international countries. Soon after the investigation, the first design codes for building energy efficiency field-Design standard for energy efficiency of civil buildings, in which the energy efficiency promotion target was set to 30%, were published.
2Pilot Project and Demonstration
(1986–2000)
Pilot Project in Northern China: During this period, efforts were focused on research and development of energy efficiency technologies and setting up relevant code and pilot projects. A new energy efficiency promotion target of 50% energy efficiency promotion was set up in the first five-year plan of the building energy efficiency promotion field — The ninth five-year arrangement and plan to 2010 of building energy efficiency promotion. In the following decade, a series of policies, technical standards, and implementation guides were published. At the same time, hundreds of research projects were carried out, and the relevant achievements provided useful information and solid theoretical foundation for the building energy efficiency promotion industry. Also, technical products, such as solar energy implementation equipment, were developed and implemented. Before 2010, 1,400 million square meter energy efficient buildings were built. Technical education and international cooperation were also widely put into practice.
3Gradual popularization
(2001–2005)
Legalization: Along with the publication of ‘The Regulations of Energy Conservation of Civil Buildings’ in 2005, the process of legalization of the building energy promotion industry was launched by the central government. The industry began to spread all over China gradually. At the same time, the institution system and the standard system also began to be improved. The regulations for energy conservation of civil buildings, which were formed based on previous experience and lessons and were of great importance, were designed to regulate the whole industry to adapt to the new developing trend (higher building energy efficiency, gradual mass promotion, and marketization) since 1986 and both guide and support the local governments to push the work in a lawful way. Local building energy efficiency promotion targets and building energy efficiency promotion development plans were also published successively by provincial governments. In all, 28 out of 32 provinces in China made their own 11th-five-year plan of building energy efficiency promotion. Some provinces published their new design code of 65% energy saving in advance. In addition, institutional reform in heating systems and large-scale application of renewable energy in the residential building field were also carried out steadily.
4Mass promotion
(After 2006)
Process of Perfection and Promotion: During this period, the energy efficiency design code system was revised and improved at least twice. The current national building energy efficiency design code was promoted to 65%, and some major cities, such as like Beijing and Tianjin had already published their local design code, applying a 75% energy efficiency level. The ratio of projects obeying building energy codes to all the newly built residential building projects, both in design phase and construction phase, had already reached 100% based on annual national inspection in terms of building energy efficiency promotion launched by the Ministry of Housing and Urban-Rural Development. At the same time, regulations and policy systems in each province were being perfected. All the provinces had published their own regulations in terms of building energy efficiency. Moreover, the scope of building energy efficiency had also expanded to green building development. Besides the energy efficiency, requirements for conservation of materials, water, land, and eco-friendliness were also set up in the new national standard. The “Three efficiency Changes” mentioned above gradually became mainstream during this period.
Table A3. Questionnaire Design of Questionnaires.
Institutes’ QuestionnaireWhat Energy Efficiency Level Do You Think China Should Reach for New Residential Buildings?
CurrentYear 2020Year 2025Year 2030
65%%%%
Experts’ Questionnaire – first roundWhat energy efficiency level do you think China should reach for new residential buildings? Please give revisions to the following settings of new residential building energy efficiency levels
SettingsYear 2020Year 2025Year 2030
75%90%100%
RevisionsYear 2020Year 2025Year 2030
%%%
Experts’ Questionnaire – second roundPlease evaluate the ACHIEVABILITY of the following energy efficiency levels at different time nodes.
Time nodeEnergy Efficiency1 to 5; 1 refers to “can’t be achieved” and 5 refers to “sure to be achieve”
Current65%1 2 3 4 5
Year 202072%1 2 3 4 5
Year 202578%1 2 3 4 5
Year 203082%1 2 3 4 5
Table A4. Advantages and Disadvantages of Delphi.
No.AdvantagesDisadvantages
1It is systematic and flexibleThe Delphi technique is very sensitive to design characteristics, including level of participants’ expertise and clarity of the questions
2It utilizes expert judgmentThe technique is very sensitive to the management of questionnaires, understanding written documents, symbolic or idiomatic meaning, and cultural barriers
3It is an iterative processExperts’ willingness to allow their judgments to be re-formed by the opinions of others
4It is anonymousExperts are vulnerable to high rates of attrition
5It eliminates the influence of personalityThe potential use of incentives or moral persuasion to identify experts and/or encourage sustained participation
6It combines advantages of both single and group interviewsRisk of specious consensus: Participants acquiescing and conforming to dominant opinions or comfortable familiar arguments may increase the risk of specious consensus in the Delphi forum
7It produces reliable and valid resultsProblems in determining what actually constitutes consensus
8It lends itself to the use of modern communications’ methodsMultiple iterations take time to complete and can be costly in terms of researchers’ time
9Feedback is controlled---
10It is well-established and insightful
Figure A1. Selection Tree for Forecasting Methods.
Energies 12 01629 g0a1

References

  1. Li, Y.; Zhu, N.; Qin, B. What Affects the Progress and Transformation of New Residential Building Energy Efficiency Promotion in China: Stakeholders’ Perceptions. Energies 2019, 12, 1027. [Google Scholar] [CrossRef]
  2. Zou, P.X.W.; Xu, X.; Sanjayan, J.; Wang, J. Review of 10 years research on building energy performance gap: Life-cycle and stakeholder perspectives. Energy Build. 2018, 178, 165–181. [Google Scholar] [CrossRef]
  3. Adinyira, E.; Kwofie, T.E.; Quarcoo, F. Stakeholder requirements for building energy efficiency in mass housing delivery: The House of Quality approach. Environ. Dev. Sustain. 2018, 20, 1–17. [Google Scholar] [CrossRef]
  4. Mlecnik, E.; Visscher, H.; van Hal, A. Barriers and opportunities for labels for highly energy-efficient houses. Energy Policy 2010, 38, 4592–4603. [Google Scholar] [CrossRef]
  5. Rowe, G.; Frewer, L.J. A Typology of Public Engagement Mechanisms. Sci. Technol. Hum. Values 2005, 30, 251–290. [Google Scholar] [CrossRef] [Green Version]
  6. Alemanno, A. Stakeholder Engagement in Regulatory Policy. 2015. Available online: https://papers.ssrn.com/sol3/papers.cfm?abstract_id=2701675 (accessed on 27 April 2019).
  7. Li, H.; Ng, S.T.; Skitmore, M. Stakeholder impact analysis during post-occupancy evaluation of green buildings–A Chinese context. Build. Environ. 2018, 128, 89–95. [Google Scholar] [CrossRef]
  8. Huo, T.; Ren, H.; Zhang, X.; Cai, W.; Feng, W.; Zhou, N.; Wang, X. China’s energy consumption in the building sector: A Statistical Yearbook-Energy Balance Sheet based splitting method. J. Clean. Prod. 2018, 185, 665–679. [Google Scholar] [CrossRef]
  9. U.S. Energy Information Adiminstration. International Energy Outlook 2014. 2014. Available online: https://www.eia.gov/pressroom/presentations/sieminski_09222014_columbia.pdf (accessed on 27 April 2019).
  10. European Commission, E.U. EU Energy Transport and GHG emissions trends to 2050. 2013. Available online: https://ec.europa.eu/energy/en/publications/eu-energy-transport-and-ghg-emissions-trends-2050 (accessed on 27April 2019).
  11. World Bank Urban China: Toward Efficient, Inclusive, and Sustainable Urbanization. 2014, pp. 1–583. Available online: http://www.worldbank.org/en/country/china/publication/urban-china-toward-efficient-inclusive-sustainable-urbanization (accessed on 27 April 2019).
  12. Sbci, U. Buildings and Climate Change Summary for Decision-Makers. 2009. Available online: https://europa.eu/capacity4dev/unep/document/buildings-and-climate-change-summary-decision-makers (accessed on 27 April 2019).
  13. Zhang, M.; Wang, M.; Jin, W.; Xia-Bauer, C. Managing energy efficiency of buildings in China: A survey of energy performance contracting (EPC) in building sector. Energy Policy 2018, 114, 13–21. [Google Scholar] [CrossRef]
  14. International Energy Agency. Setting Energy Efficiency Targets 2017. Available online: https://www.iea.org/publications/freepublications/publication/EnergyEfficiencyTargetsEnergyEfficiencyInsightsBrief.pdf (accessed on 29 April 2019).
  15. Xie, H.; Yu, Z.; Wu, J. The Current Situation and Problems in China’s Building Energy Efficiency. Procedia Eng. 2011, 21, 1145–1151. [Google Scholar] [CrossRef]
  16. Tsinghua University Building Energy Conservation Research Center. Annual Report on China Building Energy Conservation 2017; China Architecture & Building Press: Beijing, China, 2017. (in Chinese) [Google Scholar]
  17. Liu, W.; Zhang, J.; Bluemling, B.; Mol, A.P.; Wang, C. Public participation in energy saving retrofitting of residential buildings in China. Appl. Energy 2015, 147, 287–296. [Google Scholar] [CrossRef]
  18. Li, T.H.; Thomas Ng, S.; Skitmore, M. Modeling multi-stakeholder multi-objective decisions during public participation in major infrastructure and construction projects: A decision rule approach. J. Constr. Eng. Manag. 2015, 142, 04015087. [Google Scholar] [CrossRef]
  19. Li, T.H.; Ng, S.T.T.; Skitmore, M.; Li, N. Investigating stakeholder concerns during public participation. ICE Publ. 2016, 169, 199–219. [Google Scholar] [CrossRef]
  20. Linstone, H.A.; Turoff, M. The Delphi Method: Techniques and Applications; Addison-Wesley: Reading, MA, USA, 1975; Volume 29. [Google Scholar]
  21. Armstrong, J.S. Selecting Forecasting Method. In Principles of Forecasting: A Handbook for Researchers and Practitioners; Kluwer Academic Publishers: New York, NY, USA, 2001. [Google Scholar]
  22. Greatorex, M. Questionnaire Design; John Wiley & Sons, Ltd.: Hoboken, NJ, USA, 2015. [Google Scholar]
  23. Avella, J.R. Delphi panels: Research design, procedures, advantages, and challenges. Int. J. Dr. Stud. 2016, 11, 305–321. [Google Scholar] [CrossRef]
  24. Ritchie, C. Consulting the Oracle? Applications of Modified Delphi Technique to Qualitative Research in the Hospitality Industry. Int. J. Comtemporary Hosp. Manag. 2012, 24, 886. [Google Scholar]
  25. Feist, W.; Guo, L.; Sheng, S.; Jiang, H. Passive House in China: Health, Comfort, Affrodability and Sustainability. Eco-city Green Build. 2016. (in Chinese). Available online: http://www.cnki.com.cn/Article/CJFDTotal-DNGN201603028.htm (accessed on 27 April 2019).
  26. Zhou, Z.; Zhang, Z.; Zuo, J.; Huang, K.; Zhang, L. Phase change materials for solar thermal energy storage in residential buildings in cold climate. Renew. Sustain. Energy Rev. 2015, 48, 692–703. [Google Scholar] [CrossRef]
  27. Ling, J.; Xing, J.; Ma, H.; Yu, H. Quantitative research of incentive effects of heat-metering policy on energy-saving behavior in Tianjin. Energy Front. (Engl. Ed.) 2014, 8, 504–512. [Google Scholar] [CrossRef]
  28. Zhou, Z.; Wang, C.; Sun, X.; Gao, F.; Feng, W.; Zillante, G. Heating energy saving potential from building envelope design and operation optimization in residential buildings: A case study in northern China. J. Clean. Prod. 2018, 174, 413–423. [Google Scholar] [CrossRef]
  29. Ye, Q. China Low-carbon Development Annual Report (2013); Social Science Academic Press: Beijing, China, 2013; ISBN 978-7-5097-4160-3. (in Chinese) [Google Scholar]
  30. Li, J.; Shui, B. A comprehensive analysis of building energy efficiency policies in China: status quo and development perspective. J. Clean. Prod. 2015, 90, 326–344. [Google Scholar] [CrossRef]
  31. Shuai, Z.; Lihua, Z.; Rong, J.; Dong, J. Deep Influence of Passive Low Energy Consumption Multi-Storey Residential Building in Cold Region; IOP Publishing: Bristol, England, 2018; Volume 113, p. 012171. [Google Scholar]
  32. Hu, S.; Yan, D.; Cui, Y.; Guo, S. Urban residential heating in hot summer and cold winter zones of China—Status, modeling, and scenarios to 2030. Energy Policy 2016, 92, 158–170. [Google Scholar] [CrossRef]
  33. Lu, S.; Wang, R.; Zheng, S. Passive Optimization Design Based on Particle Swarm Optimization in Rural Buildings of the Hot Summer and Warm Winter Zone of China. Sustainability 2017, 9, 2288. [Google Scholar] [CrossRef]
  34. Yao, R.; Costanzo, V.; Li, X.; Zhang, Q.; Li, B. The effect of passive measures on thermal comfort and energy conservation. A case study of the hot summer and cold winter climate in the Yangtze River region. J. Build. Eng. 2018, 15, 298–310. [Google Scholar] [CrossRef]
  35. Huang, B.; Mauerhofer, V.; Geng, Y. Analysis of existing building energy saving policies in Japan and China. J. Clean. Prod. 2016, 112, 1510–1518. [Google Scholar] [CrossRef]
  36. Dalkey, N. The Delphi Method: An Experimental Study of Group Opinion. Futures 1969, 1, 408–426. [Google Scholar] [CrossRef]
  37. Rayens, M.K.; Hahn, E.J. Building consensus using the policy Delphi method. Policy politics Nurs. Pract. 2000, 1, 308–315. [Google Scholar] [CrossRef]
  38. Simmonds, W.C. The nature of futures problems. In Futures Research: New Directions; Addison-Wesley: Reading, MA, USA, 1977; pp. 13–26. [Google Scholar]
  39. Rauch, W. The Decision Delphi. Technol. Forecast. Soc. Chang. 1979, 15, 159–169. [Google Scholar]
  40. John, C.; Chambers, S.K.M. How to choose the right forecasting method. Harv. Bus. Rev. 1971, 49, 26. [Google Scholar]
  41. Rowe, G.; Wright, G. Expert opinions in forecasting role of the Delphi technique. Princ. Forecast. 2001, 30, 125–144. [Google Scholar]
  42. Kincaid, S.O. Web-Based Courses in Human Services: A Comparison of Student and Faculty Perceptions of Factors That Facilitate or Hinder Learning. 2004. Available online: https://elibrary.ru/item.asp?id=6713735 (accessed on 27 April 2019).
  43. Brungs, A.; Jamieson, R. Identification of Legal Issues for Computer Forensics. Inf. Syst. Manag. 2005, 22, 57–66. [Google Scholar] [CrossRef]
  44. Wang, Y.; Kuckelkorn, J.; Zhao, F.-Y.; Spliethoff, H.; Lang, W. A state of art of review on interactions between energy performance and indoor environment quality in Passive House buildings. Renew. Sustain. Energy Rev. 2017, 72, 1303–1319. [Google Scholar] [CrossRef]
  45. Kyriakou, V.V. Zero Energy Buildings: The Impact of Different Definitions on Achieving the ZEB Goals: Comparactive Analysis of Five Buildings; International Hellenic University: Thessaloniki, Greece, 2012; Available online: https://repository.ihu.edu.gr/xmlui/bitstream/handle/11544/447/V.KYRIAKOU_Thesis_2012_FINAL5_11_12.pdf?sequence=1 (accessed on 29 April 2019).
Figure 1. Gross Domestic Production (GDP) and Urbanization Rate from 2000 to 2017. Reproduced with permission from Yinan LI, Neng Zhu and Beibei Qin, What Affects the Progress and Transformation of New Residential Building Energy Efficiency Promotion in China: Stakeholders’ Perceptions; published by Energies, 2019.
Energies 12 01629 g001
Figure 2. Area of residential buildings: (a) The area of new residential buildings under construction and constructed per year from 2000 to 2016; (b) the area of residential buildings in each year from 2001 to 2017. (a) is reproduced with permission from Yinan LI, Neng Zhu and Beibei Qin, What Affects the Progress and Transformation of New Residential Building Energy Efficiency Promotion in China: Stakeholders’ Perceptions; published by Energies, 2019; (b) is reproduced with permission from Yinan LI, Neng Zhu and Beibei Qin, Major Barriers to the New Residential Building Energy-Efficiency Promotion in China: Frontlines’ Perceptions;published by Energies, 2019.
Energies 12 01629 g002
Figure 3. Energy consumption of buildings from 2000 to 2014 in China. (a) The total energy consumption of buildings, residential buildings and the corresponding percentage in the entire country; (b) the calculated energy intensity in residential buildings based on the area data in Figure 2b and the energy data in Figure 3a. Reproduced with permission from Yinan LI, Neng Zhu and Beibei Qin, Major Barriers to the New Residential Building Energy-Efficiency Promotion in China: Frontlines’ Perceptions; published by Energies, 2019.
Energies 12 01629 g003
Figure 4. Breakout of China Building Energy Consumption by Sector in 2015.
Energies 12 01629 g004
Figure 5. Energy Intensity of Centralized Heating in Northern China.
Energies 12 01629 g005
Figure 6. Delphi Investigation Process.
Energies 12 01629 g006
Figure 7. Data Processing Steps.
Energies 12 01629 g007
Figure 8. Dispersion of All Institutes Opinions.
Energies 12 01629 g008
Figure 9. Dispersion of Government Opinions.
Energies 12 01629 g009
Figure 10. Dispersion of Non-Government Opinions.
Energies 12 01629 g010
Figure 11. Distribution of Various Types of Institutes.
Energies 12 01629 g011
Figure 12. Distribution of Opinions of Institutes in Different Climate Zones.
Energies 12 01629 g012
Figure 13. Distribution of Experts’ Opinions.
Energies 12 01629 g013
Figure 14. Distribution of Experts’ Opinions regarding Climate, Working Years, Professional Ranks and Domain Knowledge.
Energies 12 01629 g014
Figure 15. Accumulative Percentage Distribution of Institutes’ Opinions.
Energies 12 01629 g015
Figure 16. Accumulative Percentage Distribution of Experts’ Opinions.
Energies 12 01629 g016
Figure 17. Translation of Likert 5-Scale in the 3rd round questionnaire.
Energies 12 01629 g017
Table 1. Results of Institute Selection and Delphi Expert Selection.
Institute Selection
CategoriesNo.
Climate ZoneCSC *5
SHWC *13
SHWW *11
GDP per capita (1000 YUAN)<3715
37 to 703
>7011
Property of institutesGovernment Departments12
Research Institutes5
Design Institute4
University and College3
Real estate enterprise3
Quality supervision agency1
Related enterprise1
Delphi Expert Panel Formulation
CategoriesNo. InvitedNo. Responded
Climate ZoneCSC *86
SHWC *118
SHWW *64
Professional RanksSenior1913
Medium65
Working years5–10 years33
11–20 years97
more than 20 years138
Research domainArchitecture76
HVAC1610
Structure22
* Notes: CSC-Cold and Severe Cold Climate zone; SHWC-Summer Hot Winter Cold Climate zone; SHWW-Summer Hot Winter Warm Climate zone.
Table 2. Correlation between GDP and EE Requirements.
Indexs for Correlation CalculationGDP Per CapitaYear 2030Year 2020Year 2025
GDPPearson Correlation Coefficient10.1910.382 *0.294
Significance 0.3210.0410.121
Amount of Cases29292929
Notes: * represents that the correlation is significant at the 5% level (double tail).
Table 3. Variance of Experts’ Opinions.
Climate20252030Professional Rank20252030
CSC0.30%0.30%Senior0.10%0.20%
SHWC0.20%0.10%Medium0.50%0.50%
SHWW0.40%0.40%Total0.30%0.20%
Working Years20252030Domain20252030
Over 200.10%0.20%Architecture0.20%0.20%
5 to 100.20%0.60%HVAC0.20%0.20%
10 to 200.40%0.10%Structure0.00%0.50%
Table 4. Comparison between Institutes’ opinions and experts’ opinions.
CalculationsYear 2020Year 2025Year 2030CalculationsYear 2020Year 2025Year 2030
Institutes’ Opinions76.90%81.79%87.41%Relative Difference4.29%0.15%2.01%
Experts’ Opinions73.60%81.67%89.17%Average Approximation75%82%88%
Direct Difference3.30%0.12%1.76%Relative Improvement31.42%28%33%
Table 5. Average and Proposed EE Requirement of Most Possible Option and Delphi Assessment.
AverageProposedAverage ValueVariance
EE RequirementEE ImprovementEE RequirementEE Improvement
Current65%-0.6520%-
Year 202071%17%72%3.590.25
Year 202576%16%78%3.530.4
Year 203082%27%82%3.240.6
Table 6. Result of Logical Combination.
NoEE RequirementEELoC-HCNoEE RequirementEELoC-HC
202020252030202020252030202020252030202020252030
172%75%79%YNN1872%76%100%YYN2
272%75%83%YNY2972%85%95%YYY3
372%75%95%YNY21072%85%100%YYN2
472%75%100%YNN11176%85%95%NYY2
572%76%79%YYN21276%85%100%NYN1
672%76%83%YYY31380%85%95%YYY3
772%76%95%YYY31480%85%100%YYN2
Notes: Y-Yes; N-No; C-Count.
Table 7. Most Significant Options in Institutes’ and Experts’ Questionnaires.
QuestionnaireNoEE RequirementEE Improvement‘Relative Frequency
202020252030202020252030202020252030
Experts175%80%90%28.57%20.00%50.00%66.67%38.89%38.89%
Institutes372%76%83%20.00%14.00%29.00%20.69%20.69%17.24%
472%76%95%20.00%14.00%79.00%20.69%20.69%17.24%
572%85%95%20.00%46.00%67.00%20.69%20.69%17.24%
680%85%95%43.00%25.00%67.00%17.24%20.69%17.24%
Institutes ‘Average opinion76%80.5%89%31.43%18.75%43.59%---
Table 8. Responses of Delphi Method Based on Disadvantages.
No.DisadvantagesMeasures/Modifications
1The Delphi technique is very sensitive to design characteristics including level of participants’ expertise and clarity of the questionsParticipants’ Expertise: Systematic sampling concerning critical factors, including personal experience of experts
Clarity of Questions: In accordance with Principles of Questionnaire Design
2The technique is very sensitive to the management of questionnaires, understanding of written documents, symbolic or idiomatic meaning, and cultural barriersStructured questionnaire design based on a rational method
Analysis considering the background of institutes and experts is also conducted
3Experts’ willingness to allow their judgments to be re-formed by the opinions of othersIllustration in Kick-off meeting of Delphi
4Experts are vulnerable to high rates of attrition
5The potential use of incentives or moral persuasion to identify experts and/or encourage sustained participationSetting up a rational incentive policy for experts
6Risk of specious consensus: Participants acquiescing and conforming to dominant opinions or comfortable familiar arguments may increase the risk of specious consensus in the Delphi forumRefer to No. 2
7Problems in determining what actually constitutes a consensusResults from large-scale questionnaire and Condition of convergence
8Multiple iterations take time to complete and can be costly in terms of researchers’ timeLarge-Scale Institutional Questionnaire is conducted to seek consensus among a wider range of experts
Table 9. Results of Data Processing.
OptionsEE RequirementEE Improvement
over Previous Time Node
EE Improvement
over Current Status
202020252030202020252030202020252030
Most Agreed75%82%88%28.57%28.00%33.33%28.57%48.57%65.71%
Most Significant76%80%89%30.00%18.37%45.00%31.43%42.86%68.57%
Most Possible72%78%82%20.00%21.43%18.18%20.00%37.14%48.57%
Table 10. Comparison between EE Percentage and Energy Intensity.
StageTNEEEnergy IntensityDifference
RDDIIAValueIIAIntensityR
History198630%30%30.00%30.00%87.537.537.500.000.00%
199550%20%28.57%30.00%62.52526.251.251.43%
201065%15%30.00%30.00%43.7518.7518.750.000.00%
Current 65%15%30.00%30.00%43.75013.1313.130.00%
Most Agreed Option202075%10%28.57%30.00%31.2512.513.130.631.43%
202582%7%28.00%30.00%22.58.759.380.632.00%
203088%6%33.33%30.00%157.56.750.753.33%
Most Significant Option202076%11%31.43%30.00%3013.7513.130.631.43%
202580%4%18.37%20.00%2556.001.001.63%
203089%9%45.00%45.00%13.7511.2511.250.000.00%
Most Possible Option202072%7%20.00%20.00%358.758.750.000.00%
202578%6%21.43%20.00%27.57.57.000.501.43%
203082%4%18.18%20.00%22.555.500.501.82%
Notes: TN-Time Node; R-Requirement; I-Improvement; IA-Improvement Approximation; DD- Direct Difference.
Table 11. EE Targets of Major Countries.
Country/RegionTarget YearTarget
Settings
Notes
The United States2030Net-Zero Energy Building in new federal buildingsThe building requires a small amount of energy that can be supplied by energy from renewable sources, including those produced either on-site or nearby.
United Kingdom2016Zero-Energy/Zero-EmissionNew residential buildings should be built as Zero-Energy Buildings from 2016
European Union2020Nearly Zero-Energy BuildingsAll new residential buildings must be nearly zero-energy buildings by 31 December 2020
Netherlands2020Energy-neutralThe building produces the same amount of energy that it consumes
Germany2020Zero-fossil-fuel-consumptionThe building runs without the need for fossil fuel
France2020Positive energyThe building produces more energy than it consumes
Denmark202075% EE promotion than 2006Reduce building energy consumption by 75% compared to 2006
Japan2030Net-zero energy buildingSame as Notes for the United States

