Effect of Fuel and Air Dilution on Syngas Combustion in an Optical SI Engine

 ,
,  , ,
, ,
Abstract
1. Introduction
2. Experimental Setup and Methodology
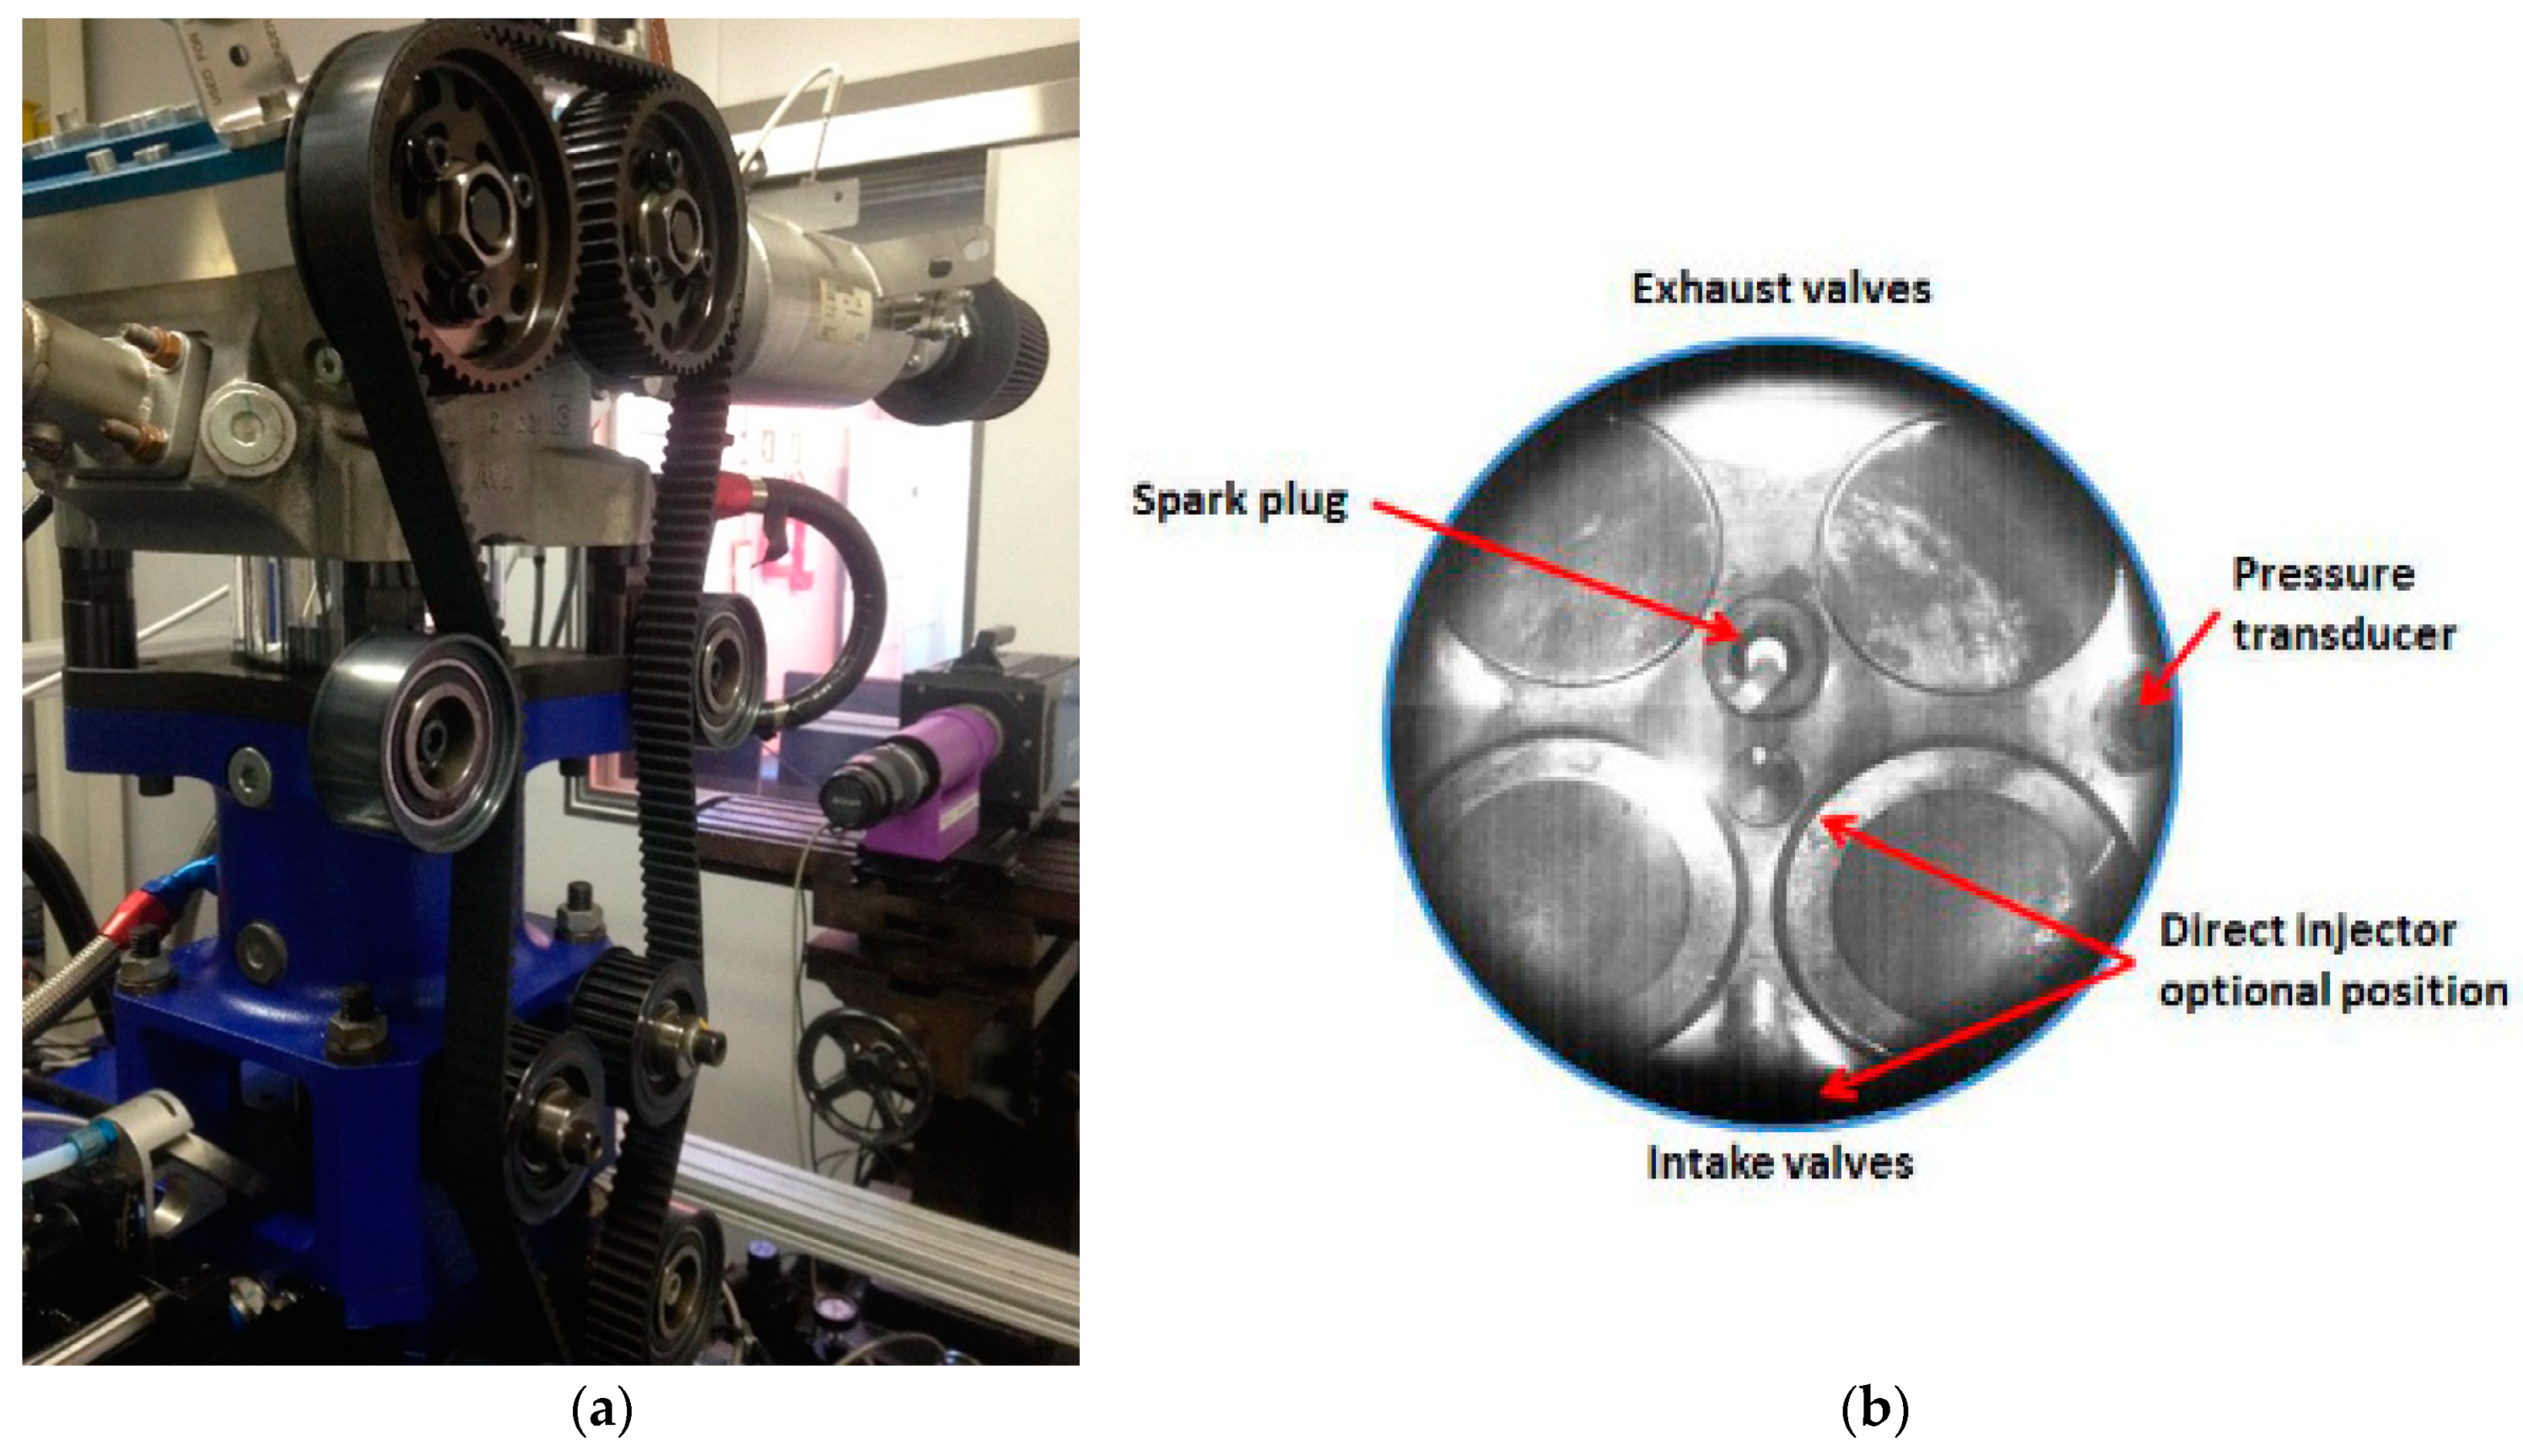
2.1. Experimental Apparatus
2.2. Fuels
2.3. Thermodynamic and Optical Measurements
3. Results
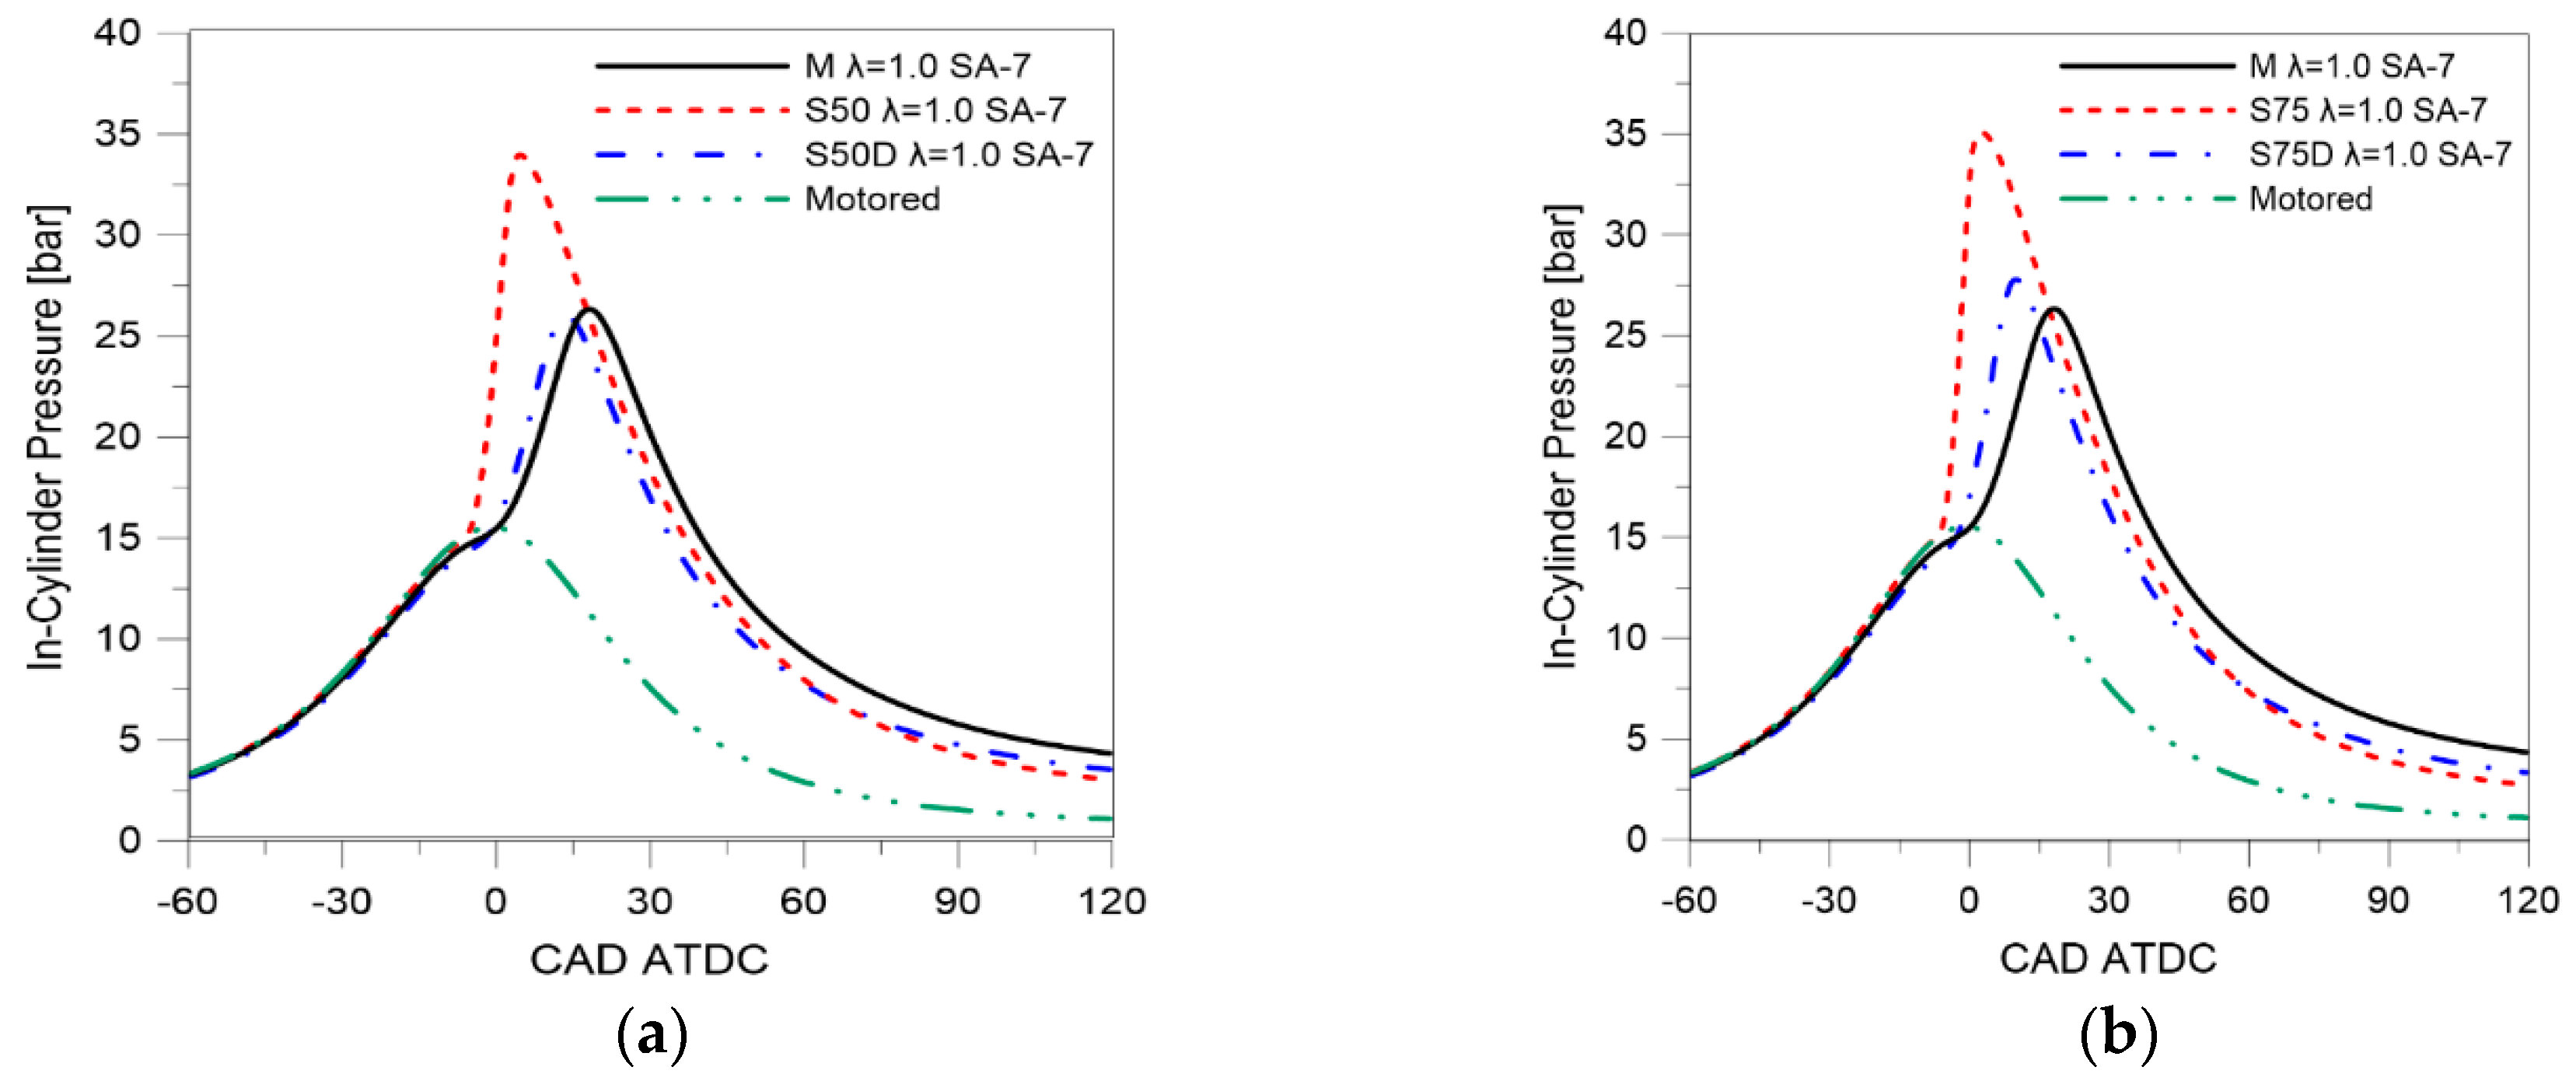
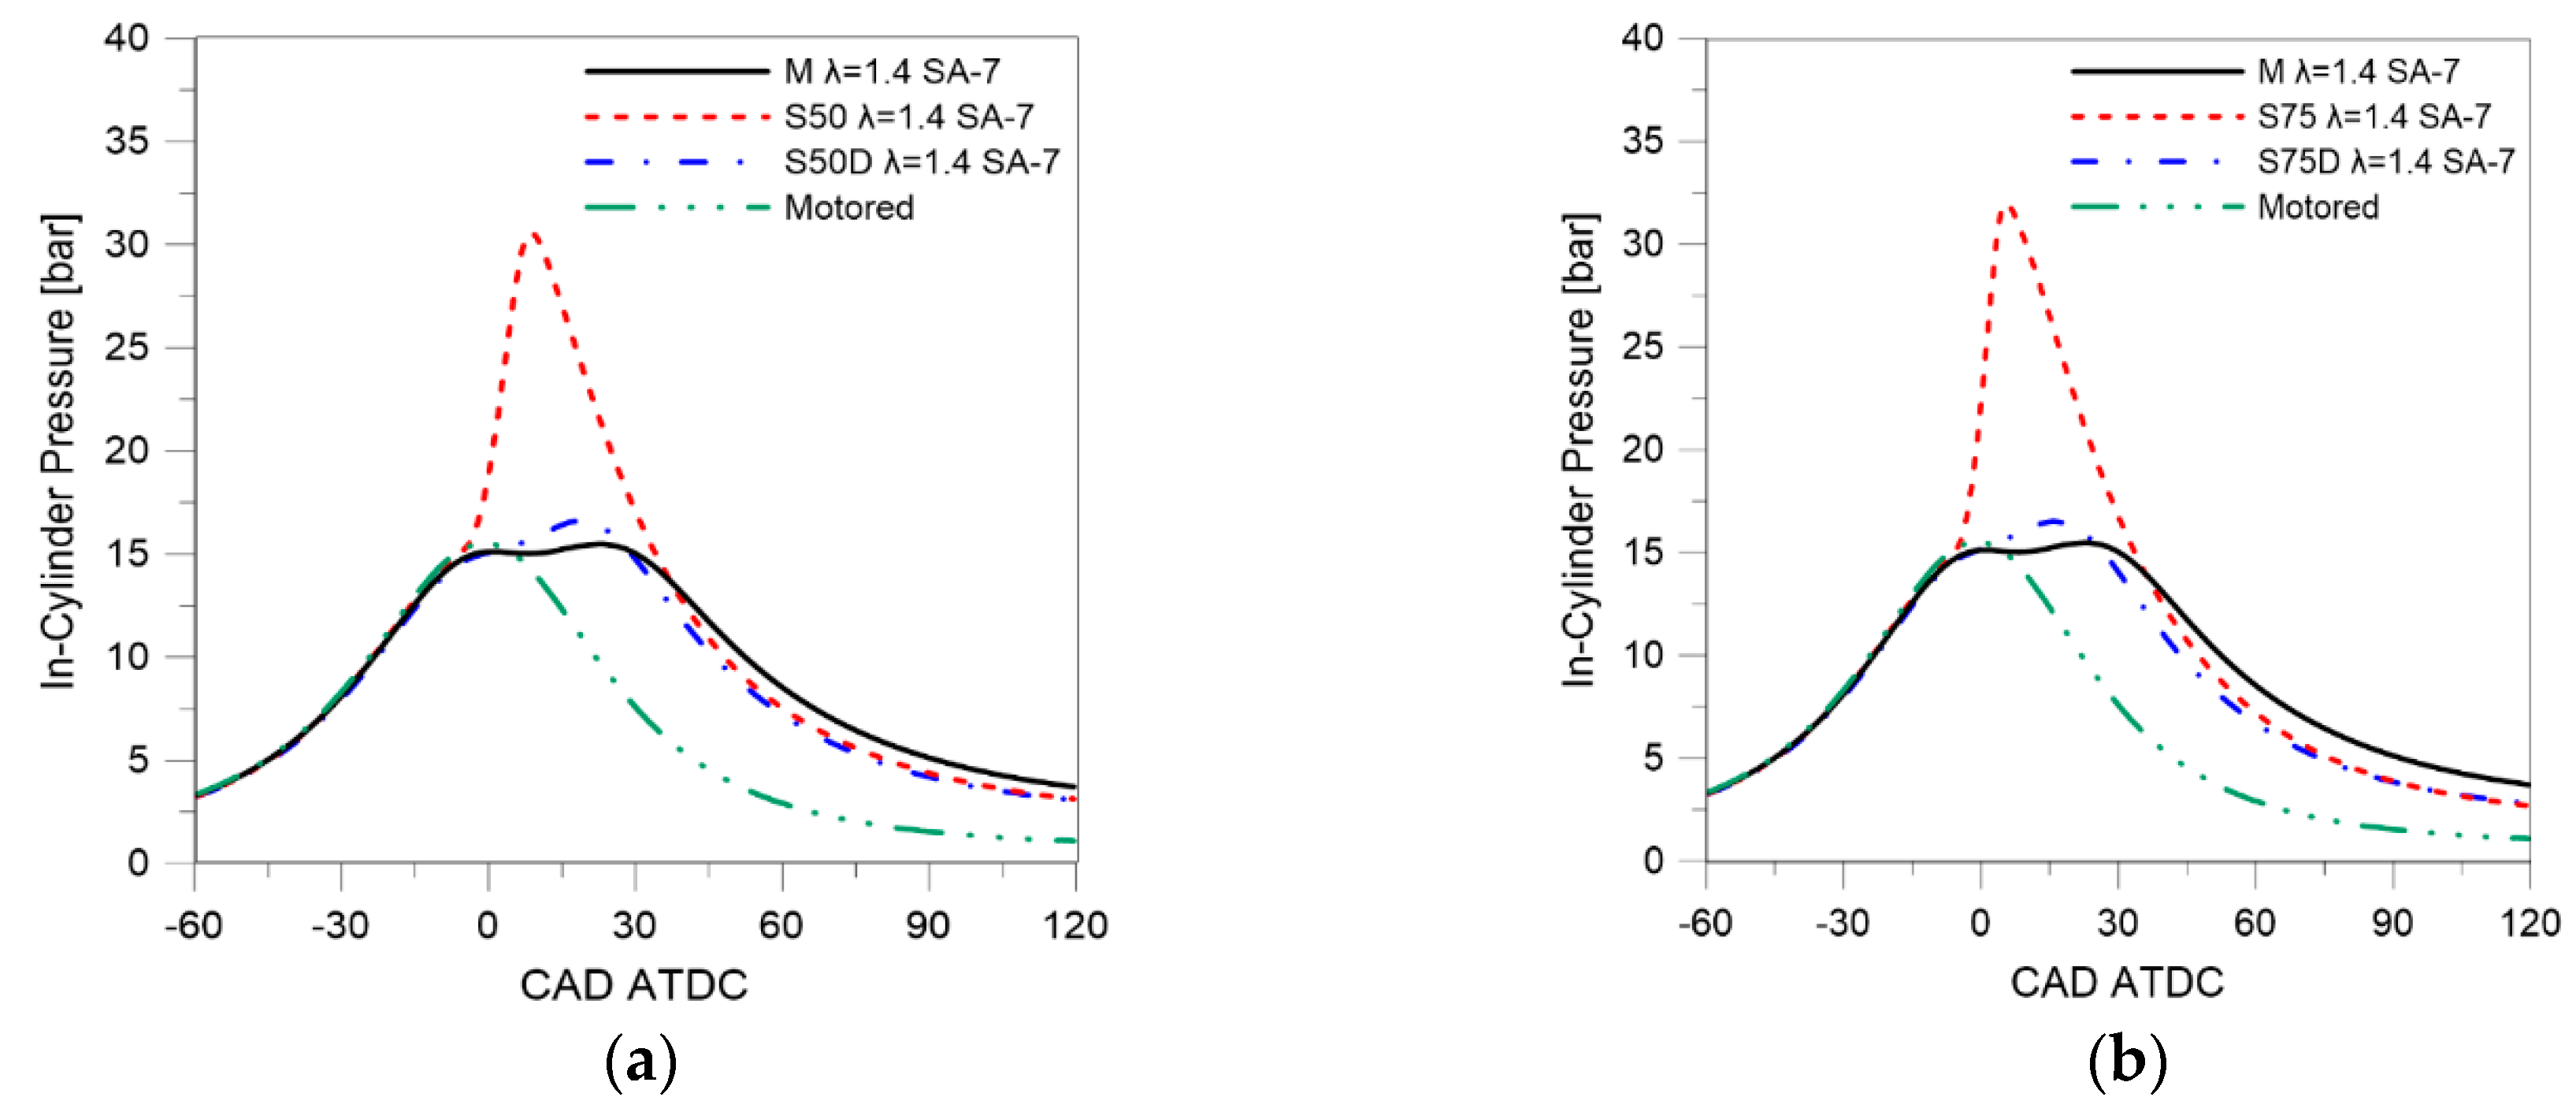
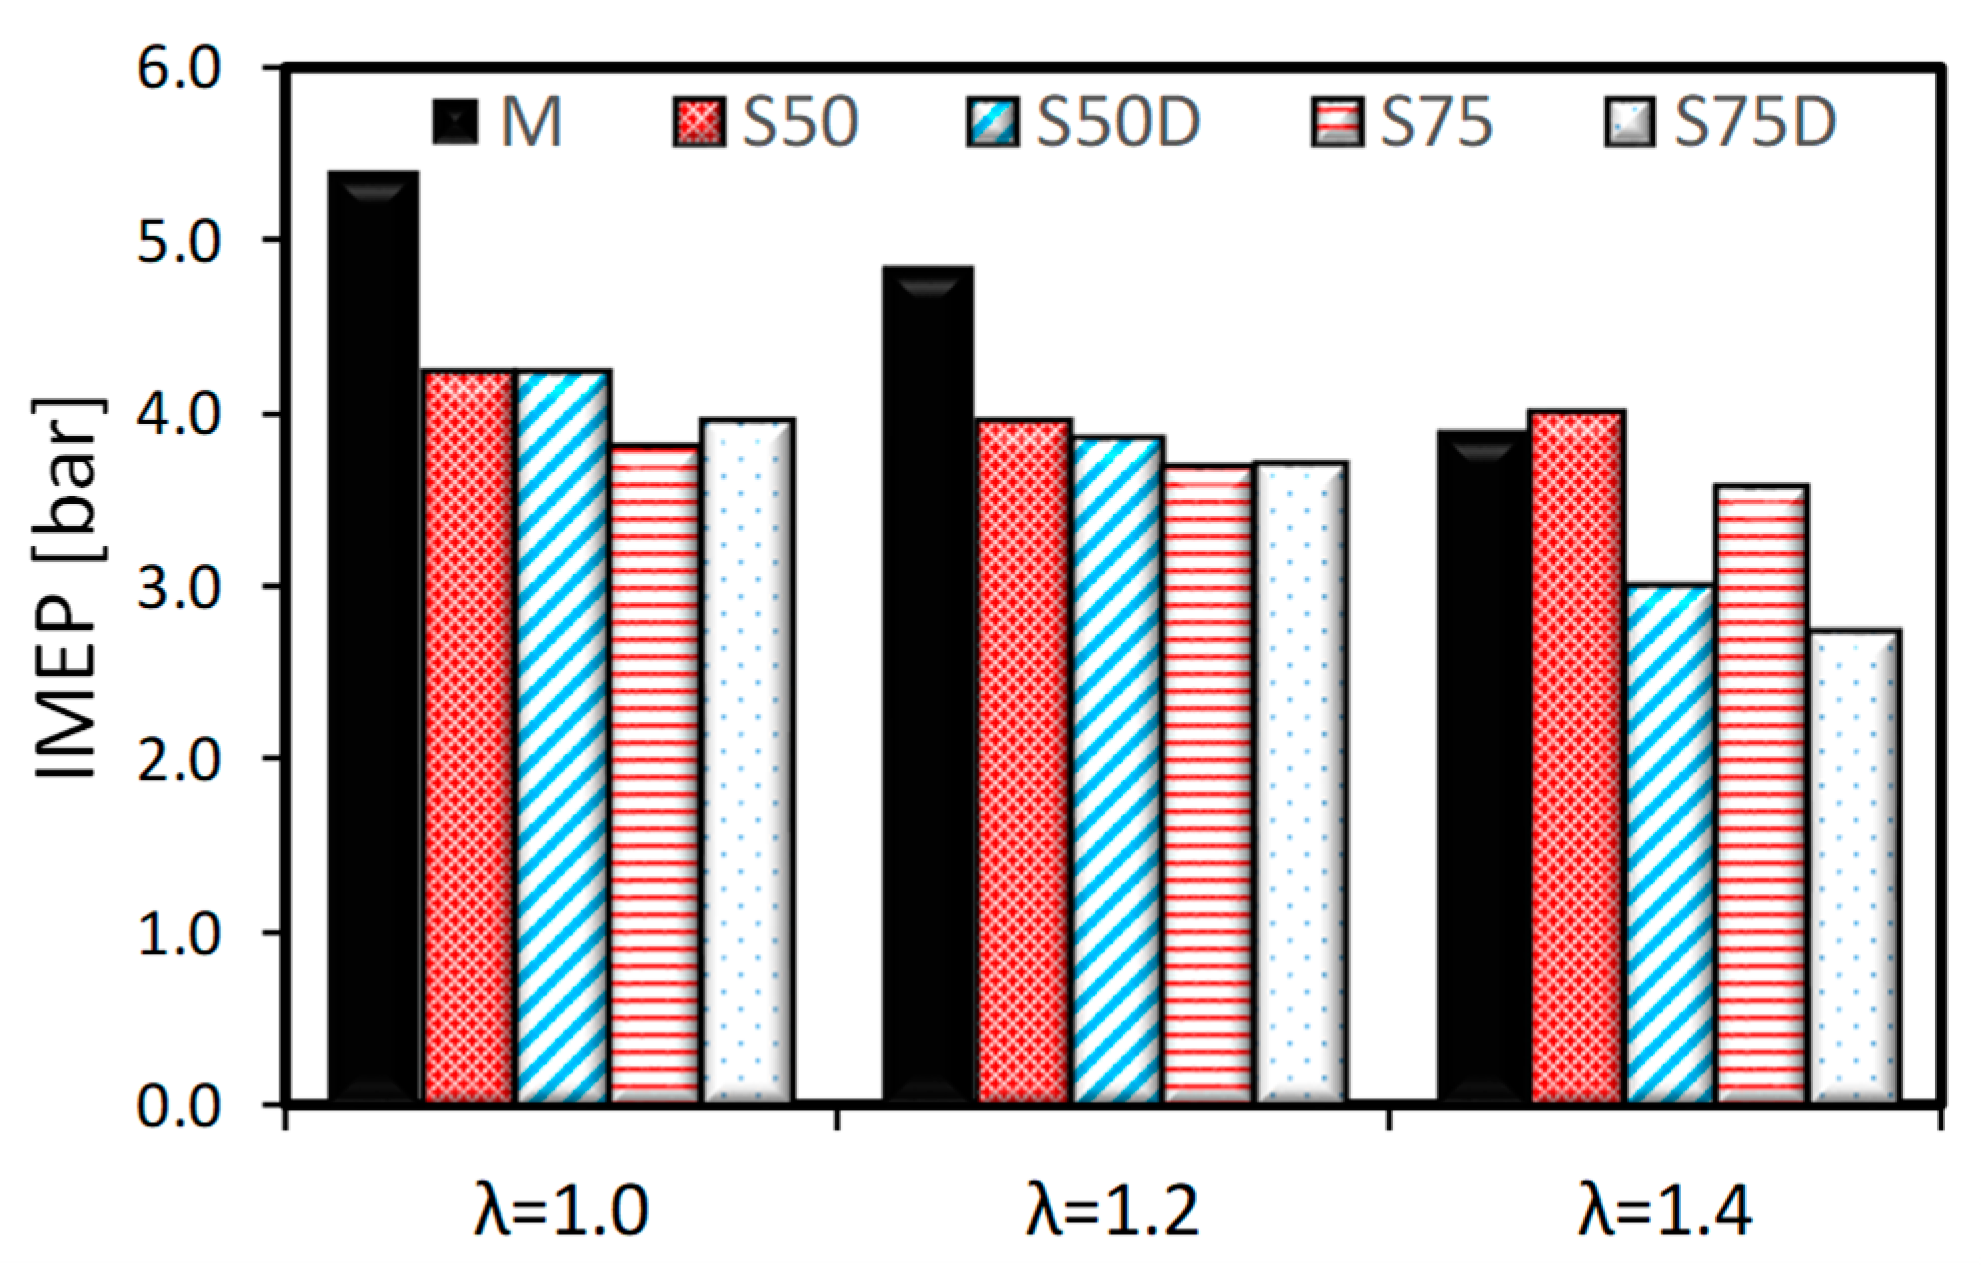
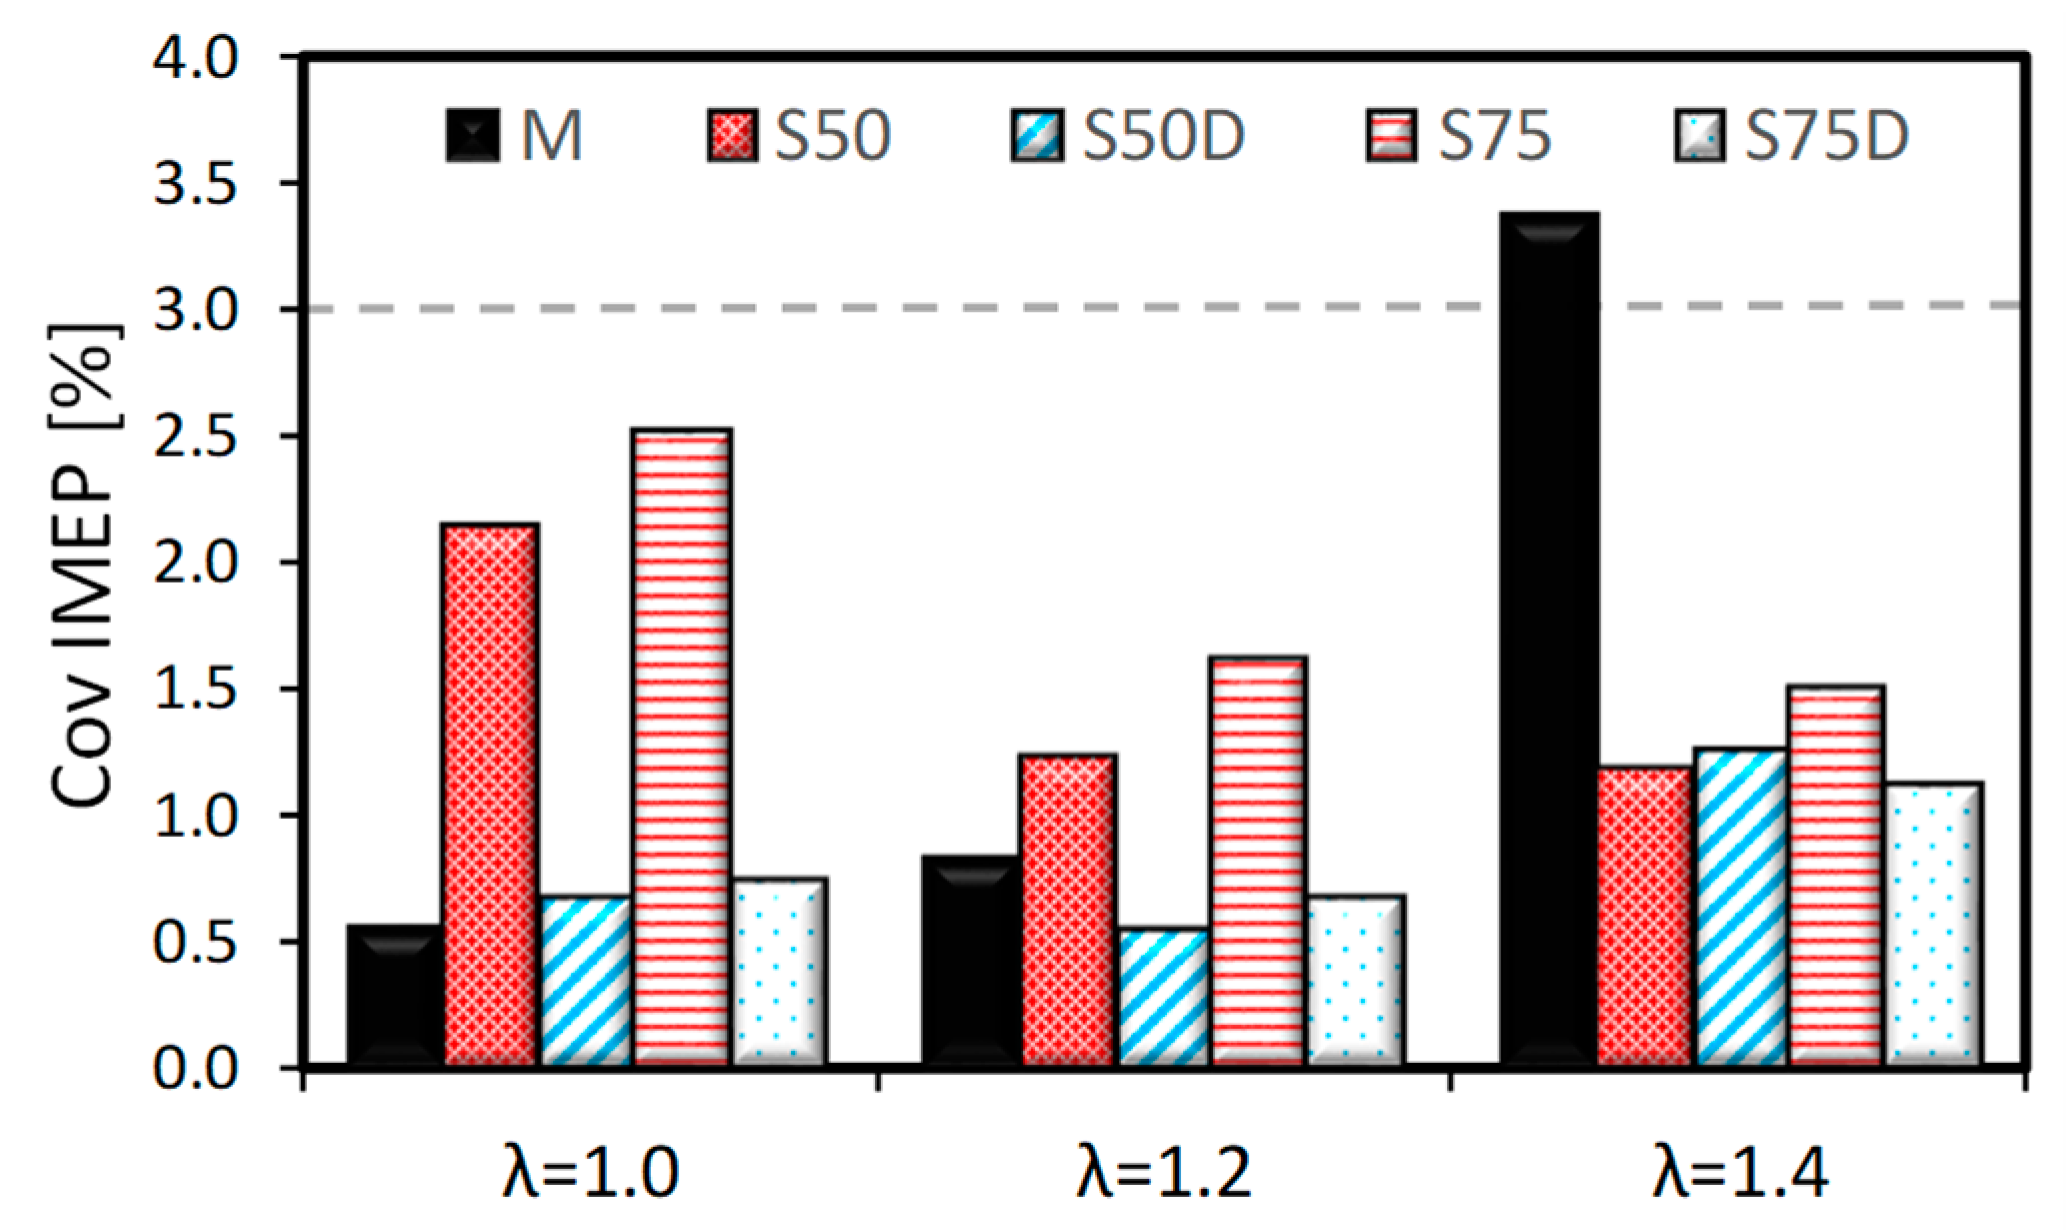
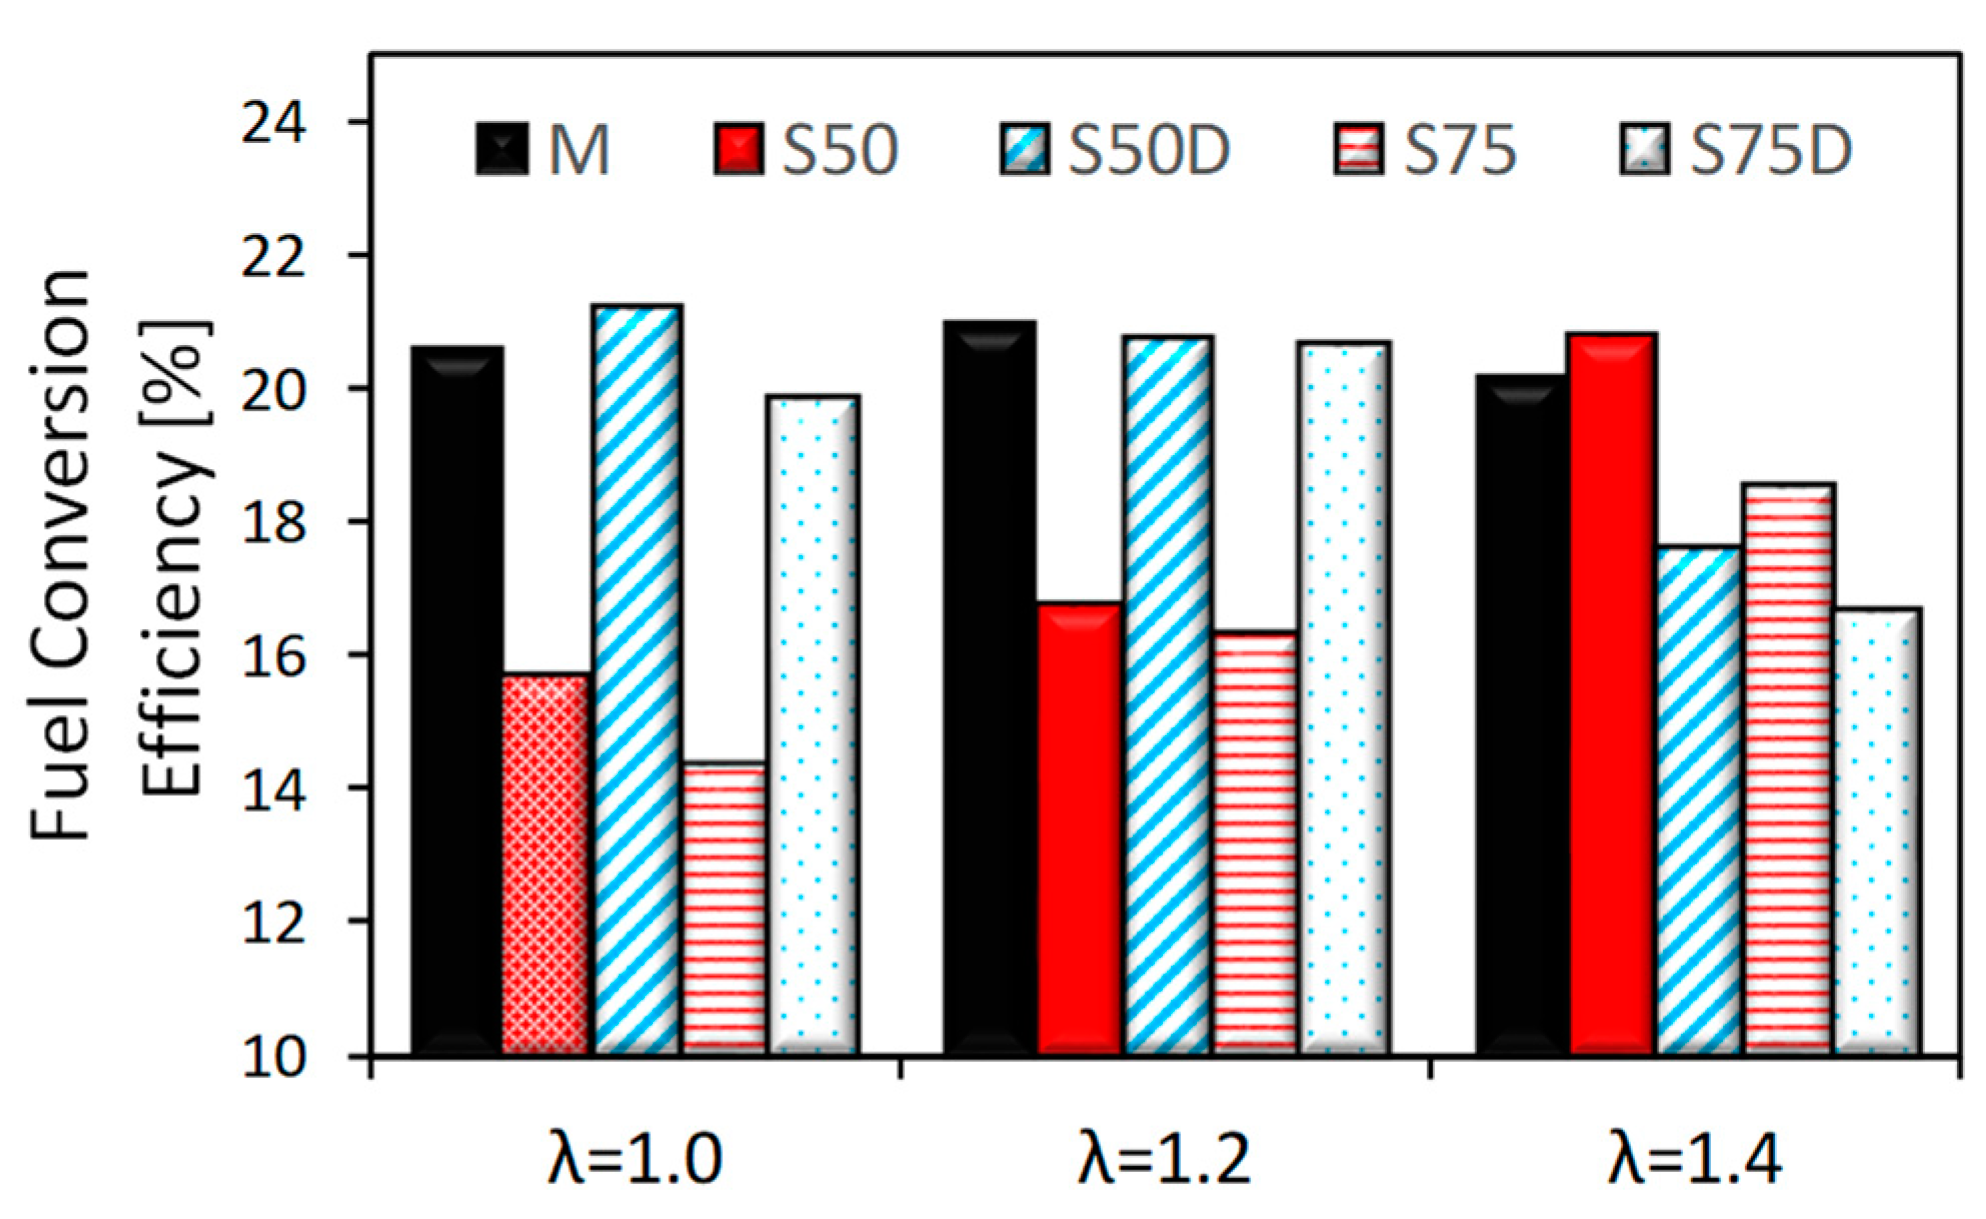
3.1. Thermodynamic Analysis
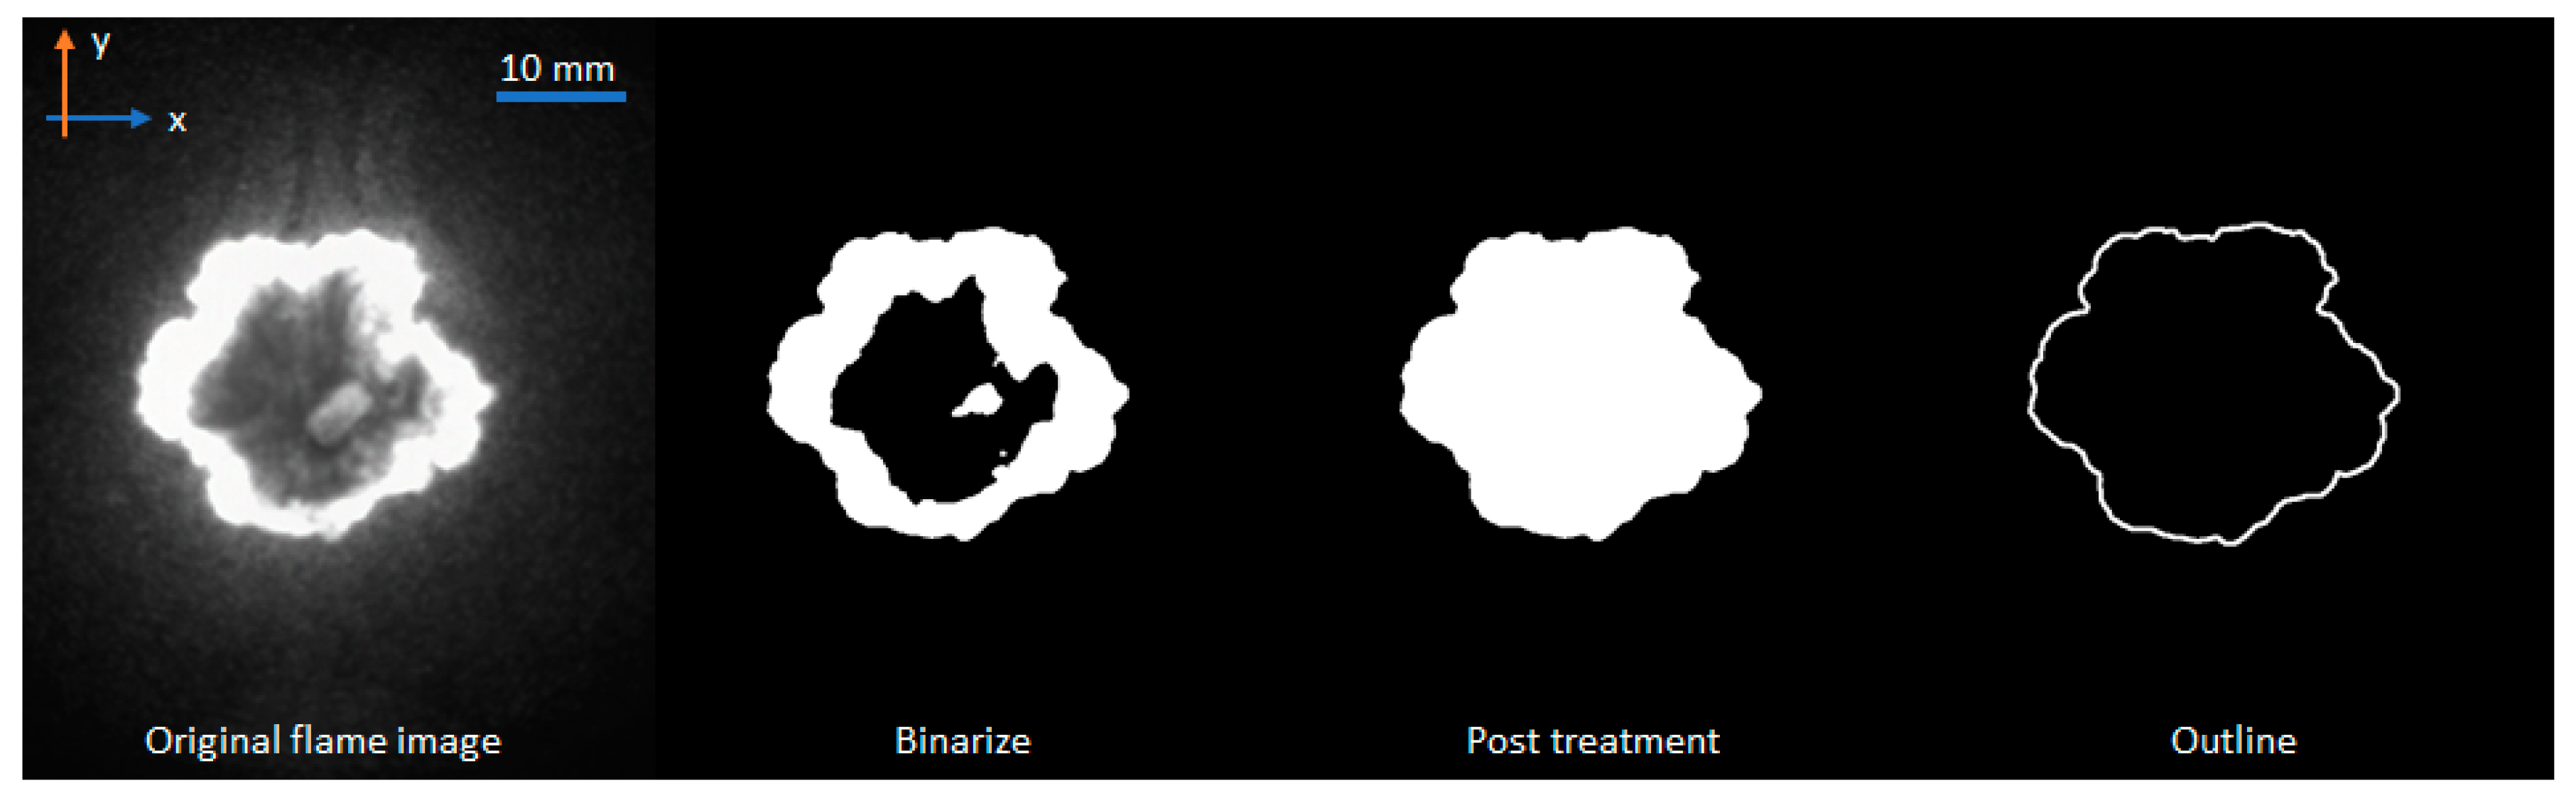
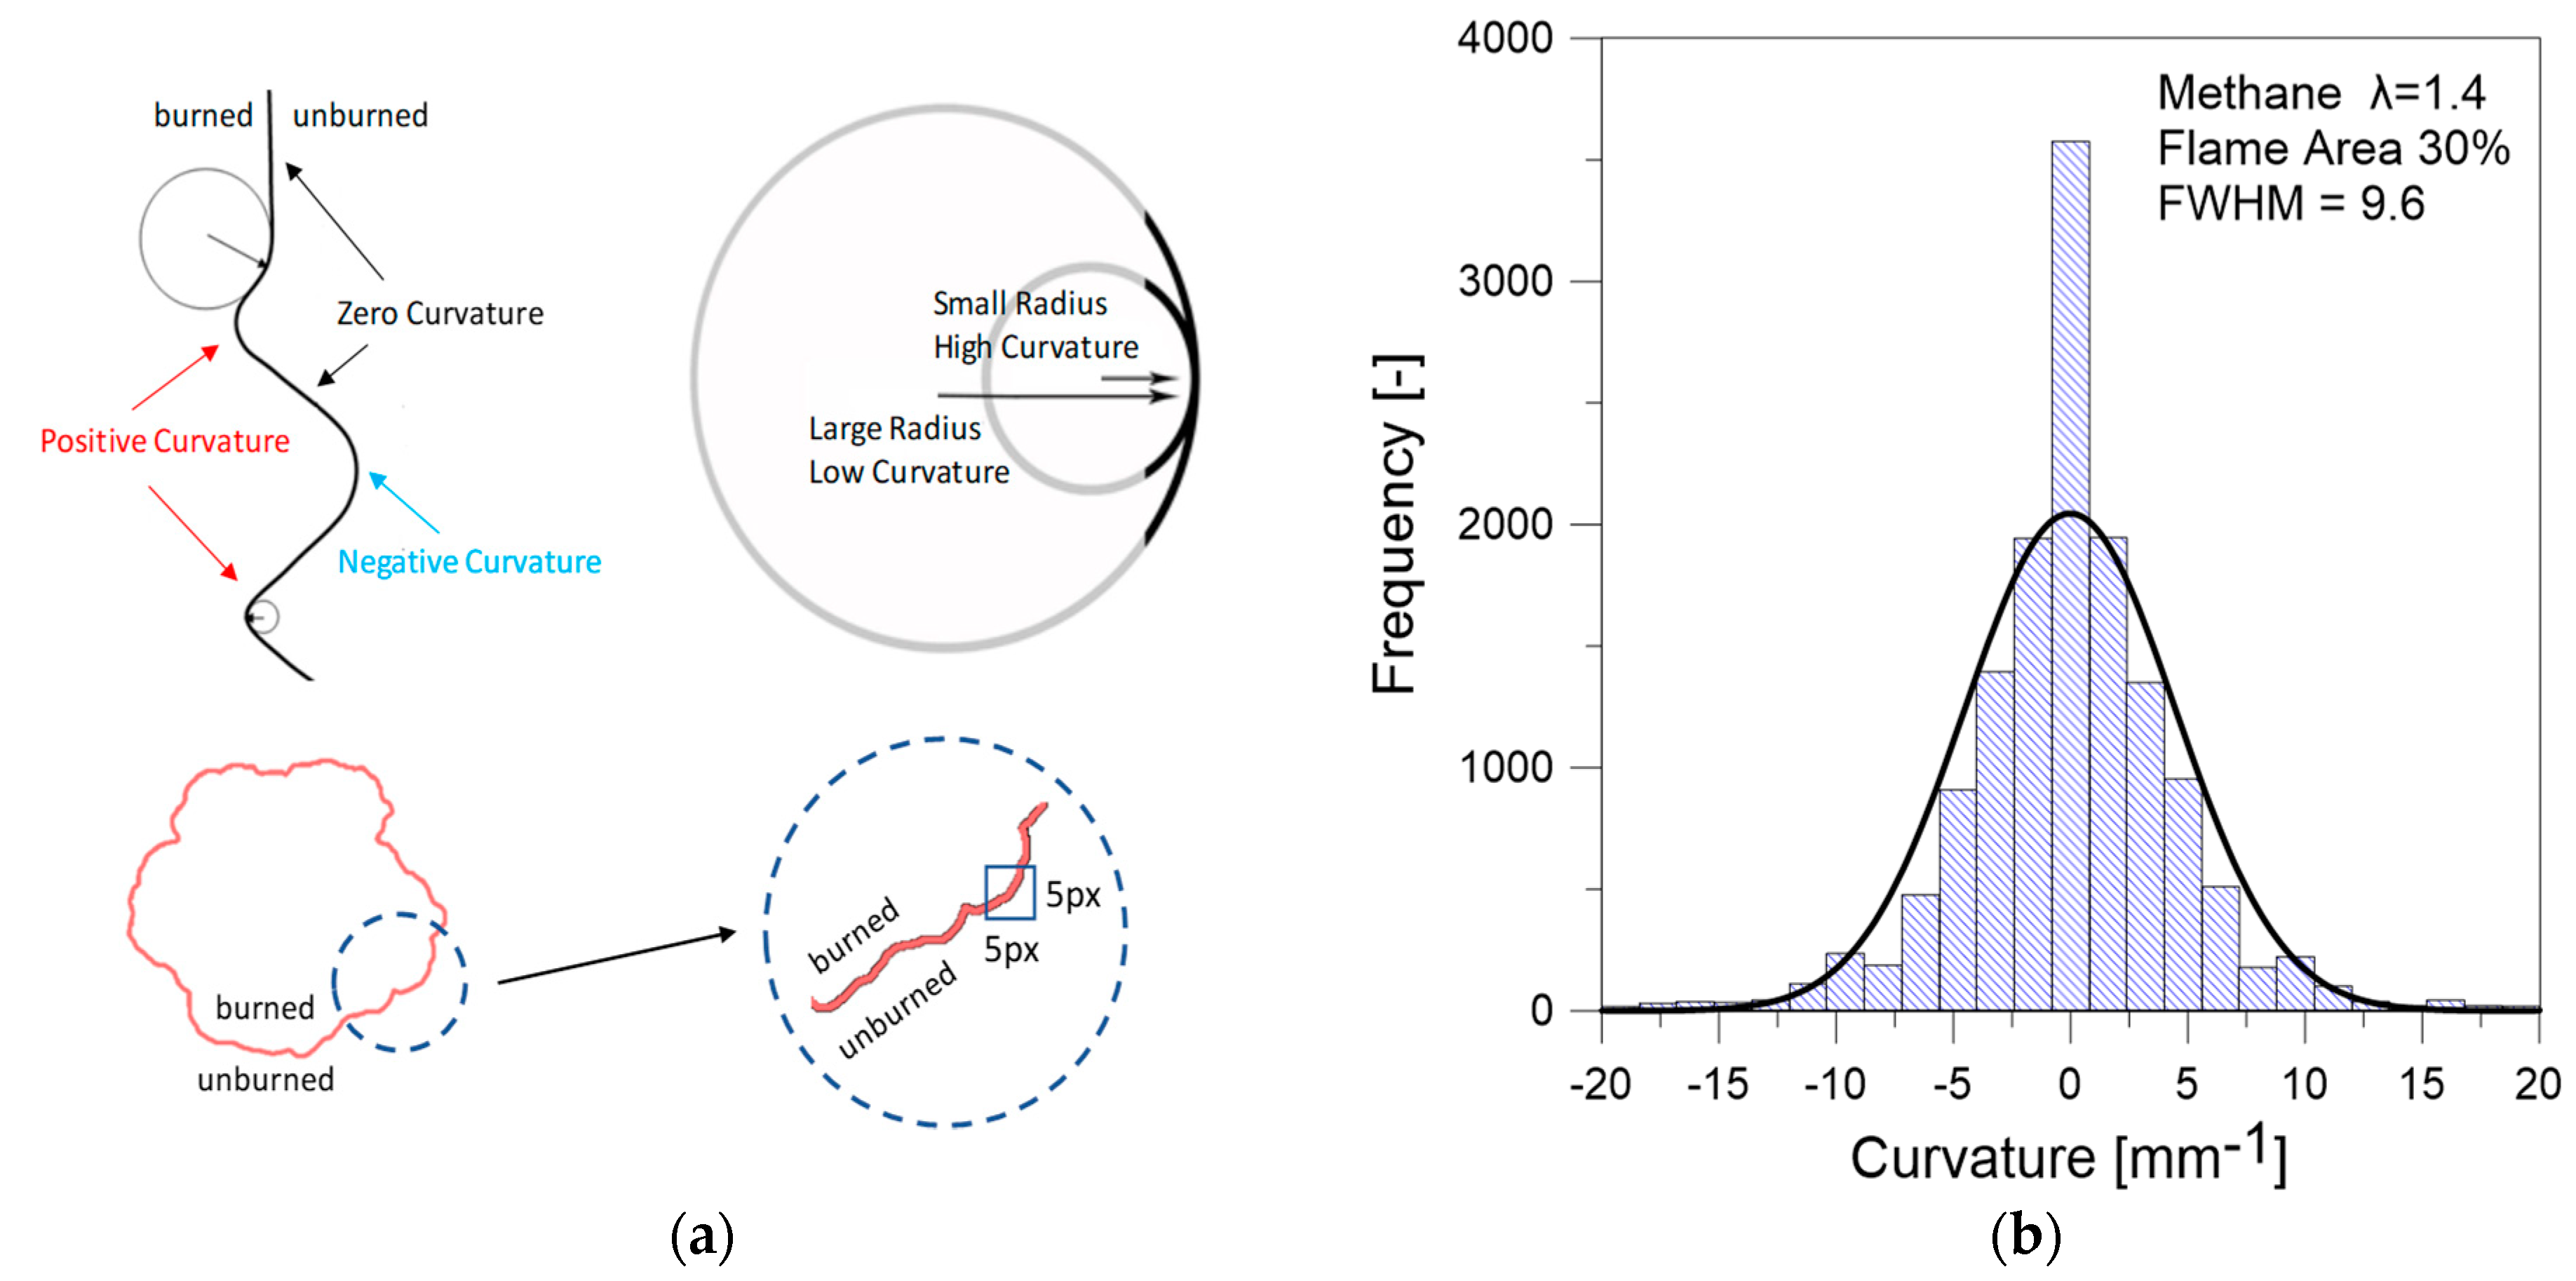
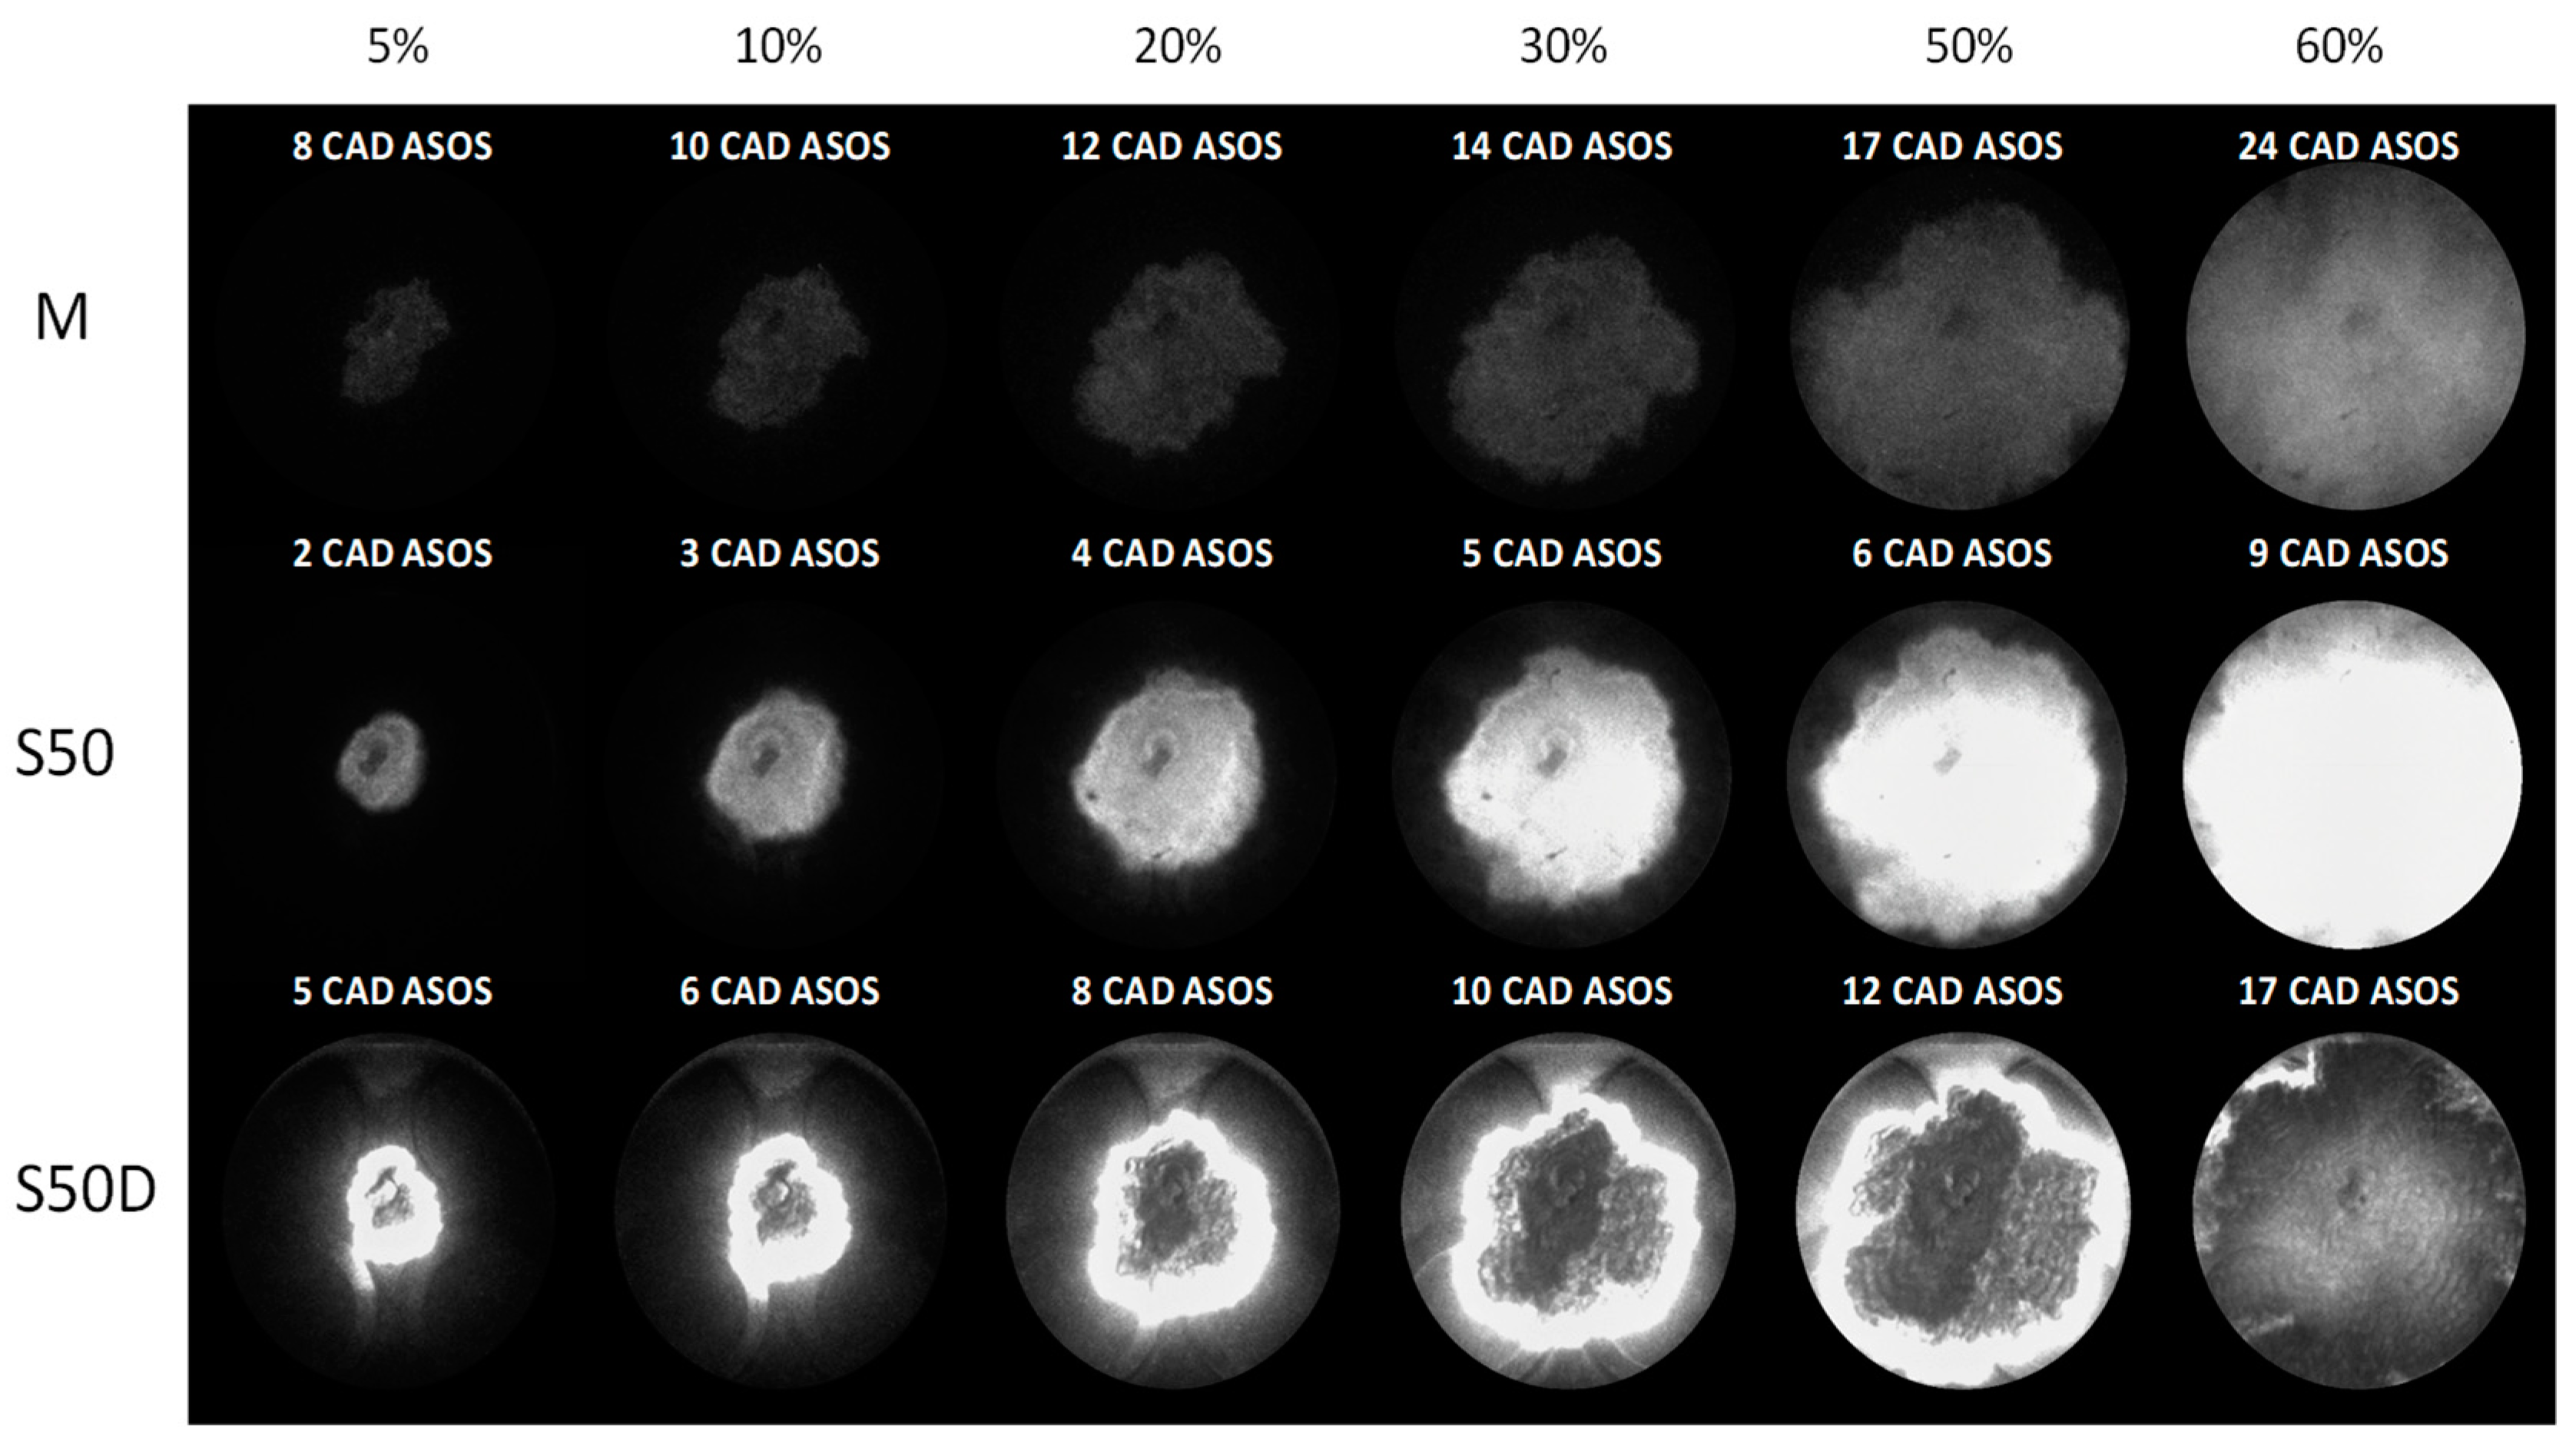
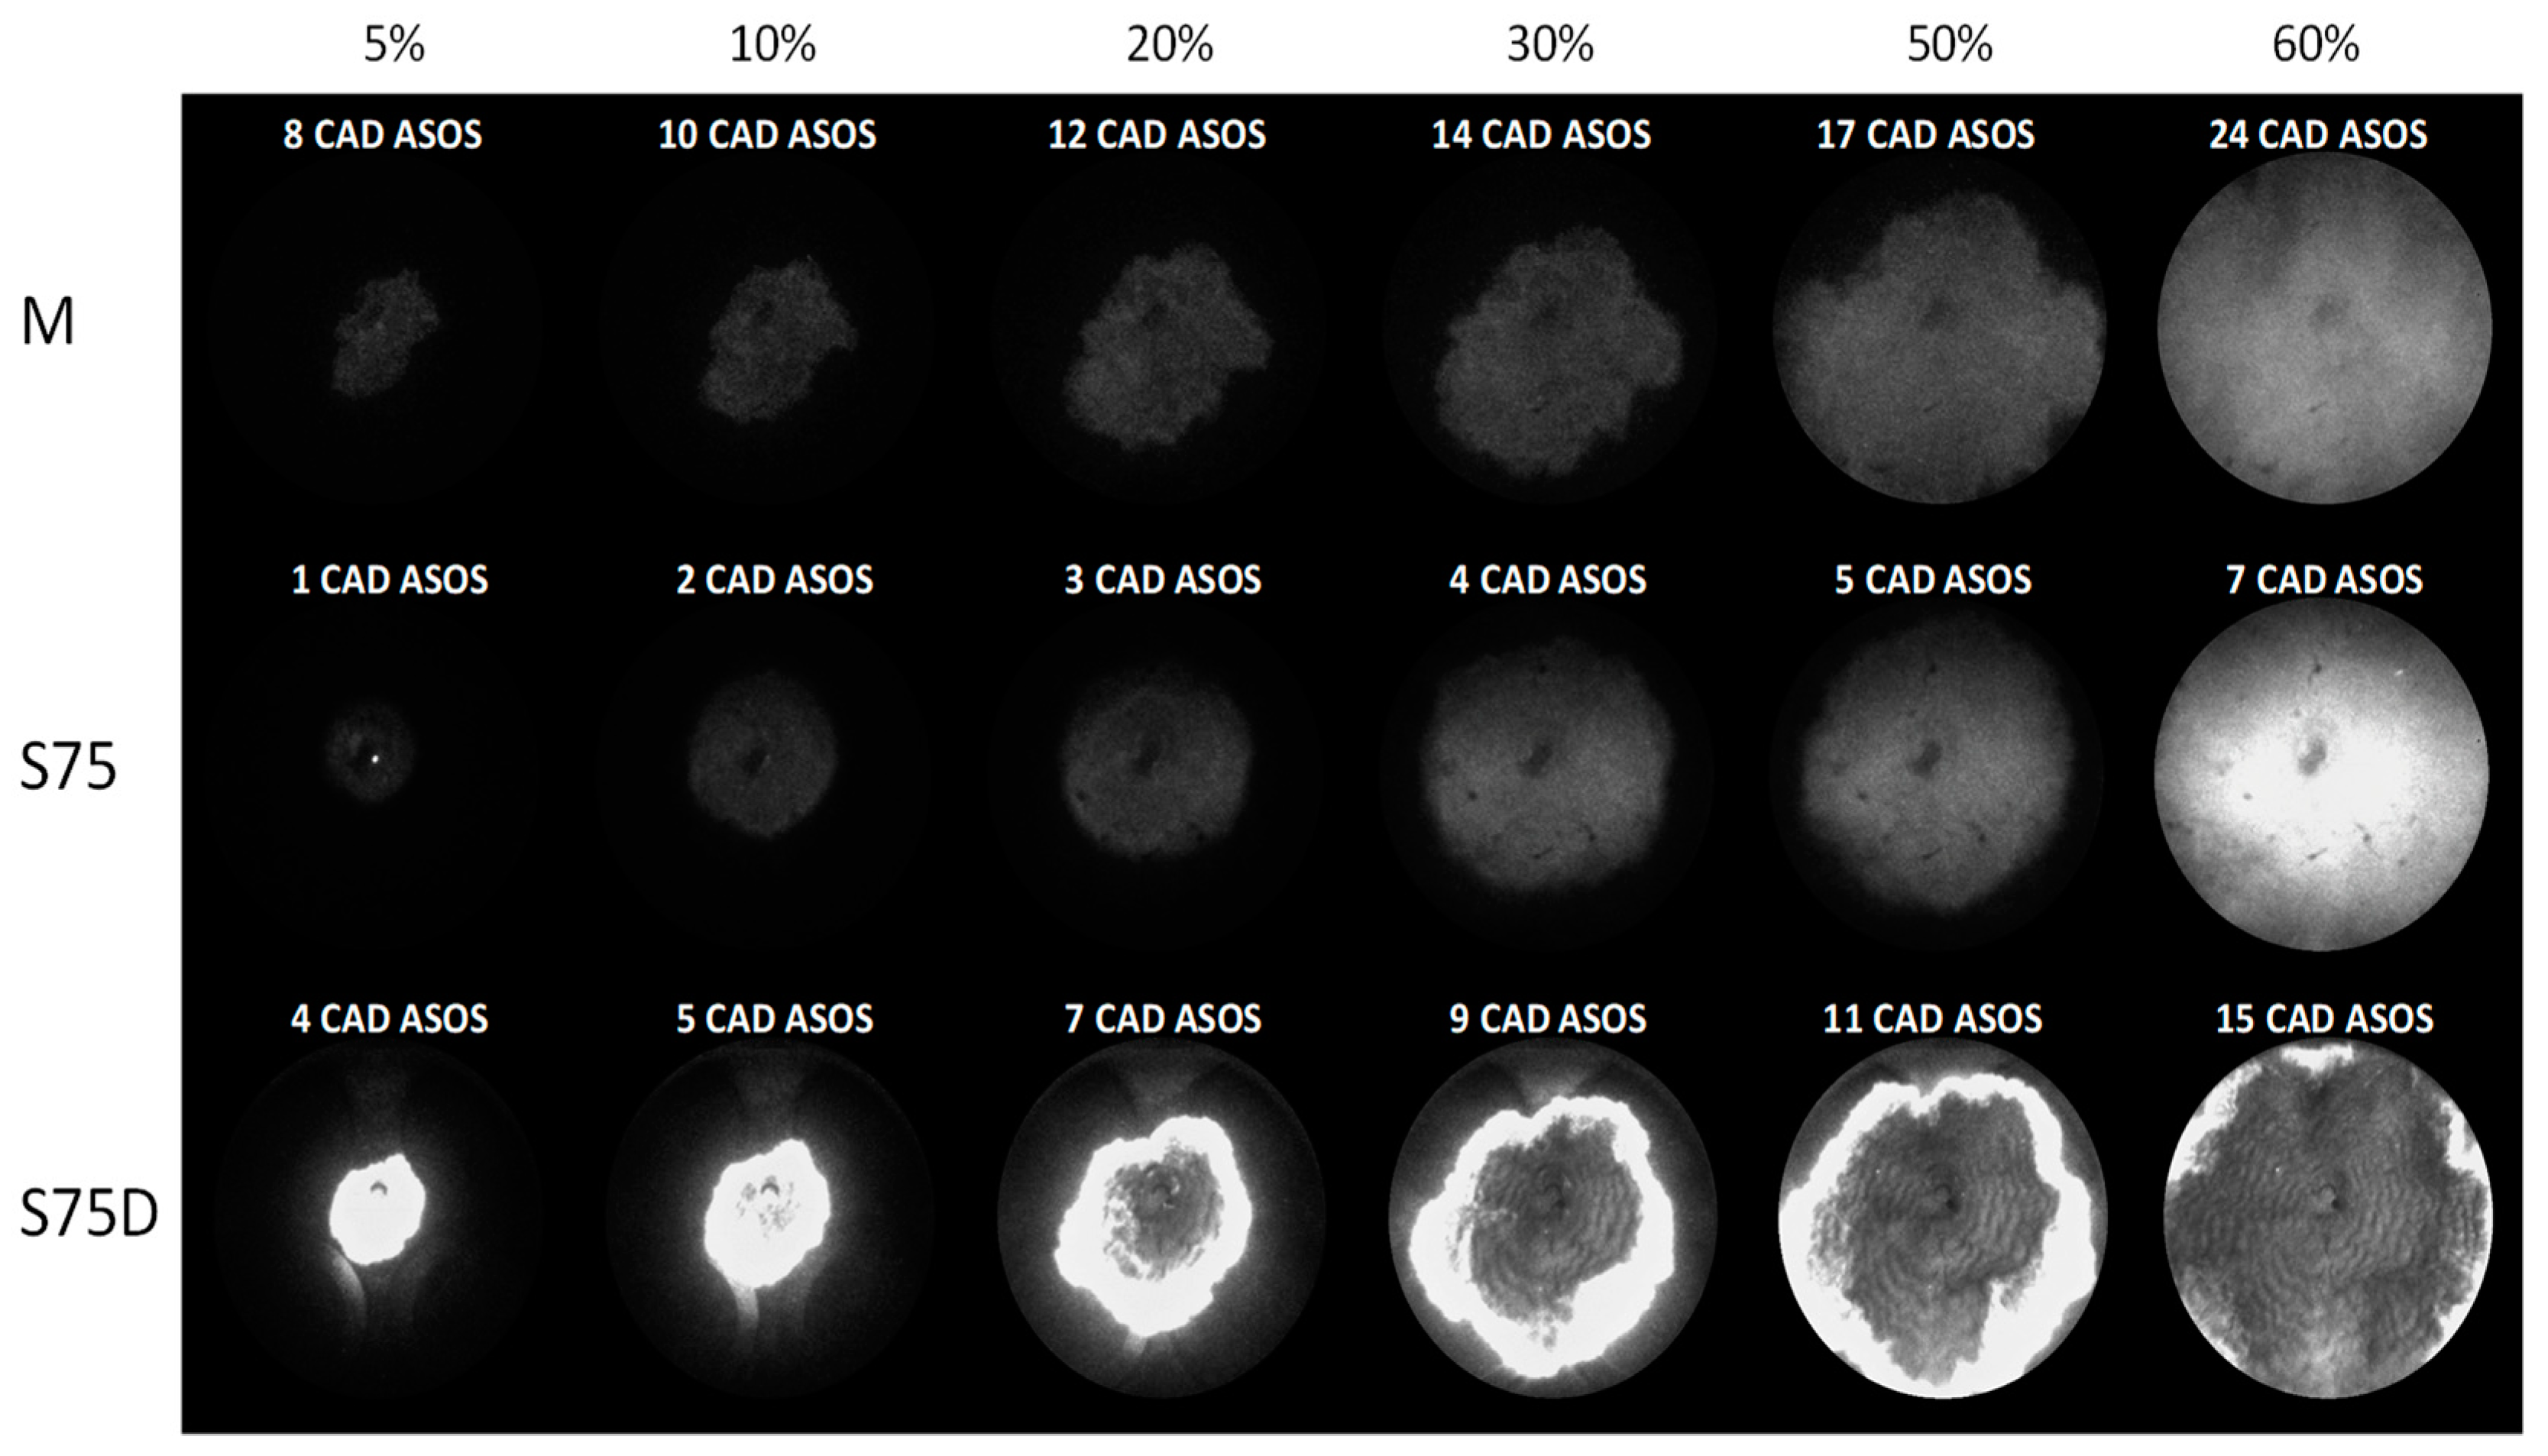
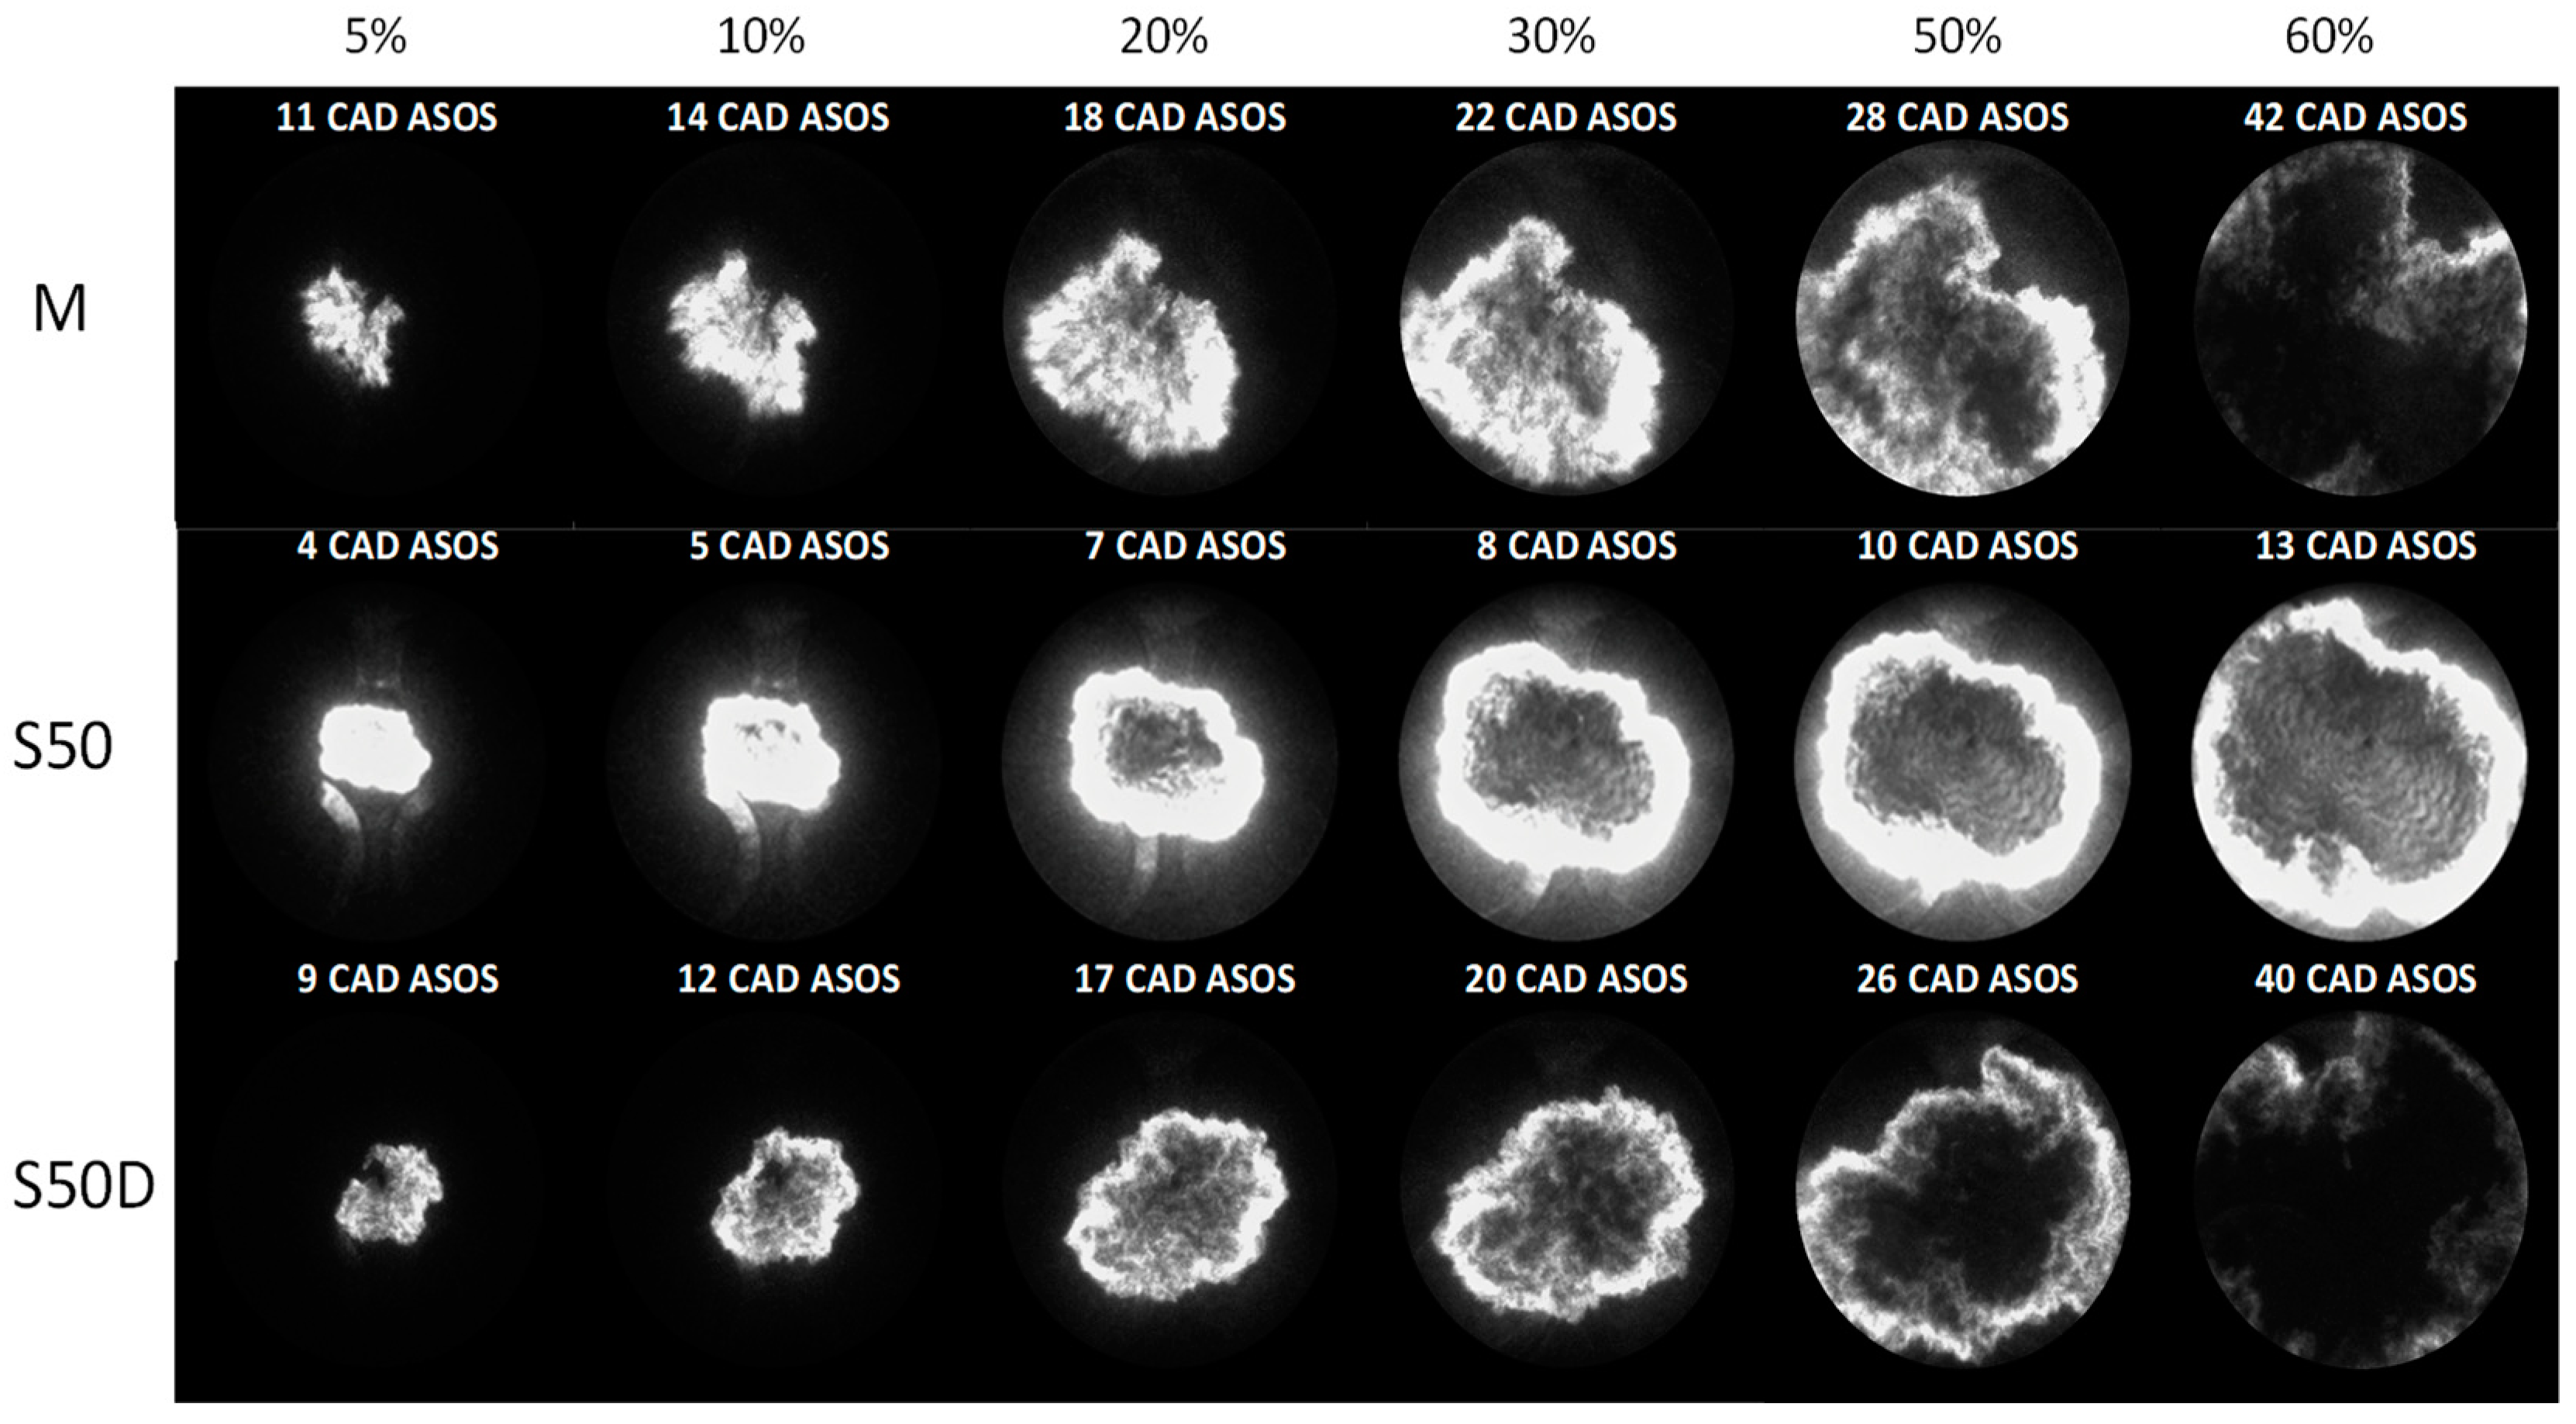
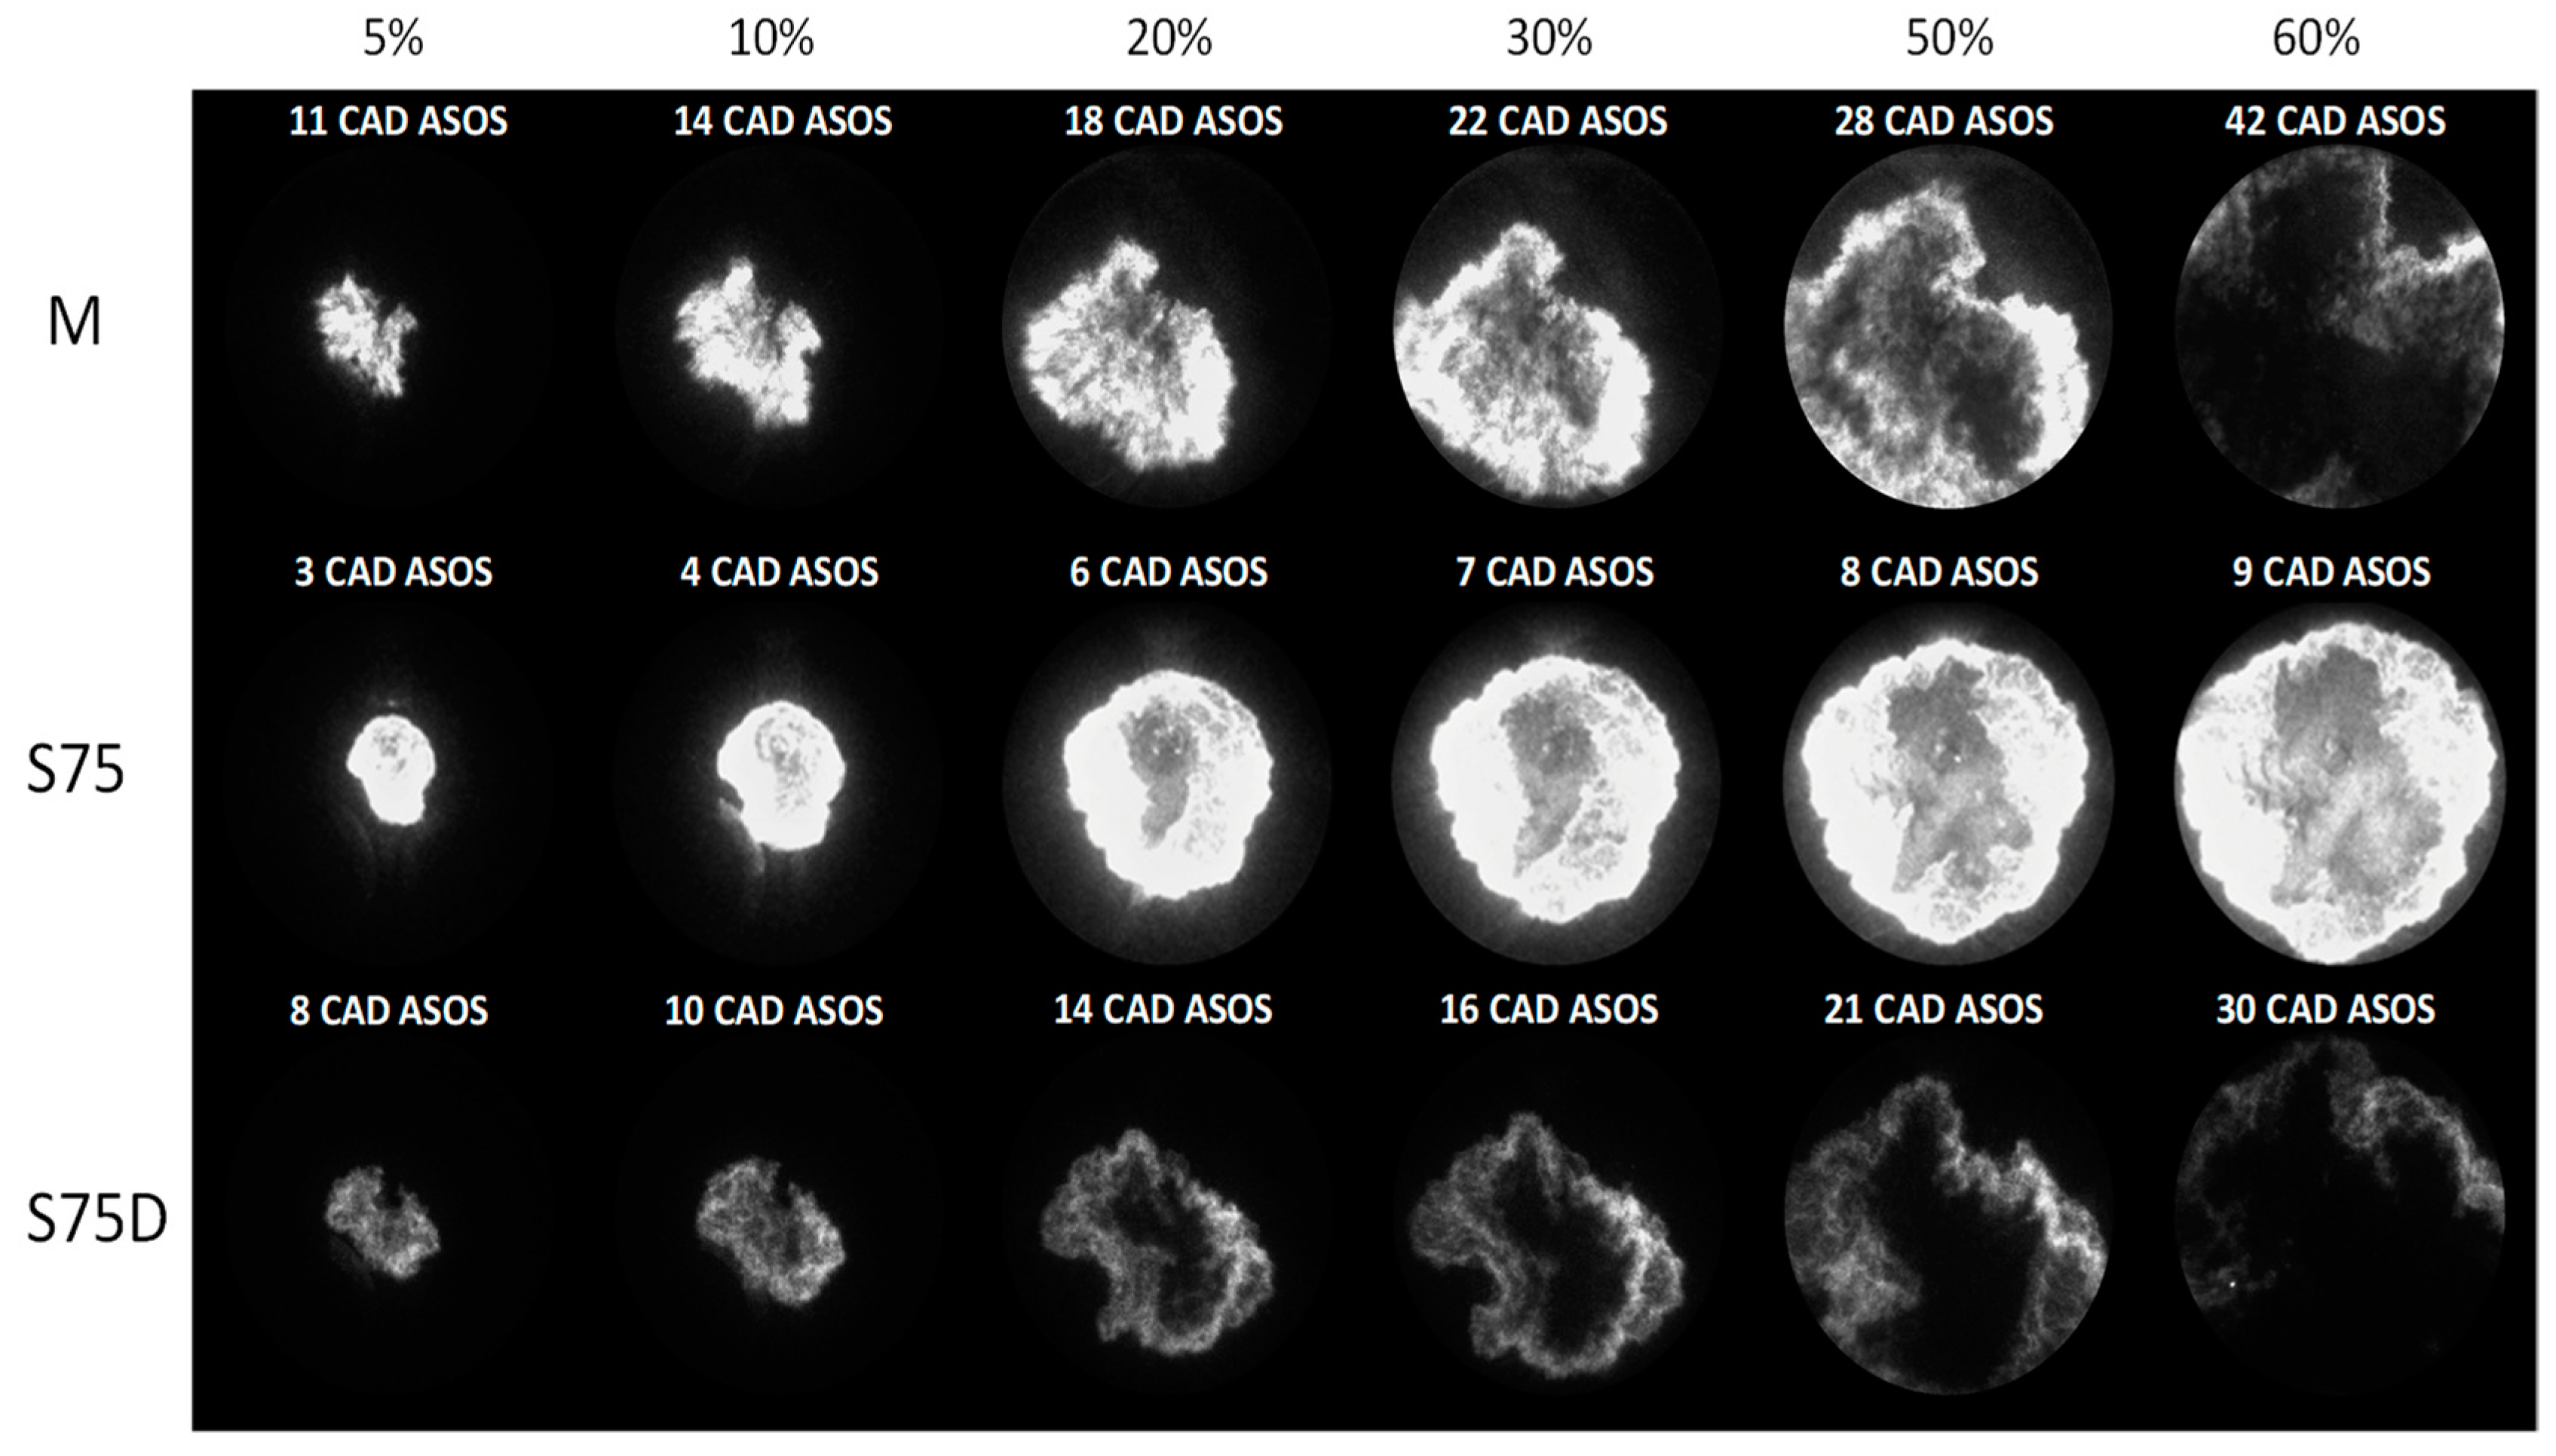
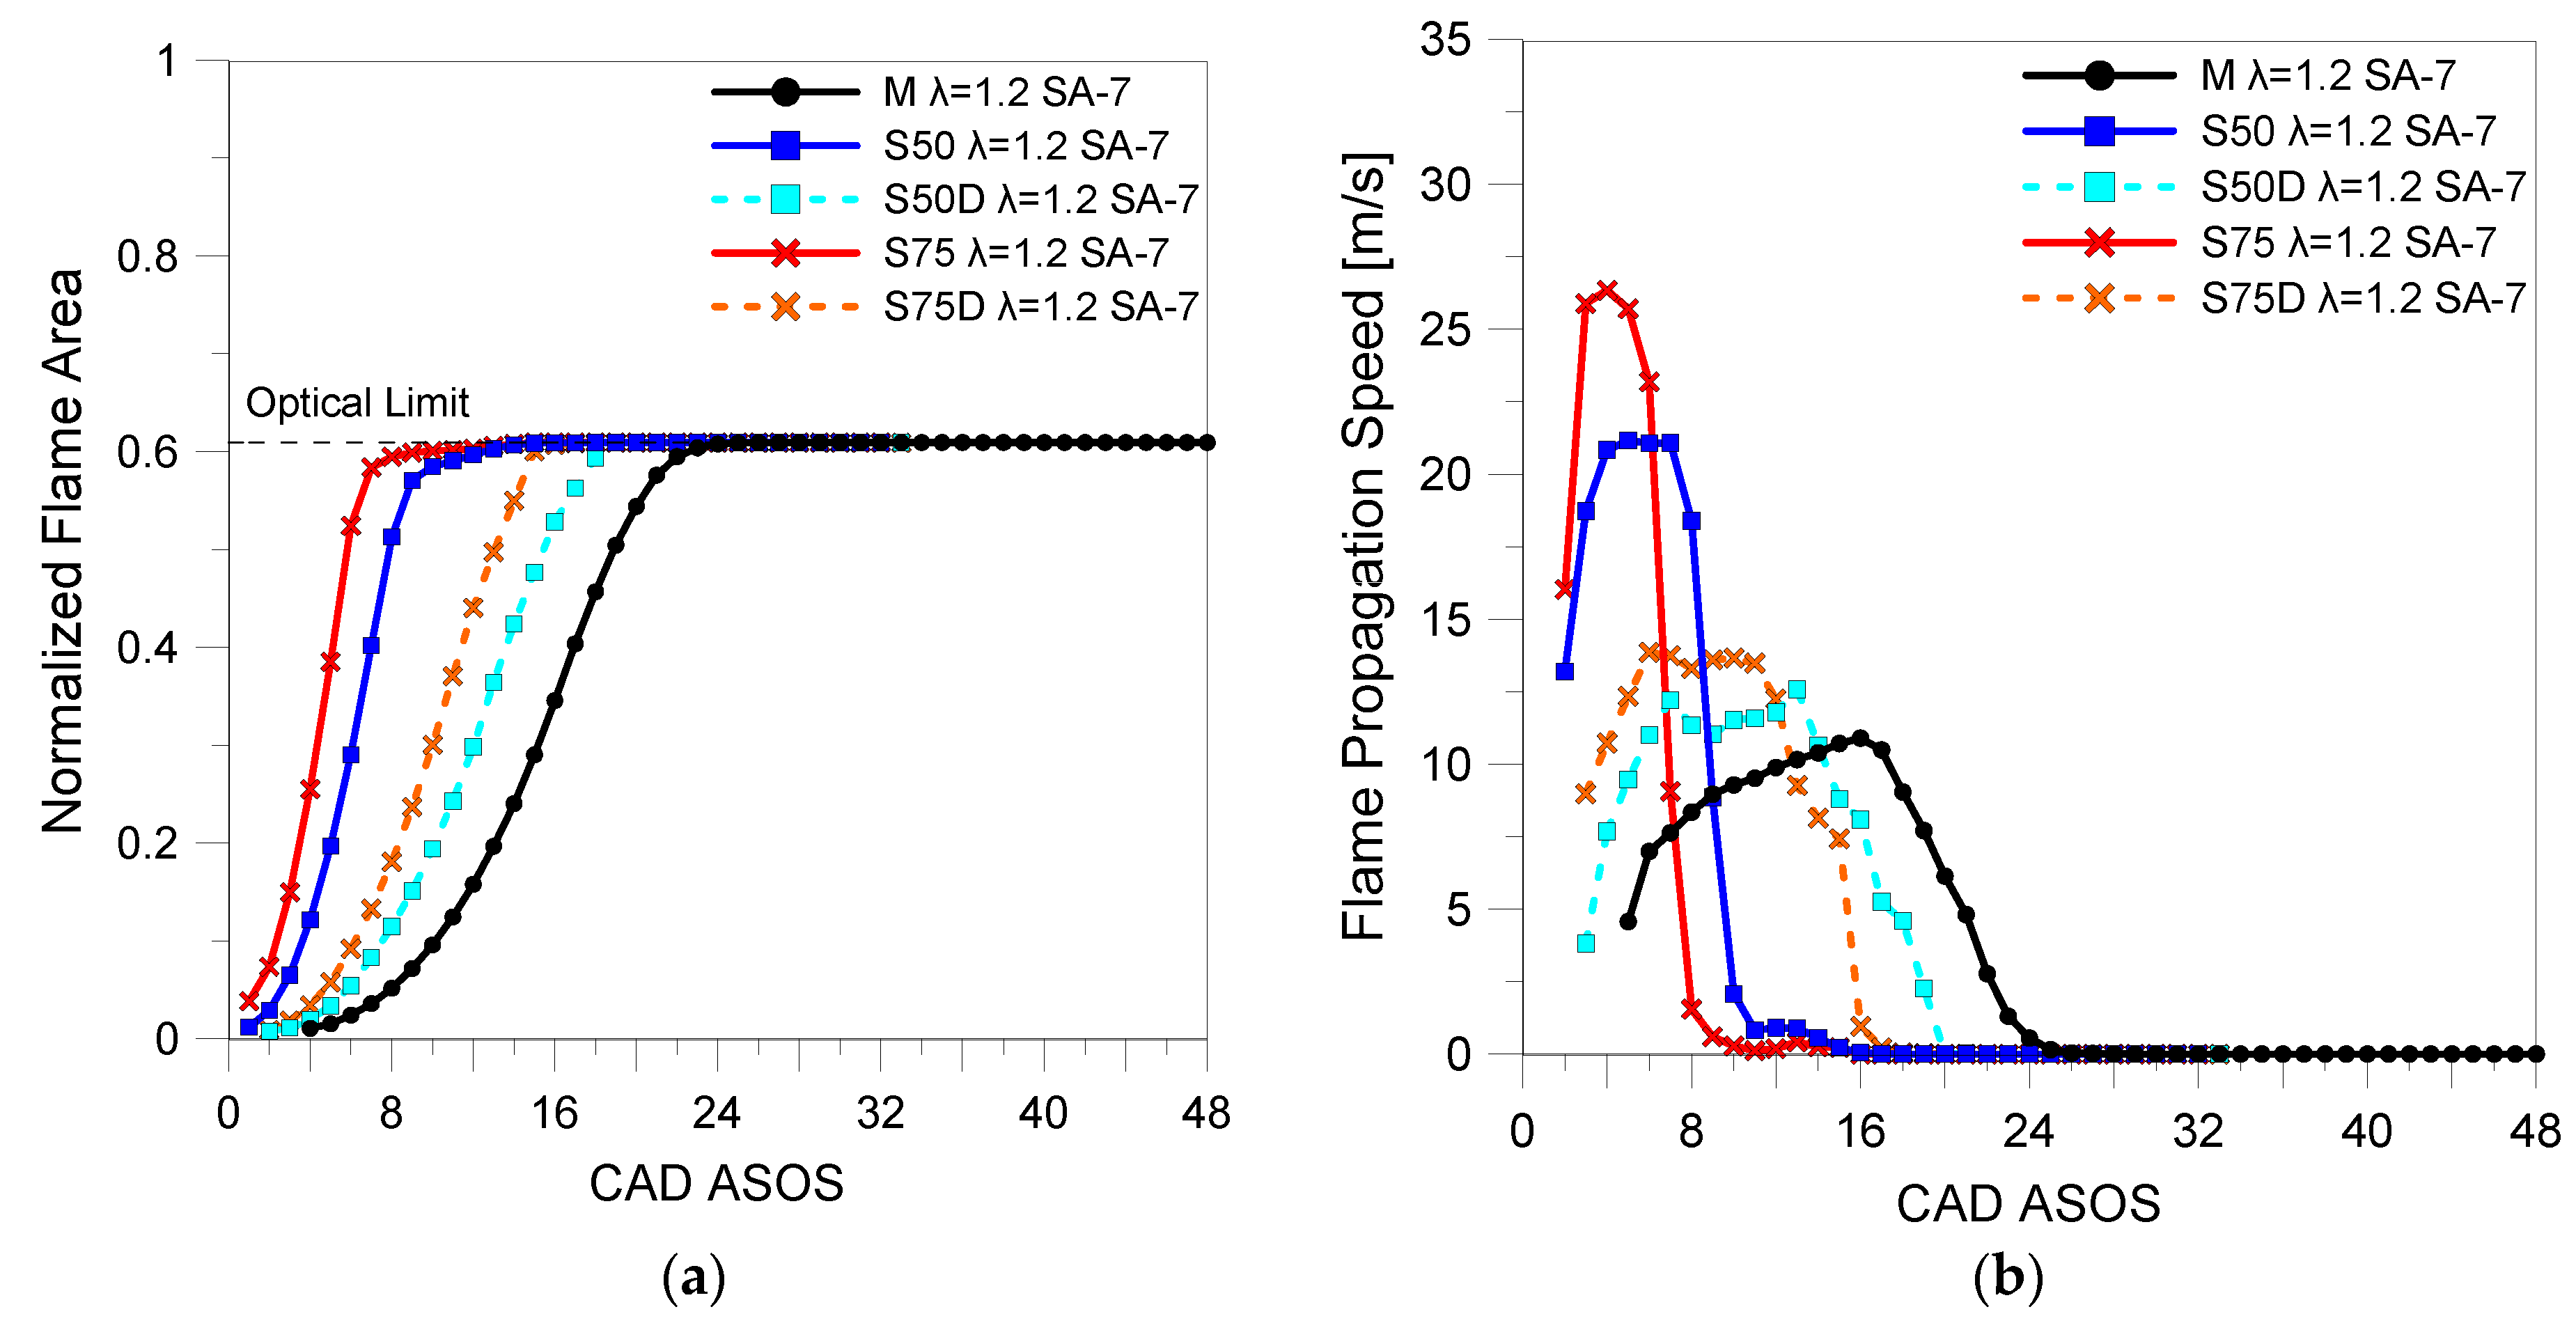
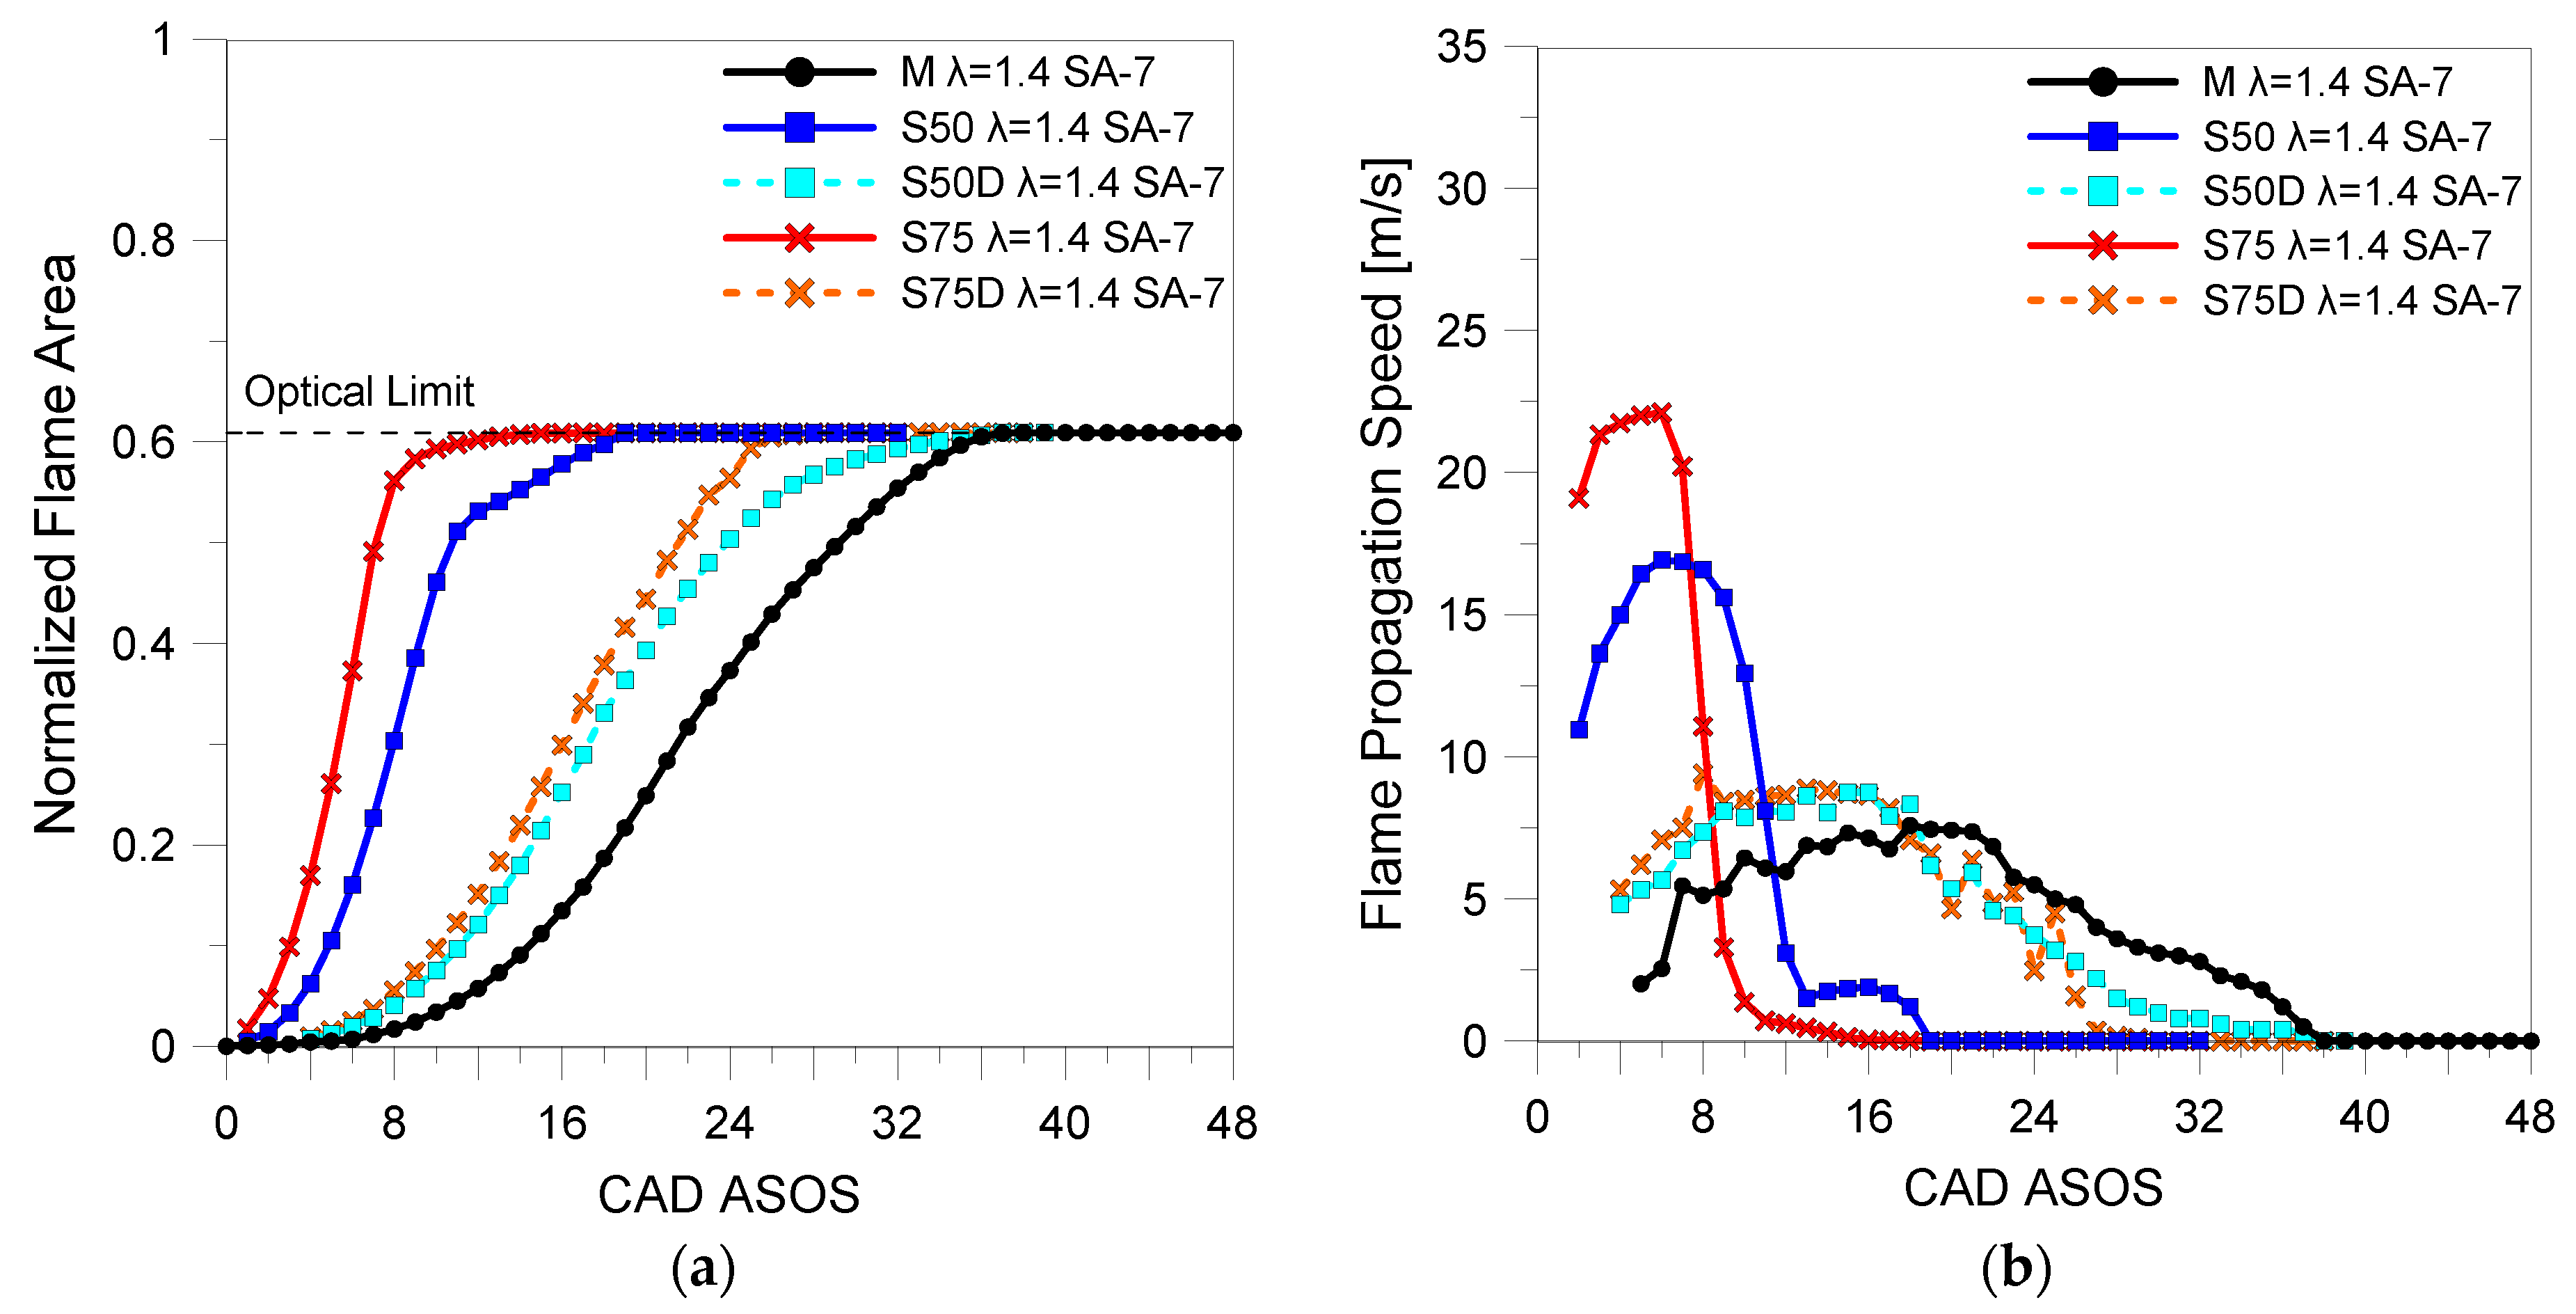
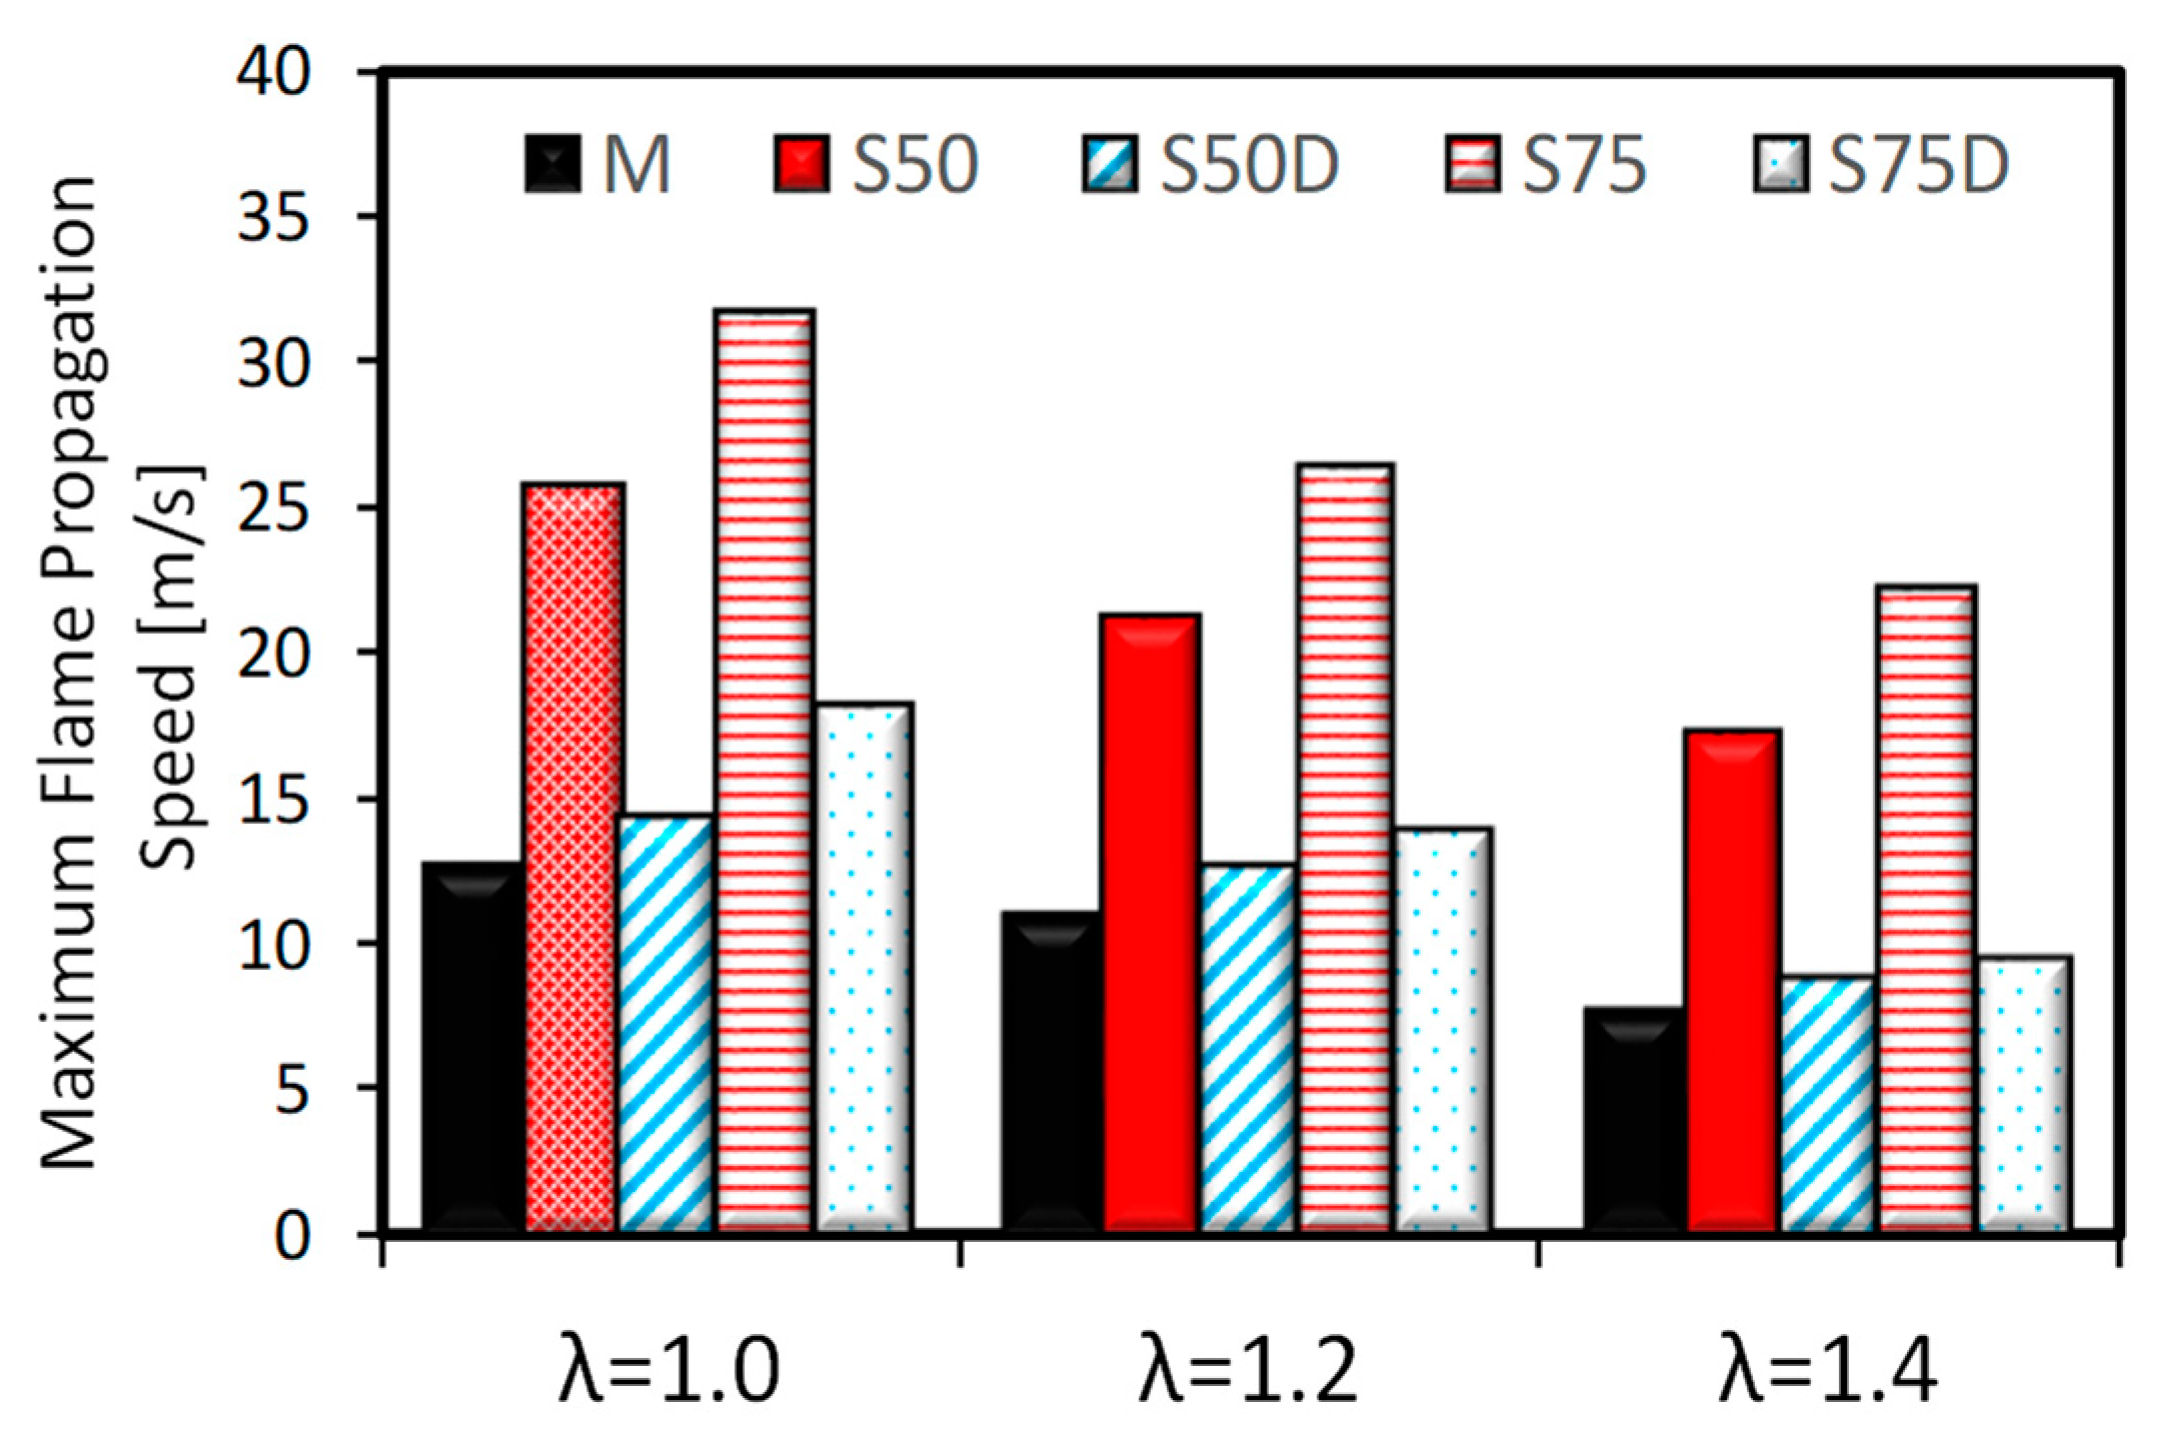
3.2. Optical Investigations
4. Conclusions
Author Contributions
Funding
Conflicts of Interest
Abbreviations
| AFRST | Stoichiometric Air fuel ratio |
| ATDC | After top dead center |
| CAD | Crank angle degree |
| CCV | Combustion cyclic variability |
| COVIMEP | Coefficient of variation of indicated mean effective pressure |
| DFBG | Downdraft fixed bed gasifier |
| DOD | Degree of dilution |
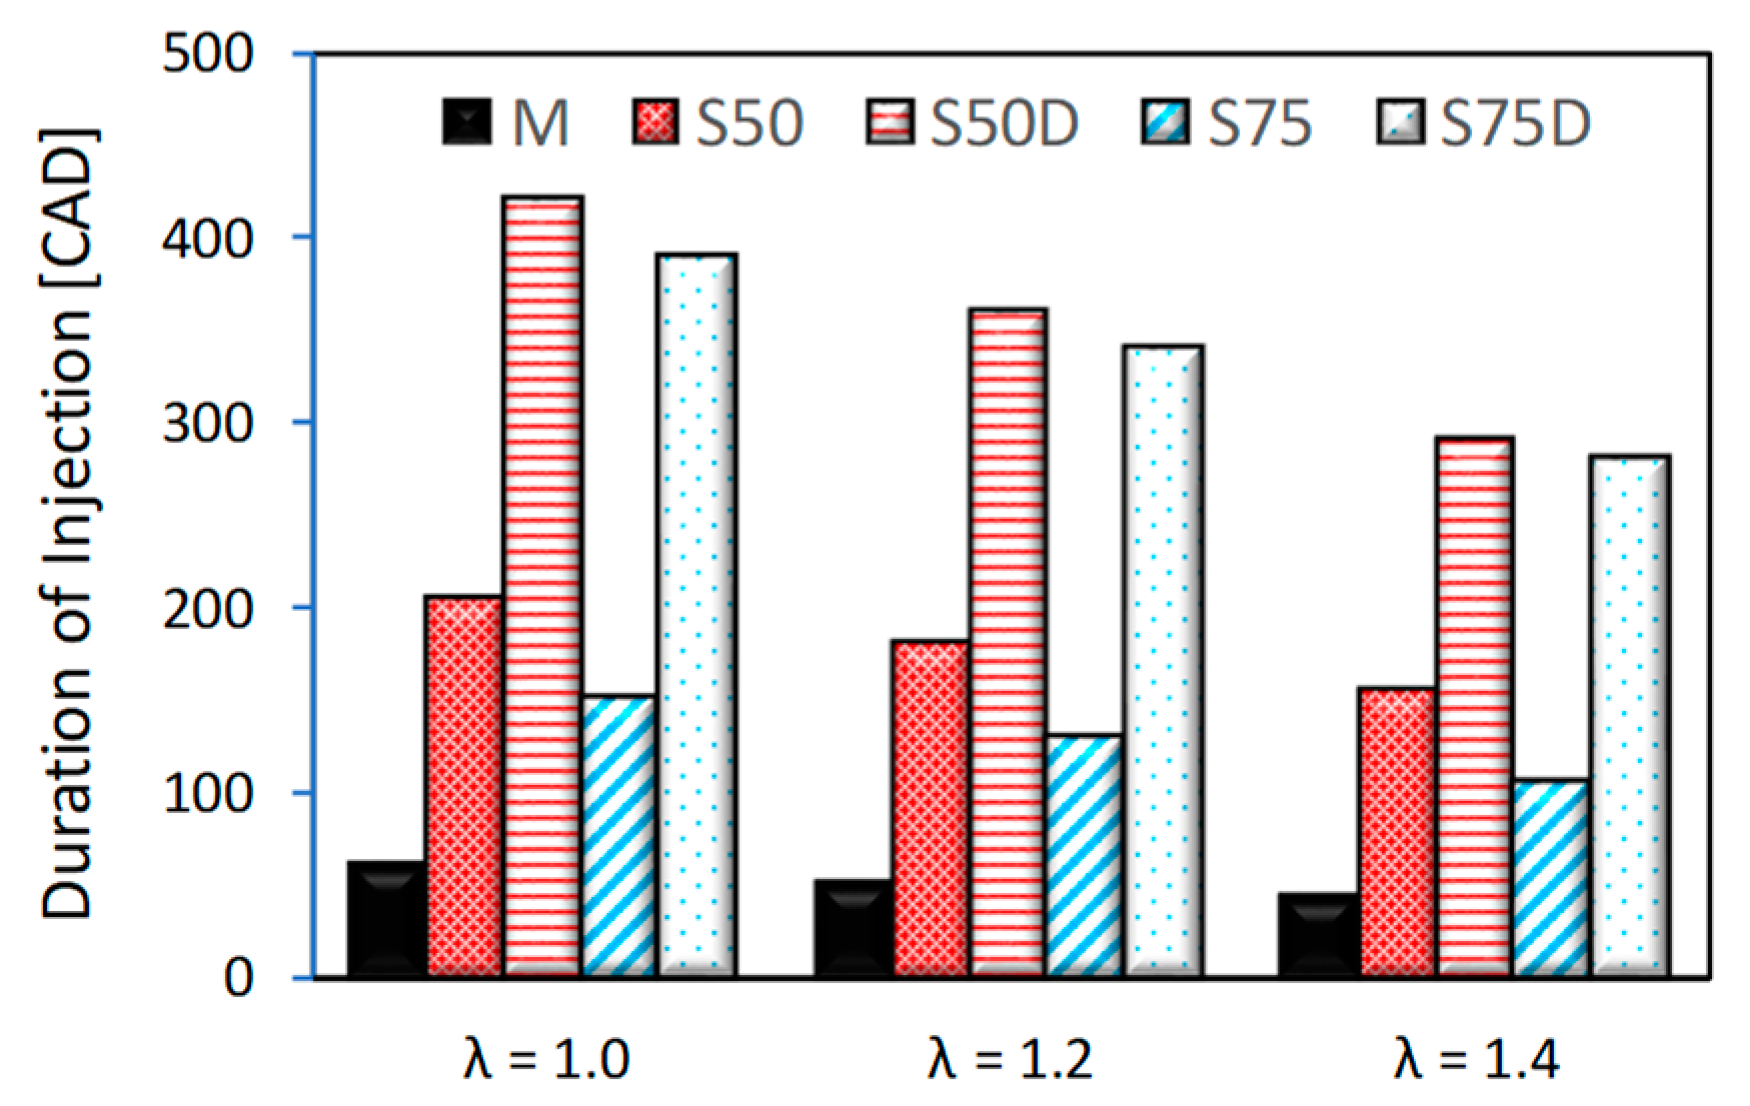
| DOI | Duration of Injection |
| fps | Frame per second |
| FWHM | Full with at the half maximum |
| HCF | Heywood circularity factor |
| ICE | Internal combustion engine |
| IMEP | Indicate mean effective pressure |
| LHV | Low heating value |
| M | Methane |
| MBT | Maximum brake torque |
| MFB | Mass fraction burned |
| NG | Natural gas |
| S50 | Syngas with composition 50% H2 and 50% CO |
| S50D | Syngas with composition 50% H2 and 50% CO in fuel basis plus 50% of dilution |
| S75 | Syngas with composition 75% H2 and 25% CO |
| S75D | Syngas with composition 75% H2 and 25% CO in fuel basis plus 50% of dilution |
| SA | Spark advance |
| SI | Spark ignition |
| SL | Laminar flame speed |
| ST | Turbulent flame speed |
| UV | Ultra violet |
| WOT | Wide open throttle |
| λ | Relative air fuel ratio |
| σ | Standard deviation of gaussian curve fitting the wrinkling histogram |
References
- Koirala, B.P.; Koliou, E.; Friege, J.; Hakvoort, R.A.; Herder, P.M. Energetic communities for community energy: A review of key issues and trends shaping integrated community energy systems. Renew. Sustain. Energy Rev. 2016, 56, 722–744. [Google Scholar] [CrossRef]
- Lee, K.; Miguel, E.; Wolfram, C. Experimental Evidence on the Demand for and Costs of Rural Electrification; NBER Working Paper No. 22292; National Bureau of Economic Research: Cambridge, MA, USA, 2016. [Google Scholar]
- Atikah, A.; Abdullah, N.; Ha, F.; Inayat, A. Assessing the gasification performance of biomass: A review on biomass gasification process conditions, optimization and economic evaluation. Renew. Sustain. Energy Rev. 2016, 53, 1333–1347. [Google Scholar]
- Pacioni, T.R.; Soares, D.; Domenico, M.D.; Rosa, M.F.; Fátima, R.D.; Muniz, P.; José, H.J. Bio-syngas production from agro-industrial biomass residues by steam gasification. Waste Manag. 2016, 58, 221–229. [Google Scholar] [CrossRef]
- Shivapuji, A.M.; Dasappa, S. In-cylinder investigations and analysis of a SI gas engine fuelled with H2 and CO rich syngas fuel: Sensitivity analysis of combustion descriptors for engine diagnostics and control. Int. J. Hydrogen Energy 2014, 39, 15786–15802. [Google Scholar] [CrossRef]
- Monteiro Magalhaes, E. Combustion Study of Mixtures Resulting From a Gasification Process of Forest Biomass; Ecole Nationale Superieure de Mecanique et d’Aerotechique (ENSMA): Poitiers, France, 2011. [Google Scholar]
- Raman, P.; Ram, N.K. Performance analysis of an internal combustion engine operated on producer gas, in comparison with the performance of the natural gas and diesel engines. Energy 2013, 63, 317–333. [Google Scholar] [CrossRef]
- Centeno, F.; Mahkamov, K.; Lora, E.E.S.; Andrade, R. V Theoretical and experimental investigations of a downdraft biomass gasifier-spark ignition engine power system. Renew. Energy 2012, 37, 97–108. [Google Scholar] [CrossRef]
- Gil, J.; Corella, J.; Aznar, M.P.; Caballero, M.A. Biomass gasification in atmospheric and bubbling fluidized bed: Effect of the type of gasifying agent on the product distribution. Biomass Bioenergy 1999, 17, 389–403. [Google Scholar]
- Shivapuji, A.M.; Dasappa, S. Analysis of thermodynamic scope engine simulation model empirical coefficients: Suitability assessment and tuning of conventional hydrocarbon fuel coefficients for bio syngas. Int. J. Hydrogen Energy 2017, 42, 16834–16854. [Google Scholar] [CrossRef]
- Couto, N.; Rouboa, A.; Silva, V.; Monteiro, E.; Bouziane, K. Influence of the biomass gasification processes on the final composition of syngas. Energy Procedia 2013, 36, 596–606. [Google Scholar] [CrossRef]
- Göransson, K.; Söderlind, U.; He, J.; Zhang, W. Review of syngas production via biomass DFBGs. Renew. Sustain. Energy Rev. 2011, 15, 482–492. [Google Scholar] [CrossRef]
- Shivapuji, A.M.; Dasappa, S. Influence of fuel hydrogen fraction on syngas fueled SI engine: Fuel thermo-physical property analysis and in-cylinder experimental investigations. Int. J. Hydrogen Energy 2015, 40, 10308–10328. [Google Scholar] [CrossRef]
- Tsiakmakis, S.; Mertzis, D.; Dimaratos, A.; Toumasatos, Z.; Samaras, Z. Experimental study of combustion in a spark ignition engine operating with producer gas from various biomass feedstocks. Fuel 2014, 122, 126–139. [Google Scholar] [CrossRef]
- Condition, O. Combustion and Heat Release Characteristics of Biogas under Hydrogen- and Oxygen-Enriched Condition. Energies 2017, 10, 1200. [Google Scholar] [CrossRef]
- Kosmadakis, G.M.; Rakopoulos, D.C.; Rakopoulos, C.D. Methane/hydrogen fueling a spark-ignition engine for studying NO, CO and HC emissions with a research CFD code. Fuel 2016, 185, 903–915. [Google Scholar] [CrossRef]
- Kosmadakis, G.M.; Moreno, F.; Arroyo, J.; Muñoz, M.; Rakopoulos, C.D. Spark-Ignition Engine Fueled with Methane-Hydrogen Blends. In Green Energy and Technology; Springer: Cham, Switzerland, 2016; Volume Part F2, pp. 405–420. [Google Scholar]
- Sahoo, B.B.; Sahoo, N.; Saha, U.K. Effect of engine parameters and type of gaseous fuel on the performance of dual-fuel gas diesel engines—A critical review. Renew. Sustain. Energy Rev. 2009, 13, 1151–1184. [Google Scholar] [CrossRef]
- Orbaiz, P.; Brear, M.J.; Abbasi, P.; Dennis, P.A. A Comparative Study of a Spark Ignition Engine Running on Hydrogen, Synthesis Gas and Natural Gas. SAE Int. J. Engines 2013, 6, 23–44. [Google Scholar] [CrossRef]
- Martinez, S.; Lacava, P.; Curto, P.L.; Irimescu, A.; Merola, S.S. Effect of Hydrogen Enrichment on Flame Morphology and Combustion Evolution in a SI Engine Under Lean Burn Conditions. In Proceedings of the SAE World 2018, Detroit, MI, USA, 10–12 April 2018; pp. 1–15. [Google Scholar]
- Peñaranda, A.; Martinez Boggio, S.D.; Lacava, P.T.; Merola, S.; Irimescu, A. Characterization of flame front propagation during early and late combustion for methane-hydrogen fueling of an optically accessible SI engine. Int. J. Hydrogen Energy 2018, 43, 23538–23557. [Google Scholar] [CrossRef]
- Uriz, I.; Arzamendi, G.; Diéguez, P.M.; Gandía, L.M. Chapter 17: Computational Fluid Dynamics as a Tool for Designing Hydrogen Energy Technologies; Elsevier: Amsterdam, The Nethelands, 2013; ISBN 978-0-444-56352-1. [Google Scholar]
- Merola, S.S.; Tornatore, C.; Irimescu, A.; Marchitto, L.; Valentino, G. Optical diagnostics of early flame development in a DISI (direct injection spark ignition) engine fueled with n-butanol and gasoline. Energy 2016, 108, 50–62. [Google Scholar] [CrossRef]
- Catapano, F.; Di Iorio, S.; Sementa, P.; Vaglieco, B.M. Analysis of energy efficiency of methane and hydrogen-methane blends in a PFI/DI SI research engine. Energy 2016, 117, 378–387. [Google Scholar] [CrossRef]
- Mustafi, N.N.; Miraglia, Y.C.; Raine, R.R.; Bansal, P.K.; Elder, S.T. Spark-ignition engine performance with “Powergas” fuel (mixture of CO/H2): A comparison with gasoline and natural gas. Fuel 2006, 85, 1605–1612. [Google Scholar] [CrossRef]
- Bika, A.S.; Franklin, L.; Kittelson, D.B. Homogeneous charge compression ignition engine operating on synthesis gas. Int. J. Hydrogen Energy 2012, 37, 9402–9411. [Google Scholar] [CrossRef]
- Hagos, F.Y.; Aziz, A.R.A.; Sulaiman, S.A.; Firmansyah, M.R. Effect of fuel injection timing of hydrogen rich syngas augmented with methane in direct-injection spark-ignition engine. Int. J. Hydrogen Energy 2017, 42, 23846–23855. [Google Scholar] [CrossRef]
- SMITH G. GRI-Mech 3.0. Gas Res Inst Des Chicago 2018. Available online: www.me.berkeley.edu/gri_mech (accessed on 10 July 2018).
- Natarajan, J.; Lieuwen, T.; Seitzman, J. Laminar flame speeds of H2/CO mixtures: Effect of CO2 dilution, preheat temperature, and pressure. Combust. Flame 2007, 151, 104–119. [Google Scholar] [CrossRef]
- Heywood, J.B. Internal Combustion Engines; McGraw-Hill: New York, NY, USA, 1988; Volume 39, ISBN 9781260116113. [Google Scholar]
- Irimescu, A.; Di Iorio, S.; Merola, S.S.; Sementa, P.; Vaglieco, B.M. Evaluation of compression ratio and blow-by rates for spark ignition engines based on in-cylinder pressure trace analysis. Energy Convers. Manag. 2018, 162, 98–108. [Google Scholar] [CrossRef]
- Irimescu, A.; Marchitto, L.; Silvia, S.; Tornatore, C.; Valentino, G. Evaluation of different methods for combined thermodynamic and optical analysis of combustion in spark ignition engines. Energy Convers. Manag. 2014, 87, 914–927. [Google Scholar] [CrossRef]
- Merola, S.S.; Sementa, P.; Tornatore, C.; Vaglieco, B.M. Spectroscopic Investigations and High Resolution Visualization of the Combustion Phenomena in a Boosted PFI SI Engine. SAE Int. J. Engines 2009, 2, 1617–1629. [Google Scholar] [CrossRef]
- Martinez, S.; Irimescu, A.; Merola, S.; Lacava, P.; Curto-Riso, P. Flame Front Propagation in an Optical GDI Engine under Stoichiometric and Lean Burn Conditions. Energies 2017, 10, 1337. [Google Scholar] [CrossRef]
- Marseglia, G.; Costa, M.; Catapano, F.; Sementa, P.; Vaglieco, B.M. Study about the link between injection strategy and knock onset in an optically accessible multi-cylinder GDI engine. Energy Convers. Manag. 2017, 134, 1–19. [Google Scholar] [CrossRef]
- Merola, S.S.; Marchitto, L.; Tornatore, C.; Valentino, G.; Irimescu, A. Optical characterization of combustion processes in a DISI engine equipped with plasma-assisted ignition system. Appl. Therm. Eng. 2014, 69, 177–187. [Google Scholar] [CrossRef]
- Martinez, S.; Merola, S.; Irimescu, A. Flame Front and Burned Gas Characteristics for Different Split Injection Ratios and Phasing in an Optical GDI Engine. Appl. Sci. 2019, 9, 449. [Google Scholar] [CrossRef]
- Heywood, J.B. Internal Combustion Engine Fundamentals; McGraw-Hill: New York, NY, USA, 1988; ISBN 0-07-028637-X 978-0-07-028637-5 0-07-100499-8 978-0-07-100499-2. [Google Scholar]
- Di Iorio, S.; Sementa, P.; Vaglieco, B.M. Analysis of combustion of methane and hydrogen-methane blends in small DI SI (direct injection spark ignition) engine using advanced diagnostics. Energy 2016, 108, 99–107. [Google Scholar] [CrossRef]
- Gomes, C.A.; da Costa, R.B.R.; Franco, R.L.; Valle, R.M.; Huebner, R. PIV Measurements of In-Cylinder Tumble Flow in a Motored Single Cylinder Optical Research Engine; SAE Technical Paper Series; SAE: Warrendale, PA, USA, 2015. [Google Scholar]
- Huang, R.F.; Huang, C.W.; Chang, S.B.; Yang, H.S.; Lin, T.W.; Hsu, W.Y. Topological flow evolutions in cylinder of a motored engine during intake and compression strokes. J. Fluids Struct. 2005, 20, 105–127. [Google Scholar] [CrossRef]
- Mandilas, C.; Ormsby, M.P.; Sheppard, C.G.W.; Woolley, R. Effects of hydrogen addition on laminar and turbulent premixed methane and iso-octane-air flames. Proc. Combust. Inst. 2007, 31, 1443–1450. [Google Scholar] [CrossRef]
- Ji, C.; Liu, X.; Wang, S.; Gao, B.; Yang, J. Development and validation of a laminar flame speed correlation for the CFD simulation of hydrogen-enriched gasoline engines. Int. J. Hydrogen Energy 2012, 38, 1997–2006. [Google Scholar] [CrossRef]
- Martínez-Boggio, S.D.; Curto-Risso, P.L.; Medina, A.; Hernández, A.C. Simulation of cycle-to-cycle variations on spark ignition engines fueled with gasoline-hydrogen blends. Int. J. Hydrogen Energy 2016, 41, 9087–9099. [Google Scholar] [CrossRef]
- Emadi, M.; Karkow, D.; Salameh, T.; Gohil, A.; Ratner, A. Flame structure changes resulting from hydrogen-enrichment and pressurization for low-swirl premixed methane–air flames. Int. J. Hydrogen Energy 2012, 37, 10397–10404. [Google Scholar] [CrossRef]
- Haq, M.; Sheppard, C.G.; Woolley, R.; Greenhalgh, D.; Lockett, R. Wrinkling and curvature of laminar and turbulent premixed flames. Combust. Flame 2002, 131, 1–15. [Google Scholar] [CrossRef]
- Driscoll, J. Turbulent premixed combustion: Flamelet structure and its effect on turbulent burning velocities. Prog. Energy Combust. Sci. 2008, 34, 91–134. [Google Scholar] [CrossRef]
- Kang, K.Y.; Baek, J.H. Turbulence characteristics of tumble flow in a four-valve engine. Exp. Therm. Fluid Sci. 1998, 18, 231–243. [Google Scholar] [CrossRef]
- Lipatnikov, A.N.; Li, W.Y.; Jiang, L.J.; Shy, S.S. Does Density Ratio Significantly Affect Turbulent Flame Speed? Flow Turbul. Combust. 2017, 98, 1153–1172. [Google Scholar] [CrossRef]
- Scurlock, A.C.; Grover, J.H. Propagation of turbulent flames. Symp. Combust. 1953, 4, 645–658. [Google Scholar] [CrossRef]
- Brequigny, P.; Halter, F.; Mounaïm-Rousselle, C.; Dubois, T. Fuel performances in Spark-Ignition (SI) engines: Impact of flame stretch. Combust. Flame 2016, 166, 98–112. [Google Scholar] [CrossRef]
- Demesoukas, S.; Brequigny, P.; Caillol, C.; Halter, F.; Mounaïm-Rousselle, C. 0D modeling aspects of flame stretch in spark ignition engines and comparison with experimental results. Appl. Energy 2016, 179, 401–412. [Google Scholar] [CrossRef]
- Ha, J.; Park, J.; Kwon, O.B.; Lim, I.G.; Yun, J.H.; Keel, S.I.; Park, H.Y.; Kim, T.H. Flame extinction in interacting CO-air and syngas-air premixed flames. J. Mech. Sci. Technol. 2015, 29, 419–428. [Google Scholar] [CrossRef]


| Parameter | Size |
|---|---|
| Displaced volume | 530 cm3 |
| Stroke | 90 mm |
| Bore | 82 mm |
| Connecting Rod | 144 mm |
| Compression ratio | 9.7 |
| Clearance height | 1.5 mm |
| Top land height | 72 mm |
| Radial clearance Crevice volume Vcv 1.4 | 0.5 mm |
| Crevice volume 1.4 | 9.3 cm3 |
| Fuel. | CH4 (%) | H2 (%) | CO (%) | CO2 (%) | N2 (%) |
|---|---|---|---|---|---|
| M | 100 | 0 | 0 | 0 | 0 |
| S50 | 0 | 50 | 50 | 0 | 0 |
| S50D | 0 | 25 | 25 | 15 | 35 |
| S75 | 0 | 75 | 25 | 0 | 0 |
| S75D | 0 | 37.5 | 12.5 | 15 | 35 |
| Properties | M | S50 | S50D | S75 | S75D |
|---|---|---|---|---|---|
| LHV (MJ/kg) | 50.2 | 17.5 | 5.5 | 29.7 | 6.1 |
| AFRst (kgair/kgfuel) | 17.2 | 4.59 | 1.44 | 8.11 | 1.73 |
| Adiabatic Peak flame temp (K@1 atm) | 2223 | 2371 | 2005 | 2373 | 1981 |
| Laminar Flame Speed (m/s) | 0.35 | 1.23 | 0.52 | 1.77 | 0.73 |
| H2/CO | - | 1.0 | 1.0 | 3.0 | 3.0 |
| H2 mass (%) | 0 | 6.7 | 2.1 | 17.8 | 3.7 |
| DODvol% | 0 | 0 | 50 | 0 | 50 |
| Fuels | λ | 5% (CAD ASOS) | 10% (CAD ASOS) | 50% (CAD ASOS) |
|---|---|---|---|---|
| M | 1.0 | 13 | 16 | 32 |
| 1.2 | 13 | 17 | 33 | |
| 1.4 | 16 | 21 | 43 | |
| S50 | 1.0 | 5 | 6 | 21 |
| 1.2 | 6 | 8 | 25 | |
| 1.4 | 7 | 9 | 27 | |
| S50D | 1.0 | 9 | 11 | 28 |
| 1.2 | 10 | 13 | 28 | |
| 1.4 | 13 | 17 | 37 | |
| S75 | 1.0 | 3 | 4 | 17 |
| 1.2 | 4 | 5 | 17 | |
| 1.4 | 5 | 6 | 18 | |
| S75D | 1.0 | 7 | 9 | 25 |
| 1.2 | 8 | 11 | 24 | |
| 1.4 | 12 | 16 | 36 |
| Fuels | CO (ppm) | NOx (ppm) | CH4 (ppm) |
|---|---|---|---|
| M | 545 | 10 | 13,824 |
| S50 | 1555 | 3076 | 0 |
| S50D | 7419 | 2 | 0 |
| S75 | 1179 | 3115 | 0 |
| S75D | 3603 | 2 | 0 |
© 2019 by the authors. Licensee MDPI, Basel, Switzerland. This article is an open access article distributed under the terms and conditions of the Creative Commons Attribution (CC BY) license (http://creativecommons.org/licenses/by/4.0/).
Share and Cite
Martinez-Boggio, S.D.; Merola, S.S.; Teixeira Lacava, P.; Irimescu, A.; Curto-Risso, P.L. Effect of Fuel and Air Dilution on Syngas Combustion in an Optical SI Engine. Energies 2019, 12, 1566. https://doi.org/10.3390/en12081566
Martinez-Boggio SD, Merola SS, Teixeira Lacava P, Irimescu A, Curto-Risso PL. Effect of Fuel and Air Dilution on Syngas Combustion in an Optical SI Engine. Energies. 2019; 12(8):1566. https://doi.org/10.3390/en12081566
Chicago/Turabian StyleMartinez-Boggio, S.D., S.S. Merola, P. Teixeira Lacava, A. Irimescu, and P.L. Curto-Risso. 2019. "Effect of Fuel and Air Dilution on Syngas Combustion in an Optical SI Engine" Energies 12, no. 8: 1566. https://doi.org/10.3390/en12081566
APA StyleMartinez-Boggio, S. D., Merola, S. S., Teixeira Lacava, P., Irimescu, A., & Curto-Risso, P. L. (2019). Effect of Fuel and Air Dilution on Syngas Combustion in an Optical SI Engine. Energies, 12(8), 1566. https://doi.org/10.3390/en12081566