Article

Internal Combustion Engine Analysis of Energy Ecological Parameters by Neutrosophic MULTIMOORA and SWARA Methods

by
Edmundas Kazimieras Zavadskas
1,*,
Audrius Čereška
2,
Jonas Matijošius
3,
Alfredas Rimkus
3 and
Romualdas Bausys
4
1
Laboratory of Operational Research, Institute of Sustainable Construction, Faculty of Civil Engineering, Vilnius Gediminas Technical University Saulėtekio al. 11, LT-10223 Vilnius, Lithuania
2
Department of Mechanical and Material Engineering, Vilnius Gediminas Technical University, Basanaviciaus str. 28, LT-03324 Vilnius, Lithuania
3
Department of Automobile Engineering, Vilnius Gediminas Technical University, Basanaviciaus str. 28, LT-03324 Vilnius, Lithuania
4
Department of Graphical Systems, Vilnius Gediminas Technical University Saulėtekio al. 11, LT-10223 Vilnius, Lithuania
*
Author to whom correspondence should be addressed.
Energies 2019, 12(8), 1415; https://doi.org/10.3390/en12081415
Submission received: 20 March 2019 / Revised: 3 April 2019 / Accepted: 4 April 2019 / Published: 12 April 2019

Abstract

:
The investigation for new innovative solutions to reduce transport pollution is a priority for the European Union (EU). This study includes energy and a sustainable environment, as well as transport, logistics, and information and communication technologies. Energy ecological parameters of internal combustion depend on many factors: fuel, the fuel injection time, engine torque, etc. The engine’s energy ecological parameters were studied by changing engine torques, using different fuels, and changing the start of the fuel injection time. The selection of the optimum parameters is a complex problem. Multicriteria decision-making methods (MCDM) present powerful and flexible techniques for the solution of many sustainability problems. The article presents a new way of tackling transport pollution. The analysis of the energy ecological parameters of the experimental internal combustion engine is performed using the neutrosophic multi-objective optimization by a ratio analysis plus the full multiplicative form (MULTIMOORA) and step-wise weight assessment ratio analysis (SWARA) methods. The application of MCDM methods provides us with the opportunity to establish the best alternatives which reflect the best energy ecological parameters of the internal combustion engine.

1. Introduction

The European Union (EU) directives govern the mandatory increase in the share of biofuels in overall fuel consumption. Currently, this is a crucial political aspect of the assurance of EU energy saving and environmental requirements. According to the EU Directive 2003/30/ EC, member states shall sell 10% of biofuels in 2020 [1]. The “polluter pays” principle, which was transposed from EU directives to national legislation, is valid throughout the EU [2]. Both heavy transport and passenger cars [3] with strict regulation of carbon dioxide (CO2) emissions [4] are subject to these requirements. The search for new innovative solutions to reduce pollution in the transport sector is a priority EU direction. These include energy and sustainable environment, as well as transport, logistics, and information and communication technologies [5]. The EU White Paper sets out the principles for promoting energy saving and eco-friendly transport solutions [6]. One of these directions could be the usage of different alternative fuels like hydrogen (H) [7,8] and biogas [9,10], some different mixtures with gasoline [11,12], or ethanol [13].
Biodiesel is now used in internal combustion engines. It is a renewable energy source that can also be produced from local biomass. This fact emphasizes the importance of energy independence from fossil fuels [14,15]. Despite many positive features, the use of biodiesel is still limited. It depends on fuel properties such as a lower calorific value compared to diesel and a cold filter plugging point [16]. The lower calorific value of biodiesel leads to reduced engine power and higher-viscosity fuel injection characteristics.
The above-listed negative properties of biodiesel can be eliminated if other fuels (compounds that contain oxygen, which improves combustion in the combustion process, generating less harmful compounds) are used [17]. Nitromethane is used as fuel in TOP FUEL race cars, aero-models, and automobile models [18]. It is a good oxidant creating a stable adiabatic flame (2400 °C). The higher the nitromethane droplets are, the better the combustion process is [19]; in mixtures with hydrocarbon–methane, it remains stable, and the higher its concentration is, the more stable and better the combustion process is due to its additional oxygen (O2) content [20].
The research shows the impact of fuel type on engine performance; choosing such renewable fuel mixtures, which would ensure that engine performance parameters remain as close to the planned ones as possible, is very important [21,22,23]. For this reason, pure biofuels are rarely used, because their physic-chemical properties can significantly affect engine performance (its energy indicators). Various alternative fuel mixtures are usually used to adjust the properties mentioned above so that they are close to mineral diesel [24]. Therefore, a fuel gradation according to nitromethane content is used, which allows choosing a mixture, the injection of which into the engine would ensure the balance of its energy and ecological parameters [25,26]. Nitromethane gas is also found in exhaust gases, especially after the oxidation–reduction processes taking place in the catalytic neutralizer [27,28].
With the engine running at different loads, requirements for fuel also change. Therefore, identifying the conditions (engine load) and the start of fuel injection (SOI) parameters, the presence of which would allow reaching the optimum nitromethane content in the mixture, becomes essential.
Start of fuel injection affects the biodiesel combustion process and adjusts the change of combustion indicators using alternative fuel mixtures. Earlier or later start of fuel injection allows compensating for slower or more intense heat release due to the changed physic-chemical properties of fuel [29]. The combustion heat release and the depending pressure, which creates useful work in the cylinder, are important for minimum fuel consumption and maximum engine efficiency in time scale. The start of fuel injection timing also affects ecological engine indicators. In pursuit of the maximum energy efficiency of the engine, the beginning of fuel injection should be brought forward to a certain limit, and specific injection strategies and pressure can be carried out [30,31,32]. However, having the excellent start of fuel injection, the combustion takes place in a smaller volume, closer to the upper point of the piston. This fact increases the combustion temperature and pressure, resulting in higher nitrogen oxide (NOx) content forming in the cylinder, reduced opacity, and hydrocarbon (HC) emissions [32,33,34,35].
The comparison of brake-specific fuel consumption (BSFC) and engine efficiency ηe of engines allows for the most objective assessment of energy indicators of the internal combustion engine [31,36,37]. These indicators enable comparing engines of different structures during their running on fuels of various composition.
The main harmful components of exhaust gases of engines are products of incomplete combustion (carbon monoxide (CO), incompletely burnt HC, smoke) and NOx [31,38,39]. Carbon dioxide (CO2) is one of the greenhouse gas components emitted by engines. Its concentration depends on fuel composition (carbon/hydrogen ratio—C/H ratio), fuel consumption, and combustion process in the engine [31,40,41]. The O2 concentration in the exhaust engine gases allows assessing the fuel/air ratio of fuel mixtures, which affects fuel combustion (oxidation) and the emissions of harmful emitted components [31,42,43].
There is little research of mixtures comprising biodiesel and nitromethane in the scientific literature [1,18]. Examining their impact on the work of the internal combustion engine and ecological characteristics is very important. To ensure the optimum engine operating parameters, compatibility of all the settings, namely, compatibility of fuel and the engine, must be guaranteed. General research of these parameters can ensure optimal research results.
Experimental research with various fuels and different engine tuning parameters yields a multi-criteria problem which can be solved applying multicriteria decision-making methods (MCDM) methods. The MCDM analysis is often used to address multiple technical issues, for example, for the assessment and selection of renewable energy technologies [44,45,46,47], development of biomass technologies [48], ecological building assessment [49], reduction potential [50], to evaluate various failure modes more precisely [51], etc. Using the step-wise weight assessment ratio analysis (SWARA) method, the evaluation factors affecting electronic learning [52] logistics [53,54], employee selection [55], and logistic provider selection [56] were analyzed. Ratings of corporate social responsibility indicators are based on SWARA and additive ratio assessment (ARAS) [57]. Investment priorities in high-tech industries are determined by the step-wise weight assessment ratio analysis complex proportional assessment (SWARA-COPRAS) method [58].
The multi-objective optimization by a ratio analysis plus the full multiplicative form (MULTIMOORA) method addressed different real-life problems, such as logistics [59], biomedical [60], and banking optimization [61] problems. The MULTIMOORA method of analysis was successfully applied to the construction problem [62]. The different aspects of the integration of MULTIMOORA and SWARA methods were studied in Reference [63].
In the present paper, a new combination of neutrosophic MULTIMOORA and SWARA is proposed.
The analysis of energy ecological indicators of internal combustion engines by MCDM methods is the original topic. Therefore, such research and its results are new and relevant not only in the EU but also globally.
The paper aims to perform experimental research of energy ecological characteristics of the internal combustion engine and to analyze the obtained results using multi-criteria analysis methods. The ultimate goal is to determine a fuel mixture, the injection of which into the engine would ensure the balance of its energy and ecological indicators.

2. Internal Combustion Engine Research Strategy

Reduction of current pollution in the transport sector is an essential aspect of the assurance of energy saving and environmental requirements. It is very important to choose such fuel mixtures that would ensure good engine ecological energy parameters.
The engine always works at different loads and, thus, the fuel requirements change. Experiments were performed by changing engine load, injection angle, and fuel mixtures. During the last few decades, little research on mixtures comprising biodiesel and nitromethane was performed.
Experimental research with various fuels with different engine load and variable start of fuel injection parameters yields data concerning different areas. To manage this information, we applied the promising neutrosophic MULTIMOORA method [64]. The new set of options with minimizing and maximizing criteria is presented in Table 1.
During experimental studies, the energy efficiency of the engine was assessed by the parameters BSFC and ηe, and the eco-efficiency parameters were NOx, HC, CO, and CO2 (concentration in the exhaust gas and smoke). The concentration of O2 in the exhaust gas helps further evaluate the composition of the combustible mixture. These engine characteristics were analyzed in many other studies that tested different fuel mixtures [65,66,67,68]. The BSFC analysis provides the opportunity to compare fuel consumption costs in kilowatt-hours for efficient work. Engine efficiency ηe evaluates the efficiency of fuel energy conversion to mechanical energy, which varies with fuel mixture and injection timing [34,69]. NOx is a hazardous material that is formed at high combustion temperatures [70], but with increasing combustion temperature, HC and CO and particulate emissions are reduced [66,71]. The CO2 emissions depend mainly on fuel consumption and fuel composition (C/H ratio) [72,73].
During the tests, the engine rotated at the speed of n = 2000 rpm, loading it at engine torques (MB) of 30, 60, and 90 Nm. These tests correspond to ~17%, ~33%, and ~50% engine load. The calculated energy parameters are shown below.
Engine power, kW [31]:
P e = M B · ω ,
where ω is equal to 2πn. Diesel fuel lower heating value HL_D = 42.5 MJ/kg; lower heating value of rapeseed methyl ester (biodiesel) HL_B = 37.27 MJ/kg; nitromethane (NM) lower heating value HL_NM = 11.3 MJ/kg; castor oil lower heating value HL_C = 37 MJ/kg.
The lower heating value of fuel mixture was calculated applying the principle of additionality [31].
H L _ m i x = H L _ B · C B 100 + H L _ N M · C N M 100 + H L _ C · C C 100 ,
where HL_B, HL_NM, and HL_C represent the lower heating value of fuels biodiesel, nitromethane, and castor oil, respectively, MJ/kg; CB, CNM, and CC; represent the share (concentration) of the mass of considered fuel, %.
The effective energy efficiency coefficient assesses the share of fuel energy that is converted to the effective power of the engine Pe [31].
η e = P e · 3.6 m f _ m i x · H L _ m i x .
BSFC assesses the fuel mass that is used to do a kilowatt-hour of efficient work, g/kWh [31].
B S F C = m f _ m i x · 1000 P e .

3. Equipment and Methodology of Experimental Research

Engine tests were performed at the Internal Combustion Engines Laboratory. 
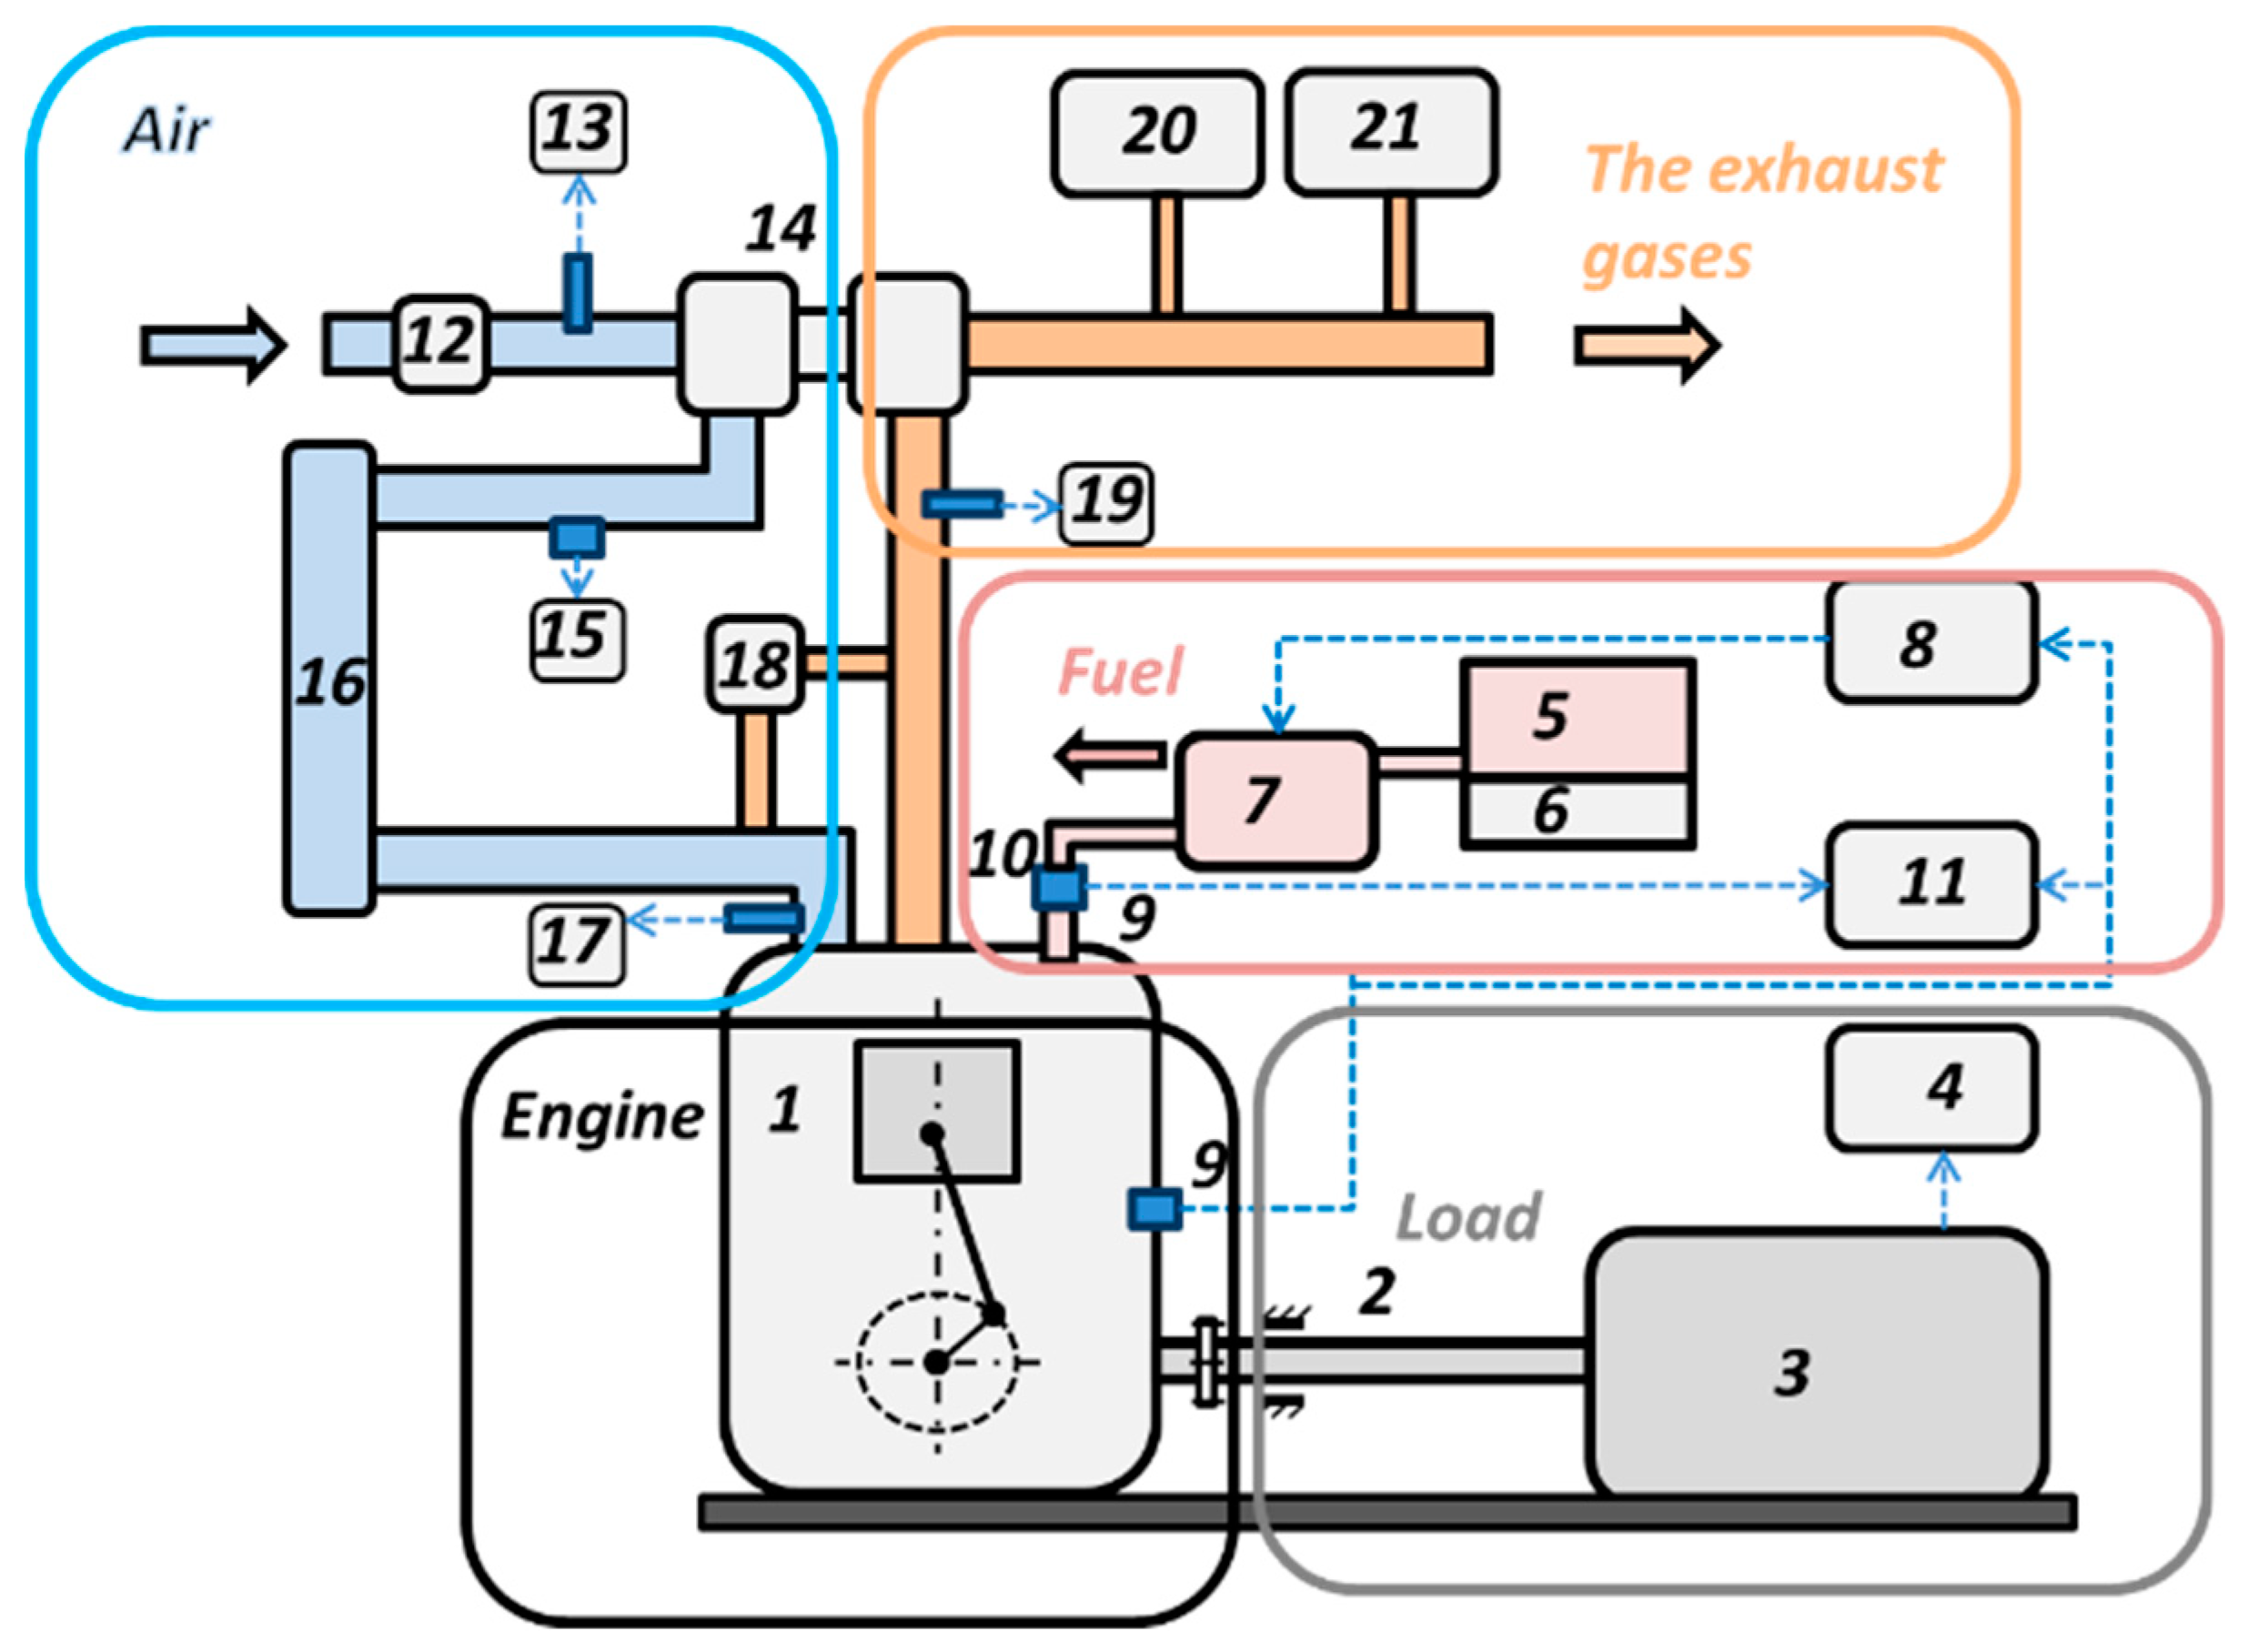
Figure 1 presents the principal scheme of the laboratory equipment. The laboratory equipment consists of the following equipment groups: compression ignition (CI) engine, engine load equipment, air supply system, fuel supply system, and exhaust system. All equipment groups were equipped with additional measuring instruments.
The main parameters of the 1.9 turbocharged direct injection (TDI) engine are shown in Table 2. The exhaust gas recirculation (EGR) system was disabled during the tests. The aim was to investigate the influence of NM on engine parameters.
Engine brake stand KI-5543 was used for the load setting. The loading stand was connected to the internal combustion engine utilizing a shaft. The engine torque MB (Nm) measurement error was ±1.23 Nm.
The intake air mass was measured applying air flow meter BOSCH HFM 5 with an accuracy of 2%. The pressure of air after turbocharger in the intake manifold of the engine was measured with pressure gauge Delta OHM HD 2304.0 (sensor TP704-2BAI), with a measurement error ±0.0002 MPa. A K-type thermocouple (accuracy ± 1.5 °C) was used for measuring intake air and exhaust gas temperature.
Hourly fuel consumption m f (kg/h) was measured using electronic scales SK-5000 and a stopwatch, with an accuracy of m f determination of 0.5%. The start of the fuel injection in the standard engine controls the electronic unit. The injection steering algorithm was adapted for different fuel types. The injection timing was controlled using an algorithm of modulation PWM (Pulse width modulation), while the signal generator was managed using a pulse controller TMW1. This device was directly connected to the distribution type fuel pump, and disconnected from the engine electronic control unit. The combustion process changes are dependent on the physic-chemical properties of the fuel, as well as the analysis of the maximum energy, and eco-efficiency analysis was performed by injecting fuel via the application of different algorithms. One of the leading fuel injection indicators is the start of the fuel injection timing measured by the crankshaft angle (°CA) before the top dead center (TDC). The start of the fuel injection was controlled using PWM, by forming the electronic control signal of the fuel pump. Start of the fuel injection was registered using a piezo sensor mounted on the tube of fuel supply to the injector and was recorded with an AVL DiSystem 845 device, with an accuracy of ±0.5 °CA.
Pollutants in exhaust gases (ecological parameters) were measured using gas analyzers AVL DiGas 4000/AVL DiCom 4000 (for NOx, HC, CO, CO2, O2) and AVL DiSmoke 4000/AVL DiCom 4000. The measurement range and the accuracy of gas analyzers are shown in Table 3.
Base diesel fuel, in line with the LST EN 590 standard and mixture of biodiesel, NM, and castor oil of different proportions, was used for running the engine. The concentration of castor oil was chosen according to the methodology of nitromethane and ethyl alcohol-driven aero models. The castor oil accounts for 20% of the weight of NM. NM is a highly volatile compound whose pure use can cause engine failure.
The experimental fuels had the following proportions:
100% diesel (D100);
100% biodiesel (B100);
94% biodiesel + 5% nitromethane + 1% castor oil (B94NM5C1);
91.6% Biodiesel + 7% nitromethane + 1.4% castor oil (B91.6NM7C1.4);
88% Biodiesel + 10% nitromethane + 2% castor oil (B88NM10C2);
82% Biodiesel + 15% nitromethane + 3% castor oil (B82NM15C3).
A very small amount of castor oil was chosen to improve fuel lubrication. Its influence on engine parameters is very insignificant.

4. Results of Experimental Investigation of the Internal Combustion Engine

Experimental research was carried out using fuel of six different compositions (D100, B100, B94NM5C1, B91.6NM7C1.4, B88NM10C2, and B82NM15C3) in a fuel tank (Figure 1). Using the start of fuel injection control equipment (PWM), the start of fuel injection timing (0, 4, 8, 12 °CA before TDC) was changed. Engine torques MB (30, 60, 90 Nm) were determined using the engine load stand. The average of five tests of measured energy and eco indicators of the engine is presented in the research results.
The use of O2-containing fuel adds to the combustion process, and improves the energy and environmental performance of the engine [74]. However, as the oxygenate concentration increases in fuel, the physic-chemical properties of the fuel mixture change and, consequently, the fuel becomes more volatile, changes its injection characteristics, reduces the heat content of the fuel mixture, and increases fuel consumption (Table 4 shows the results of the experiments). Therefore, it is essential to regulate the angle of fuel injection to achieve a more reliable balance between energy and ecological indicators in different engine loads.
The results of Table 4 show that increasing the concentration of oxygenates improves some of the parameters, while others deteriorate; therefore, it is expedient to evaluate them as a whole using the MCDM analysis.
It is crucial to identify the importance of the above indicators, which depends on the engine parameters you want to highlight. If you are going to highlight the eco-engine parameters, the appropriate mixture of optimum fuel and exceptionally self-contained oxygenates will show better combustion characteristics, which in turn will allow the complete combustion cycle to take place on additional O2. This fact results in fewer incomplete combustion products and better environmental performance. However, the lower calorific value of the mixture results in higher fuel consumption [21].
When changing engine load, it increases fuel consumption and increases exhaust gas emission. Therefore, in order to find the optimum mixture of oxygenates, it is essential to evaluate the balance between engine performance and eco-indicators, where the preferred priority of the indicators allows to ensure the compatibility of all engine parameters depending on the load and the advance angle of the engine, allowing to change the time of fuel injection, and directly affecting the combustion process. An expert survey was carried out to assess the importance of engine performance and environmental performance, during which experts put a priority ranking of indicators [75].
Twelve experts, including a doctor, scientist, and engineers, most of them teaching at a higher school and with experience between three and 45 years, were interviewed.
These 12 experts reached a consensus concerning the ranking order of the criteria and provided a personal evaluation of pairwise relative importance data, presented in Table 5.

5. MCDM Analysis Using SWARA and Neutrosophic MULTIMOORA Methods

Experimental internal combustion engine tests and large quantities of results showed that MCDM analysis is required to analyze the results. For analysis, multi-criteria analysis methods SWARA and neutrosophic MULTIMOORA were used. The SWARA method allows us to efficiently integrate individual expert opinions concerning the pairwise importance of the criteria. The MULTIMOORA method is governed by a triple objective which provides additional robustness and stability.

5.1. Assessment of the Weights by SWARA Method

The assessment of the criteria importance is a crucial aspect considering all MCDM problems. The weights of the criteria represent the degree of the influence of the particular criterion on the final ranking of the alternatives. The weight determination problem was considered, applying consistent and gradual pairwise comparison of criteria corresponding to influence in the SWARA method [76,77,78]. The SWARA method is governed by experts’ evaluation concerning the importance of the criteria [77].
The essence of the SWARA method, which is applied to calculate criteria weights, can be expressed by the following steps:
  • Determination of the set of criteria;
  • Criteria ranking performed by expert evaluation (the most crucial weight is placed in first position);
  • The average value of comparative importance is obtained s j ;
  • The benefits of the comparative importance are calculated k j = s j + 1 ;
  • Transitional weights are recalculated q j = q j 1 k j ;
  • The final weights are normalized as w j = w j j = 1 n w j , where n is the number of criteria.
Table 6 presents all intermediate results obtained applying the SWARA method: the average values of criteria relative comparative importance, coefficients of criteria relative comparative importance, converted (intermediate) criteria weights, and final criteria weights.

5.2. The Neutrosophic MULTIMOORA Method

The neutrosophic MULTIMOORA method was constructed applying chief constituents. The single-valued neutrosophic set models the initial information representation and provides the algebraic basis of the operations, and the traditional crisp MULTIMOORA approach introduced in Reference [79] offers the theoretical framework for the ranking of the alternatives. The traditional crisp MULTIMOORA method, which initially was proposed by one of the authors, was quite intensively applied to solve various problems, and this approach underwent different extensions [64,80]. This new proposed approach, namely multi-objective optimization by a ratio analysis plus the full multiplicative form single-valued neutrosophic set (MULTIMOORA-SVNS), was applied to perform internal combustion engine analysis of energy ecological parameters.
The essence of the MULTIMOORA-SVNS consists of the application of three objectives: ratio system, reference point technique, and full multiplicative form. The final ranking of the alternatives was performed integrating the results of these three objectives by the rules of the dominance theory.
Traditionally, like all MCDM methods, the proposed approach was initiated by the construction of the decision matrix X. The x i j elements of this matrix represent the i t h criteria of j t h alternative, and this matrix can be expressed by
X = [ x 11 x 1 m x n 1 x n m ] .
The ratio system was applied to the formation of the first objective of the proposed method. At the first step, the normalization of the decision matrix is initially performed by the vector normalization approach.
X * = x i j i = 1 m x i j 2 .
After normalization, the neutrosophication step for the elements of the decision matrix is performed. The crisp values are transformed into single-valued neutrosophic members applying conversion rules which were discussed in Reference [62].
After this step, the neutrosophic decision matrix is constructed. The first objective of the neutrosophic MULTIMOORA approach is calculated as follows:
Q j = i = 1 g w i ( x n * ) i j + ( i = g + 1 n w i ( x n * ) i j ) c ,
where g elements correspond to members of the criteria to be maximized, and n g corresponds to members of the criteria to be minimized. Here, single-valued neutrosophic members have the form ( x n * ) 1 = ( t n 1 , i n 1 , f n 1 ) . The following algebraic operations were applied for the neutrosophic numbers:
λ ( x n * ) 1 = ( 1 ( 1 t n 1 ) λ , ( i n 1 ) λ , ( f n 1 ) λ ) ,
( x n * ) 1 ( x n * ) 2 = ( t n 1 + t n 2 t n 1 t n 2 , i n 1 i n 2 , f n 1 f n 2 ) ,
( x n 1 * ) c = ( f n 1 , 1 i n 1 , t n 1 ) .
The deviation due to the reference point and the min–max matrix of the Tchebycheff norm is the basis for the construction of the second objective of the proposed neutrosophic MULTIMOORA method. This objective is called the reference point technique and can be expressed as
min j ( max i | D ( r i w i ( x n * ) i j ) | i ) .
The reference point can be expressed as follows:
r i = max j ( w i ( x n * ) i j ) ,
for the case of the criteria to be maximized, and, in the case of the criteria minimization,
r i = min j ( w i ( x n * ) i j ) .
The score function is utilized to perform a comparison of the neutrosophic members.
S ( ( x n * ) 1 ) = 3 + t n 1 2 i n 1 f n 1 4 .
Therefore, in the case of
S ( ( x n * ) 1 ) S ( ( x n * ) 2 ) , ,
( x n * ) 1 is smaller than ( x n * ) 2 , and
( x n * ) 1 ( x n * ) 2 .
The distance measure between two single-valued neutrosophic sets is introduced as follows:
D ( ( x n * ) 1 , ( x n * ) 2 ) = 1 3 ( ( t n 1 t n 2 ) 2 + ( i n 1 i n 2 ) 2 + ( f n 1 f n 2 ) 2 ) .
The full multiplicities form is the main concern of the third objective in the proposed approach. Therefore, the overall utility is calculated for each decision alternative, which can be expressed as follows:
U j = S ( A j ) S ( B j ) .
Here, A j and B j components are calculated as
A j = Π i = 1 g w i ( x n * ) i j , B j = Π j = g + 1 n w i ( x n * ) i j .
The first component A j represents the product of criteria of j t h alternative to being maximized, and the second component B j corresponds to the product of criteria of j t h alternative to being minimized. The multiplication of the separate single-valued neutrosophic members is performed as follows:
( x n * ) 1 ( x n * ) 2 = ( t n 1 t n 2 , i n 1 + i n 2 i n 1 i n 2 , f n 1 + f n 2 f n 1 f n 2 ) .
The final summarization of all three objectives of the neutrosophic MULTIMOORA method is performed applying the dominance theory of Brauers and Zavadskas [62].

6. Results of MCDM Analysis

Expert results of MCDM analysis using neutrosophic MULTIMOORA and SWARA methods were determined. Experimental results are divided into 12 tasks. The first problem corresponds to the first case of the experiments (lines 1–6 in Table 4), where the first problem corresponds to start of fuel injection before TDC, 0 (°CA); engine torque, 30 (Nm), the second problem corresponds to start of fuel injection before TDC, 0 (°CA); engine torque, 60 (Nm), etc. The other 11 problems are constructed in the same way. The results are presented in Table 7, Table 8 and Table 9, and Table A1, Table A2, Table A3, Table A4, Table A5, Table A6, Table A7, Table A8, Table A9, Table A10, Table A11, Table A12, Table A13, Table A14, Table A15, Table A16, Table A17, Table A18, Table A19, Table A20, Table A21 and Table A22.
The other results are presented in the annexed tables.
Table 9 summarizes the results.

7. Discussion

The aim of the research using neutrosophic MULTIMOORA and SWARA methods was to determine a fuel mixture which would ensure the balance of engine energy and ecological parameters.
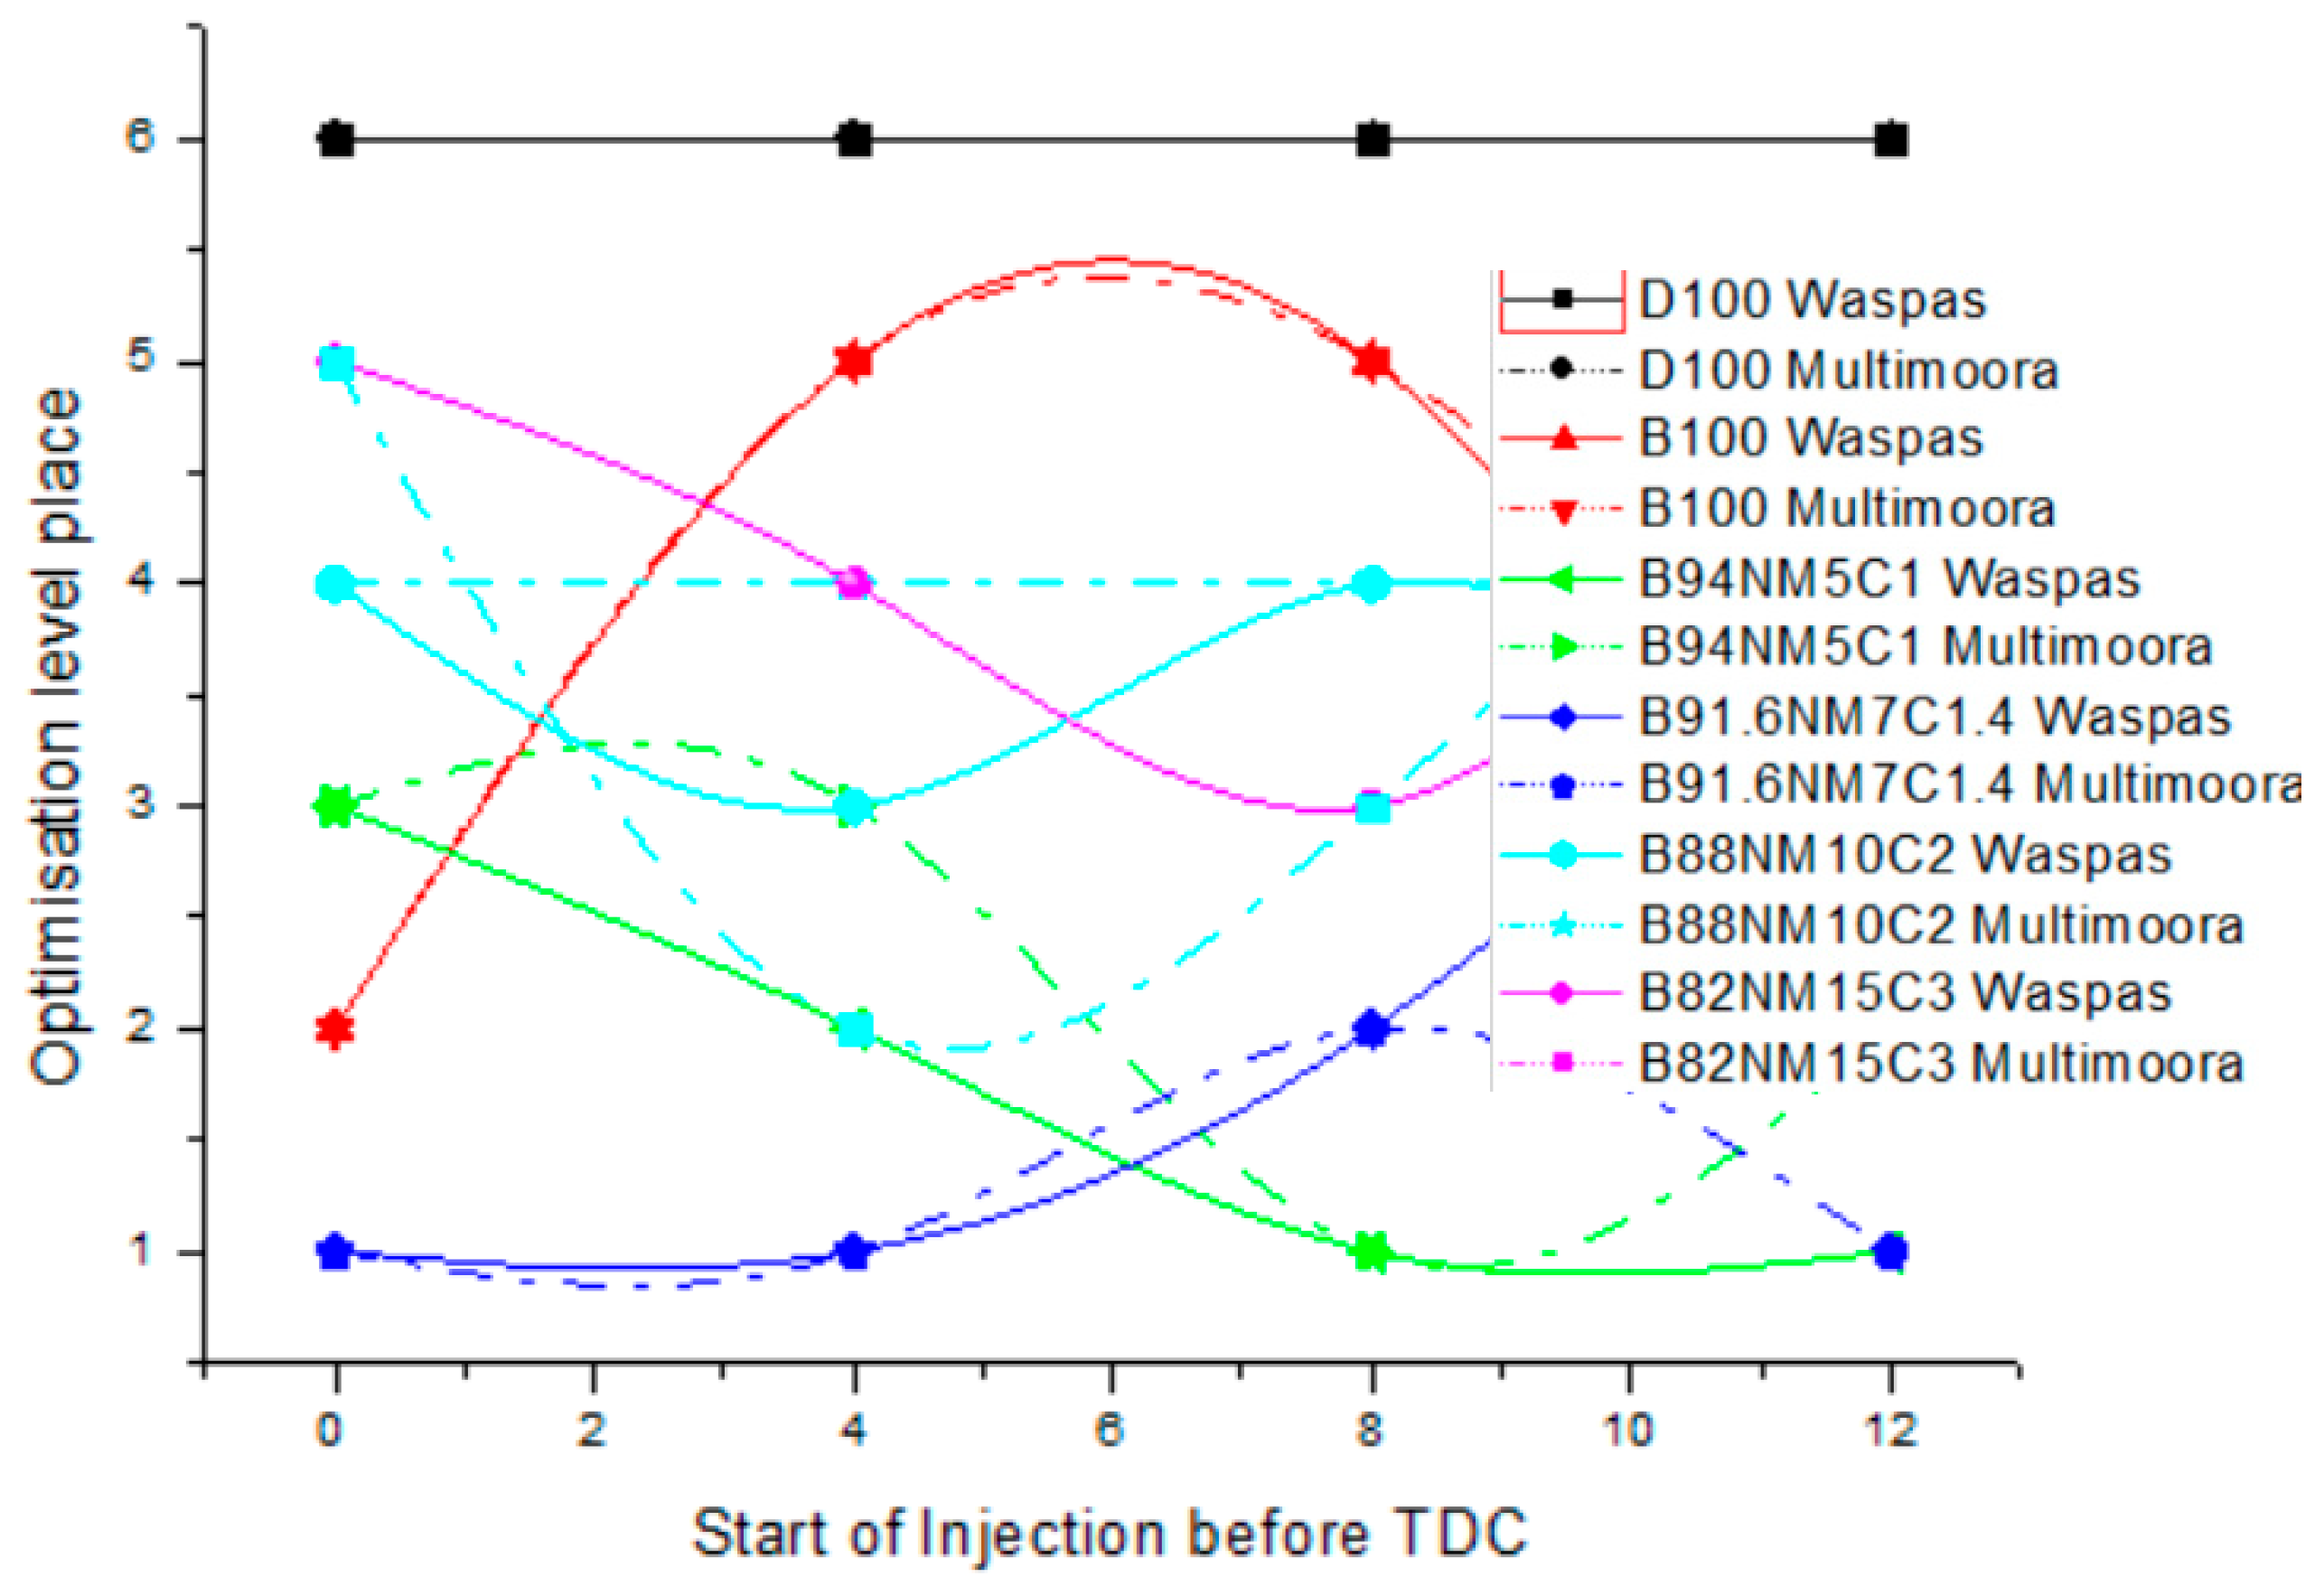
When analyzing the results of the research, it is necessary to take into account how different fuel mixtures under different operating conditions of the engine influenced its energy and ecological characteristics. For this purpose, an optimum scale was used that revealed how fuel mixtures vary in different SOI, i.e., prioritizing fuel selection. The highest priority was given to fuel, which was first on the optimum scale, while the lowest priority was given to the fuel in sixth place. This method of assessment allows the identification of the optimum use of fuel mixtures at different engine loads and SOI.
The optimal mixture change based on fuel SOI was observed at a very low (~17%) engine load (30 Nm) (Figure 2). The ranking of mixtures upon changing SOI at a very low (~17%) engine load (30 Nm) is presented in Figure 2. The diesel was the least efficient fuel at the fuel injection advance angle of 8°. This trend was observed in the application of both methods (weighted aggregated sum product assessment (WASPAS) and neutrosophic MULTIMOORA). This fact can be explained by a low amount of fuel supplied at low load, due to physic-chemical properties [15]. High nitromethane content (15%) due to increased evaporation rate of fuel and low droplet dispersion did not allow using it as optimal (third place in application of the neutrosophic MULTIMOORA method and second place using WASPAS method), although having delayed the injection angle to 12°, it fell to the fifth place in application of both methods due to higher evaporation time. Several trends of change of the biodiesel and 5% NM mixture were observed. At the injection angles of 0° and 4°, a more homogeneous combustible mixture was not formed due to worse evaporation compared to NM evaporation [15] in comparison to angles of 8° and 12°. This trend was observed in the analysis in the application of both methods, but the MULTIMOORA method was more consistent at the advance angle of 12°. Compared to other fuels, biodiesel has the highest viscosity [16], and the optimal performance was achieved at 0° fuel injection advance angle (second place in the application of both methods). However, when increasing the fuel injection advance angle, a lower droplet becomes an advantage, while a heavier one burns worse in this case, forming areas of the fatter mixture [81]. This trend was observed by increasing the fuel injection advance angle, and biodiesel became the worst mixture at 4° and 8°. When further increasing the injection angle up to 12°, the fuel had enough time to evaporate and form a homogeneous mixture in individual zones, resulting in improved efficiency of biodiesel (third place in the application of the WASPAS method and second place using the neutrosophic MULTIMOORA method). A small addition of NM (7%) slightly changed the properties of biodiesel, improving them because of decreasing viscosity of the mixture, whereby this mixture was found to be optimal. This mixture was optimal at all fuel injection angles, but when increasing the fuel injection advance angle to 12° in the application of the neutrosophic MULTIMOORA method, its optimality parameters deteriorated (fourth place). Similar trends were observed analyzing a 5% NM mixture; with the increasing injection advance angle, the mixture approached its optimal efficiency due to the NM evaporation properties (at 8° in application of both methods; at 12°, it ranked second in the application of the WASPAS method, and first using the neutrosophic MULTIMOORA method).
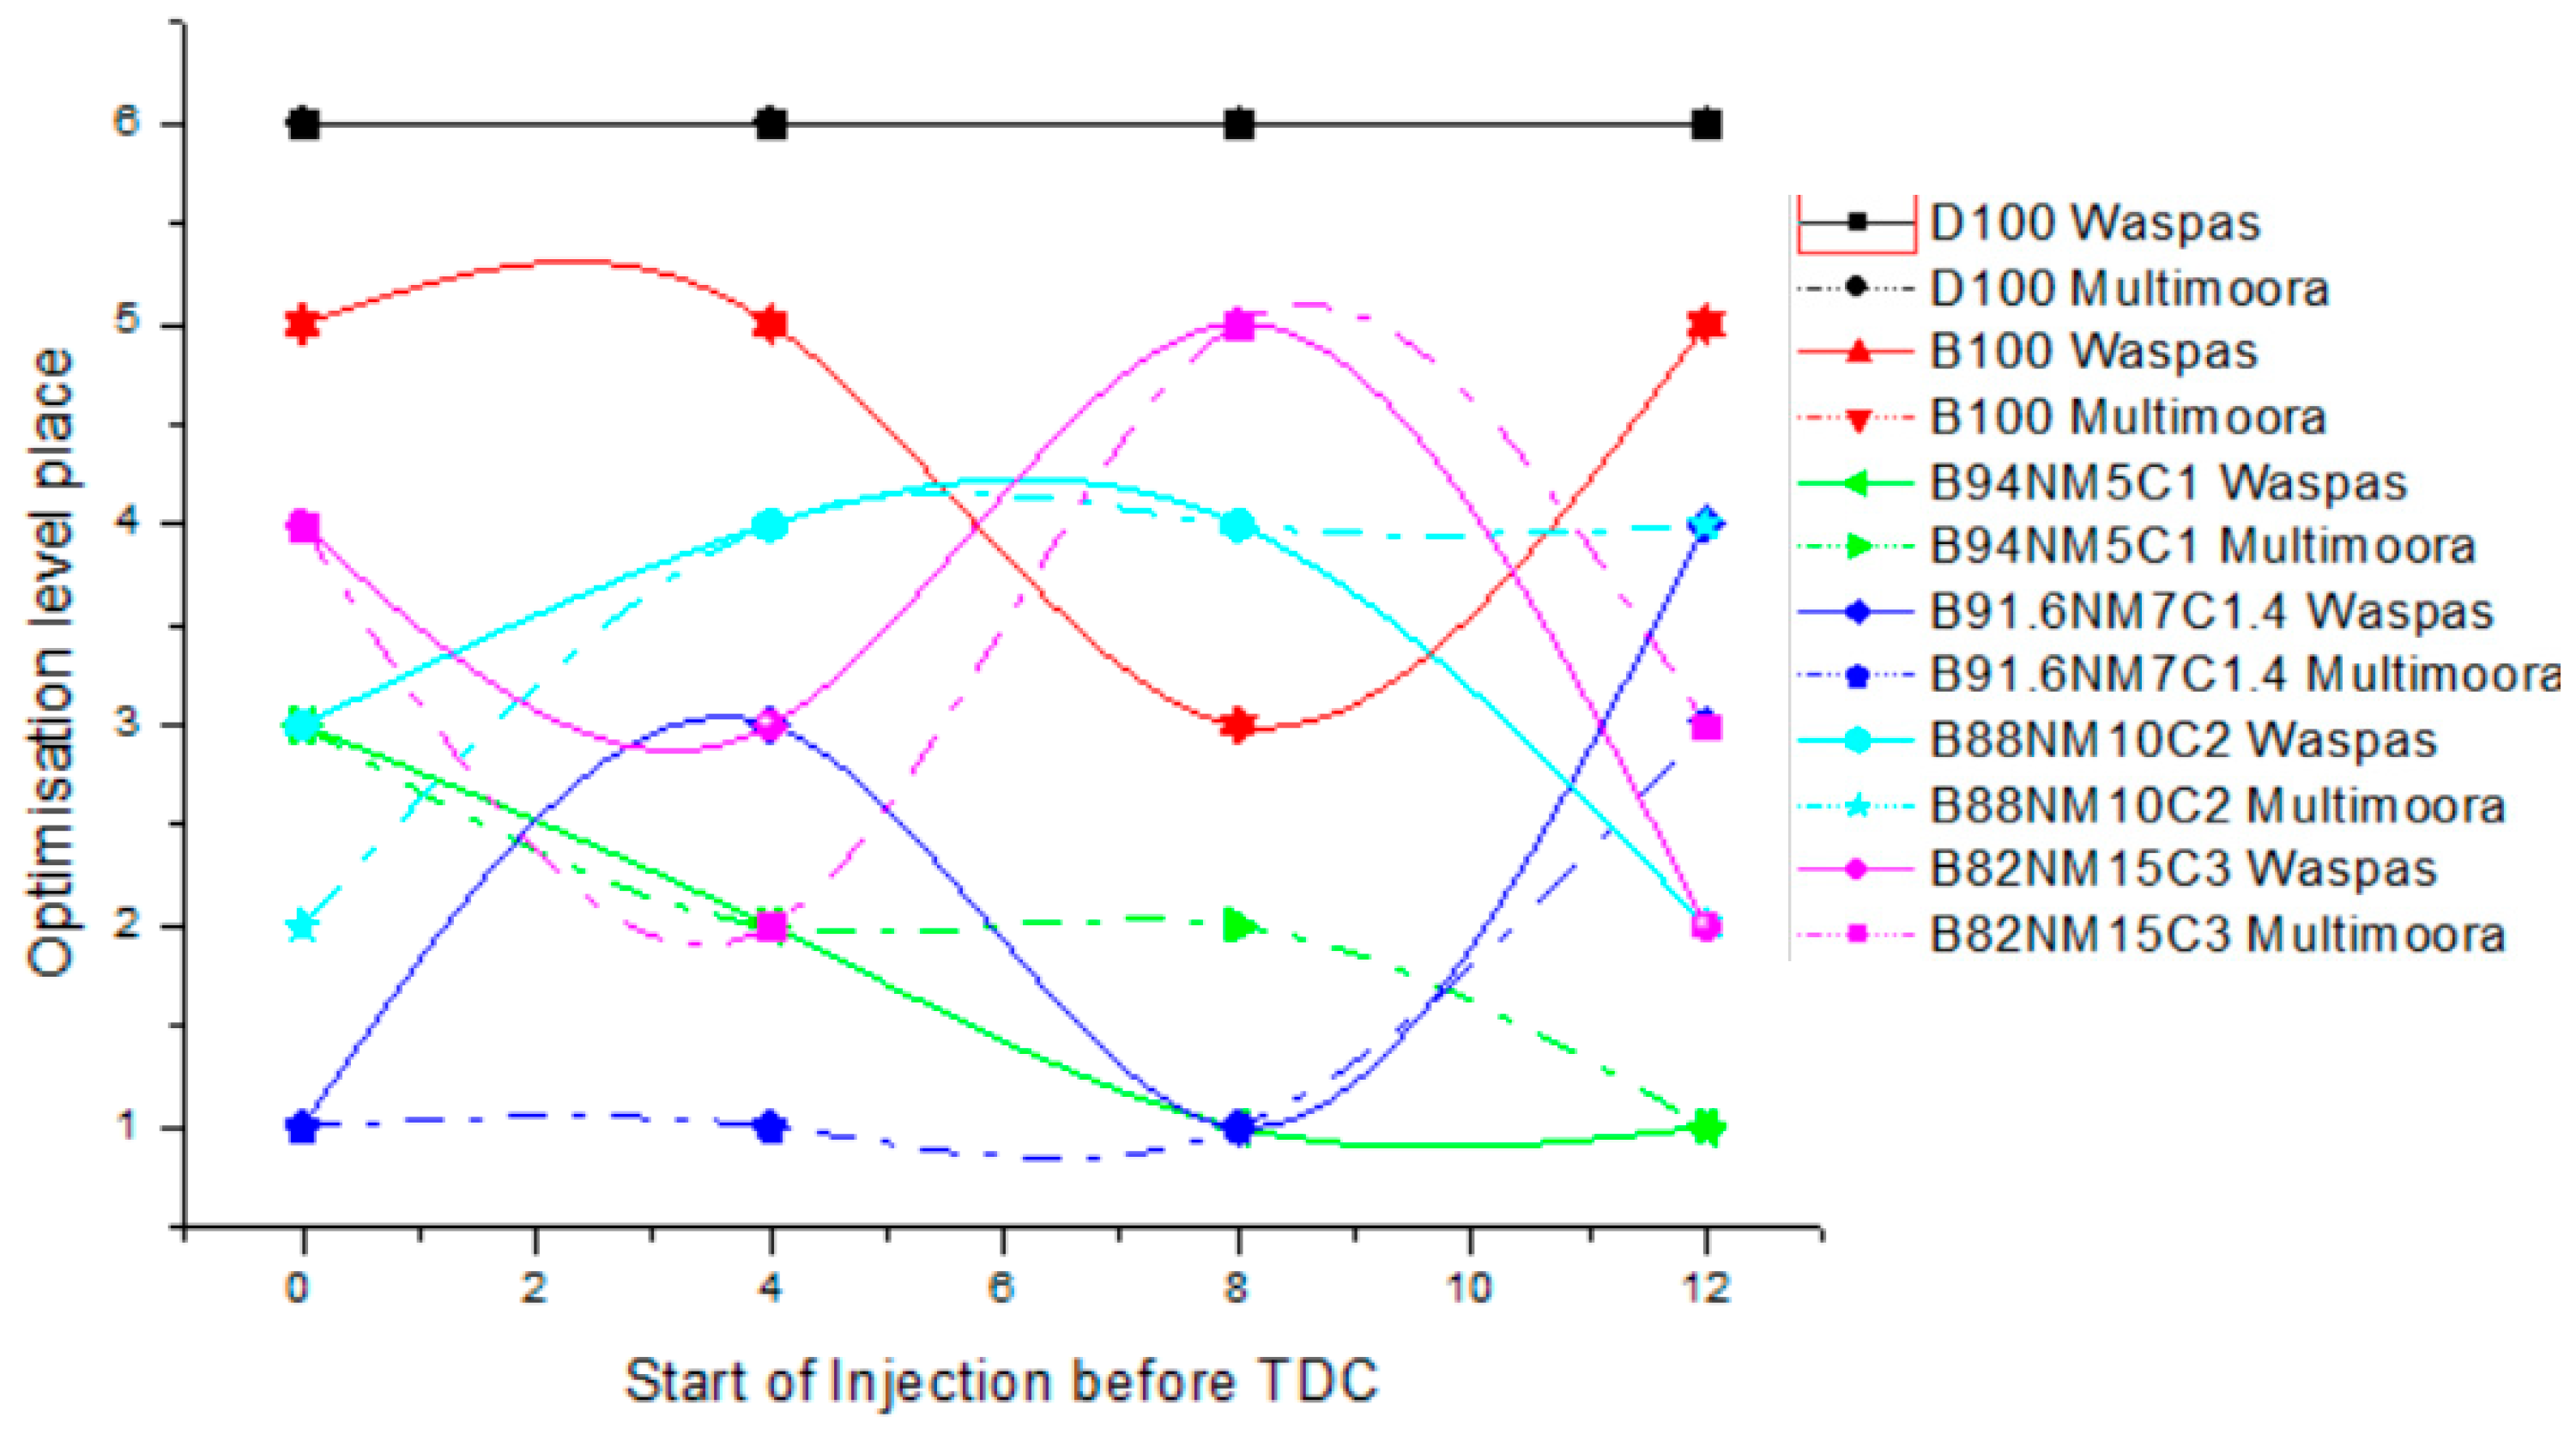
At the low (~33%) engine load (60 Nm) (Figure 3), pure diesel (sixth place) and biodiesel (fifth place at 0–4° and 12° advance angles) were observed to be the least optimal mixtures in the application of both methods. This fact comes as a result of the lower level of their evaporation compared to other fuels. The already established trends of optimality were also observed; at the advance angle of 4–12°, lower NM content (5%) allowed ensuring the optimal efficiency (first and second place using both methods) due to higher fuel consumption compared to the load of 30 Nm. Furthermore, the 7% NM mixture remained optimal (at the angles of 0° to 8°, it ranked first using the WASPAS method, and, at the advance angle of 12°, decreasing optimality was observed in the application of the neutrosophic MULTIMOORA method (third place)). The biodiesel properties also improved through increasing its evaporation level and distributing the fuel mixture more evenly. Upon increasing the NM concentration in mixtures, the optimal trends remained similar (examining mixtures with 10% NM content). A mixture with 15% NM content remained the least stable in terms of its optimal efficiency.
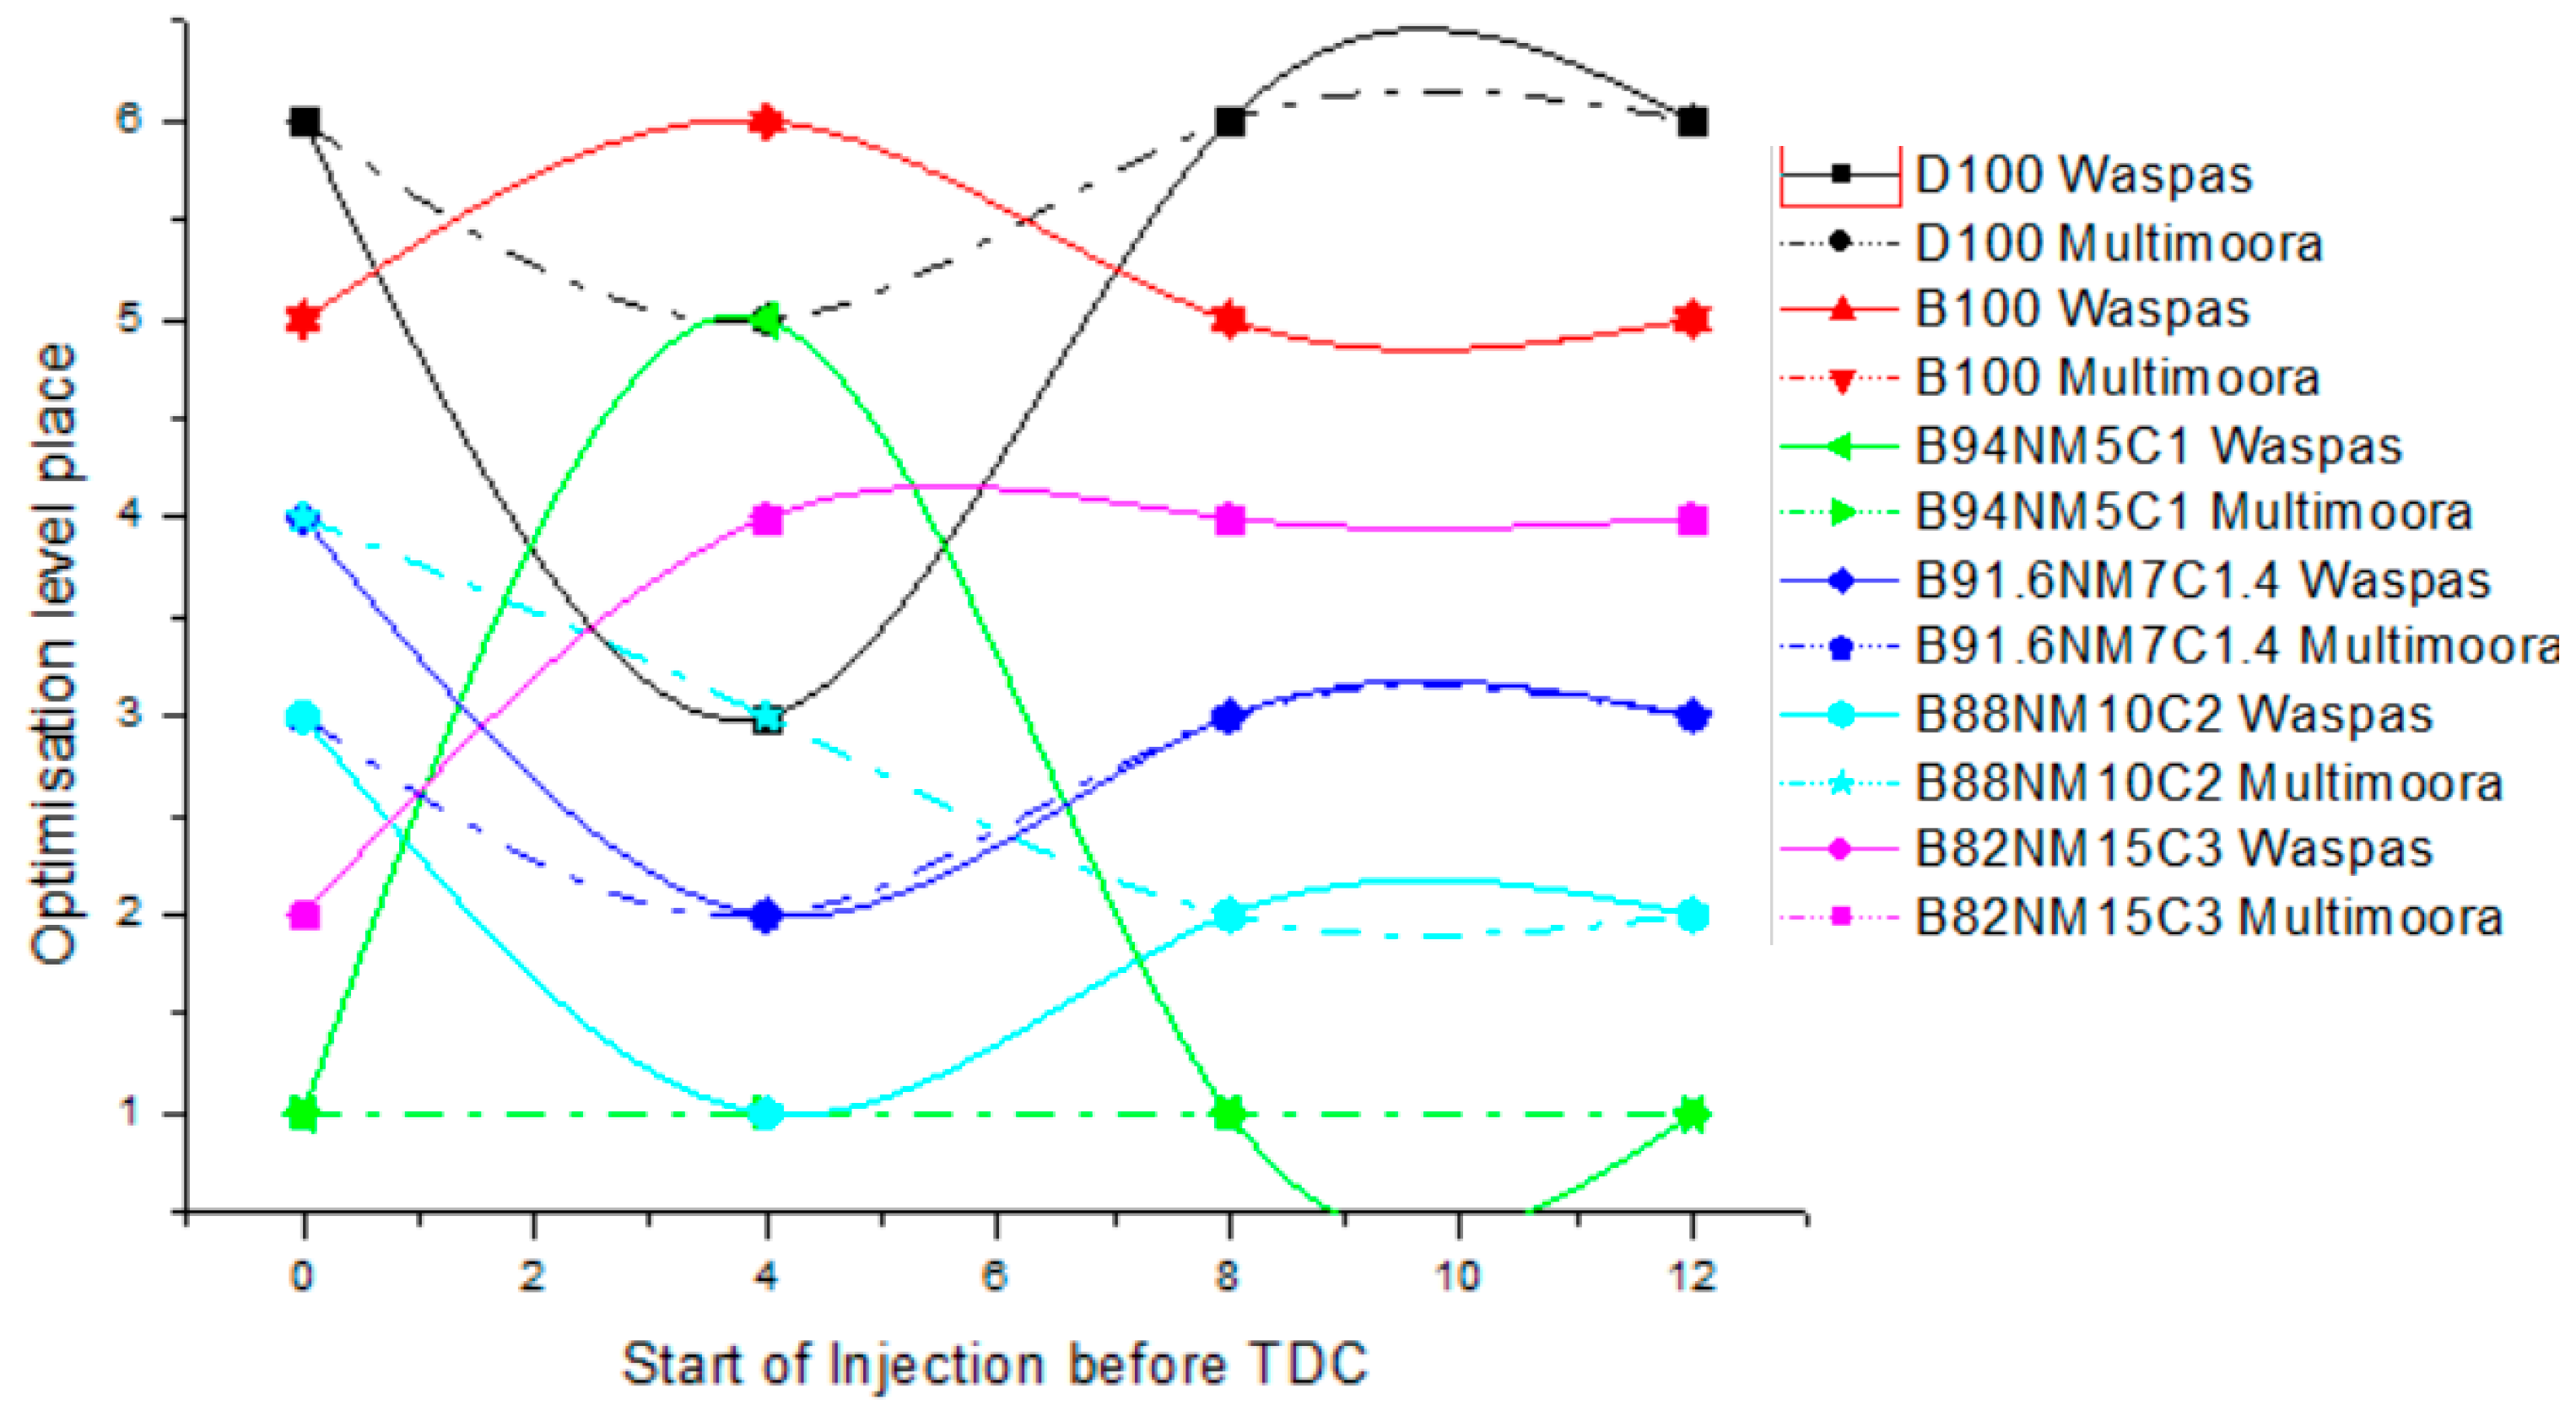
At average (~50%) engine loads (90 Nm) (Figure 4), the 5% NM mixture became optimal at all fuel injection advance angles (0°, 4°, 8°, 12°) (first place in application of the SWARA analysis method), while fuel diesel and biodiesel were the least optimal (sixth and fifth places, respectively). Engine performance parameters differed chaotically with other mixtures, which was related to the uneven distribution of the mixture.
The conducted MCDM analysis revealed that the best results were obtained with fuel B94NM5C1 because this fuel ranked first in seven cases, which accounts for more than 50% of all research results.
According to the analysis, fuel B88NM10C2 ranked second and third. The remaining places were shared by the other fuels, with D100 taking last place.

8. Conclusions

Experimental research of energy ecological parameters of the internal combustion engine was performed. During the experiments, three variables were used: fuel injection angle, engine torque, and fuel composition.
Many internal combustion engine operating characteristics obtained by experimental studies require analysis using MCDM analysis methods. The MCDM analysis was performed to determine the priority sequence of the energy ecological parameters of the internal combustion engine.
In the present paper, a new combination of neutrosophic MULTIMOORA and SWARA was proposed. When evaluating the energy and ecological aspects of the performance of the engine, it should be noted that the fuel mix made from biodiesel rapeseed methyl ester (RME) and NM was significantly better than conventional fuel diesel or biodiesel after the injection angle adjustment. According to the summarized results of the analysis, the best energy ecological working parameters were obtained using fuel B94NM5C1 and the worst were obtained using fuel D100. Fuel mixtures that contain biofuels make it possible to completely replace fossil fuels without damaging the performance of the engine. The article presents a new way to reduce diesel internal combustion engine pollution.
The MCDM analysis can be used to determine a fuel mixture that provides the optimal energy and environmental performance of the internal combustion engine, depending on the engine load.
The MCDM analysis methods can be applied to other similar technical problems.

Author Contributions

Conceptualization, E.K.Z.; methodology, R.B.; software, R.B.; validation, R.B.; formal analysis, E.K.Z., A.Č., and R.B.; investigation, A.R. and J.M.; resources, A.R. and J.M.; data curation, A.R. and J.M.; writing—original draft preparation, A.R. and J.M.; writing—review and editing, E.K.Z., A.Č., and R.B.; visualization, A.Č.; supervision, E.K.Z.; project administration, E.K.Z.

Funding

This research received no external funding.

Conflicts of Interest

The authors declare no conflicts of interest.

Appendix A

Table A1. The rankings of the alternatives using the separate objectives of the neutrosophic MULTIMOORA approach (second problem).
The First ObjectiveThe Second ObjectiveThe Third Objective
S ( Q i ) Rank max | D ( r i w i ( x n * ) i j ) | Rank U j Rank
A10.607960.971250.25486
A20.655950.972360.44675
A30.688920.971141.43573
A40.758710.971036.99981
A50.681030.969521.31034
A60.676740.968811.45132
Table A2. The final rankings of the alternatives using the dominance theory of the neutrosophic MULTIMOORA approach (second problem).
The First ObjectiveThe Second ObjectiveThe Third ObjectiveFinal Rank
A16566
A25655
A32433–4
A41311
A53243–4
A64122
Table A3. The rankings of the alternatives using the separate objectives of the neutrosophic MULTIMOORA approach (third problem).
The First ObjectiveThe Second ObjectiveThe Third Objective
S ( Q i ) Rank max | D ( r i w i ( x n * ) i j ) | Rank U j Rank
A10.523460.972150.10886
A20.583750.972260.26165
A30.747810.968416.86442
A40.743820.971247.00071
A50.729240.970934.63154
A60.735930.969026.69463
Table A4. The final rankings of the alternatives using the dominance theory of the neutrosophic MULTIMOORA approach (third problem).
The First ObjectiveThe Second ObjectiveThe Third ObjectiveFinal Rank
A16566
A25655
A31121
A42412
A54344
A63233
Table A5. The rankings of the alternatives using the separate objectives of the neutrosophic MULTIMOORA approach (fourth problem).
The First ObjectiveThe Second ObjectiveThe Third Objective
S ( Q i ) Rank max | D ( r i w i ( x n * ) i j ) | Rank U j Rank
A10.605260.97094-50.25886
A20.700920.971961.31613
A30.703710.969921.58452
A40.689550.970831.58631
A50.692940.97094–51.23244
A60.679930.969511.01255
Table A6. The final rankings of the alternatives using the dominance theory of the neutrosophic MULTIMOORA approach (fourth problem).
The First ObjectiveThe Second ObjectiveThe Third ObjectiveFinal Rank
A164–566
A22633
A31221
A44312
A534–544
A65155
Table A7. The rankings of the alternatives using the separate objectives of the neutrosophic MULTIMOORA approach (fifth problem).
The First ObjectiveThe Second ObjectiveThe Third Objective
S ( Q i ) Rank max | D ( r i w i ( x n * ) i j ) | Rank U j Rank
A10.532260.97154–60.10936
A20.581350.97154–60.22835
A30.740220.970233.68874
A40.744310.970154–65.75761
A50.738830.969514.16332
A60.729940.969723.78993
Table A8. The final rankings of the alternatives using the dominance theory of the neutrosophic MULTIMOORA approach (fifth problem).
The First ObjectiveThe Second ObjectiveThe Third ObjectiveFinal Rank
A164–666
A254–655
A32343–4
A414–611
A53122
A64233–4
Table A9. The rankings of the alternatives using the separate objectives of the neutrosophic MULTIMOORA approach (sixth problem).
The First ObjectiveThe Second ObjectiveThe Third Objective
S ( Q i ) Rank max | D ( r i w i ( x n * ) i j ) | Rank U j Rank
A10.481260.972460.05856
A20.707850.971351.21695
A30.728710.970024.40382
A40.726120.968615.14241
A50.719940.971043.55924
A60.721630.970634.27633
Table A10. The final rankings of the alternatives using the dominance theory of the neutrosophic MULTIMOORA approach (sixth problem).
The First ObjectiveThe Second ObjectiveThe Third ObjectiveFinal Rank
A16666
A25555
A31222
A42111
A54444
A63333
Table A11. The rankings of the alternatives using the separate objectives of the neutrosophic MULTIMOORA approach (seventh problem).
The First ObjectiveThe Second ObjectiveThe Third Objective
S ( Q i ) Rank max | D ( r i w i ( x n * ) i j ) | Rank U j Rank
A10.589550.972260.20936
A20.677340.970941.16815
A30.713110.96961-23.35301
A40.589460.96961-21.99593
A50.690930.971251.62084
A60.698620.970332.34572
Table A12. The final rankings of the alternatives using the dominance theory of the neutrosophic MULTIMOORA approach (seventh problem).
The First ObjectiveThe Second ObjectiveThe Third ObjectiveFinal Rank
A15666
A24455
A311–211
A461–233
A53544
A62322
Table A13. The rankings of the alternatives using the separate objectives of the neutrosophic MULTIMOORA approach (eighth problem).
The First ObjectiveThe Second ObjectiveThe Third Objective
S ( Q i ) Rank max | D ( r i w i ( x n * ) i j ) | Rank U j Rank
A10.623160.970930.25666
A20.662850.97104-60.47825
A30.704010.970221.79202
A40.697420.97104-61.91441
A50.696430.97104-61.47654
A60.691040.969711.58623
Table A14. The final rankings of the alternatives using the dominance theory of the neutrosophic MULTIMOORA approach (eighth problem).
The First ObjectiveThe Second ObjectiveThe Third ObjectiveFinal Rank
A16366
A254–655
A31221
A424–613
A534–644
A64132
Table A15. The rankings of the alternatives using the separate objectives of the neutrosophic MULTIMOORA approach (ninth problem).
The First ObjectiveThe Second ObjectiveThe Third Objective
S ( Q i ) Rank max | D ( r i w i ( x n * ) i j ) | Rank U j Rank
A10.589560.972260.20936
A20.677350.970941.16815
A30.713110.96961–23.35301
A40.689440.96961–21.99593
A50.690930.971251.62084
A60.698620.970332.34572
Table A16. The final rankings of the alternatives using the dominance theory of the neutrosophic MULTIMOORA approach (ninth problem).
The First ObjectiveThe Second ObjectiveThe Third ObjectiveFinal Rank
A16666
A25455
A311–211
A441–233
A53544
A62322
Table A17. The rankings of the alternatives using the separate objectives of the neutrosophic MULTIMOORA approach (10th problem).
The First ObjectiveThe Second ObjectiveThe Third Objective
S ( Q i ) Rank max | D ( r i w i ( x n * ) i j ) | Rank U j Rank
A10.709630.972051.49725
A20.520860.973560.06186
A30.624550.968813.99492
A40.745020.969734.26201
A50.747610.970243.49813
A60.710440.969422.09694
Table A18. The final rankings of the alternatives using the dominance theory of the neutrosophic MULTIMOORA approach (10th problem).
The First ObjectiveThe Second ObjectiveThe Third ObjectiveFinal Rank
A13555
A26666
A35122
A42311
A51433
A64244
Table A19. The rankings of the alternatives using the separate objectives of the neutrosophic MULTIMOORA approach (11th problem).
The First ObjectiveThe Second ObjectiveThe Third Objective
S ( Q i ) Rank max | D ( r i w i ( x n * ) i j ) | Rank U j Rank
A10.619060.971250.30046
A20.678640.970840.80665
A30.713710.969512.81921
A40.690930.971461.21753
A50.698320.970421.43302
A60.675250.970630.84084
Table A20. The final rankings of the alternatives using the dominance theory of the neutrosophic MULTIMOORA approach (11th problem).
The Neutrosophic Ratio SystemThe Neutrosophic Reference PointThe Neutrosophic Full Multiplicative FormFinal Rank
A16566
A25455
A31111
A43633
A52222
A64344
Table A21. The rankings of the alternatives using the separate objectives of the neutrosophic MULTIMOORA approach (12th problem).
The First ObjectiveThe Second ObjectiveThe Third Objective
S ( Q i ) Rank max | D ( r i w i ( x n * ) i j ) | Rank U j Rank
A10.619060.971250.30046
A20.678640.970840.80665
A30.713710.969512.81921
A40.690930.971461.21753
A50.698320.970421.43302
A60.675250.970630.84084
Table A22. The final rankings of the alternatives using the dominance theory of the neutrosophic MULTIMOORA approach (12th problem).
The First ObjectiveThe Second ObjectiveThe Third ObjectiveFinal Rank
A16566
A24455
A31111
A43633
A52222
A65344

References

  1. Agarwal, A.K.; Gupta, T.A.; Kothari, A. Particulate emissions from biodiesel vs diesel fuelled compression ignition engine. Renew. Sustain. Energy Rev. 2011, 15, 3278–3300. [Google Scholar] [CrossRef]
  2. Reducing CO2 Emissions from New Passenger Cars. Available online: https://eur-lex.europa.eu/legal-content/LT/TXT/HTML/?uri=LEGISSUM:mi0046&from=LT (accessed on 24 November 2018).
  3. Regulation (EC) No 443/2009 of the European Parliament and of the Council. Available online: https://eur-lex.europa.eu/legal-content/EN/TXT/HTML/?uri=CELEX:32009R0443&from=LT (accessed on 24 November 2018).
  4. Reduction of Pollution of Motor Passenger Vehicles. Available online: https://eur-lex.europa.eu/legal-content/LT/TXT/HTML/?uri=LEGISSUM:l28186&from=LT (accessed on 24 November 2018).
  5. Smart Specialization. Available online: http://mita.lrv.lt/lt/veiklos-sritys/inovaciju-ekosistema/sumani-specializacija (accessed on 24 November 2018).
  6. WhitePaper Roadmap to a Single European Transport Area—Towards a Competitive and Resource Efficient Transport System. Available online: https://eur-lex.europa.eu/legal-content/EN/TXT/HTML/?uri=CELEX:52011DC0144&from=EN (accessed on 26 November 2018).
  7. Gutarevych, Y.; Shuba, Y.; Matijošius, J.; Karev, S.; Sokolovskij, E.; Rimkus, A. Intensification of the combustion process in a gasoline engine by adding a hydrogen-containing gas. Int. J. Hydrogen Energy 2018, 43, 16334–16343. [Google Scholar] [CrossRef]
  8. Koyun, T. Exergy Analysis of Different Blends of Hydrogen and Octane for Combustion Conditions of Internal Combustion Engine. J. Nanoelectron. Optoelectron. 2018, 13, 1656–1668. [Google Scholar] [CrossRef]
  9. Rimkus, A.; Matijošius, J.; Bogdevičius, M.; Bereczky, A.; Torok, A. An investigation of the efficiency of using O2 and H2 (hydrooxile gas -HHO) gas additives in a ci engine operating on diesel fuel and biodiesel. Energy 2018, 152, 640–651. [Google Scholar] [CrossRef]
  10. Di Blasio, G.; Belgiorno, G.; Beatrice, C. Effects on performances, emissions and particle size distributions of a dual fuel (methane-diesel) light-duty engine varying the compression ratio. Appl. Energy 2017, 204, 726–740. [Google Scholar] [CrossRef]
  11. Belgiorno, G.; Dimitrakopoulos, N.; Di Blasio, G.; Beatrice, C.; Tunestål, P.; Tunér, M. Effect of the engine calibration parameters on gasoline partially premixed combustion performance and emissions compared to conventional diesel combustion in a light-duty Euro 6 engine. Appl. Energy 2018, 228, 2221–2234. [Google Scholar] [CrossRef]
  12. Benajes, J.; García, A.; Monsalve-Serrano, J.; Balloul, I.; Pradel, G. An assessment of the dual-mode reactivity controlled compression ignition/conventional diesel combustion capabilities in a EURO VI medium-duty diesel engine fueled with an intermediate ethanol-gasoline blend and biodiesel. Energy Convers. Manag. 2016, 123, 381–391. [Google Scholar] [CrossRef]
  13. Manente, V.; Johansson, B.; Tunestal, P. Partially Premixed Combustion at High Load using Gasoline and Ethanol, a Comparison with Diesel. SAE Int. 2009. [Google Scholar] [CrossRef]
  14. Agarwal, A.K.; Gupta, J.G.; Dhar, A. Potential and challenges for large-scale application of biodiesel in automotive sector. Prog. Energy Combust. Sci. 2017, 61, 113–149. [Google Scholar] [CrossRef]
  15. Szabados, G.; Bereczky, A. Experimental investigation of physicochemical properties of diesel, biodiesel and TBK-biodiesel fuels and combustion and emission analysis in CI internal combustion engine. Renew. Energy 2018, 121, 568–578. [Google Scholar] [CrossRef]
  16. Aghbashlo, M.; Tabatabaei, M.; Mohammadi, P.; Pourvosoughi, N.; Nikbakht, A.M.; Goli, S.A.H. Improving exergetic and sustainability parameters of a DI diesel engine using polymer waste dissolved in biodiesel as a novel diesel additive. Energy Convers. Manag. 2015, 105, 328–337. [Google Scholar] [CrossRef]
  17. Aghbashlo, M.; Tabatabaei, M.; Khalife, E.; Roodbar Shojaei, T.; Dadak, A. Exergoeconomic analysis of a DI diesel engine fueled with diesel/biodiesel (B5) emulsions containing aqueous nano cerium oxide. Energy 2018, 149, 967–978. [Google Scholar] [CrossRef]
  18. Bandowe, B.A.M.; Meusel, H. Nitrated polycyclic aromatic hydrocarbons (nitro-PAHs) in the environment—A review. Sci. Total Environ. 2017, 581–582, 237–257. [Google Scholar] [CrossRef]
  19. Ambekar, A.; Bhangale, R.; Chatterjee, R.; Kulkarni, C.; Kumar, S.; Chowdhury, A. Glow-plug-assisted combustion of nitromethane sprays in a constant volume chamber. Appl. Therm. Eng. 2015, 76, 462–474. [Google Scholar] [CrossRef]
  20. Ambekar, A.; Maurya, A.K.; Chowdhury, A. Droplet combustion studies of nitromethane and its blends. Exp. Therm. Fluid Sci. 2018, 93, 431–440. [Google Scholar] [CrossRef]
  21. Senthur Prabu, S.; Asokan, M.A.; Roy, R.; Francis, S.; Sreelekh, M.K. Performance, combustion and emission characteristics of diesel engine fuelled with waste cooking oil bio-diesel/diesel blends with additives. Energy 2017, 122, 638–648. [Google Scholar] [CrossRef]
  22. Beneda, K.; Andoga, R.; Főző, L. Linear Mathematical Model for State-Space Representation of Small Scale Turbojet Engine with Variable Exhaust Nozzle. Period. Polytech. Transp. Eng. 2019, 47, 1–10. [Google Scholar] [CrossRef]
  23. Collings, N.; Glover, K.; Campbell, B.; Fisher, S. Internal combustion engine exhaust gas analysis. Int. J. Engine 2017, 18, 308–332. [Google Scholar] [CrossRef]
  24. Asokan, M.A.; Senthur Prabu, S.; Kamesh, S.; Khan, W. Performance, combustion and emission characteristics of diesel engine fuelled with papaya and watermelon seed oil bio-diesel/diesel blends. Energy 2018, 145, 238–245. [Google Scholar] [CrossRef]
  25. Aboelazayem, O.; El-Gendy, N.S.; Abdel-Rehim, A.A.; Ashour, F.; Sadek, M.A. Biodiesel production from castor oil in Egypt: Process optimisation, kinetic study, diesel engine performance and exhaust emissions analysis. Energy 2018, 157, 843–852. [Google Scholar] [CrossRef]
  26. Janu, P.; Doan, S.V. Multifunctional Signal Generator for Calibration System of Jet Engine Exhaust Gas Temperature Measurement. Period. Polytech. Transp. Eng. 2019, 47, 25–28. [Google Scholar] [CrossRef]
  27. Sekimoto, K.; Inomata, S.; Tanimoto, H.; Fushimi, A.; Fujitani, Y.; Sato, K.; Yamada, H. Characterization of nitromethane emission from automotive exhaust. Atmos. Environ. 2013, 81, 523–531. [Google Scholar] [CrossRef]
  28. Yamada, H.; Misawa, K.; Suzuki, D.; Tanaka, K.; Matsumoto, J.; Fujii, M.; Tanaka, K. Detailed analysis of diesel vehicle exhaust emissions: Nitrogen oxides, hydrocarbons and particulate size distributions. Proc. Combust. Inst. 2011, 33, 2895–2902. [Google Scholar] [CrossRef]
  29. Bayındır, H.; Işık, M.Z.; Argunhan, Z.; Yücel, H.L.; Aydın, H. Combustion, performance and emissions of a diesel power generator fueled with biodiesel-kerosene and biodiesel-kerosene-diesel blends. Energy 2017, 123, 241–251. [Google Scholar] [CrossRef]
  30. Jiaqiang, E.; Pham, M.; Deng, Y.W.; Nguyen, T.; Duy, V.; Le, D.; Zuo, W.; Peng, Q.; Zhang, Z. Effects of injection timing and injection pressure on performance and exhaust emissions of a common rail diesel engine fueled by various concentrations of fish-oil biodiesel blends. Energy 2018, 149, 979–989. [Google Scholar] [CrossRef]
  31. Heywood, J.B. Internal Combustion Engine Fundamentals; McGraw-Hill: New York, NY, USA, 1988. [Google Scholar]
  32. Srinidhi, C.; Madhusudhan, A.; Channapattana, S.V. Effect of NiO nanoparticles on performance and emission characteristics at various injection timings using biodiesel-diesel blends. Fuel 2019, 235, 185–193. [Google Scholar] [CrossRef]
  33. How, H.G.; Masjuki, H.H.; Kalam, M.A.; Teoh, Y.H. Influence of injection timing and split injection strategies on performance, emissions, and combustion characteristics of diesel engine fueled with biodiesel blended fuels. Fuel 2018, 213, 106–114. [Google Scholar] [CrossRef]
  34. Wei, M.; Li, S.; Liu, J.; Guo, G.; Sun, Z.; Xiao, H. Effects of injection timing on combustion and emissions in a diesel engine fueled with 2,5-dimethylfuran-diesel blends. Fuel 2017, 192, 208–217. [Google Scholar] [CrossRef]
  35. Bashirnezhad, K.; Mehregan, M.; Kebriyaee Seyed, A. Experimental analysis of the influence of urea injection upon NOx emissions in internal combustion engines fueled with biodiesels. J. Energy Inst. 2016, 89, 115–120. [Google Scholar] [CrossRef]
  36. Chen, X.; Wang, Z.; Pan, S.; Pan, H. Improvement of engine performance and emissions by biomass oil filter in diesel engine. Fuel 2019, 235, 603–609. [Google Scholar] [CrossRef]
  37. Tuccar, G.; Uludamar, E. Emission and engine performance analysis of a diesel engine using hydrogen enriched pomegranate seed oil biodiesel. Int. J. Hydrogen Energy 2018, 43, 18014–18019. [Google Scholar] [CrossRef]
  38. Shim, E.; Park, H.; Bae, C. Intake air strategy for low HC and CO emissions in dual-fuel (CNG-diesel) premixed charge compression ignition engine. Appl. Energy 2018, 225, 1068–1077. [Google Scholar] [CrossRef]
  39. Vigneswaran, R.; Annamalai, K.; Dhinesh, B.; Krishnamoorthy, R. Experimental investigation of unmodified diesel engine performance, combustion and emission with multipurpose additive along with water-in-diesel emulsion fuel. Energy Convers. Manag. 2018, 172, 370–380. [Google Scholar] [CrossRef]
  40. Helmers, E.; Leitão, J.; Tietge, U.; Butler, T. CO2-equivalent emissions from European passenger vehicles in the years 1995–2015 based on real-world use: Assessing the climate benefit of the European “diesel boom”. Atmos. Environ. 2019, 198, 122–132. [Google Scholar] [CrossRef]
  41. Pedrozo, V.B.; May, I.; Guan, W.; Zhao, H. High efficiency ethanol-diesel dual-fuel combustion: A comparison against conventional diesel combustion from low to full engine load. Fuel 2018, 230, 440–451. [Google Scholar] [CrossRef]
  42. Sarkar, A.; Saha, U.K. Role of global fuel-air equivalence ratio and preheating on the behaviour of a biogas driven dual fuel diesel engine. Fuel 2018, 232, 743–754. [Google Scholar] [CrossRef]
  43. Jamrozik, A.; Tutak, W.; Pyrc, M.; Gruca, M.; Kocisko, M. Study on co-combustion of diesel fuel with oxygenated alcohols in a compression ignition dual-fuel engine. Fuel 2018, 221, 329–345. [Google Scholar] [CrossRef]
  44. Yazdani, M.; Chatterjee, P.; Zavadskas, E.K.; Streimikiene, D. A novel integrated decision-making approach for the evaluation and selection of renewable energy technologies. Clean Technol. Environ. Policy 2018, 20, 403–420. [Google Scholar] [CrossRef]
  45. Yazdani-Chamzini, A.; Fouladgar, M.M.; Zavadskas, E.K.; Moini, S.H.H. Selecting the optimal renewable energy using multi criteria decision making. J. Bus. Econ. Manag. 2013, 14, 957–978. [Google Scholar] [CrossRef]
  46. Mardani, A.; Zavadskas, E.K.; Streimikiene, D.; Jusoh, A.; Nor, K.M.D.; Khoshnoudi, M. Using fuzzy multiple criteria decision making approaches for evaluating energy saving technologies and solutions in five star hotels: A new hierarchical framework. Energy 2016, 117, 131–148. [Google Scholar] [CrossRef]
  47. Wu, Y.; Xu, C.; Zhang, T. Evaluation of renewable power sources using a fuzzy MCDM based on cumulative prospect theory: A case in China. Energy 2018, 147, 1227–1239. [Google Scholar] [CrossRef]
  48. Van de Kaa, G.; Kamp, L.; Rezaei, J. Selection of biomass thermochemical conversion technology in the Netherlands: A best worst method approach. J. Clean. Prod. 2017, 166, 32–39. [Google Scholar] [CrossRef]
  49. Ignatius, J.; Rahman, A.; Yazdani, M.; Šaparauskas, J.; Haron, S.H. An integrated fuzzy ANP–QFD approach for green building assessment. J. Civ. Eng. Manag. 2016, 22, 551–563. [Google Scholar] [CrossRef]
  50. Čereška, A.; Zavadskas, E.K.; Cavallaro, F.; Podvezko, V.; Tetsman, I.; Grinbergiene, I. Sustainable Assessment of Aerosol Pollution Decrease Applying Multiple Attribute Decision Making Methods. Sustainability 2016, 8, 586. [Google Scholar] [CrossRef]
  51. Fattahi, R.; Khalilzadeh, M. Risk evaluation using a novel hybrid method based on FMEA, extended MULTIMOORA, and AHP methods under fuzzy environment. Saf. Sci. 2018, 102, 290–300. [Google Scholar] [CrossRef]
  52. Turan, H. Assessment Factors Affecting E-Learning Using Fuzzy Analytic Hierarchy Process and SWARA. Int. J. Eng. Educ. 2018, 34, 915–923. [Google Scholar]
  53. Zavadskas, E.K.; Stevic, Z.; Tanackov, I.; Prentkovskis, O. A Novel Multicriteria Approach—Rough Step-Wise Weight Assessment Ratio Analysis Method (R-SWARA) and Its Application in Logistics. Stud. Inform. Control 2018, 27, 97–106. [Google Scholar] [CrossRef]
  54. Zarbakhshnia, N.; Soleimani, H.; Ghaderi, H. Sustainable third-party reverse logistics provider evaluation and selection using fuzzy SWARA and developed fuzzy COPRAS in the presence of risk criteria. Appl. Soft Comput. 2018, 65, 307–319. [Google Scholar] [CrossRef]
  55. Karabasevic, D.; Zavadskas, E.K.; Turskis, Z.; Stanujkic, D. The Framework for the Selection of Personnel Based on the SWARA and ARAS Methods Under Uncertainties. Informatica 2016, 27, 49–65. [Google Scholar] [CrossRef]
  56. Mavi, R.K.; Goh, M.; Zarbakhshnia, N. Sustainable third-party reverse logistic provider selection with fuzzy SWARA and fuzzy MOORA in plastic industry. Int. J. Adv. Manuf. Technol. 2017, 91, 2401–2418. [Google Scholar] [CrossRef]
  57. Karabasevic, D.; Paunkovic, J.; Stanujkic, D. Ranking of companies according to the indicators of corporate social responsibility based on SWARA and ARAS methods. Serb. J. Manag. 2015, 11, 43–53. [Google Scholar] [CrossRef]
  58. Hashemkhani Zolfani, S.; Bahrami, M. Investment prioritizing in high tech industries based on SWARA-COPRAS approach. Technol. Econ. Dev. Econ. 2014, 20, 534–553. [Google Scholar] [CrossRef]
  59. Awasthi, A.; Baležentis, T. A hybrid approach based on BOCR and fuzzy multimoora for logistics service provider selection. Int. J. Logist. Syst. Manag. 2017, 27, 261–282. [Google Scholar] [CrossRef]
  60. Hafezalkotob, A.; Hafezalkotob, A. Comprehensive MULTIMOORA method with target-based attributes and integrated significant coefficients for materials selection in biomedical applications. Mater. Des. 2015, 87, 949–959. [Google Scholar] [CrossRef]
  61. Brauers, W.K.M.; Zavadskas, E.K. Multimoora Optimization Used to Decide on a Bank Loan to Buy Property. Technol. Econ. Dev. Econ. 2011, 17, 174–188. [Google Scholar] [CrossRef]
  62. Zavadskas, E.K.; Bausys, R.; Juodagalviene, B.; Garnyte-Sapranaviciene, I. Model for residential house element and material selection by neutrosophic multimoora method. Eng. Appl. Artif. Intell. 2017, 64, 315–324. [Google Scholar] [CrossRef]
  63. Eghbali-Zarch, M.; Tavakkoli-Moghaddam, R.; Esfahanian, F.; Sepehri, M.M.; Azaron, A. Pharmacological therapy selection of type 2 diabetes based on the SWARA and modified multimoora methods under a fuzzy environment. Artif. Intell. Med. 2018, 87, 20–33. [Google Scholar] [CrossRef]
  64. Hafezalkotob, A.; Hafezalkotob, A.; Liao, H.; Herrera, F. An overview of multimoora for multi-criteria decision-making: Theory, developments, applications, and challenges. Inf. Fusion 2019, 51, 145–177. [Google Scholar] [CrossRef]
  65. Wei, M.; Li, S.; Xiao, H.; Guo, G. Combustion performance and pollutant emissions analysis using diesel/gasoline/iso-butanol blends in a diesel engine. Energy Convers. Manag. 2017, 149, 381–391. [Google Scholar] [CrossRef]
  66. Ashok, B.; Nanthagopal, K.; Saravanan, B.; Azad, K.; Patel, D.; Sudarshan, B.; Ramasamy, R.A. Study on isobutanol and Calophyllum inophyllum biodiesel as a partial replacement in CI engine applications. Fuel 2019, 235, 984–994. [Google Scholar] [CrossRef]
  67. Atmanli, A.; Yilmaz, N. A comparative analysis of n-butanol/diesel and 1-pentanol/diesel blends in a compression ignition engine. Fuel 2018, 234, 161–169. [Google Scholar] [CrossRef]
  68. Manigandan, S.; Gunasekar, P.; Devipriya, J.; Nithya, S. Emission and injection characteristics of corn biodiesel blends in diesel engine. Fuel 2019, 235, 723–735. [Google Scholar] [CrossRef]
  69. Guedes, A.D.M.; Braga, S.L.; Pradelle, F. Performance and combustion characteristics of a compression ignition engine running on diesel-biodiesel-ethanol (DBE) blends—Part 2: Optimization of injection timing. Fuel 2018, 225, 174–183. [Google Scholar] [CrossRef]
  70. Benajes, J.; Novella, R.; Pastor, J.M.; Hernandez-Lopez, A.; Kokjohn, S.L. Computational optimization of the combustion system of a heavy duty direct injection diesel engine operating with dimethyl-ether. Fuel 2018, 218, 127–139. [Google Scholar] [CrossRef]
  71. Tauzia, X.; Maiboom, A.; Karaky, H. Semi-physical models to assess the influence of CI engine calibration parameters on NOx and soot emissions. Appl. Energy 2017, 208, 1505–1518. [Google Scholar] [CrossRef]
  72. Belgiorno, G.; Di Blasio, G.; Beatrice, C. Parametric study and optimization of the main engine calibration parameters and compression ratio of a methane-diesel dual fuel engine. Fuel 2018, 222, 821–840. [Google Scholar] [CrossRef]
  73. Celebi, Y.; Aydin, H. An overview on the light alcohol fuels in diesel engines. Fuel 2019, 236, 890–911. [Google Scholar] [CrossRef]
  74. Lebedevas, S.; Pukalskas, S.; Žaglinskis, J.; Matijošius, J. Comparative investigations into energetic and ecological parameters of camelina-based biofuel used in the 1Z diesel engine. Transport 2012, 27, 171–177. [Google Scholar] [CrossRef]
  75. Álvarez-García, J.; del Río-Rama, M.; de la, C.; Saraiva, M.; Pires, A.R. The influence of motivations and barriers in the benefits. An empirical study of EMAS certified business in Spain. J. Clean. Prod. 2018, 185, 62–74. [Google Scholar] [CrossRef]
  76. Kersuliene, V.; Zavadskas, E.K.; Turskis, Z. Selection of rational dispute resolution method by applying new step-wise weight assessment ratio analysis (SWARA). J. Bus. Econ. Manag. 2010, 11, 243–258. [Google Scholar] [CrossRef]
  77. Nakhaei, J.; Bitarafan, M.; Lale Arefi, S.; Kaplinski, O. Model for Rapid Assessment of Vulnerability of Office Buildings to Blast Using SWARA and Smart Methods (A Case Study of Swiss re Tower). J. Civ. Eng. Manag. 2016, 22, 831–843. [Google Scholar] [CrossRef]
  78. Karabasevic, D.; Stanujkic, D.; Urosevic, S.; Maksimovic, M. Selection of candidates in the mining industry based on the application of the SWARA and the MULTIMOORA methods. Acta Montan. Slovaca 2015, 20, 116–124. [Google Scholar]
  79. Brauers, W.K.M.; Zavadskas, E.K. Project Management by Multimoora as an Instrument for Transition Economies. Technol. Econ. Dev. Econ. 2010, 16, 5–24. [Google Scholar] [CrossRef]
  80. Balezentis, T.; Balezentis, A. A survey on Development and Applications of the Multi-criteria Decision Making Method multimoora. J. Multi-Criteria Decis. Anal. 2014, 21, 209–222. [Google Scholar] [CrossRef]
  81. Chwist, M.; Szwaja, S.; Grab-Rogaliński, K.; Pyrc, M. Bio-oil blended butanol as a fuel to the spark ignition internal combustion reciprocating engine. Combust. Engines 2017, 169, 93–96. [Google Scholar] [CrossRef]
Figure 1. The scheme of engine testing equipment: 1—compression ignition engine; 2—shaft; 3—engine load stand; 4—engine brake torque and speed recording equipment; 5—fuel tank; 6—fuel scales; 7—high-pressure fuel pump; 8—start of fuel injection control equipment; 9—crankshaft position sensor; 10—start of fuel injection sensor; 11—start of fuel injection recording equipment; 12—air mass meter; 13—intake air temperature meter; 14—turbocharger; 15—turbocharger pressure meter; 16—air cooler; 17—intake gas temperature meter; 18—exhaust gas recirculation (EGR) valve; 19—exhaust gas temperature meter; 20—exhaust gas concentrations analyzer; 21—smokiness meter.
Energies 12 01415 g001
Figure 2. Engine torque of 30 Nm.
Energies 12 01415 g002
Figure 3. Engine torque of 60 Nm.
Energies 12 01415 g003
Figure 4. Engine torque of 90 Nm.
Energies 12 01415 g004
Table 1. Internal combustion engine working parameters with minimizing and maximizing criteria.
CriteriaMin/MaxParametersTitles
x1MinCO, %Carbon monoxide
x2MaxCO2, %Carbon dioxide
x3MaxO2, %Oxygen
x4MinHC, ppmHydrocarbons
x5MinNOx, ppmNitrogen oxides
x6MinSmok., %Smokiness
x7MinBSFC, g/(kWh)ηBrake-specific fuel consumption
x8MaxηeEffective energy efficiency coefficient
Table 2. The main parameters of the diesel engine. TDI—turbocharged direct injection.
Engine1.9 TDI 1Z
Engine typeCompression ignition engine
Air supplyTurbocharger
Preparation of the combustible mixtureInternal, with direct fuel injection
Displacement volume, cm31896
Number of cylinders4
Compression ratio19.5
Bore, mm79.5
Stroke, mm95.5
Power, kW66 (at 4000 rpm)
Torque, Nm180 (at 2000–2500 rpm)
Type of gas distribution mechanismSingle overhead cam (SOHC)
Engine coolingFluid
Table 3. Measurement range and accuracy of the AVL DiCom 4000 gas and AVL DiSmoke 4000 analyzers.
ParametersMeasurements UnitsMeasuring RangeMeasurement Error
AVL DiCom 4000
Nitrogen oxide (NOx) concentrationppm (vol.)0–5000±1
Hydrocarbon (HC) concentrationppm (vol.)0–2000±1
Carbon monoxide (CO) concentration% (vol.)0–10±0.01
Carbon dioxide (CO2) concentration% (vol.)0–20±0.1
Oxygen (O2) concentration% (vol.)0–25±0.01
AVL DiSmoke 4000
Smokiness%0–100±0.1
Engine rotation frequency (n)rpm250–9990±10
Engine lubricant temperature°C0–150±1
Table 4. Summary of the internal combustion engine working parameters. TDC—top dead center.
Item No.Start of Fuel Injection before TDC, °CAEngine Torques MB, NmFuelsCriteria
x1x2x3x4x5x6x7x8
1030D1000.023.315.9171236.7329.450.257
2B1000.033.415.671264.1389.960.250
3B94NM5C10.033.515.8121922.2403.700.248
4B91.6NM7C1.40.033.515.5112311.8400.870.253
5B88NM10C20.033.515.5102482.3427.800.243
6B82NM15C30.033.515.8102992.5415.400.260
760D1000.025.113.51323511.5272.980.310
8B1000.025.213.2112447.5322.050.302
9B94NM5C10.025.113.883673.2322.050.311
10B91.6NM7C1.40.015.213.493902.4325.710.312
11B88NM10C20.025.113.693982.8322.050.322
12B82NM15C30.025.113.684482.5329.450.327
1390D1000.026.711.21229422.1254.780.332
14B1000.026.811.2134308.5293.970.331
15B94NM5C10.016.711.6105423.2276.930.361
16B91.6NM7C1.40.016.711.395752.5298.570.340
17B88NM10C20.016.611.5125922.7303.310.342
18B82NM15C30.016.711.596492.5303.310.356
19430D1000.023.315.9161507.8327.570.259
20B1000.023.415.771594.4384.730.253
21B94NM5C10.023.416.092172.5377.140.265
22B91.6NM7C1.40.023.515.6102601.5389.960.260
23B88NM10C20.023.415.892602.2400.870.259
24B82NM15C30.023.415.893092.2403.700.267
2560D1000.024.913.71328013.0262.960.322
26B1000.025.213.3103137.9301.710.322
27B94NM5C10.015.113.894453.1301.710.332
28B91.6NM7C1.40.015.213.784322.1314.970.322
29B88NM10C20.015.013.794692.6308.200.337
30B82NM15C30.015.113.685282.5322.050.335
3190D1000.026.511.41048020.0248.160.341
32B1000.016.811.3115527.6276.930.351
33B94NM5C10.016.611.797252.7276.930.361
34B91.6NM7C1.40.016.711.497382.2272.980.372
35B88NM10C20.016.511.6107432.5293.970.353
36B82NM15C30.016.611.588052.3303.310.356
37830D1000.023.316.0162156.5322.050.263
38B1000.023.415.762224.4362.820.268
39B94NM5C10.023.416.282712.2367.470.272
40B91.6NM7C1.40.013.415.793401.5374.670.271
41B88NM10C20.023.415.783272.1398.090.261
42B82NM15C30.023.415.883712.2398.090.271
4360D1000.014.913.7144909.6253.650.334
44B1000.015.013.5114257.7292.470.333
45B94NM5C10.015.113.785682.9295.490.339
46B91.6NM7C1.40.015.113.486332.1304.920.333
47B88NM10C20.015.013.896242.6311.550.333
48B82NM15C30.015.013.796842.2314.970.343
4990D1000.016.511.51066216.0241.880.350
50B1000.016.811.3138223.1269.130.362
51B94NM5C10.016.511.879442.6269.130.372
52B91.6NM7C1.40.016.711.4119552.1272.980.372
53B88NM10C20.016.611.61010192.5289.520.359
54B82NM15C30.016.611.6810292.3293.970.367
551230D1000.013.316.0133034.5327.570.259
56B1000.023.515.7213614.7392.640.248
57B94NM5C10.023.516.123892.1360.530.278
58B91.6NM7C1.40.013.415.7104821.4372.240.273
59B88NM10C20.013.415.794322.0384.730.270
60B82NM15C30.013.515.886852.0392.640.275
6160D1000.015.013.6146106.7255.910.331
62B1000.015.213.4146415.4286.620.339
63B94NM5C10.015.113.887702.3286.620.349
64B91.6NM7C1.40.015.113.499192.0301.710.337
65B88NM10C20.015.013.898432.2298.570.348
66B82NM15C30.015.113.6811862.2311.550.346
6790D1000.016.511.41094210.8230.220.368
68B1000.016.811.21212853.2261.760.372
69B94NM5C10.016.611.8811802.3261.760.382
70B91.6NM7C1.40.016.711.31013902.4276.930.367
71B88NM10C20.016.511.71013302.6276.930.375
72B82NM15C30.016.711.61017292.7289.520.373
Table 5. Evaluation of the relative importance by criteria pairs.
ExpertsPairwise Evaluation of Criteria Relative Importance
x 1 2 x 2 3 x 3 4 x 4 5 x 5 6 x 6 7 x 7 8
10.170.400.030.210.170.180.40
20.110.150.000.070.030.130.36
30.150.120.330.400.030.670.03
40.130.180.110.200.130.120.73
50.130.130.930.070.070.130.27
60.160.110.500.050.130.090.50
70.110.190.470.090.070.160.17
80.140.170.080.160.170.120.19
90.190.100.110.190.190.220.20
100.120.440.060.120.270.110.33
110.110.270.100.100.300.090.27
120.130.670.040.130.270.100.18
Table 6. Criteria weighting by step-wise weight assessment ratio analysis (SWARA) method.
CriteriaAverage Values of Comparative Importance Criteria, s j j + 1 Coefficients of Comparative Importance Criteria, k j Recalculated (Intermediate) Criteria Weights, q j Final Criteria Weights, w j
x1110.2108
x20.13751.13750.87910.1853
x30.24421.24420.70660.1489
x40.231.230.57440.1211
x50.14921.14920.49990.1054
x60.15251.15250.43370.0914
x70.17831.17830.3680.0776
x80.30251.30250.28260.0596
4.7443
Table 7. The rankings of the alternatives using the separate objectives of the neutrosophic multi-objective optimization by a ratio analysis plus the full multiplicative form (MULTIMOORA) approach (first problem).
The First ObjectiveThe Second ObjectiveThe Third Objective
S ( Q i ) Rank max | D ( r i w i ( x n * ) i j ) | Rank U j Rank
A10.658960.969720.08364
A20.694720.971040.14482
A30.679730.971450.09233
A40.710010.970531.29141
A50.665940.972160.06575
A60.649950.969210.05566
Table 8. The final rankings of the alternatives by the dominance theory of the neutrosophic MULTIMOORA approach (first problem).
The First ObjectiveThe Second ObjectiveThe Third ObjectiveFinal Rank
A16244
A22422
A33533
A41311
A54656
A65165
Table 9. Summary of the engine performance of the vehicle. WASPAS—weighted aggregated sum product assessment.
Item. No.Start of Fuel Injection before TDC, °CAEngine Torque MB, NmFuelsPlaces
Neutrosophic MULTIMOORAWASPAS
1030D10066
2B10022
3B94NM5C133
4B91.6NM7C1.411
5B88NM10C244
6B82NM15C355
760D10066
8B10055
9B94NM5C132
10B91.6NM7C1.411
11B88NM10C243
12B82NM15C324
1390D10066
14B10055
15B94NM5C111
16B91.6NM7C1.422
17B88NM10C244
18B82NM15C333
19430D10066
20B10032
21B94NM5C121
22B91.6NM7C1.414
23B88NM10C243
24B82NM15C355
2560D10066
26B10055
27B94NM5C13–42
28B91.6NM7C1.411
29B88NM10C223
30B82NM15C33–44
3190D10066
32B10055
33B94NM5C121
34B91.6NM7C1.413
35B88NM10C244
36B82NM15C332
37830D10066
38B10033
39B94NM5C122
40B91.6NM7C1.411
41B88NM10C244
42B82NM15C355
4360D10066
44B10055
45B94NM5C111
46B91.6NM7C1.434
47B88NM10C243
48B82NM15C322
4990D10066
50B10055
51B94NM5C111
52B91.6NM7C1.434
53B88NM10C243
54B82NM15C322
551230D10053
56B10066
57B94NM5C115
58B91.6NM7C1.422
59B88NM10C231
60B82NM15C344
6160D10066
62B10055
63B94NM5C111
64B91.6NM7C1.433
65B88NM10C222
66B82NM15C344
6790D10066
68B10055
69B94NM5C111
70B91.6NM7C1.433
71B88NM10C222
72B82NM15C344

