Article

Innovative Policies for Energy Efficiency and the Use of Renewables in Households

by
Wadim Strielkowski
1,*,
Elena Volkova
2,
Luidmila Pushkareva
3 and
Dalia Streimikiene
4,*
1
Centre for Energy Studies, Prague Business School, Prague, Werichova 1145/29, 152 00 Praha 5 Prague, Czech Republic
2
Department of Business Informatics and Mathematics, Tyumen Industrial University, Volodarsky str. 38, 625000 Tyumen, Russia
3
Department of State and Municipal Management, North-West Institute of Management of the Russian Presidential Academy of National Economy and Public Administration, 57/43, Middle Avenue Vasilievsky Island, 199178 St. Petersburg, Russia
4
Lithuanian Energy Institute, Breslaujos 3, Kaunas LT-44403, Lithuania
*
Authors to whom correspondence should be addressed.
Energies 2019, 12(7), 1392; https://doi.org/10.3390/en12071392
Submission received: 27 March 2019 / Revised: 3 April 2019 / Accepted: 9 April 2019 / Published: 11 April 2019

Abstract

:
Renewable energy sources (RES) are gradually becoming one of the key elements in the process of achieving energy efficiency worldwide. This trend can be observed in many developed Western economies—for example, in the United States, as well as in the United Kingdom. Hence, the role of innovative policies for promoting energy efficiency is becoming crucial in transition to the post-carbon economy. The shift to the carbon-free future make all actors to face forgoing commitments Nevertheless, customers and residential households are the first and the most important players in the pursuit of the energy-efficient future. Without them, carbon-free economy based on RES would never take the shape as envisaged. Our paper focuses on the innovative strategies and policies studying the effect and the scope of RES penetration into the households. We employ and empirical analysis of the effects from using RES in households using an example of the residential households in the northwest region of the United Kingdom (UK) with and without solar photovoltaic (PV) panels and electric vehicles (EV). We analyse the four scenarios that are aimed at analysing the system dynamics and providing differentiation between systems in terms of the varying values of the gross demand, tariffs, metered import, and the total revenue. Our results demonstrate that the solar PV leads to the transfer of costs and wealth regardless of the ownership of PV and EVs. Solar energy generation reduces the share of UK solar PV households per kWh costs of the distribution system which causes the augmenting of the per unit charges as well as to the changes in payments for the electricity that impoverishes less wealthy customer groups. It also becomes clear that with the increase of EV penetration, the existing energy efficiency schemes would have to be revised.

1. Introduction

In today’s globalized and industrialized world, energy efficiency appears to only be achievable though the gradual but steady transition to a low-carbon economy. Many governments across the globe have set up strict targets for tackling climate change, decreasing the use of carbon fuels, reducing the emissions of carbon dioxide (CO2) and other greenhouse gases, as well as increasing the share of renewable energy in total energy generation [1].
With the goals for achieving decarbonizing of transport and heating within the next few decades, the electricity industry will remain the main creditor paying for the decarbonization of the economy [2]. This would create a need for the wide supply of RES that would be able to replace the rapidly shrinking sector of hydro energy and overcome the opposition to the atomic energy among various citizen groups [3]. Most people understand RES as the energy obtained from the solar, wind, biomass, geothermal and hydro sources originating from nature.
Reshaping the world economies for the higher deployment of RES would also require approval from the ordinary citizens (who also represent voters in any given democracy and thence can, albeit indirectly, influence many economic and political decisions related to energy policy). In a way, these citizens have their own responsibility for the energy-efficient future.
Luckily, the increased usage of the renewable energy is caused mainly by the popularity of the solar and wind energy which is strengthened by the technological progress (e.g., interconnection, better exploitation of the existing hydro storage, improving the existing battery technologies, and applying smart meters for monitoring and altering consumer behaviour) [4].
Solar PVs now constitute a significant source of supplying basic electricity demands in many underdeveloped areas of the world. In 2017, approximately 73 million households in these regions profited from off-grid solar alternatives [5,6].
However, in order to achieve sustainable potential, generated and consumed energy must encourage human growth in all its social, environmental, and economic dimensions. Issues associated with environment and energy shortages have set all groups to the job of actively encouraging instruction in energy conservation [7]. Therefore, many governments worldwide started to identify their obligation for diminishing the adverse impact of high energy use to the environment [8].
This paper is set up as follows: Section 2 provides a literature review covering the innovative measures and policies focused on enhancing energy efficiency. Section 3 describes the role of economic growth in the carbon-free economy. Section 4 outlines the methodology and describes our empirical model derived from the household profiles obtained from the Customer-Led Network Revolution (CLNR) survey conducted with households in the Northern England and EV estimated charges. Section 5 provides an empirical model of the energy efficiency that employs case study of households in United Kingdom (UK) captured in four cases with and without solar photovoltaic (PV) panels and electric vehicles (EV). Finally, Section 6 concludes with presenting results and drawing some policy implications.

2. Innovative Policies for Promoting Energy Efficiency

One would probably agree that in their essence, all energy efficiency measures promise to reduce energy consumption and save money on electricity bills, as well as reduce the negative environmental impact of electricity generation [9,10,11].
It becomes apparent that the state as well as local governmental policies may encourage the development of more energy-efficient buildings and products, as well as encourage consumers, companies and industrial customers to take advantage of low-cost, energy-efficient measures and to invest in future energy-efficient improvements and technological solutions [12].
However, improvements in energy efficiency can be reached by simultaneously increasing the implementation of novel energy services and by increasing of the overall energy consumption. The energy services and the precise metering are at times limited and thence decreased the desired efficiency. For example, consumers often have inaccurate or incomplete information about energy consumption, prices or net savings from energy-efficient investments [13].
Reducing energy consumption will reduce costs and can lead to financial savings for consumers if energy savings offset the additional costs associated with implementing energy–efficient technologies.
In many countries, energy efficiency is also recognized as a national security benefit, as it can be used to reduce energy imports from abroad and can slow down the energy consumption rate at which domestic energy is depleted.
A good example is the U.S. state of California. As part of its energy efficiency strategy, California has put in place a “order to load” new energy resources, putting energy efficiency first, renewable energy supplies second, and new fossil-fuelled power stations are in the process of being restructured and dismissed which is similar to the development in the other parts of the world [14,15,16].
In addition to the rebates that can be offered through public or public programmes, governments sometimes offer tax incentives for energy-efficient projects [17]. Moreover, it has been long observed that product, industrial, transport and construction laws all contribute to the overall framework for energy efficiency. Provincial and territorial governments will work to support and expand efforts to improve existing buildings by supporting energy efficiency improvements and speeding up the adoption of energy-efficient equipment, while adapting their programmes to regional conditions [18].
Many Asian countries have also given priority to energy efficiency and have ambitious targets for energy efficiency. For example, China’s leading energy experts presented how the national target for energy reduction was set for each province and for the country’s leading energy–efficient businesses, and how the government tightened energy efficiency standards for devices, buildings and vehicles [19]. This approach proves to be very efficient, since in China there exists a five-year plan period with additional funding from provincial governments that serves as an incentive to invest in energy efficiency and research and technological development [20].
Another good example is Canada. In 2000, the government started an initiative that was envisaged to help reaching the energy efficiency. The key objective was to make sure Canada would reach a commitment for reducing greenhouse gases from 2010 to 1990 levels (a 6% decrease) [21].
However, the reduction and subsequent elimination of national energy subsidies caused the energy prices to rise. In the United States, a special law has designated the State Energy Efficiency authority (SEEA) as the main implementation arm of the national energy policy [22]. For example, it makes sure that institutions to establish a sense of ownership in their buildings. In order to do that, the authorities ask the participating energy service companies (ESCOs) to include employee awareness programmes in their daily agenda [23]. In addition to the that, ESCOs also need to provide the evaluations of the renewable energy potential in all its project proposals.
Moreover, there are energy labels on the equipment contain information about the energy savings that can be achieved by introducing more energy-efficient appliances or equipment, or by ensuring that a product is more efficient than the average device on the market. Taxing and labelling can be used as powerful instruments for increasing the behaviour and strategies targeted at enhancing the energy efficiency [24].
In general, one can see that the entrepreneurs all around the world are looking for strong, long-term energy and tax policies to invest with renewed confidence in the future [25]. Energy taxes would undermine the future of any country, which would hamper the energy industry’s ability to invest in new energy supplies and conduct the necessary research and development to develop new technologies, giving up foreign companies [26]. Increasing taxes on the energy sector is not only a threat to investments in new energy projects. Millions of households rely upon the financial strength and performance of energy companies to protect their investments [27].
Achieving energy efficiency is essential to reduce energy consumption and costs which can be realised, if applicable, to redirect savings to potentially finance energy programmes and future energy improvements or to finance other district requirements [28]. However, it can also be intended to promote and to provide solutions to perform the services requested by any given country in the most cost-effective and energy-efficient way.
However, very often energy efficiency can be better achieved at the micro (household) level [29]. According to some research, increasing or decreasing thermostats “one degree” can lead to a 6 percent energy saving for energy-efficient installations such as the primary source of energy, and up to 4 percent for fuel- or oil-based installations [30]. Thence, with the increasing rate of global warming and new technologies that are more focused on energy saving, the policy-makers continue to explore and explore all options leading to reaching and maintaining energy efficiency [31,32].
On the other hand, the data show that energy consumption—either in the form of food, fossil fuels and other resources—is essential to promote the health of humans, the environment and the planet and sustainable economic development [33]. Although it is not new to emphasise how efficiently energy and food consumption can solve some of the key problems our world faces, there is not much research and no unifying framework to harmonise the concepts of sustainable system management in a single theoretical body [34].
It is necessary to have an understanding that goes beyond reducing efficiency in order to encourage integrated changes in the use of natural resources around the world to achieve a wiser energy consumption, better agricultural systems and healthier dietary habits [35]. Cooperation as a person or a group of individuals, while raising awareness of energy policies and plans, overall usage and costs, will help to reduce energy consumption and improve the environment, while at the same time reducing energy costs [36].
In addition, one has to remember that other sectors, such as product, industrial, transport and construction ones all contribute to the overall framework for energy efficiency [37]. Governments should work to support and expand efforts to improve existing technologies as well as by supporting energy efficiency improvements and speeding up the adoption of high - efficiency equipment, while adapting their programmes to regional conditions. It is important for them to establish that future development is crucial for long-term availability in increasing amounts of reliable, safe, and environmentally friendly sources.
Therefore, it becomes clear that energy management strategies developed by the governments should be smoothly integrated into their work programmes, and moreover, energy efficiency concepts and improvements in energy management should also be studied and looked upon in an integrated and holistic way.

3. Economic Growth and Carbon-Free Economy

One would probably agree that household emissions are essentially indirect emissions from the electricity consumption acquired by the electrical industry. Since natural gas generates more energy for the same emissions as coal, the increase in natural gas consumption has contributed to the overall decrease in carbon intensity and emissions in the last decade [38]. From 2012 to 2016, the decline and the resulting stability of engine petrol prices, combined with a sustained economic recovery, have led to increased fuel consumption and increased CO2 emissions worldwide [39].
In 2017, indirect carbon emissions recorded electricity consumption in the electricity sector fell by 3.5% [40]. Two primary factors, in particular, have contributed to reducing the carbon intensity of electricity generation (CO2/kWh) since 2005—replacing coal with lower carbon dioxide emissions and more efficient combined natural gas production and increasing non-carbon dioxide emissions [41,42].
Even though nuclear remains the dominant source of non-carbon generation, the rise in wind and solar power since 2008 has led to a decline in carbon intensity [43,44]. CO2 emissions also differ significantly from one sector to another based on factors such as the use of different fuels for electricity production, different climates and different sources of economic performance (both commercial and industrial) [45].
For example, in Vermont, the largest share of emissions in 2016 came from the transport sector (57%), mainly from oil, while the electricity sector accounted for a total of 0%, as Vermont practically did not report the generation of fossil fuels [46]. Vermont’s residential share of 22%, reflected its relatively cold climate, where oil is the primary fuel for heating [47]. In the same time, the State Energy Research and Development Authority in New York has introduced regulations for energy-efficient products and environmentally friendly housing [48].
There are quite a number of factors that influence the per capita emissions, including climate, the structure of the economy, population density, energy sources, building regulations and explicit guidelines for reducing emissions [49]. For utility companies, this understanding can also help them navigate the potentially tough decisions of “greening” their production, reducing the risk of seeing demand and income cannibalized by distributed generation, while giving consumers the choice to buy renewable energy which many expect [50]. Coupled with plenty of slate gas and the displacement of coal through the combination of new fossil fuels, the options for reducing carbon production are becoming the norm and it perceived as such by residential households [51].
Many studies focusing on the role of households in the low-carbon economy were limited by their relatively small sample size, or the absence of a combination with the construction of carbon footprint and socio-economic characteristics of the home, as well as energy-saving consciousness [52,53]. Further research would be helpful: for example, estimating a per capita demand and environmental impact that would take into account relevant domestic characteristics in order to predict the demand for and the environmental impact of a new residential project, thus creating a benchmark for policy-making decisions, especially in the case of carbon reduction.
In general, creating sustainable energy systems for residential use, might become a good way of saving energy and using RES instead of carbons. It becomes apparent that various energy-saving products (such as various novel appliances) are a bridge between government incentives and low-carbon localization practices for residential households [54].
On the other hand, the proposed price of carbon would apply to natural gas and oil used in the neighbourhood, as well as to carbon-intensive electricity and transport-related emissions (e.g., public transport). The uncertainty of tax credits, fuel prices and economic growth will affect the pace at which renewable energy sources (RES) are developing. Companies with sustainable development goals also stimulate renewable energy development by building their own facilities (such as solar roofs and wind farms), obtaining renewable energy through purchasing agreements and obtaining renewable energy certificates (RECs). In general, as far as the greenhouse gas emissions during operation are concerned, all RES can be divided into: (i) zero (wind, solar, and hydro); (ii) low (geothermal); or (iii) neutral (represented by biomass).
With the constantly increasing cost of solar electricity generation technology, there is a strong incentive for the continued growth of the clean energy resources worldwide. Previous scepticism about clean energy and RES subsided because energy projects on a large scale proved that renewable energy could be a fundamental element of the country-wide energy system [55]. However, one thing is the public support, and another thins is political rhetoric and approaches. While President Obama advocated the nation-wide support for renewables, his successor Donald Trump supports its carbon-intensive industry supporters, while at the same time taking into account economic opportunities and the environmental benefits offered by the RES sector. This is happening when the solar energy in U.S. is a growing country’s share of electricity, with more than 50 GW of installed capacity, which in 2017 reached 1.3% of the total electricity supply [56]. However, if RES are fully developed and in place, U.S. would need a coordinated development policy both on the federal and state level that would be targeted at new RES technologies and provide incentives for stimulating renewable energy consumption in all sectors of its energy market: wholesale, retail, thermal, as well as transport. Wind turbines use solar energy to generate clean electricity, but the effects of the production process are affected by the environment.
Solar-powered thermal power stations are well suited to the peak load of summer afternoons in thriving regions with high cooling requirements, such as the Southwestern United States. In addition, there is an important place of biomass which was the fourth largest source of RES in the U.S. after hydro energy, solar, and wind.
Many U.S. consumers begin to comprehend that RES are sustainable, completely unwavering sources of renewable energy, unlike the finite carbon fuels. They also begin to realize that nuclear reactors are the closest to a non-polluting energy source, very much like RES. Renewable energy is the fastest growing U.S. energy source, with 67% growth between 2000 and 2016. Renewable ethanol and biodiesel fuels accounted for more than 22% of the total consumption of renewable energy in the united states in 2016, compared to 12% in 2006. In 2016, renewable energies accounted for almost 15% of electricity generation, with a majority of hydro, wind and biomass [57].
In addition, two-thirds of Americans believe that renewable energy and the decline in dependence on foreign oil in the United States are the country’s top energy priorities [58]. In 2013, U.S. federal government subsidies and support for renewable energies, fossil fuels and nuclear energy were $15, 043 billion $3, 431 billion and $66 billion, respectively [59]. Electricity distributors or wholesale sellers should be motivated to use RES for supplying a certain share of their electricity.
When it comes to the status of the energy consumption in the UK, a country that is in focus of our empirical model outlined in this paper, one needs to realize that UK households are currently enjoying one of the lowest retail electricity prices in the European Union (in fact, they are among the lowest among the “core” EU-15 Member States). Other EU countries that have similar low electricity prices are Finland, France or Luxemburg (the highest retail electricity prices in the European Union can be found in Denmark or Germany). Wholesale gas and electricity costs in UK constitute 47%, transmission, distribution and metering costs are 20%, and other supplier costs and margins are 19% with VAT being 5% [60]. Moreover, the average annual household electricity bill of a British household is about £600 (in real prices and before rebates). Wholesale energy costs were estimated to make up around 37% of an average household electricity bill [61].
Additionally, one can notice that in the UK, the load profile (the time of the day and year that electricity is used) has a strong influence on the price paid per unit of electricity by the consumers. Those customers who do not use half-hourly metered data, the exact daily consumption is not known and the periodic meter readings (typically a few times a year) is recorded and converted for billing purposes into 30-min profiles based on standardised load profiles, also known as profile classes.
Moreover, the UK government, despite all the troubles with Brexit and its impending departure from the European Union, set a binding target for to decrease the carbon emissions by 35% in 2020 and by 80% in 2050. Of course, RES is perceived both by authorities and by the general public as being the most obvious ways how to achieve these targets. Thus, the authorities and the policy-makers tend to promote the popularity and the usefulness of the domestic PV solar systems through the generous capital subsidies for those British households who want to install solar PV systems [62].
A few words need to be said about the system’s energy optimisation aspects. As far as the optimal design of distributed energy systems is concerned, elements such as annual costs or carbon emissions can be considered for drawing comparisons [63]. In addition, it becomes clear that there is plethora of methods and algorithms for the energy systems and their optimisation, but one needs to consider reliability, maintenance, as well as social aspects in optimization for making the system work [64]. This might be especially relevant for the case of energy efficiency projects.
When it comes to RES, it appears that due to the wide gap between the research and the real-world applications as well as the complexity of the real world, there is a need for efficient renewable energy system design for technical, economic, environmental and socio-political optimisation [65,66]. This should be achieved not only at the country’s level but also at the municipal and local level [67].

4. Research Methodology and Data Description

In this section, we build a model of energy efficiency using a case study of UK residential households either having or not having solar PV panels and EVs. Moreover, we present the data that has been used for the creation of the model.
The example in question has not been chosen on random—in the United Kingdom, household solar PV technology is perceived as the one occupying a key position in the transition to a sustainable future. This is happening in spite of the traditional stereotype of grim and clouded skies over the British Isles. Even though wind renewable technologies are popular in some parts of the UK, most notably Scotland and Wales, most populated parts of the country, including London, are inclining to solar PV installations.
Most Britons regard solar energy as a very cheap and effective source of renewable energy generation. UK households which installed PV solar panels use them for generating around 40% of their annual electricity consumption and use around 80% of that electricity at home for their basic needs [68]. Table 1 that follows shows the share of the UK PV solar systems and the total installed capacity (TIC).
Feed-in Tariff (FITs) used for buying the electric energy generated using RES technologies in UK were first introduced in 2010. Thanks to their popularity, the rate of installing PV solar systems in the UK was growing at an incredible pace, increasing the installed capacity from 0 to 2.4 GW by 2013 [70]. Most of the solar PVs in the UK are located in the residential areas or are used in industry., Small PV solar systems that do not involve excessive administrative procedures and cumbersome installation are particularly popular with household customers [71]. Basically, there are two options for the solar PV owners in UK which are derived from their PV power: (i) generation tariff and, (ii) the quota system. With regard to the above, the following regulations are set:
  • PV solar systems below 50 kW can use FiTs;
  • PV solar systems between 50 kW and 5 MW can use both FiTs and the quota system;
  • PV solar systems more than than 5 MW can use the quota system.
Apart from benefitting from FiT, solar PV owners naturally use some or all of their energy or can sell the surplus back to the electric grid. In case the household PV solar system has the power of less than 30 kW, the household owner receives a feed-in premium over the production tariff. If the household PV solar system’s power is greater than 30 kW, the household can sell the surplus at the power market using regular wholesale price. Table 2 which follows below demonstrates the differences in payments and savings in the case of the FIT for the selected UK locations.
However, the question arises: Is there an additional potential for the household PV in the United Kingdom? Alternatively, it would be interesting to pose the following question: What is the maximum PV potential in the UK?
Let us make a brief estimate here using back-of-the-envelope calculations: In 2014, there were 23.4 million residential homes in UK. About 42% of residential accommodations in UK are semi-detached or detached houses, some 30% are represented by the terraced houses, and mere 9% are constituted by bungalows (thence having rooftops suitable for PV installations). Flats (not suitable for PV installation) accounted for 16% (purpose-built) and 4% (converted flats) of the dwelling stock. In addition, it happens so that about 61% of homes in England are located in suburban areas, 21% are located in cities, and 18% are can be found in rural areas. The majority of the homes are owner occupied (63%) or private rented (20%). This is followed by houses owned by the local authority (7%) and housing association stock (10%) [73].
Therefore, our back-of-the envelope calculations would include the following parameters applicable to the UK economy:
  • There are around 23.4 million residential dwellings
  • There are about 27 million residential electricity customers
  • Around 61% of UK households are located in suburban areas
  • About 21% are located in city or urban centres
  • Around 63% are owner occupied
  • Nearly 20% are private rented
The calculations provided in Equations (1)–(3) yield the following results:
23,400,000 (habitable homes in the UK) * 82% (suburban areas or urban centres) * 63% (owner-occupied) = 12,088,400
23,400,000 (habitable homes in the UK) * 82% (located in suburban areas or urban centres) * 83% (owner-occupied and rented) = 15,926,040 (maximum potential for PVs in the UK)
27,000,000 (residential electricity customers) * 63% (live in owner-occupied houses) = 17,010,000
Our data is taken from the consumer household survey done by the Customer-Led Network Revolution (CLNR). The survey used smart meters to monitor 199 households in the Northern England for the duration of two years (so-called “CLNR project”). CLNR data included the records on the usage of electricity or various appliances obtained from the smart meters between October 2012 and July 2014. It contained very detailed information on each single household and the data from using 36 household appliances.
Moreover, this data was complemented by the information from another CLNR trial including 155 households with solar PV carried out between June 2012 and March 2014. The data from the second survey was less detailed but included information on solar power and the power import (in kW) of each household.
Both data files contain the recordings of 30-min intervals for an average day for an average household with and without solar PV which represents around 17520 data points in total. Both datasets bear the accurate readings of the electric energy consumption and electric energy consumption and generation patterns in British households detailed and categorized by the individual appliances up to date.
The data in question was not used directly but was modified in order to derive the average values of household electricity consumption and solar energy generation. In addition, some estimates of the average EV consumption were used. EVs (plug-in hybrids or all other battery systems) are used to prevent local air pollution, particularly in urban areas. Over the last few decades, the use of electric vehicles and PV solar power has grown. Using solar energy to power an electric car can be cheaper for households with PVs, since the cost of a solar system at home can also be included in the equation. In addition to understanding what it costs to power an EV, it is also important to know the cost of an important part of the home technology: the electric vehicle’s equipment and the cost of its installation. This cost depends to a large extent on the size of the system, the quality of the solar panels and the use of the power inverter and the complexity of the installation.

5. Empirical Model

Our empirical model focuses on solving the problem for establishing the optimal tariffs and charges in a situation when the total number of customers remains the same but the share of solar PV increases altering the total revenue recovered from the residential customers. Another modification would be to add the EV to the system in order to see how the balance changes.
As far as EVs are concerned, we will look at the situation in UK. It becomes apparent that less than 50% of electricity customers are likely to have an EV. The question is: How many are going to buy an EV? In 2015, there were 31,170,700 private cars in the UK [74]. It appears from the available data that around 77% of UK households have at least one car (about 81% have access to a car meaning they might commute or share rides), and 33% of households have two or more cars [75]. By the end of 2016, UK had a fleet of over 80,000 electric vehicles. During the same period, British EVs constituted around 1.3 per cent of new cars [76].
Let us introduce a fixed element F and a variable element v in order to obtain a new plausible solution for establish the optimal tariffs and charges in a situation when the total number of customers remains the same but the share of solar PV increases altering the total revenue recovered from the residential customers. We will put a new factor assuming that the charges were upgraded by the same percentage. The calculations proceed as follows: let the Total Revenue (TR) be equal to 88.53 × 3,040,000 + 67.85 × 59,751. The average TR = TR/3,100,000 households (a total number of households using electricity in the Northwest region in the Northern England, a site of the CLNR trial). In addition, we have F + v (fixed and variable tariffs). The fixed tariff (F) remains unchanged (not additional power is needed). The only variable part will be (v) given that the volume of consumed electrical energy should remain unchanged after the adaption of PV and EV by some households. The total revenue (TR) should also remain unchanged. Solving the system of equations for x would yield the following results (see Equations (4)–(7)):
(1 + x) F * 3,100,000 + (1 + x) v * (2540 * 3,040,000 + 1800 * 59,751) = TR
(1 + x) F * 3,100,000 + (1 + x) v * (2540 * 3,100,000 * 0.78 + 1800 * 3.1 * 0.22) = TR
(1 + x) F * 3,100,000 + (1 + x) v * (2540 * 3.04 + 1800 * 59,751) = TR
(1 + x) F * 3,100,000 + (1 + x) v * (2540 * 3.1 mil. * 0.78 + 1800 * 3.1 * 0.22) = TR
where:
  • x—an additional component that needs to be added to the existing optimal tariffs and charges in a situation when the total number of customers remains the same but the share of solar PV increases altering the total recovered revenue (expressed in £);
  • F—payment for the unit of power (kW) per day by one household (k) connected to the electricity network (expressed in £);
  • v—payment for the unit of energy (kWh) by one household (k) connected to the electricity network (expressed in £);
  • TR—total revenue of the electricity provider for N customers (households) (expressed in £);
Now, let us assume that each type of household has an EV. When there is a a PV solar panel in the house, the EV battery can become a storage device, as well as a battery that connects the power supply to a distributed photovoltaic system.
In addition, suppose that an EV would increase a household electricity consumption by the additional 3000 kWh. We can proceed with our computations comparing the results for the households with and without solar PV. This time, we will add a hypothetical EV consumption of 3000 kWh that increases the household electricity consumption [77]. There are 4 scenarios to be considered in similarity to a recent study by Küfeoğlu and Pollitt [78] that yield a decrease in electricity bill due to the introduced modifications:
  • Scenario 1 (no PV, no EV);
  • Scenario 2 (PV, no EV);
  • Scenario 3 (no PV, EV);
  • Scenario 4 (PV, EV)
Overall, the issues of solar energy and electric vehicle used in residential households questions the current distribution charging mechanism for the consumers (represented by households). It appears that this existing mechanism can be unfair. In the UK, a country selected as an example for our case study, there is a two-part tariff design with a fixed rate (£/day) and a volumetric rate (£/kWh). When a fixed amount of revenue is rising by the varying the volumetric charge (as in the case of PV and EV), inequalities in charging would appear.
The explanation of the two-part tariff design can be conducted as follows: one daily charge consist of fixed charge applied to each billing day and flat rate variable charge multiplied by net demand (one daily charge, £) = (fixed day charge, £) + (total net demand for a given day, kWh) * (flat rate variable charge, £/kWh). Since we have fixed day charge in tariff, it makes sense to calculate data none less than on the basis of the daily data. This can be expressed in mathematical terms as the following (see Equations (8) and (9) that follow):
y ∊ {1,…, z} ⋀ tsyTsv
Tsv (j) = tsk, pjIk
where:
  • tsy—a digital meter variable tariff for period y,
  • Tsv—the ordered set of time-of-use tariffs;
  • Ik—a set of peak and off-peak periods.
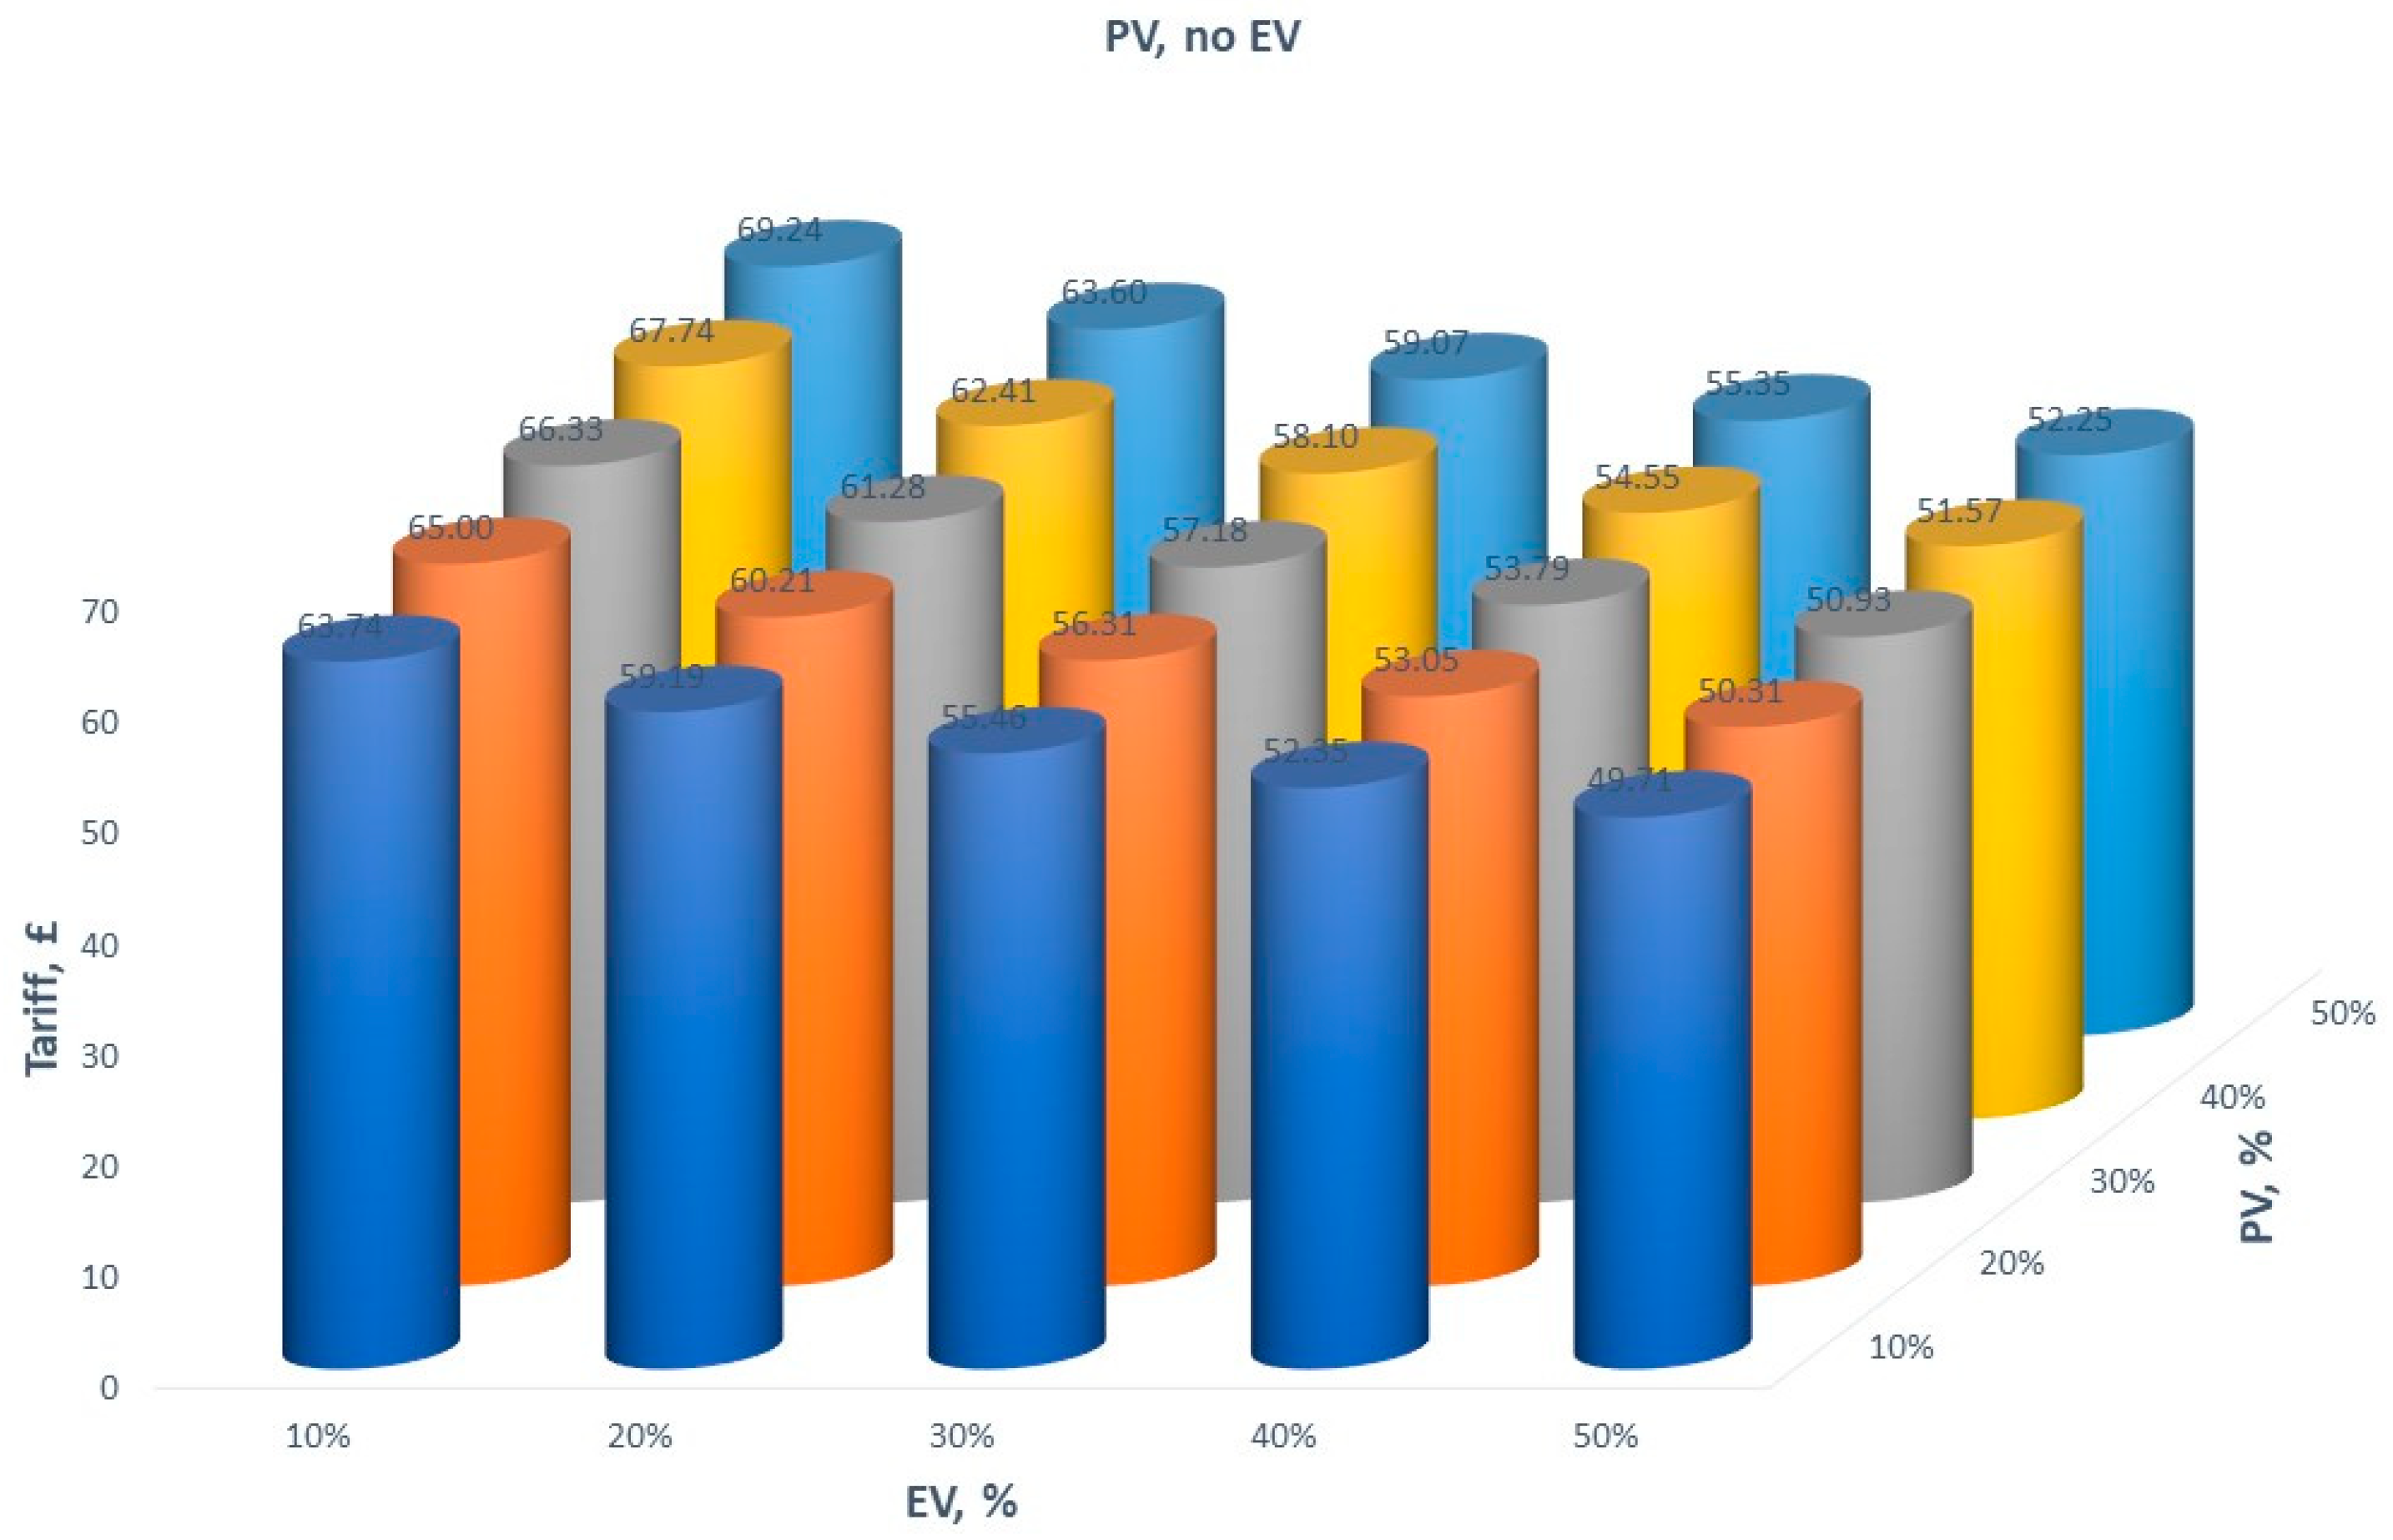
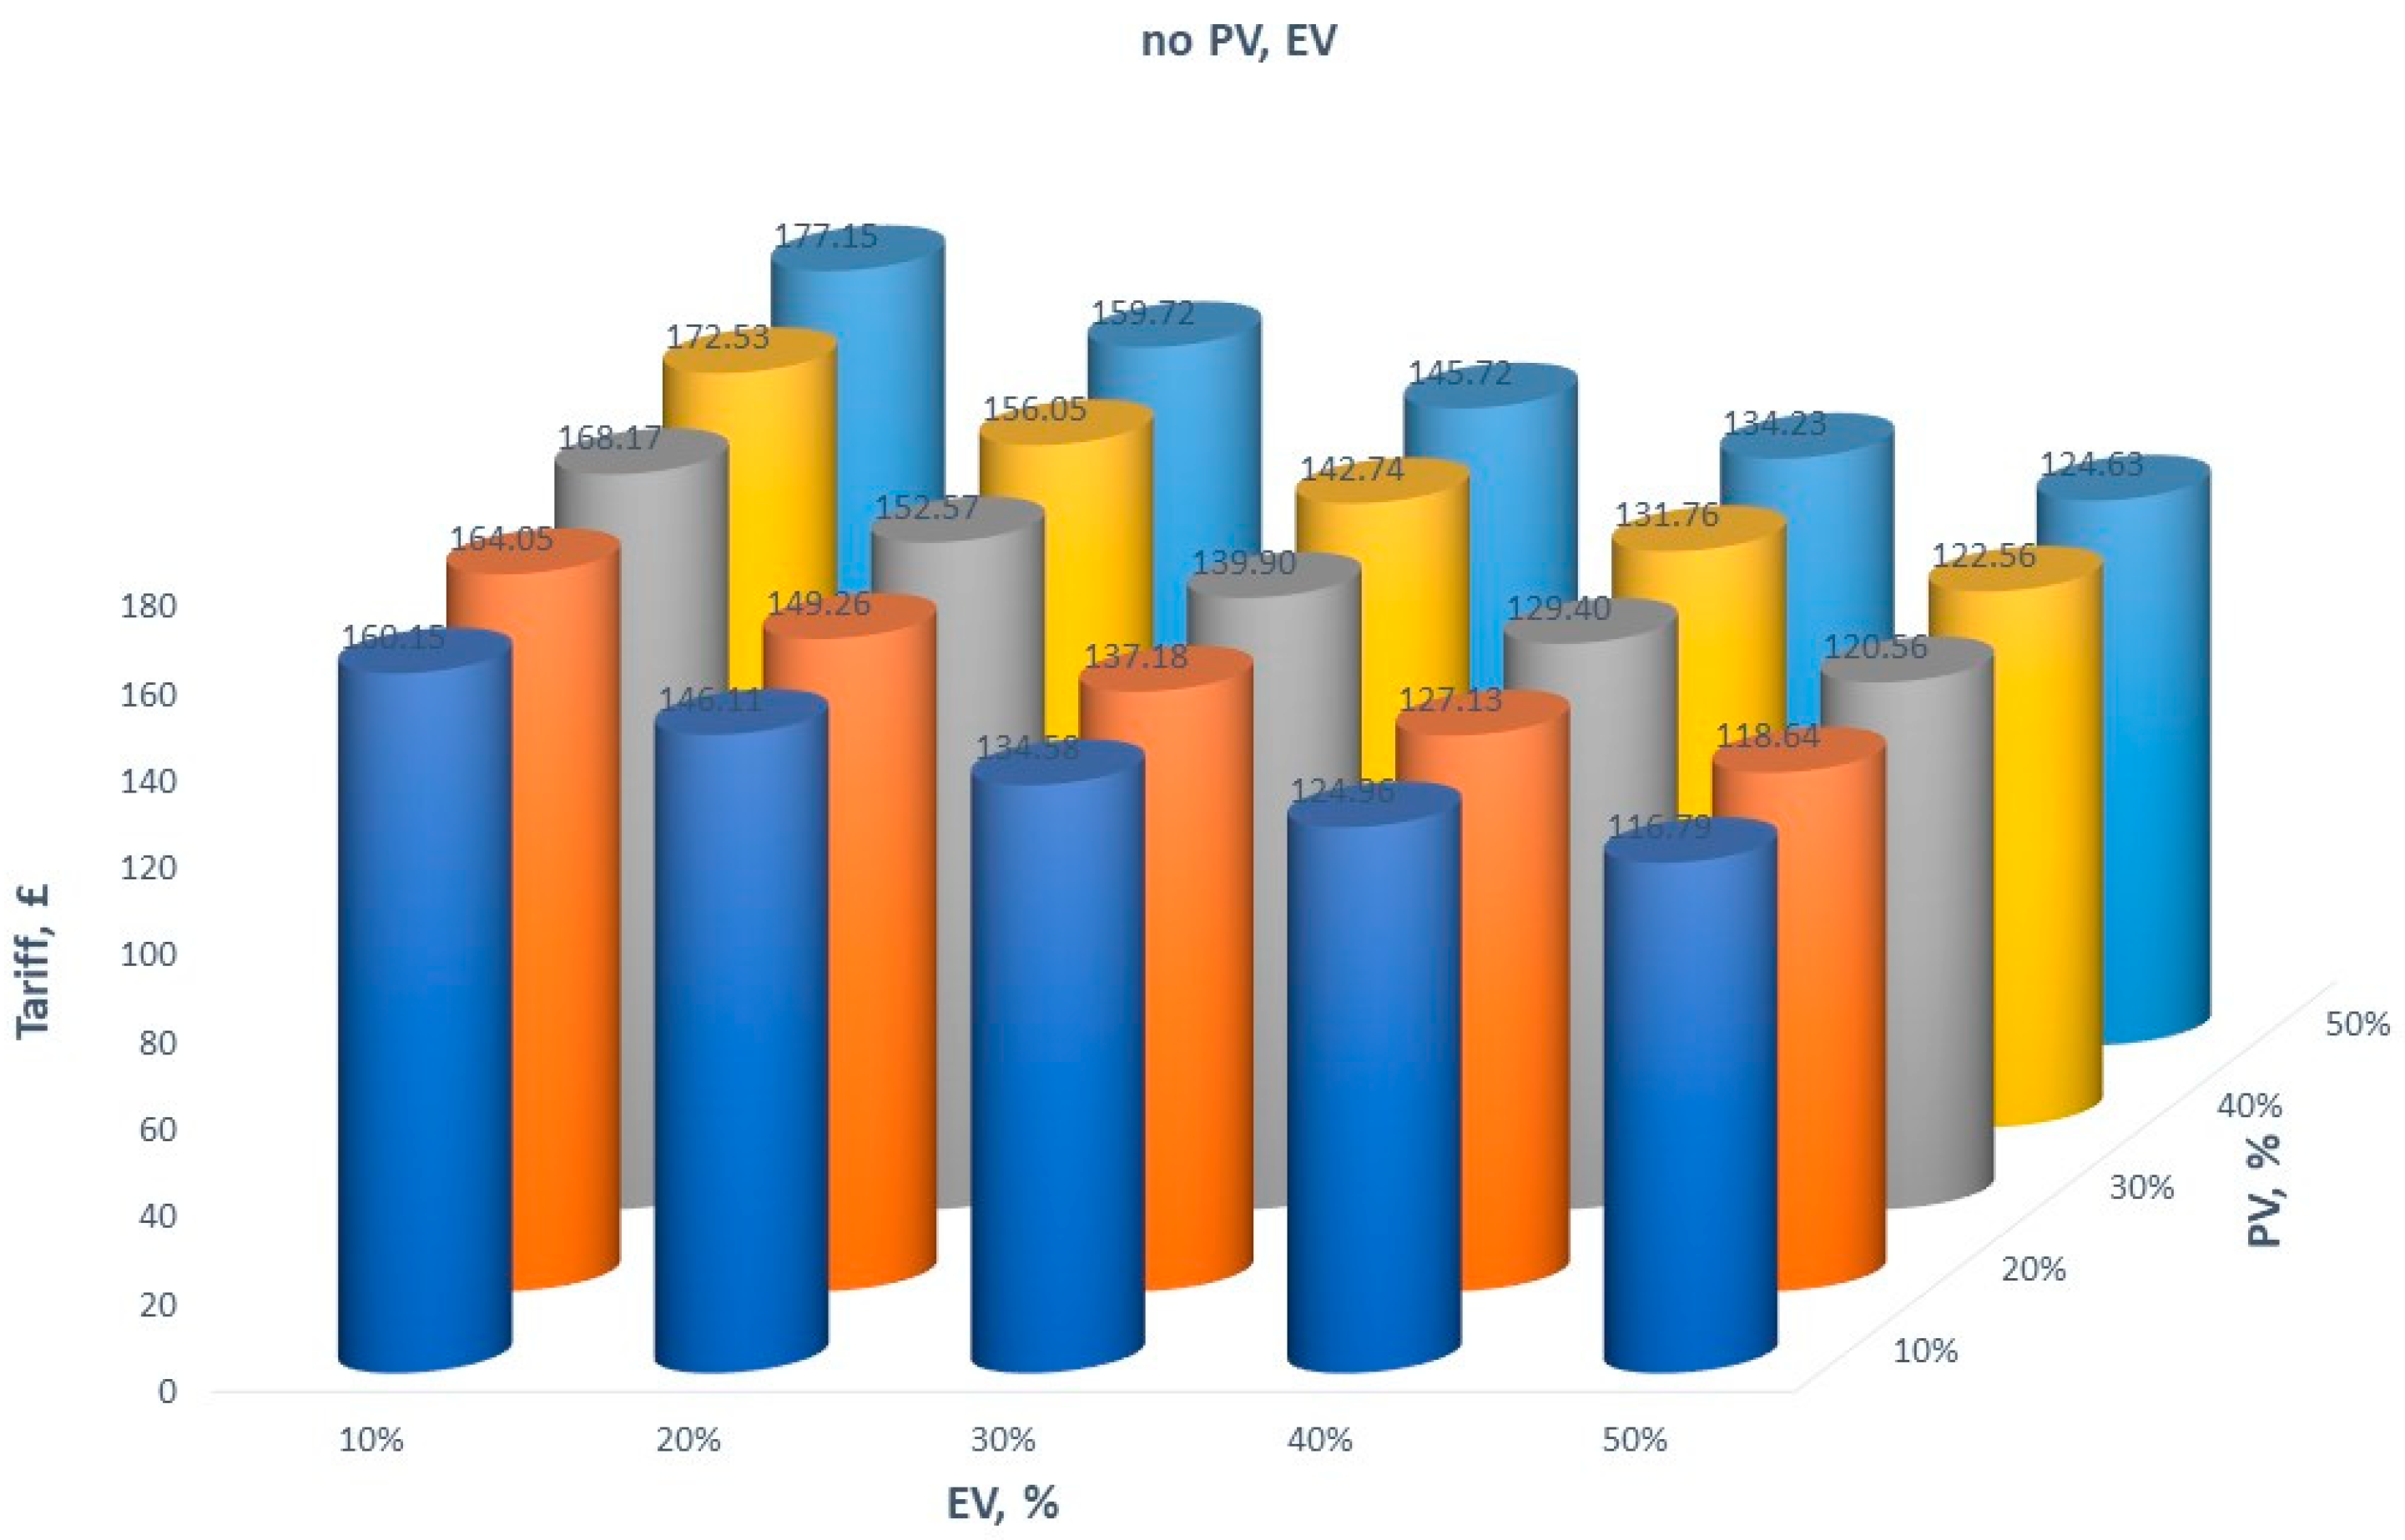
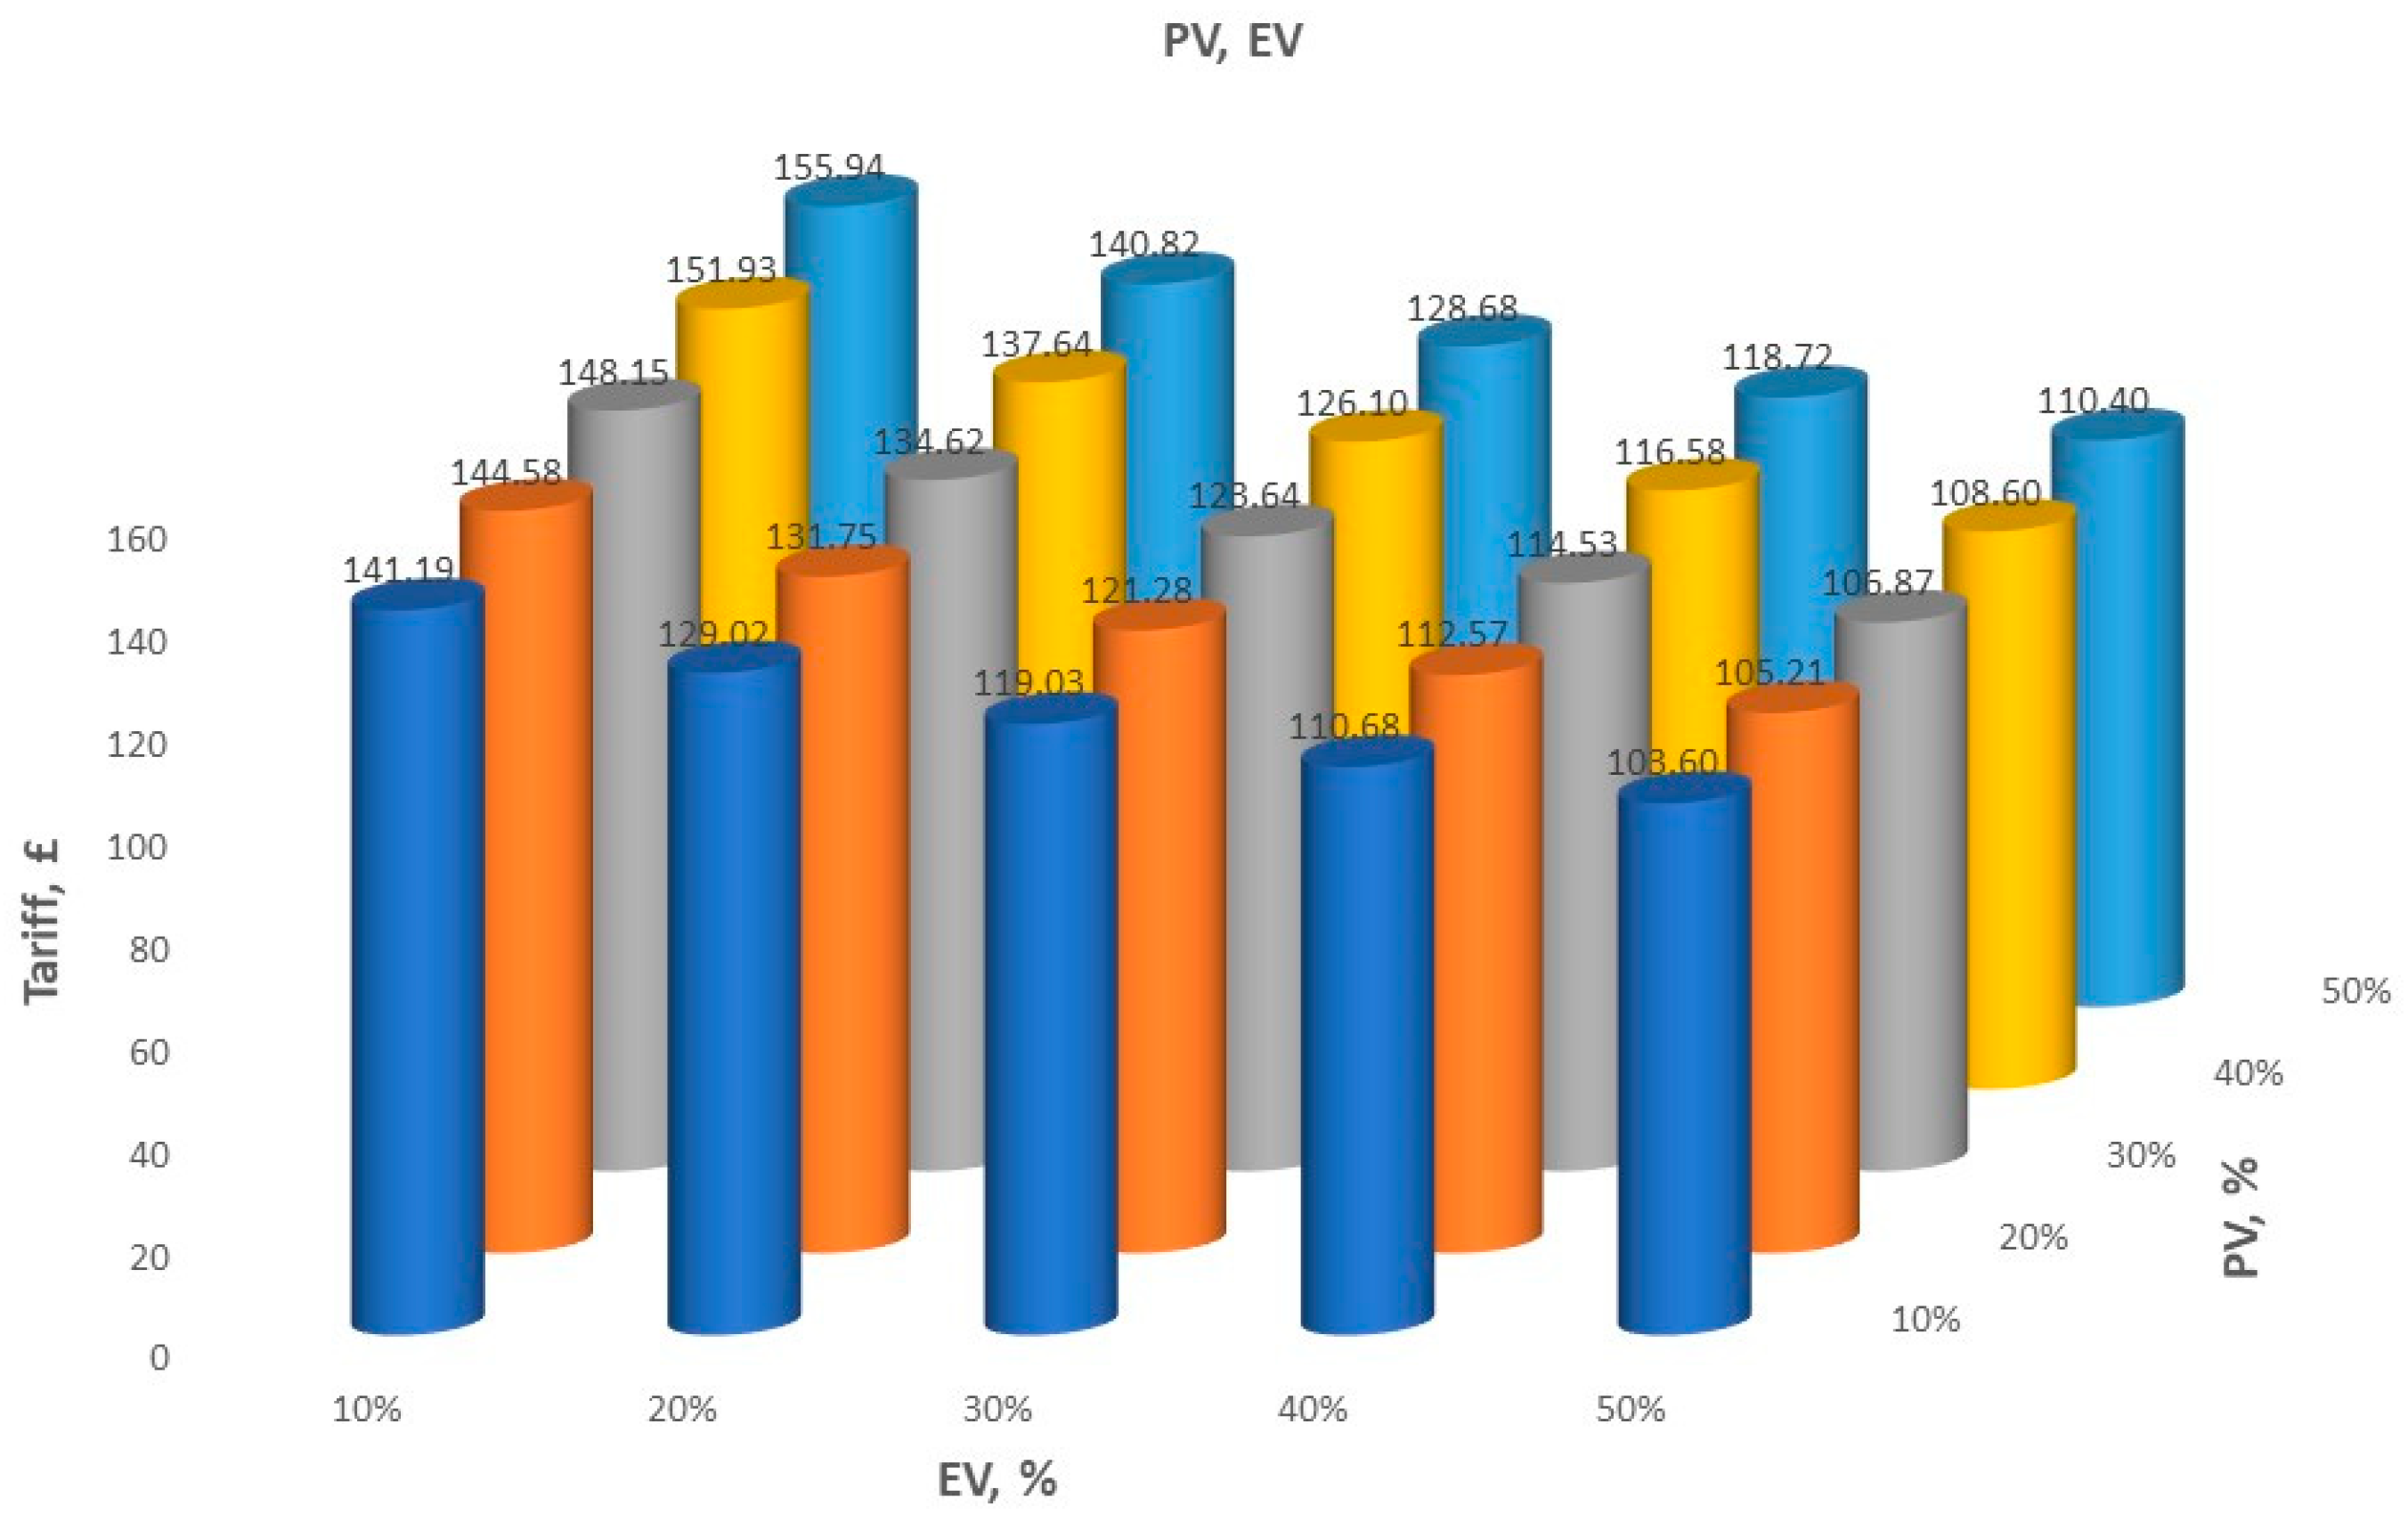
Figure 1, Figure 2, Figure 3 and Figure 4 that follow demonstrate the decrease in the payments of the maximum distribution network tariff in the case of different scenarios when the PV and EV occurs in households which own EVs but not PVs, own PVs but not EVs, own neither of them, or own both. The scenarios summarize the tariff variation using the example of Northwest England households.
All four of the above scenarios provide differentiation between systems in terms of varying values of the gross demand of a household (“regular” household, PV household, an EV household, and a PV and EV household), tariff (total payment for electrical energy) per household per year, as well as metered import for the “regular”, PV household, an EV household, and a PV and EV household, also expressed per household per year.
The main point of the scenarios is to show the system dynamics as the total revenue is shrinking due to the swelling of changes cause by the massive uptake of PV and EV in the households. Of course, all four scenarios represent a simplified model of reality with just a few parameters changing while the rest of the parameters (many of which would, without any doubt, might become key to the system dynamics) remain fixed. Nevertheless, the model might be used as a means of supporting our argument of how to achieve and attain energy efficiency in the situation with massive uptakes of PV and EV by residential households and the collapse of traditional energy tariffs and charges.
Looking at the results, one can see that the current tariff design applicable on the electricity markets, the attempts to increase energy efficiency using innovative technologies such as PVs and EVs, would inevitably lead to the reduction of distribution charges for less wealthier households without any EVs or PVs. With a higher share of PV penetration, the tariff increases regardless of whether a household owns PV or not. This would create an unfavourable situation for many energy consumers, in particular elderly and disabled ones. As a result, the final arrangement would not be set in accordance with the principles of social and economic justice, which, in the long run, might pose serious issues for the energy efficiency.

6. Discussion and Conclusions

Overall, it appears that energy efficiency depends on the smooth transition to the low-carbon future. This transition can be enhanced by the increase in the general awareness of the environmental issues and sustainability, as well as about shifting to renewable energy sources. Consumers and households should embrace the option of generating their own energy and using it for powering their homes as well as for transportation.
Our results show that there is a vast potential for that, both when it comes to rooftop capacity (using an example of the United Kingdom), or the potential for the increase in the EV fleet. The popularity of the renewable technologies is coupled with the financial incentives and earnings they might provide.
In addition, it becomes apparent that electric vehicles will consume more and more electricity, which will lead to more generation operations, with a huge increase in the use of generation fuel and air emissions. In particular, electric vehicles connected to the grid may be used instead of or in connection with the storage of electricity in emergency situations or extreme supply shortages. EVs can raise energy prices outside the peak enough to reduce the benefits of certain grid-related storage applications, in particular the change in energy time and the management of energy costs.
Furthermore, our empirical model could have some potential for regional power plant development in addition to using distributed PV systems. With EVs showing explosive growth over the last few years, they might take over the role of the distributed mobile storage devices have a high potential for power systems in future networks, especially when they coordinate with renewable energy. This would surely contribute to the increase in energy efficiency and enhance the transition to the low-carbon economy.
Our results shown that massive introduction of solar PV under the unaltered network tariffs and charges provisions lead to the transfer of costs and wealth between different existing customer groups. We showed that in case when residential households start producing their own solar energy using PV solar panels, they start tolerating lower share of the per kWh costs of the distribution system and the per unit charges increase for all electricity customers. Our results advocate the idea that with the increase of PV and EV deployment worldwide, the existing energy efficiency schemes need to be recalibrated by the relevant stakeholders and policy-makers.

Author Contributions

Conceptualization, W.S., D.S., and E.V.; Methodology, W.S. and D.S.; Formal Analysis, W.S., D.S., and L.P.; Investigation, E.V.; Resources, D.S., E.V., and L.P.; Data Curation, W.S.; Writing—Original Draft Preparation, W.S., D.S., E.V. and L.P.; Writing—Review & Editing, W.S. and D.S.; Visualization, W.S.; Supervision, L.P.; Funding Acquisition, D.S., E.V., and L.P.

Acknowledgments

This research was funded by a grant (No. S-MIP-17-131) from the Research Council of 594 Lithuania. The authors would also like to acknowledge the help of Michael G. Pollitt, CLNR and Northern Powergrid, as well as Ofgem’s Low Carbon Network (LCN) Fund. The usual disclaimer applies.

Conflicts of Interest

The authors declare no conflict of interest.

Abbreviations

CLNRCustomer-Led Network Revolution
CO2Carbon dioxide (greenhouse gas)
ESCOEnergy service company
EPCEnergy performance certificate
EVElectric vehicle
FiTFeed-in Tariff
LCNLow Carbon Network
PVPhotovoltaic panels
RECRenewable energy certificate
RESRenewable energy sources
SEEAState Energy Efficiency authority
TICTotal installed capacity
UKUnited Kingdom

References

  1. Li, H.; Li, F.; Shi, D.; Yu, X.; Shen, J. Carbon Emission Intensity, Economic Development and Energy Factors in 19 G20 Countries: Empirical Analysis Based on a Heterogeneous Panel from 1990 to 2015. Sustainability 2018, 10, 2330. [Google Scholar] [CrossRef]
  2. Newbery, D.; Pollitt, M.G.; Ritz, R.A.; Strielkowski, W. Market design for a high-renewables European electricity system. Renew. Sustain. Energy Rev. 2018, 91, 695–707. [Google Scholar] [CrossRef]
  3. Bel, G.; Joseph, S. Climate change mitigation and the role of technological change: Impact on selected headline targets of Europe’s 2020 climate and energy package. Renew. Sustain. Energy Rev. 2018, 82, 3798–3807. [Google Scholar] [CrossRef]
  4. Rausser, G.; Strielkowski, W.; Štreimikienė, D. Smart meters and household electricity consumption: A case study in Ireland. Energy Environ. 2018, 29, 131–146. [Google Scholar] [CrossRef]
  5. Shahsavari, A.; Akbari, M. Potential of solar energy in developing countries for reducing energy-related emissions. Renew. Sustain. Energy Rev. 2018, 31, 275–291. [Google Scholar] [CrossRef]
  6. Narayan, N.; Chamseddine, A.; Vega-Garita, V.; Qin, Z.; Popovic-Gerber, J.; Bauer, P.; Zeman, M. Quantifying the Benefits of a Solar Home System-Based DC Microgrid for Rural Electrification. Energies 2019, 12, 938. [Google Scholar] [CrossRef]
  7. Centobell, P.; Cerchione, R.; Esposito, E. Environmental sustainability and energy-efficient supply chain management: A review of research trends and proposed guidelines. Energies 2018, 11, 275. [Google Scholar] [CrossRef]
  8. Chang, M.-C.; Shieh, H.-S. The Relations between Energy Efficiency and GDP in the Baltic Sea Region and Non-Baltic Sea Region. Transform. Bus. Econ. 2017, 16, 235–247. [Google Scholar]
  9. Schandl, H.; Hatfield-Dodds, S.; Wiedmann, T.; Geschke, A.; Cai, Y.; West, J.; Newth, D.; Baynes, T.; Lenzen, M.; Owen, A. Decoupling global environmental pressure and economic growth: Scenarios for energy use, materials use and carbon emissions. J. Clean. Prod. 2016, 20, 45–56. [Google Scholar] [CrossRef]
  10. Kuzmin, E.A.; Volkova, E.E.; Fomina, A.V. Research on the concentration of companies in the electric power market of Russia. Int. J. Energy Econ. Policy 2019, 9, 130–136. [Google Scholar] [CrossRef]
  11. Pooranian, Z.; Abawajy, J.; Conti, M. Scheduling distributed energy resource operation and daily power consumption for a smart building to optimize economic and environmental parameters. Energies 2018, 11, 1348. [Google Scholar] [CrossRef]
  12. Lawrence, T.M.; Boudreau, M.C.; Helsen, L.; Henze, G.; Mohammadpour, J.; Noonan, D.; Patteeuw, D.; Pless, S.; Watson, R.T. Ten questions concerning integrating smart buildings into the smart grid. Build. Environ. 2016, 108, 273–283. [Google Scholar] [CrossRef] [Green Version]
  13. Franke, M.; Nadler, C. Energy efficiency in the German residential housing market: Its influence on tenants and owners. Energy Policy 2019, 128, 879–890. [Google Scholar] [CrossRef]
  14. Levinson, A. How much energy do building energy codes save? Evidence from California houses. Am. Econ. Rev. 2016, 106, 2867–2869. [Google Scholar] [CrossRef]
  15. So, K.C.; Wu, E. Developing cost-effective inspection sampling plans for energy-efficiency programs at Southern California Edison. Interfaces 2016, 46, 522–532. [Google Scholar] [CrossRef]
  16. Vlasov, A.I.; Echeistov, V.V.; Krivoshein, A.I.; Shakhnov, V.A.; Filin, S.S.; Migalin, V.S. An information system of predictive maintenance analytical support of industrial equipment. J. Appl. Eng. Sci. 2018, 16, 515–522. [Google Scholar] [CrossRef]
  17. Alam, M.; Zou, P.X.; Stewart, R.A.; Bertone, E.; Sahin, O.; Buntine, C.; Marshall, C. Government championed strategies to overcome the barriers to public building energy efficiency retrofit projects. Sustain. Cities Soc. 2019, 44, 56–69. [Google Scholar] [CrossRef]
  18. Gana, J.; Hoppe, T. Assessment of the Governance System Regarding Adoption of Energy Efficient Appliances by Households in Nigeria. Energies 2017, 10, 132. [Google Scholar] [CrossRef]
  19. Zhu, J.; Chertow, M.R. Business strategy under institutional constraints: Evidence from China’s energy efficiency regulations. Ecol. Econ. 2017, 135, 10–21. [Google Scholar] [CrossRef]
  20. Zhang, S.; Jiao, Y.; Chen, W. Demand-side management (DSM) in the context of China’s on-going power sector reform. Energy Policy 2017, 100, 1–8. [Google Scholar] [CrossRef]
  21. Smith, H.A. Unwilling internationalism or strategic internationalism? Canadian climate policy under the conservative government. Can. Foreign Policy J. 2009, 15, 57–77. [Google Scholar] [CrossRef]
  22. Geller, H.; Harrington, P.; Rosenfeld, A.H.; Tanishima, S.; Unander, F. Polices for increasing energy efficiency: Thirty years of experience in OECD countries. Energy Policy 2006, 34, 556–573. [Google Scholar] [CrossRef]
  23. Vine, E. An international survey of the energy service company (ESCO) industry. Energy Policy 2005, 33, 691–704. [Google Scholar] [CrossRef]
  24. Kern, F.; Kivimaa, P.; Martiskainen, M. Policy packaging or policy patching? The development of complex energy efficiency policy mixes. Energy Res. Soc. Sci. 2017, 23, 11–25. [Google Scholar] [CrossRef] [Green Version]
  25. Perez, C. Unleashing a golden age after the financial collapse: Drawing lessons from history. Environ. Innov. Soc. Transit. 2013, 6, 9–23. [Google Scholar] [CrossRef]
  26. Sovacool, B.K. Reviewing, reforming, and rethinking global energy subsidies: Towards a political economy research agenda. Ecol. Econ. 2017, 135, 150–163. [Google Scholar] [CrossRef]
  27. Teller-Elsberg, J.; Sovacool, B.; Smith, T.; Laine, E. Fuel poverty, excess winter deaths, and energy costs in Vermont: Burdensome for whom? Energy Policy 2016, 90, 81–91. [Google Scholar] [CrossRef] [Green Version]
  28. Gerarden, T.D.; Newell, R.G.; Stavins, R.N. Assessing the energy-efficiency gap. J. Econ. Lit. 2017, 55, 1486–1525. [Google Scholar] [CrossRef]
  29. Koirala, B.P.; Koliou, E.; Friege, J.; Hakvoort, R.A.; Herder, P.M. Energetic communities for community energy: A review of key issues and trends shaping integrated community energy systems. Renew. Sustain. Energy Rev. 2016, 56, 722–744. [Google Scholar] [CrossRef] [Green Version]
  30. Jantzen, J.; Kristensen, M.; Christensen, T.H. Sociotechnical transition to smart energy: The case of Samso 1997–2030. Energy 2018, 162, 20–34. [Google Scholar] [CrossRef]
  31. Van den Berg, H.J.; Keenan, J.M. Dynamic vulnerability in the pursuit of just adaptation processes: A Boston case study. Environ. Sci. Policy 2019, 94, 90–100. [Google Scholar] [CrossRef]
  32. Wu, X.; Xu, Y.; Lou, Y.; Chen, Y. Low carbon transition in a distributed energy system regulated by localized energy markets. Energy Policy 2018, 122, 474–785. [Google Scholar] [CrossRef]
  33. Van Vuuren, D.P.; Stehfest, E.; Gernaat, D.E.; Doelman, J.C.; Van den Berg, M.; Harmsen, M.; de Boer, H.S.; Bouwman, L.F.; Daioglou, V.; Edelenbosch, O.Y.; et al. Energy, land-use and greenhouse gas emissions trajectories under a green growth paradigm. Glob. Environ. Chang. 2017, 42, 237–250. [Google Scholar] [CrossRef] [Green Version]
  34. Ramirez-Contreras, N.E.; Faaij, A.P. A review of key international biomass and bioenergy sustainability frameworks and certification systems and their application and implications in Colombia. Renew. Sustain. Energy Rev. 2018, 96, 460–478. [Google Scholar] [CrossRef]
  35. Bringezu, S.; Potočnik, J.; Schandl, H.; Lu, Y.; Ramaswami, A.; Swilling, M.; Suh, S. Multi-scale governance of sustainable natural resource use—Challenges and opportunities for monitoring and institutional development at the national and global level. Sustainability 2016, 8, 778. [Google Scholar] [CrossRef]
  36. Sen, S.; Ganguly, S. Opportunities, barriers and issues with renewable energy development–A discussion. Renew. Sustain. Energy Rev. 2017, 69, 1170–1181. [Google Scholar] [CrossRef]
  37. Kucukvar, M.; Cansev, B.; Egilmez, G.; Onat, N.C.; Samadi, H. Energy-climate-manufacturing nexus: New insights from the regional and global supply chains of manufacturing industries. Appl. Energy 2016, 184, 889–904. [Google Scholar] [CrossRef]
  38. EIA. U.S. Energy-Related Carbon Dioxide Emissions. 2018. Available online: https://www.eia.gov/environment/emissions/carbon/ (accessed on 10 February 2019).
  39. Kousoulidou, M.; Lonza, L. Biofuels in aviation: Fuel demand and CO2 emissions evolution in Europe toward 2030. Transp. Res. Part D Transp. Environ. 2016, 46, 166–181. [Google Scholar] [CrossRef]
  40. Fernández-Dacosta, C.; Shen, L.; Schakel, W.; Ramirez, A.; Kramer, G.J. Potential and challenges of low-carbon energy options: Comparative assessment of alternative fuels for the transport sector. Appl. Energy 2019, 236, 590–606. [Google Scholar] [CrossRef]
  41. Palmer-Wilson, K.; Donald, J.; Robertson, B.; Lyseng, B.; Keller, V.; Fowler, M.; Wade, C.; Scholtysik, S.; Wild, P.; Rowe, A. Impact of land requirements on electricity system decarbonisation pathways. Energy Policy 2019, 129, 193–205. [Google Scholar] [CrossRef]
  42. Schivley, G.; Azevedo, I.; Samaras, C. Assessing the evolution of power sector carbon intensity in the United States. Environ. Res. Lett. 2018, 13, 064018. [Google Scholar] [CrossRef] [Green Version]
  43. Pehl, M.; Arvesen, A.; Humpenöder, F.; Popp, A.; Hertwich, E.G.; Luderer, G. Understanding future emissions from low-carbon power systems by integration of life-cycle assessment and integrated energy modelling. Nat. Energy 2017, 2, 939. [Google Scholar] [CrossRef]
  44. Stram, B.N. Key challenges to expanding renewable energy. Energy Policy 2016, 96, 728–734. [Google Scholar] [CrossRef]
  45. Karatayev, M.; Hall, S.; Kalyuzhnova, Y.; Clarke, M.L. Renewable energy technology uptake in Kazakhstan: Policy drivers and barriers in a transitional economy. Renew. Sustain. Energy Rev. 2016, 66, 120–136. [Google Scholar] [CrossRef]
  46. Santini, D.; Rood, M.; Zhou, Y.; Stephens, T.; Miller, J.; Bluestein, L. Implications of Successes and Failures of BEV-Focused Incentive Support for PEVs in the US, Canada and Europe. World Electr. Veh. J. 2016, 8, 831. [Google Scholar] [CrossRef]
  47. Mohr, T.M. Fuel poverty in the US: Evidence using the 2009 Residential Energy Consumption Survey. Energy Econ. 2018, 74, 360–369. [Google Scholar] [CrossRef]
  48. Ahmad, M.W.; Mourshed, M.; Mundow, D.; Sisinni, M.; Rezgui, Y. Building energy metering and environmental monitoring—A state-of-the-art review and directions for future research. Energy Build. 2016, 120, 85–102. [Google Scholar] [CrossRef]
  49. Creutzig, F.; Fernandez, B.; Haberl, H.; Khosla, R.; Mulugetta, Y.; Seto, K.C. Beyond technology: Demand-side solutions for climate change mitigation. Annu. Rev. Environ. Resour. 2016, 41, 173–198. [Google Scholar] [CrossRef]
  50. Arnette, A.N.; Brewer, B.L.; Choal, T. Design for sustainability (DFS): The intersection of supply chain and environment. J. Clean. Prod. 2014, 83, 374–390. [Google Scholar] [CrossRef]
  51. Wolske, K.S.; Stern, P.C.; Dietz, T. Explaining interest in adopting residential solar photovoltaic systems in the United States: Toward an integration of behavioral theories. Energy Res. Soc. Sci. 2017, 25, 134–151. [Google Scholar] [CrossRef]
  52. Haben, S.; Singleton, C.; Grindrod, P. Analysis and clustering of residential customers energy behavioral demand using smart meter data. IEEE Trans. Smart Grid 2016, 7, 136–144. [Google Scholar] [CrossRef]
  53. Willand, N.; Maller, C.; Ridley, I. Addressing health and equity in residential low carbon transitions–Insights from a pragmatic retrofit evaluation in Australia. Energy Res. Soc. Sci. 2019, 53, 68–84. [Google Scholar] [CrossRef]
  54. Hiteva, R.; Sovacool, B. Harnessing social innovation for energy justice: A business model perspective. Energy Policy 2017, 107, 631–639. [Google Scholar] [CrossRef] [Green Version]
  55. Goedkoop, F.; Devine-Wright, P. Partnership or placation? The role of trust and justice in the shared ownership of renewable energy projects. Energy Res. Soc. Sci. 2016, 17, 135–146. [Google Scholar] [CrossRef] [Green Version]
  56. Jacobson, M.Z.; Delucchi, M.A.; Bauer, Z.A.; Goodman, S.C.; Chapman, W.E.; Cameron, M.A.; Bozonnat, C.; Chobadi, L.; Clonts, H.A.; Enevoldsen, P.; et al. 100% clean and renewable wind, water, and sunlight all-sector energy roadmaps for 139 countries of the world. Joule 2017, 1, 108–121. [Google Scholar] [CrossRef]
  57. Nejat, P.; Jomehzadeh, F.; Taheri, M.M.; Gohari, M.; Majid, M.Z. A global review of energy consumption, CO2 emissions and policy in the residential sector (with an overview of the top ten CO2 emitting countries). Renew. Sustain. Energy Rev. 2015, 43, 843–862. [Google Scholar] [CrossRef]
  58. Pew Research Center. Two-Thirds of Americans Give Priority to Developing Alternative Energy over Fossil Fuels. 2017. Available online: https://www.pewresearch.org/fact-tank/2017/01/23/two-thirds-of-americans-give-priority-to-developing-alternative-energy-over-fossil-fuels (accessed on 10 February 2019).
  59. EIA. Analysis and Projections. 2018. Available online: https://www.eia.gov/analysis/requests/subsidy (accessed on 10 February 2019).
  60. Elexon. Load Profiles and Their Use of Electricity Settlement. 2013. Available online: https://www.elexon.co.uk/wp-content/uploads/2013/11/load_profiles_v2.0_cgi.pdf (accessed on 4 February 2019).
  61. CLNR. Commercial Arrangements Study. Review of Existing Commercial Arrangements and Emerging Best Practice. 2013. Available online: http://www.element-energy.co.uk/wordpress/wp-content/uploads/2013/07/CLNR-Commercial-Arrangements-Study_2013.pdf (accessed on 4 February 2019).
  62. Sioshansi, R. Retail electricity tariff and mechanism design to incentivize distributed renewable generation. Energy Policy 2016, 95, 498–508. [Google Scholar] [CrossRef]
  63. Karmellos, M.; Mavrotas, G. Multi-objective optimization and comparison framework for the design of Distributed Energy Systems. Energy Convers. Manag. 2019, 180, 473–495. [Google Scholar] [CrossRef]
  64. Frangopoulos, C.A. Recent developments and trends in optimization of energy systems. Energy 2018, 164, 1011–1020. [Google Scholar] [CrossRef]
  65. Eriksson, E.L.; Gray, E.M. Optimization of renewable hybrid energy systems—A multi-objective approach. Renew. Energy 2019, 133, 971–999. [Google Scholar] [CrossRef]
  66. Elsheikh, A.H.; Elaziz, M.A. Review on applications of particle swarm optimization in solar energy systems. Int. J. Environ. Sci. Technol. 2019, 16, 1159–1170. [Google Scholar] [CrossRef]
  67. Scheller, F.; Bruckner, T. Energy system optimization at the municipal level: An analysis of modeling approaches and challenges. Renew. Sustain. Energy Rev. 2019, 105, 444–461. [Google Scholar] [CrossRef]
  68. CLNR. Insight Report: Domestic Solar PV Customers. 2013. Available online: http://www.networkrevolution.co.uk/wp-content/uploads/2015/01/CLNR-L090-Insight-Report-Domestic-Solar-PV.pdf (accessed on 23 August 2018).
  69. Ofgem. Feed-in Tariffs Quarterly Reports. 2016. Available online: https://www.ofgem.gov.uk/system/files/docs/2016/12/feed-in_tariff_quarterly_report-issue_26.pdf (accessed on 30 November 2018).
  70. DECC. UK Solar PV Strategy Part 1: Roadmap to a Brighter Future; Department of Energy and Climate Change: London, UK, 2013. Available online: https://www.gov.uk/government/uploads/system/uploads/attachment_data/file/249277/UK_Solar_PV_Strategy_Part_1_Roadmap_to_a_Brighter_Future_08.10.pdf (accessed on 18 February 2019).
  71. Dusonchet, L.; Telaretti, E. Comparative economic analysis of support policies for solar PV in the most representative EU countries. Renew. Sustain. Energy Rev. 2015, 42, 986–998. [Google Scholar] [CrossRef]
  72. Strielkowski, W.; Štreimikienė, D.; Bilan, Y. Network charging and residential tariffs: A case of household photovoltaics in the United Kingdom. Renew. Sustain. Energy Rev. 2017, 77, 461–473. [Google Scholar] [CrossRef]
  73. National Statistics. English Housing Survey 2014–2015. 2016. Available online: https://www.gov.uk/government/statistics/english-housing-survey-2014-to-2015-headline-report (accessed on 19 January 2019).
  74. Department of Transport. Vehicles Licensing Statistics. 2016. Available online: https://www.gov.uk/government/statistical-data-sets/veh02-licensed-cars (accessed on 20 January 2019).
  75. National Travel Survey Statistics. Driving License Holding and Vehicle Availability. 2016. Available online: https://www.gov.uk/government/statistical-data-sets/nts02-driving-licence-holders (accessed on 21 January 2019).
  76. SMMT. EV and AFV Registrations. 2016. Available online: https://www.smmt.co.uk/2017/01/december-2016-ev-registrations (accessed on 10 March 2019).
  77. Newbery, D.; Strbac, G. What is needed for battery electric vehicles to become socially cost competitive? Econ. Transp. 2016, 5, 1–11. [Google Scholar] [CrossRef] [Green Version]
  78. Küfeoğlu, S.; Pollitt, M.G. The impact of PVs and EVs on domestic electricity network charges: A case study from Great Britain. Energy Policy 2019, 127, 412–424. [Google Scholar] [CrossRef]
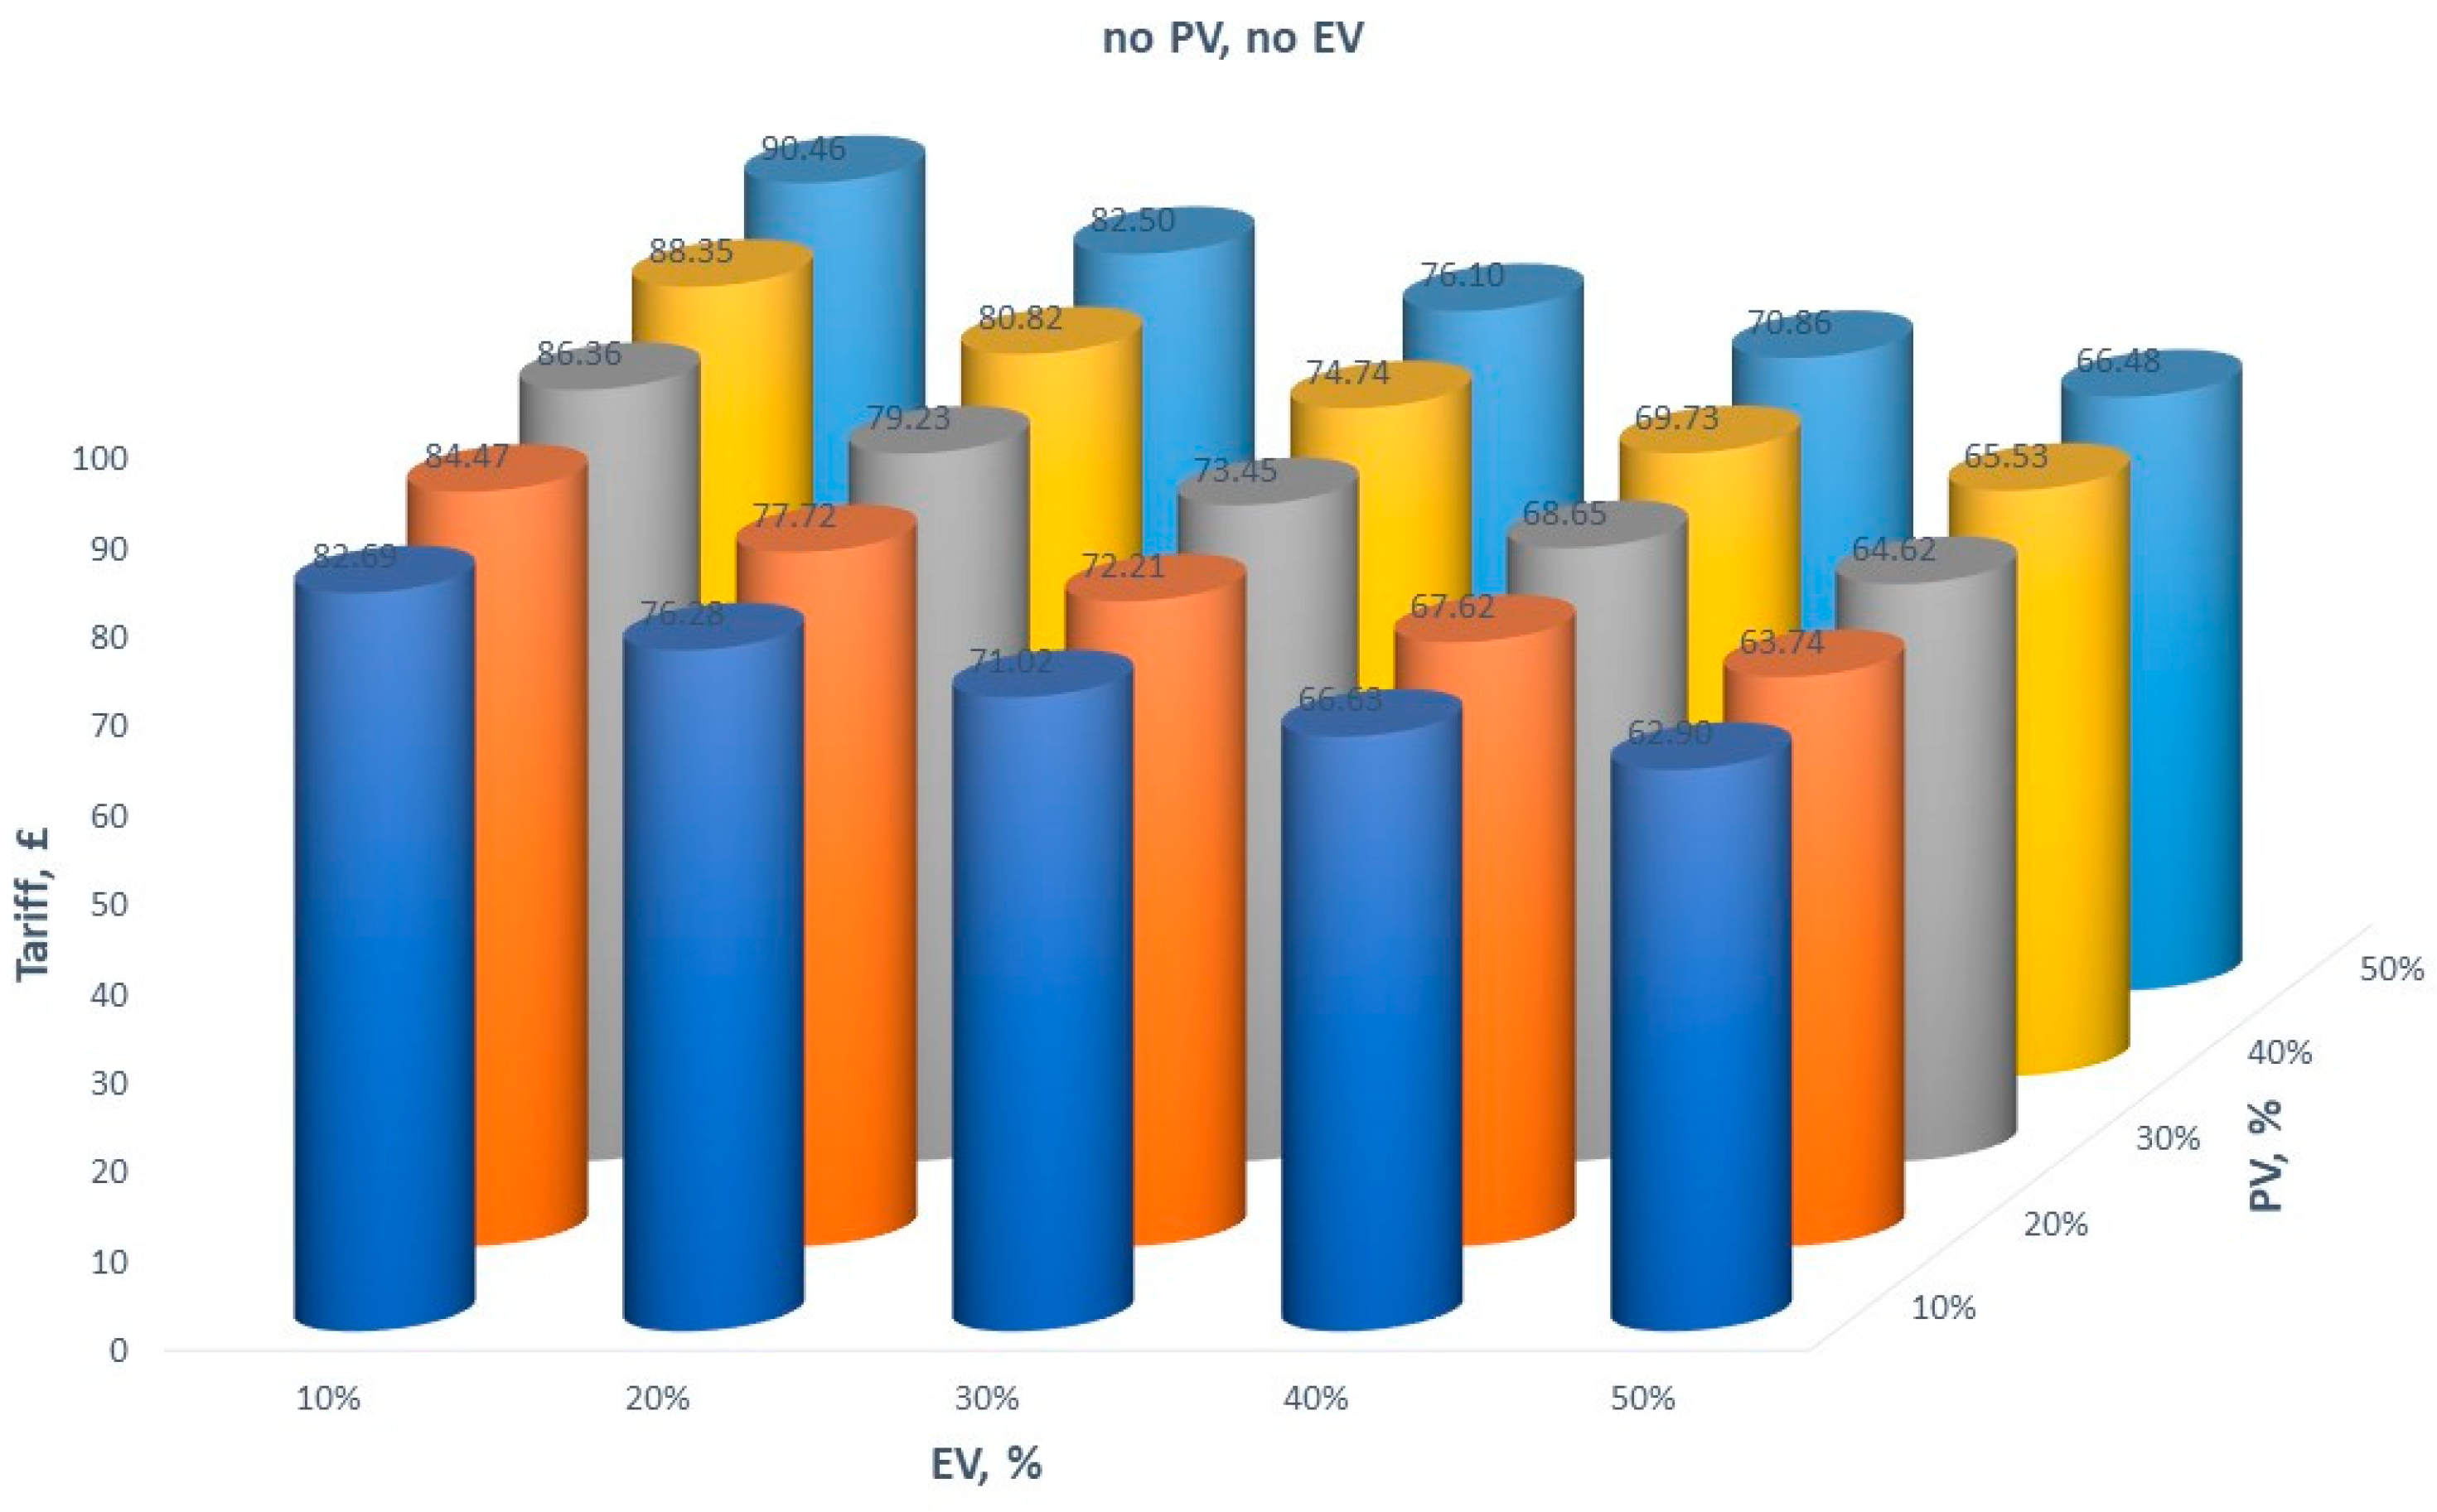
Figure 1. Distribution tariffs for households with no EV and no PV. Source: Own results.
Energies 12 01392 g001
Figure 2. Distribution tariffs for households with PV and no EV. Source: Own results.
Energies 12 01392 g002
Figure 3. Distribution tariffs for households with no PV and EV. Source: Own results.
Energies 12 01392 g003
Figure 4. Distribution tariffs for households with PV and EV. Source: Own results.
Energies 12 01392 g004
Table 1. Share of installations and total installed capacity: a case of the United Kingdom.
RegionShare of InstallationsTotal Installed Capacity (TIC)
South East12.97%11.52%
North East5.61%3.73%
East of England12.25%11.63%
East Midlands10.06%10.64%
North West10.13%7.43%
London2.68%1.97%
South West14.46%18.74%
West Midlands8.14%7.42%
Yorkshire and The Humber9.88%8.71%
Scotland7.15%11.49%
Wales6.63%6.65%
Source: adapted from [69].
Table 2. UK households’ savings from installing PVs and using the Feed-in Tariff (FITs) scheme.
CharacteristicsSunderlandDurhamYork
Energy performance certificate band *D or higherE or lowerD or higher
Roof angle30°70°50°
Shadingvery littlesignificantheavy
Roof pointing atsouthnorthsouth
Installation sizesmallmediumsmall
Peak generation in kW1.5 kWp2.0 kWp1.5 kWp
Monthly electricity bill£61£80£55
Generation tariff4.32p/kWh0.74p/kWh4.32p/kWh
Annual payment (generation tariff)£55£3£27
Annual fuel bill savings£44£16£22
Export tariff4.91p/kWh4.91p/kWh4.91p/kWh
Annual payment (export tariff)£31£11£16
Total payments and savings£131£30£65
* Note: EPCs describes how energy efficient a building is in a scale from A (very efficient) to G (inefficient). In order to get FITs at the standard rate for solar PV, the property needs to have an EPC of band D or better. Source: adapted from [72].