Article

On-Board Energy Storage Devices with Supercapacitors for Metro Trains—Case Study Analysis of Application Effectiveness

Electric Traction Division, Power Engineering Institute, Warsaw University of Technology, Koszykowa Street 75, 00-662 Warsaw, Poland
*
Author to whom correspondence should be addressed.
Energies 2019, 12(7), 1291; https://doi.org/10.3390/en12071291
Submission received: 17 February 2019 / Revised: 18 March 2019 / Accepted: 2 April 2019 / Published: 4 April 2019
(This article belongs to the Special Issue Modelling and Analysis of Distributed Energy Storage)

Abstract

:
This paper presents an analysis on using an on-board energy storage device (ESD) for enhancing braking energy re-use in electrified railway transportation. A simulation model was developed in the programming language C++ to help with the sizing of the ESD. The simulation model based on the mathematical description has been proposed for a train equipped with on-board ESD for analysis of effectiveness of its application. A case study was carried out for a metro line taking into consideration train characteristics, track alignment, line velocity limits and a running time table. This case study was used to assess the energy savings and perform a cost-benefit analysis for different sizes of the on-board ESD by applying the proposed approach. It was shown that when additional environmental benefits (reduction of CO2 emissions) are considered, this may significantly improve effectiveness of the investments due to CO2 European Emission allowances.

1. Introduction

Railway transportation generates 3.6% of the total CO2 emissions from the transport sector and constitutes 2.1% of the total transport energy consumption [1]. Research in this area focuses on producing energy efficient trains by reducing the losses in converting the energy and minimizing train auxiliary consumption [2]. The main challenge is to reuse the braking energy from the train by feeding it back to the network or storing it for later use [3,4,5,6,7,8]. The braking energy can be stored in stationary or on-board energy storage devices (ESD). The costs of the on-board ESDs may be higher than of way-side ESDs because they have to be embedded on every train instead of being placed at certain stations [9]. The drawback of the stationary ESD [10,11,12] is that the regenerated energy is sent via contact lines, which results in line losses. These losses can be reduced by using on-board ESDs [13]. If the ESD is used on-board (distributed ESD), the power and required energy capacity is lower than for stationary ESD (centralized ESD) which results in lower initial costs, making such a solution more practical. An advantage of the on-board ESD [14] is that in an event of a line power loss, the train is still able to be driven to a safe place allowing passengers to disembark [15] or to be evacuated from a tunnel in an emergency. Additional advantages of on-board ESD are as follows [16]:
  • reduction of peak-power demand and AC power supply of traction substations;
  • reduction of energy losses in catenary;
  • usage of a specific train’s on-board ESD by other trains;
  • reduction of maximum currents taken by trains from catenary (reduction of voltage drops in rails and stray currents);
  • reduction of over-voltages in a catenary;
  • opportunity to increase density of trains on the network without modernization of the power supply.
The main challenge in designing an on-board ESD is how to size it correctly as it depends on the vehicle characteristics and line details. The size will affect the payback period of the ESD and its ability to provide a return on investment. To help the designer make the best decision when designing an on-board ESD for a train, a simulation tool is needed. The simulation tool should be simple and efficient to use.
In [17] the authors developed a simulation model of a single train simulator in Matlab/Simulink with the scope to analyse the performance of a tramway with an on-board ESD. An energy management strategy method is developed for predefined velocity cycles of a tramway. In the model the authors use predefined input power profiles measured in the Seville tramway and successfully determined the optimal size for the ESD. The model limitations are that the input data needs to be measured from the existing functional system, which limits the model functionality to a specific route and train. If a new system is to be designed, a simulation model is needed with the functionality to determine the train power profiles for different route options.
The authors in [18] propose a Matlab/Simulink model for a metro-train simulator with an on-board ESD to reduce the network power demand and save energy. The Simulink model is interconnected with a physical model of a 3-phase motor-generator and an inverter that generates the current and power profiles for the simulation.
The scope of this paper is to present a simulation tool that incorporates all the requirements to design a functional train model, with an on-board ESD, that can be implemented in a programming language like C++ for its application in a physical rail transport system. The model formulas are presented and discussed in following sections. The accuracy of the train model is affected by the accuracy of the input data provided by the train and ESD manufacturers.
The main contributions of this paper are:
  • the proposal of a mathematical model and its application for analysis of an electrified urban railway system with on-board ESD; presentation of the simulation tool with its application for finding optimized solution for an on-board ESD that focuses on:
    reducing the cost,
    saving energy and improving ESD application effectiveness,
    considers the benefits due to CO2 emission reduction.
  • presentation and discussions of conclusions from a case study—application of the developed tool to analyse the effectiveness of installing an ESD on-board trains in a real metro system. This includes a presentation of influence of energy cost—with stabile or a sudden increase in energy prices and current costs of the European Emission allowances considered.
The paper is organized as follows: in Section 2, the model equations are presented, and the input/output data are discussed together with the model constraints and assumptions. In Section 3, the model equations are implemented in the programming language C++ describing the program working procedures. In Section 4, the authors propose a new optimization method for sizing the ESD and reducing the costs. Finally, in Section 5 a case study has been done for an assumed metro line and different ESD sizes have been analysed. To choose the most cost-effective option, a cost analysis has been made taking into consideration the energy price per kWh in Poland, with a sudden increase expected in 2019. A method has been proposed for the recuperation of train braking energy to improve the energy efficiency of the traction supply system. This gives additional environmental benefits by reducing the CO2 emissions, what presents benefits in a decrease of European Emission allowances for CO2 emission. Thus, return of the investment can be improved. The conclusions resulting from the work are presented in Section 6.

2. Mathematical Model

2.1. Model Input/Output Data and Limitations

To model the train energy consumption and regenerative braking a single train simulation tool (Modeltrack) was developed in the C++ language. Using Modeltrack it is possible to model different train’s traction characteristics and on-board ESD for all types of electrical traction systems (AC & DC). The simulation tool can be used to calculate the train braking energy losses (on the rheostat) [19,20] and the energy savings by using an on-board ESD. The simulation time step is one second and the system impedance is not modelled allowing the software to eliminate the errors that are generated by time/distance approximations.
The model input data that can be used in the simulation model include:
  • Vertical and horizontal track alignment;
  • Train resistance to motion against velocity;
  • Rotating mass factor;
  • Velocity limitation;
  • Dwell time (time for passengers boarding/disembarking);
  • Tractive effort and braking effort curves;
  • Mass of the train including carriages and passengers;
  • Maximum acceleration and service braking rate;
  • Train motor efficiency;
  • Train braking efficiency;
  • Train auxiliary power demand;
  • Power and energy capacity of the onboard ESD with supercapacitors (SC);
  • ESD efficiency (including invertor and SC losses for charging and discharging);
  • ESD initial state of charge (SOC) and depth of discharge (DOD).
The model output data that are obtained from the simulation model cover:
  • The train output data: speed, distance, power, energy, energy lost on braking rheostats as a function of time (1 s);
  • The ESD output data: SOC, energy;
  • The average values for a train running between two stations: average speed, distance, travel time, energy lost on braking rheostats and total energy saved by the on-board ESD.
To correctly assess the output data, we need to know the constraints and assumptions of the simulation model. The simulation model has the following constraints and assumptions:
  • The railway signalling system is not considered;
  • The train coasting mode is not considered;
  • The mechanical braking is not considered to simplify the model and decrease the simulation time. This is a conservative approach and will not have a significant effect on the output results [18].
  • It is assumed that the energy regenerated by the braking train is all used by the train and is not sent back to the catenary. The regenerated energy is considered to supply first the on-board auxiliary equipment (heating, ventilation lighting) and the remaining energy to be stored by the ESD. If the ESD SOC is 100% or the braking power is too high, the remaining energy will be lost in the braking rheostat.

2.2. Model Equations

The running resistance opposing the train motion is the sum of the three main resistances:
  • resistance to motion, described by the Davis Equation (1) [21,22]; where the coefficients k0, k1, k2, are constants calculated or given by the train manufacturer for the static resistance, train resistance and aerodynamic resistance respectively.
  • vertical resistance to motion, which depends on the track gradient (3) [22,23];
  • horizontal resistance to motion, which depends on the radius of the track (4) [21,22]:
F d = k 0 k 1 × v k 2 × v 2
Fd—rolling resistance at different velocities (N), v —train velocity (m/s), k0, k1, k2—coefficients of resistance to motion:
m t = m r + m p + m ESD
m t —total mass of the train (kg), m r —mass of the train (kg), m p —mass of the passengers (kg), m ESD —ESD mass (kg).
In Equations (3) and (4) the total mass of the train is given in tonnes:
F i = m t × g × i
F i —vertical resistance (N), g—constant gravitational attraction (m/s2), i—gradient (%):
F r = 7000 R r 20 × m p  
F r —horizontal resistance (N), Rr—radius (m).
The total resistance of the running train is calculated using Equation (5):
F t = F d + F i + F r
F t —total resistance (N).
The total mass of the train for acceleration, constant velocity and braking is calculated considering the rotating mass coefficient:
m tr = m t × r m
m tr —total mass of the train considering the rotating mass parameter (kg), r m —rotating mass coefficient.
The train journey can be divided in three main stages: acceleration, constant velocity and braking. The train motion equations for these stages are given by the Lomonossoff’s equation [23] and described in the next sections of this article.
The train coasting mode has been omitted in this model because the model is focused on achieving the shortest journey time (maximum tractive force applied) which is the worst-case scenario (maximum power demand and energy consumption) for the supply system. In the metro underground transport, the distance between stations is approximately 1–2 km and there are few speed limitations to allow the train driver to use the coasting mode. The coasting mode is often used in heavy rail transport where the distances between stations are considerable.

2.2.1. Acceleration Equations

For train acceleration (a ≠ 0), Equation (7) is used to calculate the distance travelled:
a = T e   F t m tr
a—train acceleration at different velocities (m/s2), Te—train tractive effort (N).
t a = v 2   v 1 a
ta—time of a train to accelerate from one velocity to the next (s), v 1   and   v 2 —train velocity for different durations (m/s):
s a = ( v 1 × t ) × ( a ×   t 2 2 )
sa—distance travelled by train during acceleration (m).
P a = ( T e ×   v a η t ) + P aux
Pa—train electrical power demand during acceleration (W), ηt—efficiency of the train motors at different velocity (%), v a —train velocity at a tractive effort (m/s), Paux—train auxiliary power (W).
E a = i = 1 n P a ( Δ t i ) × Δ t i
E a —electrical energy used by train for acceleration (Wh), ∆ti—time step (s), n—number of acceleration steps.

2.2.2. Constant Velocity Equations

For train constant velocity (a = 0), the Equation (12) is used to calculate the distance travelled:
s c = v c ×   Δ t
sc—distance travelled by a train during constant velocity (m), vc—train constant velocity (m/s).
t c = s c   v c
tc—duration at constant velocity (s).
P c = ( T e ×   v c η t ) + P aux
Pc—electrical power demand for constant velocity (W).
E c = i = 1 n P c ( Δ t i ) × Δ t i
Ec—electrical energy used by a train for constant velocity (Wh), ∆ti—time step (s), n—number of constant velocity steps.

2.2.3. Braking Equations

For train braking (a ≠ 0), the Equation (16) is used to calculate the distance travelled:
d = B e +   F t m tr
d—train braking rates at different velocities (m/s2), Be—train braking effort (N).
t d = v 1   v 2 a
td—time taken to brake from one velocity ( v 1 ) to the next ( v 2 ) (s).
P c = ( T e v c η t ) + P aux
sd—distance travelled by a train during braking (m).
P c = ( T e v c η t ) + P aux
Pd—electrical power generated during braking (W).
E d = i = 1 n P d ( Δ t i ) × Δ t i
Ed—train energy for braking (Wh), ∆ti—time step (s), n—number of braking steps.

2.2.4. Total Trip Equations

The total distance travelled (21) and duration (22) of train travel during acceleration, constant velocity and braking is calculated from Equations (9), (12) and (18):
s t = s a + s d + s c
st—total distance travelled by the train (m).
t t = t a + t d + t c
tt—total duration to travel the distance (st) by a train (s).
The train energy demand (23) during acceleration and constant velocity is calculated with Equations (11) and (15):
E t = E a + E c
Et—train total energy demand (Wh).

2.2.5. ESD Energy and Power Equations

The ESD storage elements are low voltage (e.g., 9 V, 12 V, 24 V batteries; 2.5 V supercapacitors) and are connected in series in pre-manufactured modules. Depending on the ESD required voltage these modules are connected in series to form a string and placed in parallel to get the required energy. To control the power flow between the ESD and the train, a converter is used which works in boost mode when the ESD is discharging (the train is motoring) and buck mode when ESD is charging (the train is braking). The ESD energy is calculated using Equation (24) and ESD power is calculated with Equation (25):
E ESD = P ESD × Δ t
EESD—ESD energy (Wh), PESD—ESD power (W).
P ESDs = P ESD × η ESD
PESDs—ESD actual power used for regeneration (W), η ESD —efficiency of the ESD (for invertor and storage elements charging and discharging) (%).
The total energy that is discharged from the storage elements is limited by SOC (%) control and is reduced to 50% to extend the supercapacitor lifetime and increase efficiency. If the ESD storage elements voltage is too low the losses are high due to the high discharging currents:
E ESD = ( P ESD × t ESD ) × SOC
EESDs—ESD actual energy saved from train braking regeneration (Wh), t ESD —duration of ESD charging/discharging.
P rht = P d P ESDs η ESD P aux
Prht—power lost on the train braking rheostat (W).
E rht = P rht × Δ t
Erht—energy lost on the train braking rheostat (Wh).
The useful energy in the ESD for a time period can be calculated as in (29) (Umin—is the minimum discharging voltage (V), Umax—is the nominal voltage (V), C—is the ESD capacity (F)).
E ESDus = 1 2 × C × ( U max 2 U min 2 )
The ESD voltage for the charge/discharge time t1 can be calculated as below:
U ESD 1 = E ESDt 1 C × 1 2

3. Software Implementation

The simulation tool (Modeltrack) was created in the ‘DEV C++’ [
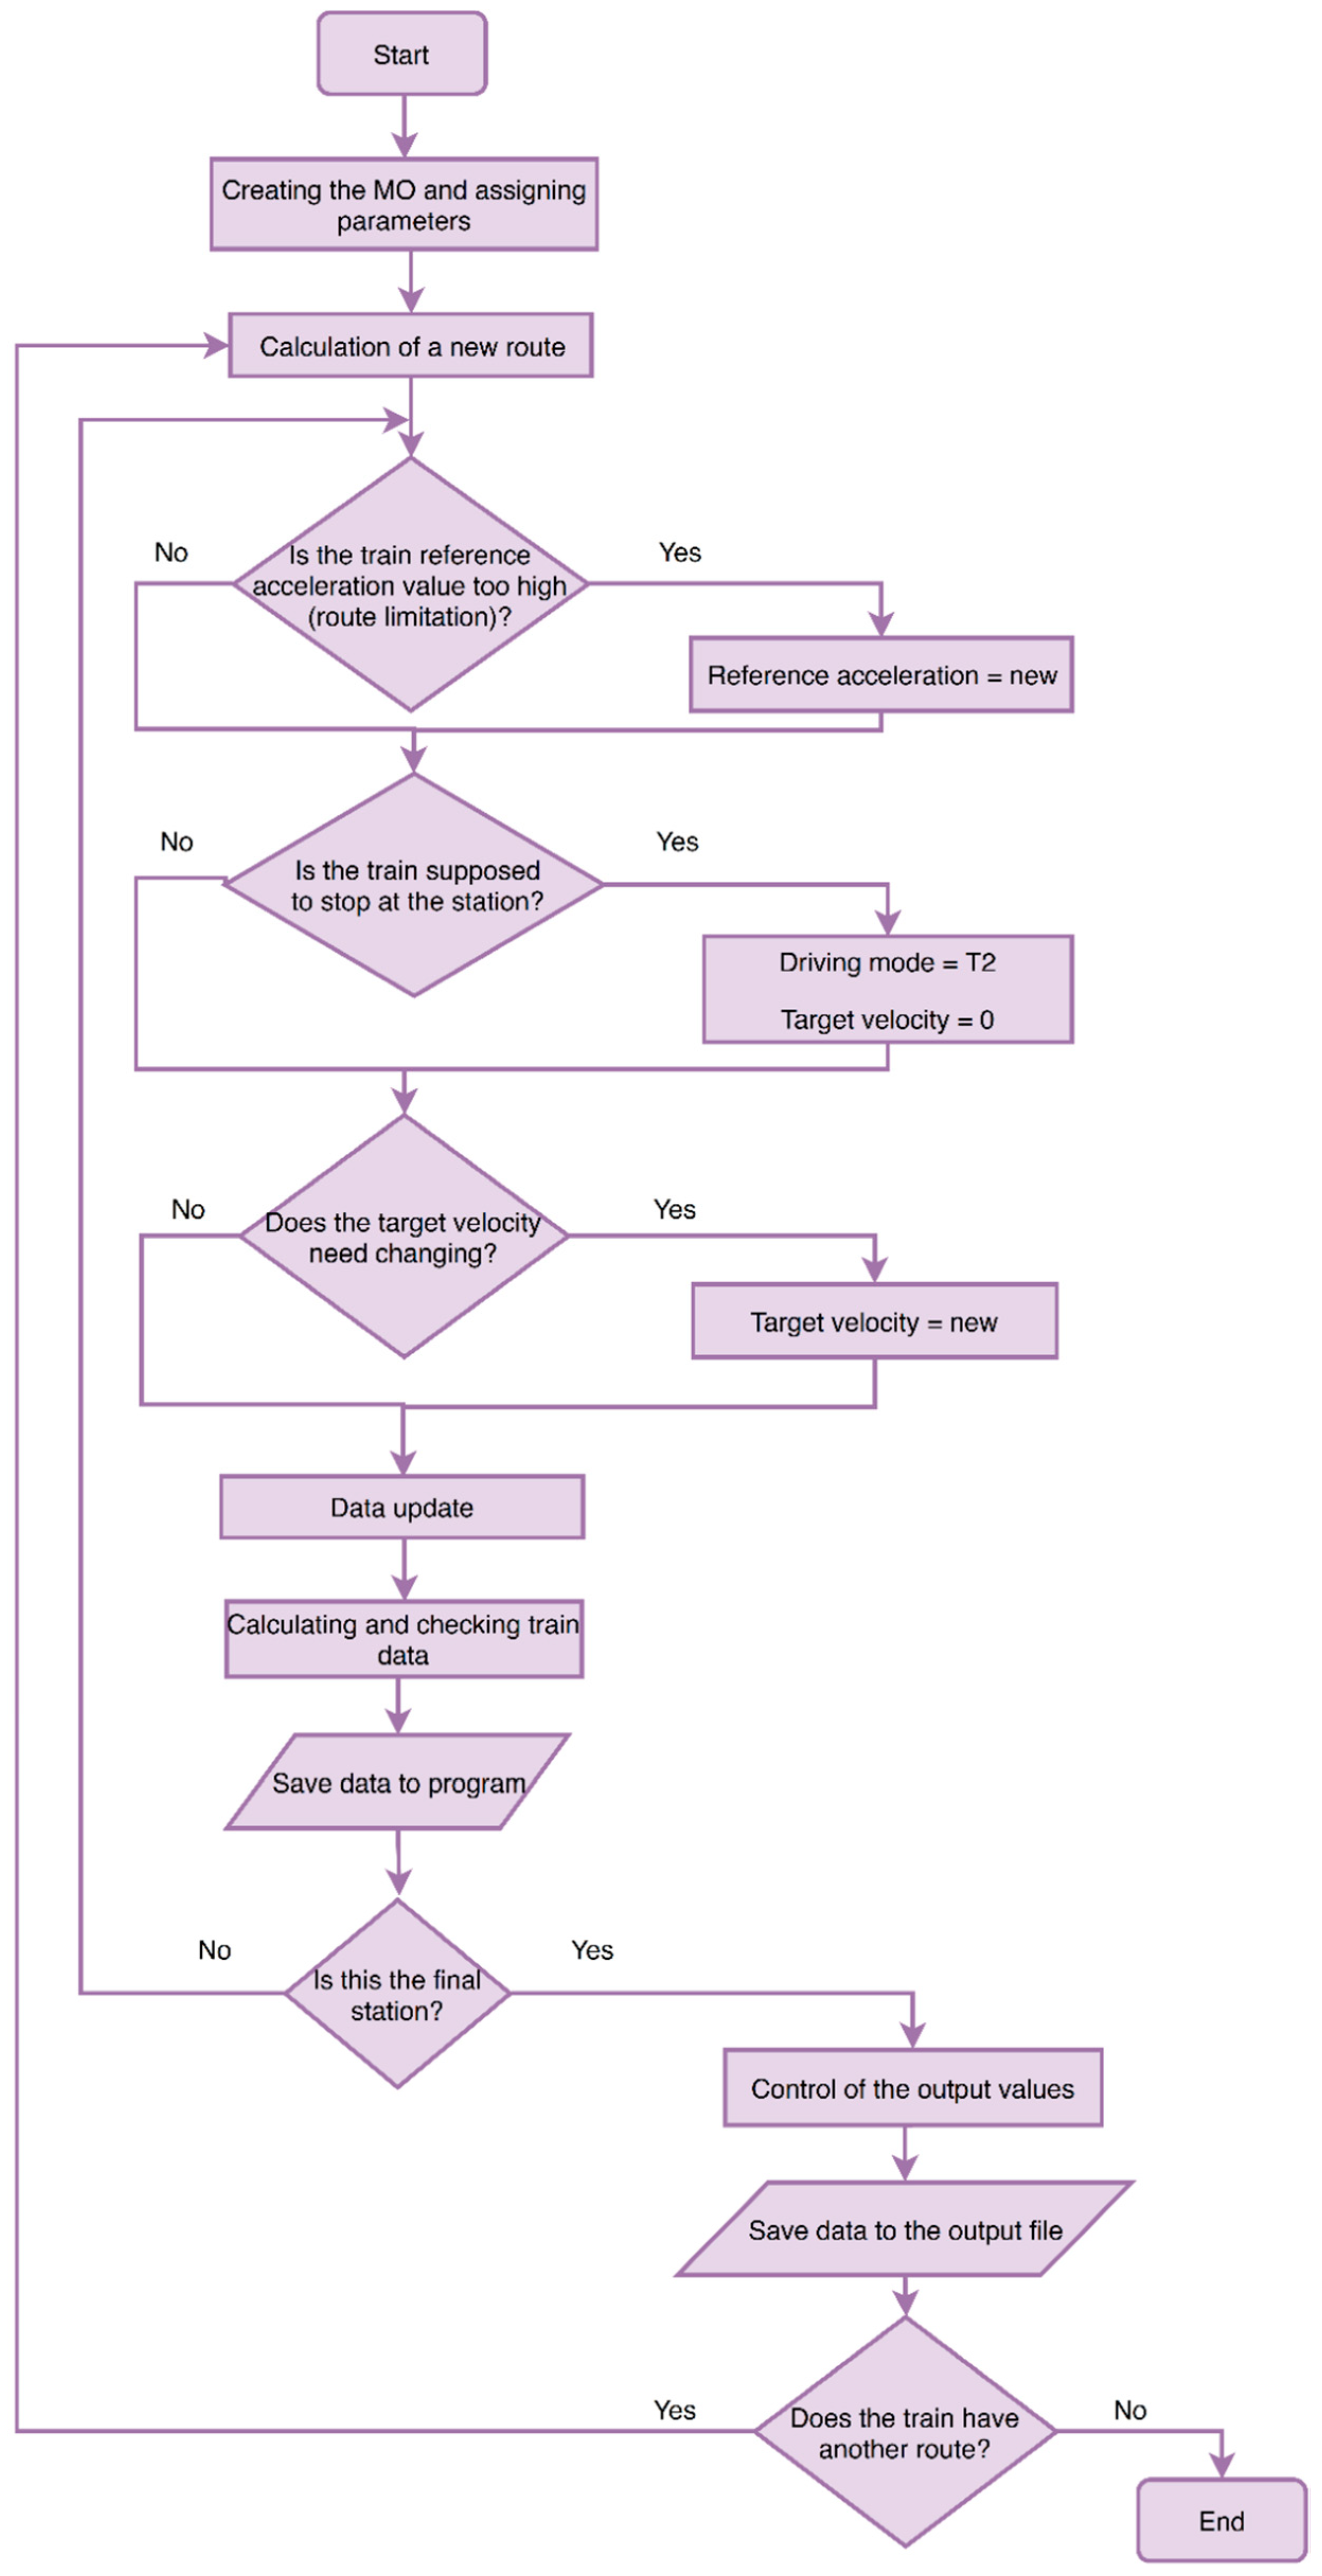
24] program. Modeltrack simulates a route of 6.9 km with seven train stations and on-board ESD in less than 1 s of a computer operation (650 s route time). The program creates a main object (MO, a train) with properties taken from input files and sets its initial parameters (Figure 1). The program prepares two loops serving the route based on input data. First loop chooses the line by identifying the starting and finishing station. The second loop is the main loop counting MO data and checking the route between the stations.
In the main loop, the appropriate procedures are carried out sequentially as below:
Step 1: The program checks if it should start braking for to stop at the station—the procedure is to calculate trains’ braking distance from the current position. The procedure is performed when target velocity at the current position (needed to stop at the station) and actual velocity at the current position are different, then MO starts braking to meet its new target velocity. The acceleration reference value is recalculated in function of the line limitation (train running resistance) and train tractive effort [25].
Step 2: The program checks if it should change the target velocity—the procedure takes place when the train has not yet started braking for the next stop or its velocity at a given moment of the route is 0. The procedure covers checking the current velocity restriction on the route from the input data, then it calculates at which moment the train will have a new target velocity. If the train is travelling on a line section with no velocity restriction the program will assign an appropriate target velocity.
Step 3: Update of the data responsible for the MOs’ resistances to motion—the procedure checks and calculates the current horizontal and vertical resistance acting on the MO. Therefore, new values of acceleration and delays are calculated.
Step 4: Counting control function—this sets the MO driving mode, i.e., whether the MO must brake (T2), accelerate (T1) or drive at a constant velocity (T0):
  • When the current velocity is smaller than the target velocity—the driving mode is T1;
  • When the current velocity is greater than the target velocity—the driving mode is T2;
  • When the current velocity is equal to the target velocity—the driving mode is T0.
Furthermore, the function calculates the use and loading of the ESD and the remaining MO values according to current data: energy, power, forces, current, time and prepares the output units value.
Step 5: Control of mean and total values—the program sums up the route values necessary to calculate the mean and total values.
The main loop is performed every meter until the train reaches the end station after its completion the program assigns the calculated values to a “csv” file type. The program calculates when the train needs to start braking to stop at the stations, it does this with an error of approximately ±2 m.

4. ESD Optimization

An optimization technique is proposed to correctly design the on-board ESD and to reduce the initial cost. The optimization technique will guarantee an optimal sizing of the ESD considering the below arguments:
  • Power and energy optimization parameters;
  • Velocity limitation parameters;
  • Cost of investment parameters.

4.1. Power and Energy Optimization Parameters

The braking power ( P d ) is obtained from the Modeltrack train simulator and the ESD charging and discharging power ( P ESD ) is based on the design of the ESD. The optimization focuses on capability of the ESD to use the train braking power (19) and store the train braking energy (20). The rest of energy that is not stored within ESD will be lost on the braking rheostats:
φ = P d P ESD P d × 100 %
The coefficient φ is the ESD power optimization parameter expressed in %. If φ is equal to 100% it means that the train braking power is equal to the ESD charging power:
= E d E ESD E d × 100 %
The coefficient is the ESD energy optimization parameter expressed in %. If is equal to 100% it means that the ESD is capable of storing all the train braking energy.

4.2. Velocity Limitation Parameters

The route velocity limitations should be considered when sizing the on-board ESD for a specific train route. If the acceleration and braking distances are too short the ESD will not be able to fully use the available energy which will result in ESD unused energy capacity. The route velocity optimization parameter γ considers the train velocity, acceleration, braking and distances for the trip stages:
γ = { f { v ,   a ,   d ,   s a , s d } γ a = v E a +   v s a                   γ d = v E d +   v s d              

4.3. Cost of Investment Parameters

The cost of investment (Ci) can be calculated as:
C i = { 0   when   n i = 0 C ESD + C inst + C ment ,   when   n i > 0 where   C ESD = ( N s × N p × C SC + C conv ) × n i
where n i is the number of motoring carriages with ESD; n i = 0 if motoring carriages are not equipped with ESD. If n i > 0 an ESD, based on supercapacitors (SC), will be installed on the train motoring carriage. The cost of an ESD installed on a motoring carriage is given by the cost Csc of an SC module multiplied by the total number of SC modules in series (Ns) and parallel (Np) plus the cost of the DC/DC converter and control system (Cconv). The total cost of investment Ci includes equipment cost (CESD), installation cost (Cinst) and maintenance costs (Cment) [26].
Total profit ( P t ) is the difference between the price of saved energy ( C Et ) expressed in $ per kWh during the installation period in years (n) and the ESD total cost of investment (C) can be calculated using Equation (35).
P t = C Et C
The price of saved energy ( C Et ) can be calculated according to the expression (36):
C Et = C E × θ × n × δ
where: C E —energy saved by the ESD during one year of functioning (kWh), θ—electricity price per kWh ($), δ—inflation of electricity price (%).
The economic efficiency optimization parameter (μ) is calculated with the following formula:
μ = C Et C C Et × 100 %
If μ is 0% it means that the saved energy price is equal to the total ESD investment cost. Additionally, application of ESD could reduce the power demand of trains and the charge per kW connected power of the traction substations supplied by power network of energy distribution operators. If the requested power is not fully used, the transport operator still must pay a fee for it. The reduction of the substation connected power fee could also be added to the total profit, but is does not fall within in the scope of this paper.

5. Case Study

The proposed ESD optimization techniques have been used for a case study on an assumed metro line, modelled in Modeltrack. The tested train is equipped with on-board ESD with a SC and no energy flow control was considered, the ESD charges from the network until between 100% and 50% of the capacity. Table 1 presents typical train parameters used for simulation purposes.
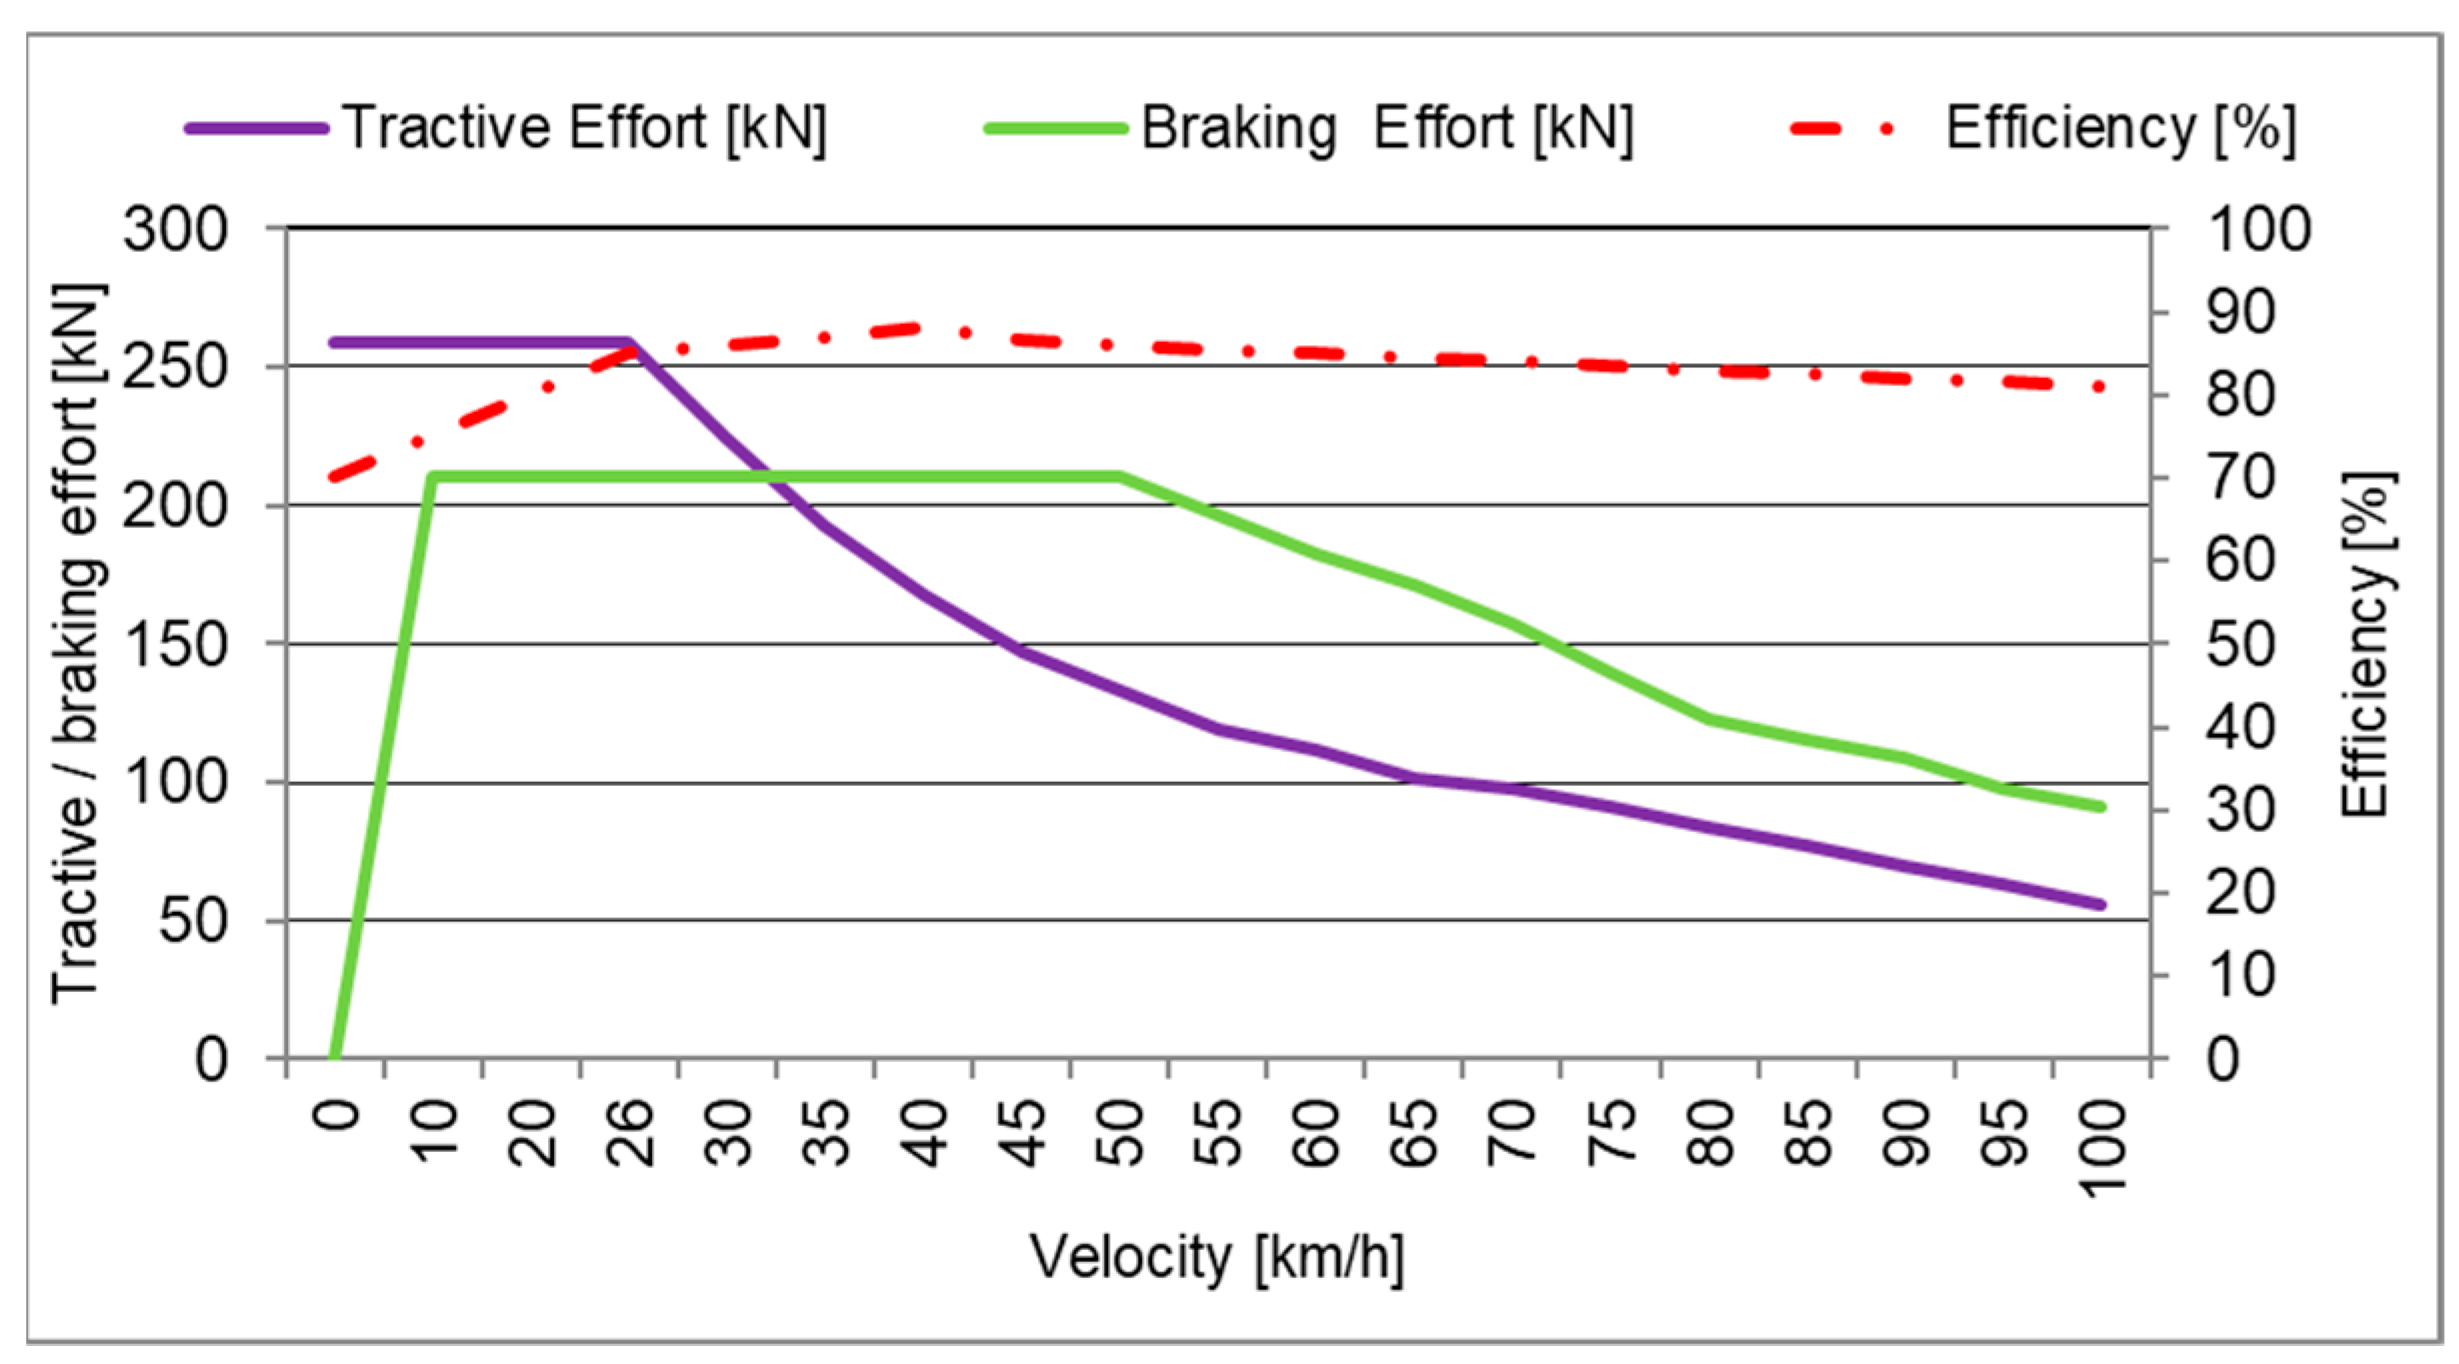
Figure 2 presents the assumed train tractive effort, braking effort and efficiency curves as a function of velocity. It can be noticed from Figure 2 that the motor efficiency depends on the velocity of the train.
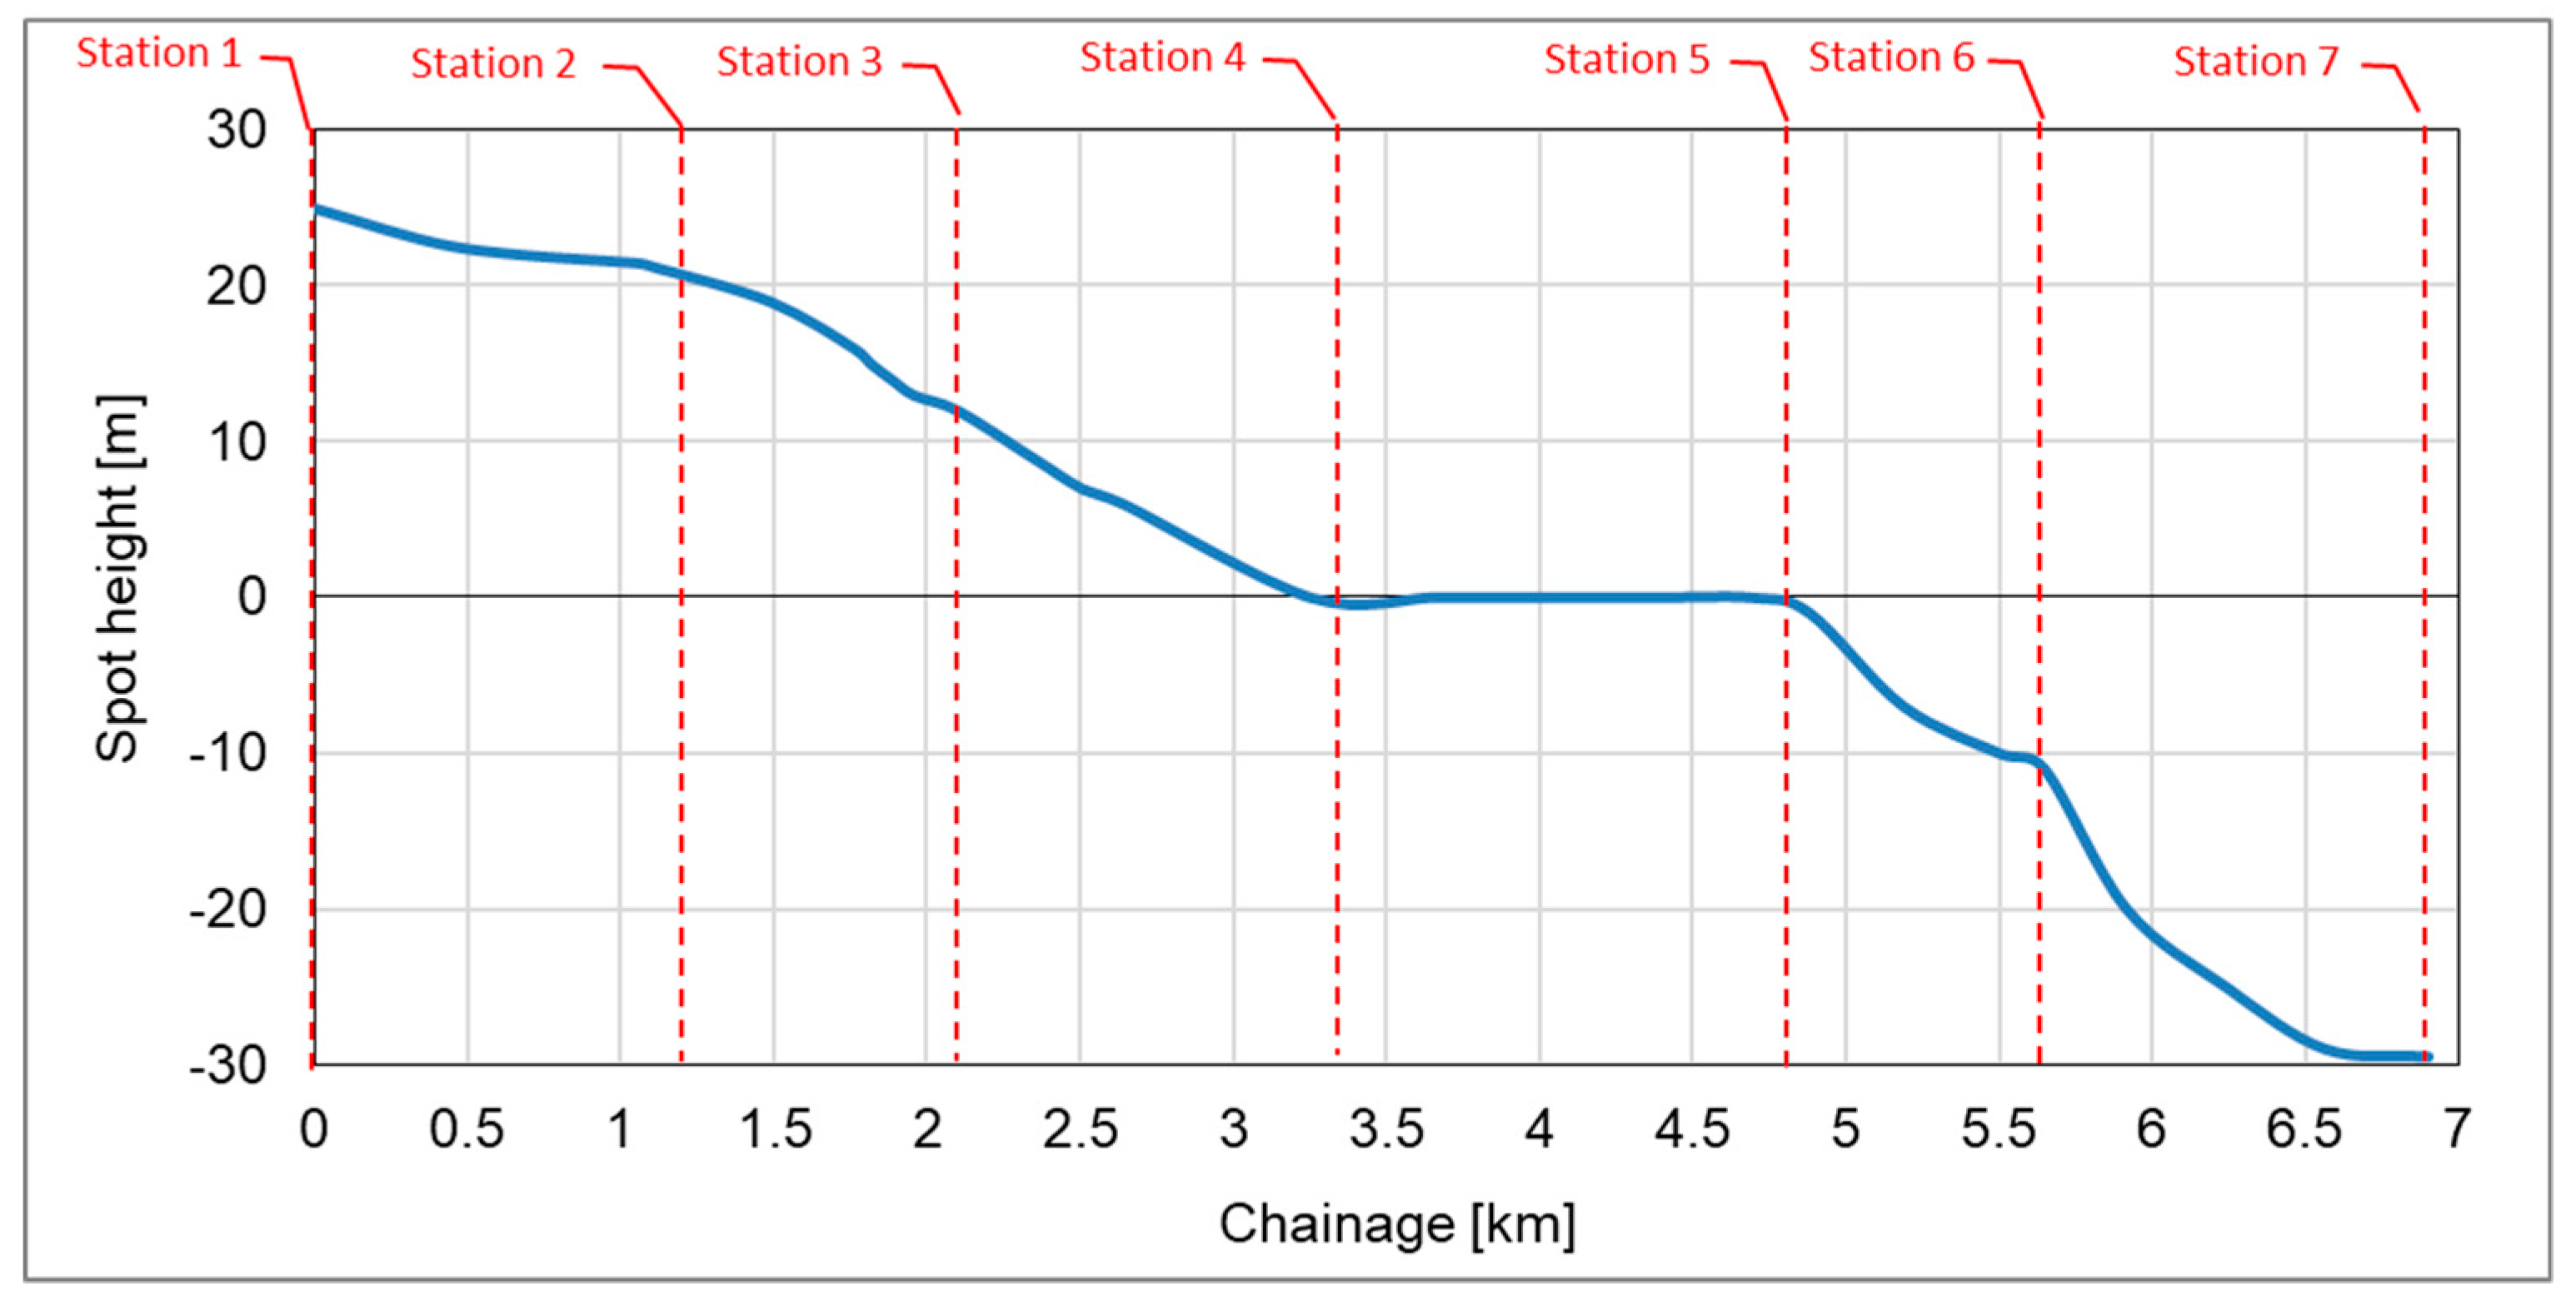
The proposed metro route gradients, stations and chainage are presented in Figure 3.
For the simulation purposes it has been considered that the train is equipped with type BMOD0063 P125 B08SC modules manufactured by the company Maxwell Technologies (San Diego, CA, USA). The module parameters are: 125 V nominal voltage, 140 A continuous current, 1900 A maximum current, 144 Wh energy capacity and 61 kg mass [27]. To achieve 750 V line voltage, 6 SC modules should be connected in series. The minimum SC voltage for a DC/DC converter to operate should not be less than 1/3 of nominal SC voltage (minimum 250 V). The SC cells suffers degradation over time, caused by current, temperature and other factors which influence the aging process (the capacity decreases and the internal resistance (ESR) increases). The aging process reduces the SC capacity by approximately 20% during the lifetime according to [28]. The SC is capable of charging and discharging a high amount of energy in a short period of time, which may influence the overall lifetime if the maximum current is exceeded [28].
The dimensions of a BMOD0063 P125 B08 SC module are: length 619 mm, width 265 mm and height 33.3 mm. The train has four motoring carriages and the SC modules are to be fixed on the roof of each carriage. Table 2 presents three different options to be analyzed for the ESD with SC.
From Table 3 it can be observed that for an ESD installed on train with four motoring carriages, the total energy capacity is 1.73 kWh for option I, 3.46 kWh for option II and 5.19 kWh for option III.
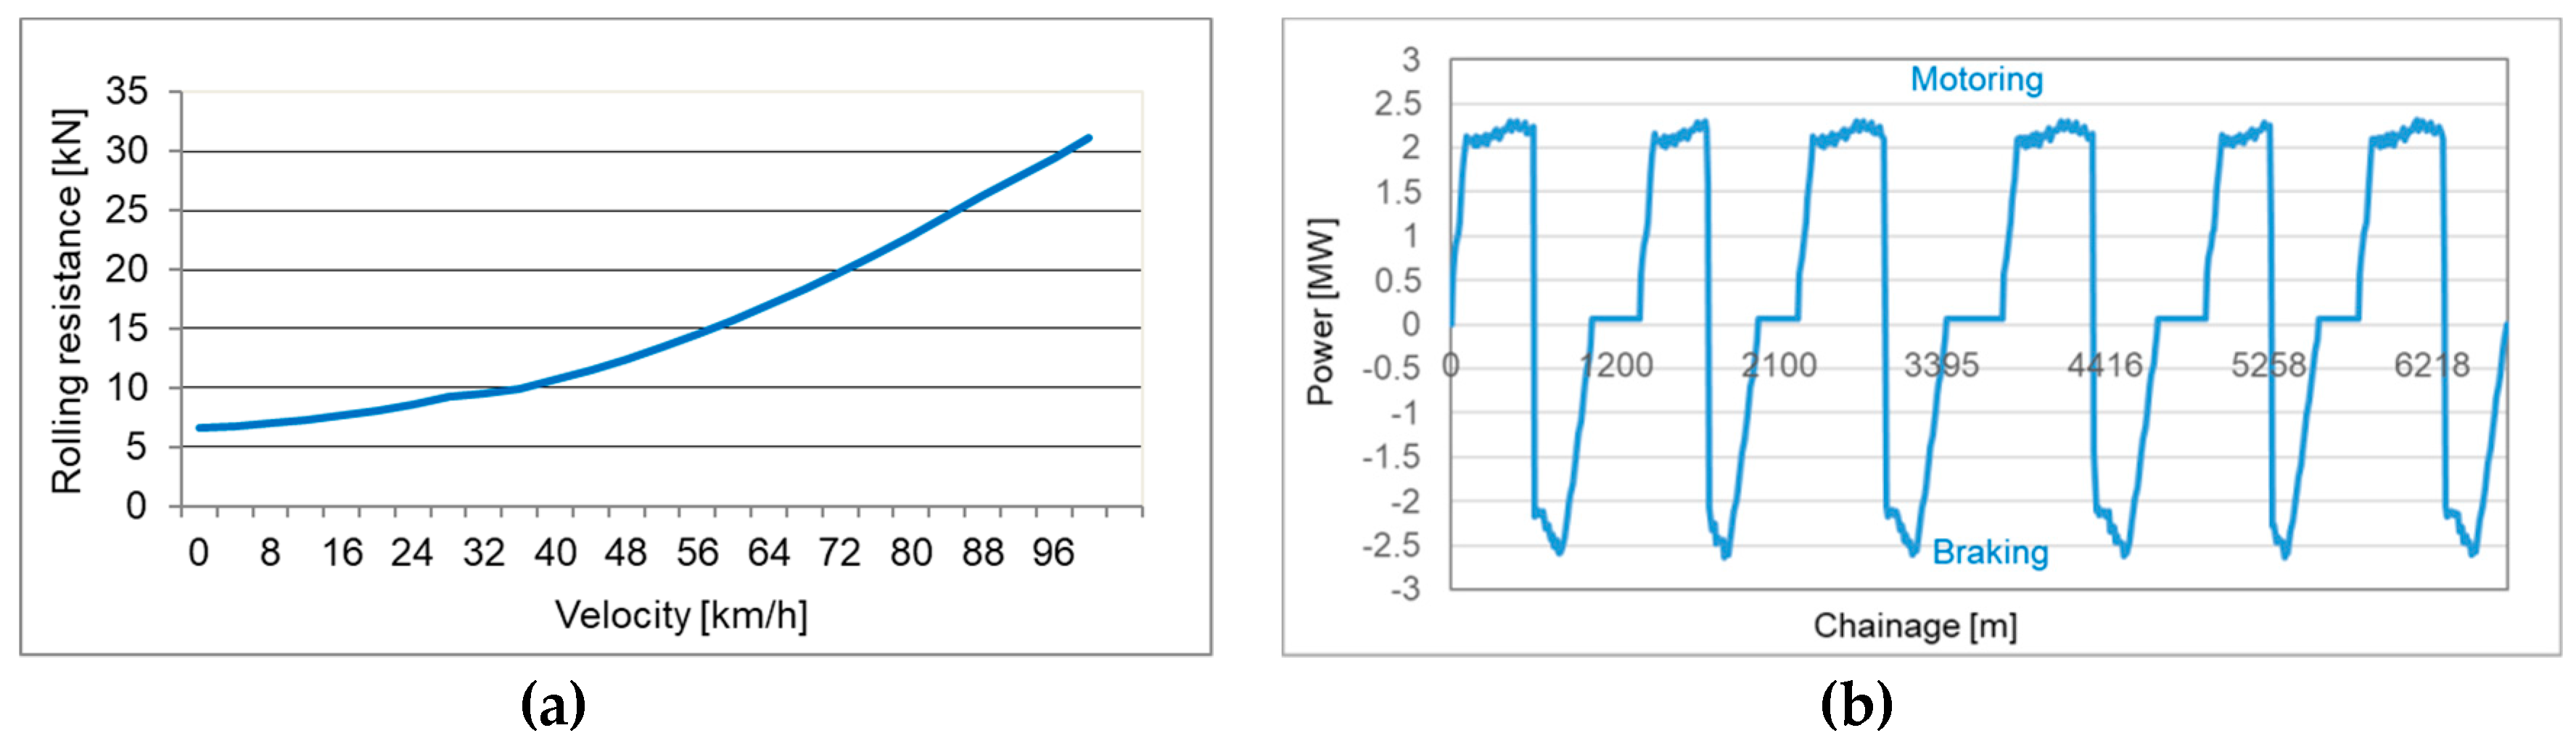
Figure 4 shows the calculated train rolling resistance against velocity and train power for braking and motoring against chainage.
The model validation is focused on assessing the impact of the model input data on the energy saving results. The following input parameters that may affect the energy savings results have been analysed:
  • different line length between train stops,
  • train maximum velocity,
  • train mass considering on-board ESD,
  • ESD energy capacity,
  • charging/discharging ESD current,
  • ESD minimum discharging voltage.
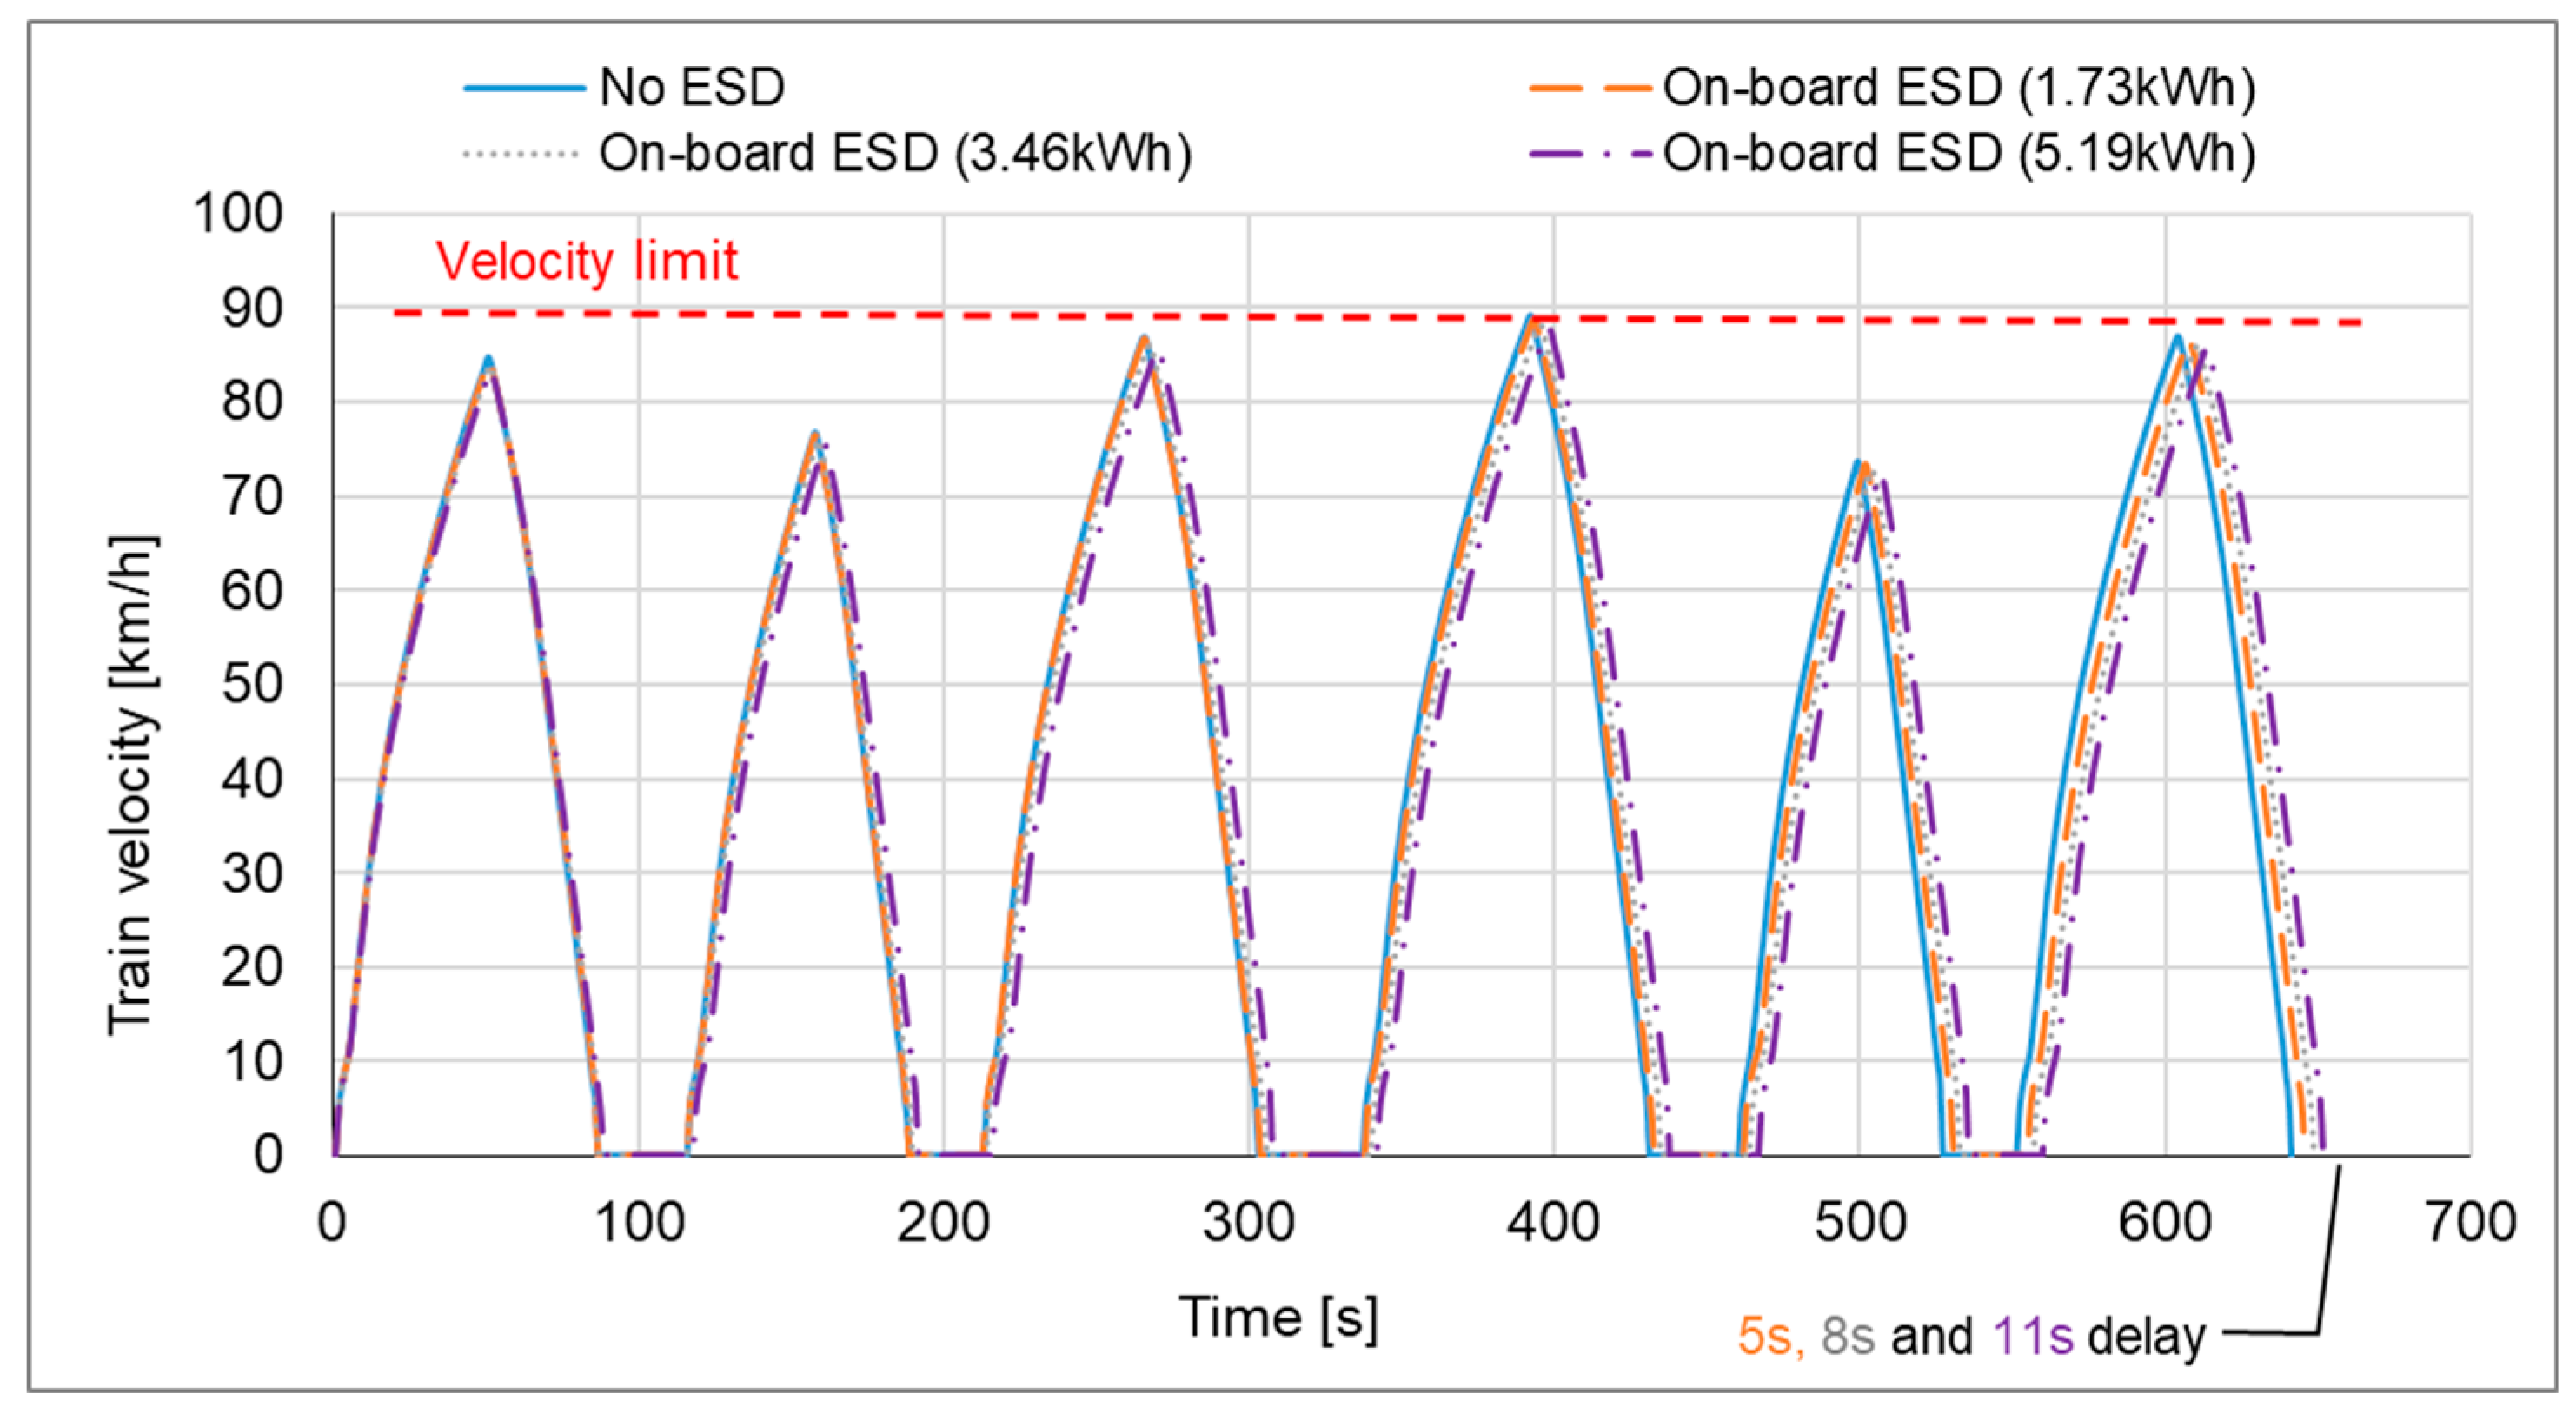
From Figure 5 can be observed that the ESD size (increased mass) has a significant effect on the train dynamics and the route travelling time. The train equipped with on-board ESD with an energy capacity of 5.19 kWh suffers an increase in weight of 13.2 tonnes (3.3 tonnes × 4 motoring carriages) which causes a total route delay of 11 s. If the ESD energy capacity is decreased to 3.46 kWh (ESD mass of 8.8 tonnes) or 1.73 kWh (ESD mass of 4.4 tonnes) the total route delay decreases to 8 s and 5 s respectively.
Table 4 presents the simulation results including time (T) and average velocity (Vavg) for a train travelling from Station 1 (S1) to Station 7 (S7).
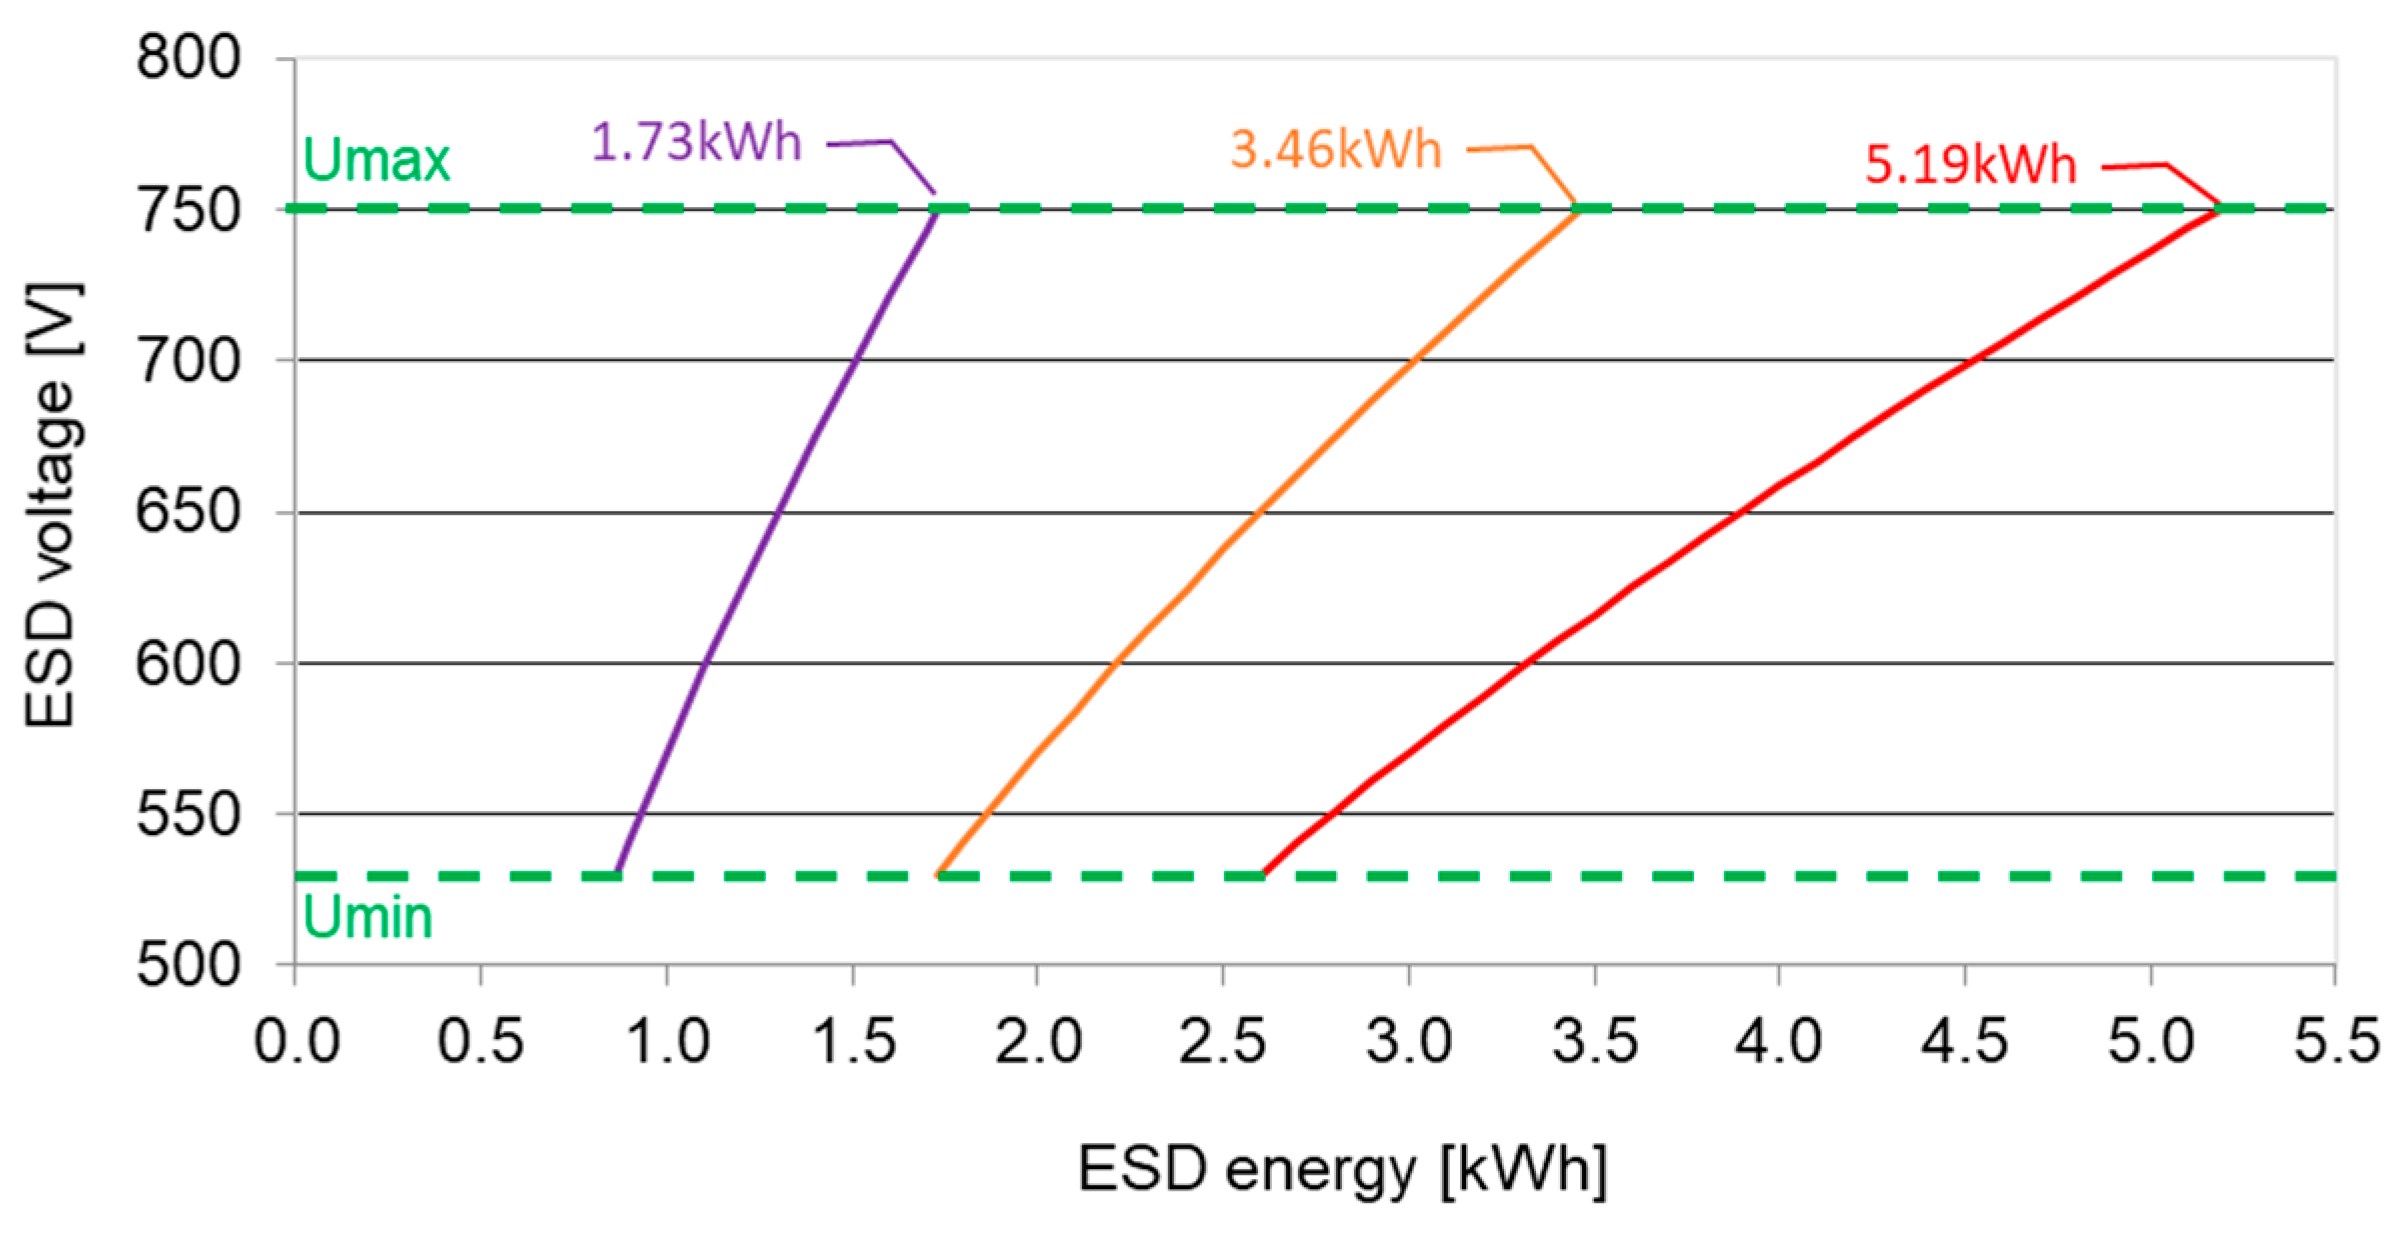
It is considered that for each ESD size, a converter is capable to keep minimum charging/discharging current corresponding to Table 3. The voltage variation on terminals of SC in ESC is assumed to be between 530 V and 750 V. From Figure 6 it may be observed that for a 50% DOD (depth of discharge) the ESD needs to discharge to 530 V which results in a 0.8 kWh of used energy for the 1.73 kWh size ESD, 1.8 kWh for the 3.46 kWh size ESD and 2.6 kWh for the 5.19 kWh size ESD.
The ESD efficiency for the SC and DC/DC converter combined is assumed to be 90% considering the energy losses for ESD charging and discharging.
The simulation results in Table 5 show that if the train is equipped with the on-board ESD the train energy demand is reduced by 5%, 10.3% and 15.7% for the different ESD sizes.
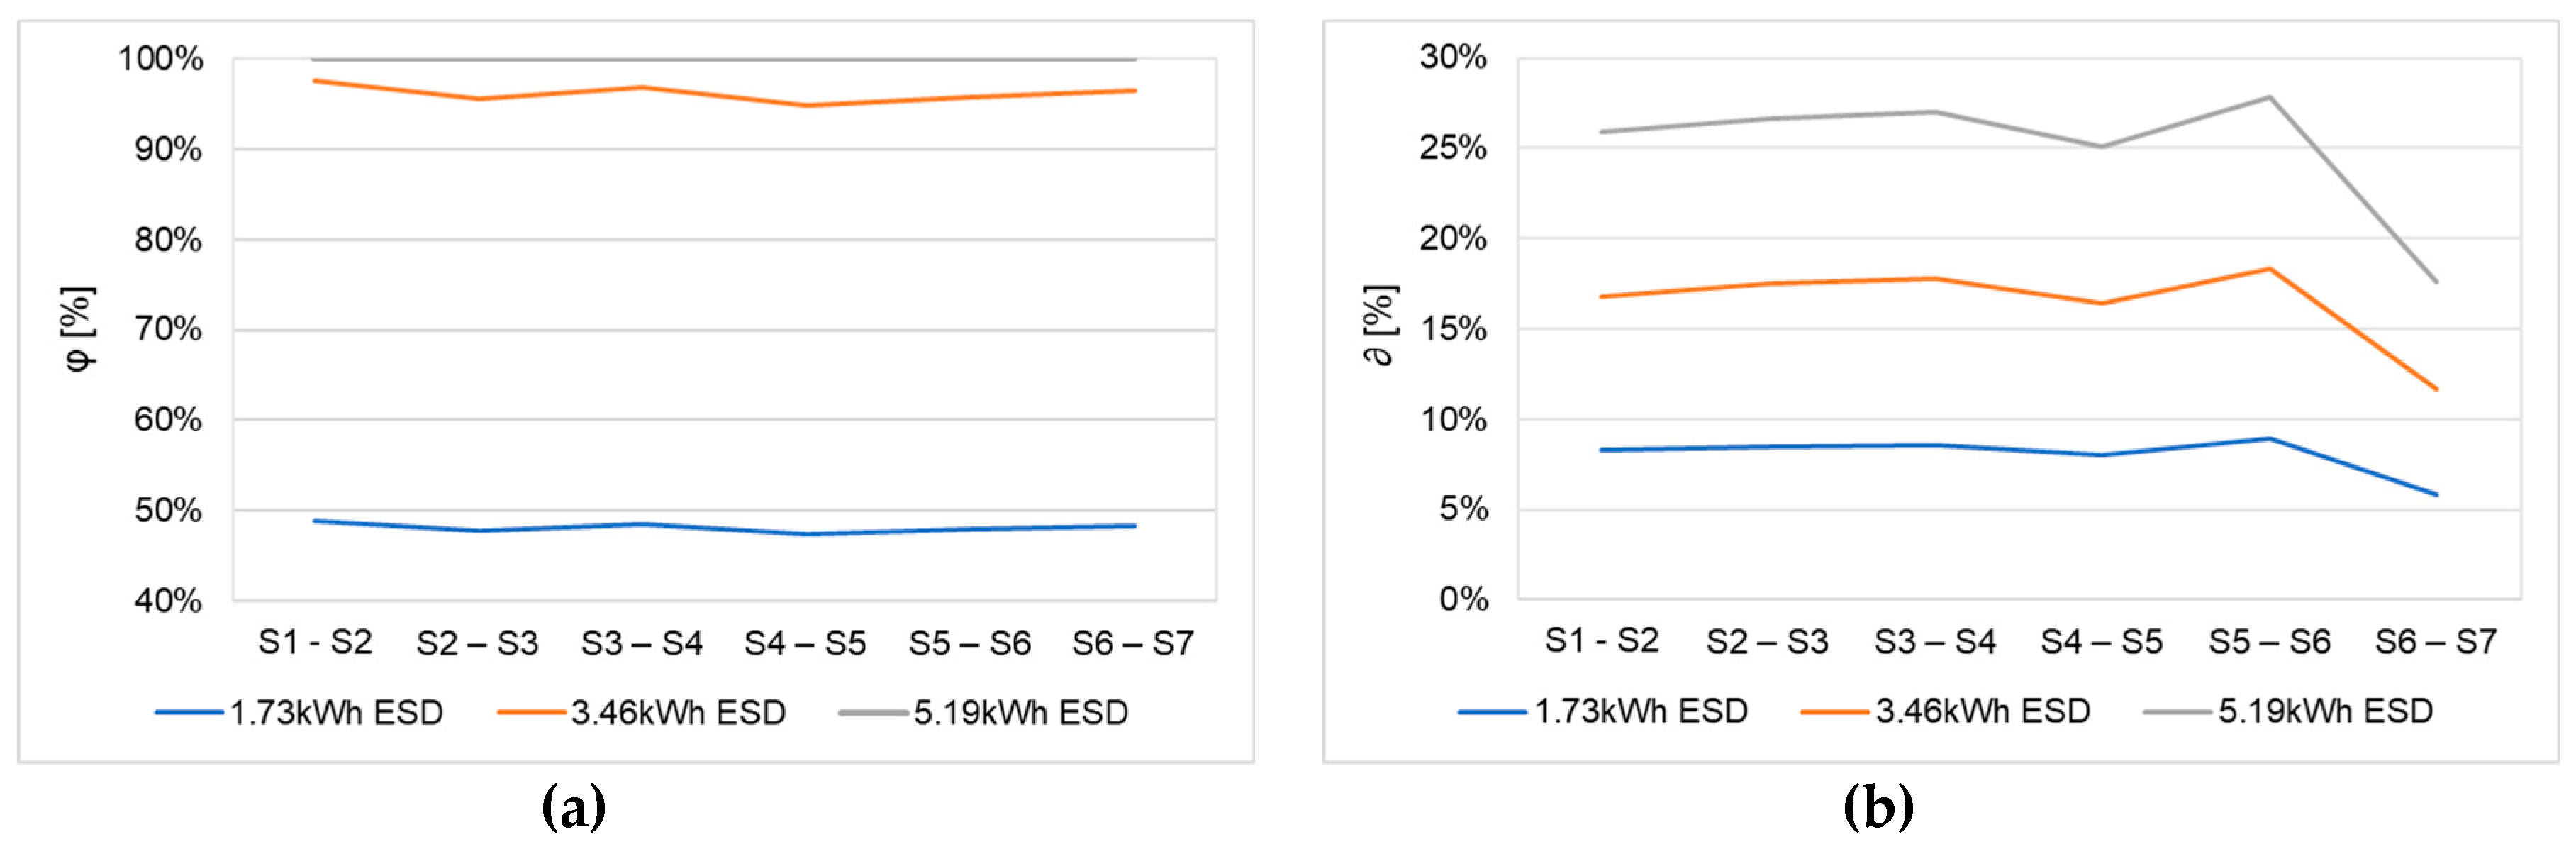
From Figure 7 it may be observed that the power and energy optimization parameters are different for a train travelling between 2 stations. The power optimization parameter from Figure 7a shows that to use whole braking power of a train (φ = 100%) the ESD power needs to be at a minimum of 2.6 MW which is achieved for the 5.19 kWh size ESD. The energy optimization parameter from Figure 7b achieved a highest value of = 27.83 % for 5.19 kWh ESD which equals the amount of energy that is saved from train braking.
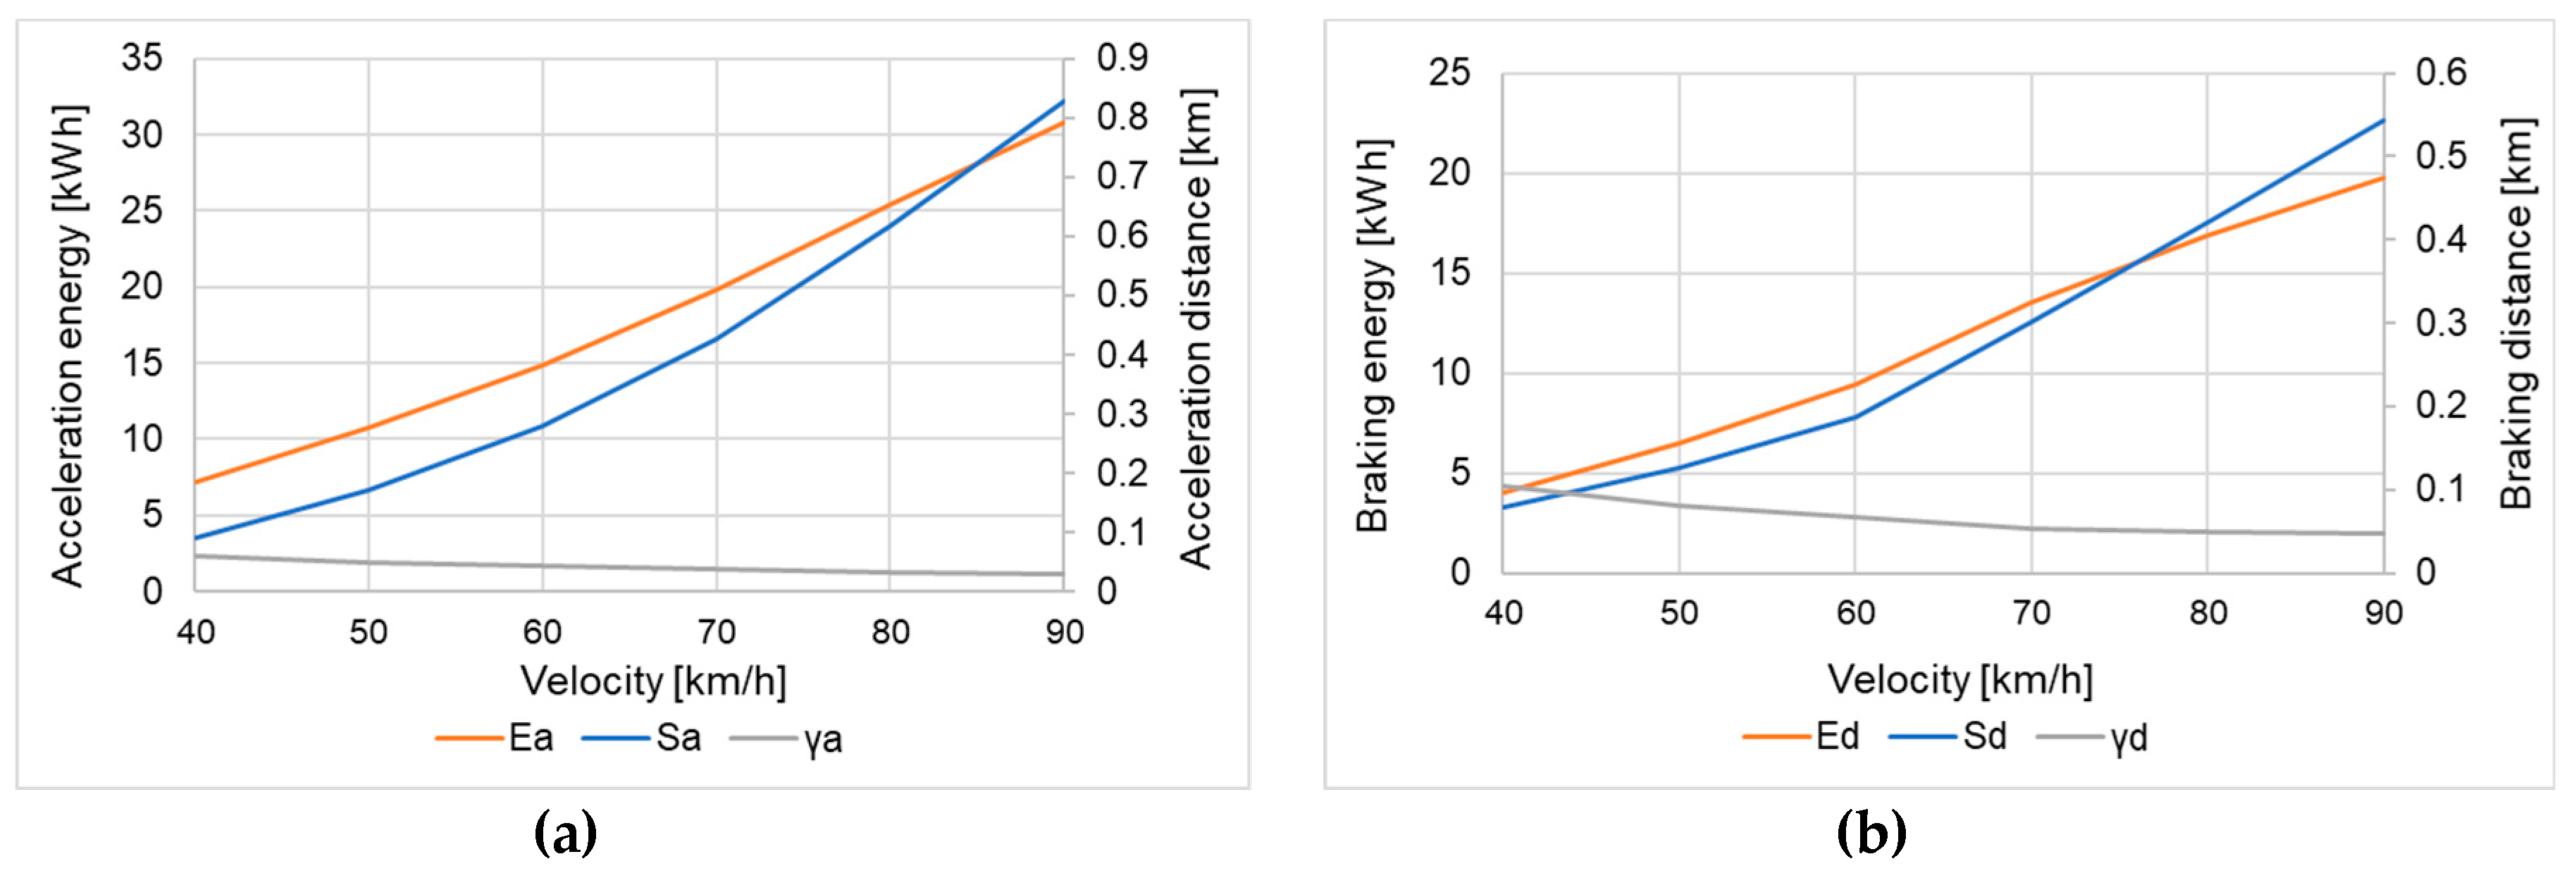
The energy required to accelerate a described train from 0 km/h to 90 km/h equals 30.8 kWh, Figure 8a. From Figure 8b it may be observed that the highest braking energy, 19.8 kWh, is achieved for a maximum speed of 90 km/h. It can be concluded that an important parameter to size the ESD are speed limits which affect the available train braking energy. Table 6 presents assumed train operation parameters calculated for 1 year.
For further analysis the following economical assumptions were established. The price for the BMOD0063 P125 B08 single module ( C SC ) is approximately US $ 4500, not including the converter and control system. The cost of the DC/DC converter and control system (Cconv) is assumed to be 20% of the total cost of the SC modules per carriage (approximately US $ 51/kW which is a conservative estimate). In [29] the authors consider the cost of a 2 MW DC/DC converter with a variable output voltage range between 400 V and 1500 V to be US $ 69700 (approximately US $ 35/kW). The ESD installation cost (Cinst) is assumed to be 10% of the total ESD cost. The service life of an SC module is 10 years or 1 million cycles [28] (the product guaranty is 2 years in the European Union). The ESD maintenance cost for a 10-year period, which will cover the replacement costs of defective SC modules, is assumed to be 25% of the total ESD cost. Table 7 gathers partial and total costs (C) of installation 3 types of ESD: Option I—1.73 kWh size ESD; Option II—3.46 kWh size ESD and Option III—5.19 kWh size ESD.
For industry purposes the cost of energy per kWh in Poland (θ) is approximately US $ 0.09 [30] with an assumed 3% per year inflation rate (δ) which will be added to the cost of energy. Table 8 presents the ESD costs and profit results during 10 years of operation. The profit coefficient ( P t ) from Table 8 shows that the investment costs will be returned after approximately 10 years. The highest profit is achieved for option III, US $ 131,000 with a total energy saved of 16.7 GWh.
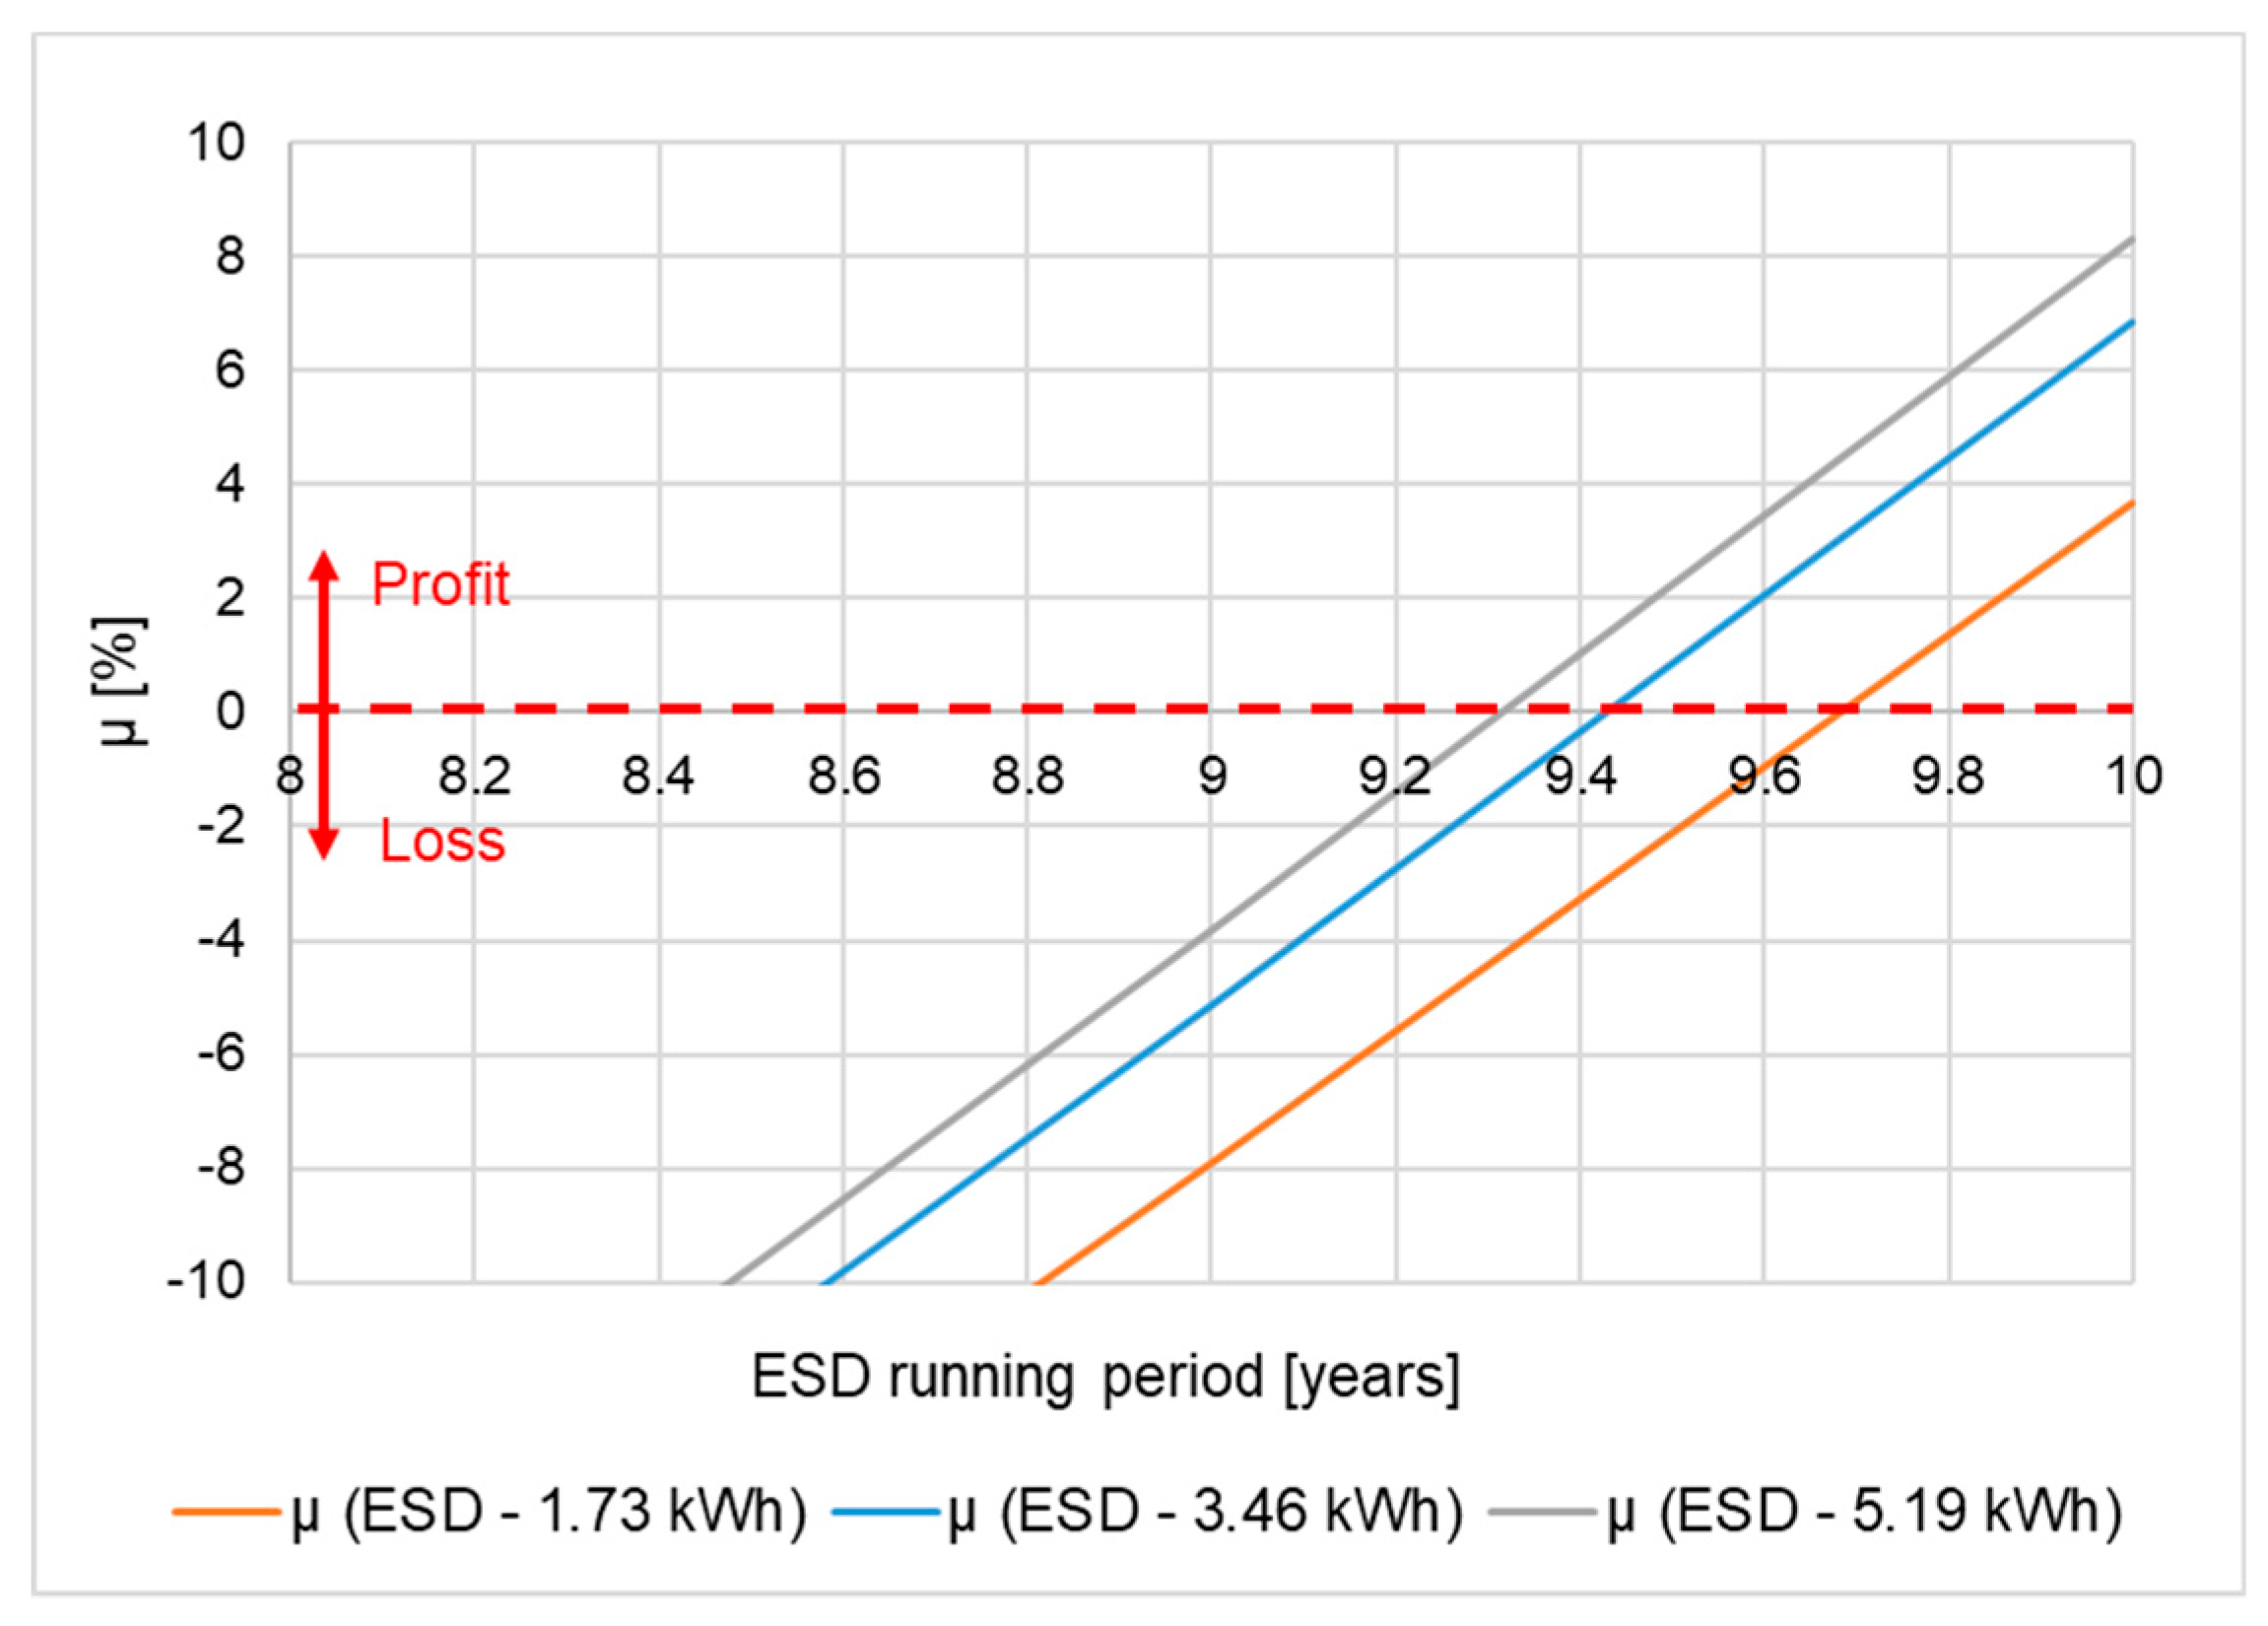
Figure 9 presents the results for the economic efficiency optimization parameter (μ = 4% for option I, μ = 7% for option II, μ = 8% for option III). Profit from the investment is achieved for option I after 9.7 years, for option II after 9.4 years and for option III after 9.3 years.
If we consider all the costs involved in the purchase, installation and maintenance of the ESD the payback period is ca. 9 years, which is close to the service life of an SC module. Further use of the ESD after this period will require replacement of the ESD modules, which will increase the total ESD costs. The on-board ESD needs to be optimally designed if it is expected to return a profit from its use.
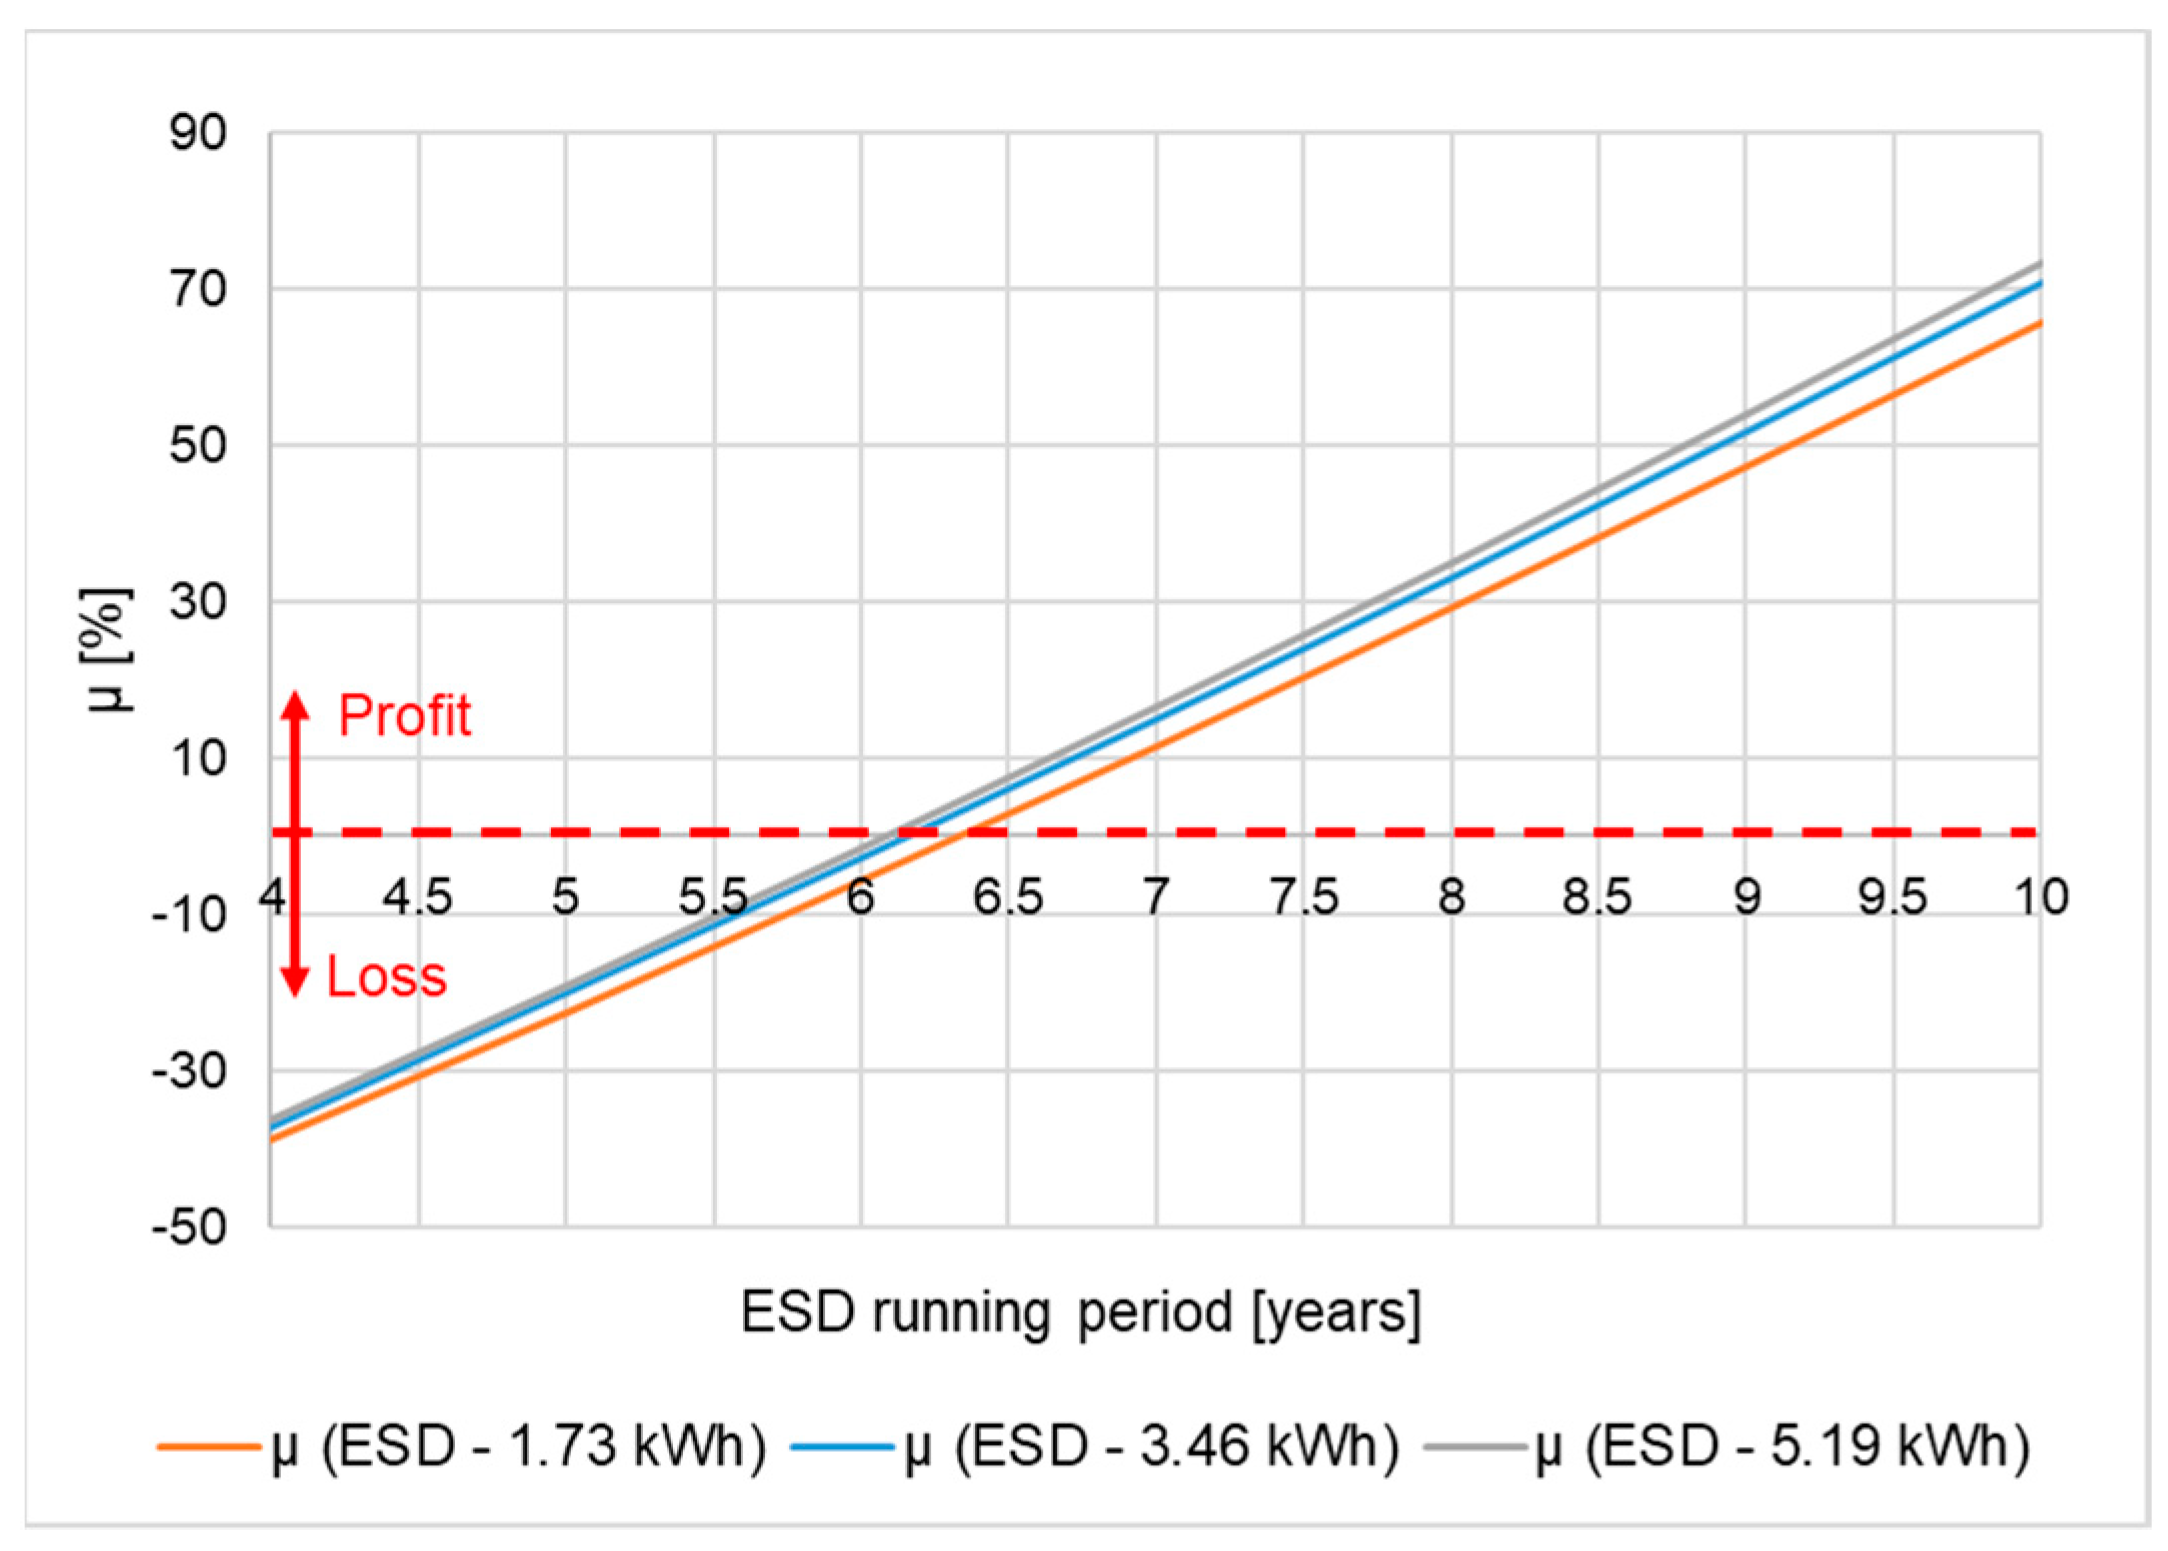
In Poland the cost of energy per kWh for transport is expected to rise in 2019 by approximately 60% (new cost US $ 0.144) [31] compared with the price from 2018. If we consider the inflation rate 3% per year this can have a large impact on the use of the ESD. Further analyses on the impact of the increasing energy price on the use of on-board ESD for the case study is presented below. The highest profit is achieved for option III, US $ 1.154 mln with a total energy saved of 16.7 GWh, Table 9.
Figure 10 presents the results for the economic efficiency optimization parameter for the new energy price (μ = 66% option I, μ = 71% option II, μ =73 % option III). Profit from the investment is achieved for option I after 6.4 years, for option II after 6.2 years and for option III after 6.1 years.
From Figure 10 it can be concluded that the new energy prices will reduce the ESD payback period by approximately 3 years to 6 years.
In Poland, for the production of 1 MWh of electrical energy, the CO2 emissions are approximately 800 kg [32]. The European Emission allowance on the 13th of February 2019 was 23.28 euro/tonne [33]. An emission cost of US $ 22.6/tonne (20 euro/tonne) was considered to calculate the additional profit from reduction of the energy by using an on-board ESD. In Table 10 the profit from CO2 emission reduction for a 10 years period of ESD running is calculated.
If the additional profit from the CO2 emission reduction is added to the total profit, this will make the use of ESD more attractive to the transportation companies, Table 11. The price of saved energy ( C Et ) in Table 11 includes the additional profit from reduction of the CO2 emissions from Table 10.
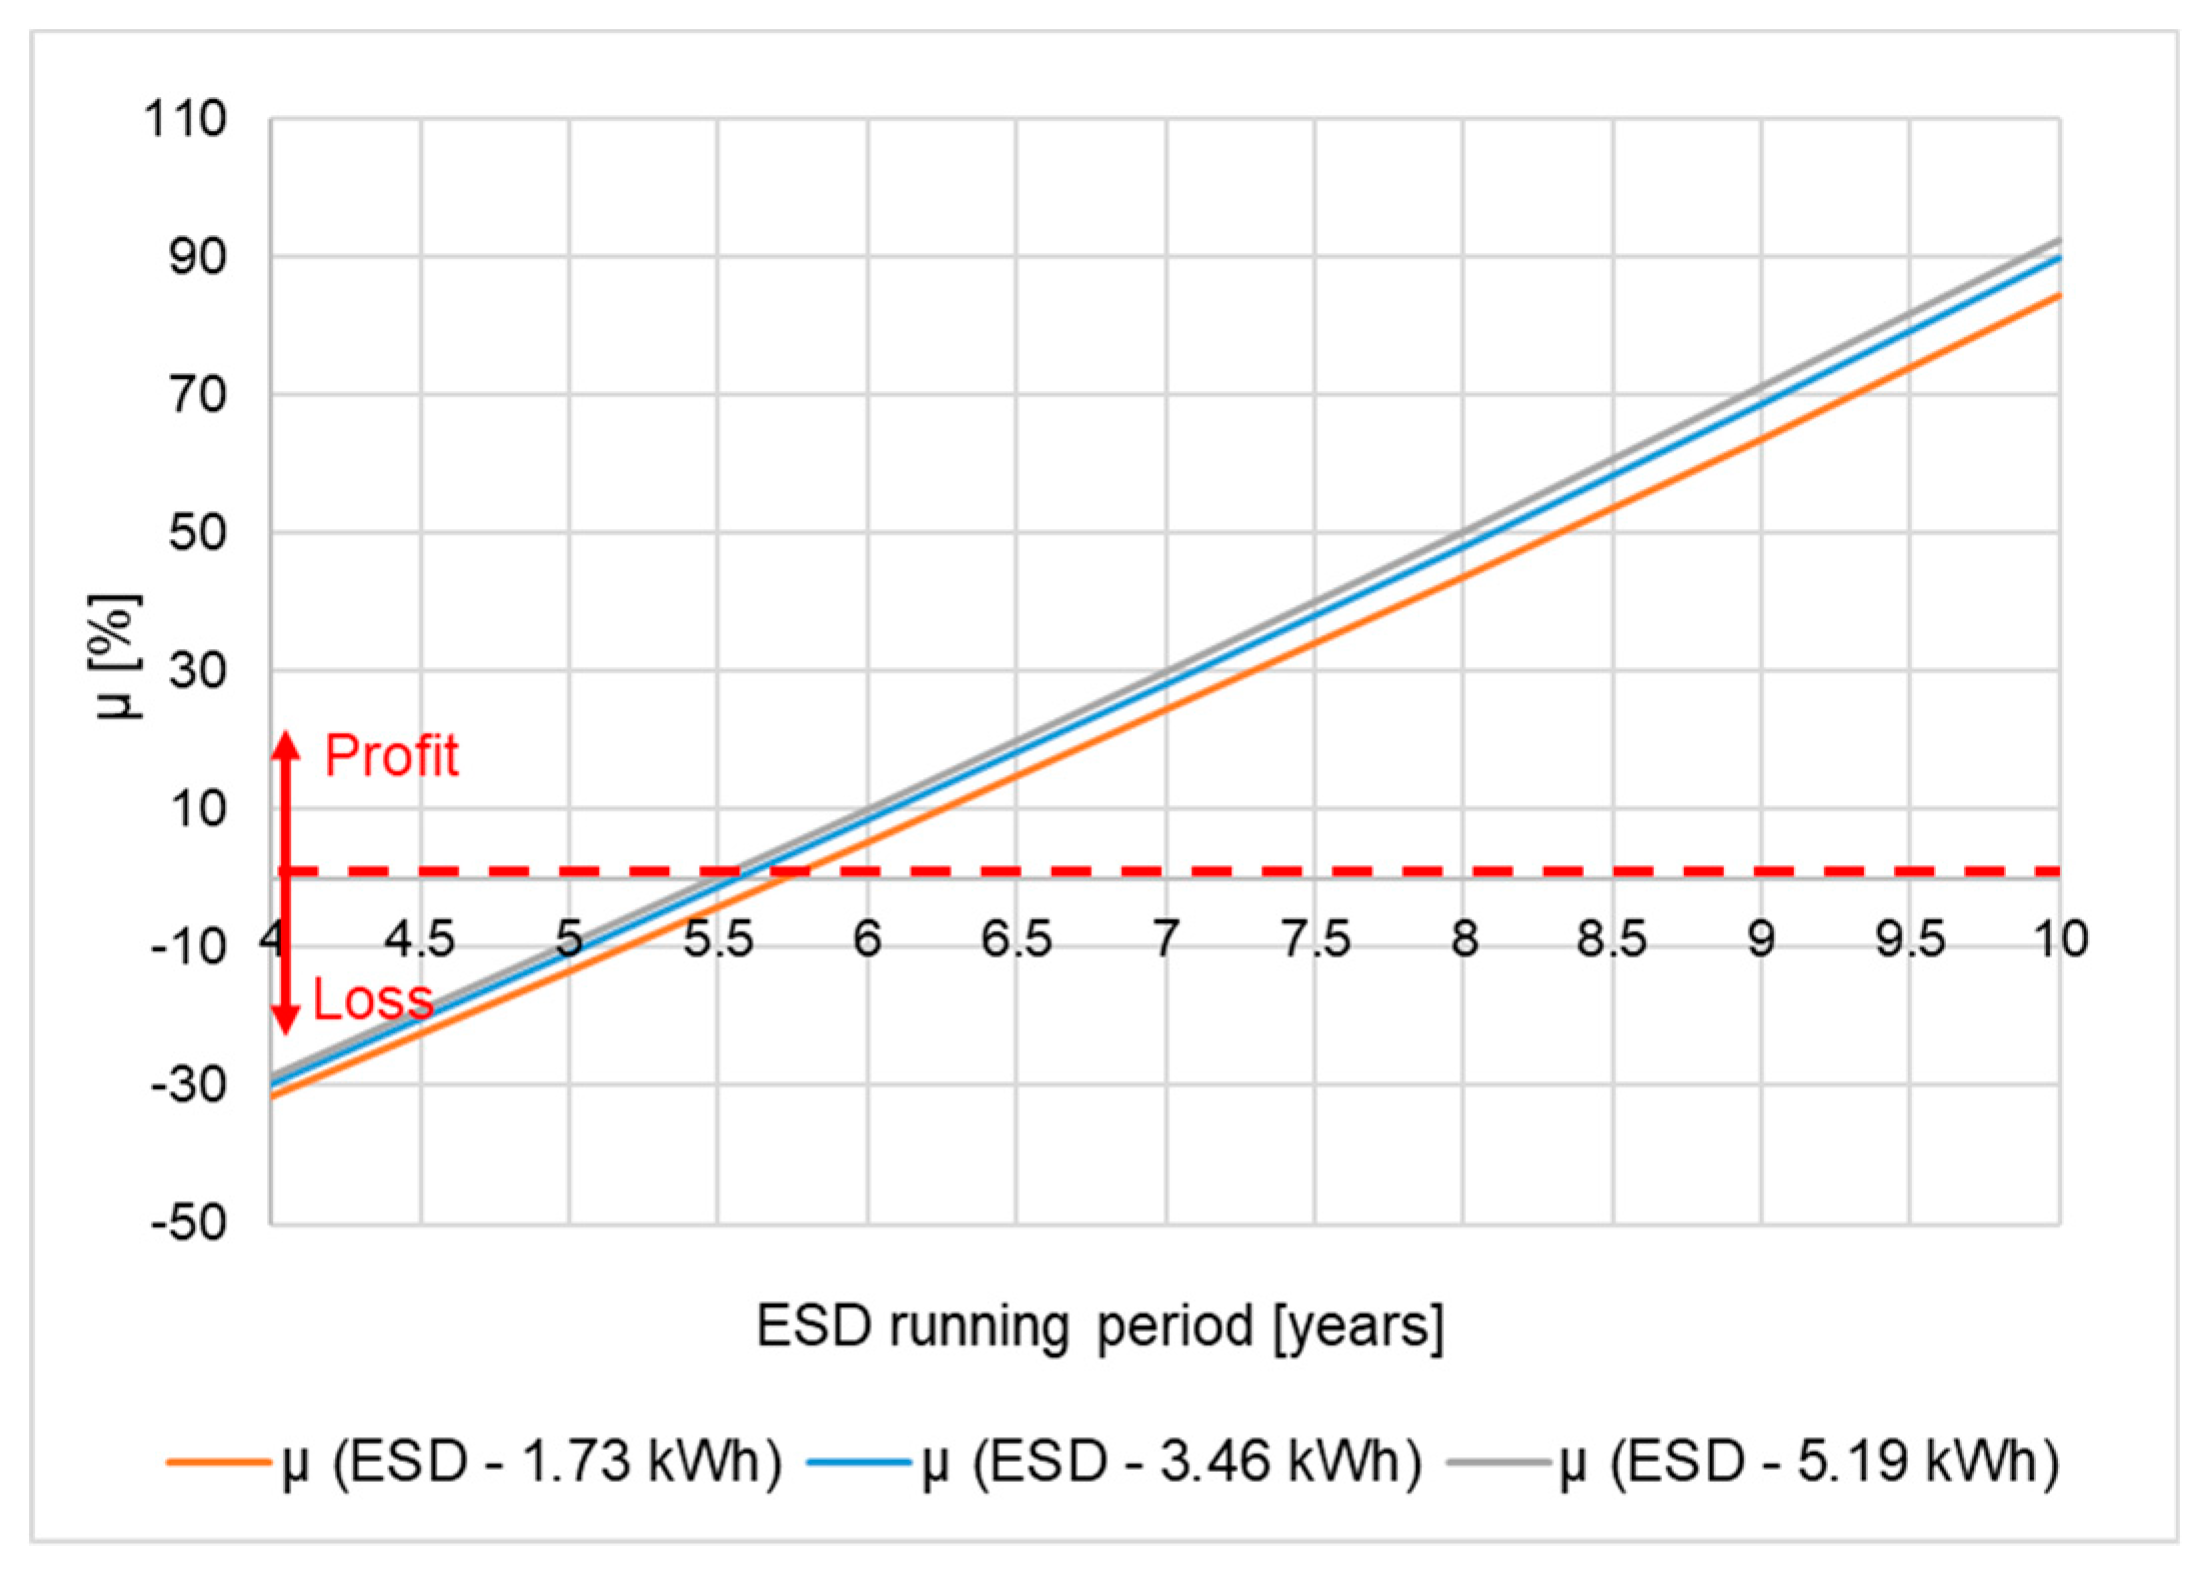
Figure 11 presents the results for the economic efficiency optimization parameter for the new energy price, including the additional profit from the reduction of the CO2 emission (μ = 84% option I, μ = 90% option II, μ = 92% option III). Profit from the investment is achieved for option I after 5.7 years, for option II after 5.6 years and for option III after 5.5 years.
From Figure 11 it may be observed that the cost of CO2 emissions has a significant impact on the payback time (reducing it by approximately 1 year) for the on-board ESD.

6. Conclusions

The paper presents an analysis of the effectiveness of an on-board ESD by enhancing the efficiency of braking energy re-use in an electrified transport system. A mathematical model of a train, equipped with the on-board ESD, was described and implemented in a program called Modeltrack simulation tool that was developed in C++. The undertaken simulation results show that an optimal sizing of the on-board ESD could increase effectiveness of energy use, cost savings and decarbonisation of electrified transport due to reduction of CO2 emissions.
Results of the case study undertaken with Modeltrack for an existing metro line, show that the energy that could be saved by the on-board ESD with a SC for a 10-year period is: 5.33 GWh (using ESD capacity 1.73 kWh), 10.98 GWh (using ESD capacity 3.46 kWh) and 16.7 GWh (using ESD capacity 5.19 kWh). With assumed DOD of 50%, the percentage of energy that is saved by the on-board ESD is between 5.79% and 27.83% of the total regenerated energy. It is comparable with data presented in [14] received from Warsaw Tram Company, where some Pesa trams in service are equipped with ESD of 1 kWh energy capacity, have shown a reduction of global energy consumption by 8–9% due to ESD installation, while recuperating energy sent back to catenary was 24% of that taken from supply.
From Figure 9, it can be concluded that the most cost-effective is option III with six SC modules connected in series and nine modules connected in parallel with a total of 216 SC modules per train (for four motoring carriages). For the energy price in 2018 in Poland the analysed on-board ESD would return a total profit of 8% (for 10 years of operation) considering the cost of a converter, control system installation and maintenance. With the new energy price expected for 2019 the return profit for option III is 73%, Figure 10. If the additional profit from the reduction of CO2 emissions is considered, the profit of the investment for option III is 92% and the payback time is reduced to only 5.5 years (Figure 11).
The presented technique for sizing the ESD on-board of trains could help to undertake decisions about applying them in a specific transport system (depending on: type of trains, route and traffic service). The analysed case study considered additional aspects such as: sudden increase of electrical energy costs (as 60% in Poland in 2019) or CO2 emission reduction (European Emission allowance was over 23 euro/1 t of CO2 on the 13th of February 2019). These aspects could significantly improve the effectiveness of installations of distributed ESD on-board trains and reduce the period for a return on the investment.
The model may be used for analysis in the DC light transport (e.g., metro, tram) to optimize the design of an on-board ESD, to assess the energy savings and technical and economic effectiveness of the solution taking into account: type of the urban transport systems, traffic, energy costs, environmental aspect (CO2 reduction). Further research with application of the proposed model and its development will include: comparison analysis of effectiveness of on-board versus stationary (installed in power supply system) ESD, application of different types of hybrid ESD and influence of different algorithms of ESD control on power supply functioning in normal and emergency situations.

Author Contributions

All authors have worked on this manuscript together and all authors have read and approved the final manuscript. Conceptualization, P.V.R., A.S. and M.S.; Formal analysis, P.V.R., A.S. and M.S.; Methodology, P.V.R., A.S. and M.S.; Software, P.V.R.; Validation, A.S. and M.S.; Data Curation, P.V.R., A.S. and M.S.; Writing—Original Draft Preparation, P.V.R. and A.S.; Writing—Review & Editing, P.V.R., A.S. and M.S.; Supervision A.S.

Funding

This research received no external funding.

Conflicts of Interest

The authors declare no conflict of interest.

Abbreviations

atrain acceleration (m/s2)
Betrain braking effort (N)
Cthe ESD’s capacity (F)
Cicost of investment ($)
Cconvcost of the DC/DC converter and control system ($)
CEenergy saved by the ESD during one year of functioning (kWh)
CESDequipment cost ($)
CEtprice of saved energy ($/kWh)
Cintsinstallation cost ($)
Cmentmaintenance costs ($)
CSCprice of single capacitor module ($)
dtrain braking rate (m/s2)
DODdepth of discharge (%)
Eaelectrical energy used by train for acceleration (Wh)
Ecelectrical energy used by train for constant velocity (Wh)
Edtrain energy for braking (Wh)
EESDESD energy (Wh)
EESDsESD actual energy saved from train braking regeneration (Wh)
Erhtenergy lost on the train braking rheostat (Wh)
ESDenergy storage device
Ettrain total energy demand (Wh)
Fdrolling resistance to motion (kN)
Fivertical resistance (kN)
Frhorizontal resistance (kN)
Fttotal resistance (N)
gconstant gravitational attraction (m/s2)
igradient (‰)
k0, k1, k2coefficients of resistance do motion
MOmain object
mESDESD mass (t)
mpmass of the passengers(t)
mrmass of the train (t)
mttotal mass of the train (t)
mtrtotal mass of the train considering the rotating mass parameter (t)
nnumber of acceleration steps
ninumber of motoring carriages equipped with ESD
Nsnumber of capacitor modules in series
Npnumber of capacitor modules in parallel
Patrain electrical power demand during acceleration (W)
Pauxtrain auxiliary power (W)
Pcelectrical power demand for constant velocity (W)
Pdelectrical power generated during braking (W)
PESDESD power (W)
PESDsESD actual power used for regeneration (W)
Prhtpower lost on the train braking rheostat (W)
Ptprofit ($)
rmrotating mass coefficient
Rrradius (m)
Sadistance travelled by train during acceleration (m)
Sddistance travelled by a train during braking (m)
sadistance travelled by train during acceleration (m)
scdistance travelled by train during constant velocity (m)
sddistance travelled by train during braking (m)
sttotal distance travelled by the train (m)
SOCstate of charge (%)
SCsupercapacitor
tatime taken for the train to accelerate from one velocity to next (s)
tcduration at constant velocity (s)
tdtime taken to brake from one velocity (v1) to next (v2) (s)
tESDduration of ESD charging/discharging (s)
tttotal duration of travelled distance (st) by the train (s)
Tetrain tractive effort (N)
Uminminimum discharging voltage (V)
Umaxnominal voltage (V)
vtrain velocity (km/h)
vatrain velocity at a tractive effort (km/h)
Vavgaverage speed (km/h)
vctrain constant velocity (m/s)
∆titime step (s)
φESD power optimization parameter
ESD energy optimization parameter
ηtefficiency of the train motors at different velocity (%)
ηESDefficiency of the ESD (%)
γroute velocity optimization parameter
θelectricity price ($/kWh)
δinflation of electricity price (%)

References

  1. Nima, G.; Javier, C.; Markus, B.; Erik, D. Review of Application of Energy Storage Devices in Railway Transportation. Energy Procedia 2017, 105, 4561–4568. [Google Scholar]
  2. Heather, D.; Clive, R.; Stuart, H.; Felix, S. An assessment of available measures to reduce traction energy use in railway networks. Energ. Convers. Manag. 2015, 106, 1149–1165. [Google Scholar]
  3. Gong, C.; Zhang, S.W.; Zhang, F.; Jiang, J.G.; Wang, X.H. An integrated energy-Efficient operation methodology for metro systems based on a real case of Shanghai metro line one. Energies 2014, 7, 7305–7329. [Google Scholar] [CrossRef]
  4. Wang, B.; Yang, Z.P.; Lin, F.; Zhao, W. An improved genetic algorithm for optimal stationary energy storage system locating and sizing. Energies 2014, 7, 6434–6458. [Google Scholar] [CrossRef]
  5. Xia, H.; Chen, H.X.; Yang, Z.P.; Lin, F.; Wang, B. Optimal energy management, location and size for stationary energy storage system in a metro line based on genetic algorithm. Energies 2015, 8, 11618–11640. [Google Scholar] [CrossRef]
  6. González-Gil, A.; Palacin, R.; Batty, P.; Powell, J.P. A systems approach to reduce urban rail energy consumption. Energy Convers. Manag. 2014, 80, 509–524. [Google Scholar]
  7. Pawełczyk, M.; Krawczyk, M. Storage of energy in railway transport. In Proceedings of the 7th European Conference of Young Research and Scientific Workers, Żilina, Slovakia, 25–27 June 2007. [Google Scholar]
  8. Czucha, J.; Karwowski, K.; Mizan, M.; Pazdro, P. Efektywnosc odzysku energii hamowania elektrodynamicznego w komunikacji miejskiej. Przegl. Elektrotech. 2004, 80, 1016–1019. (In Polish) [Google Scholar]
  9. Ricardo, B.; Joeri, V.M.; Xavier, T. Energy savings in public transport. IEEE Veh. Technol. Mag. 2008, 3, 26–36. [Google Scholar] [CrossRef]
  10. Radu, P.; Szelag, A. Modelling of operation of a stationary energy storage device in metro rail transport for selection of its parameters. MATEC Web Conf. 2018, 180, 1–6. [Google Scholar] [CrossRef]
  11. Rupp, A.; Baier, H.; Mertiny, P.; Secanell, M. Analysis of a flywheel energy storage system for light rail transit. Energy 2016, 107, 625–638. [Google Scholar] [CrossRef]
  12. Tosaphol, R.; Thanatchai, K. A Demonstration Project for Installation of Battery Energy Storage System in Mass Rapid Transit. Energy Procedia 2017, 138, 93–98. [Google Scholar]
  13. Takagi, R.; Amano, T. Optimisation of reference state-of-charge curves for the feed-forward charge/discharge control of energy storage systems on-board DC electric railway vehicles. IET Electr. Syst. Transp. 2015, 5, 33–42. [Google Scholar] [CrossRef]
  14. Steiner, M.; Klohr, M.; Pagiela, S. Energy storage system with ultracaps on board of railway vehicles. In Proceedings of the 2007 European Conference on Power Electronics and Applications, Aalborg, Denmark, 2–5 September 2007; pp. 1–10. [Google Scholar]
  15. Dengke, Y.; Shuai, G.; Junjun, L.; Yicheng, Z.; Chuanxian, L. Design and analysis of emergency self-traction system for urban rail transit vehicles. Energy Procedia 2012, 16, 585–591. [Google Scholar] [CrossRef] [Green Version]
  16. Szelag, A.; Drazek, Z.; Maciolek, T. Elektroenergetyka Miejskiej Trakcji Elektrycznej; INW Spatium: Radom, Poland, 2017. (In Polish) [Google Scholar]
  17. Victor, H.; Aitor, M.; Haizea, G.; Ion, E.O.; Igor, V.; Haritza, C. Adaptive energy management strategy and optimal sizing applied on a battery-supercapacitor based tramway. Appl. Energy 2016, 169, 831–845. [Google Scholar]
  18. Flavio, C.; Diego, I.; Pietro, T. Control of metro-trains equipped with onboard supercapacitors for energy saving and reduction of power peak demand. Transp. Res. Part C Emerg. Technol. 2012, 24, 36–49. [Google Scholar]
  19. Alvaro, J.L.L.; Ramon, R.P.; Antonio, F.C.; Paloma, A.C. Assessment of energy-saving techniques in direct-current-electrified mass transit systems. Transp. Res. Part C Emerg. Technol. 2014, 38, 85–100. [Google Scholar]
  20. Xing, L.; Jihong, W.; Mark, D.; Jonathan, C. Overview of current development in electrical energy storage technologies and the application potential in power system operation. Appl. Energy 2015, 137, 511–536. [Google Scholar] [Green Version]
  21. Iannuzzi, D.; Tricoli, P. Optimal control strategy of onboard supercapacitor storage system for light railway vehicles. In Proceedings of the 2010 IEEE International Symposium on Industrial Electronics, Bari, Italy, 4–7 July 2010; pp. 280–285. [Google Scholar]
  22. Shuai, S.; Tao, T.; Yihui, W. Evaluation of Strategies to Reducing Traction Energy Consumption of Metro Systems Using an Optimal Train Control Simulation Model. Energies 2016, 9, 105. [Google Scholar] [CrossRef]
  23. Jefimowski, W.; Szelag, A. The multi-criteria optimization method for implementation of a regenerative inverter in a 3kV DC traction system. Electr. Power Syst. Res. 2018, 161, 61–73. [Google Scholar] [CrossRef]
  24. Available online: https://www.bloodshed.net/devcpp.html (accessed on 10 September 2018).
  25. Clement, M.; Ludovic, H.; Alain, B.; Delarue, P. Comparison of Different Models and Simulation Approaches for the Energetic Study of a Subway. IEEE Transp. Veh. Technol. 2014, 63, 556–565. [Google Scholar] [CrossRef]
  26. Bartlomiejczyk, M.; Jarzebowicz, L. Energy savings by application of supercapacitor storage in trolleybus supplying station—Analysis of experimental results. Tech. Trans. Electr. Eng. 2016, 1, 17–32. [Google Scholar] [CrossRef]
  27. Maxwell Datasheet 125V Heavy Transportation Module. Available online: http://www.maxwell.com/images/documents/125V_Module_datasheet.pdf (accessed on 18 September 2018).
  28. Hammar, A.; Venet, P.; Lallemand, R.; Coquery, G.; Rojat, G. Study of accelerated aging of supercapacitors for transport applications. IEEE Tran. Ind. Electron. 2010, 57, 3972–3979. [Google Scholar] [CrossRef]
  29. Liu, Y.; Farnell, C.; Balda, J.C.; Mantooth, H.A. Topology, cost and efficiency comparisons of a 2 MW DC supply using interleaved DC-DC converter. In Proceedings of the 2014 IEEE 5th International Symposium on Power Electronics for Distributed Generation Systems (PEDG), Galway, Ireland, 24–27 June 2014. [Google Scholar]
  30. Eurostat Statistics Explained. Available online: http://ec.europa.eu/eurostat/statistics-explained/index.php/Energy_price_statistics (accessed on 18 September 2018).
  31. Rynek Kolejowy. Available online: https://www.rynek-kolejowy.pl/wiadomosci/drastyczny-wzrost-cen-energii-odbije-sie-na-przewozach-kolejowych-88801.html (accessed on 12 February 2019).
  32. Audyty Energetyczne. Available online: https://www.audytoenerg.pl/index.php/74-uncategorised/159-wskaznik-emisji-co2-dla-energii-elektrycznej (accessed on 12 February 2019).
  33. Business Insider. Available online: https://markets.businessinsider.com/commodities/co2-emissionsrechte (accessed on 12 February 2019).
Figure 1. Flowchart of the simulation program.
Energies 12 01291 g001
Figure 2. Tractive effort, braking effort and efficiency as a function of velocity.
Energies 12 01291 g002
Figure 3. Route details.
Energies 12 01291 g003
Figure 4. Simulation results for a train with no ESD: (a) Train rolling resistance, (b) Train power (positive power—the train is motoring, negative power—the train is braking with energy regeneration).
Energies 12 01291 g004
Figure 5. Train velocity for different sizes of on-board ESD (1.73 kWh, 3.46 kWh and 5.19 kWh).
Energies 12 01291 g005
Figure 6. ESD charging/discharging characteristic for DOD 50% for different ESD energy capacity.
Energies 12 01291 g006
Figure 7. Simulation results for three sizes of ESD: (a) φ—power optimization parameter, (b) —energy optimization parameter.
Energies 12 01291 g007
Figure 8. Simulation results for Ea, Ed—energy during acceleration and braking respectively; Sa, Sd—distance travelled during acceleration and braking respectively; ya, yd—route velocity optimization parameters (33): (a) velocity limitation parameter for acceleration, (b) velocity limitation parameter for braking.
Energies 12 01291 g008
Figure 9. Economic efficiency optimization parameter.
Energies 12 01291 g009
Figure 10. Economic efficiency optimization parameter—higher price for the energy included.
Energies 12 01291 g010
Figure 11. Economic efficiency optimization parameter-higher price for the energy and profits form reduction of CO2 emission included.
Energies 12 01291 g011
Table 1. Input parameters.
ParameterUnitValue
mass of metro traintonnes160
passenger masstonnes100
voltageV750
maximum tractive effortkN260
auxiliary loadkW60
number of motoring carriages-4
number of trailer carriages-2
carriage lengthm20
carriage widthm2.8
maximum acceleration ratem/s0.9
mean braking service ratem/s0.8
rotating mass factor%1.1
k0-15.4
k1-0.23
k2-0.06
Table 2. ESD parameters per traction carriage.
Option N s N p Length (m)Width (m)Mass (tonnes)Charging/Discharging Current (A)
I633.70.7951.1420
II667.40.7952.2840
III6911.10.7953.31260
Table 3. ESD parameters for train.
Option Number of SC ModulesTotal Mass (tonnes)Charging/Discharging Current (A) E E S D   ( kWh )
I724.416801.73
II1448.833603.46
III21613.250405.19
Table 4. Simulation results.
RouteNo ESDESD—1.73 kWhESD—3.46 kWhESD—5.19 kWh
T (s)Vavg (km/h)T (s)Vavg (km/h)T (s)Vavg (km/h)T (s)Vavg (km/h)
S1–S211637.311637.311637.311836.7
S2–S39733.59733.59833.29833.1
S3–S412437.812537.512637.212637.2
S4–S512341.112440.712440.712540.4
S5–S69131.79331.19331.19331
S6–S78853.38952.69052.19052.1
Total63939.164438.864738.665038.4
Table 5. ESD saved energy simulation results.
RouteEnergy Used (kWh) (No ESD)Energy Saved (kWh) (ESD—1.73 kWh) Energy Saved (kWh) (ESD—3.46 kWh)Energy Saved (kWh) (ESD—5.19 kWh)
S1–S227.881.493.034.67
S2–S323.311.262.603.95
S3–S429.541.603.345.07
S4–S531.411.593.264.98
S5–S621.691.212.483.77
S6–S729.661.092.203.31
Total163.498.216.925.7
Table 6. Assumed train operation for a calendar year.
TimeFrequencyCycles per DayTotal Cycles
Peak hours (5–9 a.m. and 4–7 p.m.)3 min14051,100
Off—peak hours and weekends8 min3813,870
Between 23 p.m. and 5 a.m.No metro services--
Total64,970
Table 7. ESD total cost for a 10-year period.
Option N s × N p C s c   ( US   $ ) C c o n v   ( US   $ ) n i C E S D   ( US   $ ) C i n s t   ( US   $ ) C m e n t   ( US   $ ) C (US $)
I18450016,2004388,80038,88097,200524,880
II36450032,4004777,60077,760194,4001,049,760
III54450048,60041,166,400116,640291,6001,574,640
Table 8. ESD total cost and profit for a 10-year period.
N (years)Option IOption IIOption III
C E   ( GWh ) C E t   ( mln   $ ) P t   ( mln   $ ) C E   ( GWh ) C E t   ( mln   $ ) P t   ( mln   $ ) C E   ( GWh ) C E t   ( mln   $ ) P t   ( mln   $ )
10.530.048−0.4771.100.099−0.9511.670.150−1.424
21.070.097−0.4282.200.201−0.8493.340.305−1.270
31.600.148−0.3773.290.305−0.7445.010.464−1.110
42.130.200−0.3244.390.413−0.6376.680.628−0.946
52.660.254−0.2715.490.524−0.5268.350.796−0.778
63.200.309−0.2166.590.637−0.41210.020.969−0.605
73.730.366−0.1597.690.754−0.29611.691.147−0.428
84.260.424−0.1018.780.874−0.17613.361.328−0.246
94.790.483−0.0429.880.996−0.05415.031.515−0.060
105.330.5440.01910.981.1220.07216.701.7060.131
Table 9. ESD total cost and profit for a 10-year period with the new energy price.
n (years)Option IOption IIOption III
C E   ( GWh ) C E t   ( mln   $ ) P t   ( mln   $ ) C E   ( GWh ) C E t   ( mln   $ ) P t   ( mln   $ ) C E   ( GWh ) C E t   ( mln   $ ) P t   ( mln   $ )
10.530.077−0.4481.100.158−0.8921.670.240−1.334
21.070.156−0.3692.200.321−0.7293.340.488−1.087
31.600.237−0.2883.290.489−0.5615.010.743−0.832
42.130.321−0.2044.390.661−0.3896.681.005−0.570
52.660.407−0.1185.490.838−0.2128.351.274−0.300
63.200.495−0.3016.591.020−0.03010.021.551−0.024
73.730.5850.6057.691.2060.15711.691.8350.260
84.260.6780.1538.781.3980.34813.362.1250.551
94.790.7730.2489.881.5940.54415.032.4240.849
105.330.8710.34610.981.7950.74516.702.7291.154
Table 10. Reduction of CO2 emission and additional profit for a 10-year period.
Option C E   ( GWh ) CO2 Emission Reduction (tonnes)Additional Profit ($)
I5.33426496,366
II10.988784198,518
III16.713,360301,936
Table 11. ESD total cost and profit for a 10 years period with the new energy price and additional profit from reduction of the CO2 emission.
n (years)Option IOption IIOption III
C E t   ( mln   $ ) P t   ( mln   $ ) C E t   ( mln   $ ) P t   ( mln   $ ) C E t   ( mln   $ ) P t   ( mln   $ )
10.086−0.4480.178−0.8720.271−1.304
20.175−0.3690.361−0.6890.548−1.026
30.266−0.2880.548−0.5020.834−0.741
40.359−0.2040.740−0.3091.126−0.449
50.455−0.1180.937−0.1131.425−0.149
60.553−0.0301.1390.0891.7320.157
70.6530.0601.3450.2962.0460.471
80.7550.1531.5570.5072.3670.792
90.8600.2481.7720.7232.6951.121
100.9670.3461.9930.9433.0311.456

