1. Introduction
In an effort to reduce the global output of greenhouse gas emissions, an increasing number of original equipment manufacturers (OEMs) including Ford [
1], Tesla [
2] and Volkswagen [
3] are employing electrified powertrains within their new and upcoming models of automotive vehicles. A 2017 report by the International Energy Agency (IEA) [
4] estimates that as a result of these OEM, together with government initiatives, the global stock of electric vehicles (EV) and plug-in hybrid vehicles (PHEV) may increase from 2 million reported units in 2016 to between 9–20 million units by 2020. Other reports also forecast a significant shift in the global automotive powertrains mix towards electrification, where the combined global market share for EVs, PHEVs and hybrid electric vehicles (HEVs) may exceed 30% by 2030 [
5].
Due to their high energy and power density [
6], lithium-ion batteries are an attractive choice for the energy storage system contained within EV, PHEV and HEVs, resulting in their widespread adoption by leading automotive OEMs [
7]. However, the performance and durability (i.e., ageing rate) of lithium-ion batteries is highly sensitive to their thermal condition [
8], which can lead to detrimental effects on the battery if left (thermally) unmanaged [
9]. It is commonly reported that an optimum battery operating temperature may exist for lithium-ion cells, where Pesaran et al. suggested a range of 15–35 °C for LiFePO
4-type cathode chemistries to maximise performance whilst limiting high temperature-related ageing effects [
10]. Similarly, Tourani et al. [
11] suggested a slightly narrower operating window of 20 ± 5 °C for a battery with a Lithium Manganese Oxide (LMO) cathode chemistry, whereas Hosseinzadeh et al. [
12] suggested a higher range of 25–35 °C for a large format pouch cell employing Nickel Manganese Cobalt (NMC) cathode chemistry. To ensure that automotive batteries are allowed to remain within their optimum temperature range during operation, in addition to avoiding rapid temperature increases that can lead to a safety critical thermal runaway event [
13], battery thermal management systems (BTMS) are, therefore, required [
14].
Not only must the BTMS remove or add heat to the battery cell to maintain its optimal operating temperature, it must do so in a manner that inhibits the development of temperatures gradients (both through the cell and between cells) which are known to accelerate the battery ageing rate [
15]. Owing to this, it is commonly reported [
16,
17,
18,
19,
20] that the magnitude of the gradient should not exceed circa 5 °C. The design of the BTMS must also be conducive towards a low weight and a high compactness, given the constraints imposed by automotive OEMs [
21]. A successful BTMS must, therefore, satisfy the temperature constraints on the battery without significantly reducing the overall pack level gravimetric and volumetric energy density.
Large format pouch-type lithium-ion batteries are a common choice as the battery form factor within automotive energy storage systems [
22] and have received growing attention towards their thermal management method. Forced air cooling [
23] across the cell body benefits from its simplistic (low cost) and light-weight design, given that weighty metallic cold plates and secondary liquid-to-air heat exchangers are not required [
24]. However, the poor heat capacity of air (circa 1006 J·kg
−1·K
−1 relative to circa 3320 J·kg
−1·K
−1 for a typical water glycol mixture [
25]) makes it difficult to achieve the required heat removal without worsening its temperature uniformity [
8], which is particularly problematic for cells with a long flow path and/or high heat generation rate [
25]. Packing the air channels with aluminium foam [
26] or attaching bespoke heat sinks to the battery surface as in Reference [
27] can extend the use of air cooling under more intensive current loads by mitigating these issues. However, these specific designs require a large cell-to-cell spacing (to accommodate the air channel and/or cooling plate), which can be detrimental to the volumetric energy density of the cell stack. An inordinate amount of parasitic cooling power is also generally required for air-cooled systems relative to liquid-cooled systems to satisfy thermal constraints as the battery heat load increases [
28]. This may explain why an increasing number of OEMs such as Tesla [
29] and Chevrolet [
30] are opting for indirect liquid cooling in their respective models of EVs and PHEVs.
Common liquid-cooled methods for pouch or prismatic cells involve attaching mini-channel cold plates to the battery surface. Examples of these approaches can be found in References [
31,
32,
33]. As the heat transfer medium is contained within the cold plate channels, the use of conductive mediums with superior heat transfer properties can be used. Chen et al. [
34] demonstrated through a simulation that indirect plate cooling pouch cells with a water–glycol mixture offered greater surface temperature uniformity and a lower cell temperature rise than direct cooling with a nonconductive mineral oil, provided that the plate flowrate exceeded circa 0.75 g s
−1. However, as highlighted by Kim and Pesaran [
25], care must be taken with indirect cooling methods to ensure that the added thermal resistance between the cell surface and heat transfer medium does not offset the heat transfer benefit from using conductive fluids. The risk of leakage is also greater in these systems that use electrically conductive fluids given the severity of a thermal runaway event associated with a cell short circuit [
35].
Other developing methods of indirect liquid cooling involve placing conductive sheets between the battery cells (commonly termed fin cooling or extended surface cooling) where the heat from the cell surface is transferred to an external location to be further dissipated [
34]. These approaches have the advantage of simplifying the duct and tubing arrangement, given that the fluid is not passed across the large bodies of all the individual cells. Fewer manifold connections and/or seals may, therefore, be present relative to mini-channel cold plates, where the external liquid-cooled location may also be positioned in a safer area away from the cell compartment to improve the overall safety of the battery pack [
36]. Basu et al. [
36] presented a novel extended surface BTMS design for cylindrical cells using aluminium conduction elements to transfer heat to two side cold plates. From their simulations, they concluded that the design could efficiently limit the maximum cell temperature rise across a string of 5 cells to within circa 7 °C at the end of a 2.7 C discharge, whilst operating with low liquid velocities in the side cold plates (0.01 m s
−1). Hosseinzadeh et al. [
37], however, concluded that placing aluminium fins between large format pouch cells may be a poor thermal management choice under more aggressive heat generation conditions (3 C and 5 C). Specifically, for a simulated 40 Ah pouch cell at the end of a 3 C discharge subject to single-edge aluminium fin cooling, an extreme volumetric temperature gradient of 22.9 °C was predicted through the battery. Increasing the sandwich fin thickness from 1.5 mm to 5 mm could lower the gradient to 11.9 °C but may be impractical due to the added weight and volume penalty. Chen et al. [
34] further demonstrated that single-edge fin cooling large format batteries with aluminium fins may add excessive weight to the cell (39%) relative to mini-channel cold plate cooling (7%) for a fixed volume penalty. Evidently, there is scope within the literature to improve the thermal efficiency of fin cooling when applied to large format batteries.
In this paper, the thermal performance of a novel super conductive, light-weight fin material is investigated to advance the use of fin cooling for large format pouch type batteries. The paper is structured as follows.
Section 2 describes the fin materials used and outlines the design and assembly procedure of the test rig used to experimentally measure the thermal performance of the fin materials. The experimental testing procedure, together with the drive cycle profiles used to electrically load the cells is also discussed in
Section 2. In
Section 3, the experimental temperature results from the test rig for the highly conductive fins are compared against conventional copper and aluminium fins under a wide range of electrical loading conditions that cover standard EV, PHEV and high performance EV race conditions. Further, a discussion on weight and volume metrics for the different fin materials is included. Further work and the conclusions are contained in
Section 4 and
Section 5, respectively.
3. Results and Discussion
In this section, the measured thermal outputs obtained from the test rig are discussed in detail for each tested electrical loading condition and fin material type.
Due to issues with the cycler equipment failing to reinitiate the testing between some cycle runs, the full set of 6-cell readings is not obtainable for all analysed electrical loading conditions.
Table 2 displays the number of successful cell samples obtained for each fin material type and each duty cycle.
Given that thermocouple readings are present at locations TC5 and TC9 on both the front and back fins, it is important to first test whether there exists any significant statistical evidence that a difference exists between the readings from both the front and back fins. Such a difference may suggest that the test rig has not been set up correctly to achieve the desired symmetry along the cell central plane, as shown previously in
Figure 2a. To test whether a difference exists between the front and back fin measurements, a paired student t-test is conducted on the measurements obtained at the end of the 3 C discharge, which is chosen given that this test case has the greatest number of cell samples for all fin material types. At the α = 0.05 level, the t-test accepts the null hypothesis that the difference between the readings is zero; therefore, there is statistical evidence supporting that the rig has been assembled (for cells 1, 2 and 3) and reassembled (for cells 4, 5 and 6) in a manner to achieve the desired symmetry condition.
3.1. Thermal Contact Resistance
Surface asperities present on the pouch cell and fin material result in multiple heat transfer modes across the interface between the two surfaces. These include the conduction between the points at which both surfaces are in contact, through conduction in the gas (in this instance air) that fills the gaps between the surfaces, through convection of air in the gaps and through radiation across the gaps [
46]. These heat transfer modes are typically characterised via a thermal contact resistance, where methods to reduce this resistance may include the application of pressure to increase the solid–solid contact area and/or the addition of a thermal interface material to improve gap heat transfer.
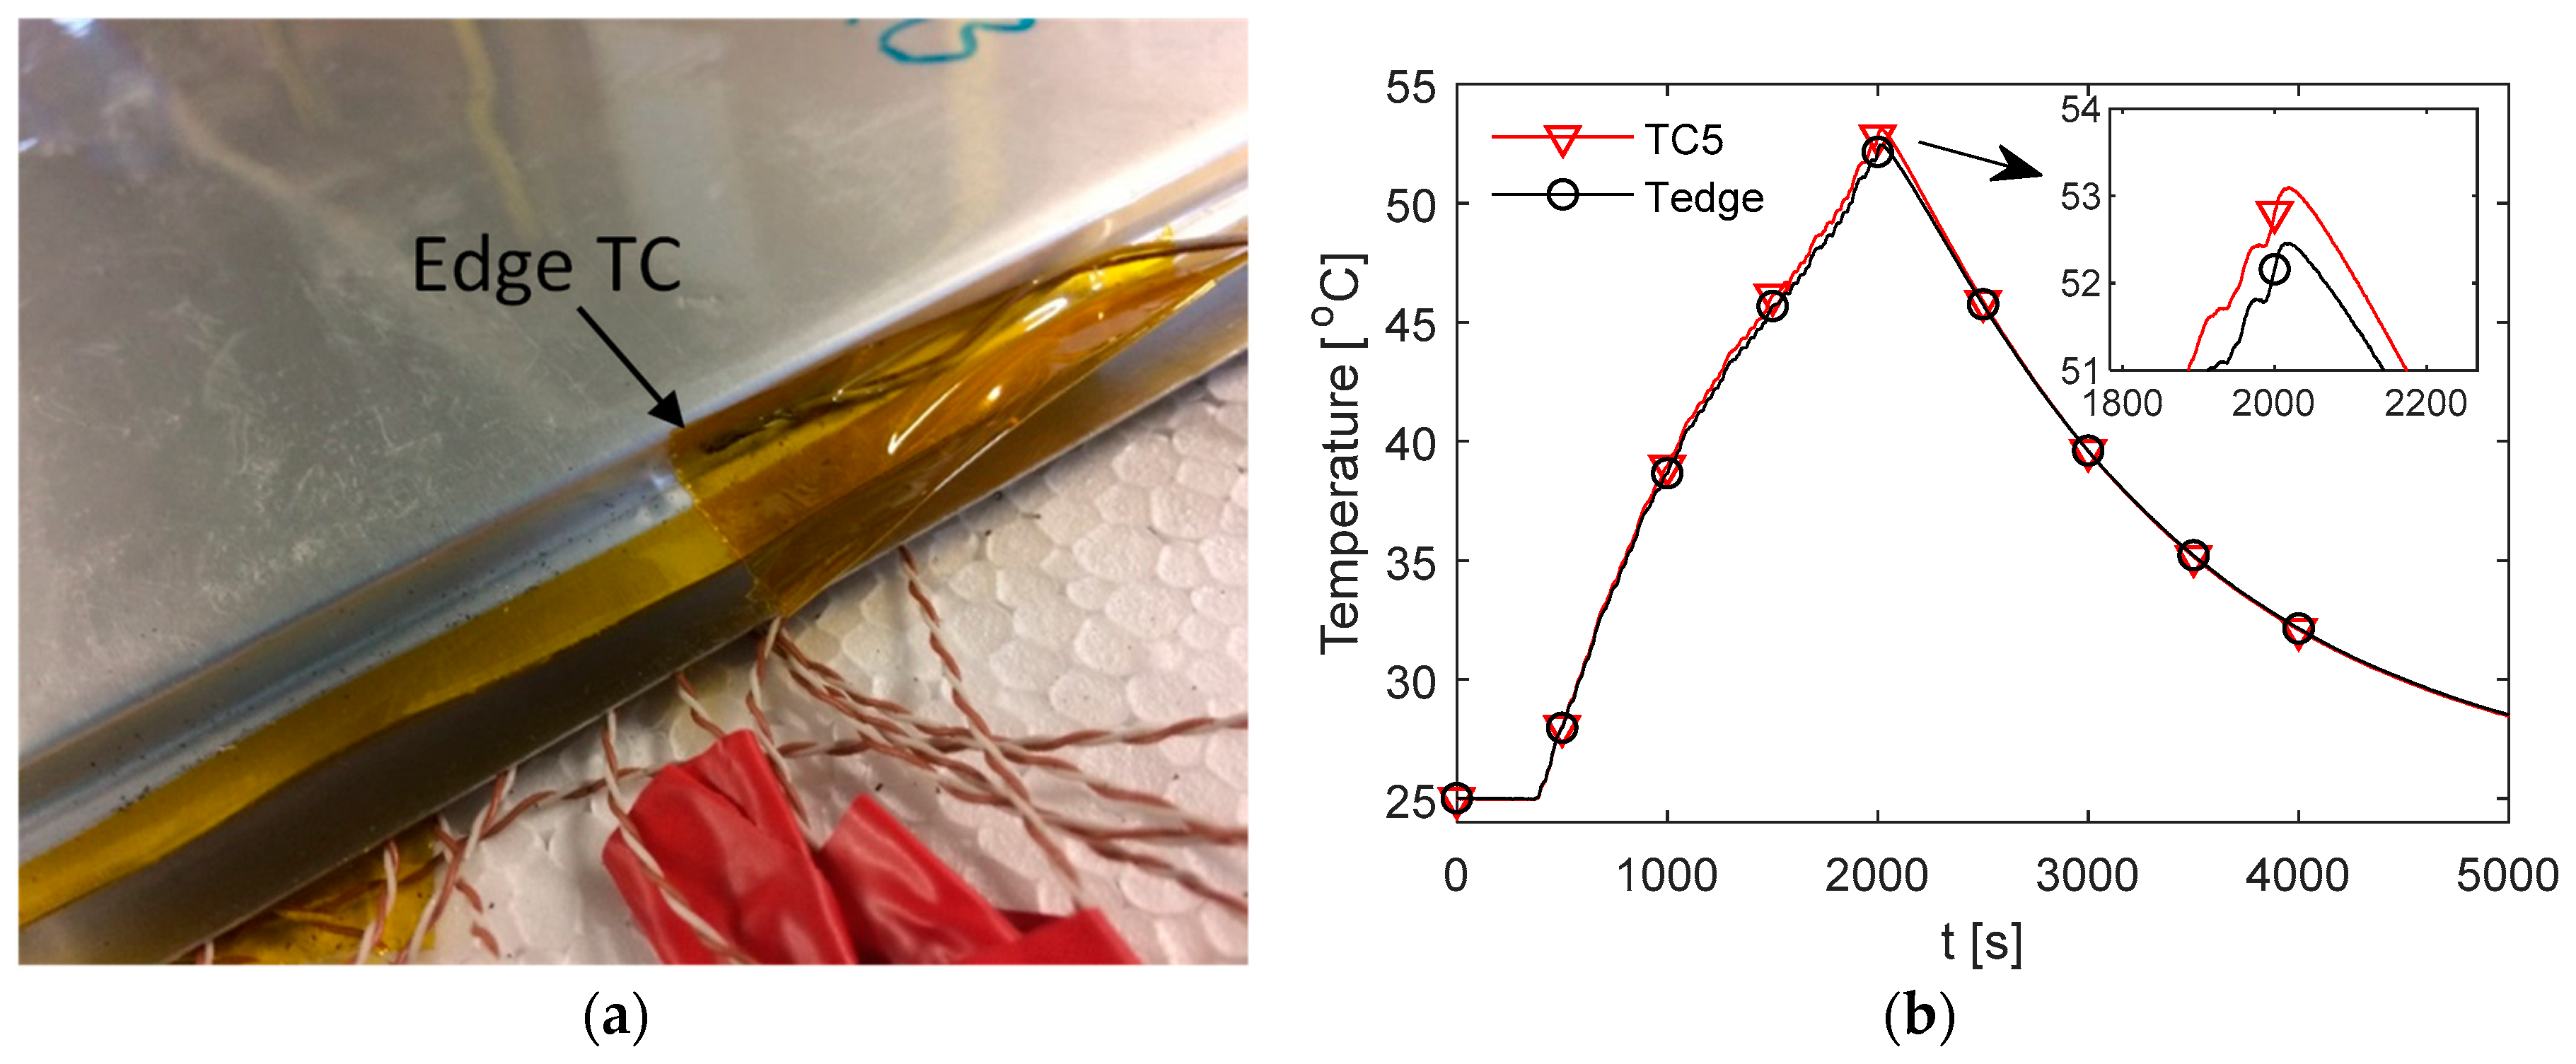
In this study, it has been chosen to avoid the use of a thermal interface material and rely on the applied pressure achieved within the test rig via the use of the air bag. To test whether there exists a large contact resistance that would result in a noticeable temperature drop between the cell surface and the measured thermocouple location on the fin surface, an additional thermocouple (termed
) is attached with Kapton tape on the accessible edge of the cell during testing with the aluminium fins. The location of the thermocouple on the side of the cell is shown in
Figure 10a, which shares the same y-coordinate position as the location of TC5.
A comparison between
and TC5 on the back fin (which is closest to the thermocouple location) during the race duty cycle for Cell 3 is shown in
Figure 10b. Here, it is observed that there is a maximum difference of 0.64 °C between the two measurements at the end of the cycle, whereby
is slightly cooler than TC5. This is not as expected given that there would exist a temperature drop across the interface and through the thickness of the fin. This may be explained due to the edge of the cell being exposed to the ambient air present in the spacing at the rear of the test rig and, therefore, experiences a cooling effect that is not present at TC5 which is sandwiched between the cell and the insulating polystyrene material. It is also possible that the difference is attributed to variability in the thermocouples, given that the value is lower than 1 °C.
The thermal resistance for conduction through the thickness of the fin under steady-state conditions may be expressed as [
46]
where
is the thermal resistance (K W
−1),
is the thickness of the fin (m),
is the cross-sectional area perpendicular to the heat flow (m
2) and
is the thermal conductivity of the fin in the direction of the heat flow (in this case, in the x-direction with reference to the coordinate scale in
Figure 2) (W m
−1 K
−1). The calculated
value for the k-core fin when taking
as 10 W m
−1 K
−1,
as 0.0395 m
2 and
as 0.52 mm for the APG core (neglecting the skin layer presence) results in a value of 0.0013 K W
−1. The battery heat generation rate assuming only irreversible components is expressed via [
47]
where
is the battery heat generation rate (W),
is the cell current (A) and
is the cell overpotential resistance (Ω). Assuming a static value of 1.33 mΩ for
based on the quoted resistance value given by the cell manufacturer at 50% cell SOC [
38], the average value for
across the race duty cycle is calculated as 49.2 W. Assuming a worst case scenario that 24.6 W is transferred into each fin upon reaching a quasi-steady-state, the temperature drop across the thickness of the fin is calculated as 0.03 °C, which may be assumed negligible. The thermal contact resistance is defined as [
46]
where
is the thermal contact resistance (m
2 K W
−1),
is the cell surface temperature (K),
is the fin surface temperature (in contact with the cell surface) and
is the heat flux (W m
−2). Given the surface area of the cell body is 0.0395 m
2, the steady-state heat flux again assuming 24.6 W is 622.8 W·m
−2. For a 1 °C drop to exist between the cell and fin surface, an
value of 16.1 × 10 °C
−4 m
2 K W
−1 is calculated. For comparison, Xia et al. [
48] reported a value of
on the order of 1 × 10
−4 m
2 K W
−1 for a typical indirect liquid-cooled system. Therefore, poor contact between the fin and pouch cell surface would have to be present for the temperature gradient across the junction to exceed 1 °C.
The results from this analysis, together with the experimental data from
Figure 10b do not support a temperature drop between the cell and measured fin surface exceeding 1 °C. It may, therefore, be a reasonable assumption to assume that the measured fin surface temperature approximates the temperature on the cell surface for a given
yz coordinate under even the most aggressive of testing scenarios. Ultimately, further testing would be required to determine the exact value of
for this system.
For a practical application within a real vehicle system, the use of a thermal interface material such as double-sided adhesive tape (as employed in Reference [
20]) may be required if sufficient stack pressure cannot be applied. One potential advantage of the k-core material over the conventional copper and aluminium materials in this regard is from its additional flexibility, which may allow it to better conform to the pouch cell surface to further reduce the thermal contact resistance and/or to remove the need for a thermal interface material. Further work may wish to seek the relationship between the applied stack pressure and the thermal contact resistance for the different fin materials.
3.2. Identification of the Fin Hot Spot and Maximum Temperature Gradient
The maximum fin temperature ) and maximum fin temperature gradient ) are important parameters to gauge the thermal performance of the thermal management system. It is desirable to reduce to ensure that the cell operates at a more uniform temperature, whereas a lower is desirable to reduce the rate of high-temperature-related ageing mechanisms for the cell. Controlling is also imperative to ensure that upper temperature thresholds for the cell are not exceeded, thus reducing the risk of the cell entering a thermal runaway event.
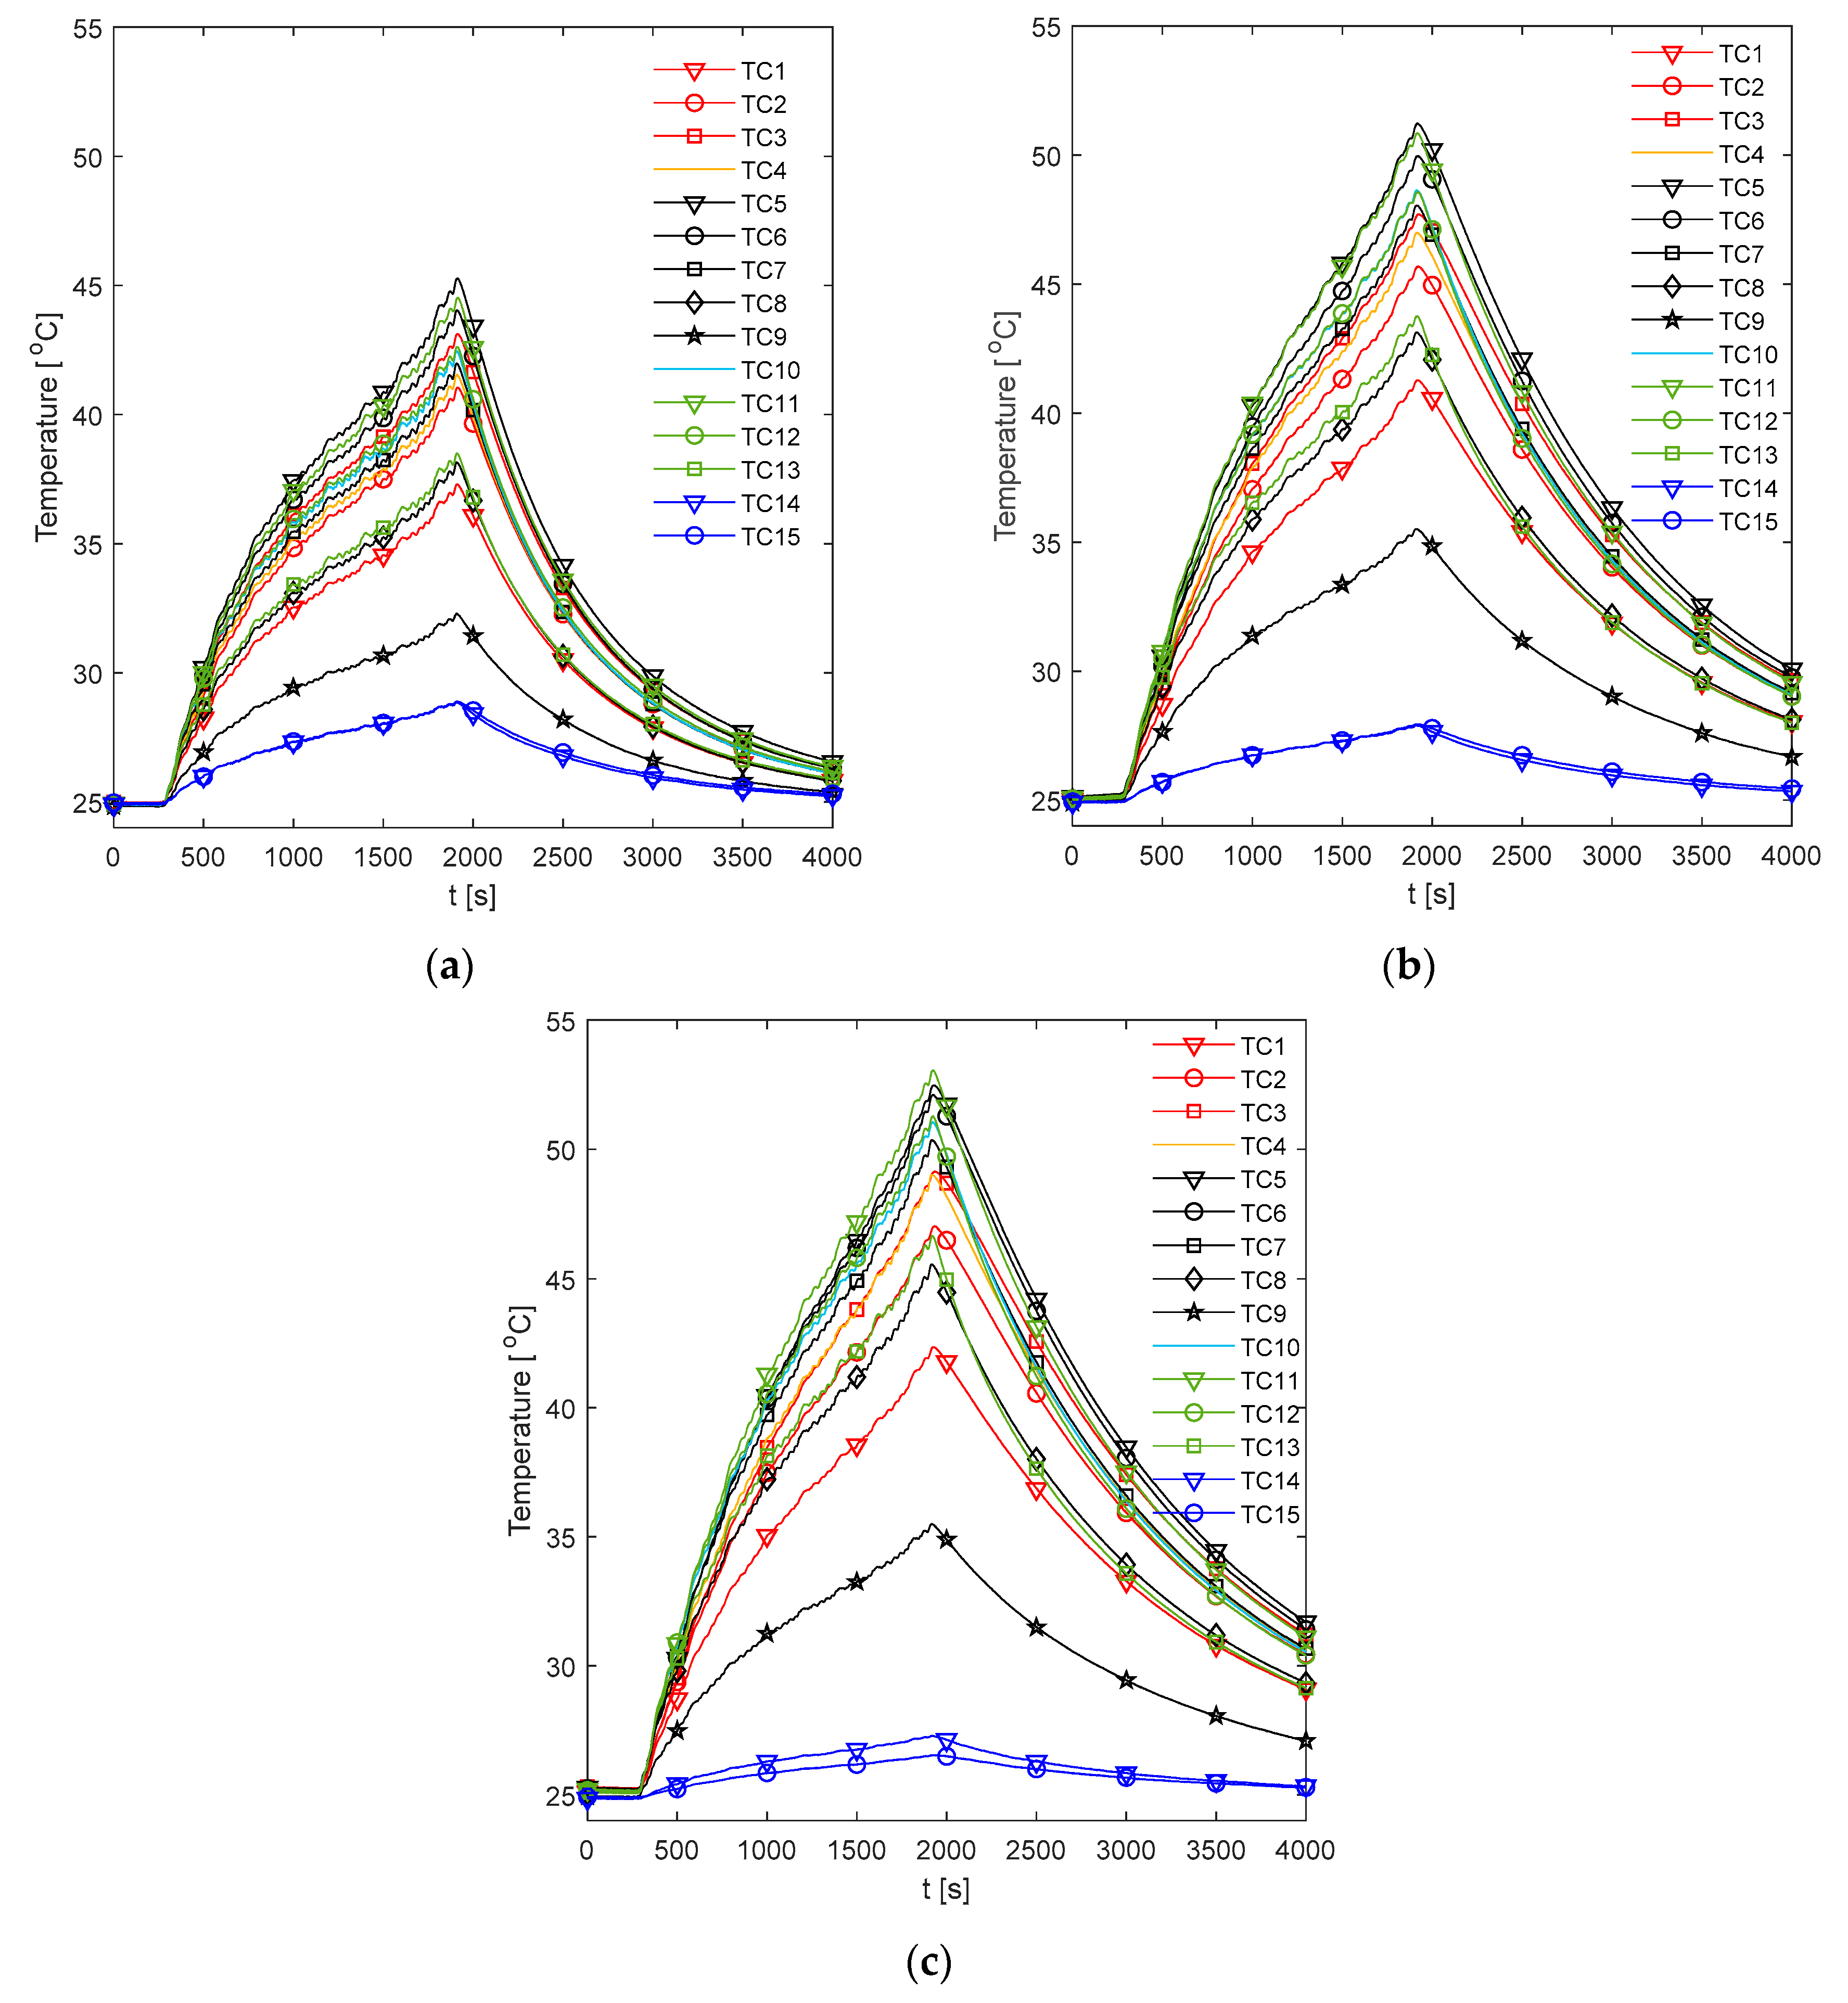
Figure 11 demonstrates the temperature measurements obtained across the front fin sample of Cell 4 for each of the analysed fin materials during the race duty cycle. For the k-core fin (
Figure 11a), it is observed that TC5 provides the hottest measurement followed closely by TC11. This is to be expected as TC5 is the furthest measured location from the cooled edge of the fin. It is also observed that TC11 is hotter than TC3, which implies that the cell is experiencing a degree of cooling on the tabs leading to hotter temperatures towards the base of the fin for a given position along the
y-axis. Cooling at the tabs may be caused due to the brass busbar blocks providing a large thermal mass, where any accumulated heat is further conducted through the busbar and along the protruding brass screw to be dissipated to the ambient via the active air circulation within the climate chamber. This is consistent with the observations of Grandjean et al. [
22], who applied a similar mechanism of achieving an electrical connection to the tabs of large format pouch cells and witnessed a cooling effect on the tabs during aggressive electrical loading conditions (5 C in their case).
A similar behavior is observed for the copper fin which is shown in
Figure 11b. However, for the aluminium fin (
Figure 11c), it is observed that TC11 is slightly hotter than TC5. This is not always the case for the other samples, whereby TC5 can become hotter. This may be due to small variations in the positioning of the cell tabs within the busbar blocks which results in offsets between the exact positioning of the cell body under the fin surface, which may contribute to the shift of the hot spot between TC5 and TC11. For example, a slight offset in the positioning of the cell to the left would result in TC5 no longer overlaying the edge of the cell, thus positioning it further from the heat generation source and, therefore, reducing the measurement value relative to TC11 which is still overlaying the cell material. This cause of variance is discussed further in
Section 3.4, and may be more prominent for the cells cooled with lower thermally conductivity fins which incur greater temperature gradients across the fin body. For all analysed fin materials, the measured cold spot across the fin body is given by TC9, which is as expected due to its closest proximity to the cold plate.
Given that the temperature difference between TC5 and TC11 appears to be minimal, whereby the measured hot spot may, in some instances, interchange slightly between the two; the remainder of the analysis will focus on the measurements from TC5 and TC5–TC9, which are considered as and respectively. This is performed to provide consistent comparisons between the fin material samples and to enable an averaging of the values across the back fin samples given that these measurements are also present at these locations.
3.3. Comparisons between Fin Materials
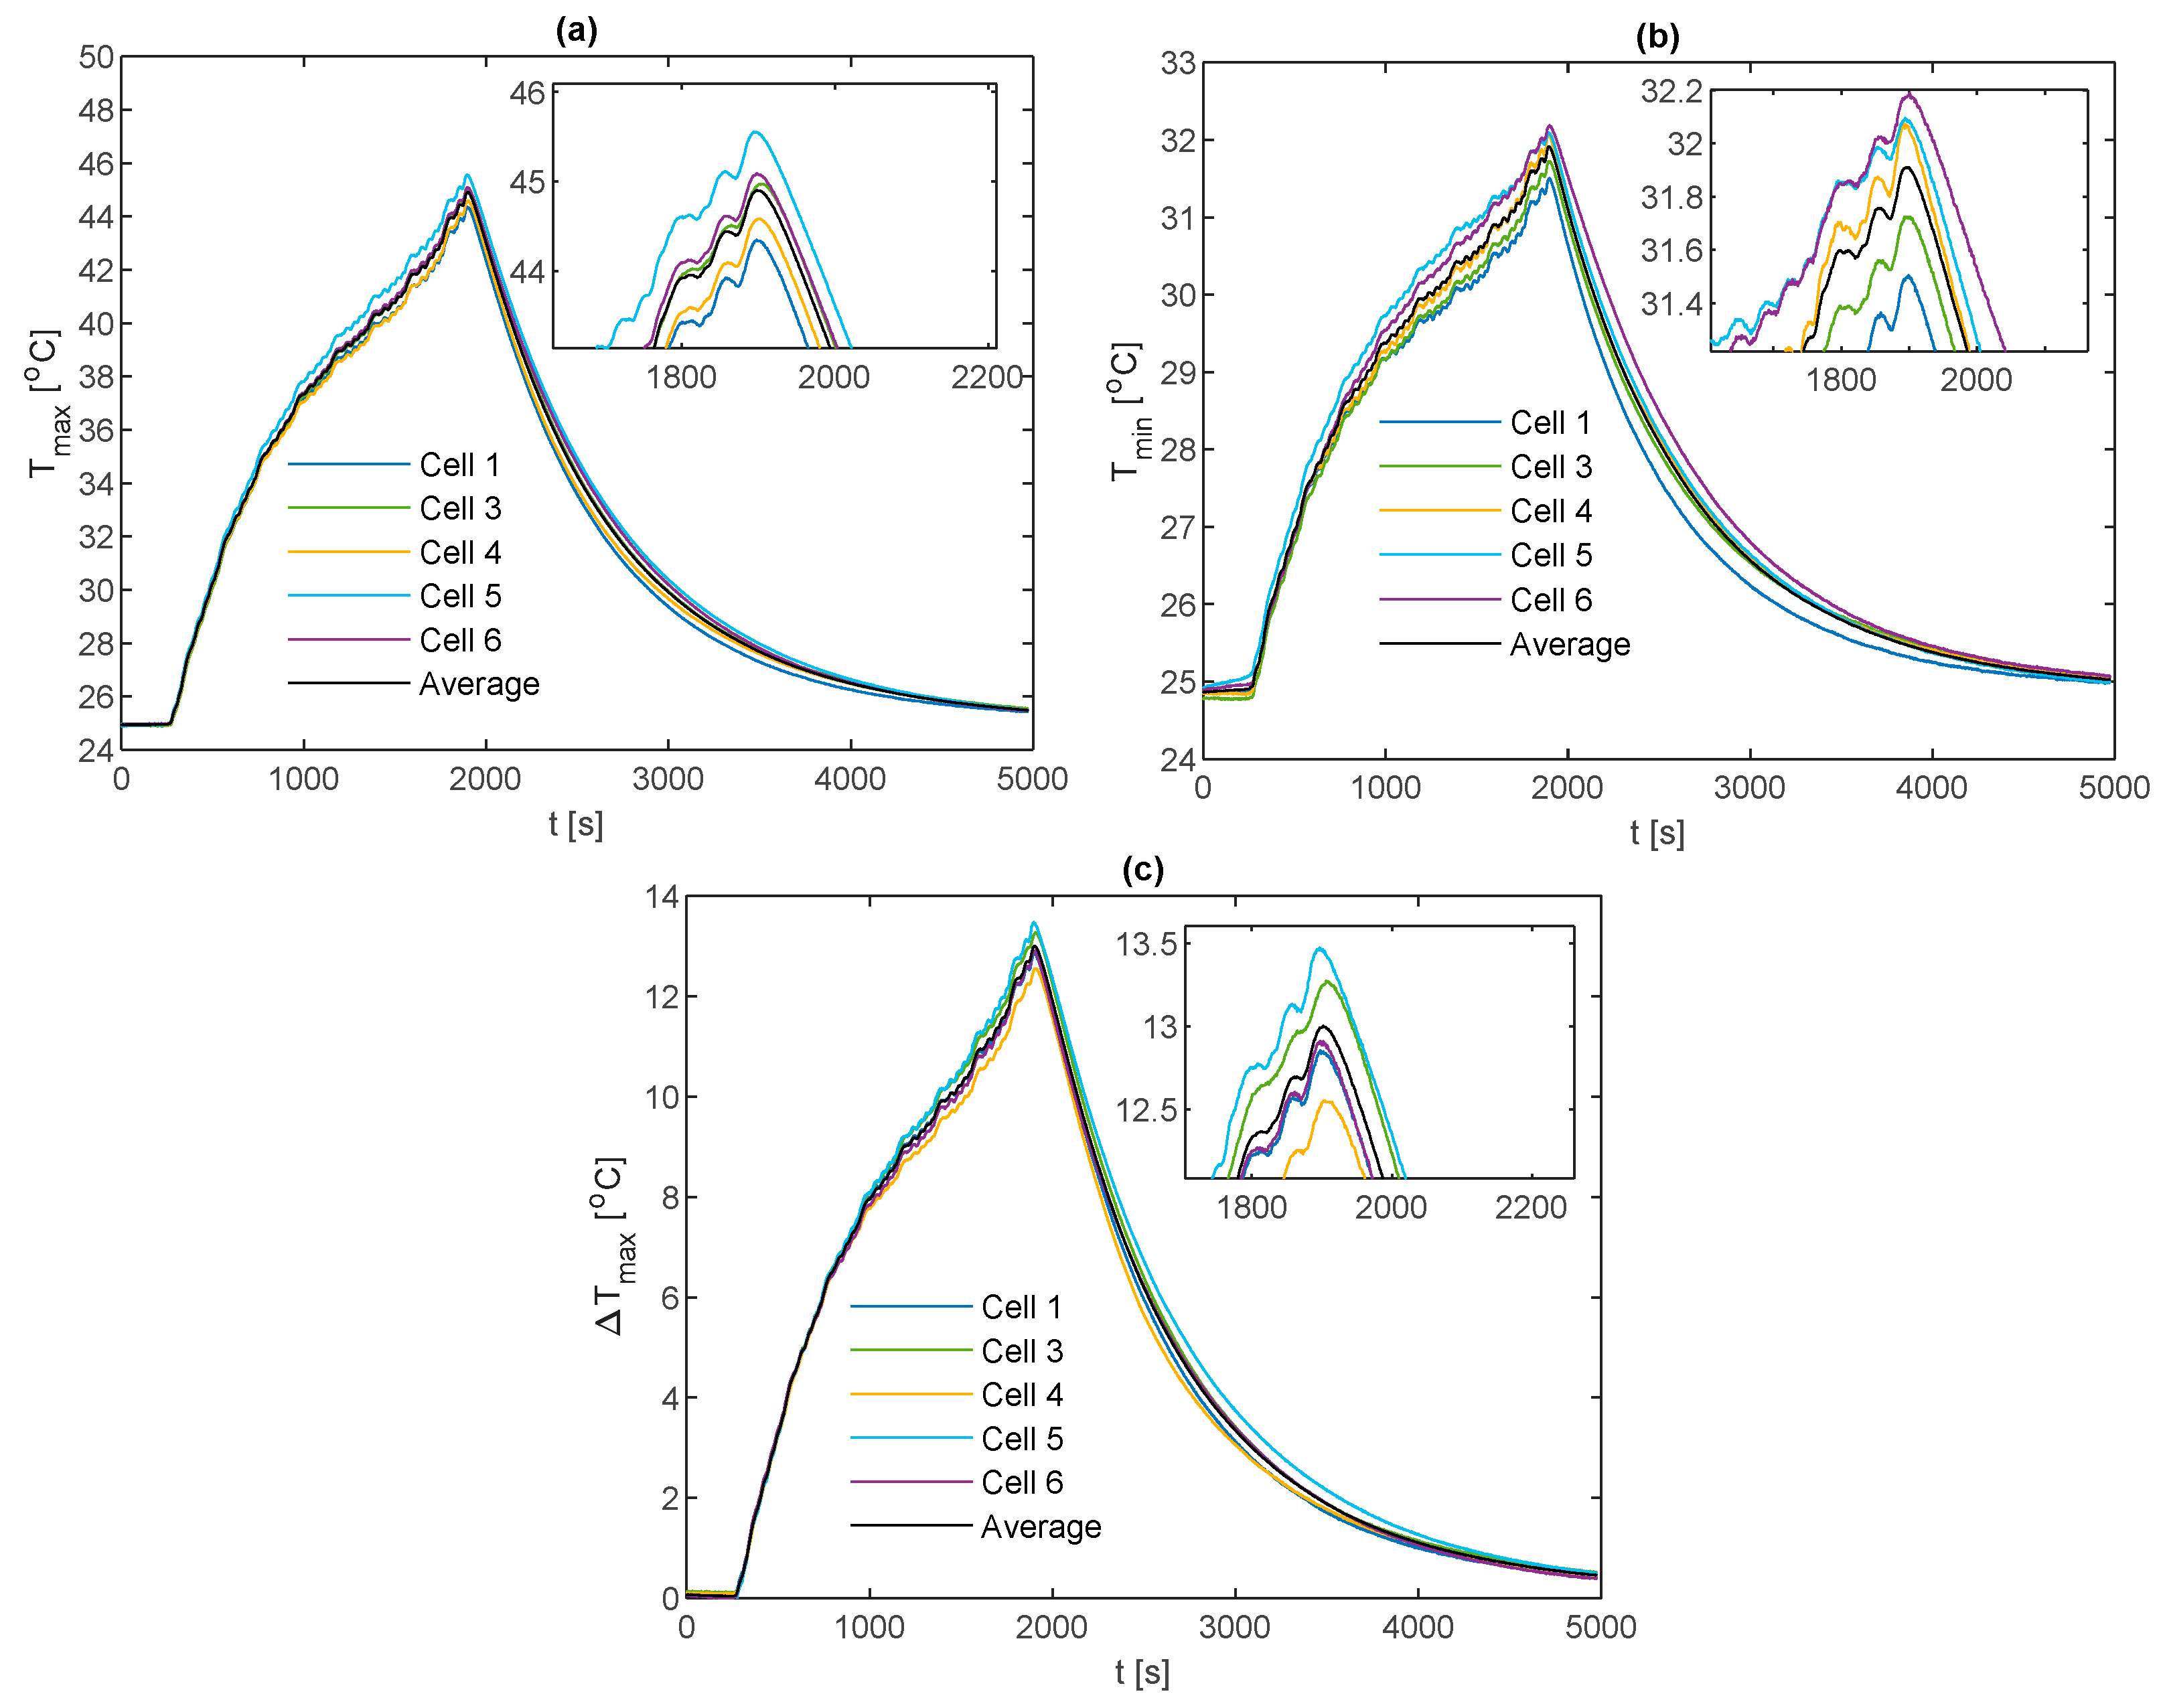
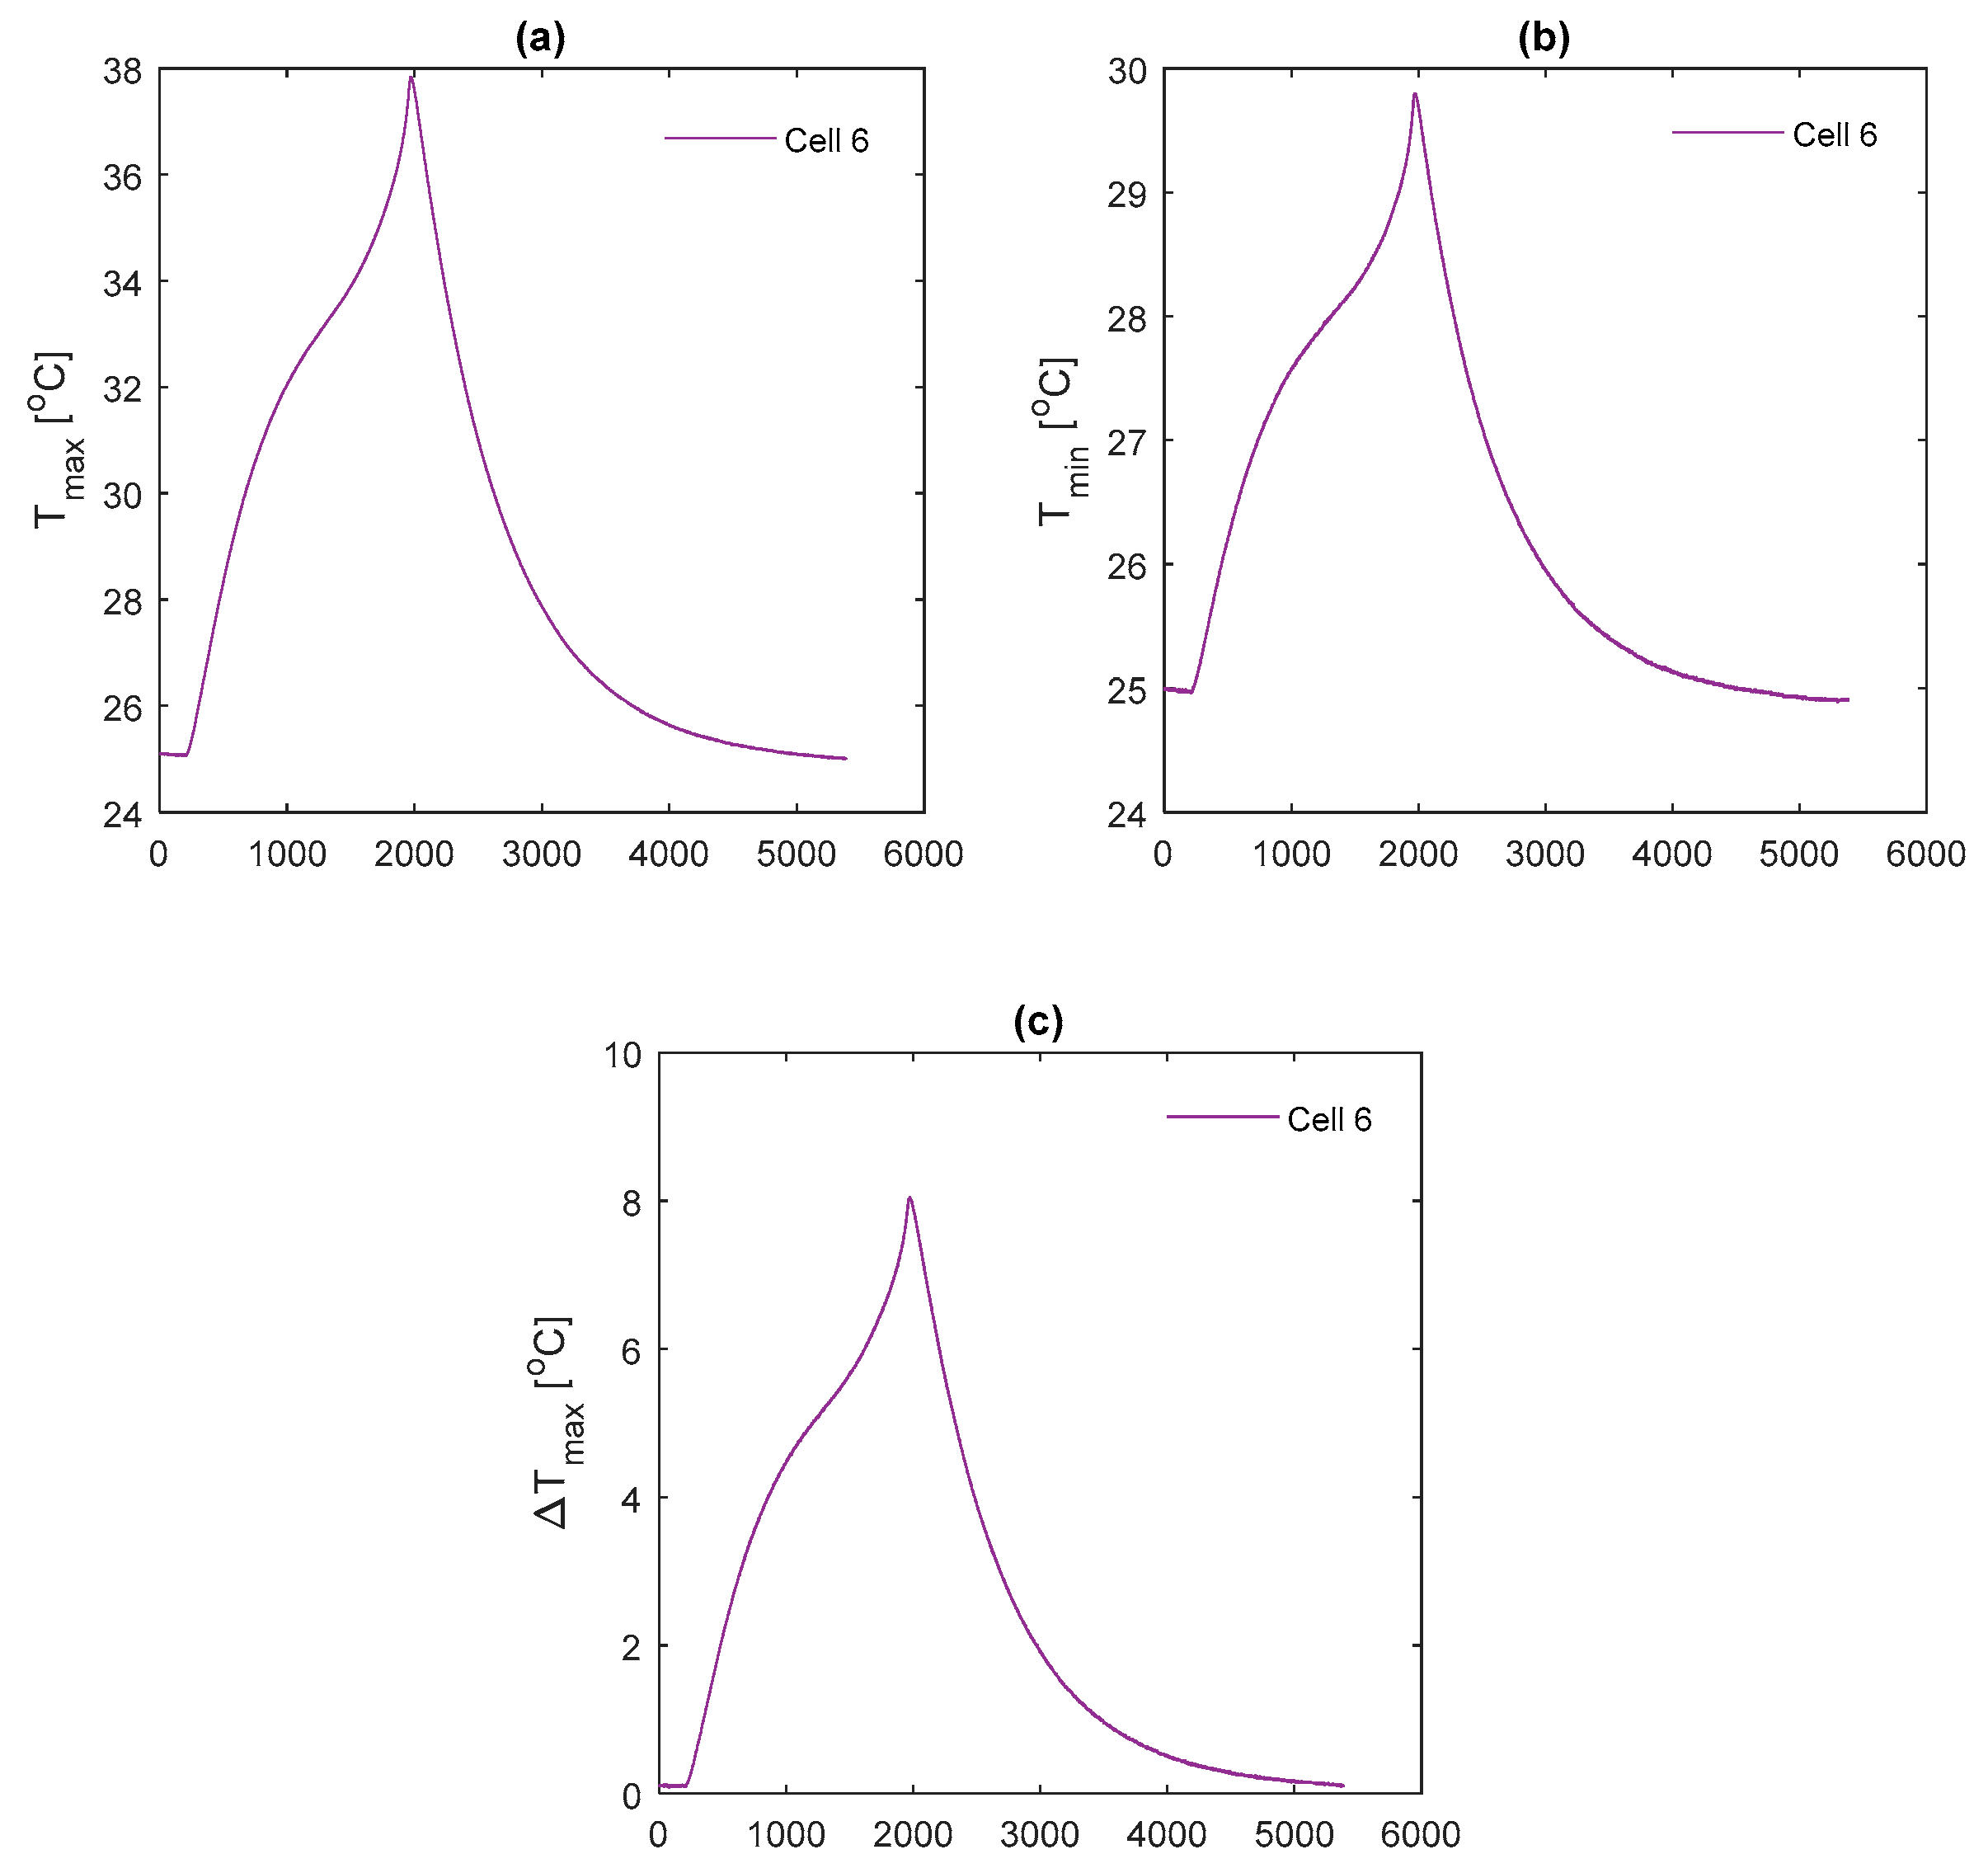
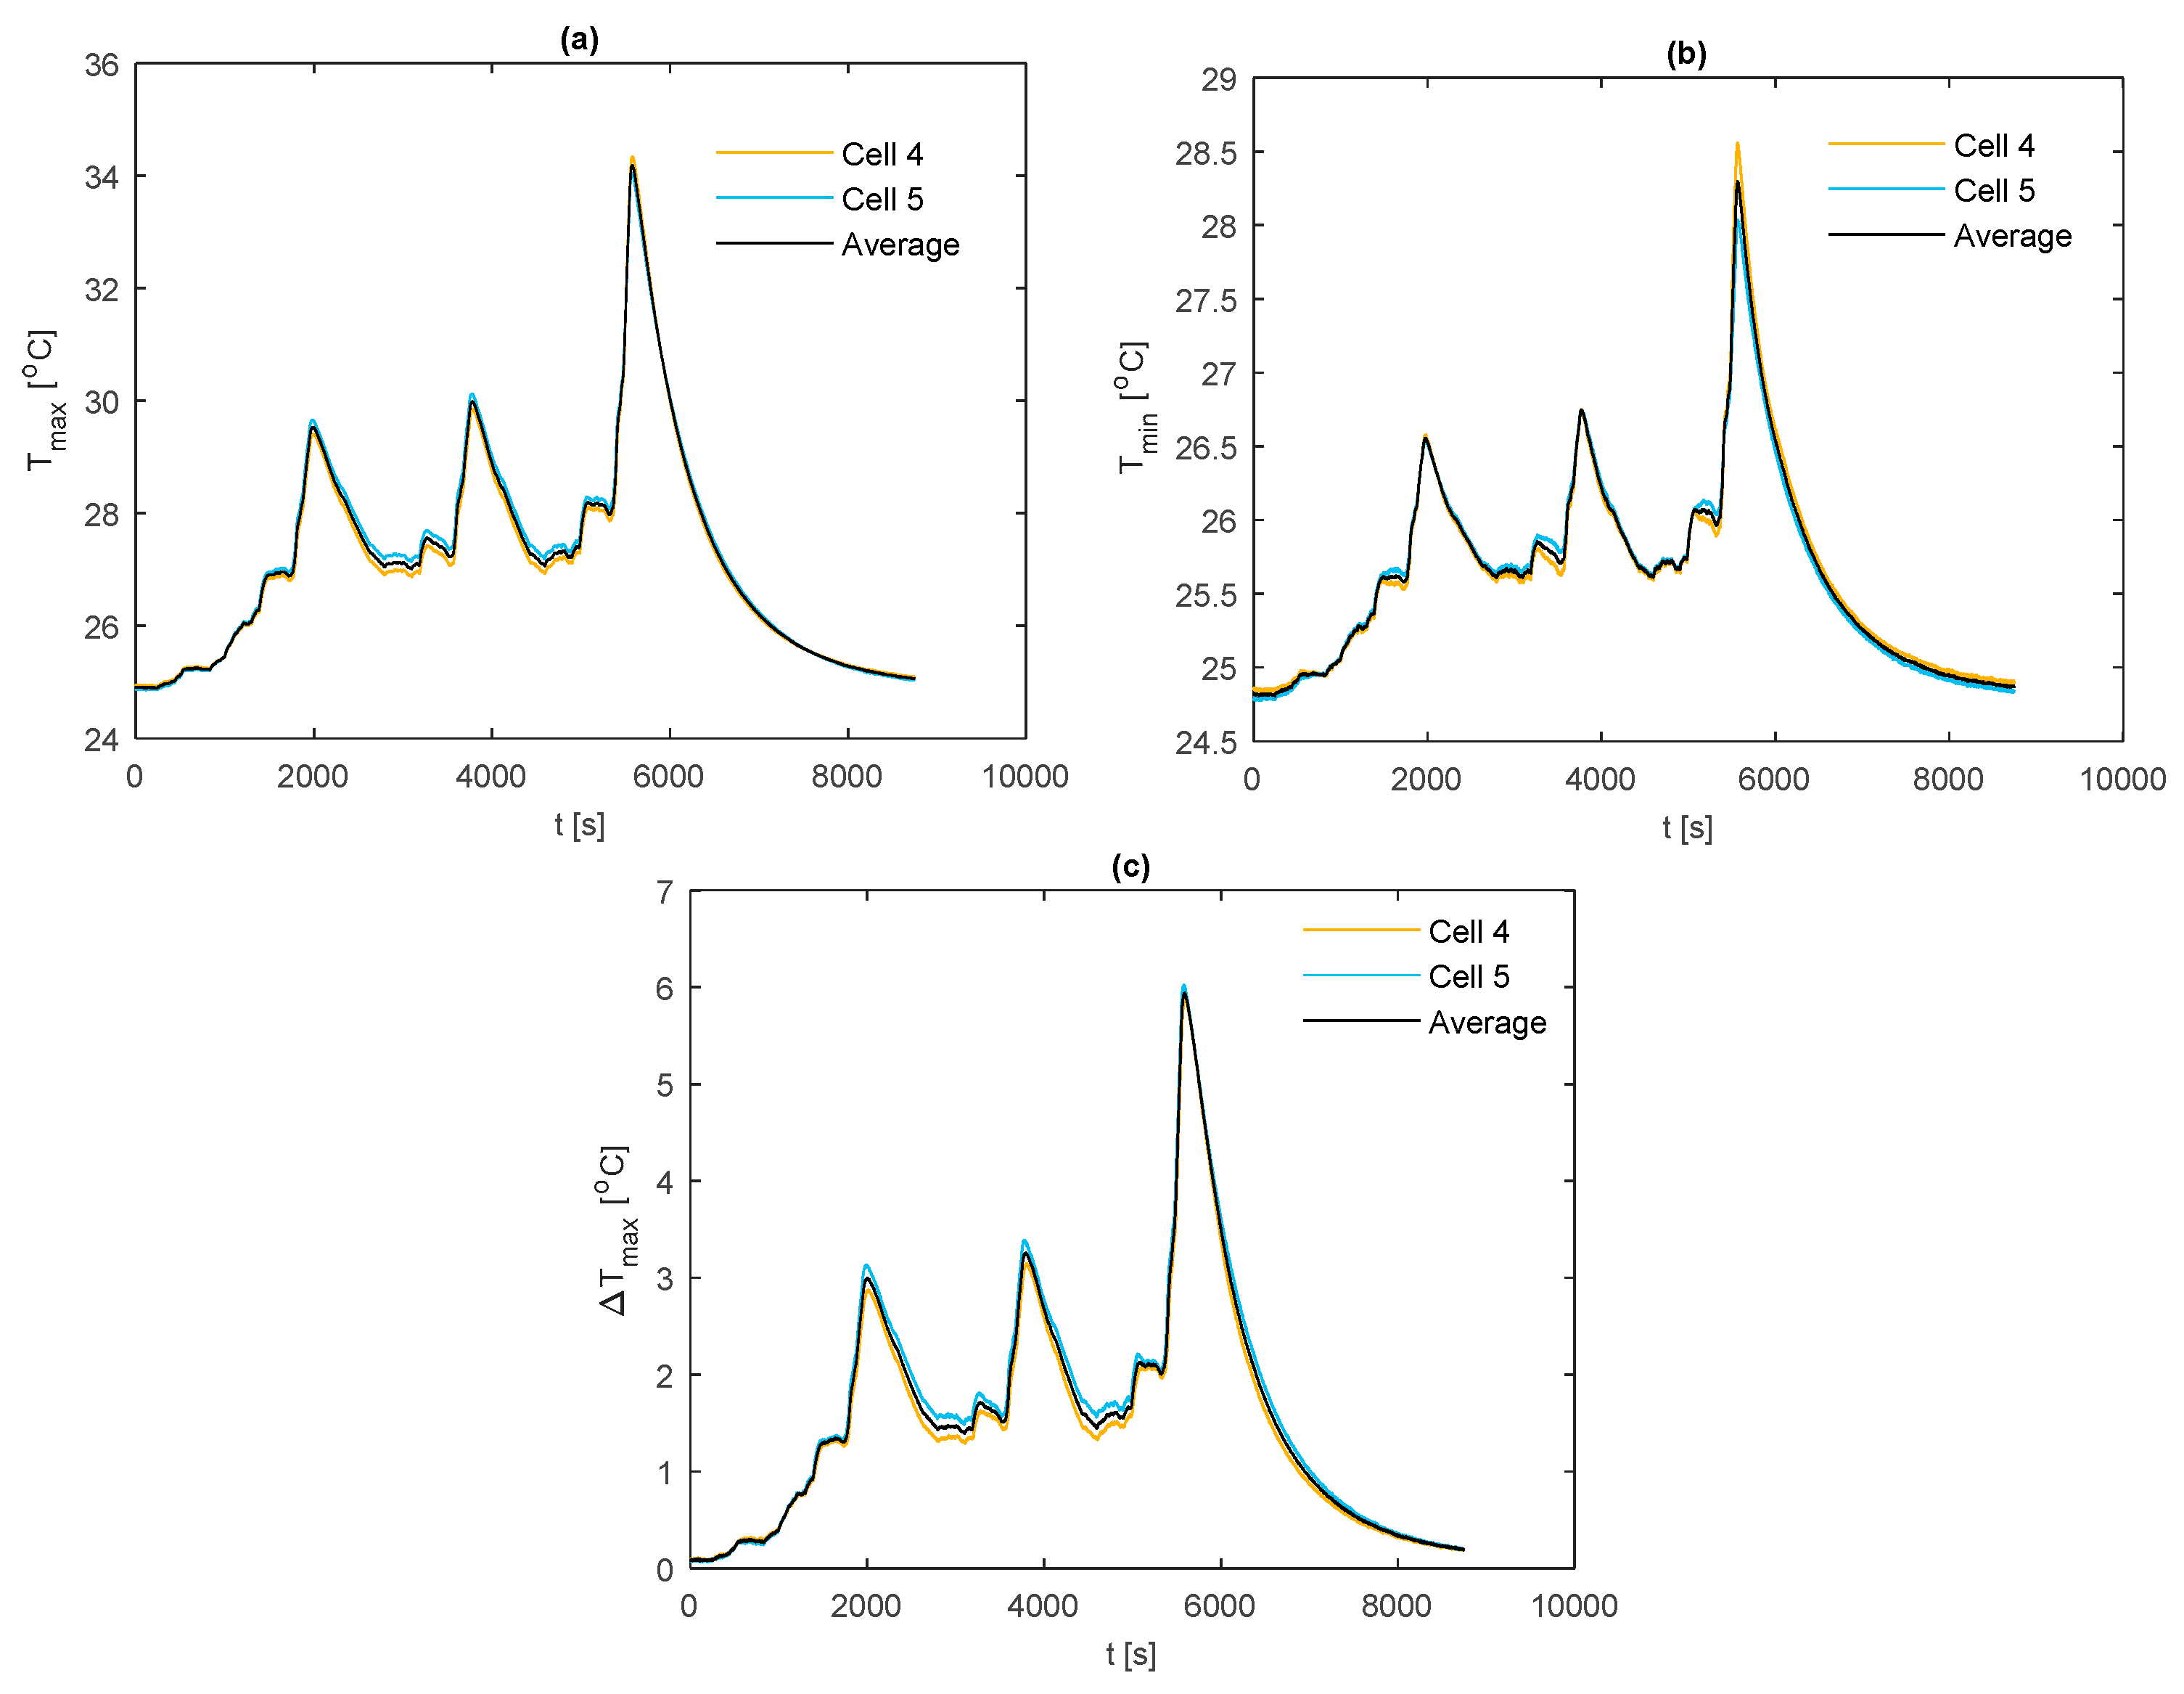
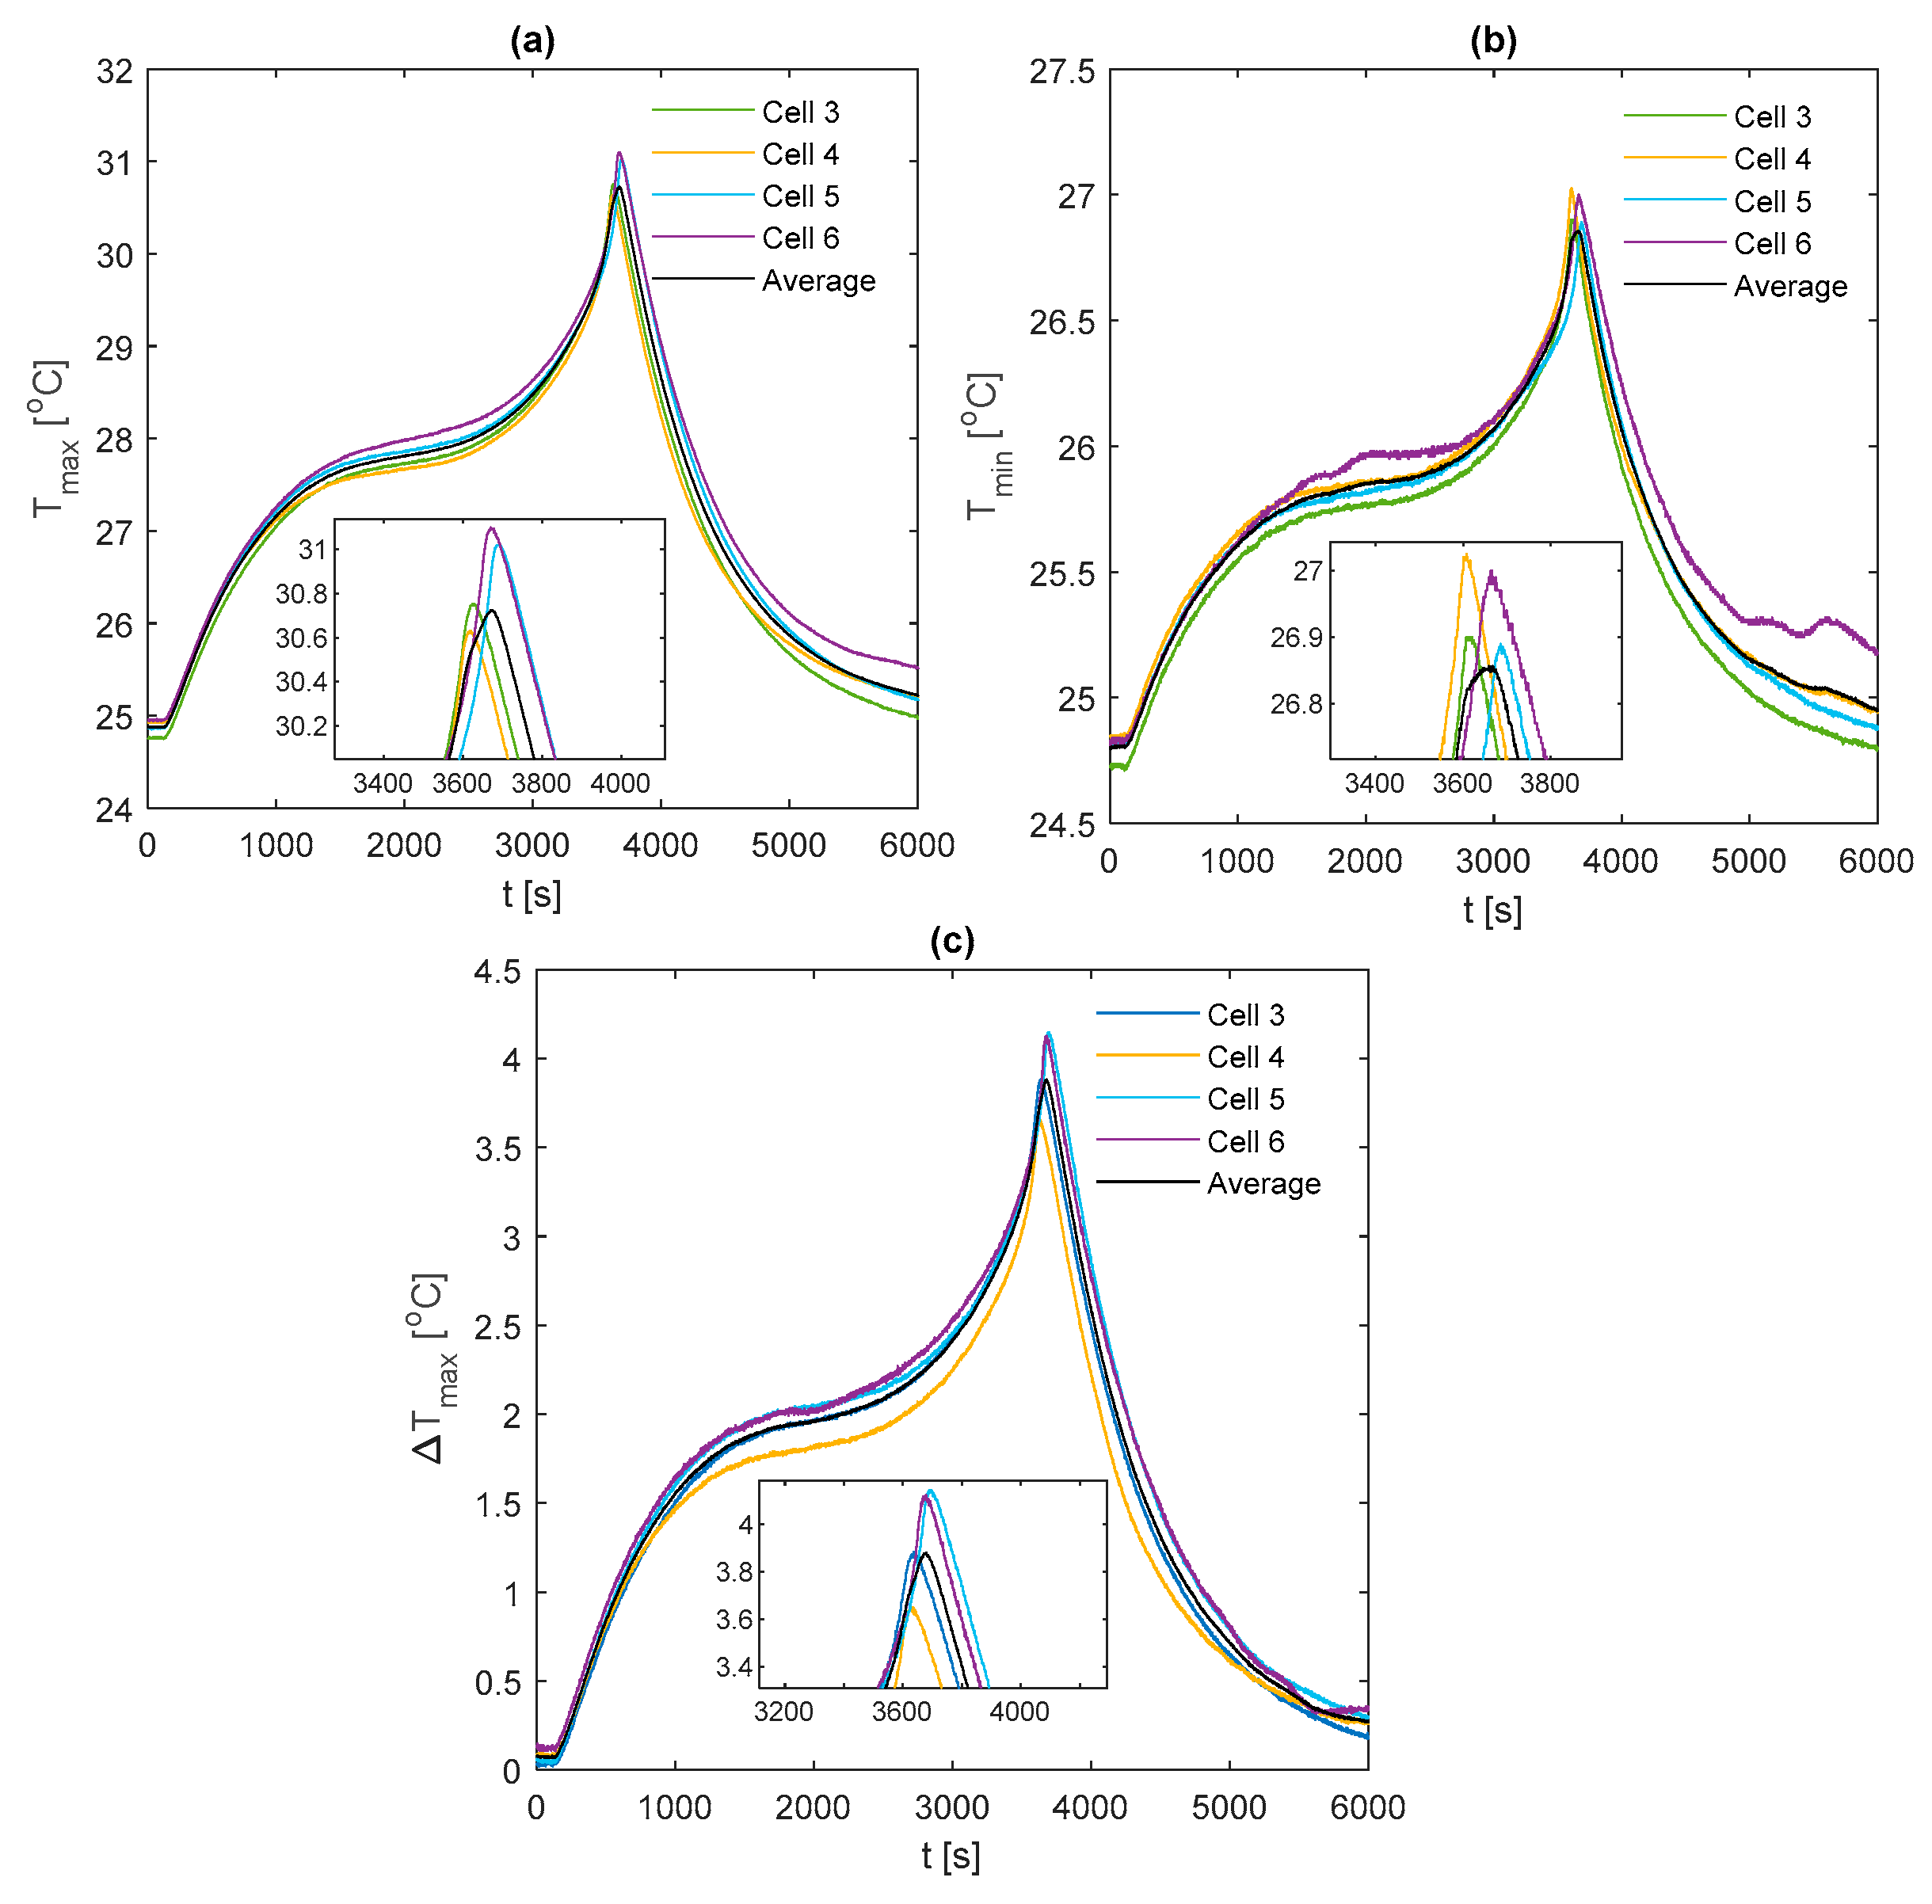
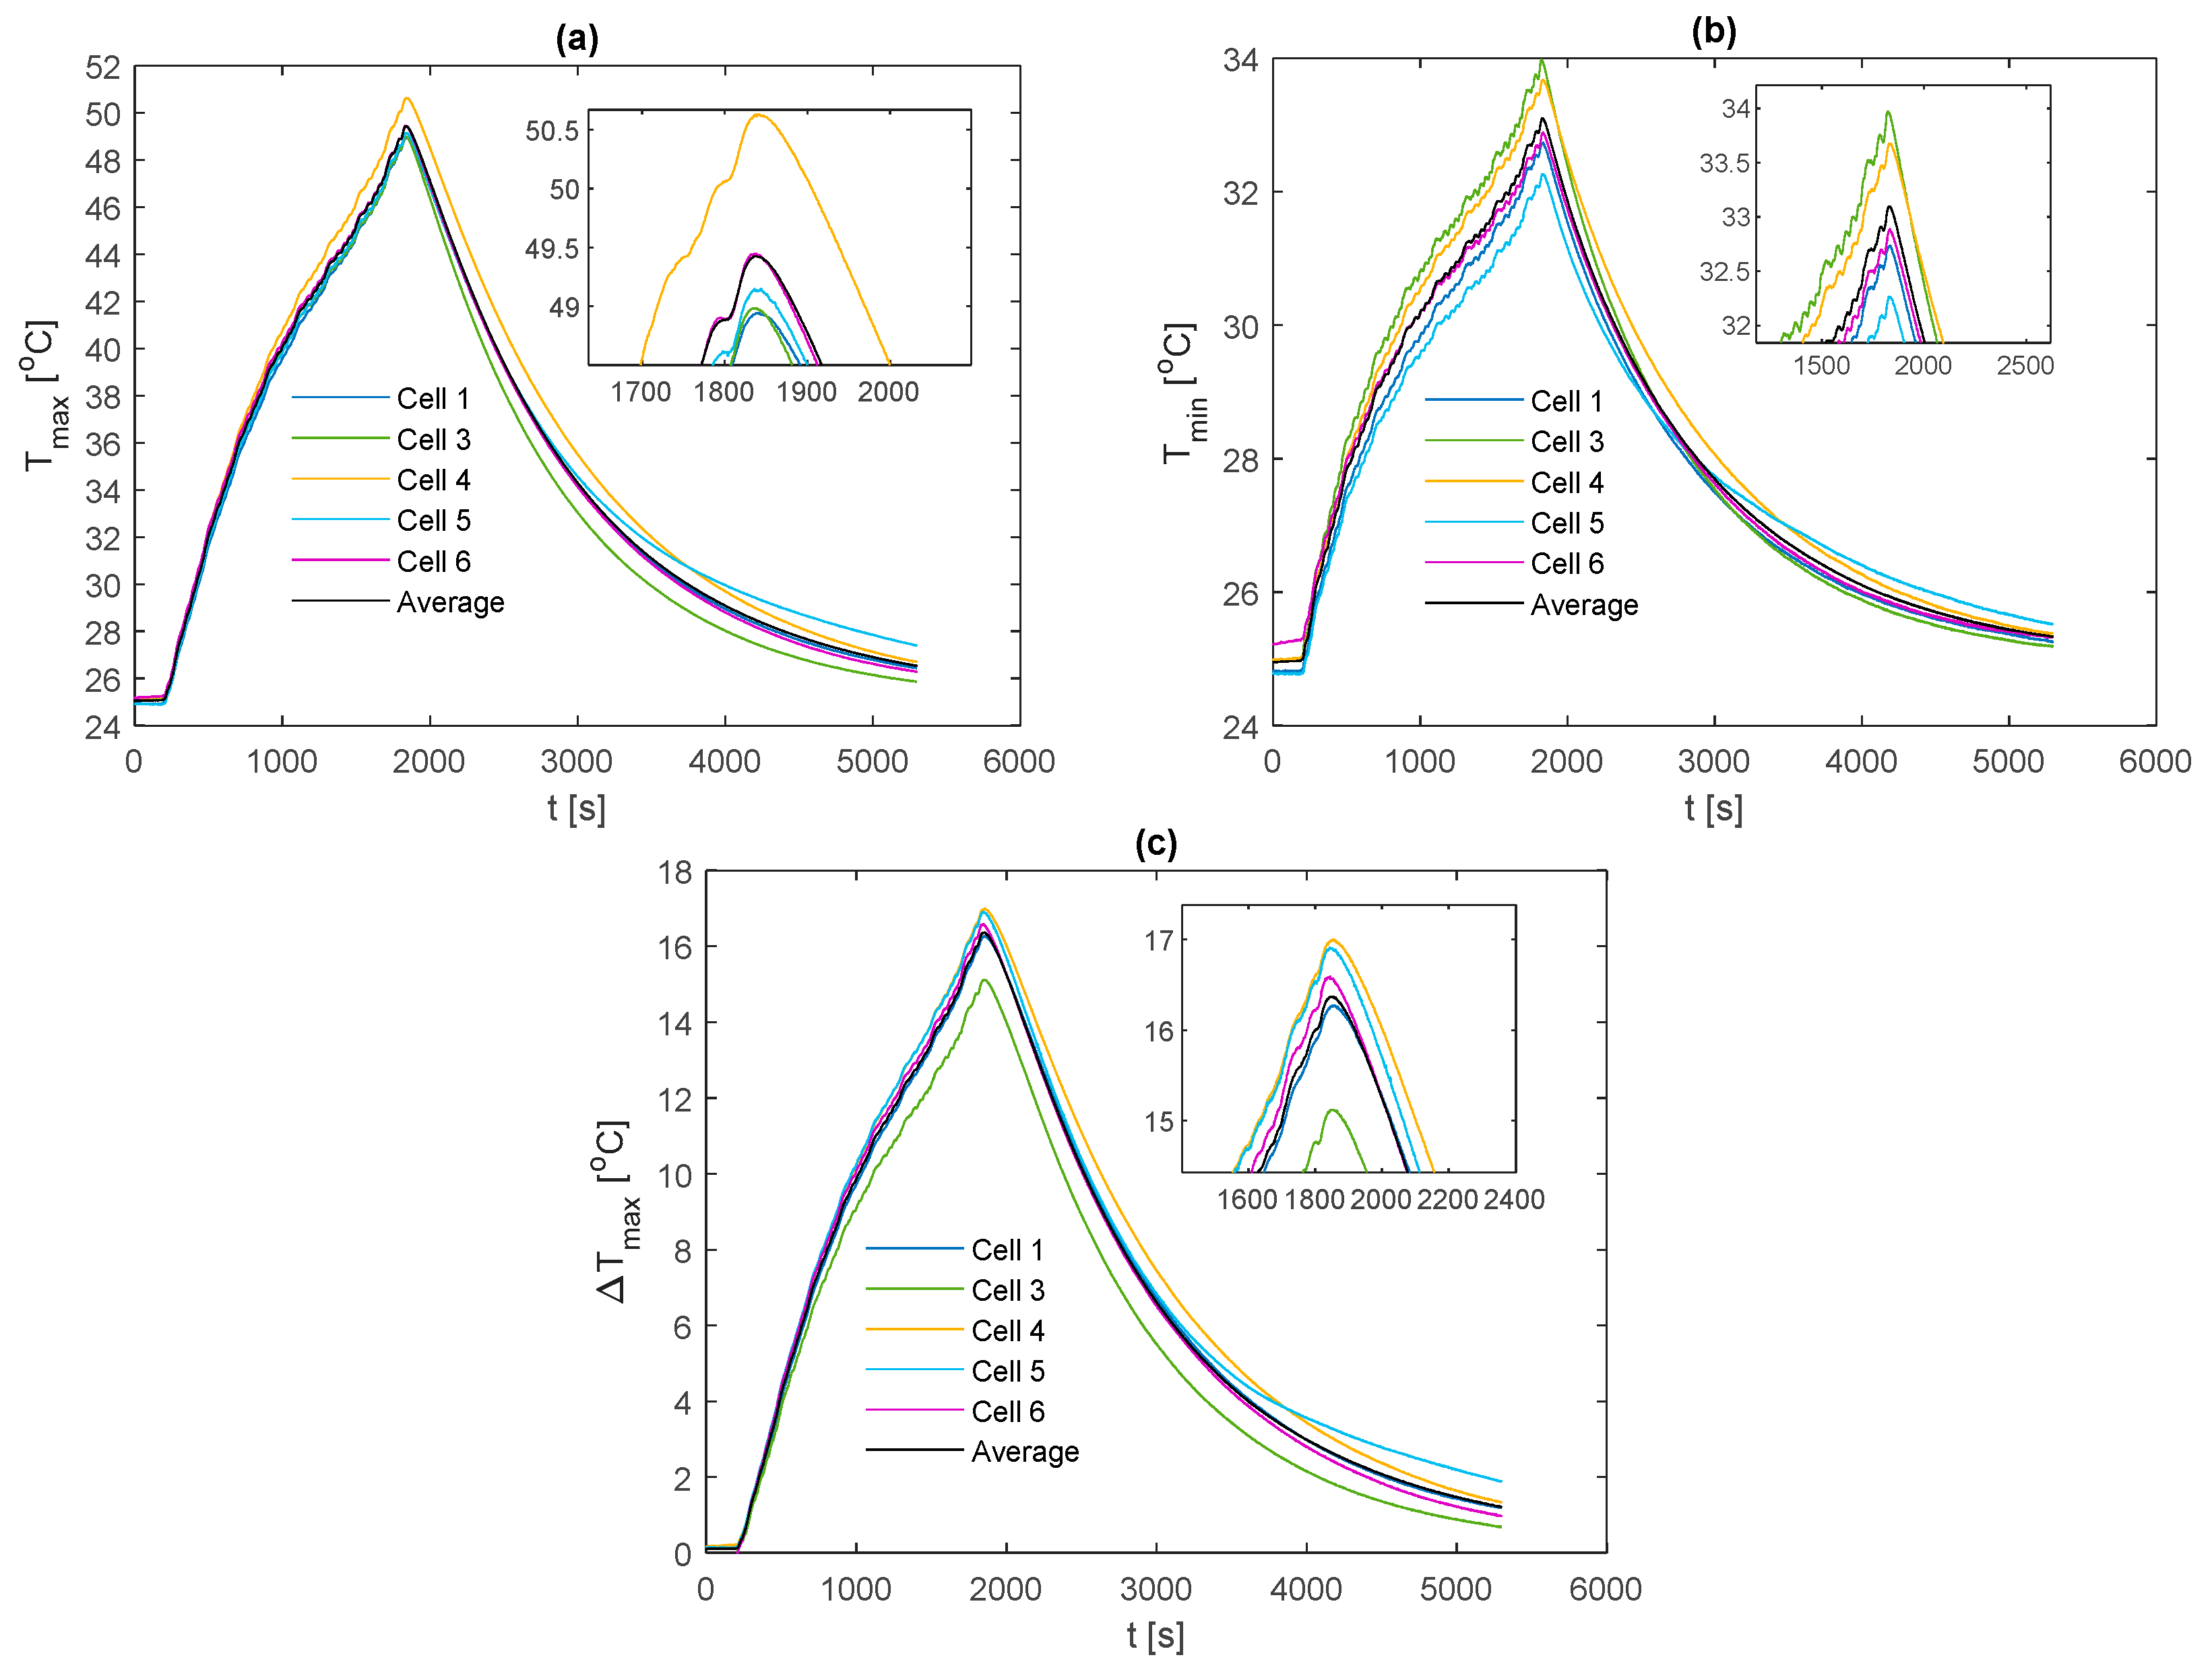
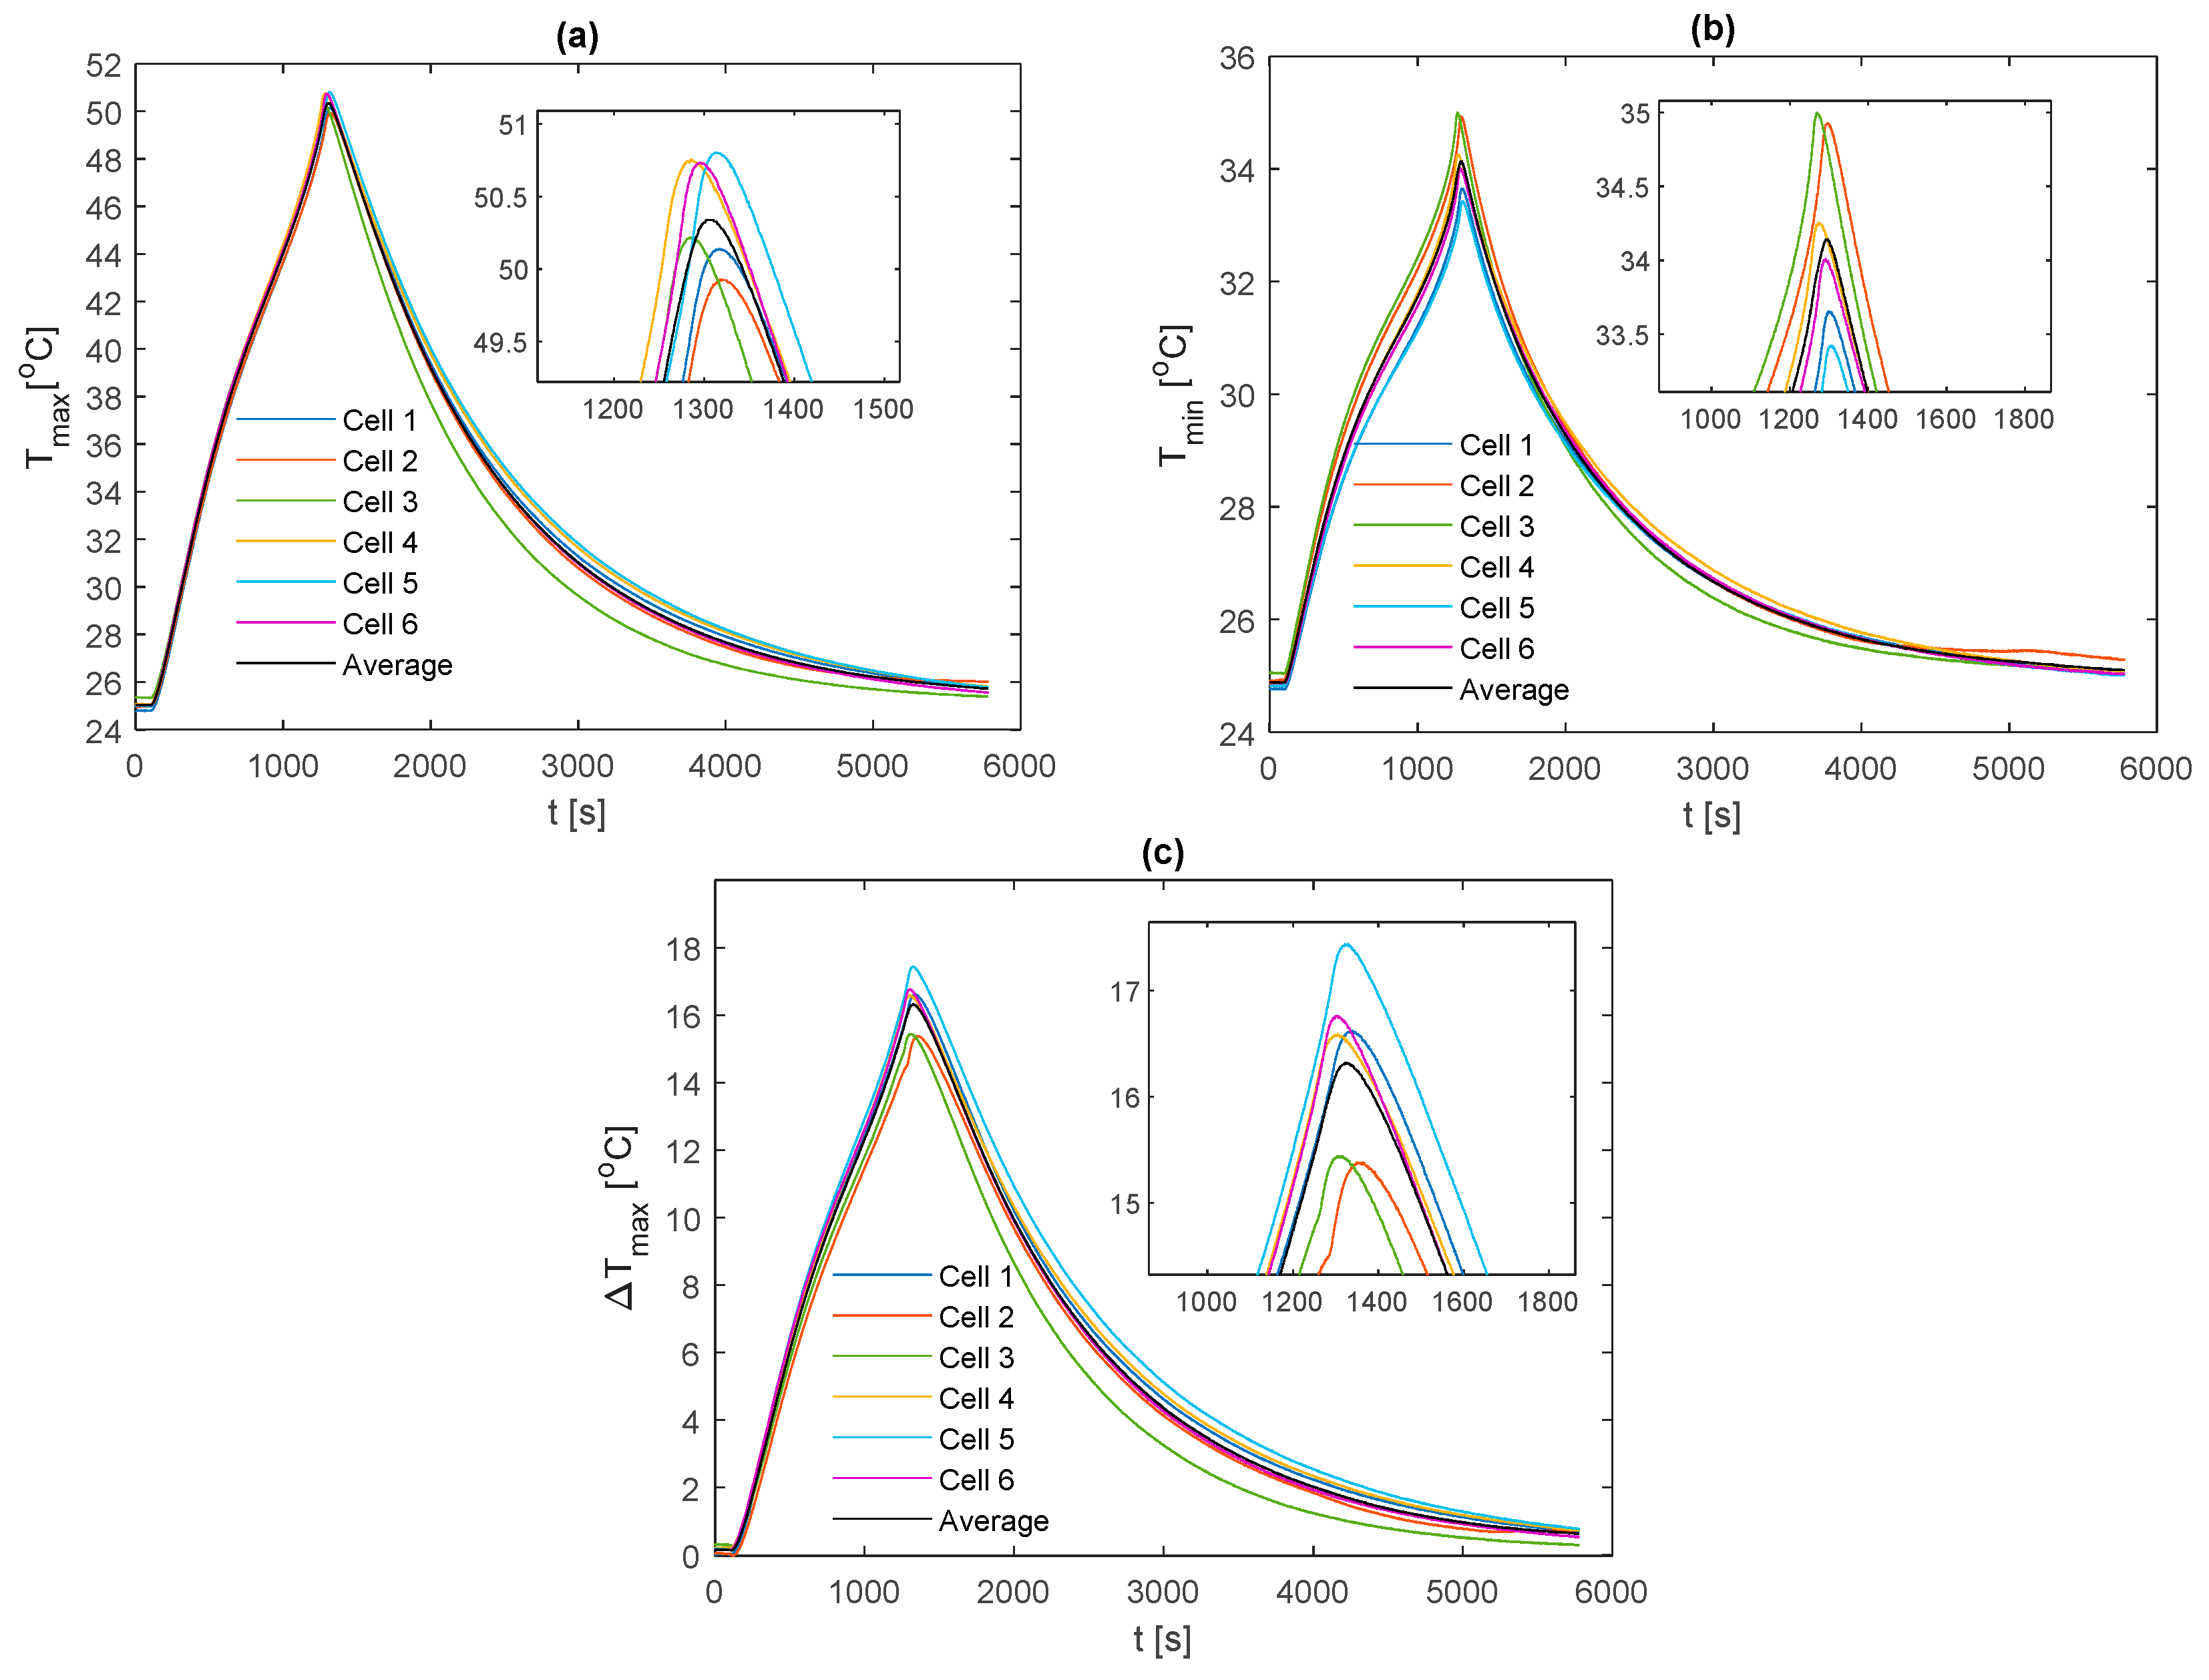
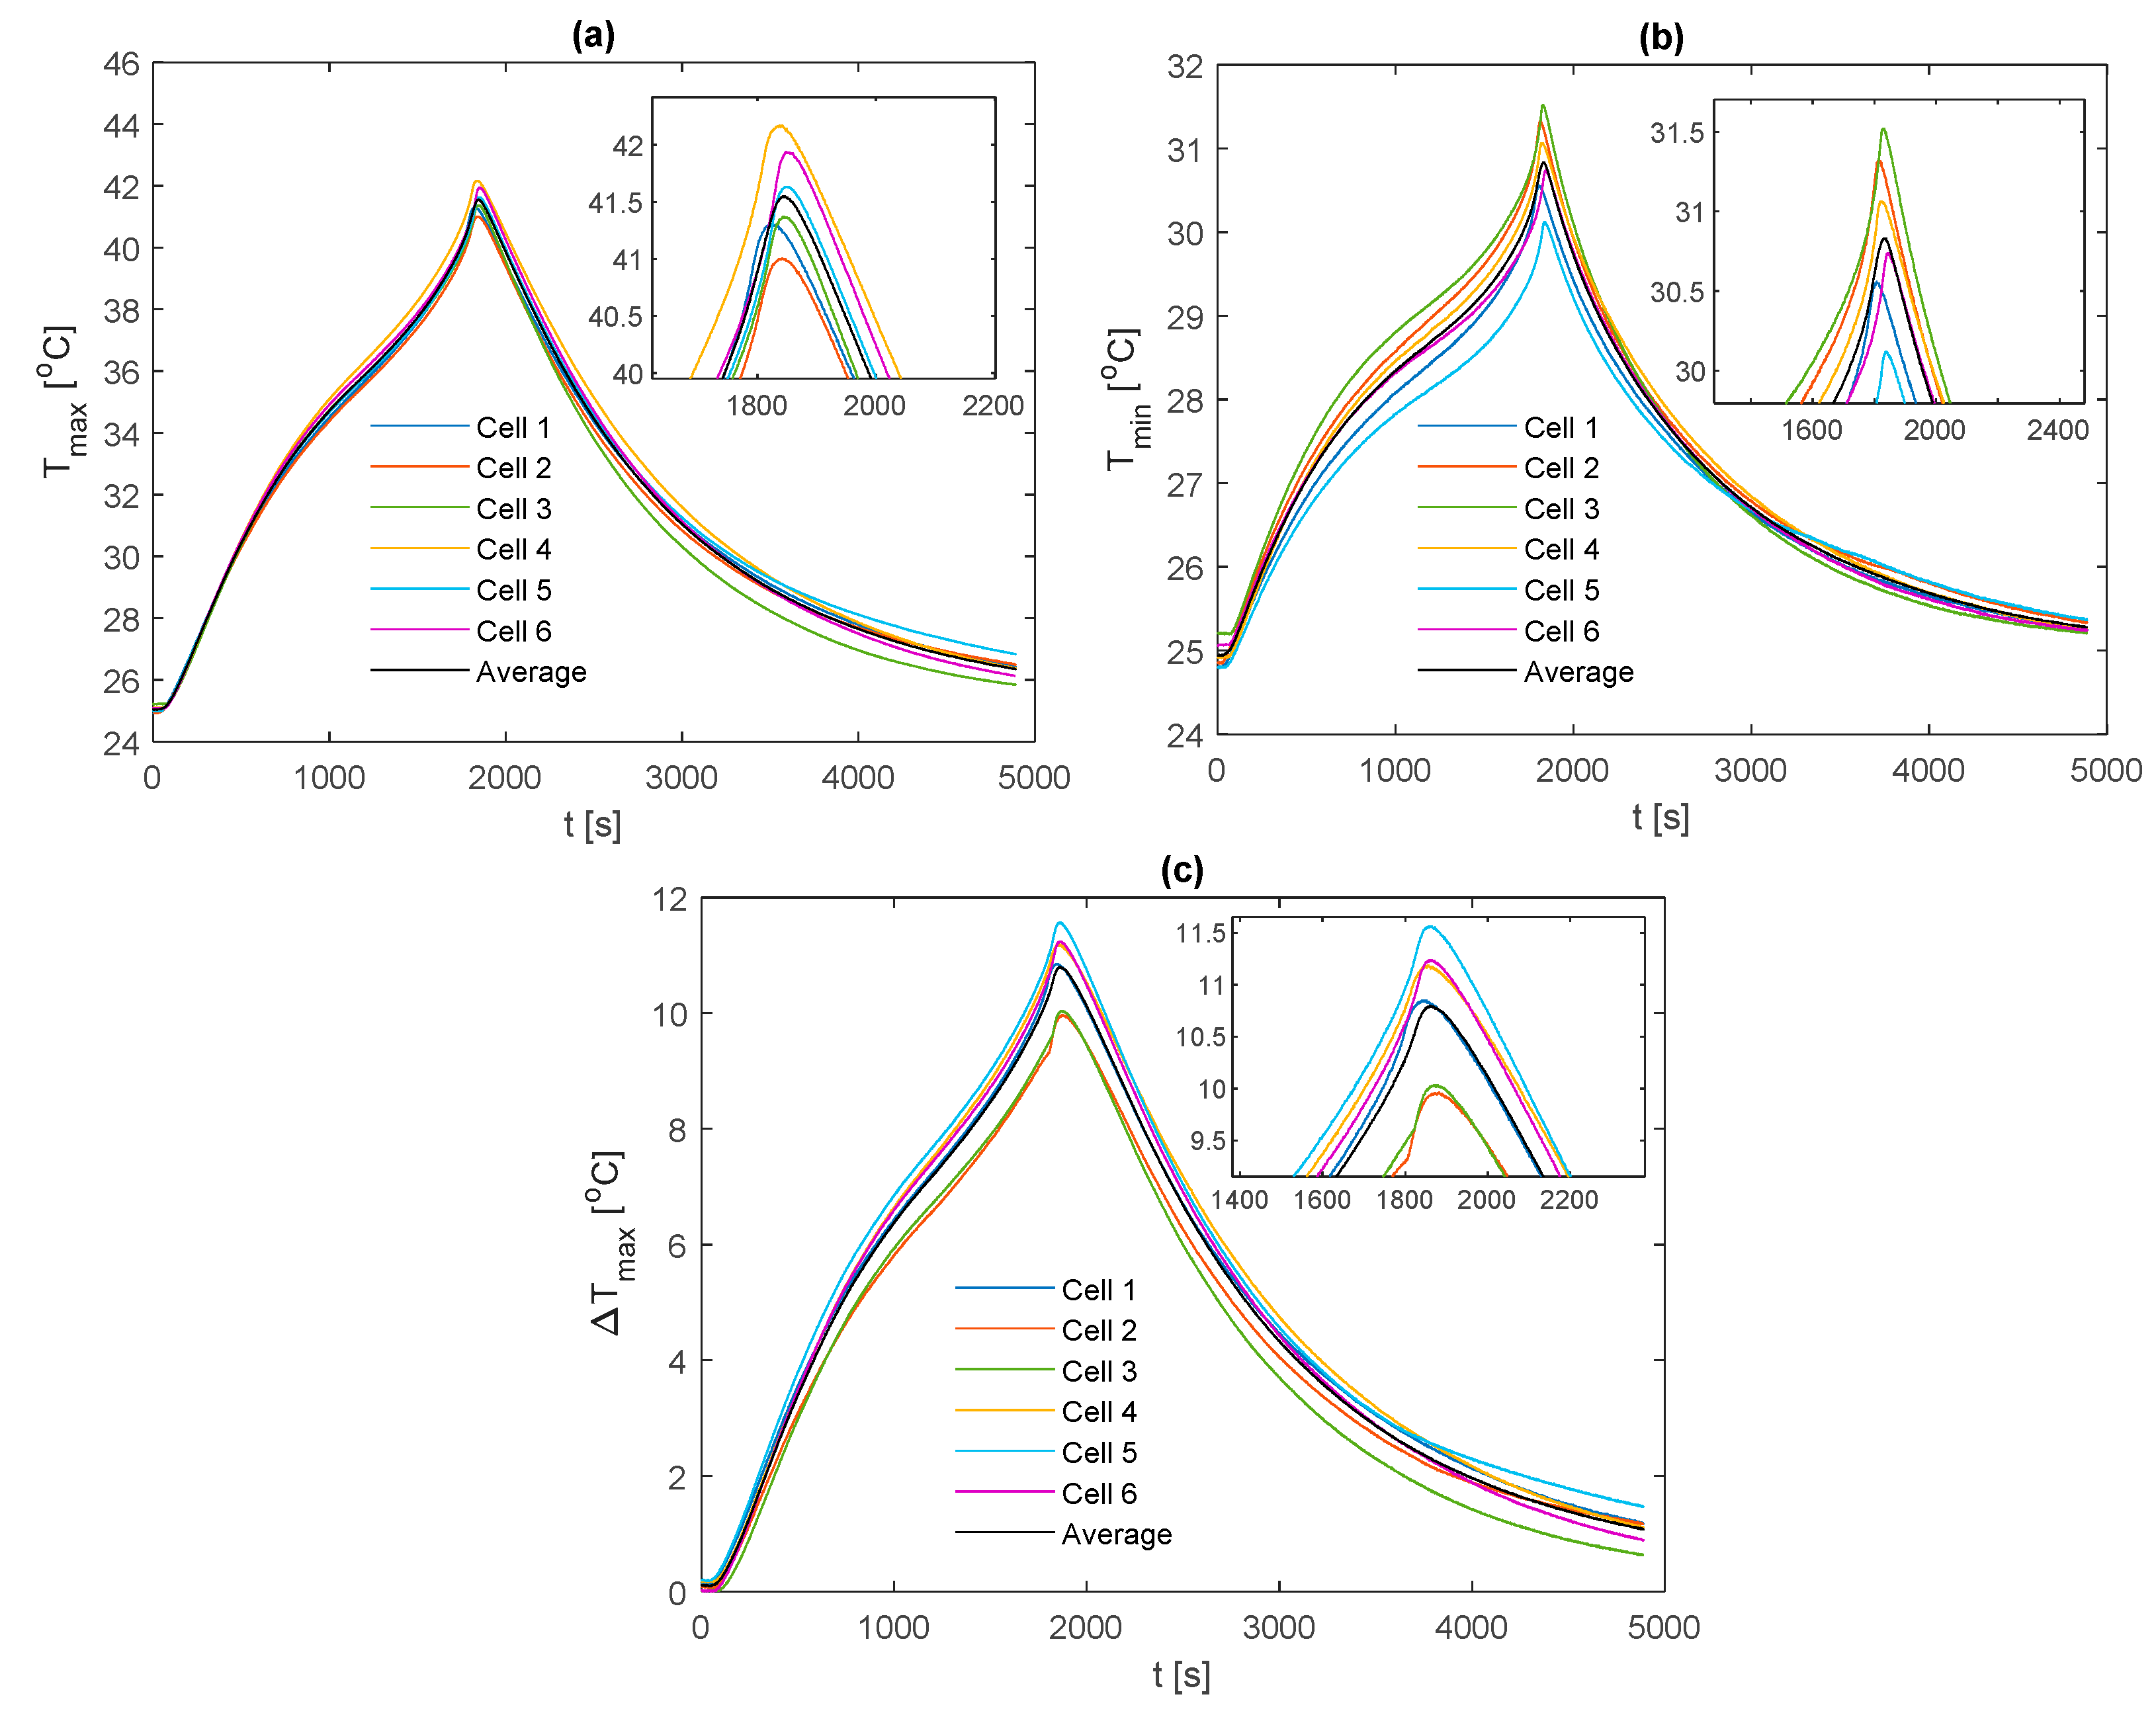
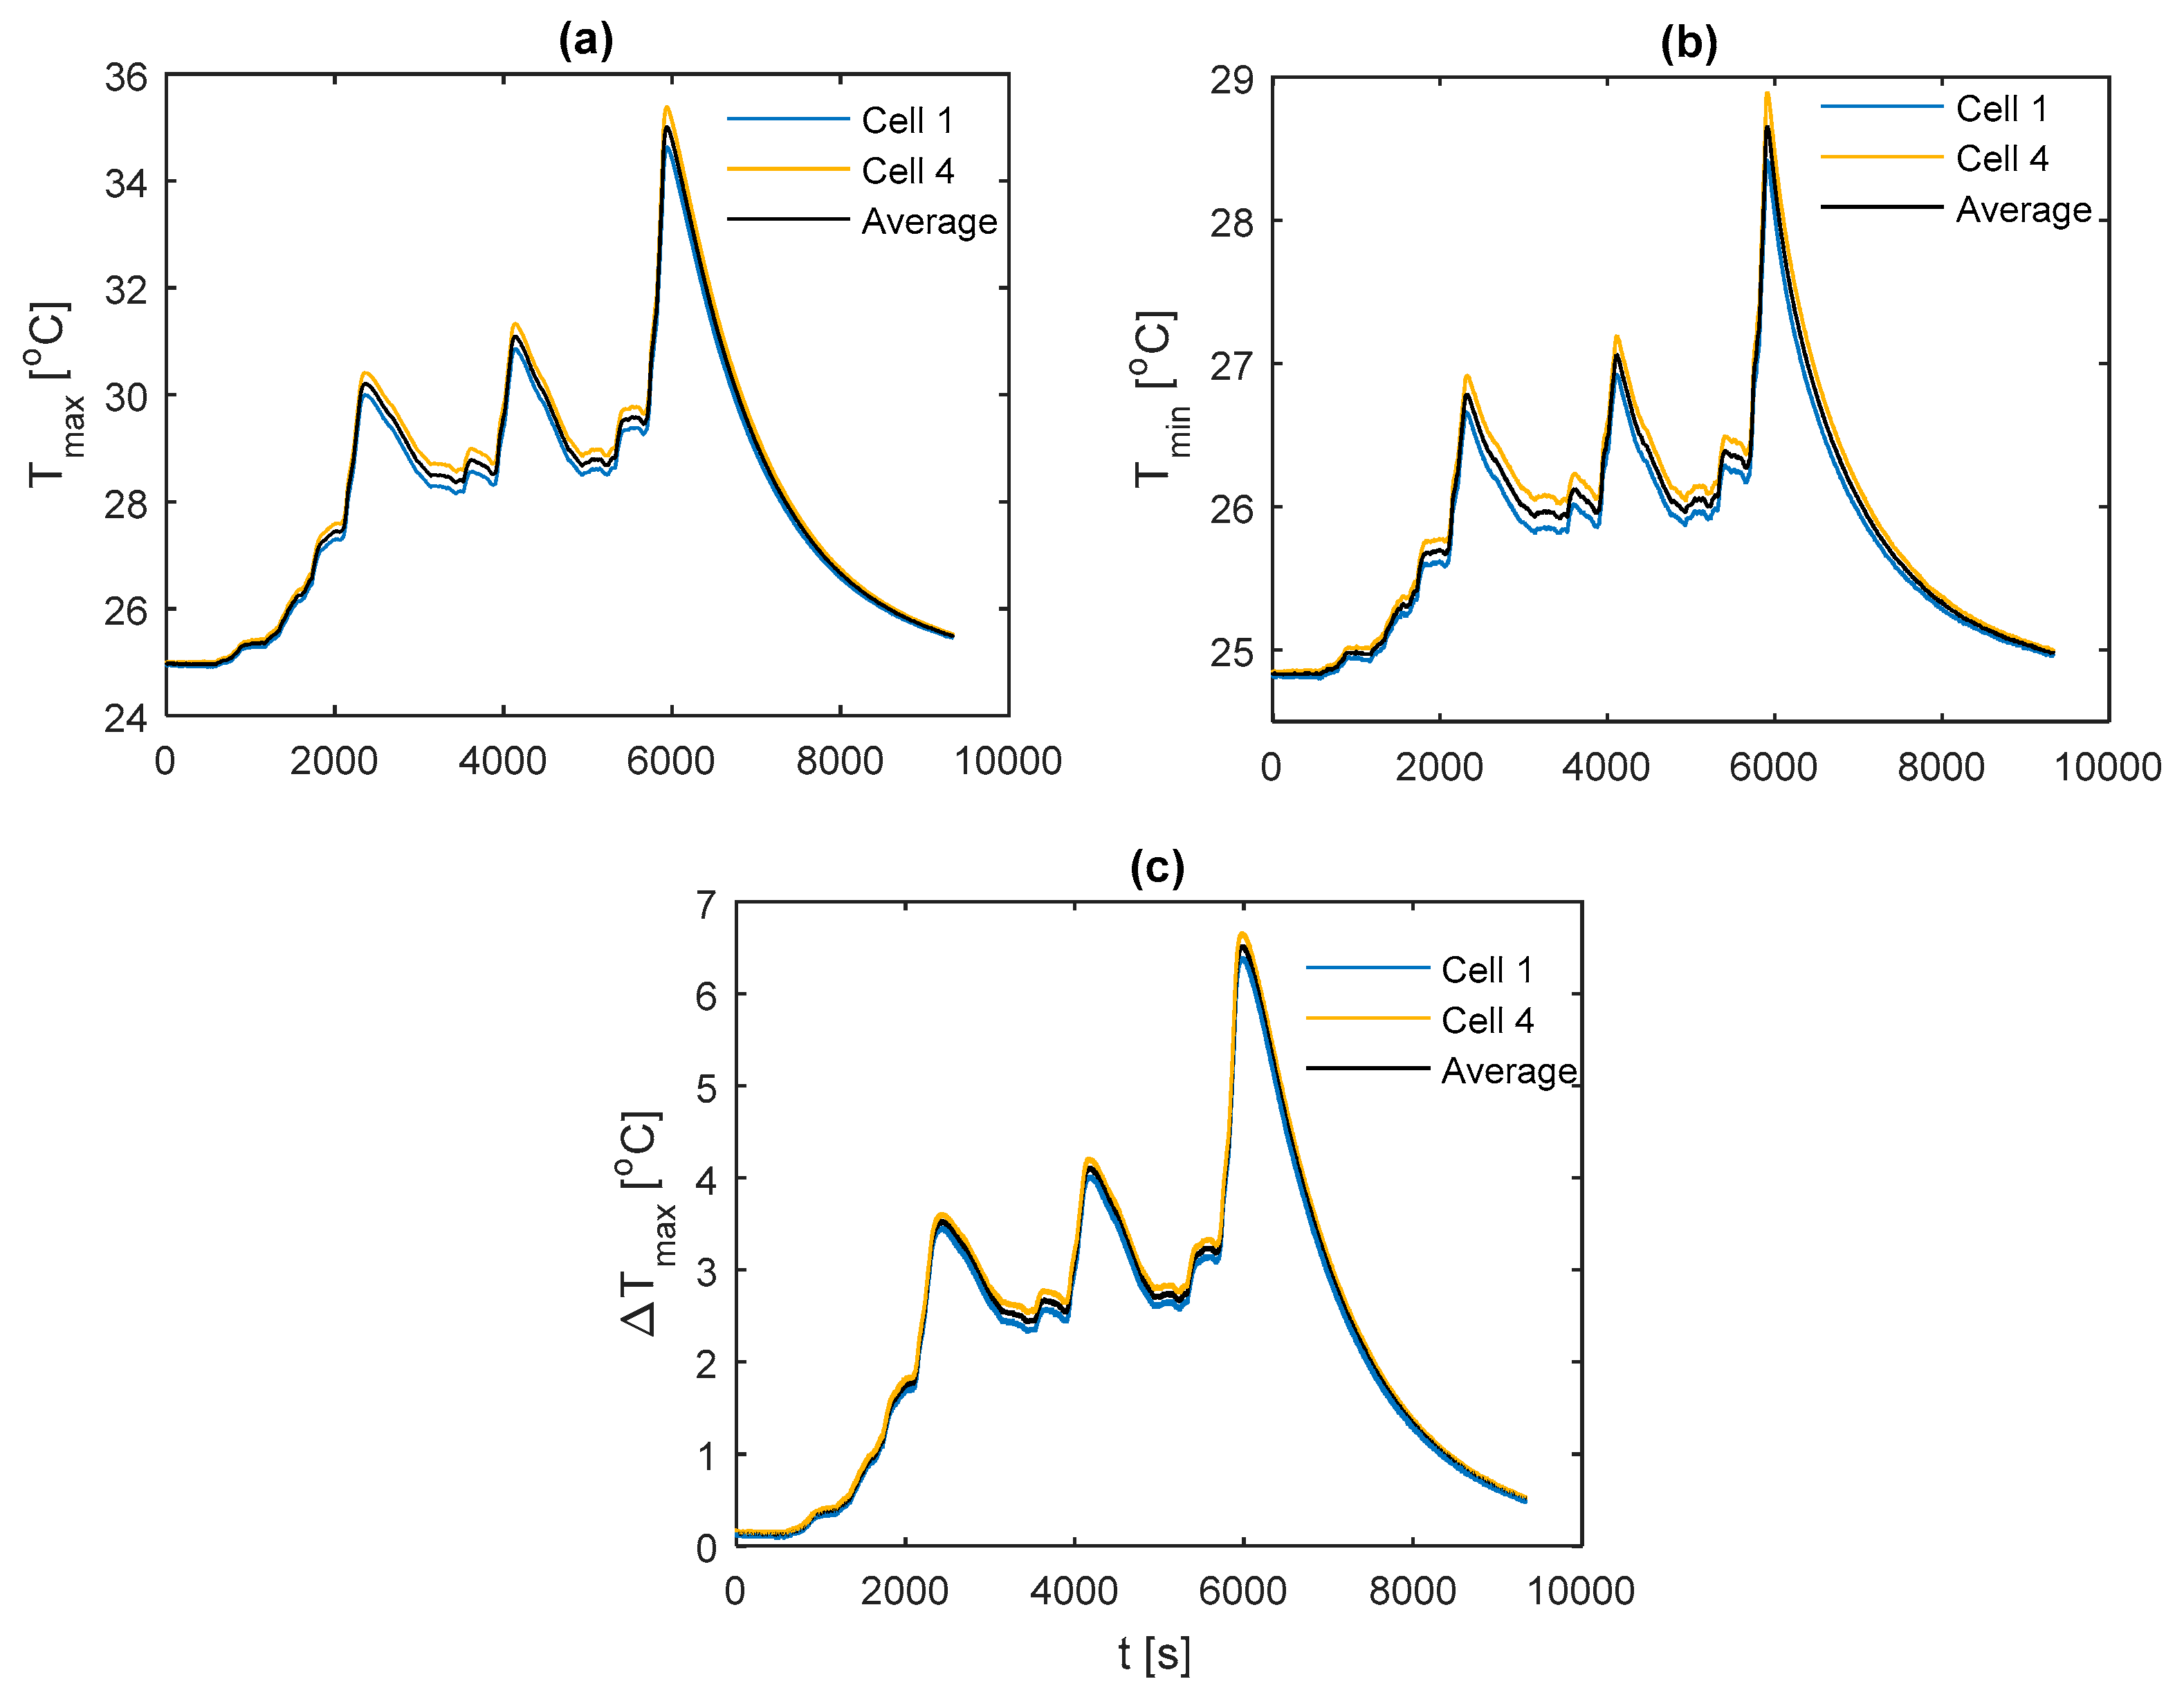
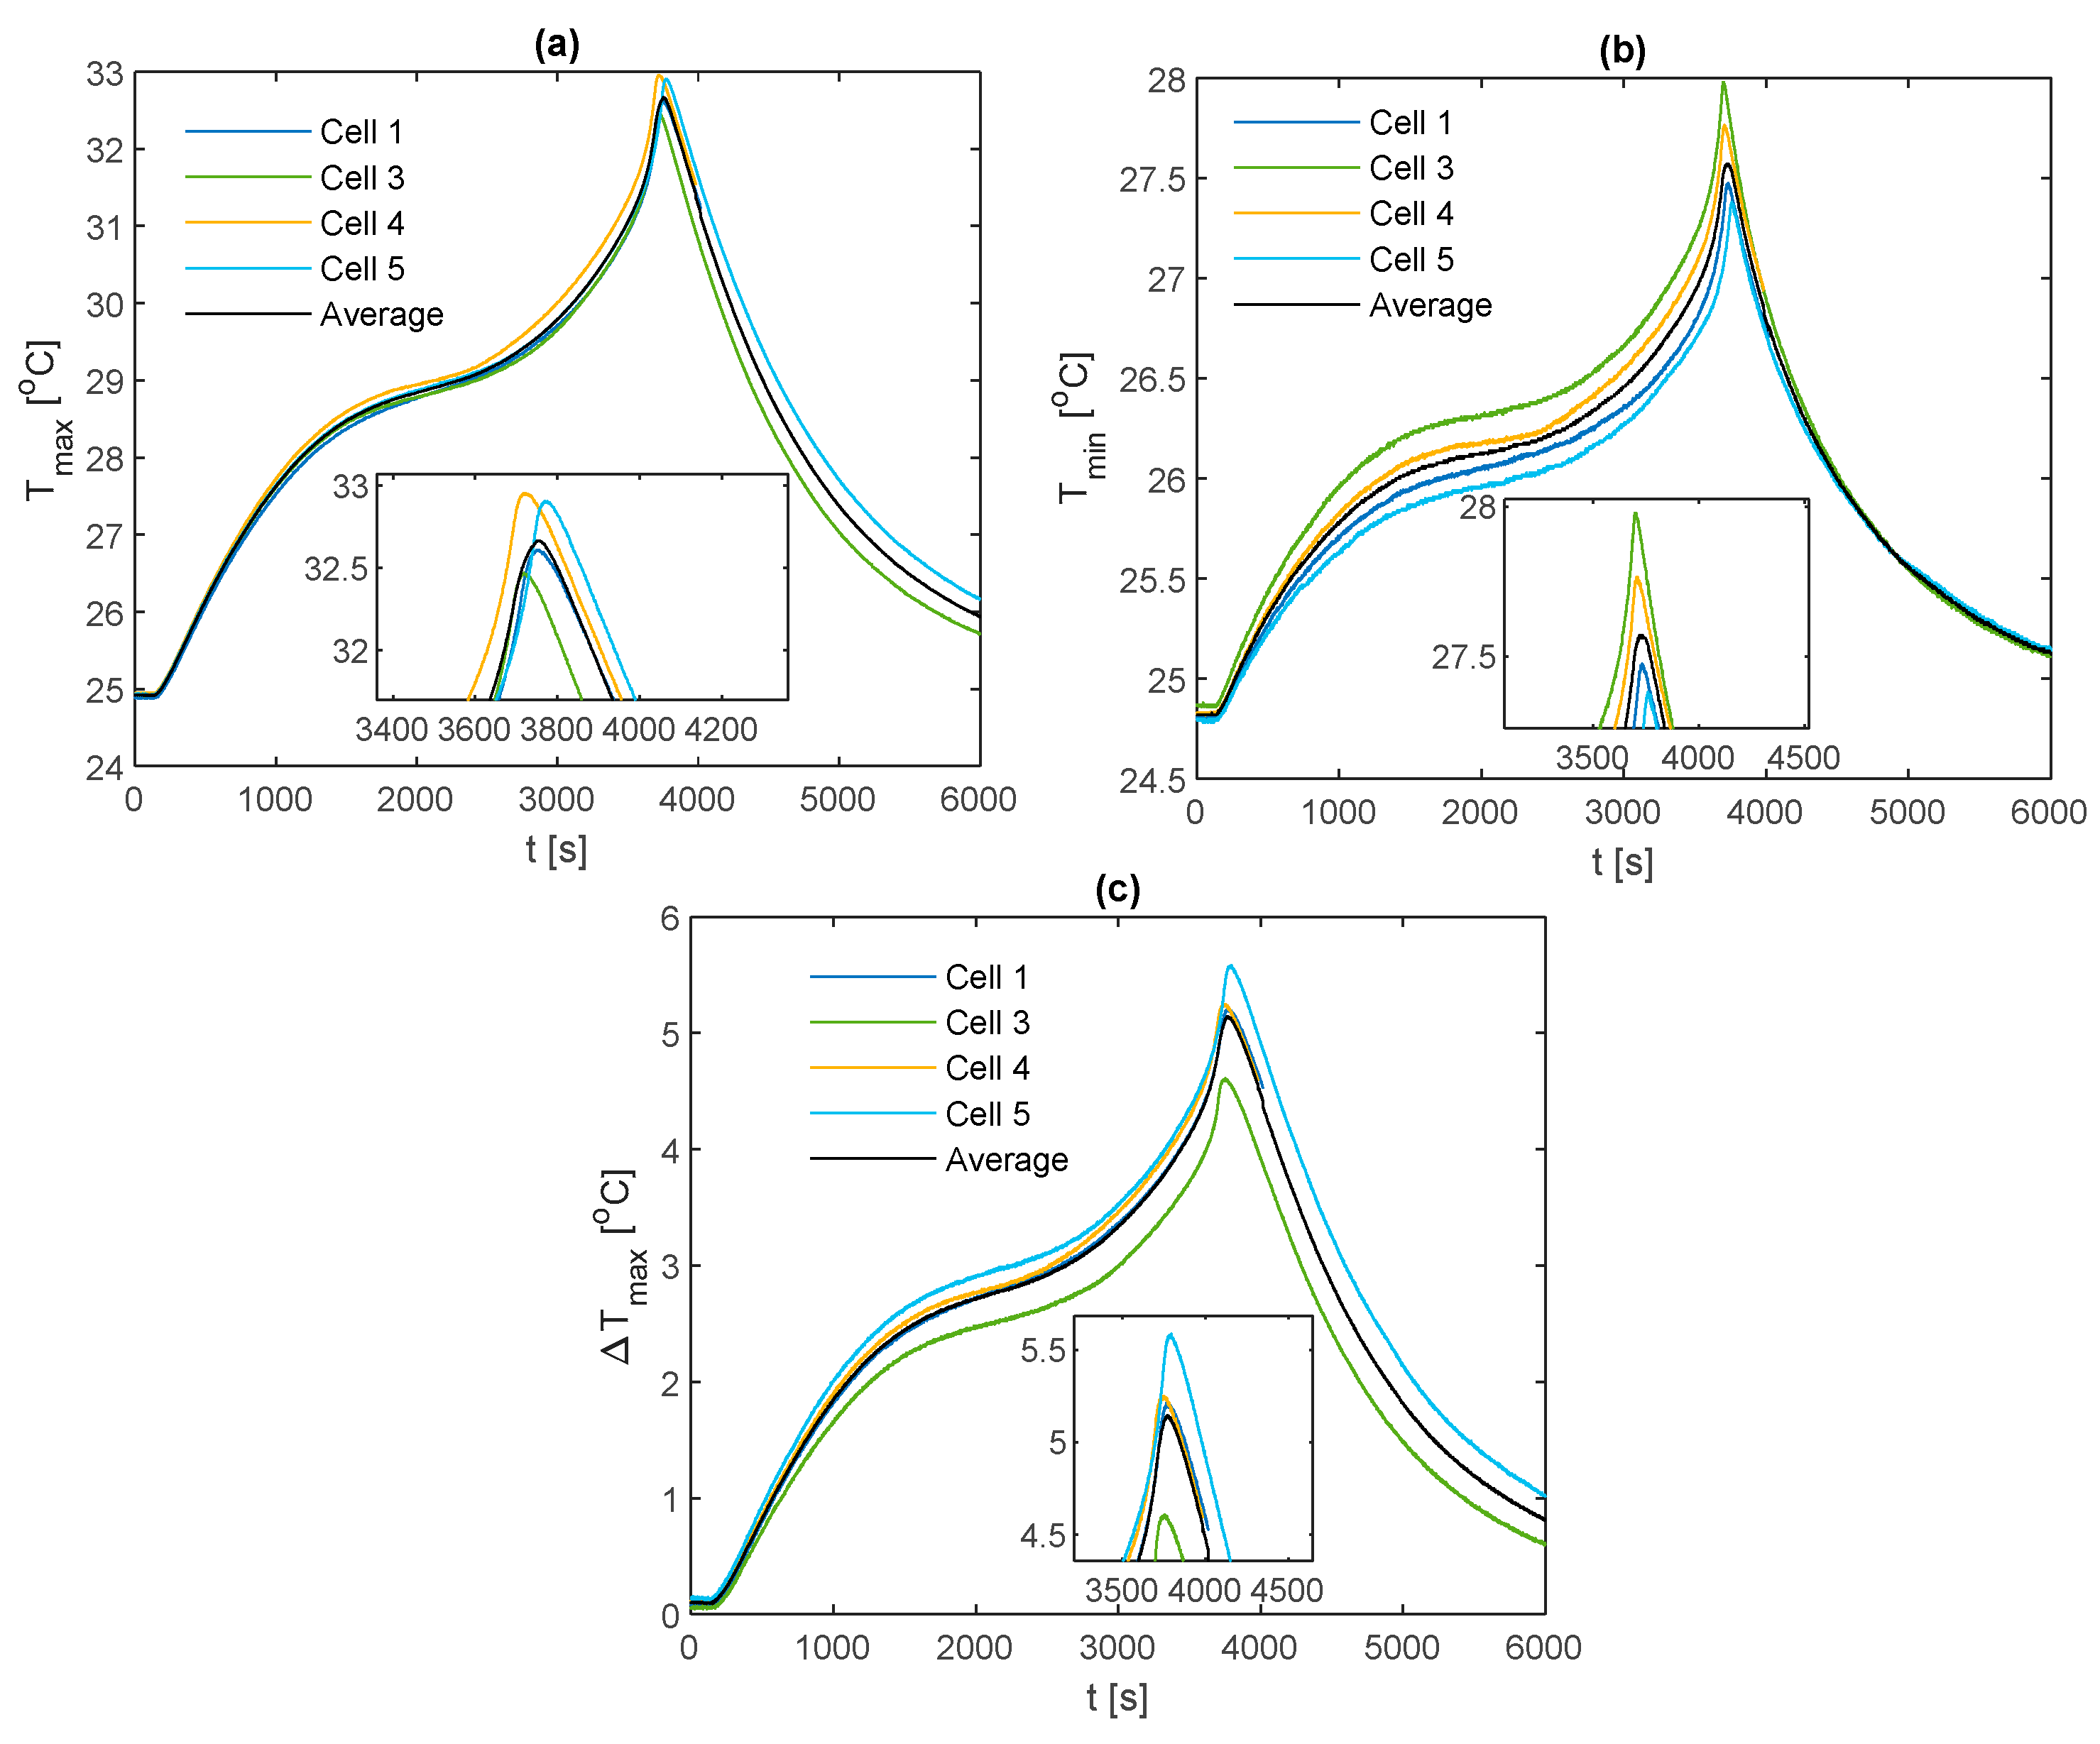
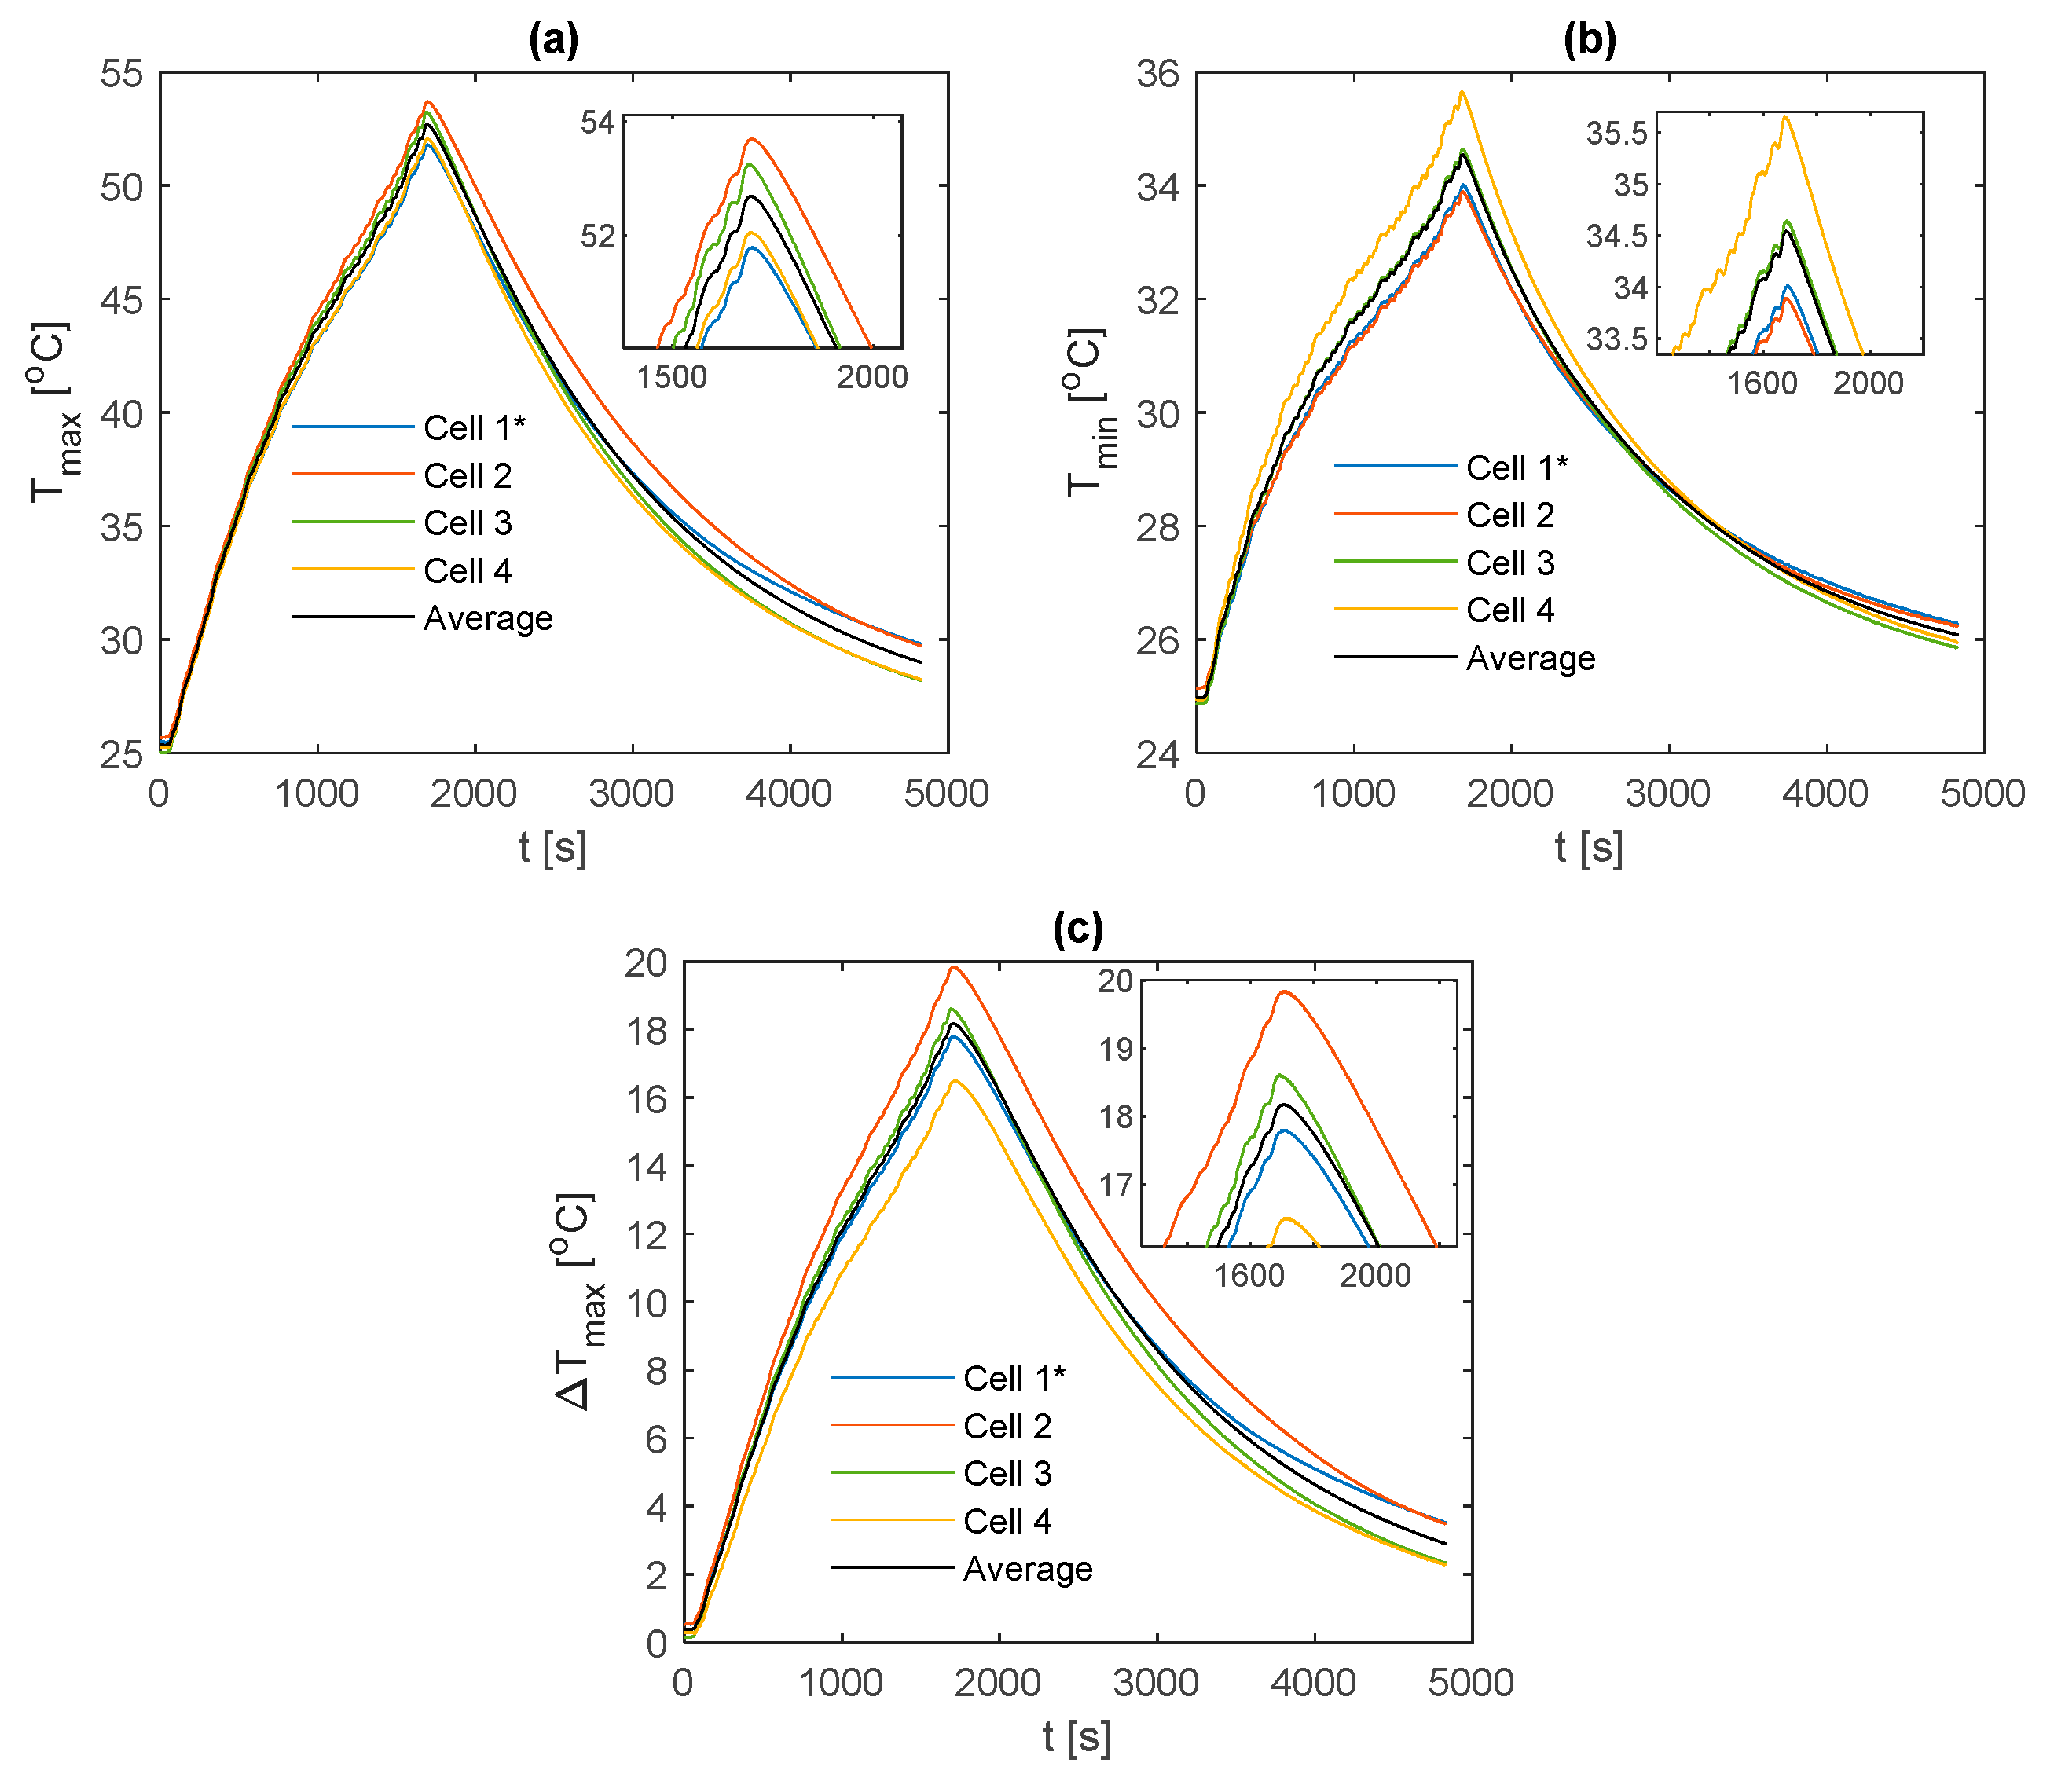
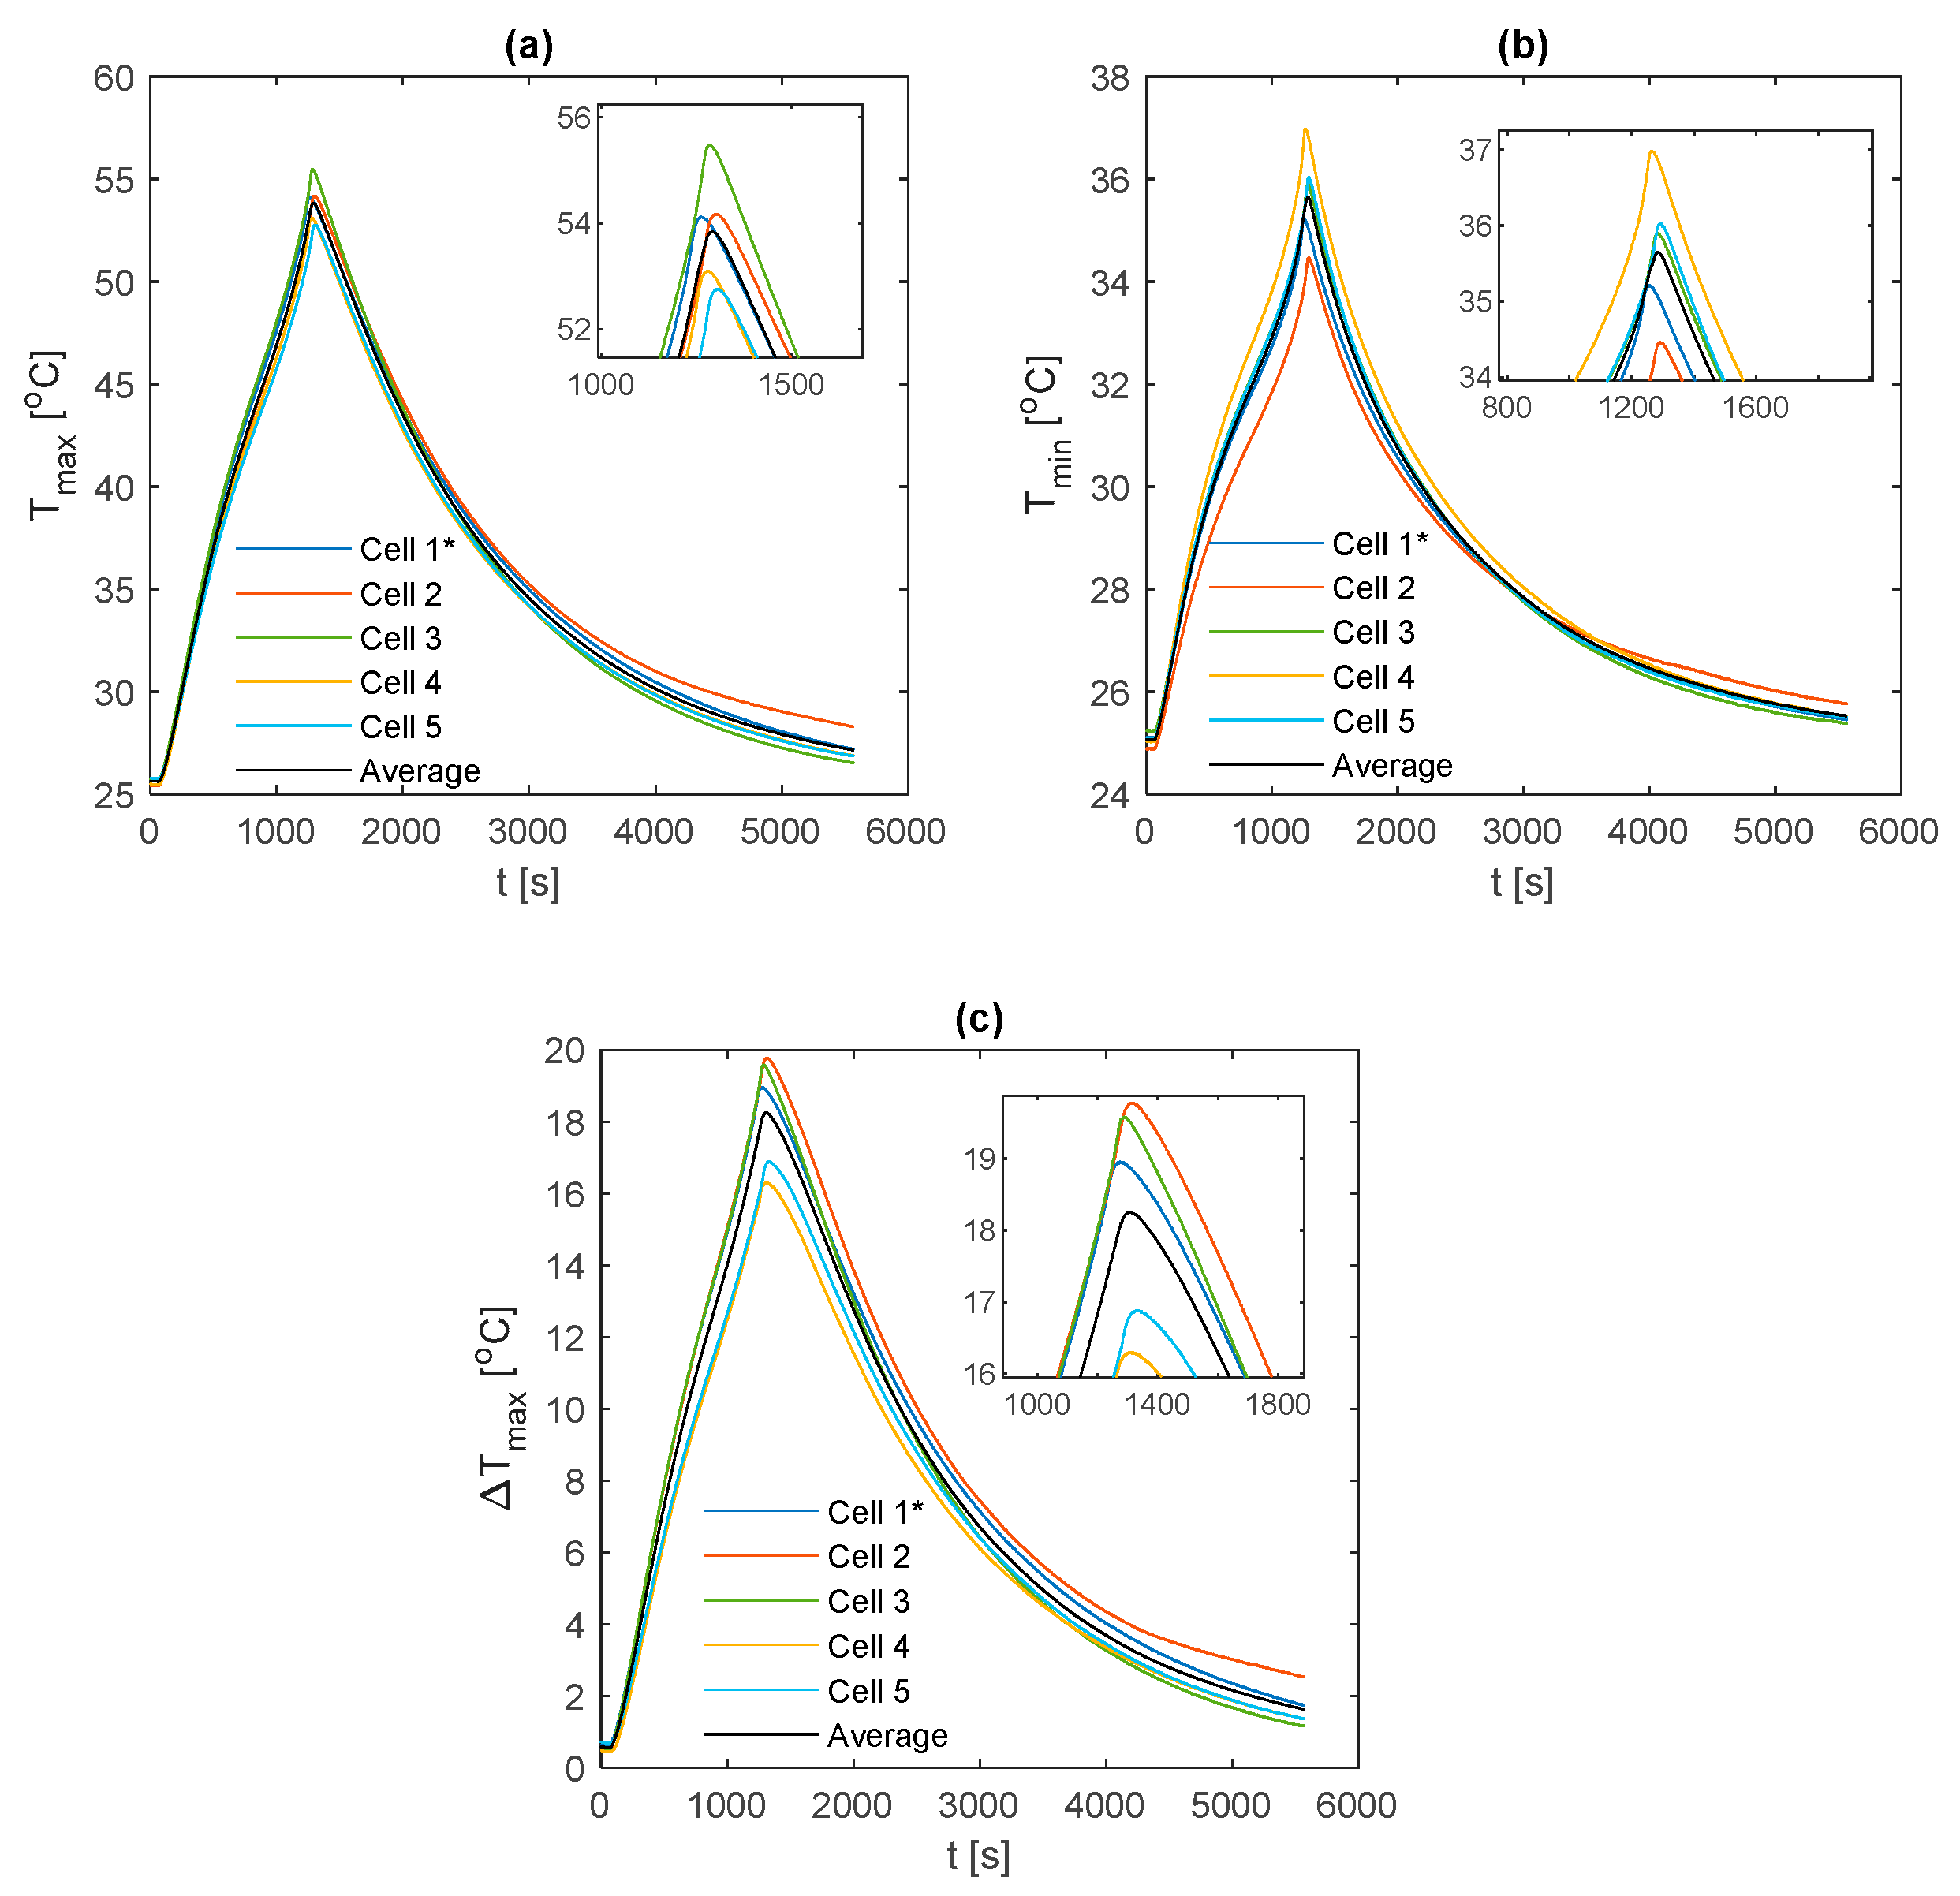
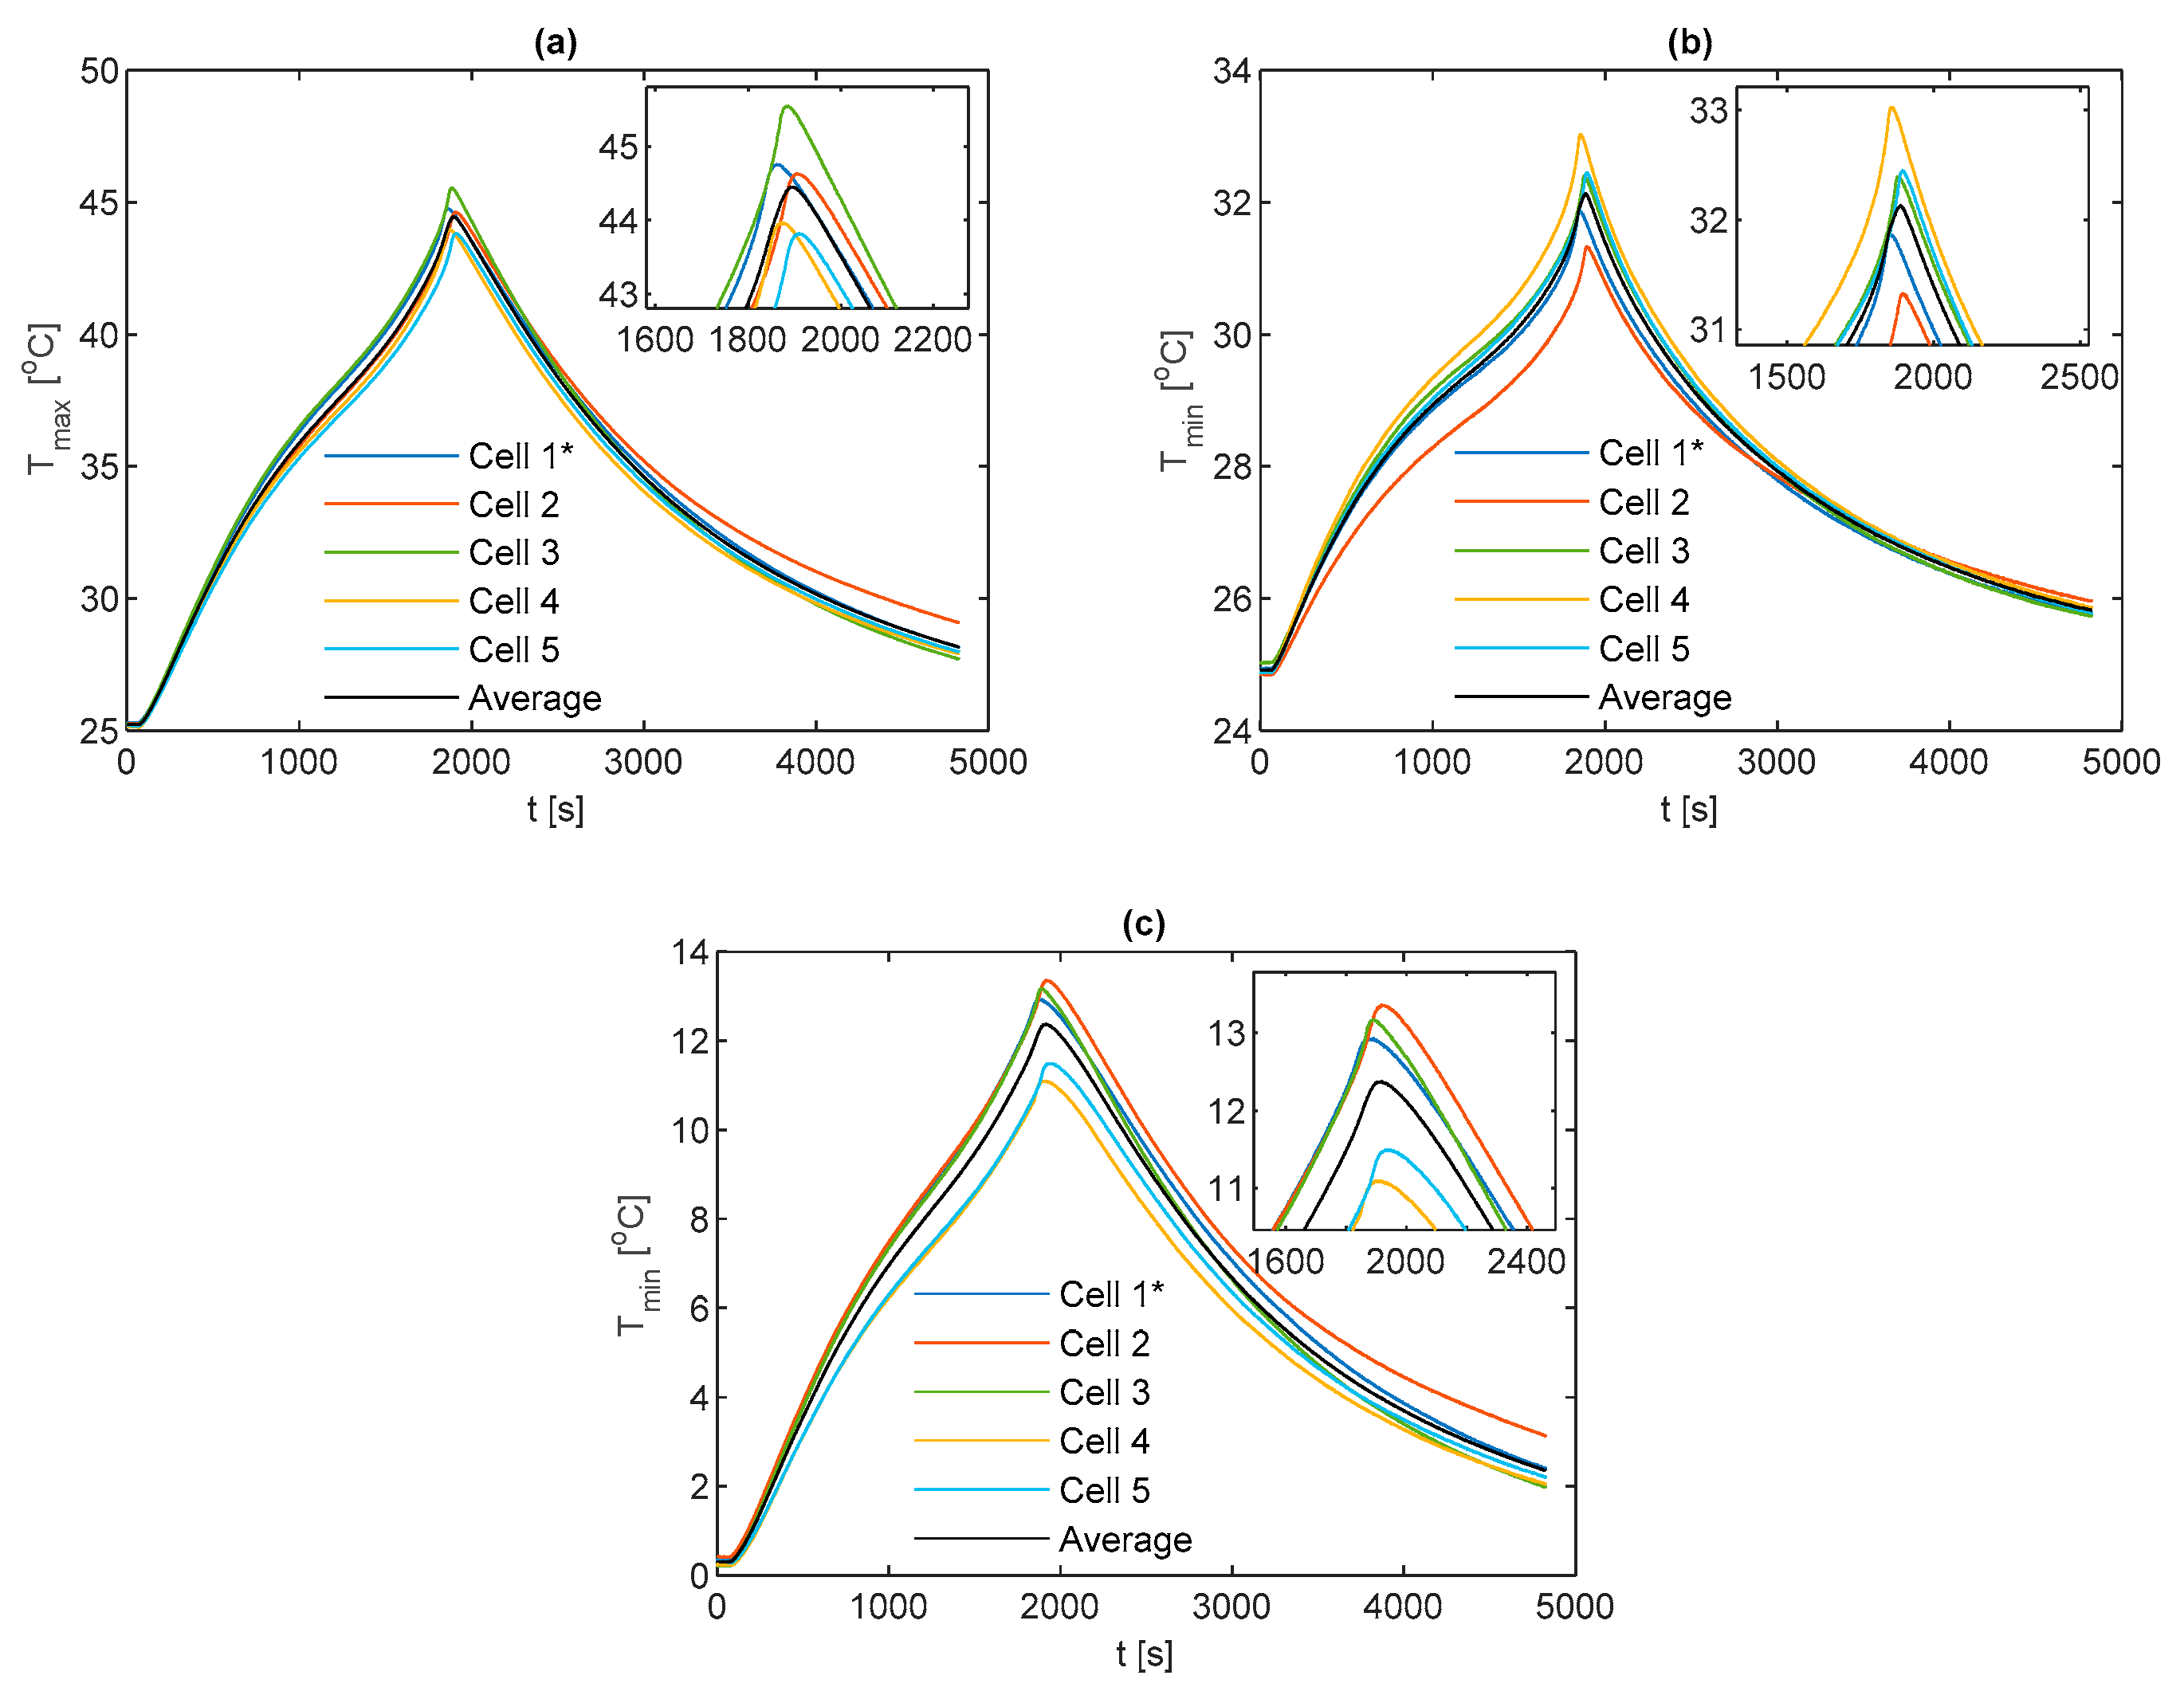
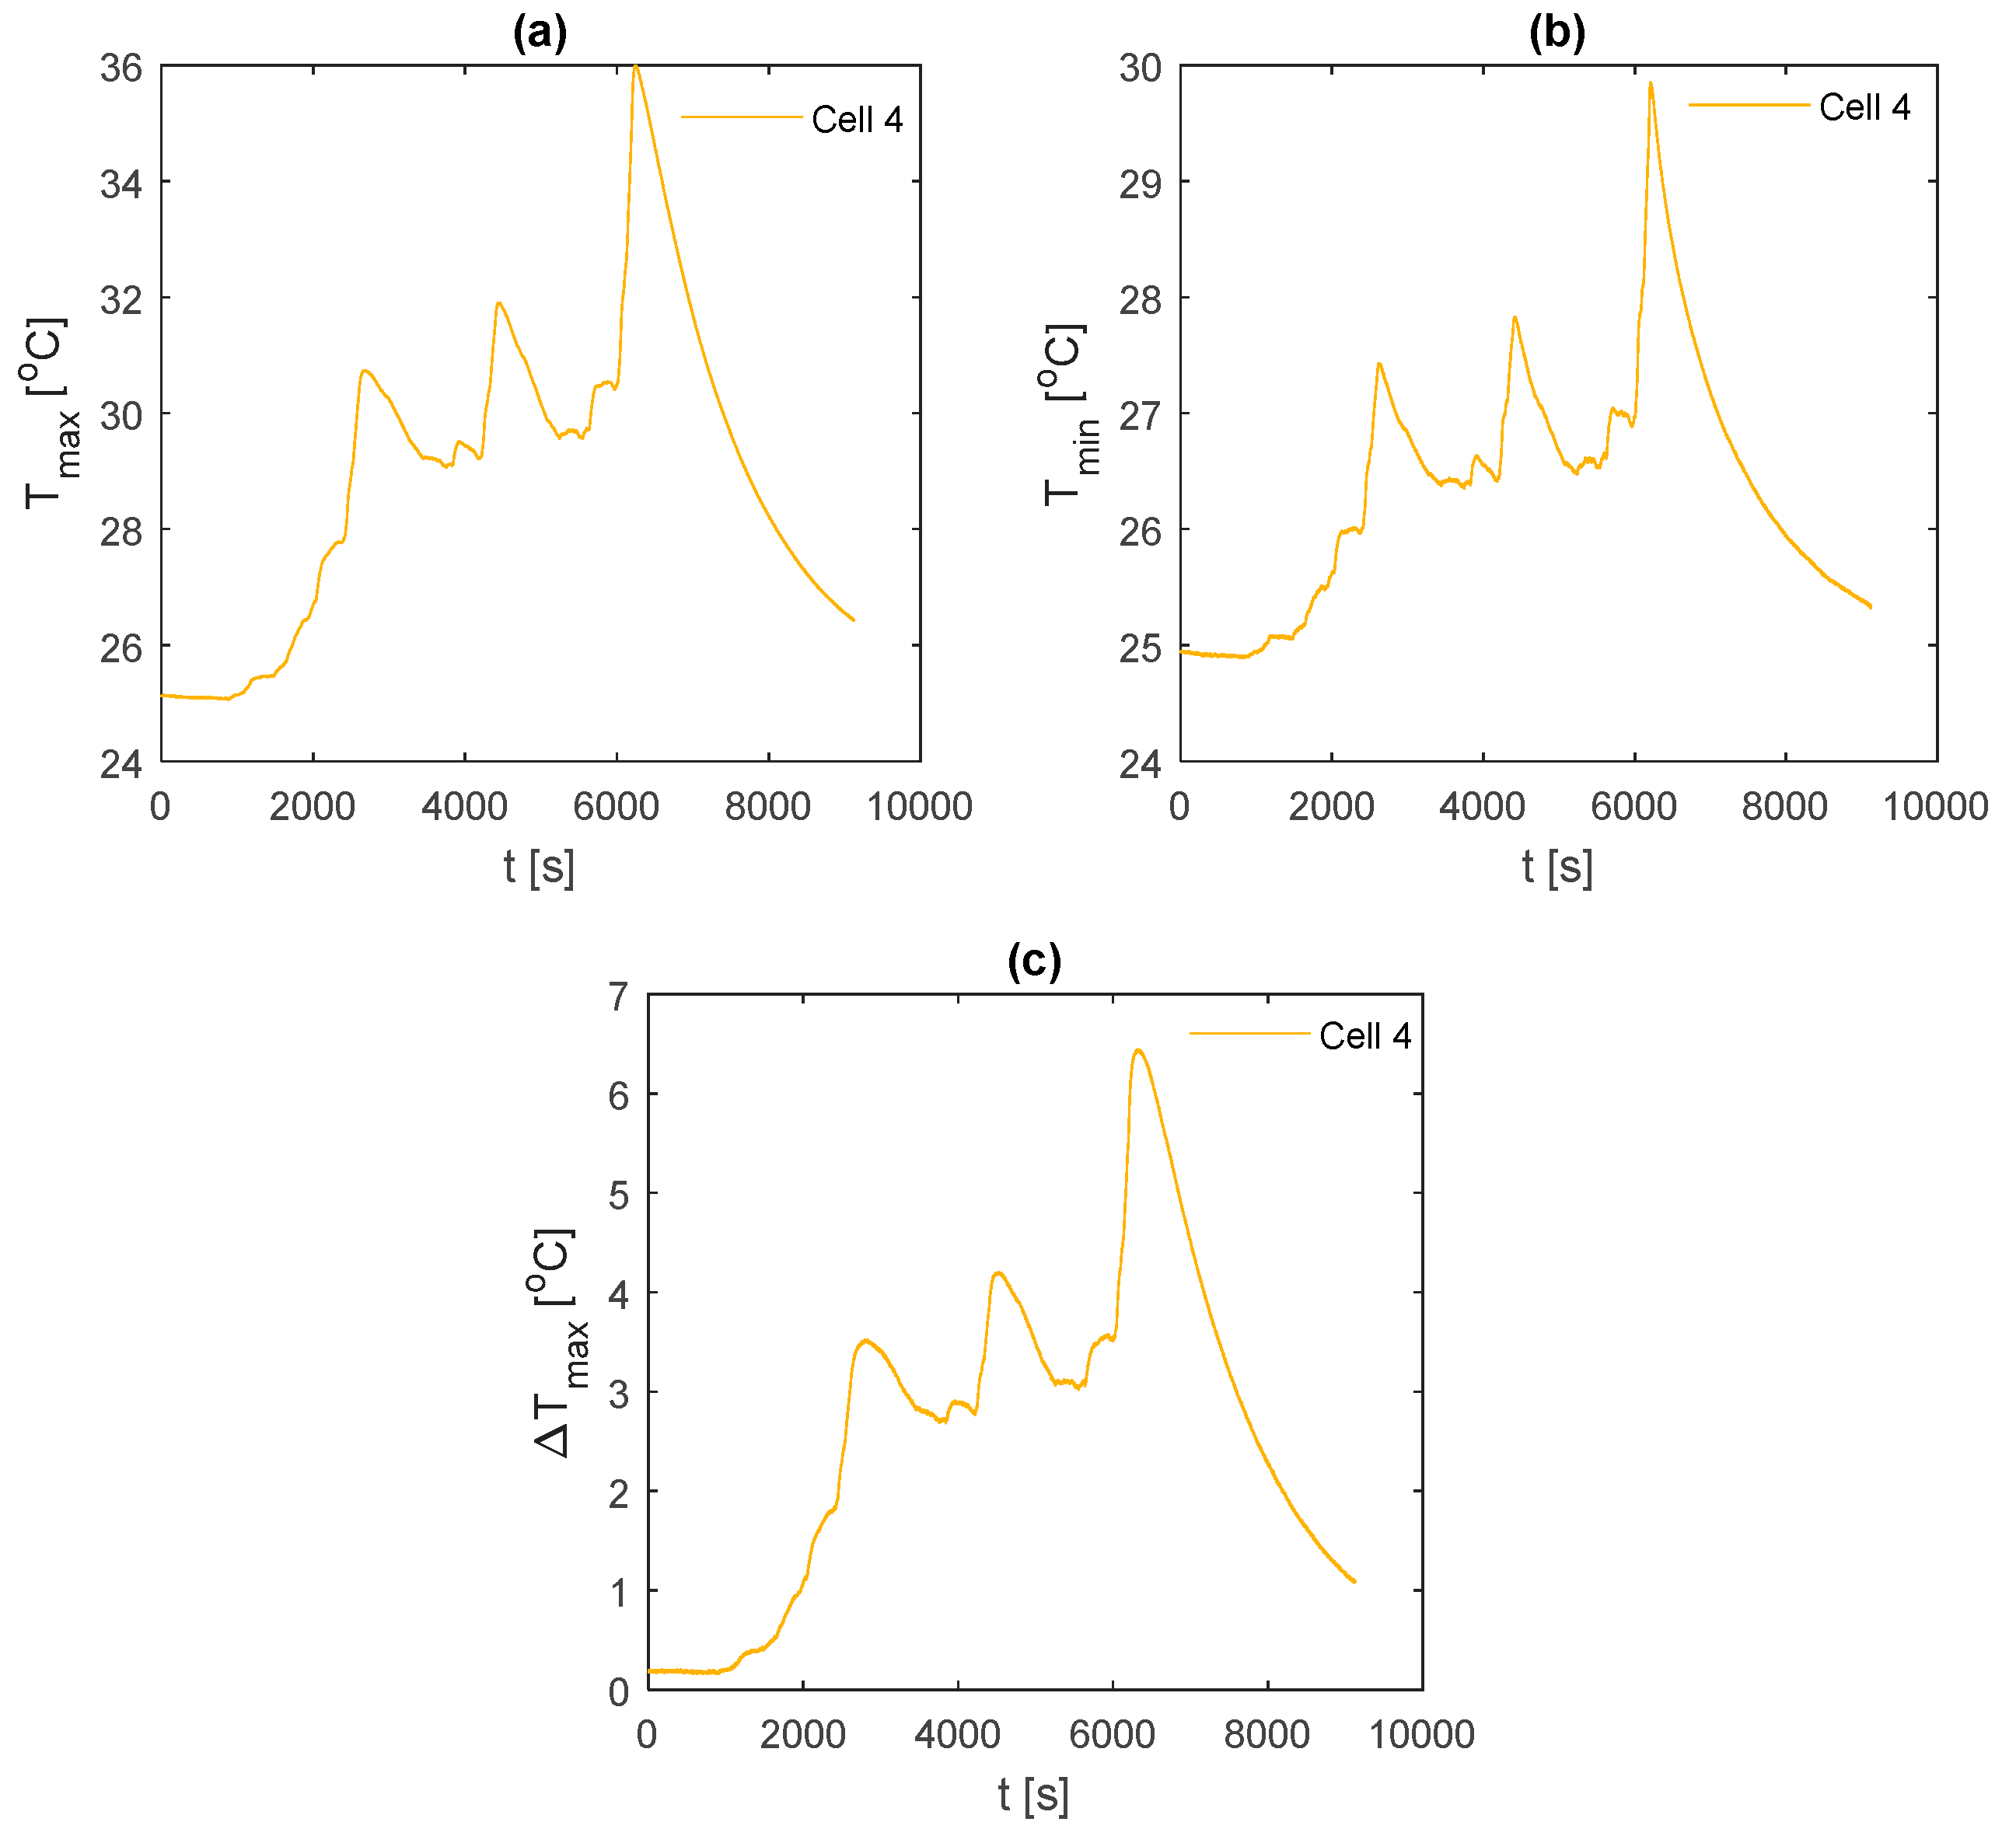
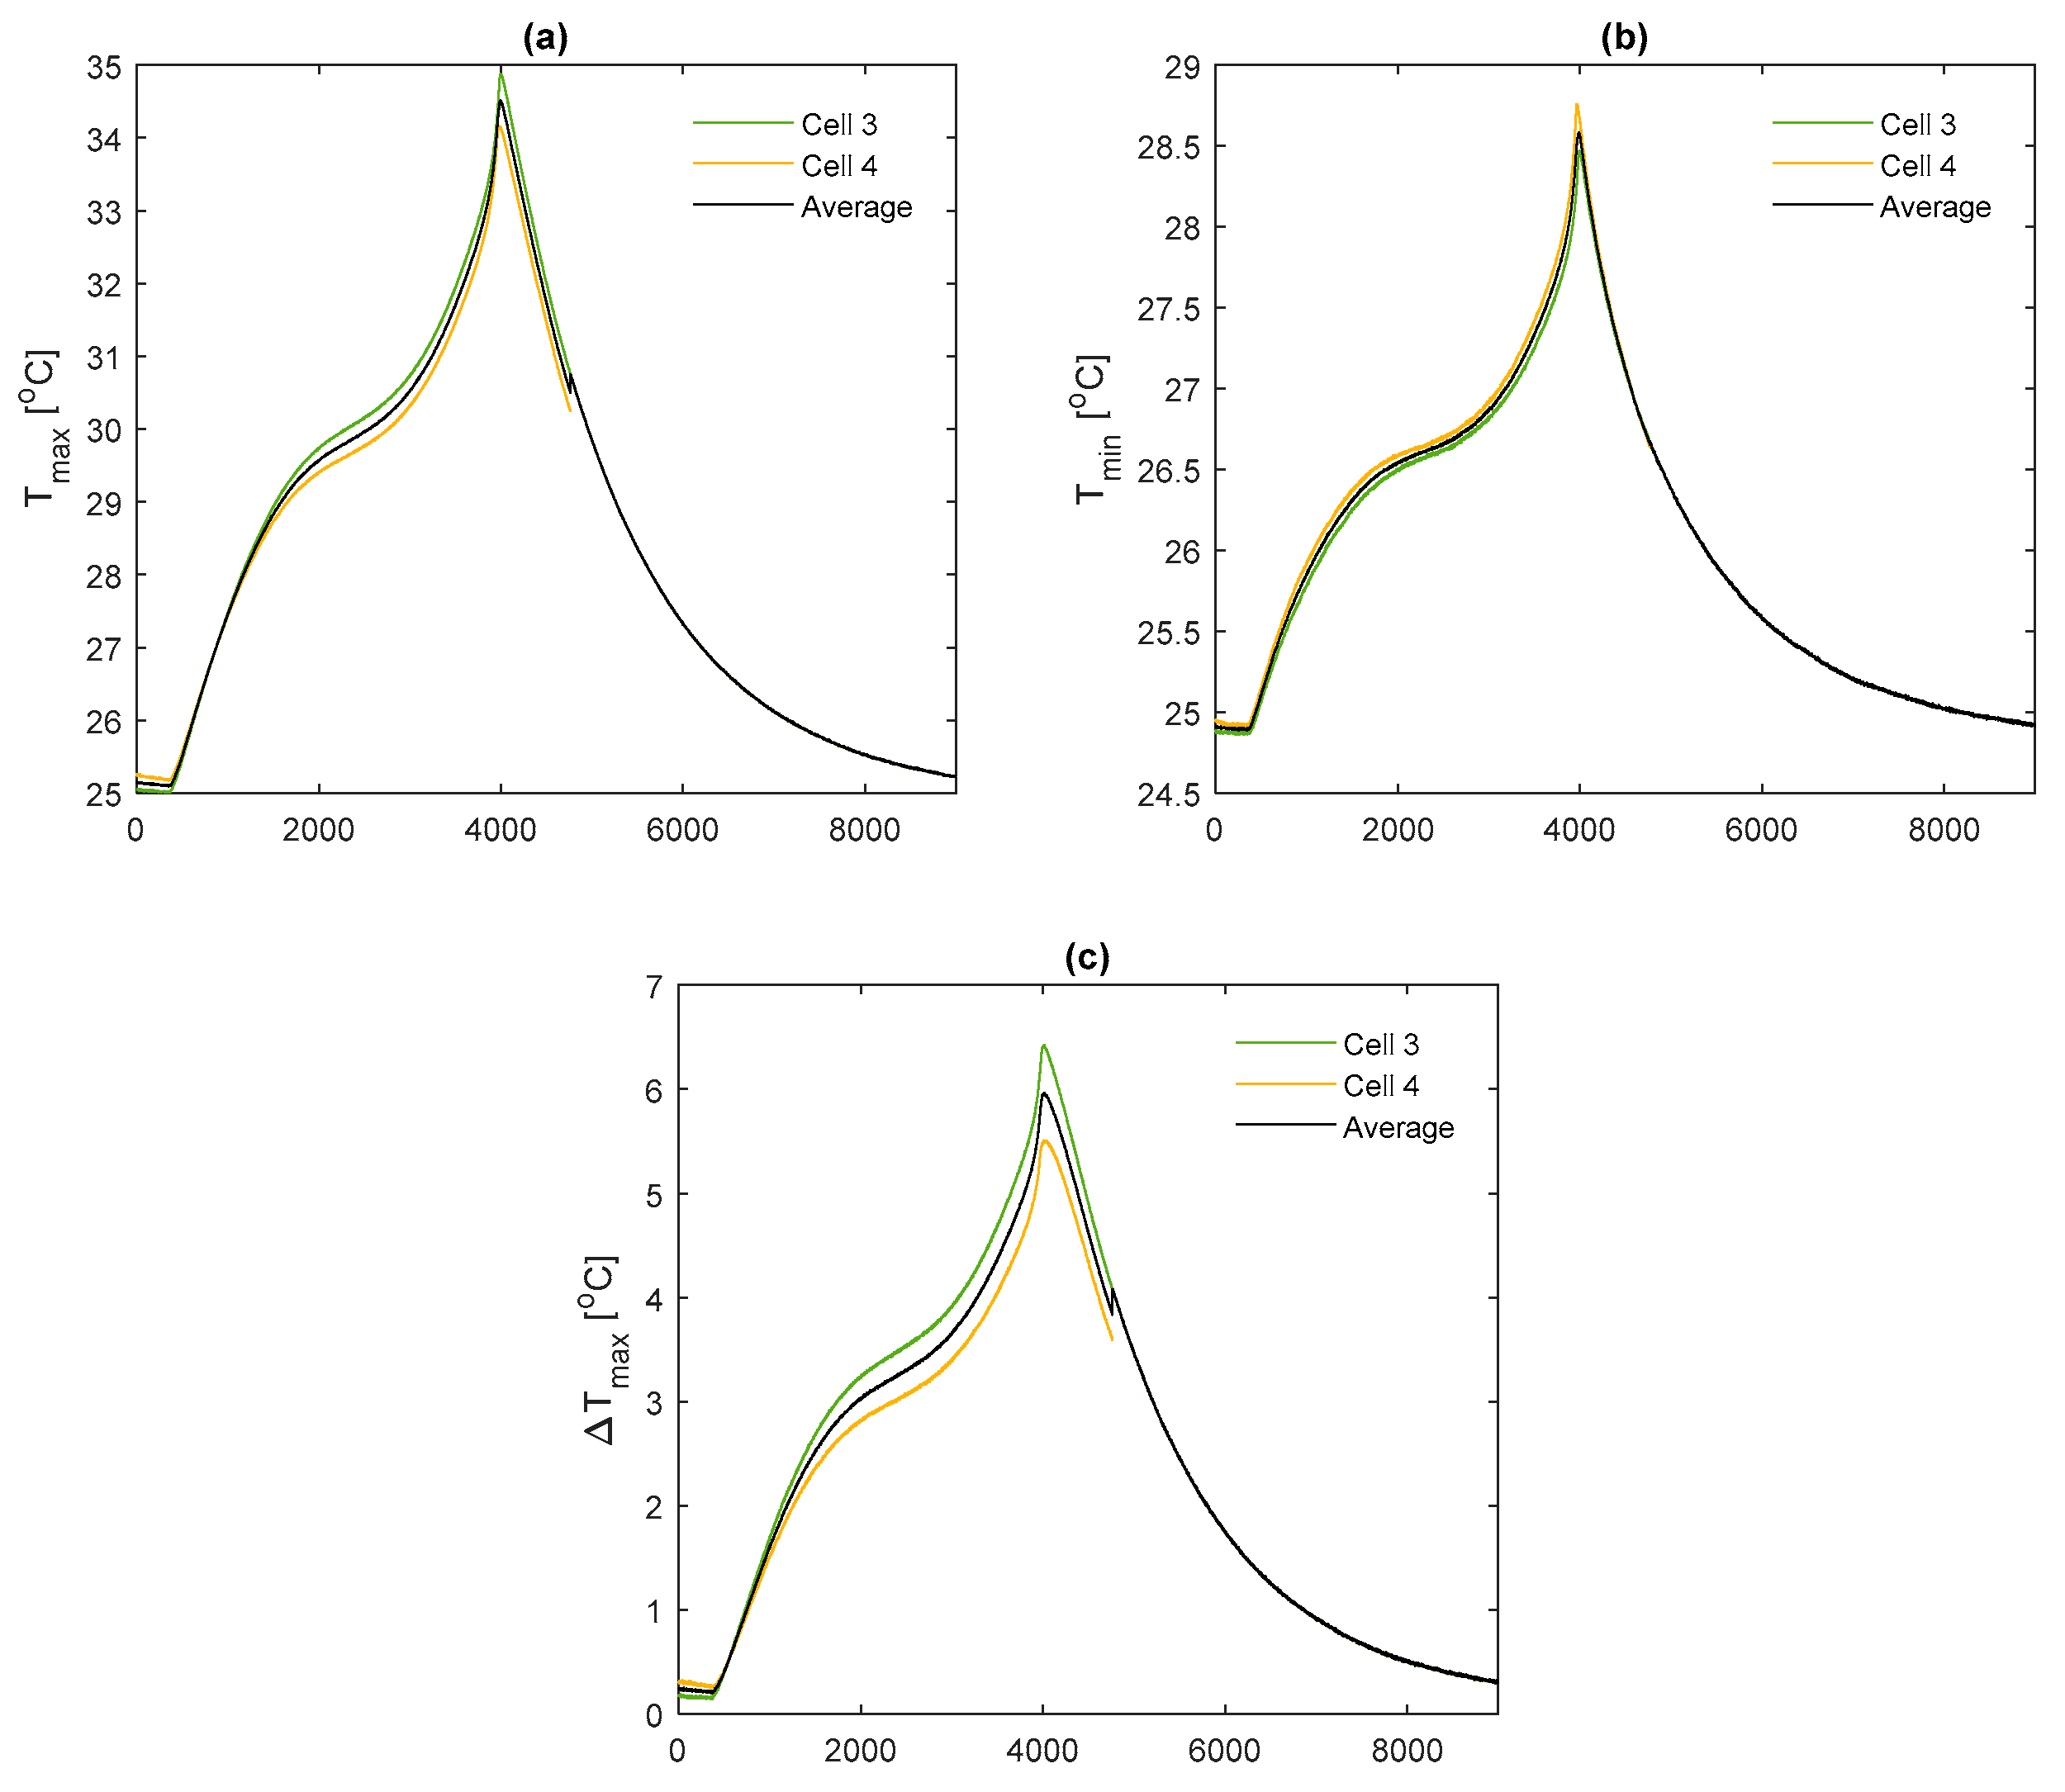
For comparison between fin materials, the average values of TC5 and TC9 between the front and back fins are taken as the value for that given cell sample. The average value over all the individual cell samples is then taken to represent the value for the given material type and thermocouple location. A comparison of the average curve to those of each individual cell sample is shown for every electrical loading condition and fin type, which is contained in
Appendix A for completeness.
3.3.1. C Thermal Response
The key temperature measurements for the fin surface during the 1 C discharge are displayed in
Figure 12, where marker points are shown at increments of 500 s. From
Figure 12a, it is observed that TC5 reaches a peak of 34.9 °C with the aluminium fin and a peak of 32.7 °C and 30.7 °C for the copper and k-core fins, respectively. From our previous work in Reference [
12], it is suggested that the optimum temperature range of the 53 Ah cells may be in the region of 25–35 °C to maximise the battery performance whilst limiting the rate of high-temperature-related ageing mechanisms. Therefore, single-edge cooling of the cell with aluminium fins appears to be appropriate under this 1 C usage scenario, which may be a particularly aggressive yet realistic case for a large sized EV [
44]. It is important to note, however, that the maximum temperature inside the cell will be larger than that recorded on the fin surface. An estimation of the temperature gradient throughout the cell could be achieved via a thermal modelling analysis which is an area for further work.
Figure 12b highlights that
reaches 6.4 °C at the end of the 1 C discharge for the aluminium fin which is over the common recommended limit of 5 °C for the cell temperature gradient reported in the literature (as discussed in
Section 1). Provided that the deep discharge region of the cell is avoided (e.g., limit the discharge to not enter below circa 10% SOC), it is possible to avoid the majority of the large temperature increase of the cell during the final portions of the discharge to satisfy the 5 °C limit. However, the k-core fin is the only material that enables
to remain below 5 °C for the whole discharge with a peak value of 3.9 °C. Evidently, the superior thermal conductivity of the k-core fin improves the heat removal rate to the exterior cold plate, allowing for both a reduced peak temperature and an improved temperature uniformity.
3.3.2. WLTP Class 3 Thermal Response
The temperature results for the WLTP Class 3 PHEV duty cycle are shown in
Figure 13. Here, the k-core fin provides an average value for
of 27.4 °C and
of 1.7 °C across the duration of the duty cycle. For the aluminium and copper fins, the average values for
are 29.1 °C and 28.4 °C respectively, with a corresponding average value for
of 2.6 °C and 2.4°C. Relative to the 1 C discharge, the more dynamic nature of the drive cycle highlights a difference in the ability of the fin materials to thermally control the cell under more aggressive situations (i.e., periods of higher currents). Specifically, the higher in-plane thermal conductivity and high in-plane thermal diffusivity of the k-core material enable the thermal system to respond quicker to temperature fluctuations relative to the conventional materials. This can be seen during the less intensive portions of the duty cycle that follow an aggressive period (e.g., at t = 2000 s), where the fin and cell begin to cool at a much faster rate with the k-core material. This minimises the periods in which the cell is subject to the detrimental effects of elevated temperature. However, for this particular drive cycle, provided that the deep discharge region is avoided during commercial use to prevent the large spike in temperature, the use of the k-core fin (although preferable) may not be necessary, given that the aluminium fin offers a satisfactory thermal control. A more direct benefit of employing the k-core material for this electrical loading (also for the 1 C case) may be in enabling the use of thinner fins. This is since the extra thermal head room that is present with the current fin thickness may be traded for a thinner fin, which, when possible, is beneficial for reducing the mass and/or volume penalty of the BTMS.
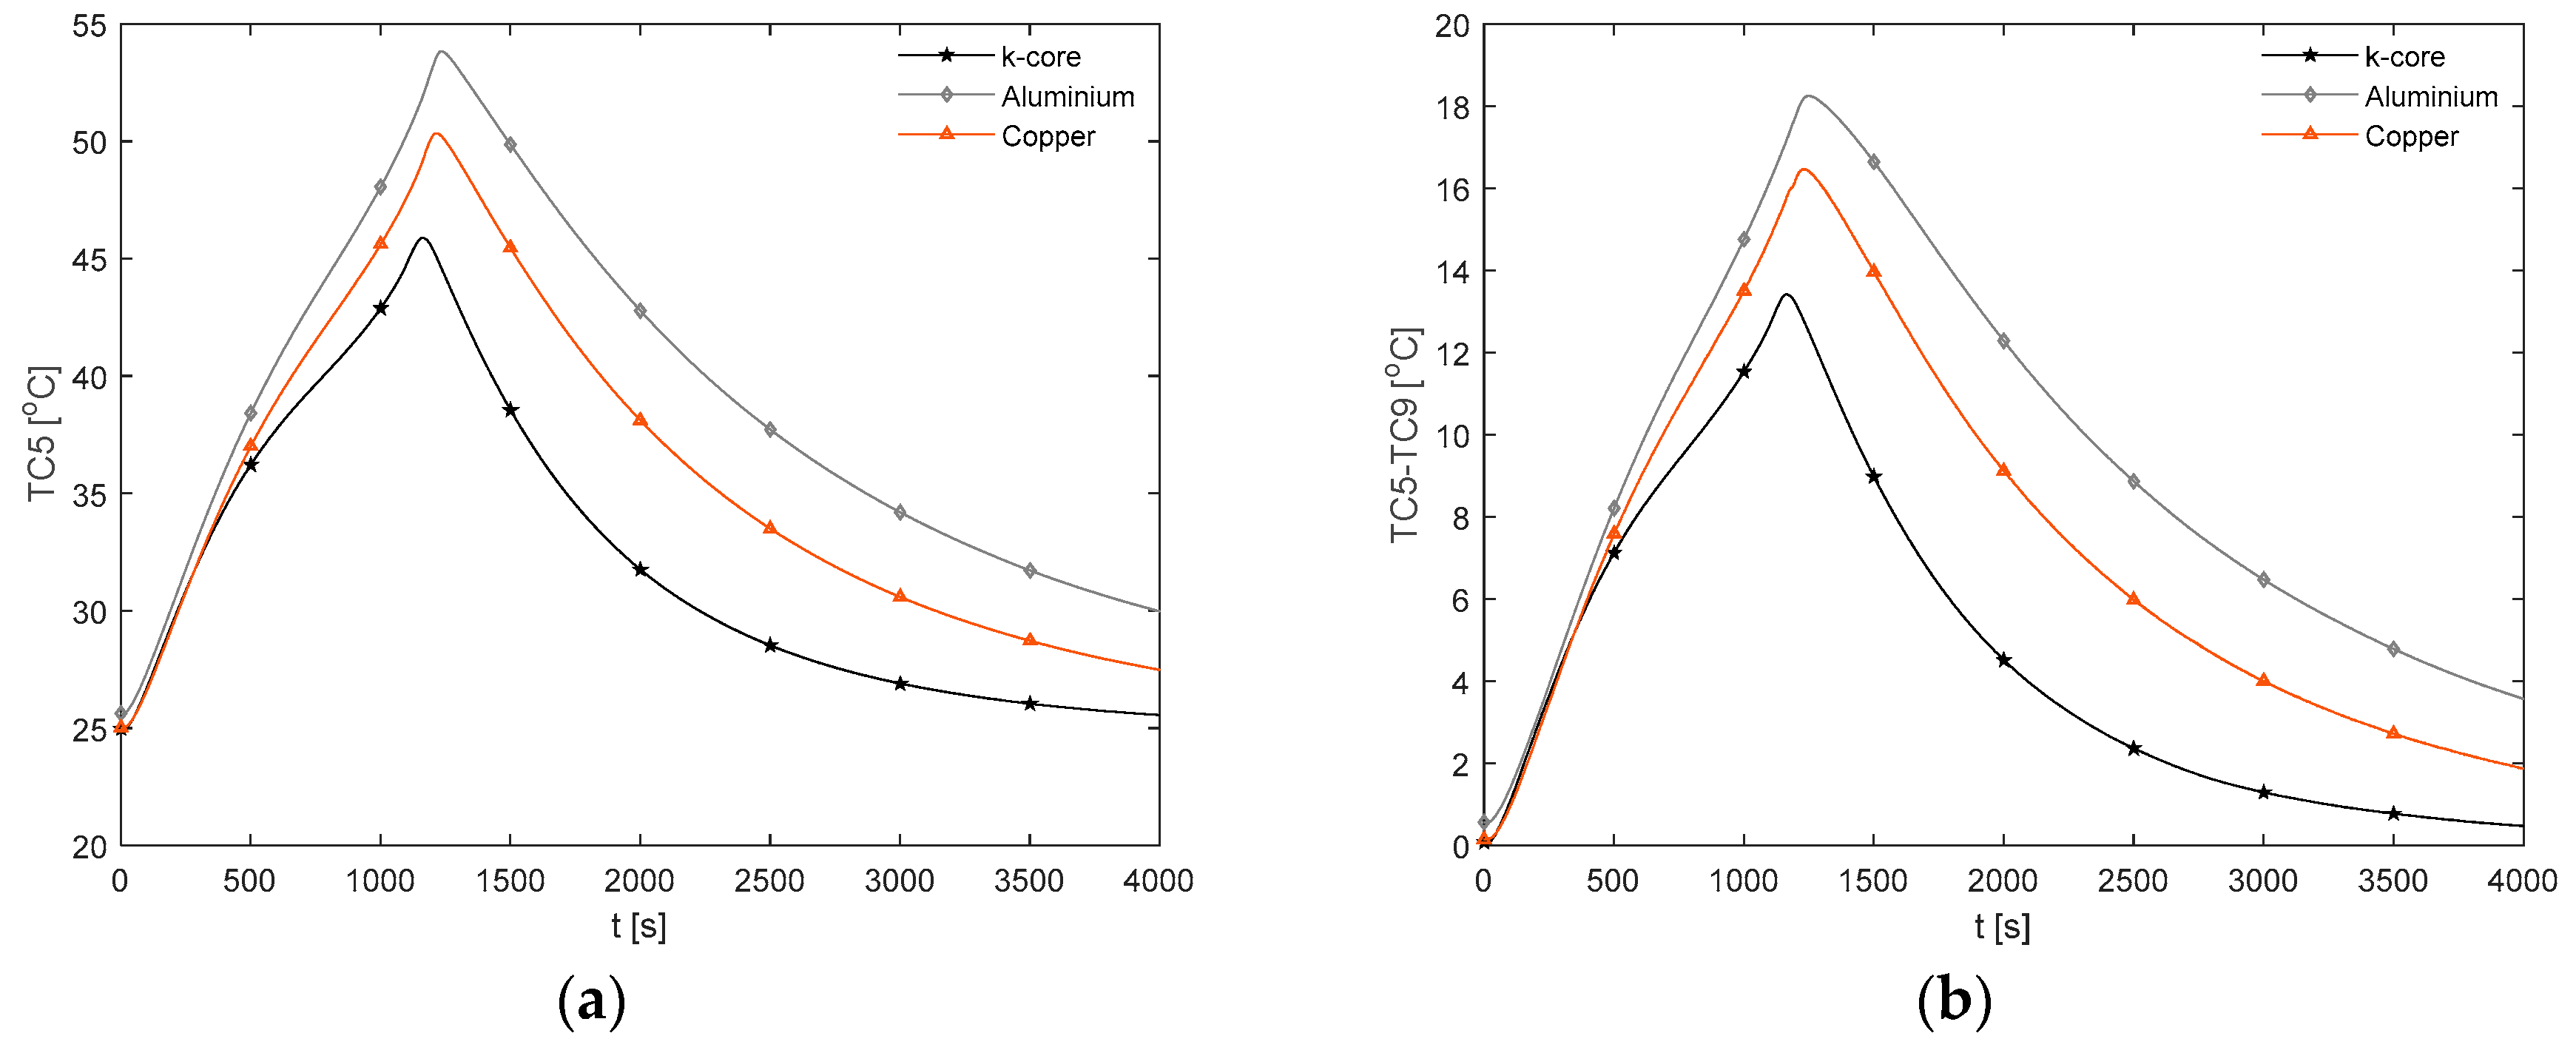
3.3.3. C and 3 C Discharge Thermal Response
For the more aggressive 2 C and 3 C electrical loading conditions, the improvement of the k-core fin over conventional aluminium in reducing
becomes more apparent. From
Figure 14a for the 2 C discharge, the k-core fin provides a reduction in the peak value of
of 15.1% relative to aluminium.
Figure 15a for the 3 C case provides a similar reduction of 14.7%, whereby
for the k-core fin is 45.6 °C at the end of the discharge and is the only fin material capable of remaining below 50 °C. As recommended by Sato [
49], this threshold should not be surpassed for a lithium-ion battery to avoid an accelerated degradation and reduced cycle life. Thomas et al. [
50] also reported significant increases in the power fade of lithium-ion batteries when exposed to temperatures above 45 °C, where they experimentally observed the power fade increasing from circa 22% at 45 °C to circa 33% at 55 °C after 20 weeks of soak time at the given temperature when stored at 60% SOC.
Figure 14a and
Figure 15b demonstrate the evolution of
for each fin material during the 2C and 3C discharge respectively. Relative to aluminium, the k-core fin results in a decrease in the peak value of
of 35.5% and 26.8% during the 2C and 3C discharge respectively. The greater reduction for the 2C discharge may be due to the greater duration of the cycle and lower battery heat generation rate, which allows for the thermal profile of the cell and fin to more fully develop prior to the cell reaching the cutoff voltage. However, neither fin material is able to limit
to below 5 °C during either discharge.
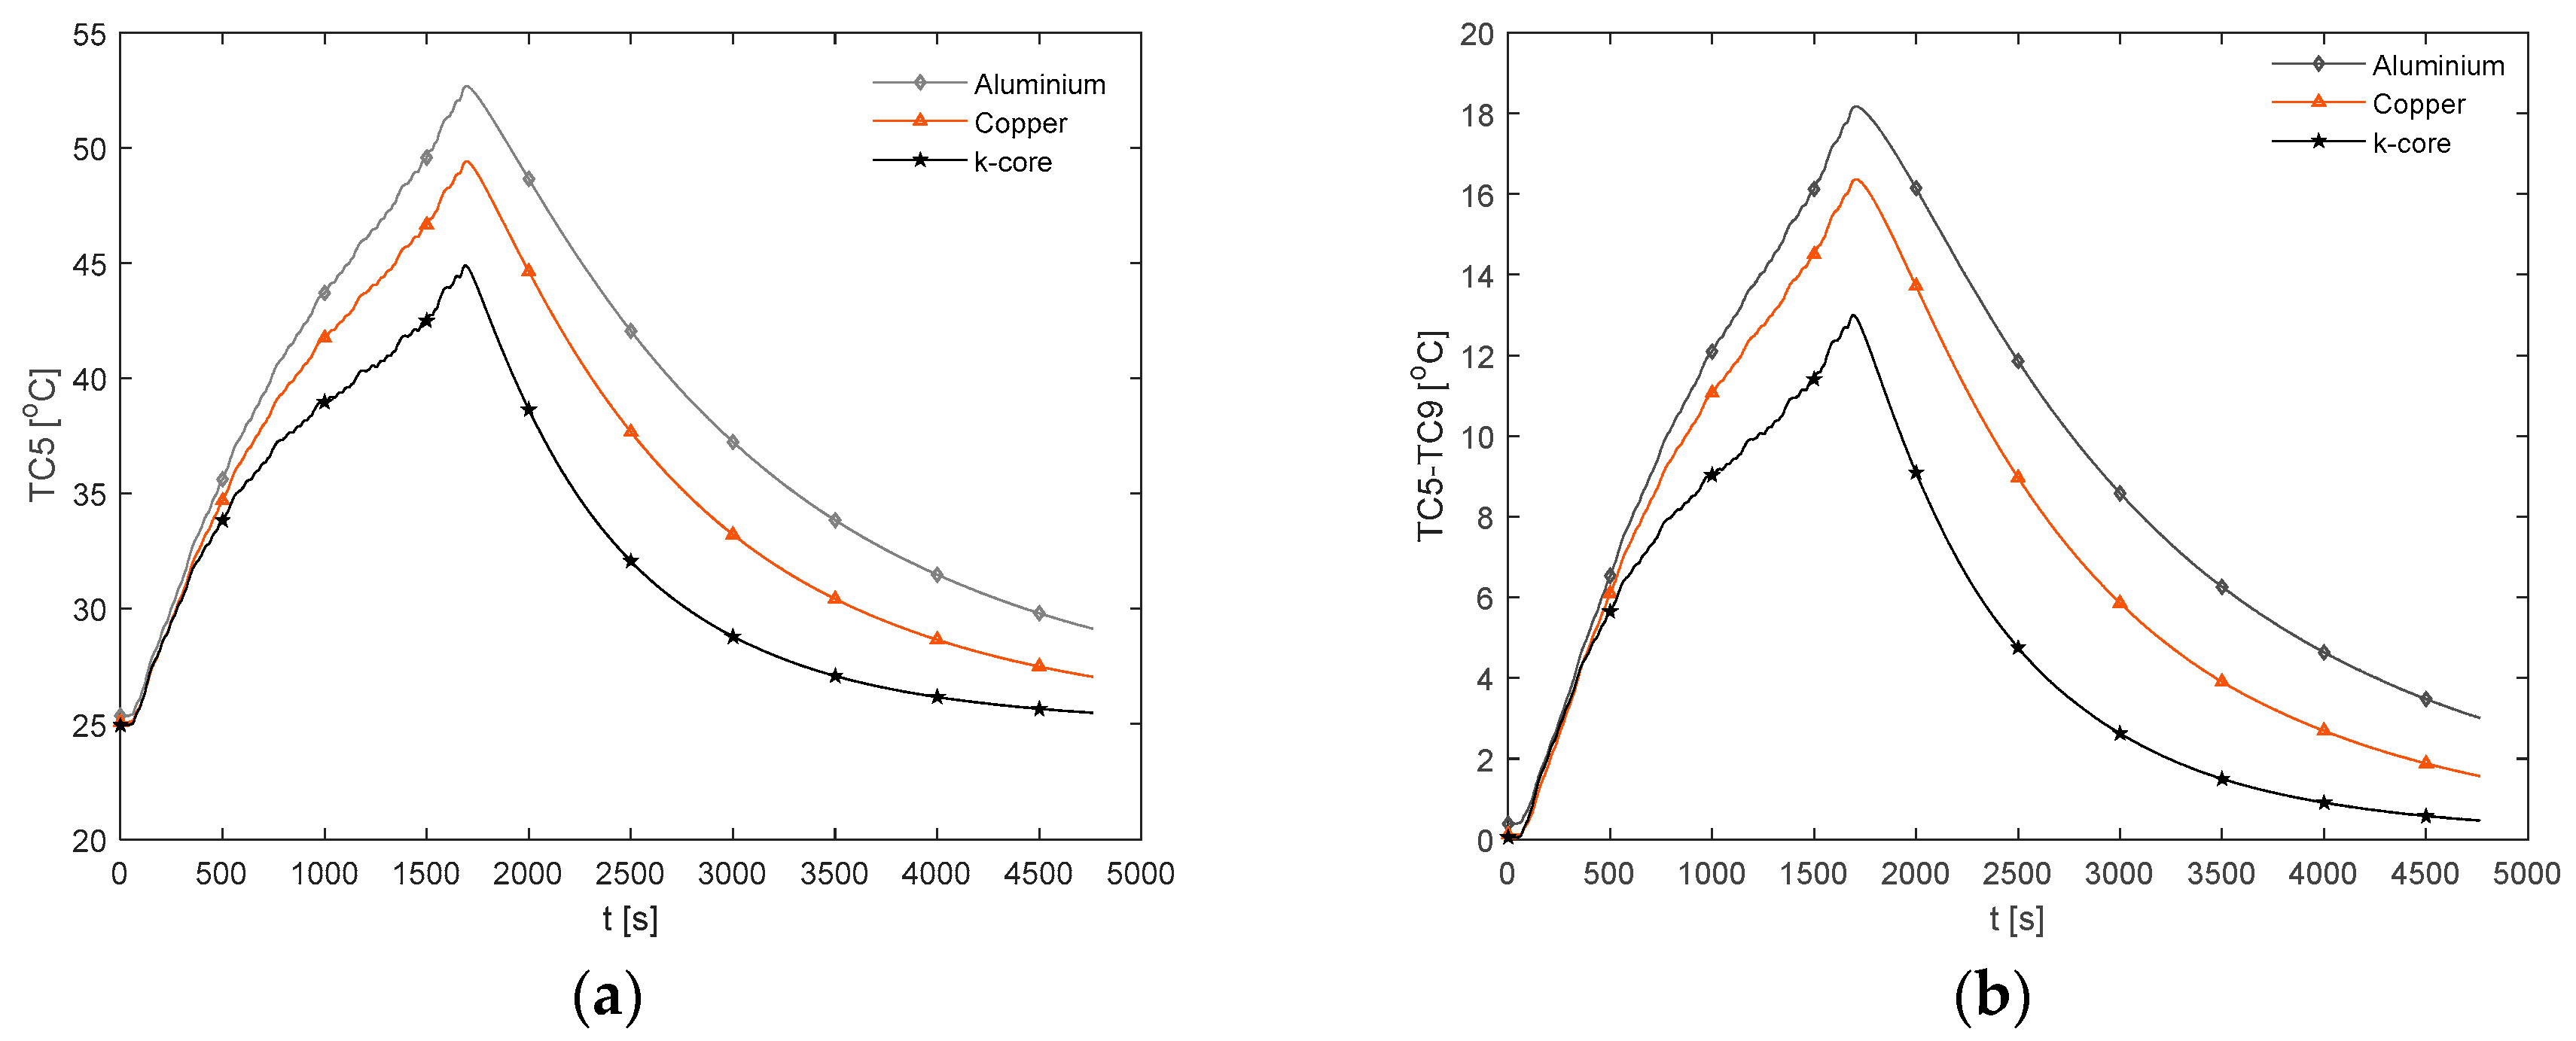
3.3.4. Race Cycle Thermal Response
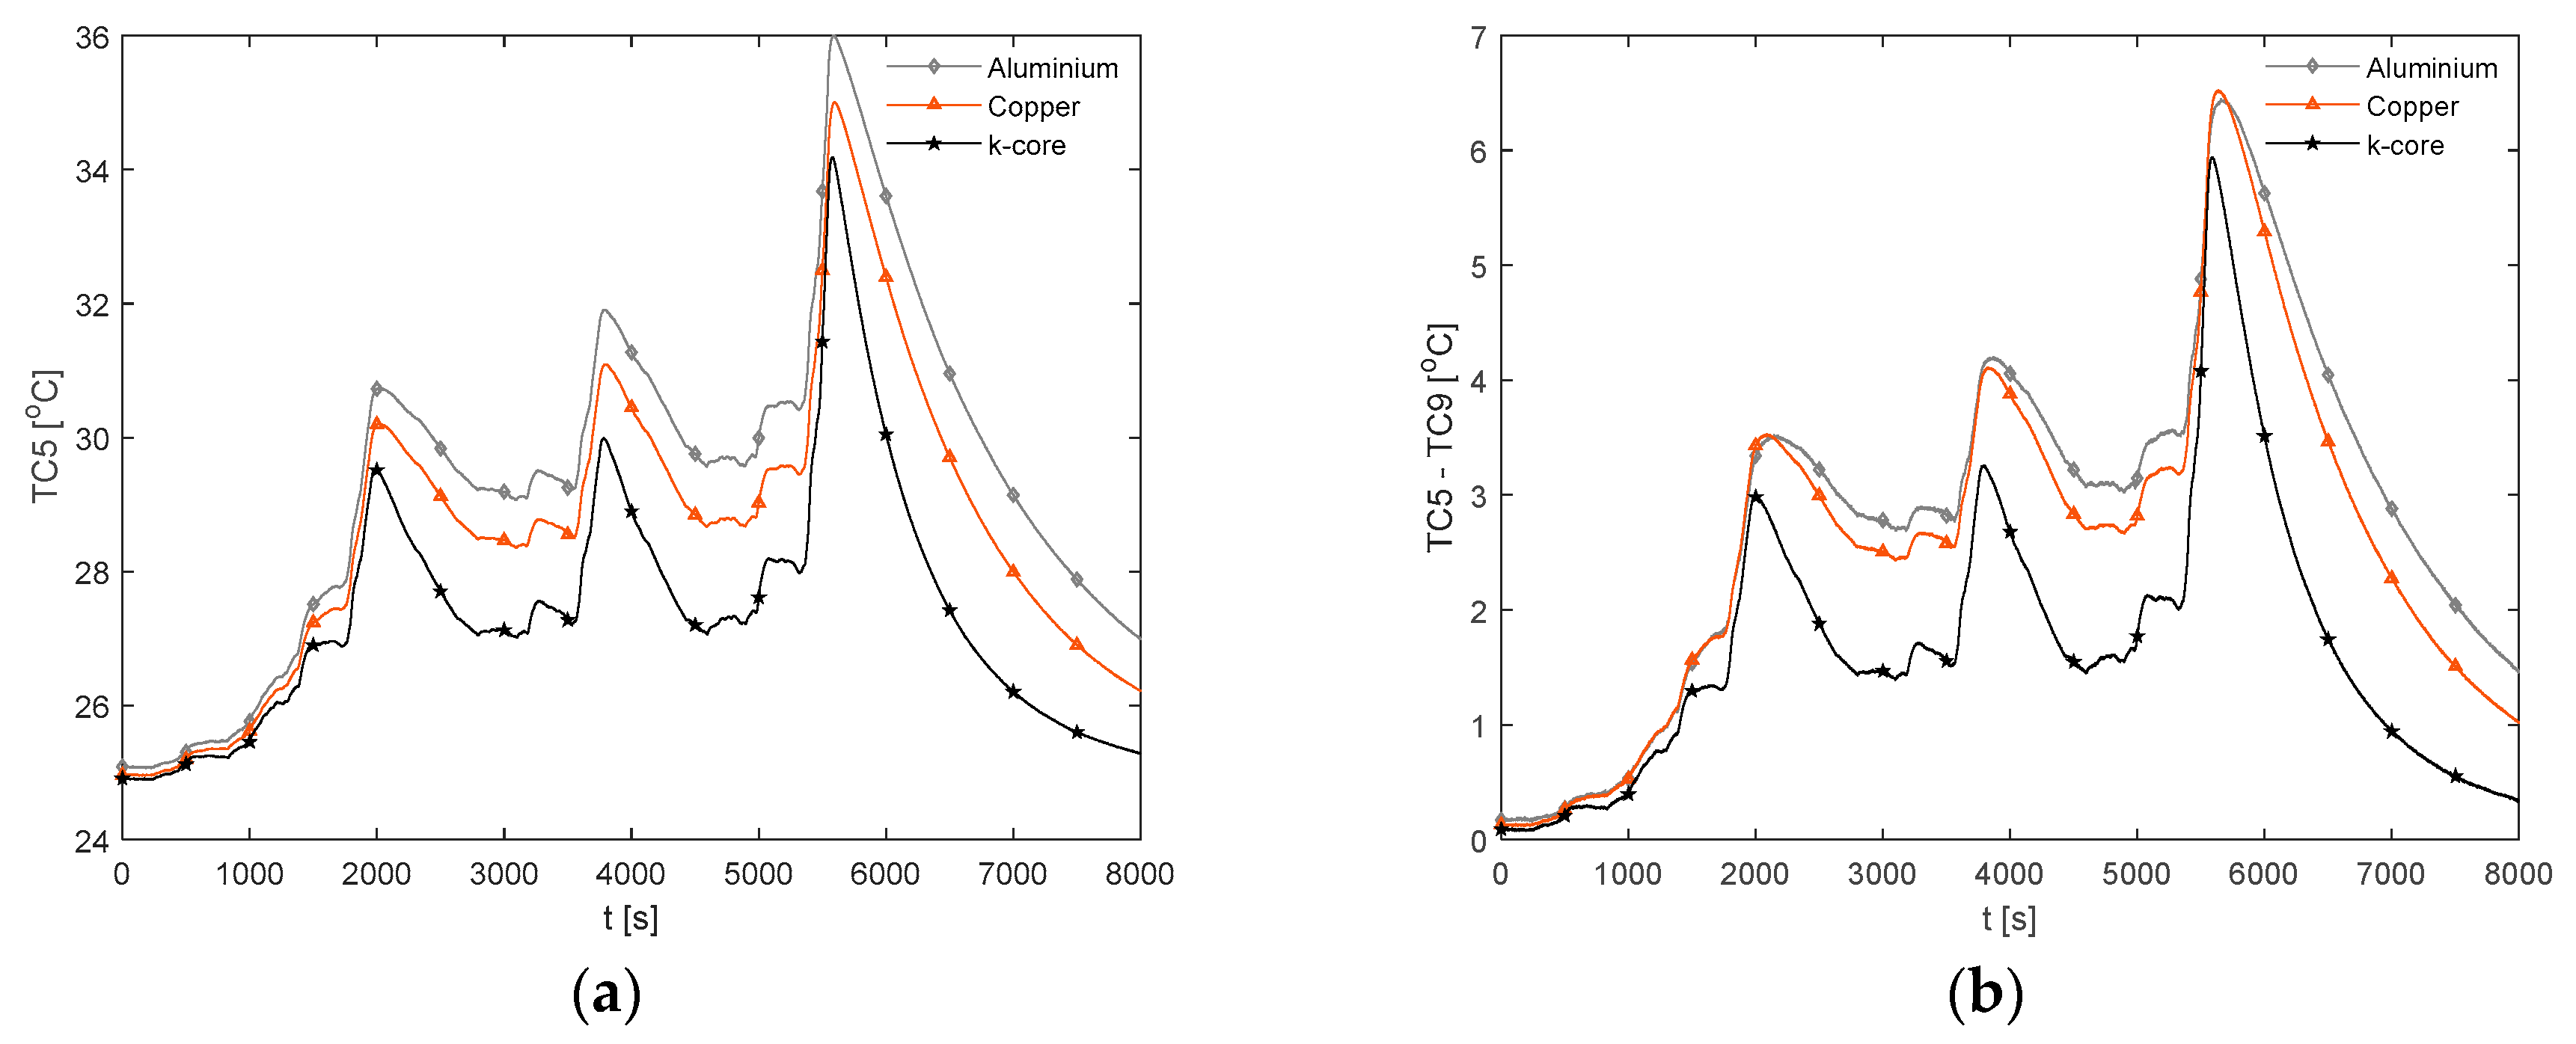
The temperature results during the race duty cycle are shown in
Figure 16. Whilst the k-core fin provides an appreciable reduction in
and
relative to both aluminium and copper, the k-core fin still results in large values for
of 44.9 °C and
of 13.0 °C. As with the 2 C and 3 C discharges, this points towards a limitation in the ability of this particular fin-based BTMS during more aggressive conditions. This may be due to cooling only one edge of the fin, particularly for this analysed pouch cell where the heat transfer pathway between the non-cooled edge of the fin and the cooled edge is long, resulting in a larger thermal resistance. Single-edge cooling, even with the k-core fin, may, therefore, be an inadequate thermal management choice when subject to long-term track racing use due to both the excessive peak temperature and surface temperature gradient.
It is also important to analyse the cooldown period (i.e., the period following the completion of the duty cycle where the cell current is zero) between the different fin materials. Here, it is observed that the k-core fin cools rapidly relative to the other materials. For instance, it takes the aluminium fin 18.9 min to cool from 44 °C to 34 °C, 14.3 min for the copper fin and 9.5 min for the k-core fin. This may enable potential efficiency savings for the control system when employing a k-core fin-based BTMS, given that the active thermal control system could be disengaged sooner than when employing the less thermally conductive materials which require a longer cooldown period.
3.3.5. Comparisons Summary
A summary of the key thermal parameters taken at the end of each analysed electrical loading scenario is shown in
Table 3.
3.4. Error Analysis
A statistical analysis highlighting the results of the standard deviation and standard error of the TC5 and TC9 measurements is shown in
Table 4. The results for the aluminium WLTP Class 3 and k-core fin 2 C condition are not applicable given that only a single sample is achieved for each of these conditions.
Sources of experimental variation between the samples may be due to slight offsets in the cell position within the busbar blocks, which alters the alignment of the thermocouple locations relative to the cell location. An example of an offset in the position of the cell to the left is represented schematically in
Figure 17.
As shown, the offset results in the location of TC5 now being further from the cell body, which may result in a lower reading than the reference position where TC5 is positioned closer to the heat generation source. Similarly, as TC5 is now positioned to the left, TC9 is in turned positioned to overlay further across the cell and, therefore, is further from the cold plate. This effect may increase the reading of TC9 relative to the reference case without any offset. An example of an offset in the cell tab positioning to the left may have occurred for Cell 3 during the copper fin experiments, as this would explain why it consistently has one of the highest TC9 readings yet also the lowest TC5 reading when compared to the other samples (see
Figure A6,
Figure A7,
Figure A8,
Figure A9 and
Figure A10 in
Appendix A).
3.5. Mass and Volume Considerations
As the analysed fin material samples do not have the exact dimension and thickness (although similar), it is important to investigate their impact on both a mass and volume basis.
A volume packing metric (
can be defined, which considers the thickness of the fin in relation to the cell thickness.
where
is the volume packing metric. Values closer to unity for
are conducive towards a more compact thermal management design.
Table 5 summarises the results of the analysis, which also includes the % increase in weight of the cell with the cooling fins. The mass of the cells is 1.15 kg.
Table 5 highlights that 1-edge cooling with k-core and aluminium adds circa 13% weight to the cell. Methods to reduce the mass impact of the fin cooling method could be achieved by optimising the geometry of the fin, given that these analysed prototype samples are slightly oversized for the cell body. The weight increase for the copper fin adds more than 40% extra weight for the cell, rendering it unsuitable as a cooling material.
The presence of the skin layer with the k-core fin decreases the volume packing compactness from 0.92 with the conventional fins to 0.90 with the k-core fin. The total fin thickness could be reduced through decreasing the APG thickness or altering the skin layer properties. The effect of this on the fin thermal performance is a scope for further work.
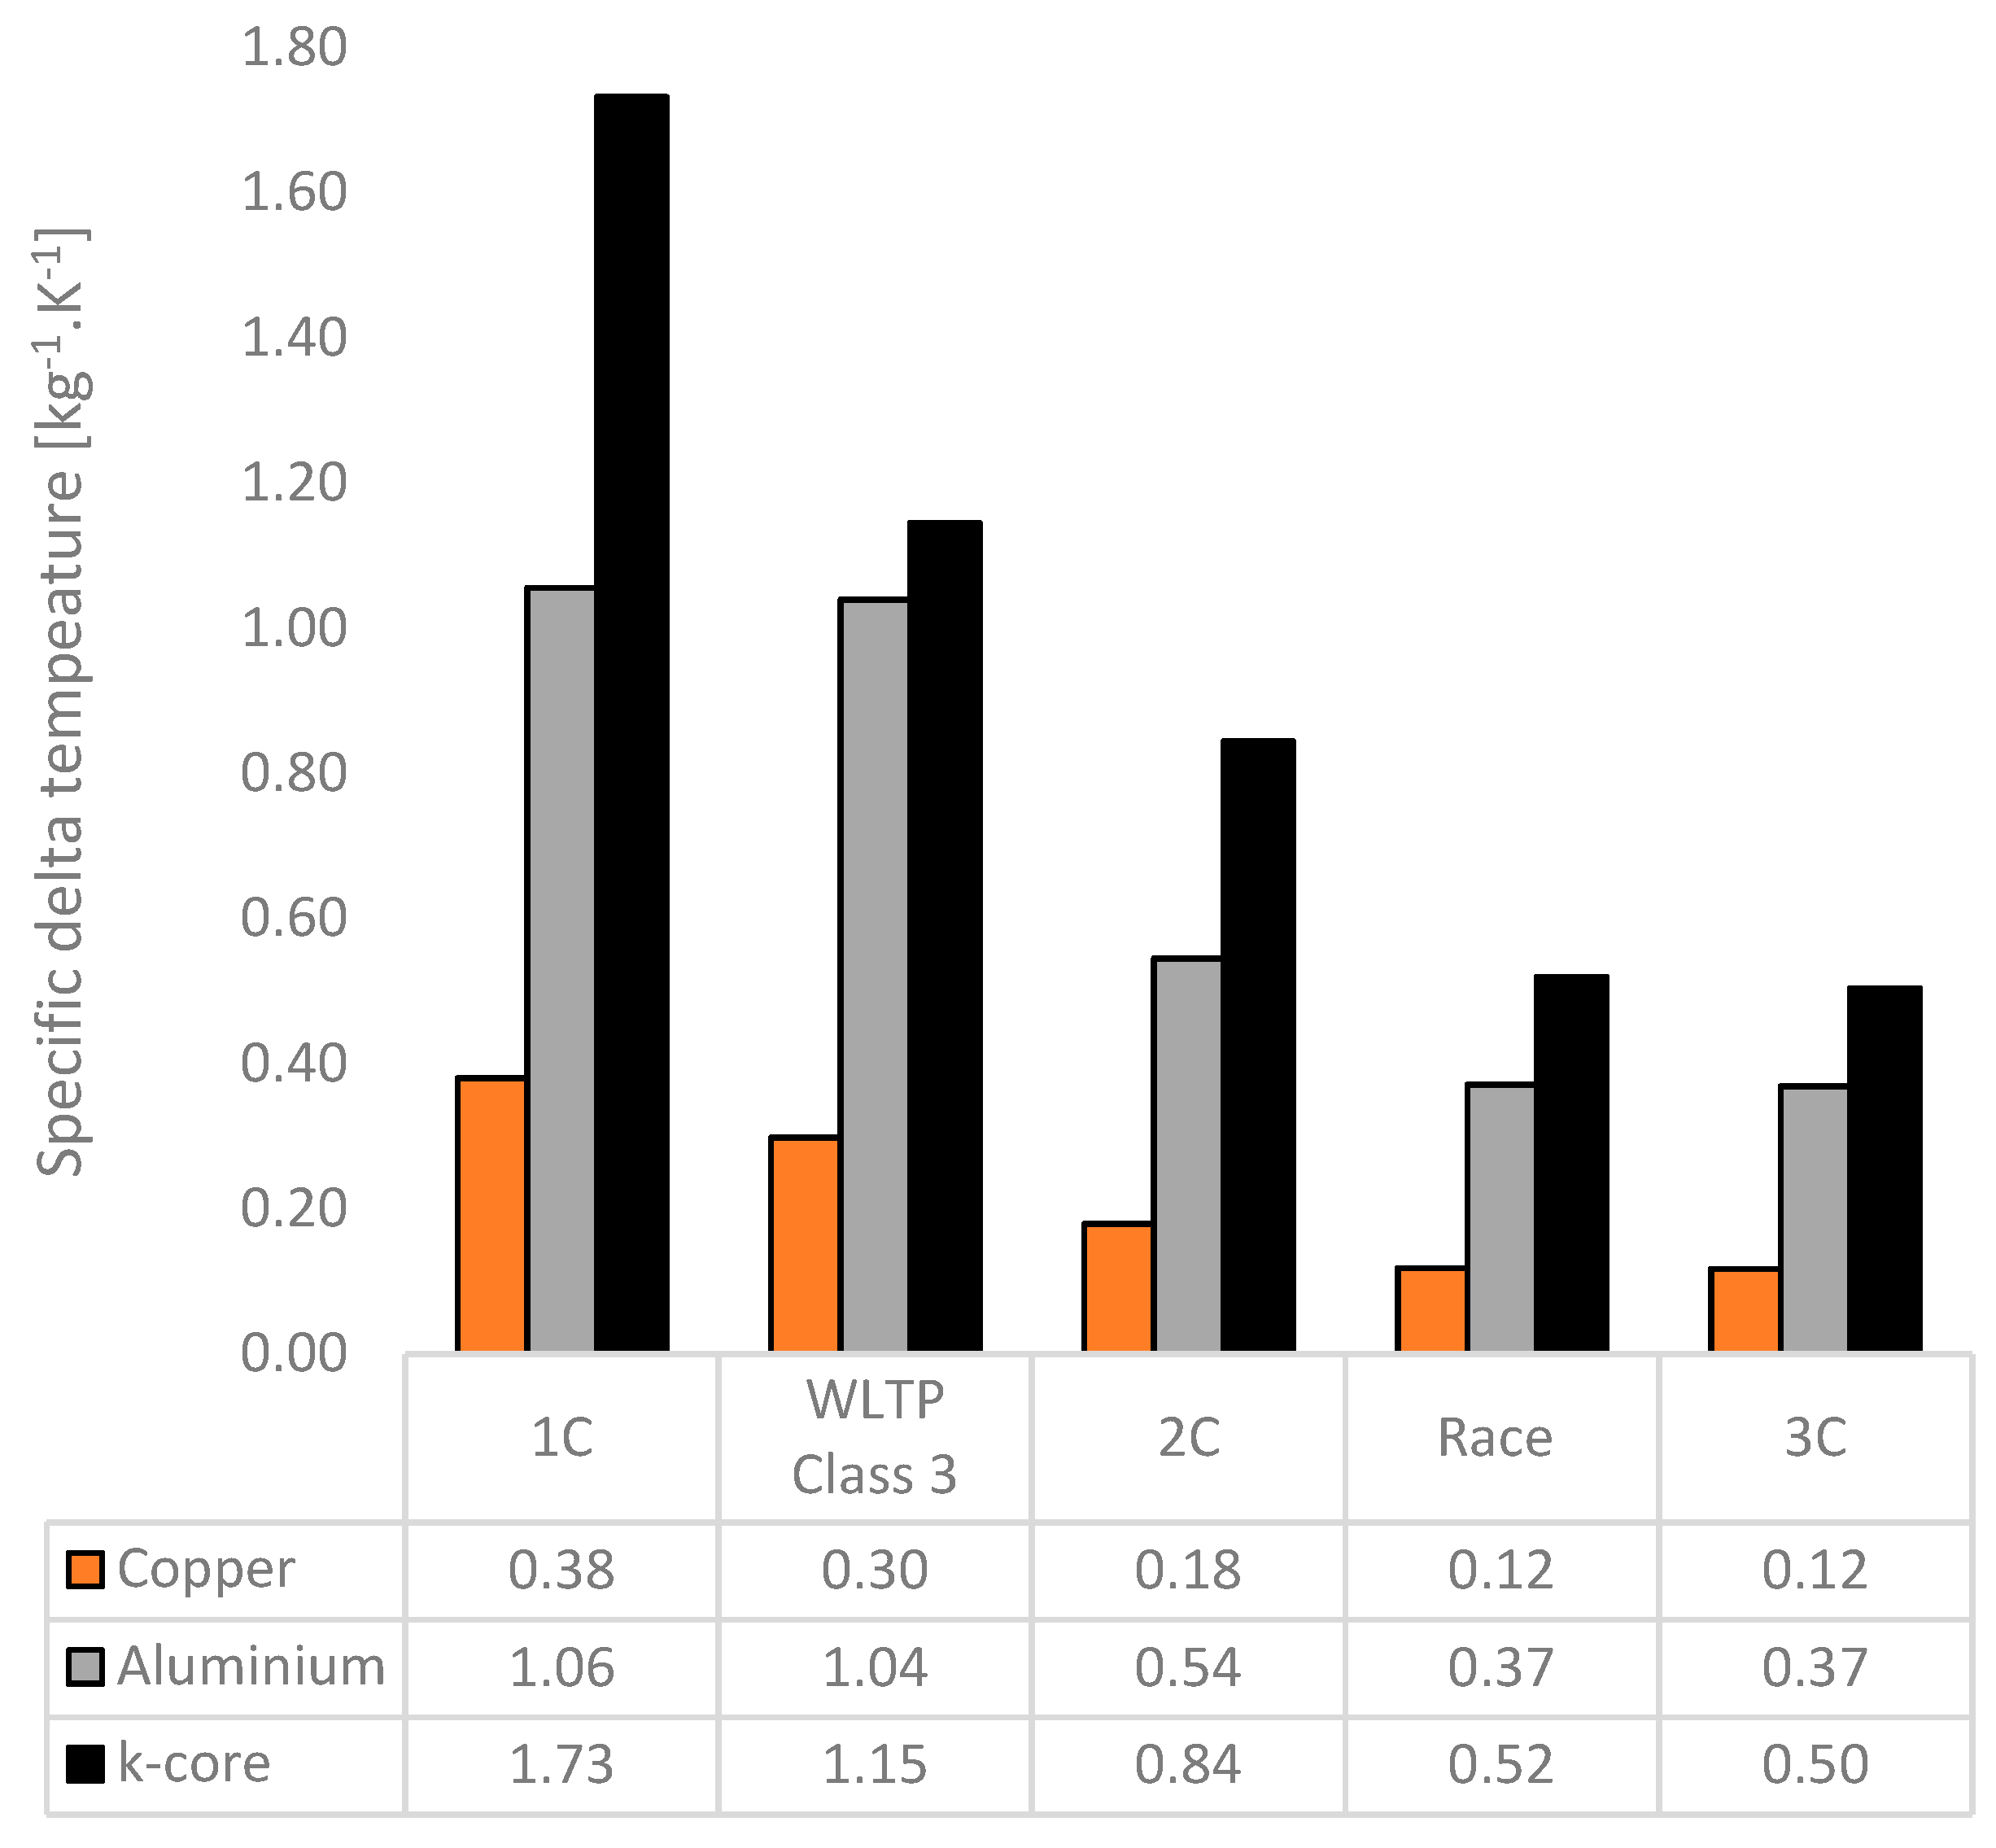
The effectiveness of the fin materials in their ability to minimise the formed temperature gradients on a mass basis can also be expressed by the specific delta temperature, which considers the reciprocal of the product of the peak value of
and the total fin mass per cell in this instance. Larger values for the specific delta temperature point towards a greater thermal efficiency on a mass basis. The results for the specific delta temperature as a function of fin material for each test case are shown in
Figure 18. Here, the k-core fin provides an increase in the specific delta temperature between 10–64% relative to aluminium across all the tested scenarios. The lowest increase is for the WLTP Class 3 cycle, which may be due to the rapid increase in temperature as the cell reaches the cutoff voltage which cannot be compensated for by the BTMS. Also observed is that the specific delta temperature decreases for all materials as the aggressiveness of the test case increases. Methods to improve the mass efficiency of the system, such as the potential for two-edge cooling to reduce the thermal path between the cell and external cooling source, should be investigated for these use cases (particularly for the 3 C discharge and the race cycle).
4. Further Work
Given the thermal improvement of the k-core over the reference case fins, further work should seek to analyse the effect of the improved gradient and peak temperature on the ageing rate of the cells. This would require a long-term testing of cells cooled with k-core fins and separate cells with aluminium fins under exact external cooling and electrical loading conditions.
As the presented test rig with k-core fin cooling requires the edge of the fin to be bent with a large 25 mm of contact length, a more practical edge cooling approach should be investigated to enable the compact packing of cells. The suitability of other encapsulating materials, such as Kapton, and the effect of the APG core thickness on thermal performance should also be investigated to further lower the mass and volume penalty associated with the k-core fins. In addition, as the material is currently produced on a level to supply niche sectors (such as aerospace), a cost analysis should be performed to investigate the potential of increased economies of scale to allow the penetration of the material into the commercial EV, PHEV and HEV markets.
The development of a thermal model to estimate the temperature profile throughout the cell under both single- and two-edge fin cooling is also an area for further work. Performing additional experiments to determine the difference in contact resistance between the more flexible k-core fin and conventional aluminium fins may further guide the choice of whether a thermal interface material is required in practical applications.
5. Conclusions
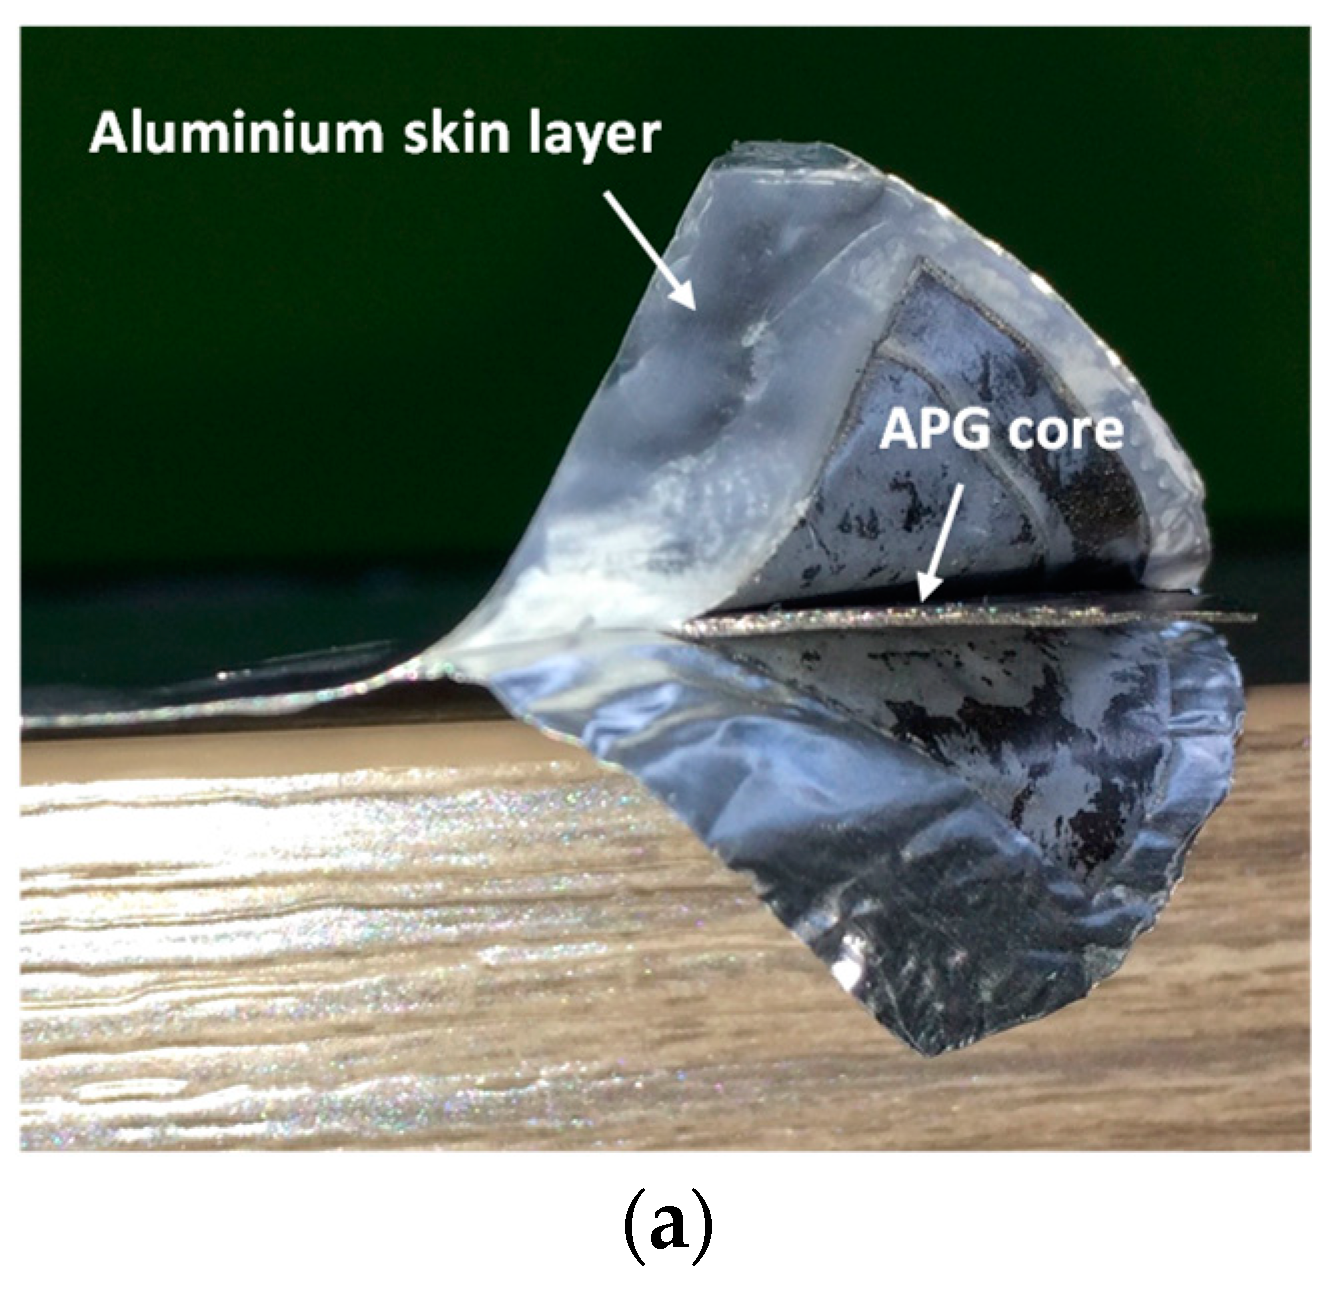
A comprehensive thermal analysis has been performed on a conduction-based method for cooling the surface of large format pouch cells, where a novel fin material with superior in-plane thermal conductivity is presented.
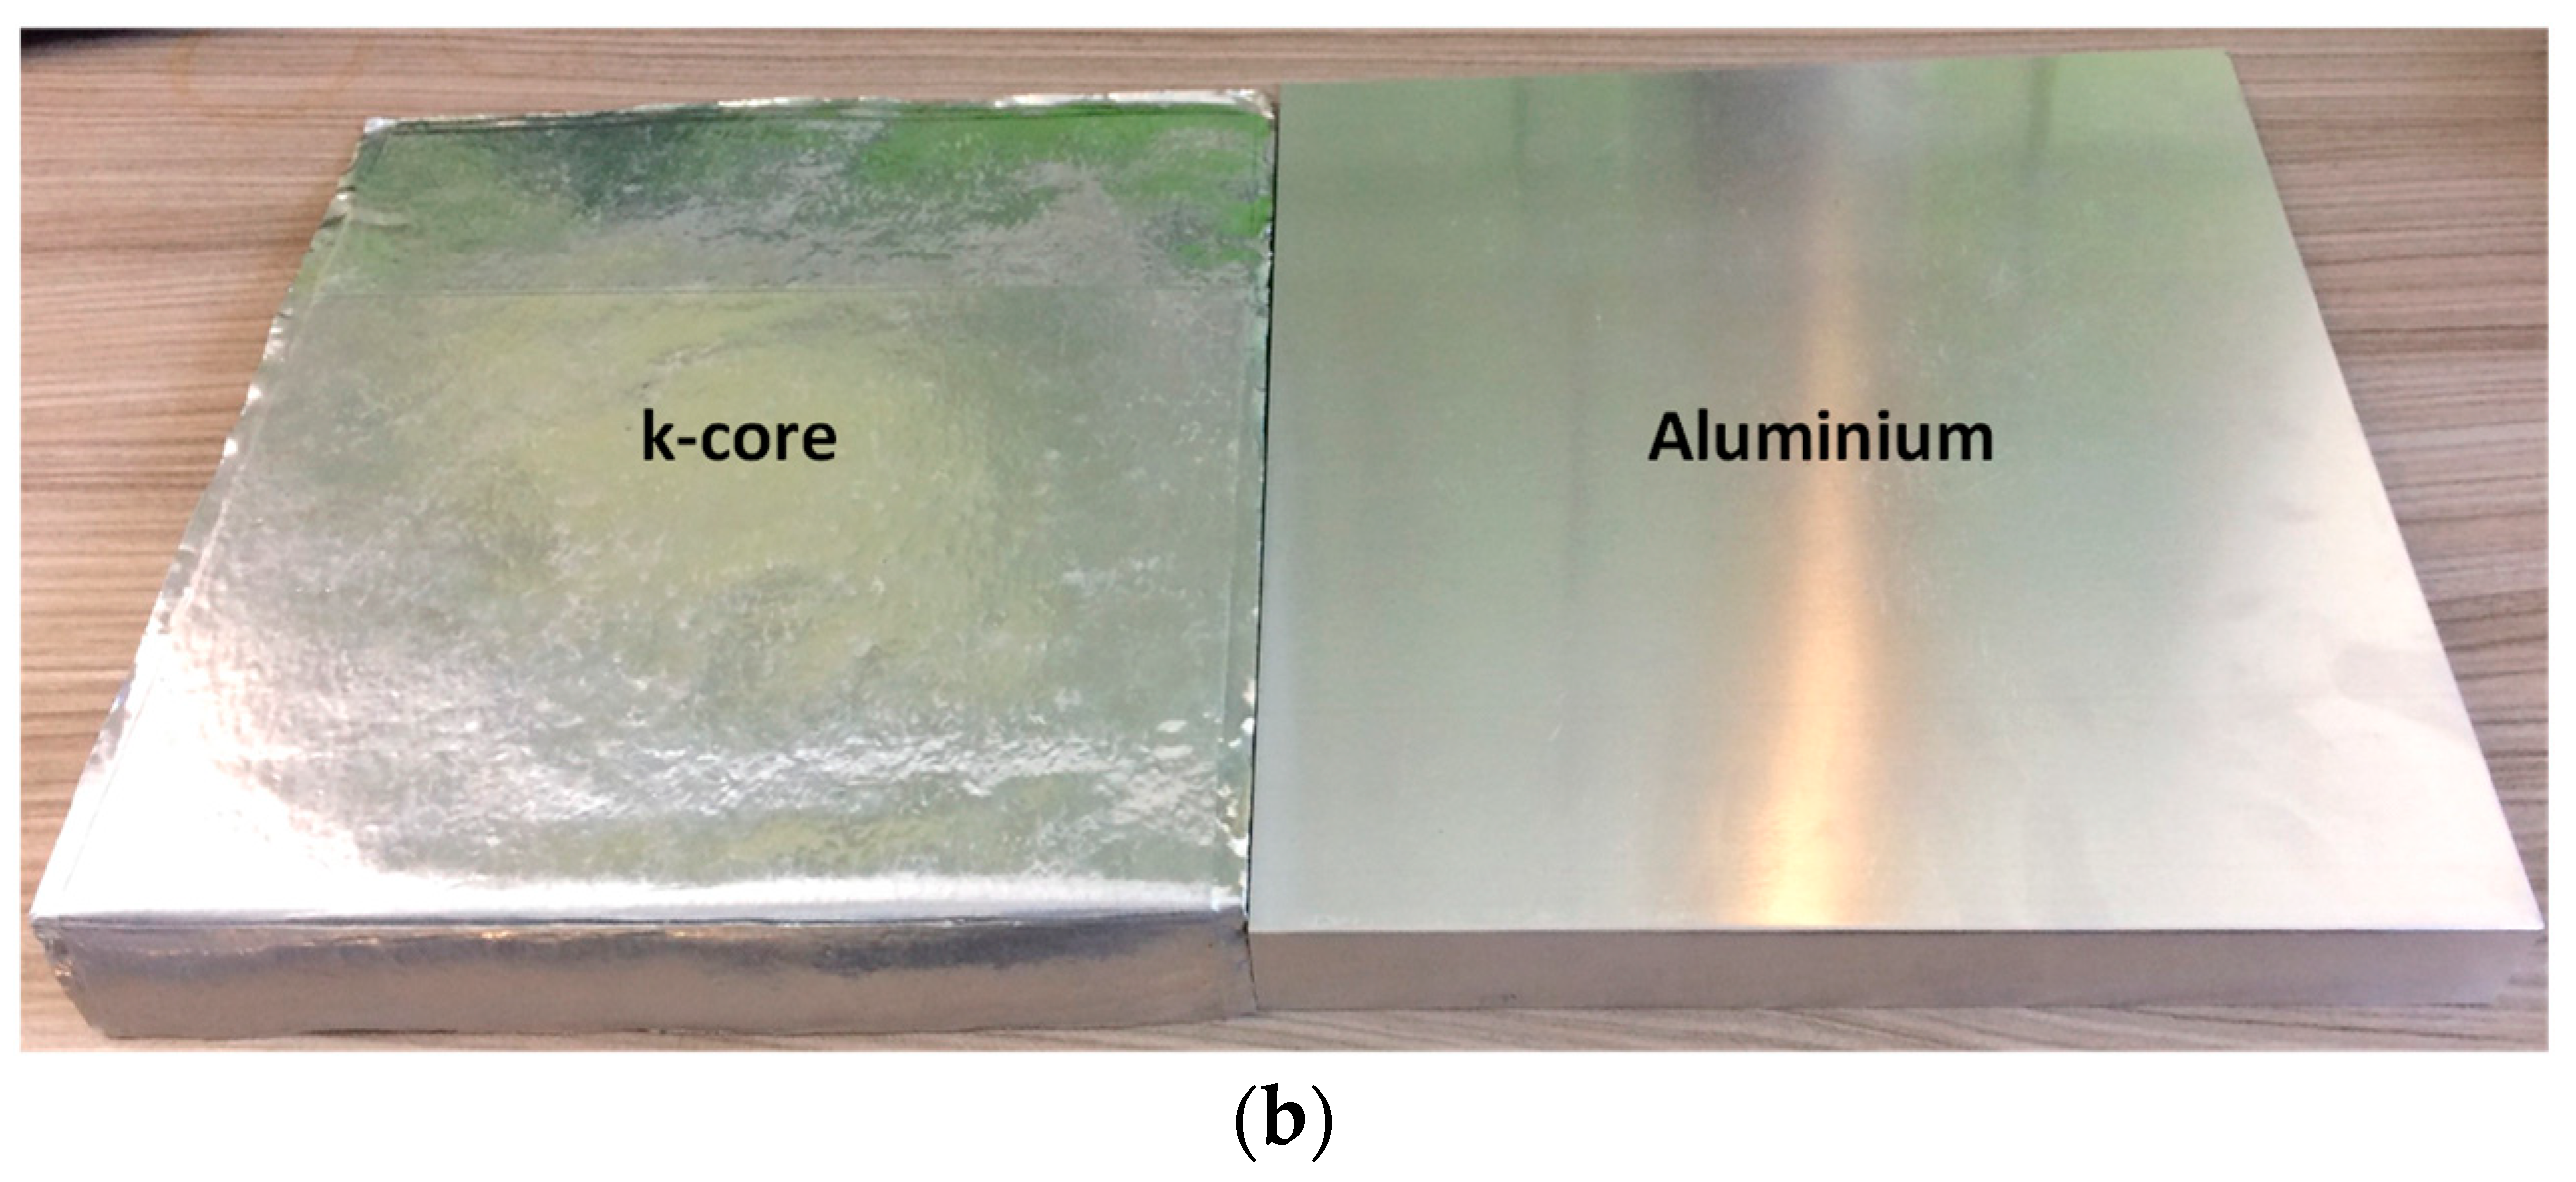
Of the considered cell electrical loading conditions, the experimental results reveal that 1-edge fin cooling pouch cells with k-core sheets (comprised of an annealed pyrolytic graphite core encapsulated in an aluminium foil) can provide a reduction in both the maximum fin temperature and temperature gradient of up to 15% and 39%, respectively, relative to conventional aluminium fins. The advantage of k-core is more prominent for the more aggressive electrical loading conditions, such as the performance electric vehicle (EV) duty cycle where the maximum recorded temperature can remain below 45 °C, whilst the aluminium fins reach a temperature of 53 °C. This enables the cells cooled with k-core fins to operate within a far safer tolerance, given the accelerated ageing rates associated with operating at temperatures exceeding circa 50 °C reported in the literature. However, whilst the k-core fin also provides a greater temperature uniformity across the fin surface (13.0 °C measured gradient vs. 18.2 °C for aluminium), the value is still much larger than the recommended 5 °C limit reported in the literature. Further work should seek to investigate methods to improve the heat transfer rate for these aggressive applications, such as by cooling both edges of the fin or investigating the effect of increasing the fin thickness.
For the less aggressive tested electrical loading conditions (1 C and the plug-in hybrid vehicle (PHEV) cycle), the aluminium fin may provide a satisfactory thermal control given that the maximum temperature and temperature gradient remain below 35 °C and 5 °C for the majority of the test period. The benefit of k-core fins for these applications may be in the use of thinner fins to further reduce the mass and volume requirements of the battery thermal management system (BTMS), given the larger thermal head room available and their superior efficiency on a mass basis to reduce the temperature gradient (63% more efficient that the aluminium fin for the 1 C discharge). The determination of the optimum fin thickness for these applications is a scope for further work. The tested copper fins are unsuitable as a fin material for a BTMS given the large weight incurred to the cell, where the mass increase is 44.9% versus 12.9% for both the aluminium and k-core fins.
The promising results of this work act to advance the understanding on the thermal performance of conduction-based cooling for large format lithium-ion batteries, which may, in turn, accelerate the adoption of future lightweight, inherently safer fin cooling designs for automotive battery systems.

 ,
, 


