Article

Optimal Charging Navigation Strategy Design for Rapid Charging Electric Vehicles

School of Automation, Guangdong University of Technology, Guangzhou 510006, China
*
Author to whom correspondence should be addressed.
Energies 2019, 12(6), 962; https://doi.org/10.3390/en12060962
Submission received: 12 January 2019 / Revised: 23 February 2019 / Accepted: 7 March 2019 / Published: 13 March 2019
(This article belongs to the Special Issue Intelligent Transportation Systems for Electric Vehicles)

Abstract

:
Electric vehicles (EVs) have become an efficient solution to making a transportation system environmentally friendly. However, as the number of EVs grows, the power demand from charging vehicles increases greatly. An unordered charging strategy for huge EVs affects the stability of a local power grid, especially during peak times. It becomes serious under the rapid charging mode, in which the EVs will be charged fully within a shorter time. In contrast to regular charging, the power quality (e.g.,voltages deviation, harmonic distortion) is affected when multiple EVs perform rapid charging at the same station simultaneously. To reduce the impacts on a power grid system caused by rapid charging, we propose an optimal EV rapid charging navigation strategy based on the internet of things network. The rapid charging price is designed based on the charging power regulation scheme. Both power grid operation and real-time traffic information are considered. The formulated objective of the navigation strategy is proposed to minimize the synthetic costs of EVs, including the traveling time and the charging costs. Simulation results demonstrate the effectiveness of the proposed strategy.

1. Introduction

With the increasing concern about environmental protection and the energy supply problems, more attention has been focused on the development of electric vehicles (EVs) [1]. In contrast to the normal gasoline/diesel powered vehicles, EVs are considered as a kind of zero-emission transportation. Meanwhile, EVs can function as moving electric storage equipment to help the power balance between the supply and demand sides [2,3,4]. The vehicle performances are improved via realizing the advantages of environmental protection and energy conservation. However, as the number of EVs grows, the power charging demand increases greatly. The larger-scale and disorganized charging strategies cause several serious problems for the local power grid. The charging terminals will be overloaded and the performances of power grids, including the efficiency, stability and reliability will be directly affected [5,6]. Along with the development of internet of things (IoT) technologies, how to design an optimal and efficient charging strategy for EVs becomes a critical problem.
Normally, the existing EV charging modes can be classified into: regular (slow) charging, rapid charging and battery switching [7,8]. In the regular charging mode, the charging power is low. It takes a longer time for EVs to be fully charged, which can extend EVs’ battery life and reduce the impact of charging behaviors on the local power grid. Since the charging process is slow, this charging mode requires a long parking time and the charging stations are often located in the large public/commercial parking lots or residential underground garages.
Given the limited capacity of EV battery, the drivers who have a long-distance trip should select a fast charging mode to refuel their vehicles. Compared with regular charging, the charging time durations of EVs under the rapid charging and the battery switching modes are reduced. As for the battery switching mode, the battery parameters and interface standards are different for the various EV types and manufacturers. Under the battery switching mode, several professional and particular EV battery switching stations are needed to support the EV traffic [8,9]. It is suitable for public transport buses, and it has a limited influence on the power grid. Besides battery switching, rapid charging is another faster charging mode. Under this charging mode, the charging process will be completed in the charging stations with high power level. It is more convenient and flexible, so the normal drivers prefer this mode to recharge their EVs to continue driving more quickly.
However, rapid charging may pose threats to the power grid system. A large number of disordered and random rapid charging behaviors will cause negative effects on the local power grid, especially during the peak periods. Compared with regular charging, excessive rapid charging loads on the electric power distribution network can cause more serious problems, such as voltages deviation, overload of network components (e.g., cables or transformers), and the increase of the harmonic distortion level of the local power grid [10,11,12].
To reduce the EV charging impacts on the power grid, many studies have been carried out, focusing on the charging scheduling design to flatten the peak loads [13,14], via the help of the real time IoT technologies, such as vehicle-to-grid (V2G) communication, crowd sensing. Ref. [15] proposes a coordinated architecture to shift the charging loads by dynamic price regulating. Furthermore, in [16], a fair energy scheduling scheme is proposed to control the charging loads of EVs. By coordinating both the charging and discharging behaviors, an optimal charging approach is presented in [17] to achieve peak shaving and minimize the charging power losses. Most of these studies mentioned are based on the regular charging mode, the main objectives of these scheduling schemes are to change the charging behaviors of EV drivers. However, when urgent charging demands arrive for the moving EVs on roads, adjusting the start time of charging reduces the drivers’ satisfaction sharply. When the EVs are driving on the road outside, the rapid/faster charging modes are needed. It is necessary to develop a charging navigation strategy for rapid charging EVs.
In the literature about charging navigation, Ref. [18] analyzes the EV navigation problem while the traveling cost is minimized. Ref. [19] formulates the charging-scheduling problem and proposes an optimal method to reduce the total charging time of EVs. In terms of navigation in transport sectors, some necessary navigation applications (e.g., GPS) are installed to guide the EVs to the charging stations. However, the mentioned navigation strategies [18,19] do not consider the power system information. Then, the power system performance will be reduced when the mentioned strategies are utilized for the rapid charging EVs directly. In  detail, as the power demand for rapid charging increases, it  causes charging congestion when a large number of EVs arrive at one rapid charging station at the same time. In  China, since the rapid charging stations are generally built in bustling downtown areas, such behaviors may lead to traffic congestion around rapid charging stations as well as the power overload of these areas. Likewise, heavy traffic situations also greatly affect the charging of EVs, including the traveling time on the roads and the waiting time at the charging stations. An integrated rapid-charging navigation strategy is proposed in [20], that considers both the traffic condition and power grid status. It develops a strategy considering the total time for charging, however, the charging expenses are neglected. Ref. [15] formulates an optimized charging model to minimize the charging cost in response to time-of-use (TOU) price in a regulated market. Even in the same time period, the charging stations in different areas can adjust their rapid charging prices according to their operation status. Adjusting the charging prices in real time becomes an efficient method to control the number of charging EVs. Therefore, besides considering the power grid and traffic system constraints, it is  necessary to satisfy the EVs’ demands with the minimal synthetic cost (i.e., traveling time and charging expenses) under the rapid charging mode, via the deployed IoT network in both the traffic and power grid systems.
In this paper, we develop an optimal EV navigation strategy under the rapid charging mode, while the synthetic costs, including the traveling time and charging expenses are minimized. Meanwhile, the traffic congestion and the charging station overloading are mainly considered. In  our work, we only focus on private electric vehicles and specifically aim at the Chinese situation. The real time traffic data and the power grid operation information are the basis of our proposed navigation strategy. We propose an intelligent transport system framework for the rapid charging EV system, the data collection and transmission are processed in the distributed computing manner. The  rapid charging stations regulate the charging power of each charging pole dynamically according to the power grid operation information, and adjust their charging prices base on TOU tariffs and the queuing number of EVs. During the driving process of EVs, the charging navigation path is updated in real time, according to the power grid status and the traffic conditions. Therefore, the charging navigation paths are always optimal in the driving process. In summary, the contributions of this paper are listed as follows.
  • We design an optimal charging navigation strategy for rapid charging EVs to reduce EV users’ traveling time and charging expenses flexibly.
  • We propose an intelligent transport system framework for our optimal charging navigation strategy, while the traffic and power grid operation information are considered.
  • To implement our optimal charging navigation strategy, we use the charging power regulation scheme to reduce the influence for power grid, and charging price adjustment scheme to balance the number of EVs at each rapid charging station.
The remainder of this paper is organized as follows. The system model is presented in Section 2. The optimal charging navigation scheme is proposed in Section 3. Simulation results are proposed in Section 4. In Section 5, we present the conclusions of this paper.

2. System Model

In this section, we propose a comprehensive system model as illustrated in Figure 1. It  contains three parts: Intelligent Transport System center (ITS center), Rapid-Charging Station (RCS), and EV terminals. Real-time traffic data and power grid operation information are collected and calculated in a distributed model via the IoT networks (e.g., crowd sensing). The EV navigation system operates in the slot-by-slot fashion. The structure of each slot is shown in Figure 2. Each slot has three frames, including calculation and broadcast frame t 1 , decision frame t 2 , and monitoring frame t 3 . Normally,  t 3 > > t 1 and t 3 > > t 2 . In order to obtain optimal rapid-charging navigation strategies for EVs, the  navigation paths should be updated in each slot. In  the monitoring frame t 3 , the RCS collects the power grid operation data, meanwhile, the ITS center collects real-time traffic data. In  frame t 1 , the RCS and ITS center calculate the collected information respectively and then broadcast the charging station information and road conditions to the EVs. After receiving the broadcasting data, the EVs determine the navigation paths in frame t 2 . The integrated system is described in detail as follows.

2.1. Rapid-Charging Station

As shown in Figure 1, there are multiple RCSs deployed around the road. A distribution management system (DMS) unit is included in each RCS, which is used to connect the local power grid. In frame t 3 of each slot, the RCS collects the power grid operation data via the DMS. Then,  in frame t 1 , in order to ensure safe and stable operation of the local power grid, after collecting the power grid information, the DMS calculates the maximum permissible charging load based on the power loading level of the distribution power system. According to the maximum accessible charging capacity released by DMS, each RCS calculates and adjusts their charging plans. Then, it distributes the charging powers to each charging pole dynamically. In addition, according to the TOU electricity price issued by power grid company in advance, combined with their profitability and the number of queuing vehicles, the RCSs adjusts their charging prices in each slot. After that, these planned charging power data and the station information (i.e., charging prices, arrival rate and service rate at RCSs) will be broadcast to the moving EVs.

2.2. Intelligent Transport System Center

With the emerging communication and information techniques, the ITS center becomes a transport management system, which has the remarkable benefits in reducing traffic congestion. In our work, the ITS center is connected with the traffic communication network. In frame t 3 , the ITS center collects real-time traffic data via crowd sensing or other IoT data collecting technologies. Then, in frame t 1 of the next slot, the ITS center calculates the road conditions (e.g., average driving velocities in each road segment in the slot) and broadcasts them to the moving EVs.

2.3. EV Terminal

We set that the EVs can obtain the electricity from both the regular and rapid charging modes. In order to balance the gap between the traveling time and cost, we consider that the EVs obtain the charging energy via the rapid charging only on the trip. When they arrive the destination, their batteries will be charged fully via using the regular charging mode. On the basis of the received road condition data and charging station information, in the frame t 2 of each slot, the EV terminals calculate the synthetic costs for all reachable charging stations and develop optimal navigation strategies for EVs. Thus, with the dynamic information of charging station and traffic conditions, the navigation strategies can be proposed dynamically and display the result to EVs in each slot.

3. Optimal Charging Navigation Scheme
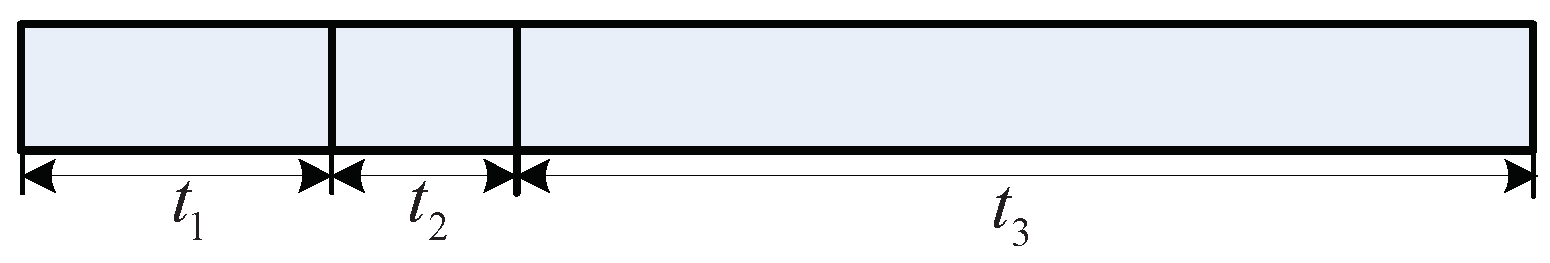
Assume that the EV starts traveling from the origin and passes through the complex traffic network to reach the destination, as shown in Figure 3. During the traveling, at the beginning of each slot in frame t 2 , the EV terminal determines whether it needs to be charged. When the remaining amount of state of charge (SoC) is not enough to finish the trip, the EV terminal should design an optimal charging navigation strategy with the minimum synthetic cost. During the driving process of charging navigation, the navigation path will be updated at the beginning of each slot, based on the dynamic information EV terminal receives. The EV arrives at the selected RCS and obtains the suitable charging energy.
In the proposed optimal navigation strategy, both the time cost and the charging cost are considered. In detail, the time cost includes the EV driving time, the waiting time and charging time at the RCSs. Moreover, the charging cost includes the rapid charging cost in the RCSs and the regular charging cost at the destination. The details are shown below, and the mathematical symbols in this paper are listed in Table 1.

3.1. Time Cost

3.1.1. Driving Time

Firstly, let T d r i v e represent the total driving time from the origin to the destination, which can be calculated as
T d r i v e = i , j { Ω Φ } T i j ,
where T i j is the traveling time between locations i and j. Ω and Φ are the sets for all visited locations and RCSs.
The driving time between locations i and j is expressed as
T i j = d i j v ¯ i j , k ,
where d i j is the distance between locations i and j. v ¯ i j , k is the average driving velocity in time slot k between locations i and j. Here, k 1 , 2 , , K , K is the total number of time slots. We set that the ITS center broadcasts the average driving velocity v ¯ i j , k to all EVs at the beginning of each slot in frame  t 1 .
We set that the EV can complete its journey with only one charging at the RCS. Let T j , d r i v e 1 denote the driving time from origin to RCS j, T j , d r i v e 2 denote the driving time from RCS j to destination. The total traveling time for RCS j is obtained via the below formula
T j , d r i v e = T j , d r i v e 1 + T j , d r i v e 2 = i , j { Ω Φ } T i j = i , j { Ω Φ } d i j v ¯ i j , k .

3.1.2. Waiting Time

We estimate the waiting time T w a i t at RCS j based on Queue Theory. Let T k denote the time duration of slot k. The number of arriving EVs during T k is denoted by n j , k a r r i v e and the number of EVs being charged during T k is denoted by n j , k s e r v i c e . These data can be easily obtained via multiple deployed sensors or devices in the charging station [21]. Then, at RCS j, the EV arrival rate δ j , k (EV number per minute) and service rate η j , k (EV number per minute) at time slot k are given as
δ j , k = n j , k a r r i v e T k , η j , k = n j , k s e r v i c e T k .
According to the queuing model M / M / s of queue theory mentioned in [21,22,23,24], the arrival rate is subject to the poisson distribution with parameter δ j , k , the service rate is subject to the negative exponential distribution with parameter η j , k . The total idle probability of the RCS j at time slot k is shown as
P 0 , j , k = n = 0 c j - 1 1 n ! δ j , k η j , k n + 1 c j δ j , k η j , k c j 1 1 - p j , k - 1 ,
where n is the number of charging EVs,   c j is the total number of EV chargers at RCS j. p j , k is the occupation rate per charger of RCS j and is expressed as
p j , k = δ j , k η j , k c j .
The length of queue L q , j is calculated as
L q , j = p j , k c j ! ( 1 - p j , k ) 2 δ j , k η j , k c j P 0 , j , k ,
thus, when a EV arrives at RCS j, the waiting time is
T j , w a i t = L q , j δ j , k .

3.1.3. Charging Time

The charging time is related to the charging power of EVs at RCSs. For the safety consideration of local power grid, we give a rapid charging power regulation scheme similar as Ref. [20]. We define the maximum rapid charging load of each RCS as the available charging capacity Q j , k . The power system allocates available charging capacity on the basis of the load condition of power nodes at each slot. At the RCS, based on the rapid-charging characteristics, the total rapid charging power of all charging pole should not exceed the available charging capacity Q j , k . Thus, to ensure the safety of a distribution power grid system, the rapid charging power P j , k of each charging pole can be obtained from
P j , k = min Q j , k n j , k , P m a x ,
where n j , k denotes the number of charging EVs at RCS j at time slot k, and P m a x is the maximum charging power that charging pole can provide.
Then, the charging time T j , c h at RCS j is
T j , c h = E c h r a p i d P j , k ϑ r a p i d ,
where  ϑ r a p i d is the rapid charging efficiency and  E c h r a p i d is the amount of rapid charging electricity.

3.2. Charging Cost

3.2.1. Rapid Charging Cost

The rapid charging cost is associated with the charging price. From the formulation Equation (9) of P j , k , when more EVs perform rapid charging in a RCS simultaneously, the rapid charging power will be affected. To balance the rapid charging demand of each RCS and avoid overcrowding at the RCS, we propose a rapid charging price adjustment scheme. We set the rapid charging price base on TOU tariffs. A parameter ρ is introduced to express the additional charging charges. The charging price ρ ¯ j , k at RCS is designed as
ρ ¯ j , k = λ j ρ t ( w j , k = 0 ) λ j ρ t + w j , k ρ ( w j , k > 0 ) ,
where ρ t denotes the TOU price in electricity market, λ j denotes the profit coefficient for RCS j. The  queuing number of EVs is denoted as w j , k (i.e., the number of EVs that waiting to be charged). If  n j , k c j , we have w j , k = 0 , otherwise w j , k > 0 . The rapid charging price adjustment scheme is shown in Figure 4. The charging price will be updated and broadcast to the moving EVs at every time slot. Once the EV starts charging, the charging price of this EV will remain unchanged during the whole charging process.
The rapid charging cost is calculated as
C r a p i d = E c h r a p i d ρ ¯ j , k .

3.2.2. Regular Charging Cost

When arriving at the destination, the EV is parked in the residential area or parking lot with charging poles. The EV will be charged to the rated capacity of battery using the regular charging mode. The regular charging price is the TOU price ρ t in the electricity market. We denote  E c h r e g u l a r as the regular charging amount, we have
C r e g u l a r = E c h r e g u l a r ρ t .

3.3. Objective Function and Constraints

In summary, the goal of charging navigation scheduling is to minimize the synthetic cost C. The objective function is formulated as
min C = φ T d r i v e + T w a i t + T c h + C r a p i d + C r e g u l a r ,
where φ is the weight coefficient, which is adjusted according to users’ requests. For example, a higher φ means that the driver is more concerned about the time consumption.
The constraints for the objective function are
E c a S O C 0 e c D p a t h 1 + E c a m i n ,
E c a S O C 0 - e c D p a t h 1 + E c h r a p i d e c D p a t h 2 + E c a m i n ,
E c a S O C 0 + E c h r a p i d + E c h r e g u l a r - e c ( D p a t h 1 + D p a t h 2 ) = E c a ,
0 < E c h r e g u l a r < E c a ,
0 < E c h r a p i d < E c a ,
where E c a is the rated battery capacity,   E c a m i n is the minimum storage of battery capacity,   S O C 0 is the state of charge at origin,   e c is the energy consumption per kilometer. D p a t h 1 is the driving distance from origin to the selected RCS and D p a t h 2 is the driving distance from the selected RCS to destination. In  detail, constraint (15) means that the remaining battery energy of EVs at origin should be greater than the energy consumption from origin to the selected RCS. Constraint (16) means that the battery energy after rapid charging at RCS should be greater than the energy requirement from the selected RCS to destination. We assume that the EV will be charged to the rated capacity E c a using the regular charging mode after arriving at the destination, the battery capacity should satisfy the Equation (17). The regular charging amount and rapid charging amount should satisfy constraint (18), (19).

3.4. Solution

The optimization problem (14) is a typical mixed integer nonlinear programming (MINP) problem, it is hard to solve directly. The Dijkstra algorithm is a common tool to solve the shortest path problem [25]. According to Dijkstra algorithm, the traffic network can be modeled with a weighted directed graph. The weighted lines of the graph represent the road segment and the nodes represent the intersection of road network. Normally, the attribute of weight value can be either the distance of road segment or the average time to drive through the road segment. In this paper, we use the synthetic cost of traveling the road segment as the weight value. We can rewrite the objective function (14) as  the following formulation:
W e i g h t = φ T i m e + E x p e n s e .
T i m e represent the time traveling the road segment, E x p e n s e represent the expense of electricity consumption through road segment. φ is the weight coefficient, which is also used in the objective function (14). According to the expression of objective function, the W e i g h t is expressed as
W i j = φ T i j + ρ t E i j ,
where W i j is the weight value of road segment between location i and j, E i j is the electricity consumption through road segment between location i and j. According to the weight value of each road segment, we can use the Dijkstra algorithm to plan the optimal driving path. By using the Optimal Path Planning Algorithm illustrated in Algorithm 1, we can obtain the optimal driving path and the selected RCS for EV in each slot. According to the proposed charging navigation strategy, we can obtain the solution procedure of optimal rapid-charging navigation. The solution procedure is illustrated in Figure 5. After  the real-time data is updated, the Optimal Path Planning Algorithm is employed to search for optimal driving path and the RCS for EV. During the driving process of charging navigation, the  optimization of path planning will be repeated at the beginning of each time slot. The charging navigation path is also updated through optimization until destination has been reached.
Algorithm 1Optimal Path Planning Algorithm at slot k.
Require:
  • The traffic network topology information.
  • The parameters listed in Table 2.
  • The real-time data δ j , k , η j , k , P j , k , ρ ¯ j , k
  • The start point s p and the end point e p .
Ensure:
1:
for each j Φ do
2:
 Simulate driving path from s p to RCS j and the path from RCS j to e p based on Dijkstra algorithm.
3:
if The driving path satisfy the constraints  (15) and (16). then
4:
  Calculate the total cost
C j = φ T j , d r i v e + T j , w a i t + T j , c h + C j , r a p i d + C r e g u l a r ,
by solving the optimization model proposed in Section 2.
5:
else
6:
   C j = i n f .
7:
end if
8:
end for
9:
Select the driving path and RCS with the minimum total cost C = min { C j j Φ } .

4. Simulation Results

We consider a 25 × 25 km region of a city-center road network, which is similar to Guangzhou Higher Education Mega Center in Guangzhou, Guangdong Province, China. The topological graph of the transportation network is shown in Figure 6. The number of RCSs is 4. The RCSs (labeled with red circle) are located at transportation nodes 17, 21, 37 and 11. Each RCS contains 8 charging poles with the maximum charging power of 120 kW. The capacity of each EV is 54.75 kWh, and the energy consumption is 0.147 kWh/km(these data are based on the GACNE Trumpchi GE530 [26]). We assume the initial SoC of each EV is 20%. The parameters of studied EVs are listed in Table 2. The TOU charging prices in electricity market are listed in Table 3 [27]. We set the profit coefficient λ j and additional charging charge parameter ρ of each RCS as listed in Table 4. The conventional load curve over one day is shown in Figure 7. We set that the permissible maximum load of this area is 25 MW, which means, if the actual load exceeds the maximum load, it will cause a harmful effect on the power grid. As the conventional load increases, the maximum available charging capacity of all RCSs decreases as is shown in Figure 8. The charging capacity of each RCS is also dynamically adjusted as the total available charging capacity changes.

4.1. Impact Analysis of the Charging Power Regulation Scheme

In our simulation, we test the impacts of two charging approaches: the uncoordinated EV charging approach and the charging approach using our proposed charging navigation strategy based on the charging power regulation scheme, as shown in Figure 9. We can find that the uncoordinated EV charging approach can cause an exceeded load peak over the maximum load. However, with the proposed charging approach, the charging load can be controlled according to the state of the power grid, which can effectively avoid overload. Thus, in order to reduce the influence of rapid charging on the power grid, it is necessary to design an efficient and optimal charging strategy to limit the rapid charging power, especially at the peak hours.

4.2. Impact Analysis of the Proposed Rapid Charging Price Adjustment Scheme

In Figure 10, we simulate 7 EVs that start from node 1 to node 9. We set their weight coefficients φ = 0 . 2 (Yuan/min). They start every 5 min one by one from 18:00 to 18:30 under two cases as follows.
C a s e 1 : Using the proposed rapid charging price adjustment scheme. The rapid charging price is obtained by Equation (11).
C a s e 2 : Using the conventional rapid charging price scheme. The rapid charging price is based on TOU price, i.e., ρ j , k = λ j ρ t .
From the Figure 10, we find that, in Case 1, the proposed rapid charging price adjustment scheme adjusts the charging price according to TOU price and the number of queuing vehicles. The studied EVs select different RCSs based on minimum synthetic cost. In Case 2, the EVs choose the same RCS based on the conventional rapid charging price. Obviously, the proposed rapid charging price adjustment scheme can balance the rapid charging demand of each RCS effectively. When the charging demand is large, the EVs can be more balanced distributed in each RCS, reducing their waiting time and the operation pressure of stations.

4.3. Impact Analysis of the Proposed Optimal Navigation Strategy with Different Weight Coefficient

In Figure 11 and Figure 12, the performance of the proposed optimal navigation strategy is compared with the simple shortest path strategy with different coefficients. The shortest path strategy is that the EVs choose the path with shortest distance to travel. We select one EV that starts from node 1 to node 9 during the hours between 08:00 and 22:00. Under these two different charging strategies, the total cost comparisons are shown in Figure 11. The comparisons of average traveling time and charging cost is shown in Figure 12.
In Figure 11, with different weight coefficient φ , we can find that the total cost of the proposed charging navigation strategy is lower than the simple shortest path strategy. When φ = 0 . 5 (Yuan/min), at 18:00, the total cost is reduced about 25% using the proposed charging navigation strategy. This is because at peak times, when the congestion occurs in some road segments or charging stations, the proposed charging strategy can update the driving path timely and select other RCS to minimize the overall cost with a weight coefficient.
In Figure 12, we compare the time costs and charging costs separately under different weight coefficients. When φ = 0 (Yuan/min), the objective is to minimize the charging cost. The average charging cost of the proposed charging strategy is lower than the shortest path strategy, while their average time costs are very close. This is because when φ = 0 (Yuan/min), the proposed navigation strategy only considers the charging cost. It selects the path with minimum charging cost even though the time cost is high. As the weight coefficient increases, the objective is more concerned with the time consumption and the average traveling time of proposed charging strategy is reduced a lot. When φ = 0 . 2 (Yuan/min), the average traveling time is reduced about 11 (min). When φ = 0 . 5 or φ = 1 (Yuan/min), the average traveling time is reduced about 15 (min). This is because when φ > 0 . 5 , it is difficult to further reduce the time cost under the same road conditions. As the results show, the proposed strategy can optimize charging navigation path and reduce EV users’ traveling time and charging expenses flexibly depending on different weight coefficients.

5. Conclusions

In this paper, we propose an optimal charging navigation strategy for rapid charging EVs, taking into consideration power grid operation and the real-time traffic information. With the proposed charging strategy based on the charging power regulation scheme, the proposed strategy can effectively avoid overload and mitigate the peak load in the distribution network. The proposed rapid charging price adjustment scheme can balance the rapid charging demand of each RCS, thus reducing waiting time of EV users and the operation pressure of stations. Moreover, we compare the total cost with shortest path strategy under different weight coefficients at different times. Both the time cost and the charging cost with different coefficient are analyzed. The modified Dijkstra algorithm is used to find the optimal solution. The simulation shows that the proposed strategy can effectively reduce EV users’ charging navigation cost depending on different optimization objectives.

Author Contributions

Data curation, W.M., K.L. and S.D.; Formal analysis, W.M.; Investigation, W.M. and C.Y.; Methodology, C.Y. and X.C.; Project administration, X.C.; Supervision, C.Y.

Funding

This research was funded by National Natural Science Foundation of China under Grant number 61603099, 61773126, 61727810, and 61701125, Natural Science Foundation of Guangdong under Grant number 2018A0303130080; Pearl River S&T Nova Program of Guangzhou under Grant number 201806010176.

Conflicts of Interest

The authors declare no conflict of interest.

Abbreviations

The following abbreviations are used in this manuscript:
EVElectric Vehicle
IoTInternet of Things
V2Gvehicle-to-grid
TOUtime-of-use
ITSIntelligent Transport System
RCSRapid Charging Station
DMSDistribution Management System
SoCState of Charge

References

  1. Hannan, M.; Hoque, M.; Mohamed, A.; Ayob, A. Review of energy storage systems for electric vehicle applications: Issues and challenges. Renew. Sustain. Energy Rev. 2017, 69, 771–789. [Google Scholar] [CrossRef]
  2. Zhang, K.; Mao, Y.; Leng, S.; Zeng, M.; Xu, L.; Jiang, L.; Vinel, A. Optimal energy exchange schemes in smart grid networks: A contract theoretic approach. In Proceedings of the IEEE/CIC International Conference on Communications in China (ICCC), Chengdu, China, 27–29 July 2016; pp. 1–6. [Google Scholar]
  3. Debnath, U.K.; Ahmad, I.; Habibi, D.; Saber, A.Y. Improving Battery Lifetime of Gridable Vehicles and System Reliability in the Smart Grid. IEEE Syst. J. 2015, 9, 989–999. [Google Scholar] [CrossRef]
  4. Liu, Y.; Yang, C.; Jiang, L.; Xie, S. Intelligent Edge Computing for IoT-Based Energy Management in Smart Cities. IEEE Netw. 2019, accepted. [Google Scholar]
  5. De Quevedo, P.M.; Mun̂oz-Delgado, G.; Contreras, J. Joint expansion planning of distribution networks, EV charging stations and wind power generation under uncertainty. In Proceedings of the IEEE Power Energy Society General Meeting, Chicago, IL, USA, 16–20 July 2017; pp. 1–5. [Google Scholar]
  6. Marcincin, O.; Medvec, Z.; Moldrik, P. The impact of electric vehicles on distribution network. In Proceedings of the 18th International Scientific Conference on Electric Power Engineering (EPE), Ostrava, Czech Republic, 17–19 May 2017; pp. 1–5. [Google Scholar] [CrossRef]
  7. Yang, H.; Pan, H.; Luo, F.; Qiu, J.; Deng, Y.; Lai, M.; Dong, Z.Y. Operational Planning of Electric Vehicles for Balancing Wind Power and Load Fluctuations in a Microgrid. IEEE Trans. Sustain. Energy 2017, 8, 592–604. [Google Scholar] [CrossRef]
  8. You, P.; Yang, Z.; Zhang, Y.; Low, S.H.; Sun, Y. Optimal Charging Schedule for a Battery Switching Station Serving Electric Buses. IEEE Trans. Power Syst. 2016, 31, 3473–3483. [Google Scholar] [CrossRef]
  9. Wang, Y.; Huang, Y.; Xu, J.; Barclay, N. Optimal recharging scheduling for urban electric buses: A case study in Davis. Transport. Res. Part E Logist. Transport. Rev. 2017, 100, 115–132. [Google Scholar] [CrossRef]
  10. Akhavan-Rezai, E.; Shaaban, M.F.; El-Saadany, E.F.; Zidan, A. Uncoordinated charging impacts of electric vehicles on electric distribution grids: Normal and fast charging comparison. In Proceedings of the IEEE Power and Energy Society General Meeting, San Diego, CA, USA, 22–26 July 2012; pp. 1–7. [Google Scholar]
  11. Alshareef, S.M.; Morsi, W.G. Impact of fast charging stations on the voltage flicker in the electric power distribution systems. In Proceedings of the IEEE Electrical Power and Energy Conference (EPEC), Saskatoon, SK, Canada, 22–25 October 2017; pp. 1–6. [Google Scholar]
  12. Febriwijaya, Y.H.; Purwadi, A.; Rizqiawan, A.; Heryana, N. A study on the impacts of DC Fast Charging Stations on power distribution system. In Proceedings of the International Conference on Electrical Engineering and Computer Science (ICEECS), Sanur-Bali, Indonesia, 24–25 November 2014; pp. 136–140. [Google Scholar]
  13. Wang, K.; Gu, L.; He, X.; Guo, S.; Sun, Y.; Vinel, A.; Shen, J. Distributed Energy Management for Vehicle-to-Grid Networks. IEEE Netw. 2017, 31, 22–28. [Google Scholar] [CrossRef]
  14. He, Y.; Venkatesh, B.; Guan, L. Optimal Scheduling for Charging and Discharging of Electric Vehicles. IEEE Trans. Smart Grid 2012, 3, 1095–1105. [Google Scholar] [CrossRef] [Green Version]
  15. Cao, Y.; Tang, S.; Li, C.; Zhang, P.; Tan, Y.; Zhang, Z.; Li, J. An Optimized EV Charging Model Considering TOU Price and SOC Curve. IEEE Trans. Smart Grid 2012, 3, 388–393. [Google Scholar] [CrossRef] [Green Version]
  16. Xie, S.; Zhong, W.; Xie, K.; Yu, R.; Zhang, Y. Fair Energy Scheduling for Vehicle-to-Grid Networks Using Adaptive Dynamic Programming. IEEE Trans. Neural Netw. Learn. Syst. 2016, 27, 1697–1707. [Google Scholar] [CrossRef] [PubMed]
  17. Khatiri-Doost, S.; Amirahmadi, M. Peak shaving and power losses minimization by coordination of plug-in electric vehicles charging and discharging in smart grids. In Proceedings of the IEEE International Conference on Environment and Electrical Engineering and 2017 IEEE Industrial and Commercial Power Systems Europe (EEEIC/I CPS Europe), Milan, Italy, 6–9 June 2017; pp. 1–5. [Google Scholar]
  18. Liu, C.; Zhou, M.; Wu, J.; Long, C.; Wang, Y. Electric Vehicles En-Route Charging Navigation Systems: Joint Charging and Routing Optimization. IEEE Trans Control Syst. Technol. 2017, 27, 906–914. [Google Scholar] [CrossRef]
  19. Zhu, M.; Liu, X.Y.; Kong, L.; Shen, R.; Shu, W.; Wu, M.Y. The charging-scheduling problem for electric vehicle networks. In Proceedings of the IEEE Wireless Communications and Networking Conference (WCNC), Istanbul, Turkey, 6–9 April 2014; pp. 3178–3183. [Google Scholar]
  20. Guo, Q.; Xin, S.; Sun, H.; Li, Z.; Zhang, B. Rapid-Charging Navigation of Electric Vehicles Based on Real-Time Power Systems and Traffic Data. IEEE Trans. Smart Grid 2014, 5, 1969–1979. [Google Scholar] [CrossRef]
  21. Yang, H.; Deng, Y.; Qiu, J.; Li, M.; Lai, M.; Dong, Z.Y. Electric Vehicle Route Selection and Charging Navigation Strategy Based on Crowd Sensing. IEEE Trans. Ind. Inf. 2017, 13, 2214–2226. [Google Scholar] [CrossRef]
  22. Hafez, O.; Bhattacharya, K. Integrating EV Charging Stations as Smart Loads for Demand Response Provisions in Distribution Systems. IEEE Trans. Smart Grid 2018, 9, 1096–1106. [Google Scholar] [CrossRef]
  23. Bae, S.; Kwasinski, A. Spatial and Temporal Model of Electric Vehicle Charging Demand. IEEE Trans. Smart Grid 2012, 3, 394–403. [Google Scholar] [CrossRef]
  24. Gong, Q.; Midlam-Mohler, S.; Serra, E.; Marano, V.; Rizzoni, G. PEV charging control for a parking lot based on queuing theory. In Proceedings of the American Control Conference, Washington, DC, USA, 17–19 June 2013; pp. 1124–1129. [Google Scholar]
  25. Zhang, X.; Chen, Y.; Li, T. Optimization of logistics route based on Dijkstra. In Proceedings of the 6th IEEE International Conference on Software Engineering and Service Science (ICSESS), Beijing, China, 23–25 September 2015; pp. 313–316. [Google Scholar]
  26. GACNE Trumpchi GE3 530. 2018. Available online: http://www.gacne.com.cn/vehicles/ge3530 (accessed on 21 December 2018).
  27. TOU Tariff Standard for Commercial Electricity. 2018. Available online: http://www.docin.com/p-804976213.html (accessed on 21 December 2018).
Figure 1. System model overview.
Energies 12 00962 g001
Figure 2. Structure of a slot.
Energies 12 00962 g002
Figure 3. Topology structure of road network model.
Energies 12 00962 g003
Figure 4. The rapid charging price adjustment scheme.
Energies 12 00962 g004
Figure 5. Solution procedure of optimal rapid-charging navigation.
Energies 12 00962 g005
Figure 6. Transportation network and its topological graph based on Guangzhou Higher Education Mega Center.
Energies 12 00962 g006
Figure 7. The conventional load curve.
Energies 12 00962 g007
Figure 8. The charging capacity of Rapid-Charging Stations (RCSs) at different time.
Energies 12 00962 g008
Figure 9. Comparison of load curves to demonstrate the impacts of Electric vehicle (EV) charging approaches.
Energies 12 00962 g009
Figure 10. Comparison of two rapid charging price scheme.
Energies 12 00962 g010
Figure 11. Total cost comparison of two different navigation strategies.
Energies 12 00962 g011
Figure 12. Comparison of traveling time and charging cost with different weight coefficients by two navigation strategies.
Energies 12 00962 g012
Table 1. Mathematical symbols used in this paper.
SymbolDescription
T d r i v e / T w a i t / T c h a r g e Driving/waiting/charging time
C / C r a p i d / C r e g u l a r Total cost/rapid charging cost/regular charging cost
φ Weight coefficient
T i j Traveling time between locations i and j
d i j Distance between locations i and j
v ¯ i j , k Average driving velocity between locations i and j during time slot k
( ) j , k At RCS j during time slot k
δ j , k EVs’ arrival rate (EV number per minute)
η j , k EVs’ service rate (EV number per minute)
p j , k Occupation rate per charger
P j , k Rapid charging power of each charging pole
Q j , k Charging capacity of RCS j during time slot k
n j , k Number of charging EVs
w j , k Queuing number of EVs
ρ ¯ j , k Rapid charging price
c j Total number of EV chargers at RCS j
ρ t TOU charging price in electricity market(Regular charging price)
ρ Additional charging charges
E c a / E c a m i n Rated battery capacity/minimum storage of battery capacity
ϑ r a p i d Rapid charging efficiency
P m a x Maximum charging power of charging pole
e c Battery energy consumption
E c h r a p i d / E c h r e g u l a r Rapid charging amount/regular charging amount
S O C 0 State of charge at origin
D p a t h 1 / D p a t h 2 Driving distance from origin to selected RCS/driving distance from selected RCS to destination
Table 2. Parameters in simulation.
ParameterValuesParameterValues
E c a (kWh)54.75 E c a m i n (kWh)2.5
e c (kWh/km)0.147 ϑ r a p i d 0.9
Table 3. Time-of-use (TOU) Price of charging in China’s electricity market.
PeriodsBottomFlatPeak
(00:00–06:59)
(23:00–23:59)
(07:00–09:59)
(15:00–17:59), (21:00–22:59)
(10:00–14:59)
(18:00–20:59)
ρ t (Yuan/kWh)0.38180.83951.3222
Table 4. Profit coefficient and additional charging charge.
StationsRCS1RCS2RCS3RCS4
λ j 1.41.31.251.35
ρ (Yuan/kWh)0.150.150.150.15

