Article

Floating Membrane Bioreactors with High Gas Hold-Up for Syngas-to-Biomethane Conversion

by
Konstantinos Chandolias
1,*,
Enise Pekgenc
2 and
Mohammad J. Taherzadeh
1
1
Swedish Centre for Resource Recovery (SCRR), Faculty of Textiles engineering and Business, University of Borås, Allégatan 1, 501 90 Borås, Sweden
2
Department of Environmental Engineering, Istanbul Technical University, Maslak, 34467 Sarıyer/İstanbul, Turkey
*
Author to whom correspondence should be addressed.
Energies 2019, 12(6), 1046; https://doi.org/10.3390/en12061046
Submission received: 20 February 2019 / Revised: 13 March 2019 / Accepted: 14 March 2019 / Published: 18 March 2019
(This article belongs to the Collection Bioenergy and Biofuel)

Abstract

:
The low gas-to-liquid mass transfer rate is one of the main challenges in syngas biomethanation. In this work, a new concept of the floating membrane system with high gas hold-up was introduced in order to enhance the mass transfer rate of the process. In addition, the effect of the inoculum-to-syngas ratio was investigated. The experiments were conducted at 55 °C with an anaerobic mixed culture in both batch and continuous modes. According to the results from the continuous experiments, the H2 and CO conversion rates in the floating membrane bioreactor were approximately 38% and 28% higher in comparison to the free (suspended) cell bioreactors. The doubling of the thickness of the membrane bed resulted in an increase of the conversion rates of H2 and CO by approximately 6% and 12%, respectively. The highest H2 and CO consumption rates and CH4 production rate recorded were approximately 22 mmol/(L·d), 50 mmol/(L·d), and 34.41 mmol/(L·d), respectively, obtained at the highest inoculum-to-syngas ratio of 0.2 g/mL. To conclude, the use of the floating membrane system enhanced the syngas biomethanation rates, while a thicker membrane bed resulted in even higher syngas conversion rates. Moreover, the increase of the inoculum-to-syngas ratio of up to 0.2 g/mL favored the syngas conversion.

1. Introduction

Gasification is a thermochemical process which converts biomass into a gaseous mixture, called syngas (mostly CO, H2, and CO2). This gas can be employed for the production of electricity, energy, and transport fuels. Currently, approximately 50% of the generated syngas is converted into NH3, 25% into H2, and the remaining fraction is used for the production of Fischer Tropsch fuels, methanol, and other valuable chemicals [1,2]. Syngas is also considered as a promising vector for heat and power generation [3]. Another promising application of syngas and other industrial off-gases is anaerobic fermentation and conversion into biofuels, alcohols, bioplastics, and value-added chemicals. Syngas biomethanation, in particular, is considered as a sustainable alternative to the applications mentioned above [4].
An important limitation of syngas fermentation is the low syngas conversion rate due to poor gas-to-liquid mass transfer rates. Different approaches, in order to improve the mass transfer, focus mainly on the bioreactor’s design and the syngas feed. More specifically, different bioreactor types such as stirred tank, bubble, packed bed, airlift, and trickle bed bioreactors have been studied. Packed bed and membrane bioreactors allowed higher mass transfer and cell-density than the traditional bubble column and stirred tank reactors during syngas fermentation [5]. In addition, the use of microbubble sparging reduced the power-to-energy demand [6]. Hollow fibre membranes were also employed for the syngas feed and led to high mass transfer efficiency [7]. Another effect of the hollow fibre membranes was the creation of a biofilm on the surface of the membranes for better gas-cell contact [8].
Another way to increase the gas-to-liquid mass transfer without using costly and energy-demanding methods, such as agitation, is to increase the gas hold-up. Higher gas hold-up allows for better diffusion of the gas inside the bulk medium and better contact with the cells. This can be achieved by altering the bioreactor´s design [4], such as by increasing the height and decreasing the diameter of the bioreactor or by blocking the anodic path of the rising gas bubbles inside the liquid medium.
The main novelty in this work is in the function of polymeric membranes which were employed in order to decelerate the anodic bubble-rise velocity and thus increase the gas hold-up of syngas in a floating membrane bioreactor (floating MBR). Initially, the membranes were shaped into rectangular sachets which were seeded with anaerobic cells and then heat-sealed and placed inside the medium of the floating MBR. The membrane-floating effect was caused by the biogas that was produced inside the membranes. The swollen membranes formed a packed membrane bed which floated under the surface of the liquid medium with the help of a plastic net. In other words, the floating MBR system is actually a reverse membrane bioreactor (reverse MBR) [9] in which the membranes form a packed floating bed inside the medium of the reactor.
Another factor that was studied in this work and can affect the syngas conversion rate is the inoculum-to-syngas ratio (ISR). Although the effect of ISR on the methane potential of organic waste has been investigated in other studies [10,11], there is no previous study on the effect of the ISR in syngas biomethanation. This parameter could be essential for the improvement of the process as a low ratio could lead to toxic syngas concentrations for the cells, while a high ratio could cause cell-starvation. For this purpose, several ISRs were tested in both batch and continuous experiments.
The aim of this work was to investigate the effect of a MBR with a floating membrane bed on the syngas conversion rate and the effect of increasing ISR during syngas biomethanation. According to the authors’ best knowledge, there are no similar studies in the literature.

2. Materials and Methods

2.1. Inoculum, Syngas, and Liquid Medium

The inoculum was a mixed culture collected from a local thermophilic 3000 m3 anaerobic digester operating on organic fraction of food solid waste (Borås Energy and Environment AB, Borås, Sweden). Prior to the experiment, the inoculum was incubated for four days at 55 °C in order to consume all the nutrients. The pH of the inoculum was 8.0 and the total solid (% TS) and volatile solid (% VS) content was 15.01 ± 0.17% and 65.11 ± 0.44%, respectively.
The gaseous substrate was syngas, containing 20% H2, 55% CO, and 10% CO2, and was provided by AGA gas AB (Gothenburg, Sweden). The gas cylinder, containing the syngas, was pressurized with nitrogen gas at 1500 psi.
The liquid medium consisted of basal medium (micronutrients and macronutrients) and acetic acid. The basal medium recipe was obtained from the literature [12]. The macronutrients concentration in the liquid medium was 280 mg NH4Cl/L, 330 mg K2HPO4·3H2O/L, 100 mg MgSO4·7H2O/L, and 10 mg CaCl2·2H2O/L. In addition, 2 mL of trace elements solution was added per 1 L of liquid medium. The composition of the trace elements solution was 2000 mg FeCl2·4H2O/L, 50 mg H3BO3/L, 50 mg ZnCl2/L, 500 mg MnCl2·4H2O/L, 38 mg CuCl2·2H2O/L, 50 mg (NH4)6Mo7O24·4H2O/L, 2000 mg CoCl2·6H2O/L, 142 mg NiCl2·6H2O/L, and 164 mg Na2SeO3·5H2O/L.

2.2. Bioreactor Characteristics, Seeding, and Start Up

The excess water of the inoculum was removed by centrifugation at 9000× g for 3 min (Hereaus Megafuge 8, Thermo Scientific, Bremen, Germany) prior to seeding. Both batch and continuous experiments were conducted. The batch bioreactors were serum glass bottles with a rubber sealed cap and a total volume of 118 mL (Bioprocess control AB, Lund, Sweden). Each bioreactor was loaded with 40 mL of liquid medium and different amounts of inoculum in order to investigate the effect of different ISRs of 0.01, 0.04, 0.07, and 0.1 g/mL. After seeding, the bioreactors were placed inside a shaking water bath at 100 rpm, at an inclination of approximately 45°, and a temperature of 55 °C.
The bioreactors that were operated in the continuous mode were glass bubble column vessels with rubber sealing caps and a total volume of 2.2 L. These bioreactors were placed inside a stationary water bath at 55 °C. Each bubble column reactor contained 1.7 L of liquid medium and was seeded with 45 g of the pelleted inoculum. The continuous experiments were conducted in order to compare the floating MBR with other types of free cell bioreactors and the effect of thicker membrane bed and higher ISR. More specifically, the bioreactor designs that were used were a floating MBR; a bioreactor with both floating membrane bed and free cells (floating MBR/FCBR); a bioreactor with free cells, filled with packing material (PBR); and a free cell bioreactor (FCBR). The FCBR had an ISR of 0.1 g/mL and was operated in parallel with another free cell bioreactor (FCBR.2), which was loaded with 90 g inoculum (ISR = 0.2 g/mL). The Floating MBR contained 15 membranes filled with 3 g of inoculum each. In the floating MBR/FCBR, a part of the inoculum (24 g) was encased inside eight membranes and another part (26 g) was suspended in the liquid medium of the reactor. The PBR and FCBR contained free cells with the difference that the PBR was filled with 1.5 L of packed material, designed for cell-attach growth, with a diameter of 15 mm, made from PVC (HR 15–7, Rauschert, Hannover, Germany). Finally, another bioreactor, the floating MBR.2, was loaded with 30 membrane sachets (1.5 g inoculum/membrane), forming a floating membrane bed with a thickness of approximately 6 cm, while the thickness of the membrane bed in the floating MBR was approximately 3 cm.
The membranes were hydrophilic polyvinylidene difluoride (PVDF) flat sheets (Merck Millipore Ltd., Cork, Ireland) with a pore size and thickness of 0.1 µm and 125 µm, respectively, while the method of cell-encasement was described in a previous work [13].

2.3. Gas and Liquid Feeding

Figure 1 shows a scheme of the gas and liquid feeding process. Syngas was fed in the bioreactors with a flow meter control (11–110 mL/min, Swagelok, Sollentuna, Sweden) at a flow rate of 15 mL/min. The gaseous substrate was introduced to the bottom of the bioreactors with a sparger (Air diffuser 2 × 3 cm, Zalux, Zaragoza, Spain). There was no gas-recirculation and the conversion rate of syngas was reported after one pass through the medium broth. The gas composition was analysed at the inlet and outlet of the reactors, while the gas flow rate at the outlet was recorded by a data acquisition system (AMPTS II, Bioprocess control, Sweden AB, Sweden). The feeding of the liquid medium took place with a plastic 50 mL syringe though a tube that was immersed inside the medium. Regular controls with gas and liquid sampling ensured the stable operation of the bioreactors.

2.4. Analytical Methods

The gas components were detected with Gas Chromatography. The CO levels were obtained by a Gas Chromatograph (Perkin-Elmer 480, Norwalk, CT, USA) with a packed column (CarboxenTM 1000, SUPELCO, 6′ × 1.8” OD, 60/80 Mesh, Shelton, CT, USA) and a thermal conductivity detector (Perkin-Elmer) with an injection temperature of 200 °C. The H2, CO2, and CH4 levels were analysed with a Gas Chromatograph (Perkin-Elmer 590, Norwalk, CT, USA), equipped with a packed column (CarboxenTM 1000, SUPELCO, 6′ × 1.8” OD, 60/80 Mesh, Shelton, CT, USA), using a thermal conductivity detector (Perkin-Elmer, Norwalk, CT, USA) with an injection temperature of 200 °C. The gas sampling was performed with a 0.25 mL gas-tight syringe (VICI, Precision Sampling Inc., Baton Rouge, LA, USA) and the carrier gas in the chromatographs was N2 with a flow rate of 30 mL/min at 75 °C.
For the analysis of the liquid samples, a High-Performance Liquid Chromatography (Waters 2695, Waters Corporation, Milford, CT, USA) with a hydrogen-based column (Aminex HPX87-H, BioRad Laboratories, München, Germany), equipped with a refractive index (RI) detector (Waters 2410, Waters Corporation, Milford, CT, USA), was operated at 60 °C and 0.6 mL/min (5 mM H2SO4 eluent).
The gas analysis of the continuous experiment took place every five days starting from the 50th day and ending on the 90th day of fermentation, while the batch experiment was run in triplicates for a period of seven days and gas samples were analysed every 24 h. The results are presented as average value ± standard deviation.

3. Results and Discussion

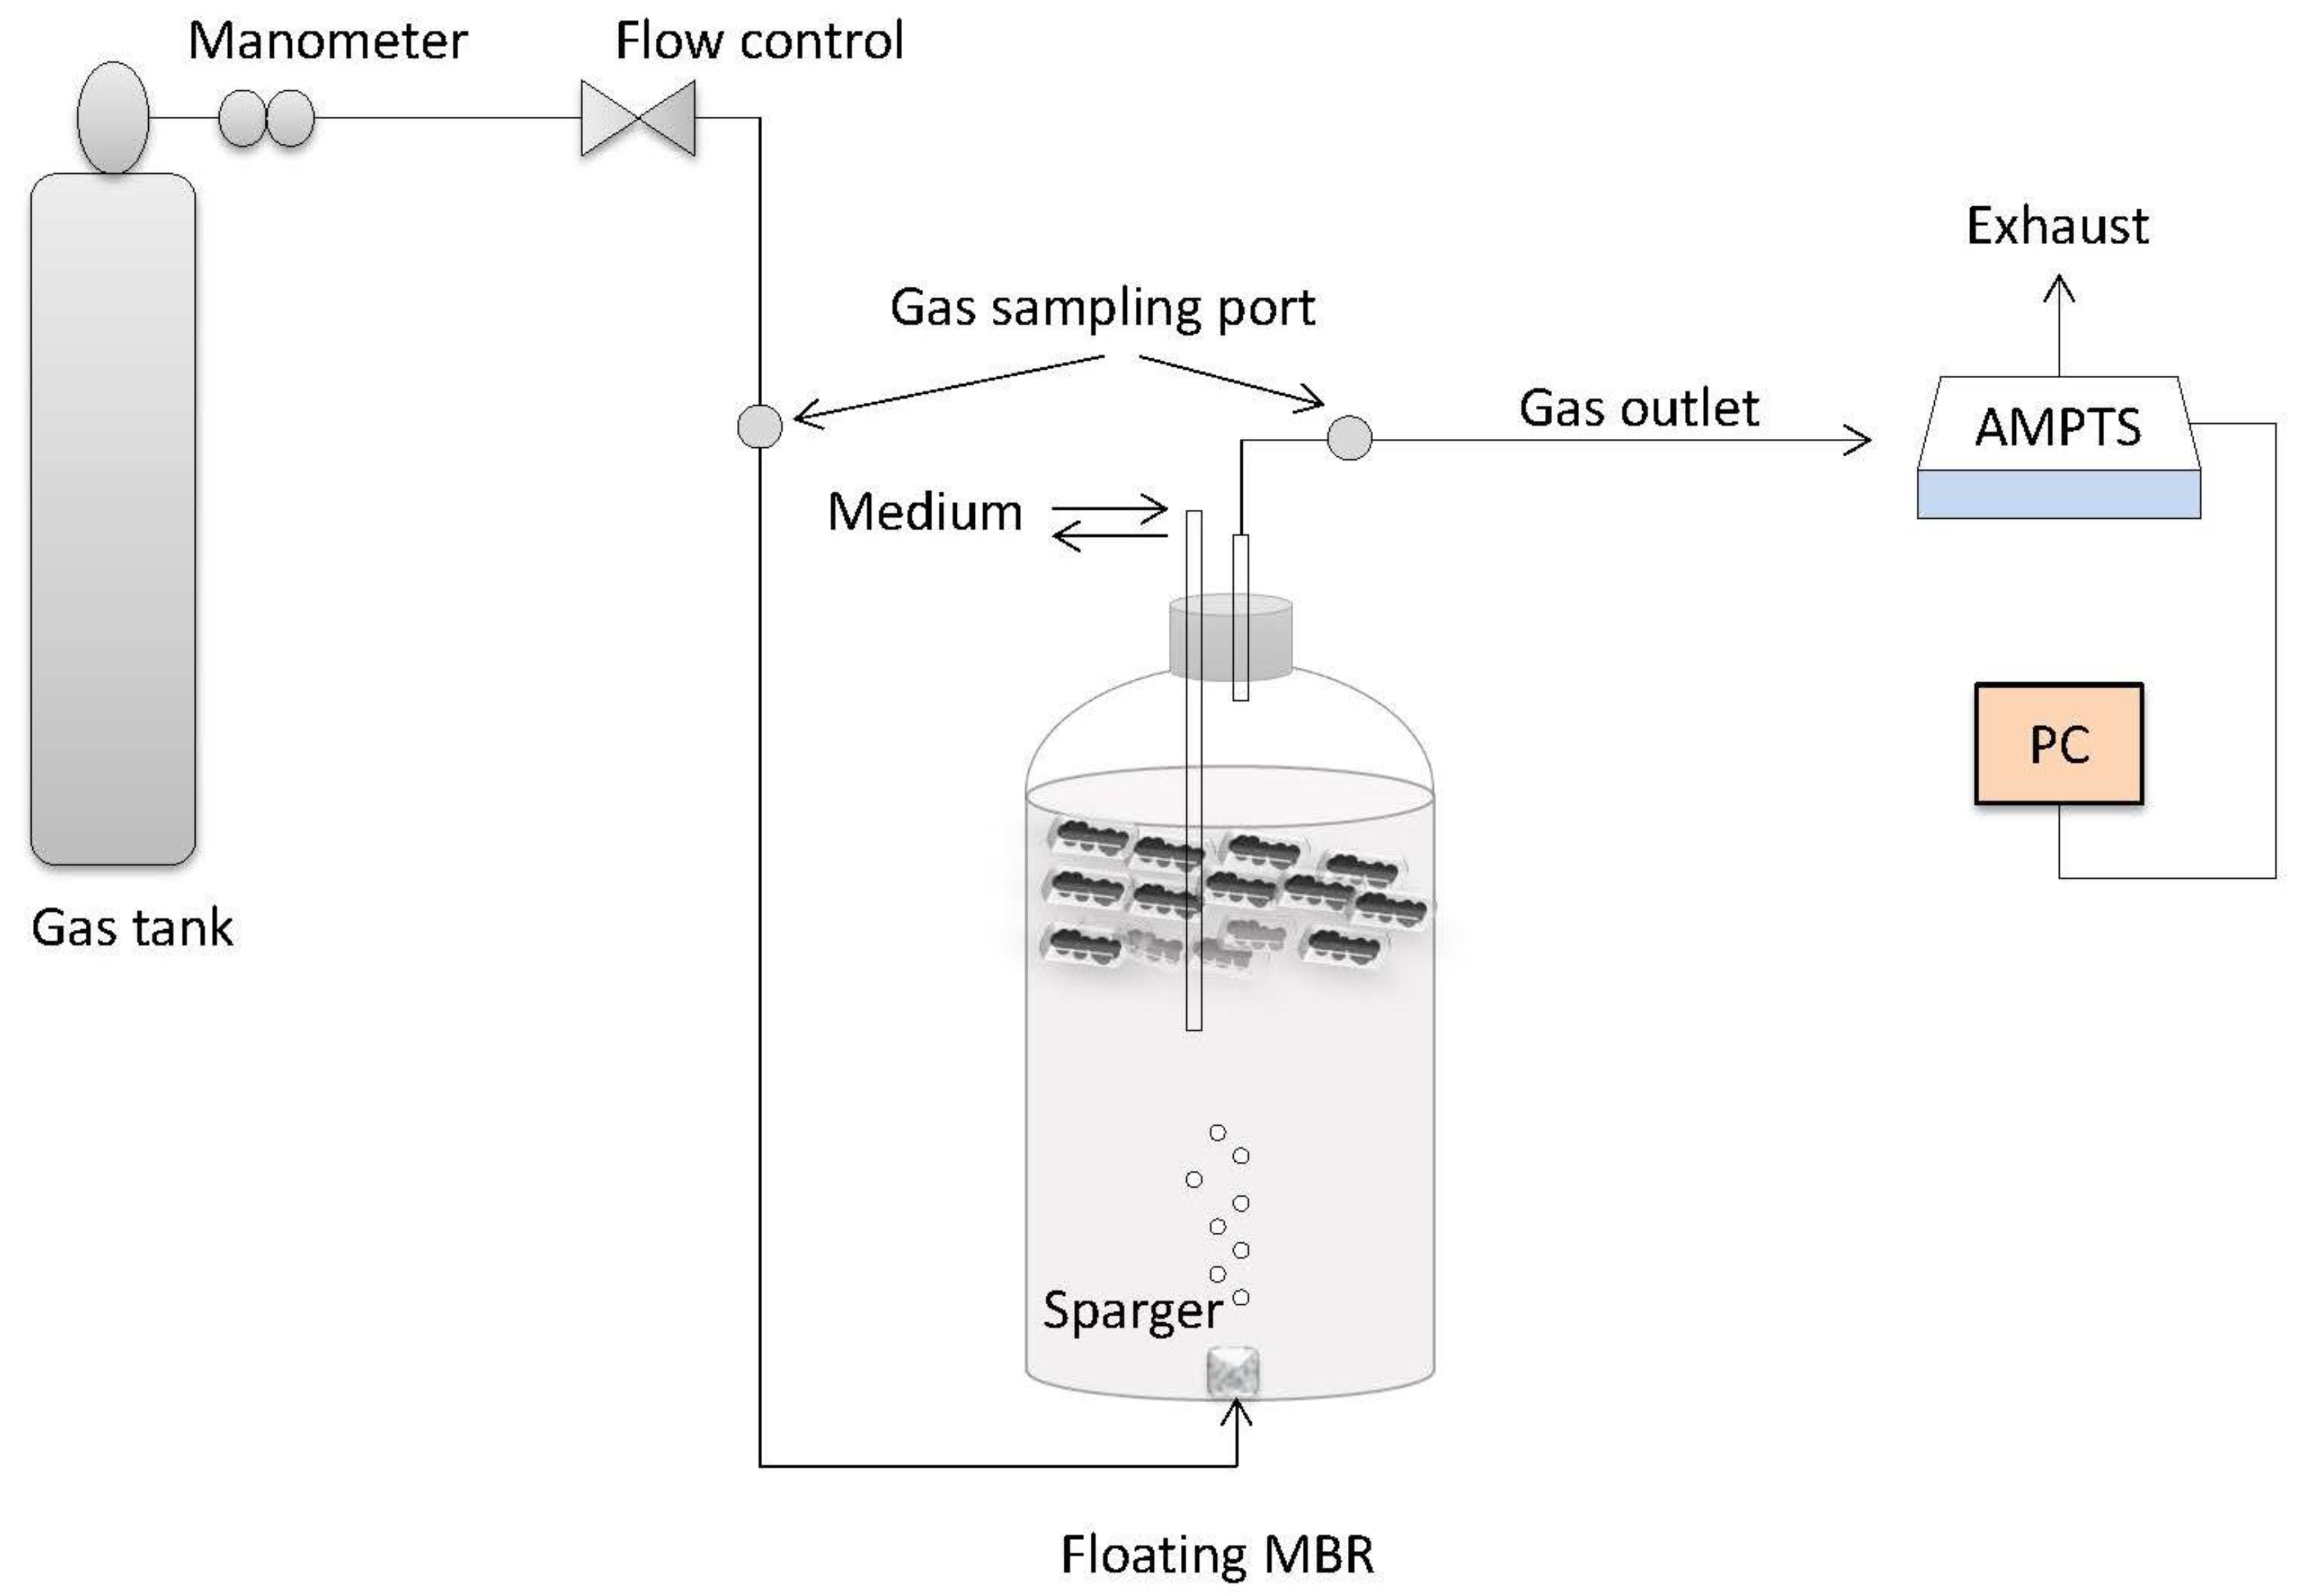
A main challenge during syngas fermentation is the low gas-to-liquid mass transfer, which can be improved by increasing the gas hold-up inside the liquid medium of bioreactors. For this purpose, anaerobic cells were encased in membrane sachets which were then heat-sealed and immersed inside a bubble column bioreactor. During the fermentation process, syngas was introduced to the bottom of the bioreactor with a sparger and the bubble ascent of syngas components was delayed because of the membrane bed, which operated as a mechanical barrier. This delay increased the gas hold-up in the liquid phase. Consequently, the syngas components diffused in the liquid phase and through the 0.1 μm membrane pores. The total interfacial area for gas mass transfer (α) increases with higher gas hold-up and smaller bubble size. Thus, higher mass transfer rates are achieved in systems with higher gas hold-up and smaller bubble size [14]. In addition, the position of the membrane bed under the liquid surface and the gas passing through the membrane pores and into the cell-contained area favoured the gas-to-cell contact without agitation.
The membranes were hydrophilic and, therefore, accessible to dissolved syngas components and organic acids in the liquid phase. These components diffused through the membrane pores and thereafter were converted into biogas. The produced biogas built a pressure inside the membranes which increased until it reached the membrane bubble point. Then, biogas exited the inner membrane area by blowing the membrane pores dry. Consequently, the inner pressure of the membrane dropped again, and fresh liquid diffused through the membrane. The fact that the membrane sachets were continuously swollen led also to the conclusion that there was probably minimum gas exchange from the outside to the inside of the sachets. The membranes are accessible to gas when they are dry, however once they are wet, the differential pressure has to be greater than the bubble point for a gas exchange to occur. This means that the membranes worked as conductors of the diffused liquid phase and the produced gas phase. From previous studies, it was observed that the floating effect was directly stirred by the organic loading rate (OLR) of the bioreactors [15] because the biogas production rate inside the membranes had to be high in order to create the floating effect. The experiments in this work showed that a minimum OLR of approximately 1 g COD/(L·d) was required in order to initiate the membrane floating phenomenon. The undissolved syngas bubbles ascended between the membrane sachets to the surface of the liquid.
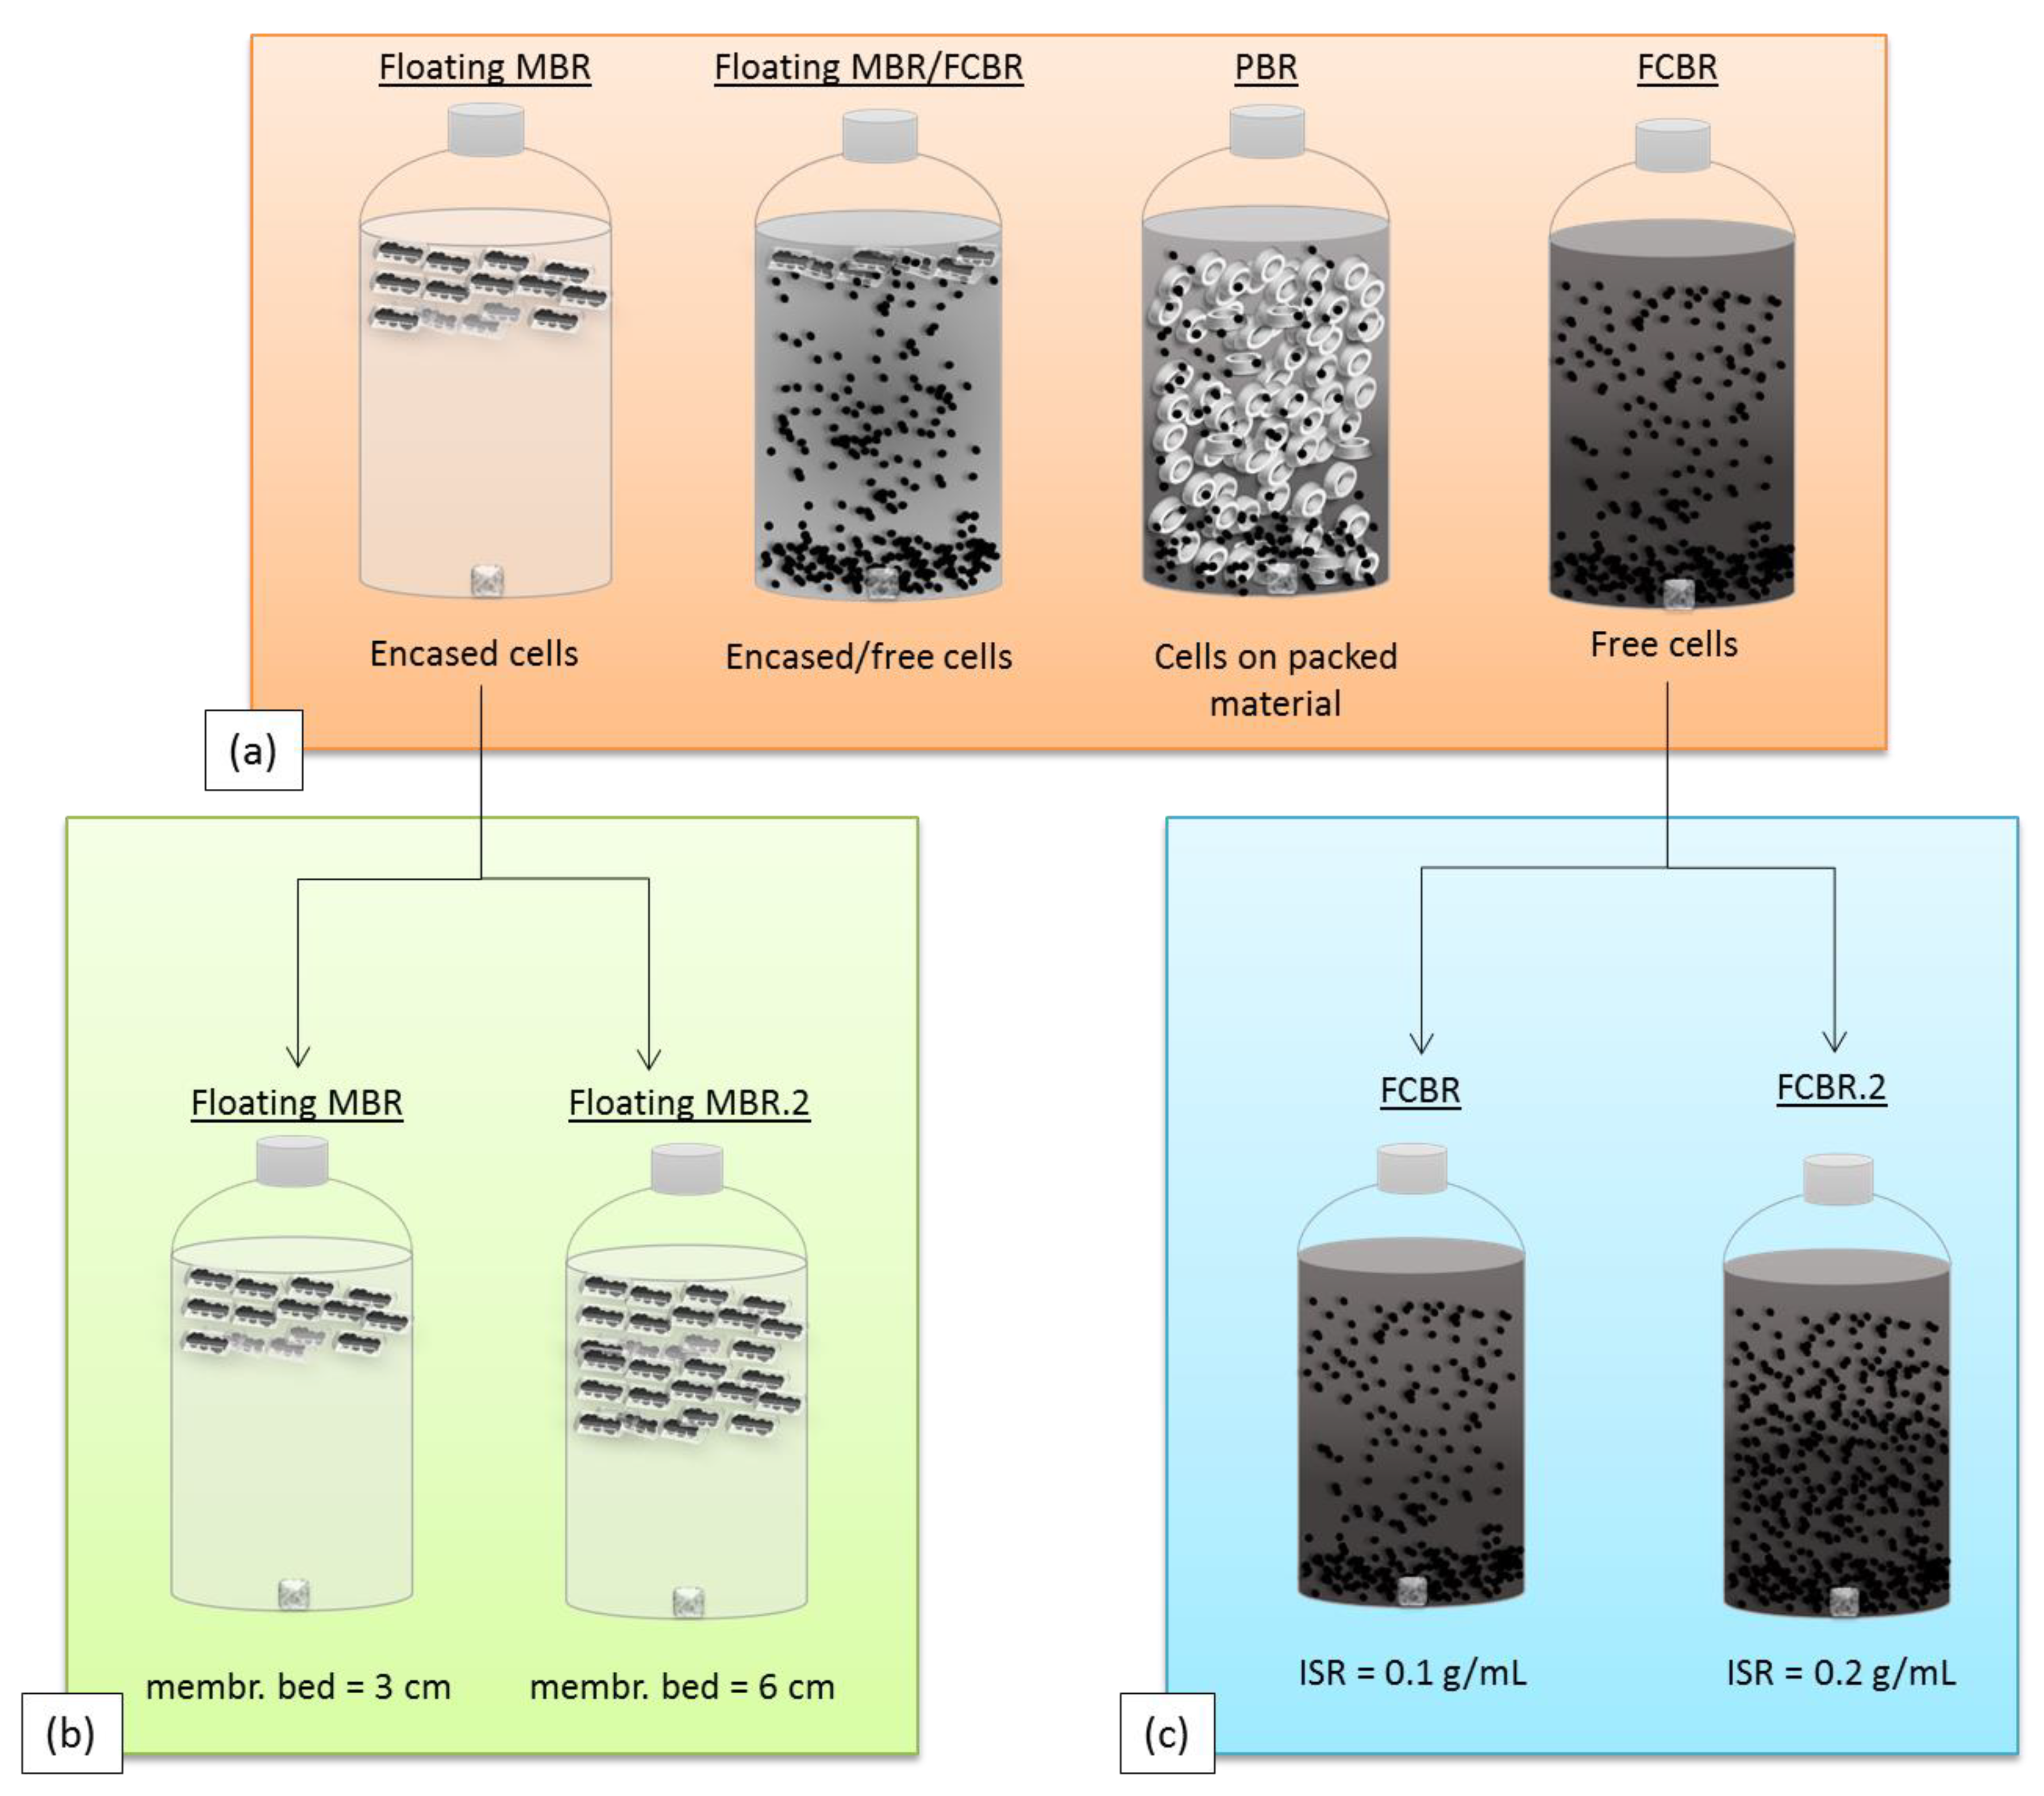
Figure 2 illustrates the different bioreactor designs that were investigated. The floating MBR was operated in parallel with a free cell bioreactor (FCBR) containing free suspended cells, a packed bioreactor (PBR) containing free cells growing on packed material, and a hybrid bioreactor (floating MBR/FCBR) containing both membrane encased cells and free cells. These bioreactors are described in more detail in the 
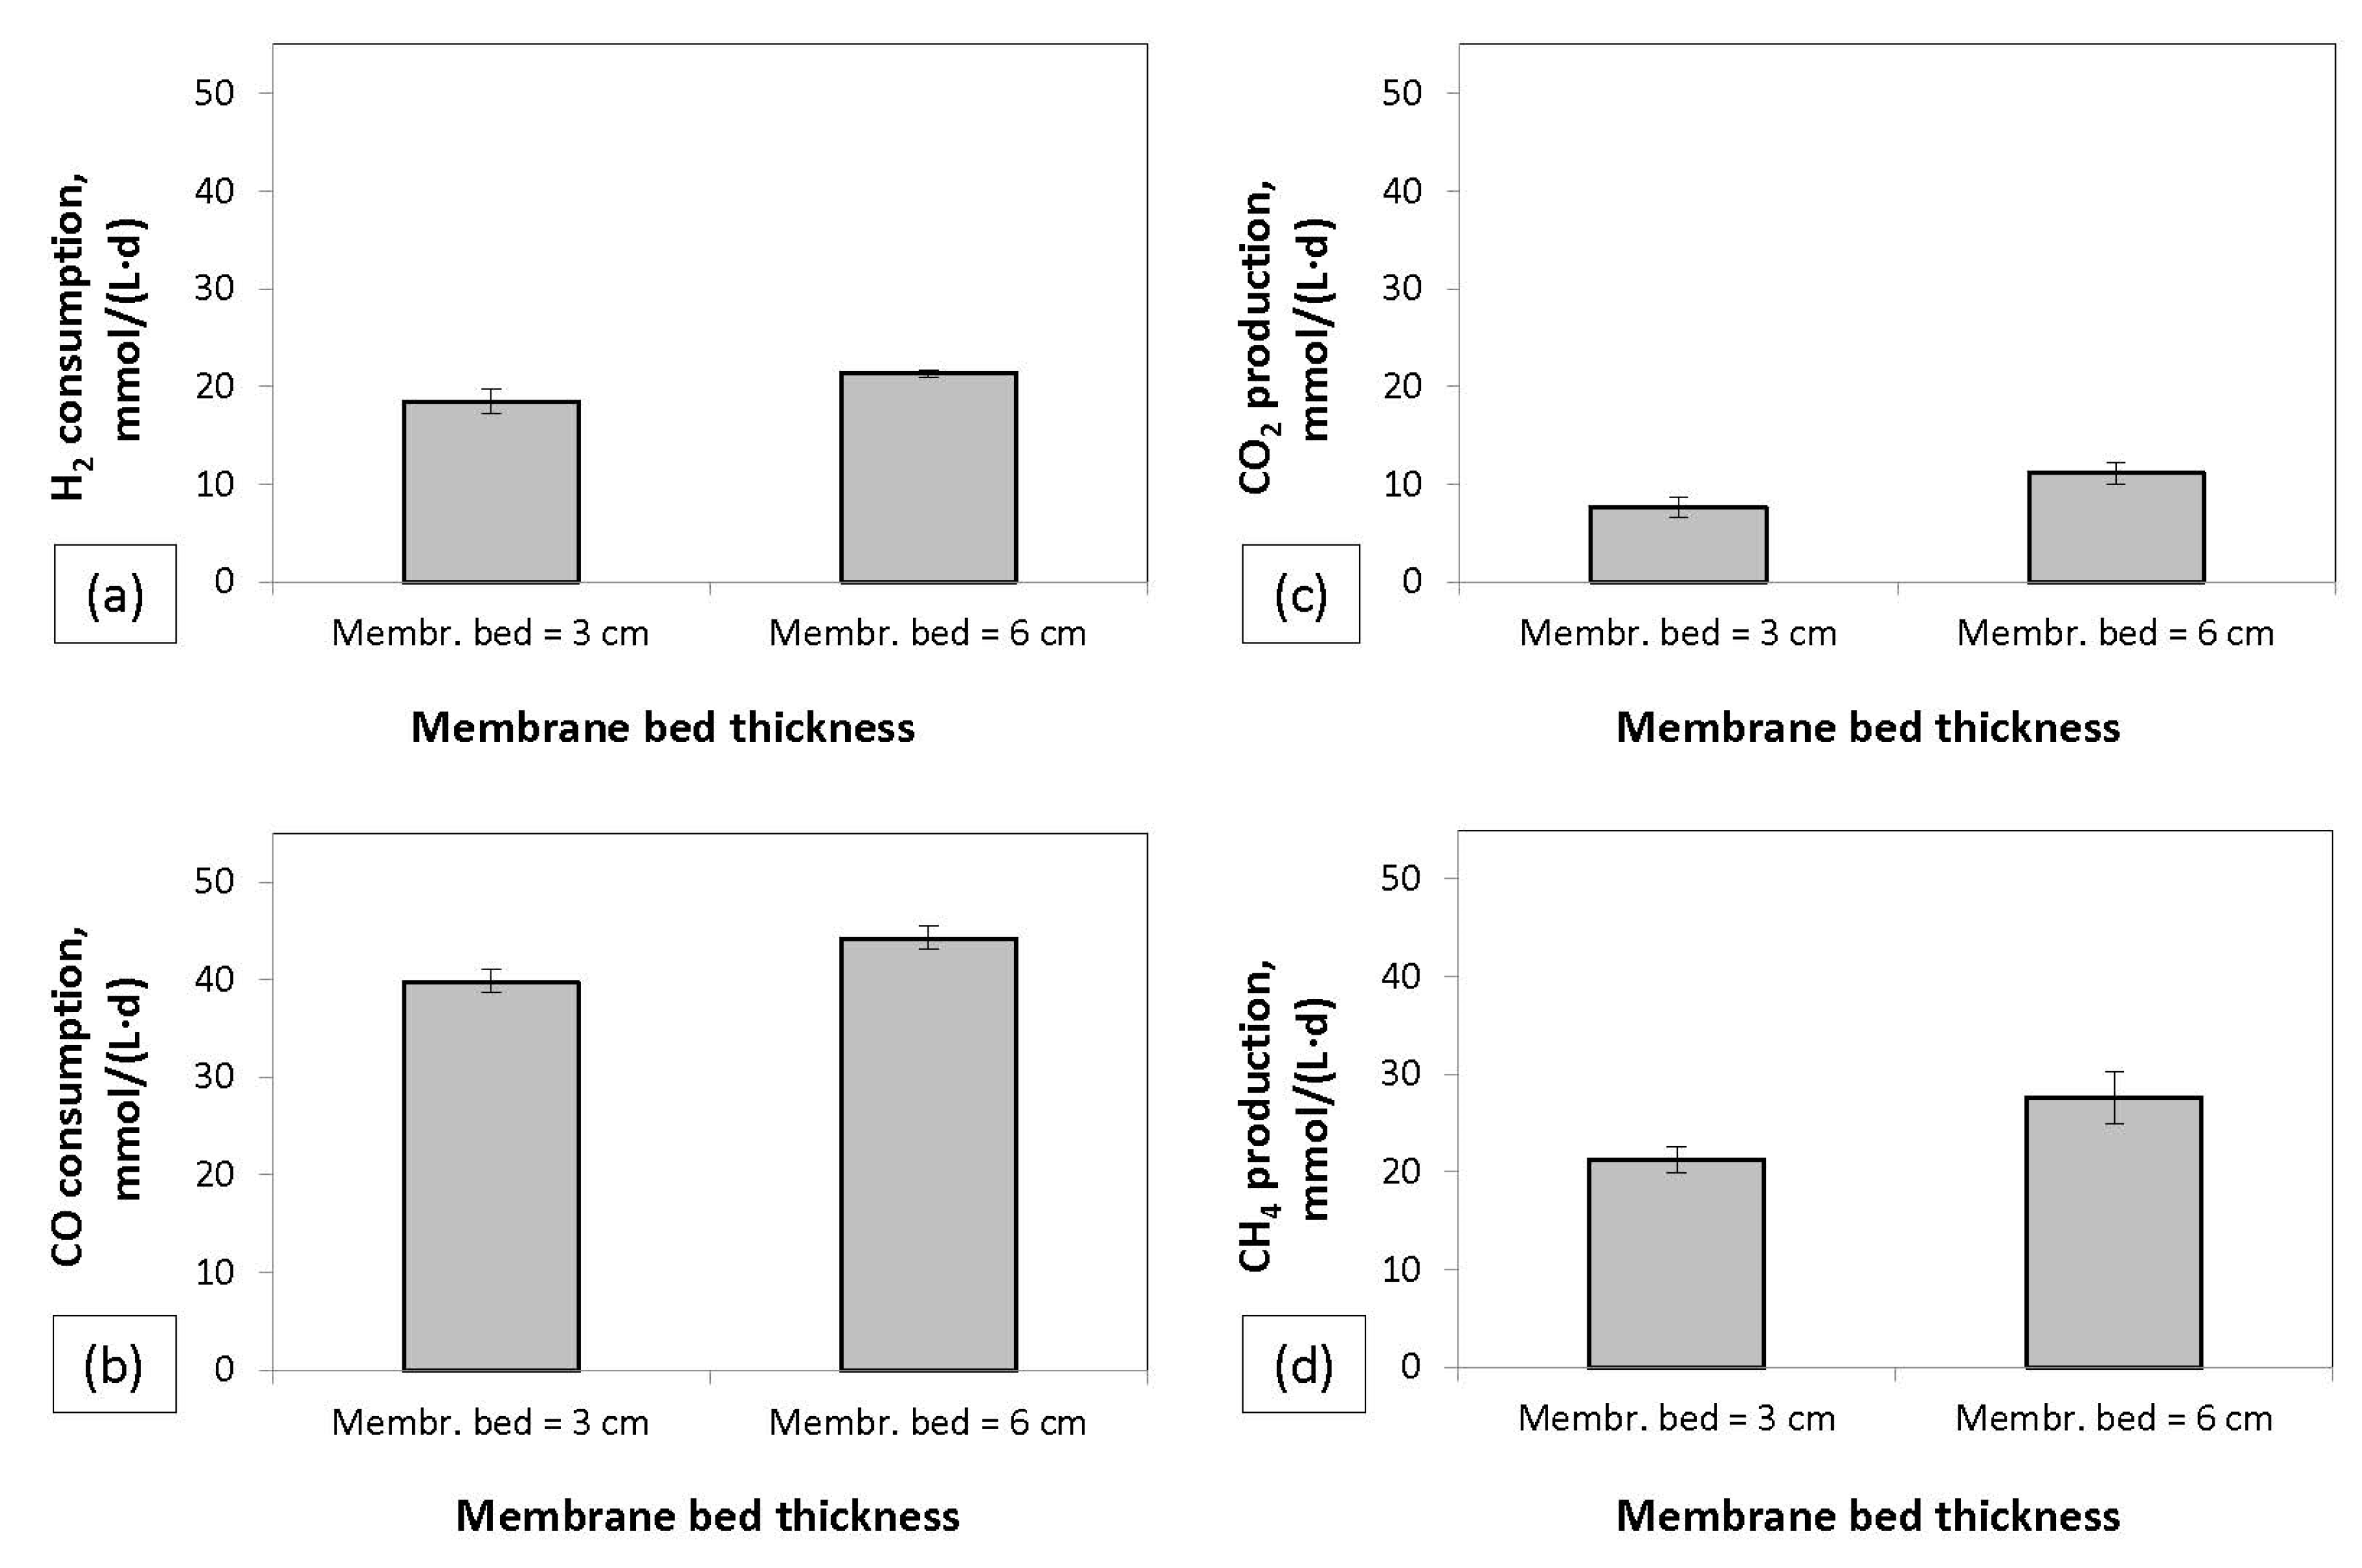
Materials and Methods section. The effect of a thicker membrane bed was also investigated as well as the effect of a higher inoculum-to-syngas ratio (ISR). The H2 and CO conversion rates and the CO2 and CH4 production rates in mmol/(L·d) were used as indicators of the reactors’ efficacy. The results showed that the use of the membrane bed resulted in higher syngas conversion rates. The increase of the thickness of the membrane bed led to higher conversion rates. In addition, higher ISRs increased the conversion rates in both batch and continuous experiments.
During the starting up period (first 30 days) of the continuous experiment, the bioreactors were fed with basal medium which contained micro- and macro-nutrients and syngas as the sole carbon and energy source. From the 31st day and until the 90th day, acetic acid was also introduced into the liquid medium with an OLR of 1.21 g COD/(L·d). The HRT was 34 d during the experiment.

3.1. Efficacy of the Membrane Floating Bed System

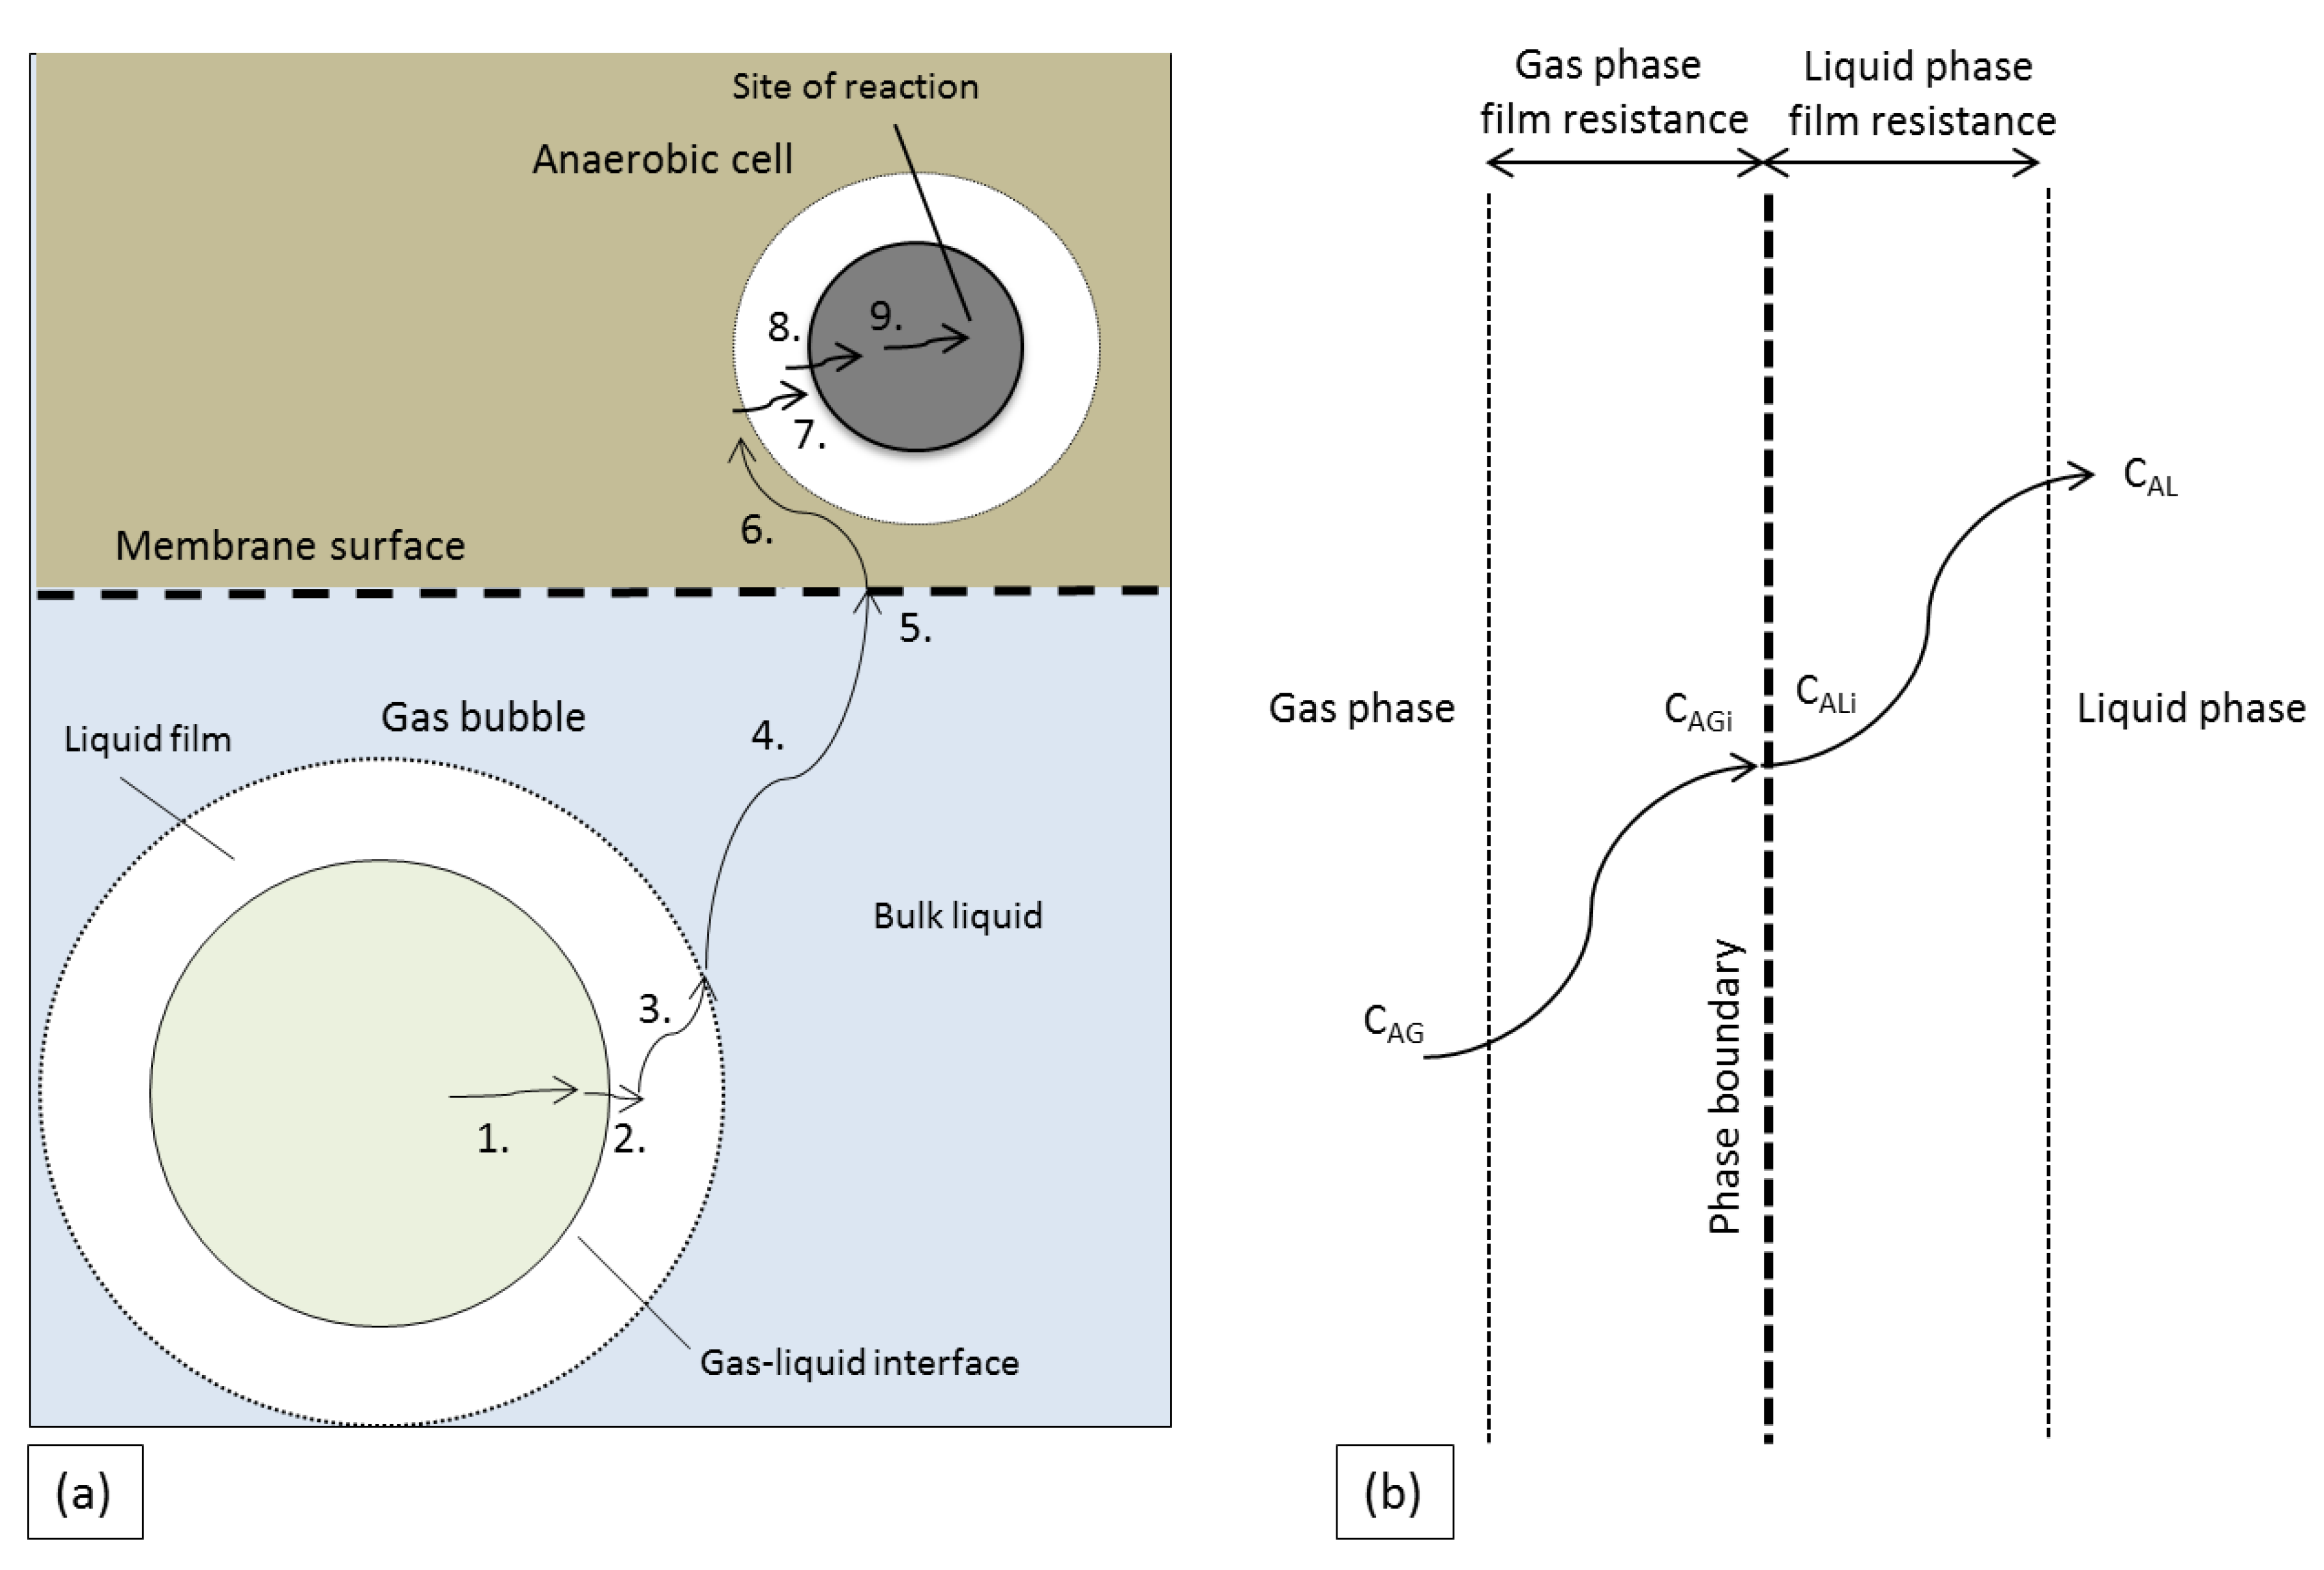
The inoculum used in this work consisted of mixed cells which take up syngas from the liquid phase. Therefore, the rate of the mass transfer and, thus, the mass transfer coefficient from the gas-to-liquid phase is of vital importance. The syngas components face several resistances during their journey from the gas phase to the cells (Figure 3a). In the case of floating MBR, there is an extra mass transfer resistance of the membrane surface, however previous studies proved that this resistance is negligible [15]. The liquid film surrounding the cells (Figure 3b) is considered to be the main resistance of the gas-to-liquid mass transfer inside the investigated bioreactors, while the rest of the resistances are considered negligible [14]. The following equations show the rate of mass transfer of component A though the gas (NAG) and the liquid (NAL) boundary in gmol/(m3·s):
NAG = kGα(CAG − CAGi),
NAL = kLα(CALi − CAL),
where kG and kL is the gas-phase and liquid-phase mass transfer coefficient, m/s, respectively, and α is the total interfacial area for mass transfer, 1/m. The concentration of A in the liquid bulk is CAL and in the liquid boundary is CAli, while the concentration of A in the gas phase is CAG and in the gas boundary is CAGi, in gmol/m3.
Equations (1) and (2) can be simplified to Equations (3) and (4) [14], respectively, where mCAL = C*AG is the gas-phase concentration of A in equilibrium with CAL and CAG/m = C*AL is the liquid-phase concentration of A in equilibrium with CAG, and m is the distribution factor.
NAG = kGα(CAG − C*AG),
NAL = kLα(C*AL − CAL),
Equations (3) and (4) are valid for systems in which the main mass transfer resistance is either the gas-phase film resistance or the liquid-phase film resistance. Thus, the overall mass transfer coefficients KGα and KLα were replaced by kGα and kLα [14]. In the case of syngas fermentation, H2 and CO are poorly soluble to the aqueous solution, which means that kGα is significantly larger than kLα and, therefore, Equation (3) is the main equation that can describe the limiting mass transfer rate in the system.
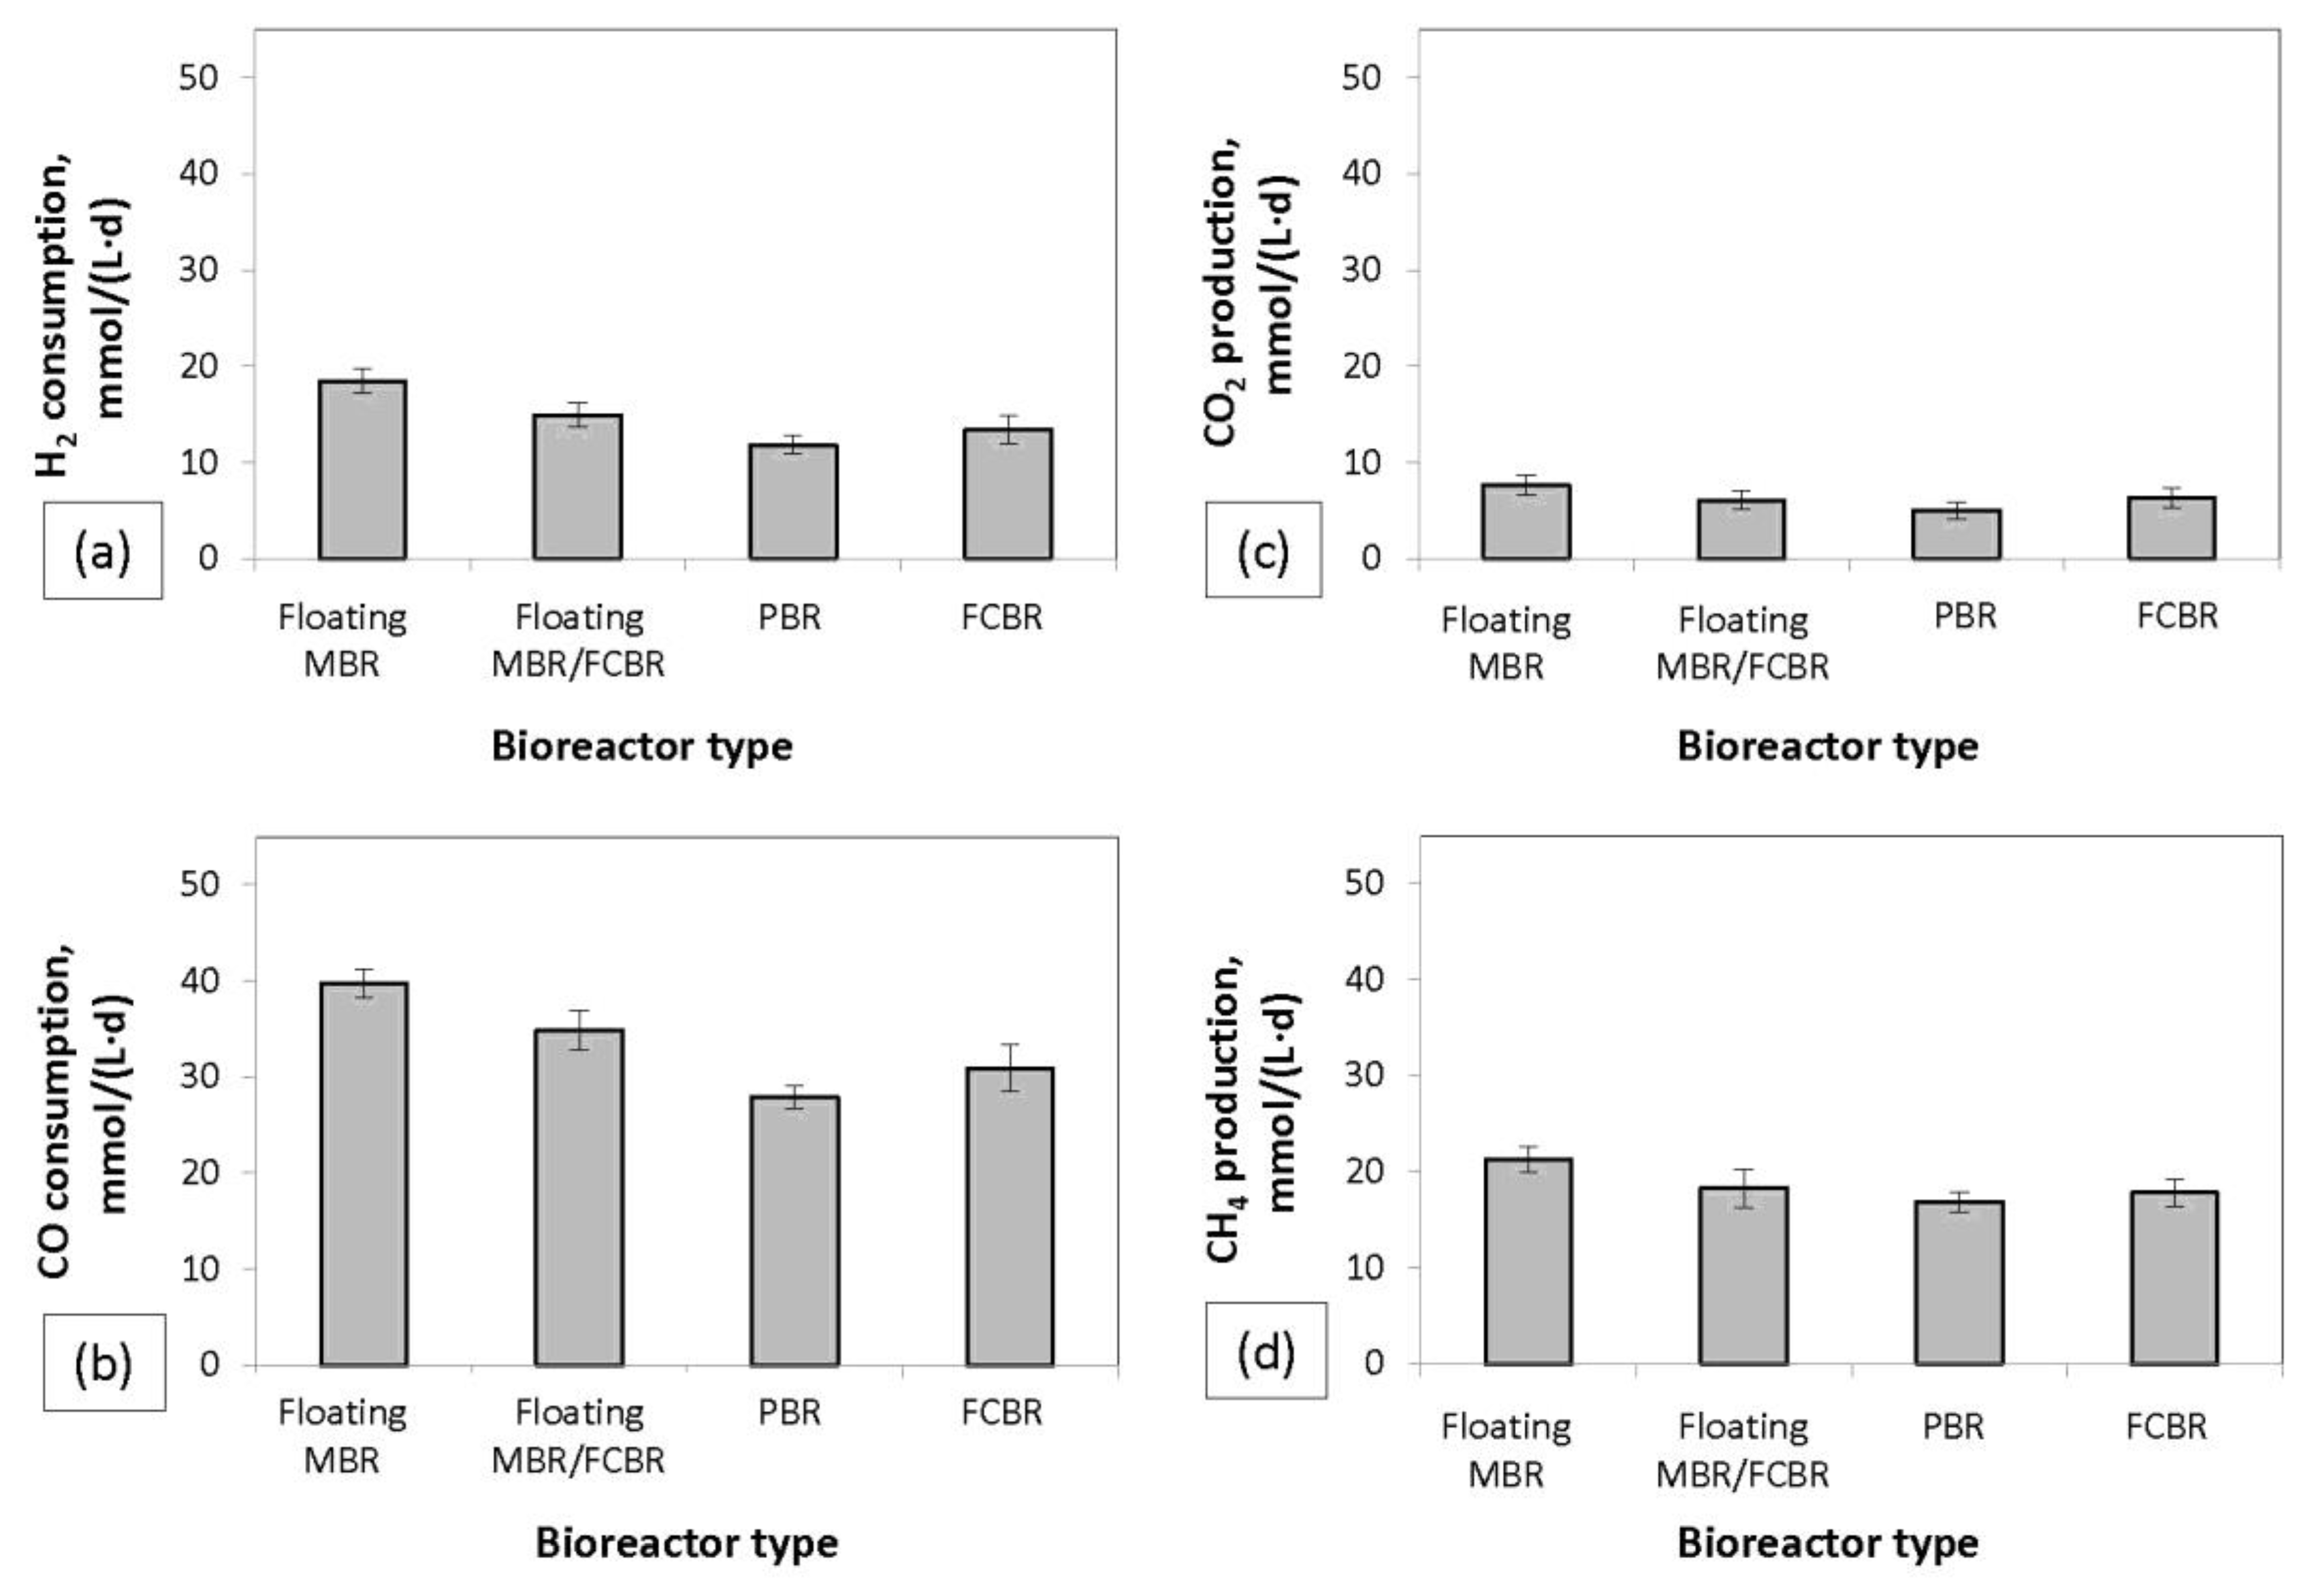
The consumption rates of H2 and CO and the production rates of CH4 and CO2 in floating MBR, floating MBR/FCBR, PBR, and FCBR are presented in Figure 4. The highest consumption rates of H2 and CO obtained were 18.47 ± 1.25 and 39.67 ± 1.45 mmol/(L·d), respectively, in floating MBR. In the same bioreactor, the highest CH4 production of 21.33 mmol CH4/(L·d) was also achieved and the highest CH4 yield of 0.36 mol CH4/mol (H2 + CO). The pH of the effluent was 8.2 ± 2.0 in all bioreactors during the experiment. In previous studies, a triculture (R. rubrum, M. barkeri, M. formicicum) converted syngas of a similar composition into CH4 in a trickle bed bioreactor with a CH4 production rate of 48–72 mmol CH4/(L·d) and yields of 0.2–0.214 mol CH4/mol (H2 + CO) [16,17]. Moreover, the same triculture converted syngas in a packed bed bioreactor with a CH4 production of 4.8–7.2 mmol/(L·d) and a yield of 0.214 mol CH4/mol (H2 + CO) [17]. Higher yields of 0.6–0.8 mol CH4/mol (H2 + CO) and a CH4 production of 73 mmol/(L·d) were obtained in a multi-orifice oscillatory baffled bioreactor where granular sludge converted syngas with a gas recirculation rate of 600 mL/min [18].
The lowest syngas biomethanation rates were observed in the PBR and the FCBR. This result contradicts with other studies, which reported that the use of packed material in the PBR significantly improved the syngas conversion rates and CH4 production rate. For instance, Burkhardt, et al. [19] reported a CH4 concentration of higher than 98% in their final biogas product, achieved in a trickle bed bioreactor filled with packing material. Trickle bed bioreactors with packed material are considered effective in syngas biomethanation because of higher mass transfer coefficients and lower cost than the continuous stirred bioreactors (CSTR) [16]. The liquid recirculation, which may be co-current or counter-current with the gas flow, is one of the main reasons for high mass transfer in the trickle bed bioreactors. However, in the present study, there was no liquid recirculation and, therefore, the lower syngas conversion rates in PBR are likely a result of inadequate substrate distribution inside the bioreactor, which is probably the reason for the lower acetic acid consumption (Table 1) in comparison to other bioreactors.
The floating MBR/FCBR system proved to be less efficient in terms of syngas conversion in comparison to the floating MBR system. The reason for this was probably the better gas-to-cell contact in floating MBR due to the fact that the suspended inoculum was mostly concentrated at the bottom of the floating MBR/FCBR. Likewise, in the FCBR and the PBR, the inoculum was mostly concentrated at the bottom of the bioreactors. In bubble column bioreactors with free cells, when syngas feed is introduced at the bottom of the bioreactor, the H2 and CO levels decrease as the gas flows up the column because of cellular consumption. This causes spatial difference of dissolved syngas inside the bubble column which can affect the cellular growth and the product profile [20]. Therefore, the aim is to establish favourable syngas concentration profiles in the liquid medium according to the desirable product [20]. However, in the floating MBR, the cells were assembled in packed formation at the upper parts of the liquid medium so that the gas bubbles stayed longer in the liquid and were dispersed though the membrane pores. This cell-placement was probably a main factor which caused better gas-to-cell contact and, therefore, faster syngas biomethanation in the floating MBR.
The floating MBR resembles the concept of a trickle bed or a packed bed bioreactor where the packed material is replaced by membranes. Trickle bed bioreactors are preferred to other bioreactor types, such as continuous stirred bioreactors, because of their enhanced gas-to-liquid mass transfer mechanisms. A mass transfer analysis on various bioreactors claimed that the mass transfer was enhanced over three times in a trickle bed bioreactor in comparison to continuously stirred tank reactor [21]. In addition, the optimum CO mass transfer coefficient of stirred tank bioreactors can be substantially improved in bubble column bioreactors because of higher mass transfer driving forces, which are a result of gas composition spatial profiles and longer gas hold-up [20].

3.2. The Effect of Membrane Bed Thickness

The floating MBR, containing a floating membrane bed, presented the highest syngas conversion efficacy in comparison to other bioreactor types in the previous section. In order to study the effect of membrane bed thickness, another bioreactor was operated in parallel with the floating MBR. This second bioreactor (floating MBR.2) consisted of a higher amount of membranes (30) that was two times the amount of membranes in the floating MBR. The floating membrane bed in floating MBR.2 was approximately 6 cm thick in comparison with the membrane bed in floating MBR which had a thickness of approximately 3 cm. The results in Figure 5 show that the reinforcement of the membrane bed increases the conversion rates of H2 and CO by approximately 6% and 11%, respectively, in floating MBR.2. This result proved that bioreactors with a thicker membrane bed had higher conversion rates, although the improvement was not proportional to the magnitude of the increase of the thickness of the membrane bed, which was approximately 100%.

3.3. Impact of Inoculum-to-Syngas Ratio (ISR)

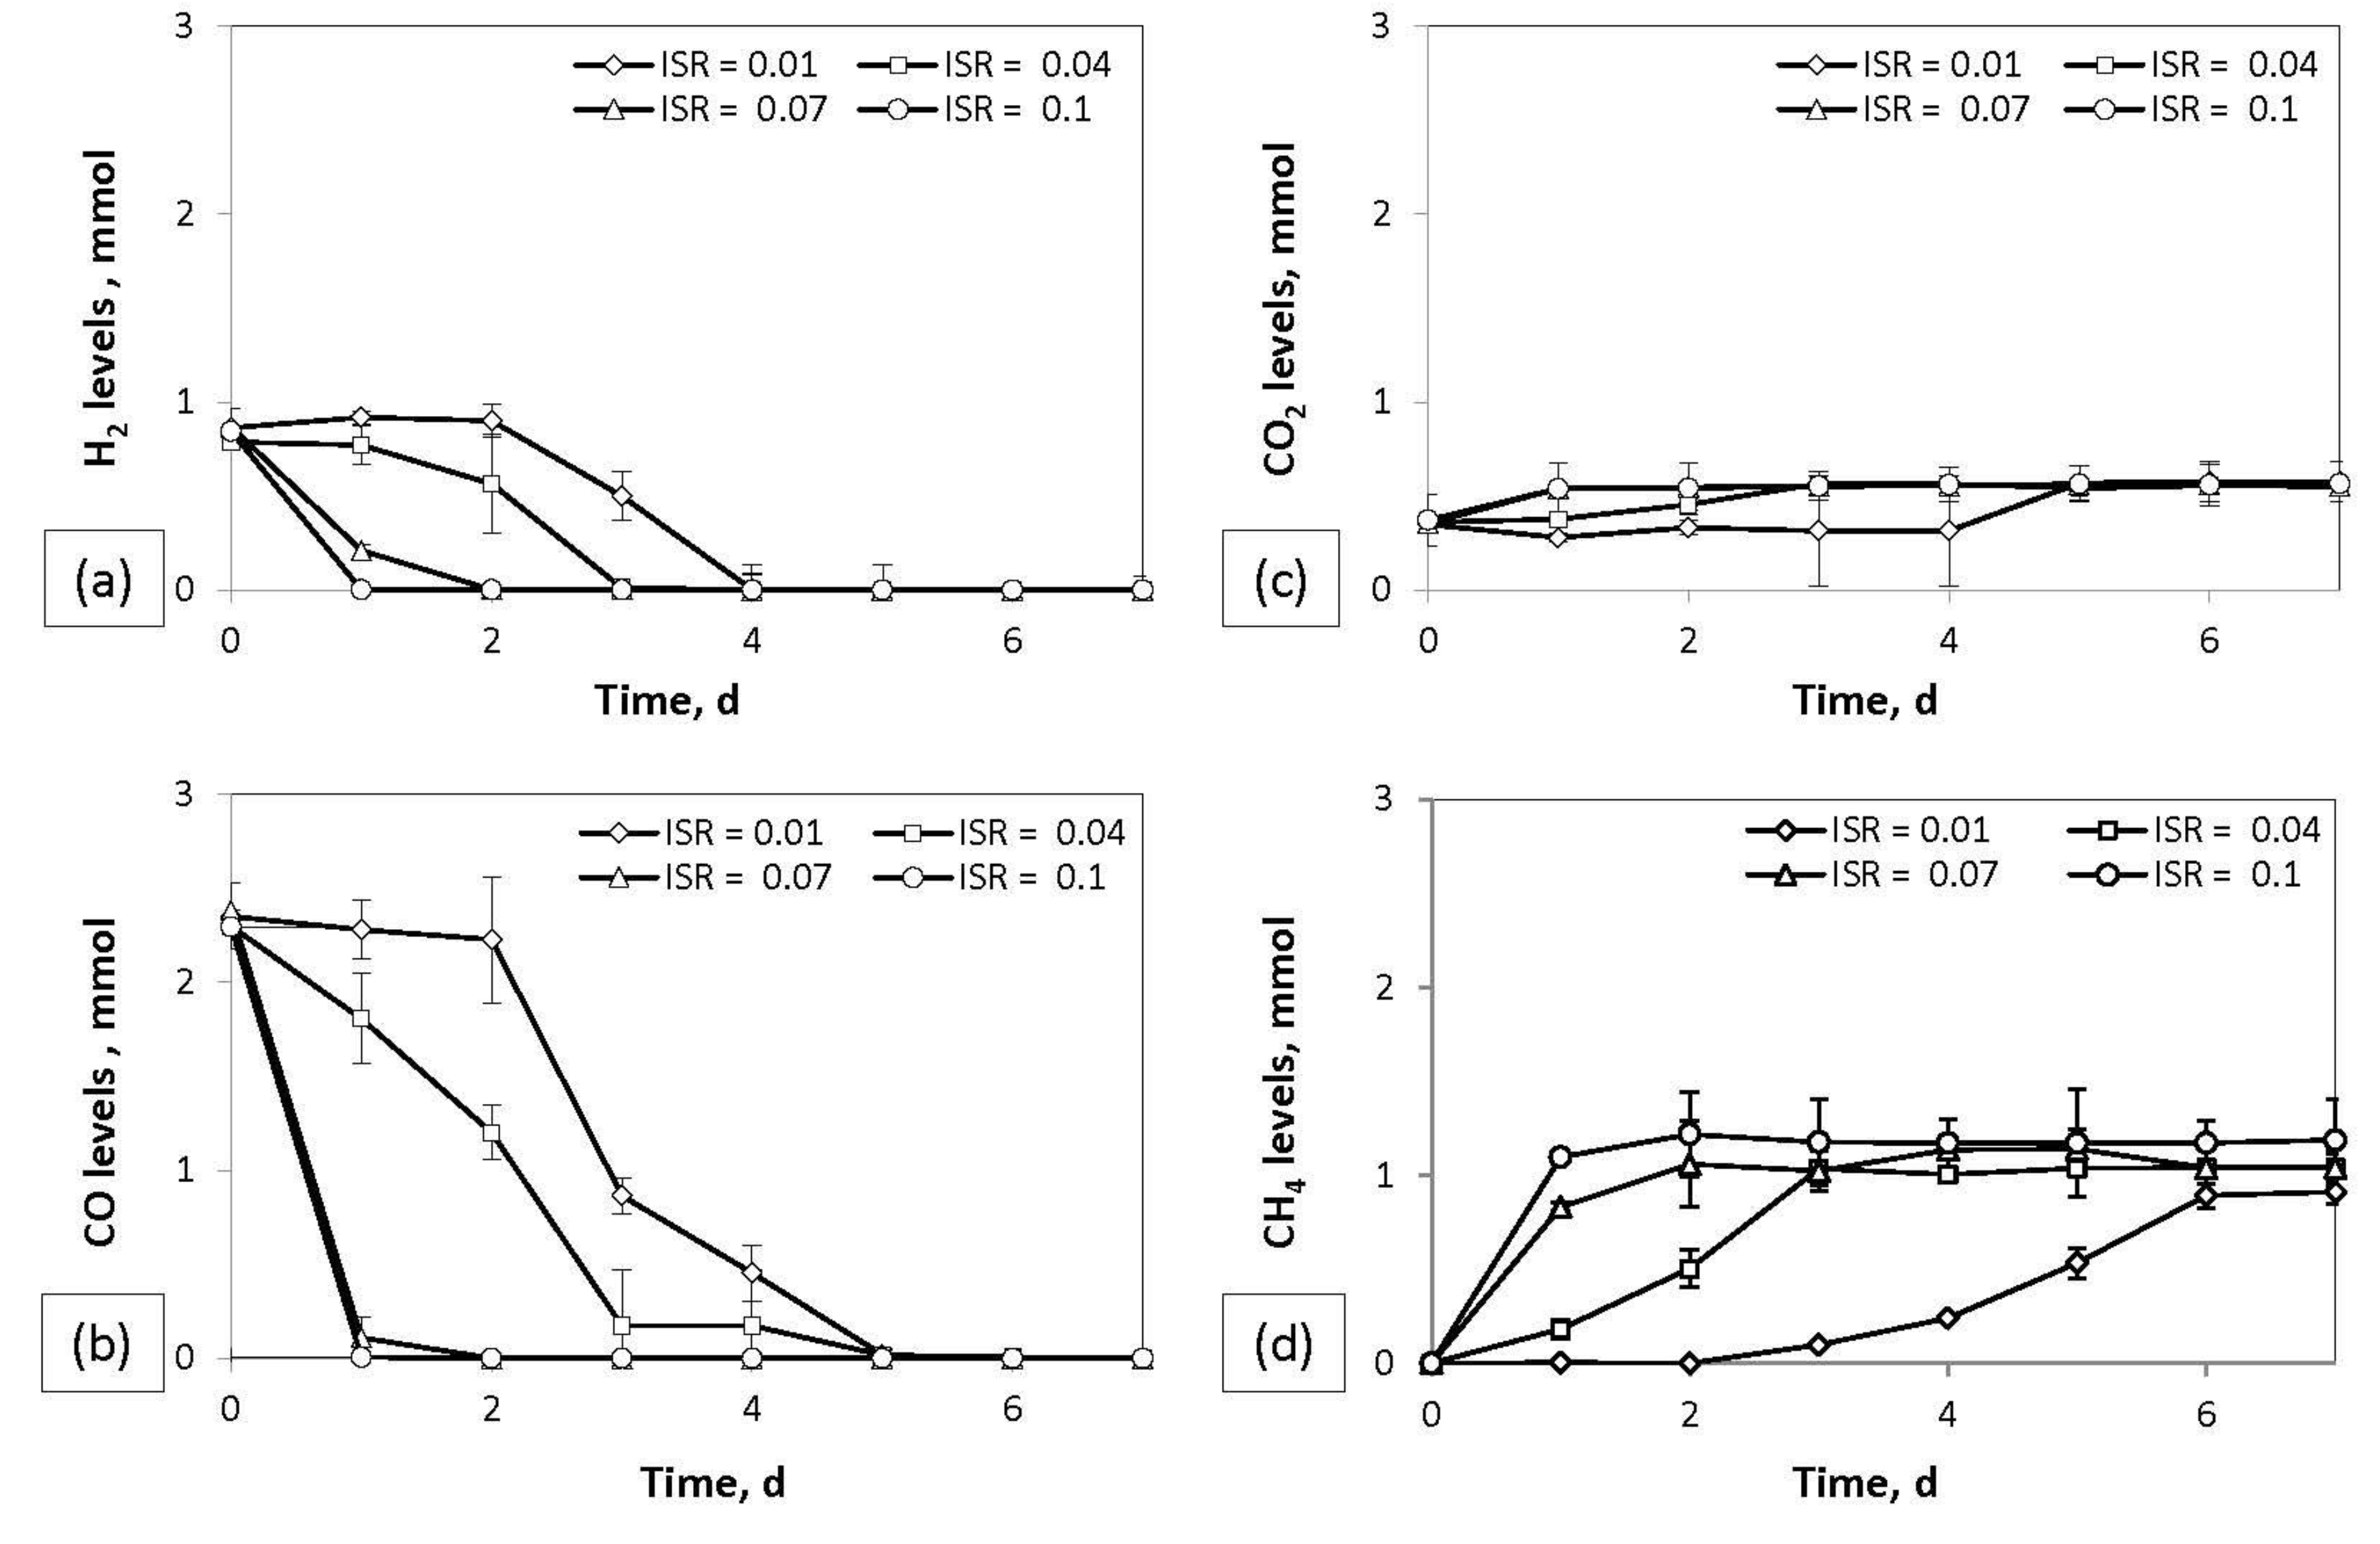
In order to study the effect of different ISRs, both batch and continuous bioreactors were operated. During the batch experiment, syngas consumption and biogas production was investigated at different ISRs (0.01, 0.04, 0.07, and 0.1 g/mL), and the results are presented in Figure 6. According to the figure, the increase of ISR led to faster consumption of H2 and CO. More specifically, the complete consumption of H2 and CO took one day in bioreactors with an ISR of 0.1 g/mL, while in bioreactors with 10 times less inoculum (ISR = 0.01 g/mL), the complete consumption of H2 and CO took four and five days, respectively. The CH4 production followed the same trend. The CH4 production in the bioreactor with an ISR of 0.1 g/mL was stabilized on the third day, while the CH4 production in the bioreactor with an ISR of 0.01 g/mL reached its highest CH4 production on the sixth day of fermentation. In bioreactors with an ISR of 0.04 g/mL, the complete conversion of H2 and CO took three and five days, respectively. These conversion rates were lower in comparison with a previous study with a similar system (ISR = 0.38 g/mL) during which H2 and CO were totally consumed in two days [22]. However, in this work, the initial amount of H2 and CO content in the bioreactors was approximately 50% and 24% higher than in the previous study. The highest CH4 yield (at an ISR of 0.1 g/mL) obtained in the current work was 0.39 mol CH4/mol (H2 + CO2), which is comparatively higher than in other similar studies. For example, the CH4 yield achieved during the conversion of H2/CO2 and CO in a batch bubble column bioreactor with an ISR of 0.0037 g/mL was 0.22–0.26 mol CH4/mol (H2 + CO2) and 0.25 mol CH4/mol CO, respectively [23]. The lower yields in the above work could have been caused by the lower ISR and the different syngas composition in comparison to the current work.
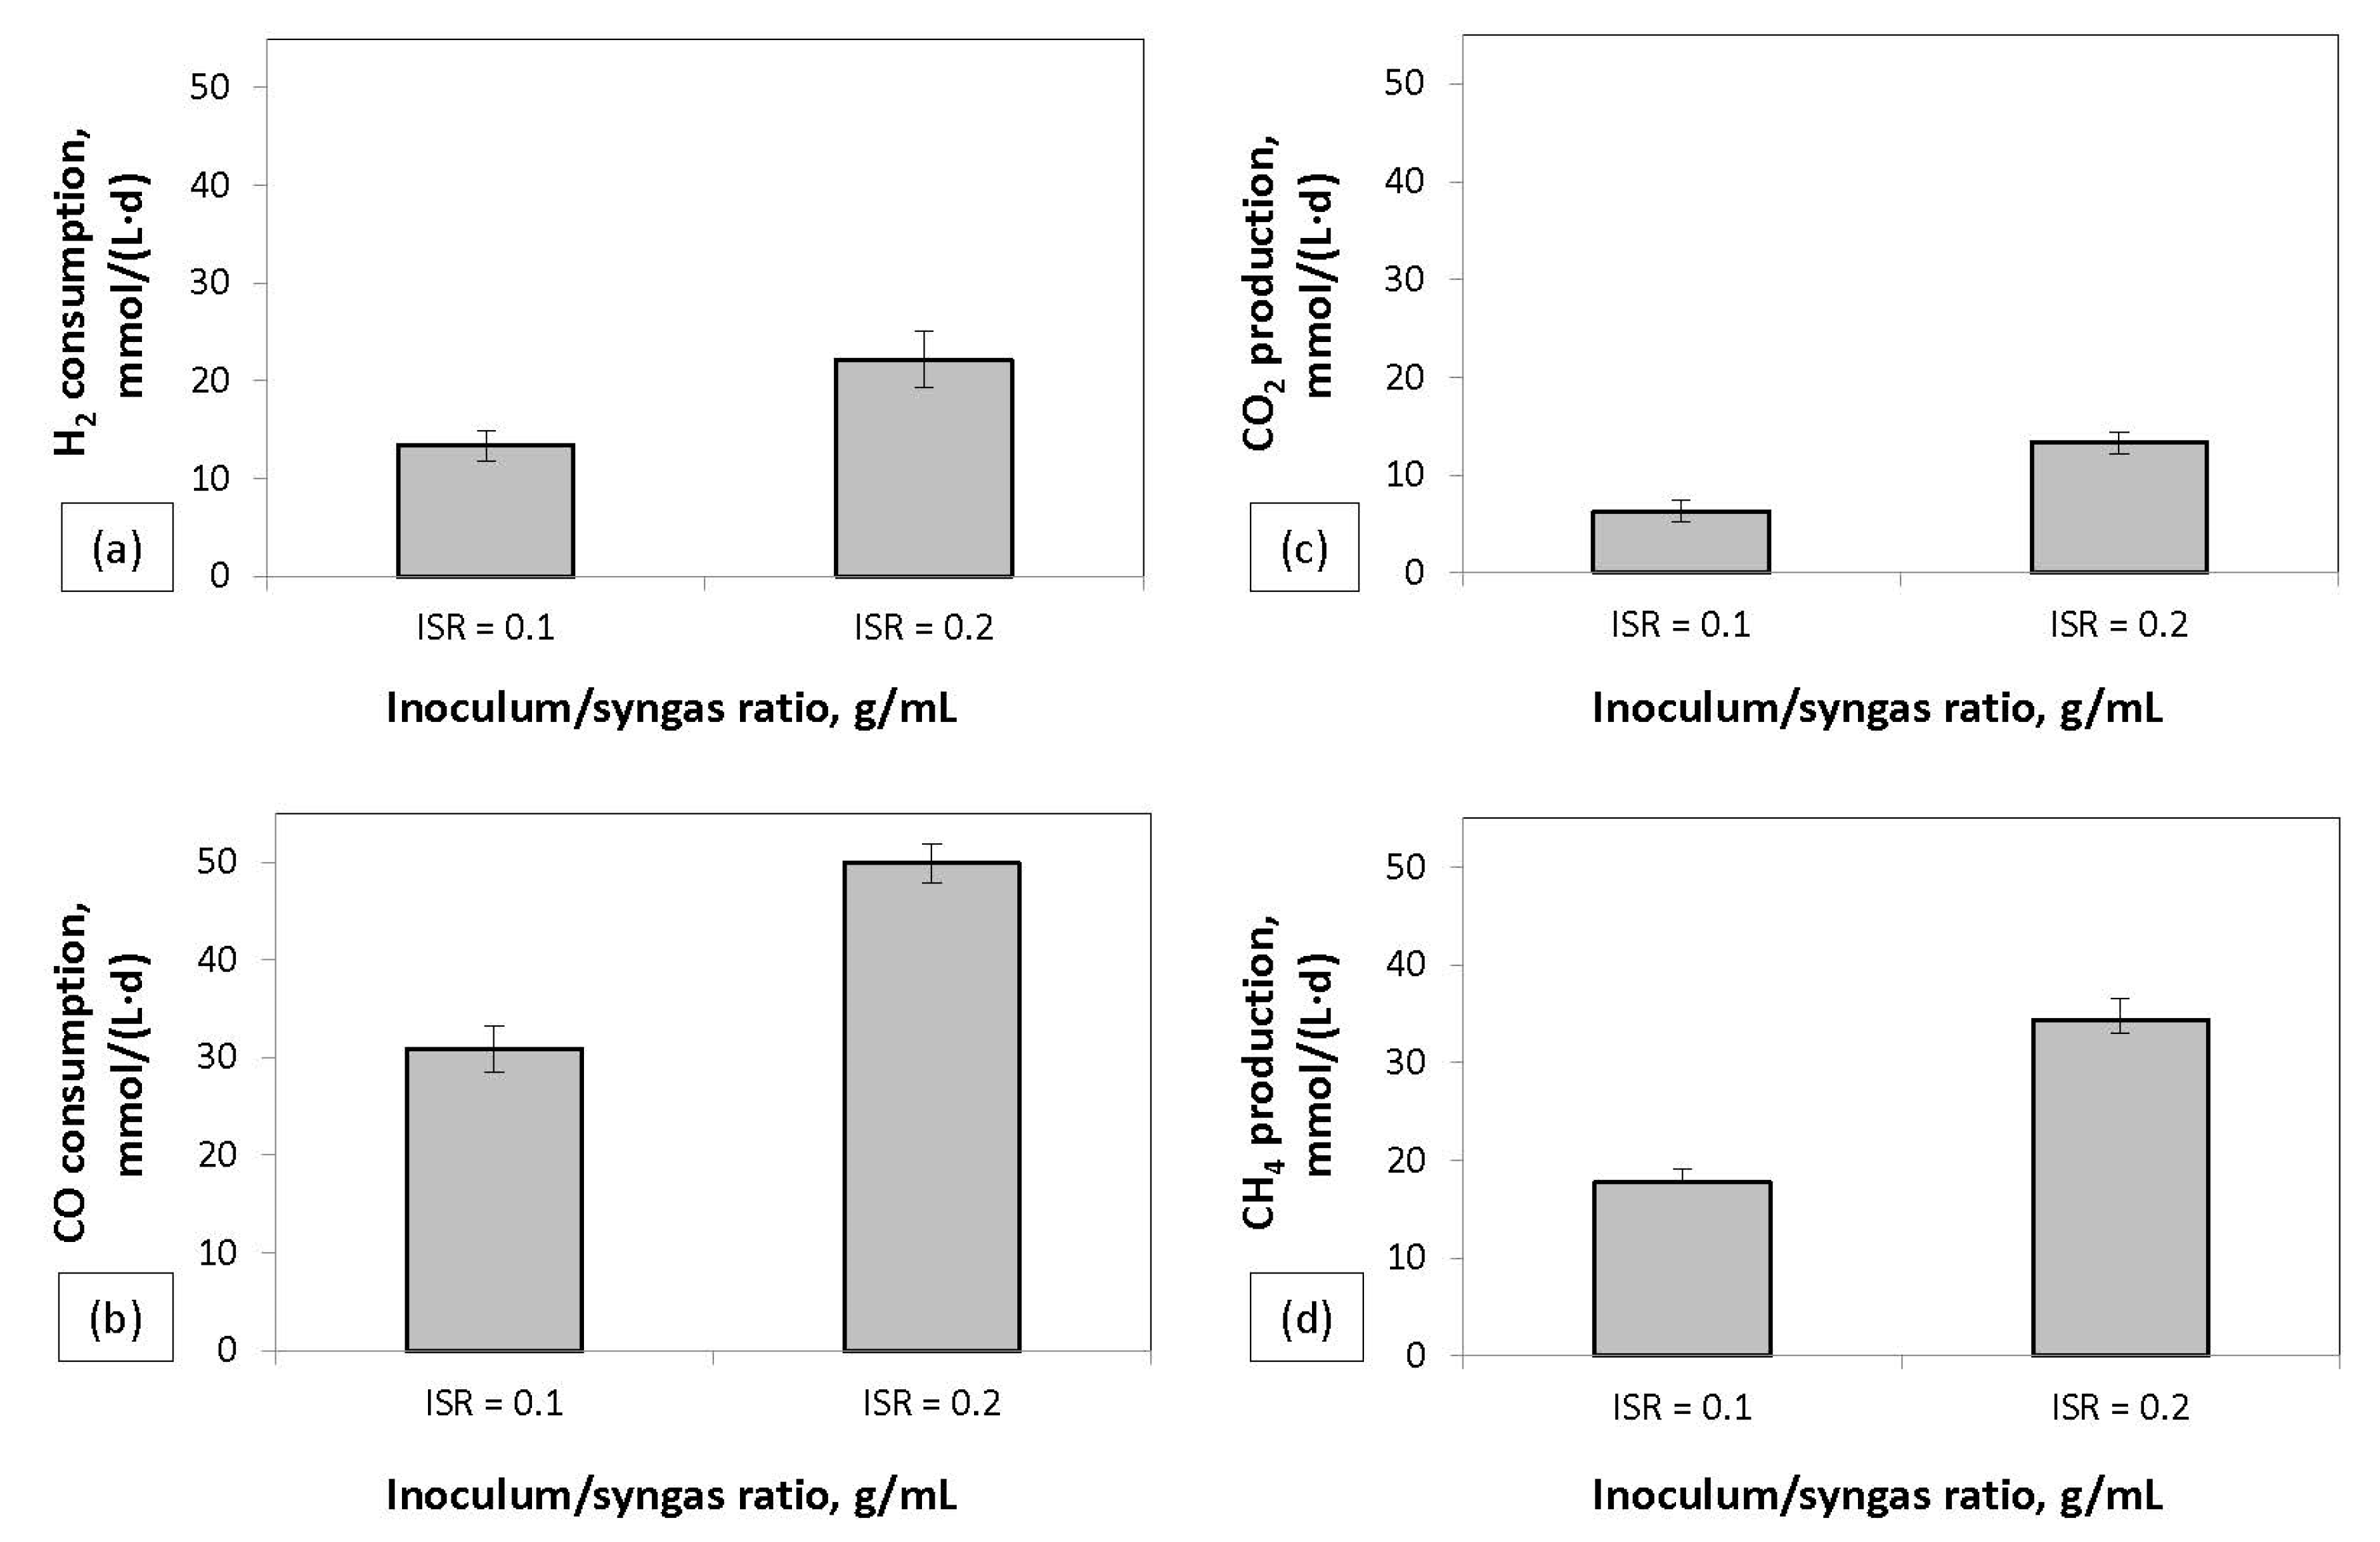
During the continuous experiment, the FCBR that had an ISR of 0.1 g/mL was operated in parallel with FCBR.2 with an ISR of 0.2 g/mL. The aim was to investigate the effect of doubling the ISR and the operation in continuous mode. The results (Figure 7) showed an increase in the H2 and CO consumption rate of approximately 66% and 61%, respectively, and an increase of approximately 94% in CH4 production rate. The CH4 production rate in the bioreactor with an ISR of 0.2 g/mL was 34.41 mmol/(L·d), the highest achieved in this work. This production rate is comparable to results from other similar studies. A CH4 production rate of 72 mmol/(L·d) was achieved during biomethanation of syngas with a similar composition at a gas flow rate of 70 mL/min. The syngas was converted in a trickle bed bioreactor by a triculture of R. rubrum, M. barkeri, and M. formicicum [4,16]. Another study was conducted in a packed bed bioreactor with the same triculture, similar syngas composition, and gas flow rate of 80 mL/min. In that work, a lower CH4 production rate between 4.8 and 7.2 mmol/(L·d) was reported [17]. In the literature, there are previous studies that have reported that higher ISRs can improve the CH4 potential yields. These studies have mainly focused on the investigation of using different ISRs based on g VSadded, with mixed anaerobic sludge. For example, a study on the effect of ISR on the CH4 potential of microcrystalline cellulose production wastewater reported that the fastest CH4 production rate and highest kinetic constant were achieved at the highest ISR of 2.0 [10]. However, extremely high ISRs may be inhibiting for the anaerobic process. Lim and Fox [24] studied three different ISRs (1, 0.33, and 0.125) and reported that the highest CH4 production rate was obtained at the ratio of 0.33, whereas the minimum production rate was obtained at an ISR of 0.125. The low ISR probably caused low substrate concentration and the high ISR caused high concentration of volatile fatty acids and thus, low pH [24].

4. Conclusions

The new concept of floating MBR was successfully applied during continuous syngas biomethanation with a mixed culture and thermophilic conditions. The floating MBR was operated in parallel with a hybrid bioreactor containing both membrane encased and free cells, a bioreactor with free cells growing on packed material, and a free cell bioreactor. The results showed that the use of the floating MBR improved the gas hold-up and accelerated the syngas conversion rate. Thus, syngas conversion rates were higher in the floating MBR in comparison to the other bioreactors. The increase of the thickness of the membrane bed by twofold resulted in higher syngas conversion rates of 6% and 11% for H2 and CO consumption, respectively. In addition, different inoculum-to-syngas ratios (ISR) were tested during both batch and continuous experiments and the highest syngas conversion rates were achieved at the highest ISR of 0.2 g/mL during continuous biomethanation. The study of the limiting effect of ISR in continuous syngas biomethanation is considered an interesting future step.

Author Contributions

Conceptualization, K.C.; methodology, K.C. and E.P.; validation, K.C.; formal analysis, K.C.; investigation, E.P. and K.C.; resources, E.P. and K.C.; data curation, E.P. and K.C.; writing—original draft preparation, K.C.; writing—review and editing, K.C. and M.J.T.; visualization, K.C. and E.P.; supervision, M.J.T.; project administration, K.C. and M.J.T.; funding acquisition, M.J.T.

Funding

This research was funded by the Swedish Research Council.

Acknowledgments

The authors would like to thank Jean-Francois Charlot from Merck, Millipore S.A.S., France and Amir Mahboubi from University of Borås, Sweden for their technical support on membranes.

Conflicts of Interest

The authors declare no conflict of interest.

References

  1. Rauch, R.; Hrbek, J.; Hofbauer, H. Biomass gasification for synthesis gas production and applications of the syngas. Wiley Interdiscip. Rev. Energy Environ. 2014, 3, 343–362. [Google Scholar] [CrossRef]
  2. Boerrigter, H.; Rauch, R.; Knoef, H.A.M. Handbook Biomass Gasification, 2nd ed.; BTG Biomass Technology Group: Enschede, The Netherlands, 2005. [Google Scholar]
  3. Solarte-Toro, J.C.; Chacón-Pérez, Y.; Cardona-Alzate, C.A. Evaluation of biogas and syngas as energy vectors for heat and power generation using lignocellulosic biomass as raw material. Electron. J. Biotechnol. 2018, 33, 52–62. [Google Scholar] [CrossRef]
  4. Grimalt-Alemany, A.; Skiadas, I.V.; Gavala, H.N. Syngas biomethanation: State-of-the-art review and perspectives. Biofuels Bioprod. Biorefin. 2017, 12, 139–158. [Google Scholar] [CrossRef]
  5. Asimakopoulos, K.; Gavala, H.N.; Skiadas, I.V. Reactor systems for syngas fermentation processes: A review. Chem. Eng. J. 2018, 348, 732–744. [Google Scholar] [CrossRef]
  6. Bredwell, M.D.; Srivastava, P.; Worden, R.M. Reactor Design Issues for Synthesis-Gas Fermentations. Biotechnol. Progr. 1999, 15, 834–844. [Google Scholar] [CrossRef] [PubMed]
  7. Shen, Y.; Brown, R.; Wen, Z. Enhancing mass transfer and ethanol production in syngas fermentation of Clostridium carboxidivorans P7 through a monolithic biofilm reactor. Appl. Energy 2014, 136, 68–76. [Google Scholar] [CrossRef]
  8. Shen, Y.W.; Brown, R.; Wen, Z.Y. Syngas fermentation of Clostridium carboxidivoran P7 in a hollow fiber membrane biofilm reactor: Evaluating the mass transfer coefficient and ethanol production performance. Biochem. Eng. J. 2014, 85, 21–29. [Google Scholar] [CrossRef]
  9. Mahboubi, A.; Ylitervo, P.; Doyen, W.; De Wever, H.; Taherzadeh, M.J. Reverse membrane bioreactor: Introduction to a new technology for biofuel production. Biotechnol. Adv. 2016, 34, 954–975. [Google Scholar] [CrossRef] [PubMed] [Green Version]
  10. Rodriguez-Chiang, L.M.; Dahl, O.P. Effect of Inoculum to Substrate Ratio on the Methane Potential of Microcrystalline Cellulose Production Wastewater. Bioresources 2015, 10, 898–911. [Google Scholar] [CrossRef]
  11. Pellera, F.M.; Gidarakos, E. Effect of substrate to inoculum ratio and inoculum type on the biochemical methane potential of solid agroindustrial waste. J. Environ. Chem. Eng. 2016, 4, 3217–3229. [Google Scholar] [CrossRef]
  12. Osuna, M.B.; Zandvoort, M.H.; Iza, J.M.; Lettinga, G.; Lens, P.N.L. Effects of Trace Element Addition on Volatile Fatty Acid Conversions in Anaerobic Granular Sludge Reactors. Environ. Technol. 2003, 24, 573–587. [Google Scholar] [CrossRef] [PubMed]
  13. Youngsukkasem, S.; Rakshit, S.K.; Taherzadeh, M.J. Biogas production by encapsulated methane-producing bacteria. Bioresources 2012, 7, 56–65. [Google Scholar]
  14. Doran, P.M. Mass transfer. In Bioprocess Engineering Principles, 2nd ed.; Elsevier: Amsterdam, The Netherlands, 2012; pp. 379–444. [Google Scholar]
  15. Westman, Y.S.; Chandolias, K.; Taherzadeh, J.M. Syngas Biomethanation in a Semi-Continuous Reverse Membrane Bioreactor (RMBR). Fermentation 2016, 2, 8. [Google Scholar] [CrossRef]
  16. Kimmel, D.E.; Klasson, K.T.; Clausen, E.C.; Gaddy, J.L. Performance of trickle-bed bioreactors for converting synthesis gas to methane. Appl. Biochem. Biotechnol. 1991, 28–29, 457–469. [Google Scholar] [CrossRef]
  17. Klasson, K.T.; Cowger, J.P.; Ko, C.W.; Vega, J.L.; Clausen, E.C.; Gaddy, J.L. Methane production from synthesis gas using a mixed culture ofR. rubrum M. barkeri, and M. formicicum. Appl. Biochem. Biotechnol. 1990, 24, 317–328. [Google Scholar] [CrossRef]
  18. Pereira, F.M.R. Intensified Bioprocess for the Anaerobic Conversion of Syngas to Biofuels. Ph.D. Thesis, University of Minho, Braga, Portugal, 2014. Available online: http://hdl.handle.net/1822/34834 (accessed on 18 March 2019).
  19. Burkhardt, M.; Koschack, T.; Busch, G. Biocatalytic methanation of hydrogen and carbon dioxide in an anaerobic three-phase system. Bioresour. Technol. 2015, 178, 330–333. [Google Scholar] [CrossRef] [PubMed]
  20. Chen, J.; Gomez, J.A.; Höffner, K.; Barton, P.I.; Henson, M.A. Metabolic modeling of synthesis gas fermentation in bubble column reactors. Biotechnol. Biofuels 2015, 8, 89. [Google Scholar] [CrossRef] [PubMed]
  21. Atiyeh, H.K.; Devarapalli, M.; Lewis, R.S.; Huhnke, R.L. Semi-Continuous Syngas Fermentation in a Trickle Bed Reactor. In Proceedings of the AIChE 2013 Annual Meeting, San Franscisco, CA, USA, 3–8 November 2013. [Google Scholar]
  22. Youngsukkasem, S.; Chandolias, K.; Taherzadeh, M.J. Rapid bio-methanation of syngas in a reverse membrane bioreactor: Membrane encased microorganisms. Bioresour. Technol. 2015, 178, 334–340. [Google Scholar] [CrossRef] [PubMed] [Green Version]
  23. Bugante, E.C.; Shimomura, Y.; Tanaka, T.; Taniguchi, M.; Oi, S. Methane production from hydrogen and carbon dioxide and monoxide in a column bioreactor of thermophilic methanogens by gas recirculation. J. Ferment Bioeng. 1989, 67, 419–421. [Google Scholar] [CrossRef]
  24. Lim, S.J.; Fox, P. Biochemical methane potential (BMP) test for thickened sludge using anaerobic granular sludge at different inoculum/substrate ratios. Biotechnol. Bioprocess. Eng. 2013, 18, 306–312. [Google Scholar] [CrossRef]
Figure 1. Schematic of gas and liquid feeding in the floating MBR (membrane bioreactor).
Energies 12 01046 g001
Figure 2. Syngas biomethanation in bioreactors containing (a) membrane-encased cells (floating MBR), membrane-encased and free cells (floating MBR/FCBR), free cells growing on packed material (PBR), and free (suspended) cells (FCBR); (b) membrane bed thickness of 3 cm (floating MBR) and 6 cm (floating MBR.2), and (c) inoculum to syngas ratio (ISR) of 0.1 g/mL (FCBR) and 0.2 g/mL (FCBR.2).
Energies 12 01046 g002
Figure 3. (a) The resistances during the mass transfer of syngas from the gas phase to the site of reaction in the cells. 1. Travel in the gas bubble; 2. Move across the gas-liquid interfacial; 3. Travel through the liquid film surrounding the gas bubble; 4. Travel in the liquid bulk; 5. Enter the interior of the membrane through its pores; 6. Move inside the membrane; 7. Travel across the liquid film surrounding the microbial cell; 8. Pass through the cell membrane; 9. Move through the cell and end up in the site of reaction; (b) Movement of A through the interfacial boundary. CAL: concentration of A in the liquid phase; CAli concentration of A in the liquid boundary; CAGi concentration of A in the gas boundary; and CAG concentration of A in the gas phase [14].
Energies 12 01046 g003
Figure 4. Syngas biomethanation in floating MBR, floating MBR/FCBR, PBR, and FCBR during continuous syngas feeding. Consumption of (a) H2 and (b) CO and production of (c) CO2 and (d) CH4in mmol/(L·d).
Energies 12 01046 g004
Figure 5. Syngas biomethanation in floating MBR and floating MBR.2 with a membrane bed thickness of 3 cm and 6 cm, respectively, during continuous syngas feeding. Consumption of (a) H2 and (b) CO and production of (c) CO2 and (d) CH4 in mmol/(L·d).
Energies 12 01046 g005
Figure 6. Syngas biomethanation in batch bioreactors with an ISR of 0.01, 0.04, 0.07, and 0.1 (g/mL). Consumption of (a) H2 and (b) CO and production of (c) CO2 and (d) CH4 in mmol.
Energies 12 01046 g006
Figure 7. Syngas biomethanation in FCBR (ISR = 0.1 g/mL) and FCBR.2 (ISR = 0.2 g/mL) during continuous syngas feeding. Consumption of (a) H2 and (b) CO and production of (c) CO2 and (d) CH4 in mmol/(L·d).
Energies 12 01046 g007
Table 1. Consumption of acetic acid in the bioreactors.
Bioreactor TypeAcetic Acid Consumed, g/(L·d)
floating MBR (membr. bed = 3 cm)1.40 ± 0.42
floating MBR/FCBR1.01 ± 0.41
PBR0.78 ± 0.51
FCBR (ISR = 0.1 g/mL)0.92 ± 0.52
floating MBR.2 (membr. bed = 6 cm)1.15 ± 0.35
FCBR.2 (ISR = 0.2 g/mL)1.79 ± 0.62

