Abstract
Directive 2010/31/EU promotes the refurbishment of existing buildings to change them into nearly zero-energy buildings (nZEBs). Within this framework, it is of crucial importance to guarantee the best trade-off between energy performance and indoor environmental quality (IEQ). The implications of a global refurbishment scenario on thermal and visual comfort are assessed in this paper pertaining to an existing office building. The retrofit actions applied to achieve the nZEB target consist of a combination of envelope and technical building systems refurbishment measures, involving both HVAC and lighting. Energy and comfort calculations were carried out through dynamic simulation using Energy Plus and DIVA, for the thermal and visual performance assessments, respectively. The results point out that energy retrofit actions on the building envelope would lead to significant improvements in the thermal performance, regarding both energy savings (−37% of the annual primary energy for heating) and thermal comfort. However, a daylighting reduction would occur with a consequent higher electricity demand for lighting (36%). The research presents a detailed approach applicable to further analyses aimed at optimizing the energy efficiency measures in order to reduce the imbalance between visual and thermal comfort and to ensure the best performance in both domains.
1. Introduction
In the last few decades, the reduction in global energy consumption has been centrally involved in the scientific debate. Since the building stock accounts for 40% of the final energy consumption, as stated by the European Union Council, relevant energy savings can be obtained for the existing building stock. Directive 2010/31/EU thus promotes the improvement of the energy performance of buildings and enforces the Member States to draw up national plans to increase the refurbishment of existing buildings in order to change them into nearly zero-energy buildings (nZEBs) [1]. Together with the importance of increasing the building energy performance, the indoor environmental quality (IEQ) should be considered as a part of the total building performance. Ensuring compliance with comfort requirements in a refurbishment scenario is not a common task. Energy refurbishment measures may have opposite effects on the thermal and visual performance, and may lead to a consequent imbalance between the two domains. They can, for example, reduce solar heat gains and lead to an improvement in thermal comfort during the cooling season, but at the same time can lead to a reduction in daylight supply and, as a consequence, to a higher energy need of electric lighting to provide visual comfort conditions.
Many studies have dealt with the commonly adopted retrofit actions and have demonstrated the negative effect on visual comfort as a result of a reduction in daylight availability; these actions mainly concerned window replacements [2,3,4,5,6], solar shading device installations [4,7,8] and the reduction of window carcasses, due to the thickening of the thermal insulation [9,10,11].
As far as glazing typology is concerned, Hee et al. [2] investigated the effect of window glazing on daylight and energy savings in buildings. The authors highlighted that both static and dynamic glazing can affect the balance between the two domains in different ways, but static glazing optimization needs more consideration. Reinhart [3] investigated the influence of the visible transmittance of glazing on lighting energy consumption in open plan offices. He found that if no shading devices were considered, a reduction in transmittance of 0.75 to 0.35 increases the energy consumption for lighting by about 20%. Moreover, Mainini et al. [4] evaluated several transparent envelope refurbishment strategies for an existing Italian office building and they found that the replacement of the existing windows with low-e double glass led to a consistent reduction in heating and cooling energy consumptions (8% and 43% respectively), but also determined an increase in primary energy use for lighting (17%). On the other hand, dynamic glazing and smart-windows may also lead to an imbalance between thermal and visual performance, as stated by Dussault and Gosselin [5] and Ajaji and André [6]. Both of these research studies highlighted that electrochromic glazing introduced an added value as a result of removing overheating, while the useful daylight illuminance (UDI) decreased by around 40% as a result of limited solar gains and daylight availability.
Hernández et al. [7] drew the same conclusions after testing different solar shading configurations. They demonstrated a significant worsening of the visual comfort, when a configuration of louvre angles that maximised the cooling energy performance in an office building was applied. On the other hand, in the work of Mainini [4], the implementation of movable shading devices, coupled with clear double pane glass, in an existing office building only led to a slight worsening of the lighting energy performance (2%). David et al. [8] highlighted the lack of a process for the sizing of shading devices that takes into account both thermal and visual issues, and they proposed simple indexes to compare the thermal and visual efficacy of different types of solar shadings. Finally, many studies have focused on the effects of different window-to-wall ratios (WWR) on the visual and thermal performance of buildings. For example, Xue et al. [9] coupled sunshades and the optimization of WWR in an attempt to meet the daylighting standard, while Pellegrino et al. [10] showed how a decrease in indoor daylight availability, due to a reduction in WWR or an external obstruction, may lead to an increase in the global energy demand of a building, despite a reduction in the cooling loads. Altan et al. [11] evaluated the effect of different insulation thicknesses on the overall performance of a residential building. Their main results show that a 200 mm thermal insulation layer leads to a decrease of around 40% in the daylight factor, but guarantees a consistent reduction in heat losses.
The implications on the indoor environmental quality of partial building renovation, involving just one, or a combination of two energy efficiency measures, were studied in the aforementioned works [2,3,4,5,6,7,8,9,10,11]. Holistic approaches that take into account comfort aspects, energy consumption and nZEB requirements are diffuse in studies concerning the design of new low-energy buildings, as in the work of Jin et al. [12]. Nevertheless, global building renovations of existing buildings, considering retrofit actions on both building envelope and technical building systems, have not yet been widely investigated. The present work aims at bridging this research gap and at setting up an approach that allows the IEQ implication of global refurbishment scenarios on the existing building stock to be evaluated, considering different types of thermal and visual comfort evaluations. Through this in-depth approach, the design of nearly-zero energy buildings, regardless of whether they are new or existing buildings undergoing refurbishment, will be able to address the optimization of the overall building performance, by identifying the best trade-off between IEQ and compliance with nZEB requirements.
Within this framework, the “Renovation of existing buildings in NZEB vision (nearly Zero Energy Buildings)” Project of National Interest (PRIN 2015), funded by the Italian Ministry of Education, University and Research (MIUR) [13], is aimed at studying integrative solutions for the transformation of existing buildings into nZEBs, considering both technical and economic implications. A specific line of research is aimed at investigating the best trade-off between thermal and visual parameters for the design of nZEBs. The challenge of the Project, as well as of the present research, is to correlate different knowledge domains, encompassing energy performance requirements and criteria for indoor environmental quality. The energy performance requirements are those that have been fixed by regulations. In Italy, the reference is the national Inter-ministerial Decree of 26 June 2015 [14]. The IEQ criteria follow standardised methodologies (as discussed later in Section 2).
This article presents the preliminary results of this line of research and is focused on the global refurbishment of an Italian office building. It is an extension of a previous conference paper [15] and it provides improvements of the methodology, a deepening of the numerical analysis and more detailed findings. This study is intended to address the following research questions:
- Can a reference package of energy efficiency measures, which is applied to achieve the nZEB target, ensure both thermal and visual comfort and improve the overall building energy performance?
- To what extent does the effect of the energy efficiency measures of the building envelope cause an increase in thermal comfort, on the one hand, and a reduction in visual comfort, on the other hand?
- What optimized solutions could be suggested to guarantee visual comfort conditions while ensuring the highest overall energy performance?
2. Methodology
The methodology followed in the present work includes both thermal and visual comfort analyses, and an energy performance assessment. The comfort and energy aspects were both estimated through numerical simulations, following established procedures, and expressed by means of indexes, in accordance with technical standards and other official international references. The methods applied in this research are presented in detail in Section 2.1, Section 2.2 and Section 2.3.
Thermal and visual comfort, and building energy performance were assessed and compared for the following variants of the same case study:
- (1)
- The building in its current condition (Exist.B).
- (2)
- The nZEB, obtained by only applying energy efficiency measures to the building envelope components (nZEB*).
- (3)
- The nZEB, obtained by applying energy efficiency measures to both the building envelope and the technical building systems (nZEB).
In the present work, a storey of a representative office building was taken as a case study.
2.1. Thermal Comfort Analysis
A yearly thermal analysis was performed to study the effect of building envelope retrofitting on the building performance. Thermal comfort was evaluated for the mid-seasons (i.e., periods belonging to neither the heating nor the cooling seasons), and through the procedures and indexes specified in the EN 16798-1 technical standard [16]. For the rest of the year, during the heating and cooling seasons, thermal comfort is considered to be achieved through the use of HVAC systems.
The so-called adaptive criteria were applied for the mid-seasons. They are usually considered for buildings without mechanical heating and/or cooling systems, and for those building categories, such as offices, that are mainly characterised by sedentary activities, where there is easy access to operable windows and occupants can freely adapt their clothing to the indoor and/or outdoor thermal conditions.
In the adaptive comfort approach, the comfort operative temperature varies in function of the outdoor running mean temperature, which is defined as an exponential running mean of the outdoor air temperature. By considering a period of seven days, the outdoor running mean temperature (θr,m, in °C) is calculated as in Equation (1):
where θe,d,j is the past j-th daily mean outdoor air temperature (in °C), and α is a constant value, which is assumed equal to 0.8, as recommended in EN 16798-1. In the present work, the outdoor running mean temperature (θr,m) is an hourly value. For its determination, the daily mean outdoor air temperature (θe,d,j) of Equation (1) was calculated from hourly values of the external air temperature. For each hour of the day, θe,d,j is the mean of the 24 previous hourly values, starting from the same hour of the past (j-1)-th day.
The relationship between the comfort operative temperature and the outdoor running mean temperature is valid when the latter is between 10 °C and 30 °C. Acceptable ranges of indoor operative temperatures fall between the upper and lower temperature limits. Category II limits (i.e., a medium comfort level) are normally used, according to EN 16798-1, as design criteria for standard buildings. The range refers to a variation of the optimal operative temperature of +3 °C (highest limit) and −4 °C (lowest limit), where the optimal operative temperature (θo,c, in °C) is calculated as in Equation (2):
where θr,m is the outdoor running mean temperature (Equation (1)).
Thermal comfort indexes were calculated from hourly values of the indoor operative temperature, which were derived from simulations carried out using Energy Plus [17]. The following two indexes, which are proposed in EN 16798-1 and are usually applied for long-term comfort evaluation, were considered:
- the percentage of discomfort hours (PDH), which expresses the percentage of occupied hours in which the indoor operative temperature exceeds the recommended range, and
- the weighted hours of discomfort (WHD), which express the time (in hours) during which the indoor operative temperature exceeds the specified range during the occupied hours, weighted by a factor that is a function of the temperature deviation out of the range. Cold discomfort and warm discomfort periods were considered separately to determine the index. The weighted hours of cold discomfort (WHDc) and of warm discomfort (WHDw) were calculated using Equations (3) and (4), respectively:where, wf is the weighting factor, τ is the time (in hours), θo is the indoor operative temperature (in °C) and θo,limit,lower/upper is the lower/upper limit of the comfort range (in °C). The weighting factor (wf) was determined using the equations provided by EN ISO 7730 (Method B) [18]:where θo,c is the optimal operative temperature (in °C), as calculated in Equation (2).
2.2. Visual Comfort Analysis
Appropriate lighting to ensure visual comfort inside a building can be provided by means of daylight, electric lighting or a combination of both. Daylighting is usually preferred, because of its positive effects on human performance and its potential to reduce the energy consumption for electric lighting [16,19]. Nonetheless, the amount of daylight in indoor spaces varies greatly over the months, the days and the spaces, thus implying the risk of having insufficient or excessive lighting, which may, in the latter case, causes visual or thermal discomfort. An electric lighting system should be designed to provide the total illumination required to complement or substitute daylighting.
According to the EN 12464-1 lighting standard [19], the amount of light required to perform visual tasks in office spaces safely, quickly and comfortably, which is expressed as the maintained illuminance over the task area (Em), should be 500 lux.
In this study, two separate analyses were performed to evaluate the visual comfort in the offices of the reference building: one to analyse the daylighting supply, with respect to the lighting requirements, and the other to verify the lighting conditions provided by electric lighting alone.
A climate-based annual simulation was performed for the daylighting, and different metrics were calculated to assess the daylighting conditions, with respect to the lighting requirement for visual comfort.
Useful daylight illuminance (UDI) metrics, as defined by Mardaljevic et al. [20,21], were used to evaluate the daylighting potential, in terms of percentage of occupied hours throughout the year during which the illuminances are within the defined ranges. The “useful” range was derived from a survey of reports of occupant preferences, and it was assumed to be between 100 lux and 2500 lux [20]. The useful range was further divided into two sub-ranges: UDI supplementary (UDI-s), when daylight illuminances are between 100 lux and 500 lux and electric lighting may be used to achieve comfort conditions, and UDI autonomous (UDI-a), when daylight illuminance is between 500 lux and 2500 lux and daylighting conditions are appropriate with respect to the typical office requirements, or at least tolerable [20]. Outside the useful range, UDI fell-short (daylight illuminances below 100 lux) and UDI exceeded (daylight illuminance above 2500 lux) can be calculated [21] to quantify conditions of insufficient daylighting or potentially excessive daylighting. Although UDI metrics are not included in international standards with minimum required values, a comparison of these metrics for different building configurations may be useful to analyse how the daylight provision in a space varies over the year, for different illuminance ranges.
A further metric, spatial Daylight Autonomy (sDA), was used to evaluate the sufficiency of daylight. This metric is based on the criteria that a space is considered to have adequate daylight if a target illuminance is achieved on a fraction of space for a fraction of time. The metric, which was first adopted by the Illuminating Engineering Society (IES), in the LM-83-12 report [22], has recently been introduced into the EN 17037 standard to assess Daylight Provision in interior spaces [23]. In this study, Daylight Provision was calculated according to the method provided by the EN 17037 standard. The annual illuminances, calculated through a climate-based simulation on the horizontal plane (h 0.85 m), were elaborated to determine the fraction of space that met the recommended target illuminance (500 lux) and a minimum target illuminance (300 lux) for at least 50% of the time. According to the standard recommendations, the calculated fractions of space should be at least 50% for the target illuminance (sDA500,50%) and at least 95% for the minimum target illuminance (sDA300,50%).
The daylighting analysis was repeated for the building in its current configuration (Exist.B) and for the nZEB, obtained by applying only energy efficiency measures to the building envelope components (nZEB*).
A numerical simulation was carried out to assess visual comfort under electric lighting conditions, without considering the presence of daylight. The analysis was performed for the building with the current lighting plant (Exist.B) to verify the visual comfort provided by the existing system, while the simulation was performed for the nZEB to design a lighting plant that was compliant with the lighting requirements. Visual comfort, related to the electric lighting conditions, was assessed through the main indexes reported in the EN 12464-1 standard [19]: average maintained illuminance—Em; illuminance uniformity—U and Unified Glare Rating—UGR.
The power of the two lighting plants was then used to estimate the energy performance of the building. The lighting analysis was carried out using two different tools: Dialux EVO [24], to assess the lighting performance of the electric lighting systems, and DIVA [25], to evaluate the annual daylighting conditions and the consequent electric lighting energy demand.
2.3. Energy Performance Assessment
According to the EN ISO 52000-1 technical standard [26], the overall energy performance (EP) of a building is the calculated or measured amount of weighted energy needed to meet the energy demand associated with the typical use of the assessed object. This includes energy used for specific services (e.g., space heating, space cooling, domestic hot water production, lighting, etc.).
In the present work, the building EP was calculated and expressed in terms of annual overall non-renewable primary energy normalized by the conditioned net floor area. The actual energy services of the existing building were included, i.e., space heating and lighting (neither space cooling nor domestic hot water systems are installed in the building in the current configuration). In the renovation phase (nZEB), space cooling and domestic hot water were also considered.
In the EP calculation, the electricity production from technologies that use renewable energy sources (e.g., photovoltaic system) was allocated to the different energy services proportionally to the electricity demand of each service on a monthly basis. The non-renewable primary energy conversion factors of the energy carriers applied in the EP assessment are the Italian national values established by the Inter-ministerial Decree of 26 June 2015 [14], as shown in Table 1.

Table 1.
Non-renewable primary energy conversion factors (fP,nren) [14].
In addition, the annual electricity consumption for lighting, before and after the building retrofit, was estimated taking into account the different lighting requirements consequent to the introduction of efficiency measures involving the thermal envelope of the building.
The energy needs for the considered building energy services were calculated by means of a dynamic simulation, using Energy Plus [17] for the thermal uses and DIVA [25] for lighting. The use of different types of simulation software allowed us to study the mutual influence between electric lighting and thermal performance. For instance, thermal performance is affected by the dissipated energy due to lighting, which is taken into account as an internal heat gain.
3. Case Study
3.1. Description of the Building
The case study is an office building that was built in the 1960s in Torino (Italy), which was considered to be representative of the existing northern Italian office building stock, as regards the building envelope and the technical building system features. It is composed of a main block of seven above-ground and two below-ground stories and a secondary block of two below-ground stories, with both of the main façades North-South oriented. The West and East sides of the building are mainly in the shade, due to the height of the surrounding buildings, as shown in Figure 1.
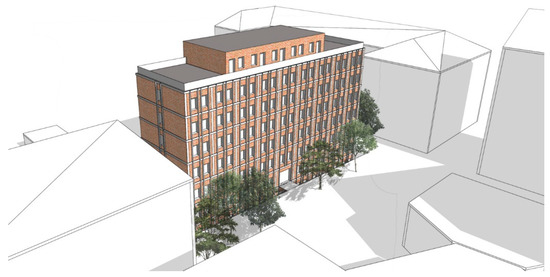
Figure 1.
3D model of the office building and the surrounding buildings.
The above-ground levels of the main block, which are characterized by regular plans, houses the offices. The secondary block houses the archives and rarely occupied rooms, such as informatics and meeting rooms. The building has a concrete frame structure and an uninsulated envelope. As regards the opaque envelope, the external walls are mainly made of brick masonry with an air gap. The transparent envelope is characterized by two original horizontal pivot window types: double glazed panes with a wood-frame and single glazing with a metal frame, both of which have a characteristic frame-to-window area ratio equal to 15%. The windows are manually openable. External roller shutters, which are also used as solar shading devices, are installed on each window on the above-ground levels on both the North- and South-façades. The main data on the building envelope components are listed in Table 2.
Table 2.
Physical data of the existing building envelope components.
As far as the HVAC system is concerned, the whole building is equipped with a heating system which is supplied by a district heating generator. The heat emitters are radiators and fan coils. Neither cooling nor air-conditioning systems have been installed and the indoor air quality is guaranteed by natural ventilation. The lighting system consists of two types of tubular fluorescent lamps, which were installed with an electric power of 36 W and 58 W, respectively. The luminaires are those that are generally installed in offices, that is, ceiling mounted luminaires with screens and refractors. The average Light Power Density (LPD) of the reference floor is 14 W·m−2.
The energy performance and the thermal and visual comfort analyses referred to a representative building storey, which is shown in Figure 2, located on the fifth above-ground floor. This floor represents an average condition, with respect to the shading provided by the external surrounding obstructions, and the results of the comfort analysis are therefore not influenced by too favourable or unfavourable conditions. The representative building storey is composed of nine South- and five North-oriented office modules, which are separated by unoccupied areas. Each office module is characterized by a net conditioned floor area of 17.3 m2, an internal height of 3 m, and two 1.8 m2 windows. The characteristic window-to-wall ratio of each office module is equal to 0.25. Each module hosts two or three employees and is equipped with one heat emitter, a thermostat and two luminaires.
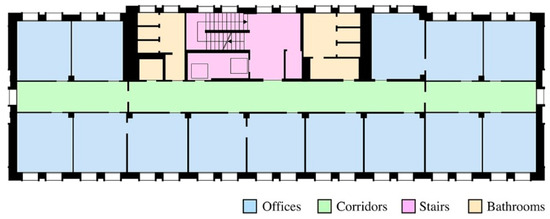
Figure 2.
Plan of the analysed storey (5th above-ground floor).
3.2. Building Use and Climatic Data
The considered information was derived from questionnaires and in-field surveys, and concerned the occupancy profile, the operation of the shading devices, the opening profile of the windows, the use of electric lighting and the operation of the heating system.
Hourly schedules were created, on the basis of the replies to the questionnaires. About sixty replies were analysed and processed in relation to the building storey and the main orientation. Hourly profiles were created, as regards the occupancy, as the average occupancy presence during the working hours (also considering the presence during the lunch break). The shading device operation and window opening information was processed on a seasonal basis, and it represents the most recurring answer in the questionnaire.
The building is occupied from 8 a.m. to 5 p.m. during the weekdays, while it is unoccupied at weekends. The maximum occupancy density differs between the North- and South-oriented offices (0.096 person/m2 and 0.089 person/m2, respectively) and varies during the occupancy hours, as shown in Figure 3a. The shading devices operation (Figure 3b) and the windows opening profile (Figure 3c) were evaluated separately for each season (winter, summer and mid-seasons) and for the North- and the South-oriented offices. The office users have free and easy access to open the windows of their own office modules. Moreover, the roller shutters are never activated in the North-oriented offices.
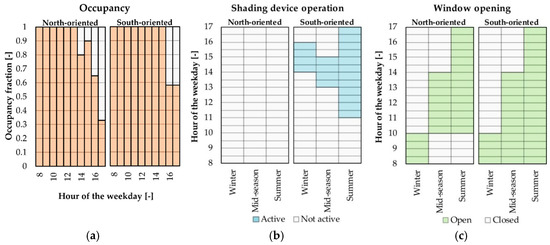
Figure 3.
Building usage profiles: (a) Occupancy; (b) Shading device operation; (c) Window opening.
The heating system starts two hours before occupancy (6 a.m.) and stops at 4:30 p.m., during the heating period, that is, from October 15th to April 15th. The air temperature set-point (20 °C) of the offices was derived from the replies to questionnaires, while it was assumed equal to 18 °C for the unoccupied spaces. The lighting control system is manual on/off, thus it allows the lighting to be managed individually in each room. The present user behaviour and usage profiles were considered for each variant of the case study. Energy performance and daylighting evaluations were carried out by means of annual climate-based simulations using the International Weather for Energy Calculations (IWEC) data file [27] of the city of Torino (Italy).
3.3. Technological Solutions of the Nearly Zero-Energy Building
The package of energy efficiency measures applied to transform the current office building into a nZEB was derived from the findings of a previous work [28], in which a numerical model of the office building was set up with the data described in Section 3.1 and Section 3.2 The building was modelled in DesignBuilder Software [29]. The internal heat gains were assessed in function of the installed electrical power of the office equipment (e.g., personal computers, printers), the luminaires and the occupant metabolic rate. The heat gains from the office equipment were modulated on the occupancy profile. Moreover, natural ventilation was modelled in function of the wind speed, the difference in air pressure between the inside and outside, the hourly opening profile of the windows, their size and the opening percentage. The latter was modulated in relation to the difference between the outdoor and indoor air temperatures, from a minimum value of 0% to a maximum of 62% (calculated according to the EN 16798-7 technical standard [30]).
The building model was then calibrated by means of the real energy consumption data, in accordance with the statistical indexes specified by ASHRAE “Guideline 14—Measurement of Energy, Demand, and Water Savings” [31]. Several energy refurbishment measure packages, covering different energy efficiency levels, were analysed in a global refurbishment scenario. These measures included opaque and transparent envelope insulation, the installation of movable shading devices, heat-generator replacement with an air-to-water heat pump that covers the energy demand for space heating, space cooling and domestic hot water, the installation of thermal solar and photovoltaic systems and the retrofitting of the electric lighting system.
An optimal solution was found which satisfied both the nZEB requirements fixed by Italian legislation [14] and the lowest global cost for a building lifetime of 30 years (cost-optimal solution). The cost optimization was performed through the NSGA II algorithm, implemented in DesignBuilder Software [29]. As highlighted by the survey and review conducted by Tian et al. [32], the integration of optimisation techniques and energy simulation tools is an effective approach to design and refurbish buildings.
The optimal package of energy efficiency measures is shown in Table 3 and Table 4 related to the building envelope components and the technical building systems, respectively. The building envelope component measures are those considered in the nZEB* variant of the present analysis (i.e., second point in the bulleted list in Section 2), while the properties of the technical building systems are taken into account in the nZEB variant (i.e., third point in the bulleted list in Section 2).
Table 3.
Properties of the energy efficiency measures for the building envelope.
Table 4.
Properties of the energy efficiency measures for the technical building systems.
The implementation of energy efficiency measures involves a variation of the proportion between the opaque and transparent part of the building envelope. The building insulation was supposed to be achieved by adding 14 cm of insulation (and 2 cm of plaster) to the exterior side of the opaque envelope and by adopting new windows with larger frames (8 cm, with a frame-to-window area ratio of 25%) and with triple glazing (clear plus low-e). Furthermore, the insulation was designed to cover the top and the lateral parts of the external window carcass (5 cm of thickness) in order to avoid thermal bridges. Therefore, the window-to-wall ratio of the nZEB* and nZEB variants is reduced compared to the building in the pre-retrofit configuration; WWR changes from 0.25 to 0.20 and the area of each window changes from 1.8 m2 to 1.5 m2. The glazing has the same thermal and optical properties for both the North-facing and the South-facing windows, while the solar control is supposed to be achieved through the use of movable solar shadings (replacing the existing roller shutters), which are activated on the basis of the operation profile described in Figure 3b.
4. Results
4.1. Thermal Comfort Analysis
The thermal comfort analysis was carried out for the building in both the current configuration (Exist.B) and after the transformation of the building into an nZEB, although limited to the envelope refurbishment (nZEB*). As the adaptive comfort approach was followed and the effect of the technical building systems was therefore not considered, the nZEB variant of the case study (i.e., third point in the bulleted list in Section 2) was excluded from the analysis.
The number of hours when neither heating nor cooling were required in the occupancy period were preliminarily calculated for the analysed storey. These hours are referred to as free floating periods, that is, when the indoor air temperature is between the heating set-point temperature (20 °C) and the cooling set-point temperature (26 °C).
The fraction of free floating time of the total occupancy time for the Exist.B and nZEB* variants is shown in Figure 4 on a monthly basis. The number of free-floating hours is strictly related to the thermal behaviour of the building. By transforming the existing building into a nZEB, the effect of an increase in the thermal insulation level on the indoor air temperature determines a global annual increase in the free-floating time of 118% (560 h in Exist.B and 1219 h in nZEB*). The period in which space heating would be required switches from 53% (Exist.B) to 19% (nZEB*) of the total yearly occupancy time. On the other hand, the hours in which space cooling would be required rises from 23% (Exist.B) to 30% (nZEB*) on a yearly basis.
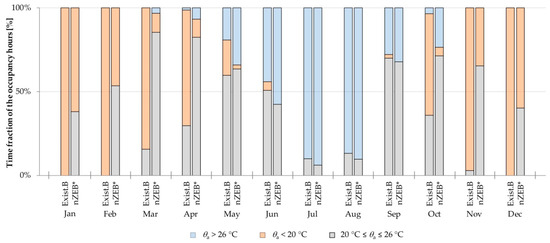
Figure 4.
Comparison of the free floating time between the building in the current condition (Exist.B) and considering the retrofit of the building envelope (nZEB*) on a monthly basis.
The variation of the free-floating time between the ante- and post-retrofit phases is not equally distributed over the analysed period. The increasing of the free-floating period is significant for the intermediate seasons (March and April), while the highest reduction in free-floating time, that is, from 50.7% (Exist.B) to 42.5% (nZEB*), occurs in June.
The free floating period considered for the evaluation of the thermal comfort indexes was chosen on the basis of the results shown in Figure 4. The months in which the free floating time fraction exceeded 50% were selected, excluding the heating period fixed by Italian legislation (i.e., for Torino, from October 15th to April 15th). Thus, the thermal comfort analysis was carried out for the periods from April 16th to May 31st and from September 1st to October 14th. The hourly values of the indoor operative temperature in these periods are plotted in function of the outdoor running mean temperature in Figure 5, for both the Exist.B and the nZEB* variants, and for the North- (Figure 5a) and the South-oriented offices (Figure 5b).
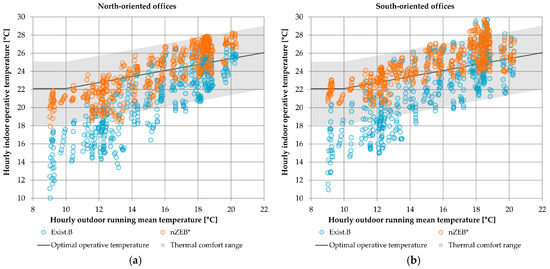
Figure 5.
Thermal comfort analysis results; comparison between the building storey in the current condition (Exist.B) and considering the retrofitting of the building envelope (nZEB*): (a) North-oriented offices; (b) South-oriented offices.
Figure 5a,b shows a high number of points outside the recommended thermal comfort range for the storey under the pre-retrofit condition (grey area in Figure 5). The hours exceeding the range are mostly distributed below the lowest temperature limit. Discomfort in the nZEB* solution is solved in the North-oriented offices. In fact, the hourly indoor operative temperatures of the nZEB* fall almost completely into the comfort temperature range. However, an increase in the warm discomfort periods can be observed for the South-oriented offices, although the temperature is never below the lowest temperature limit.
The thermal comfort indexes that summarise the whole analysed free-floating period are listed in Table 5. The values of the weighted hours of cold discomfort (WHDc) confirm the results of Figure 5; after the building envelope has been retrofitted, WHDc is reduced by 97% in the North-oriented offices and is null in the South-oriented offices. On the other hand, the weighted hours of warm discomfort (WHDw) are more than double those of the uninsulated building. However, overall, PDH is reduced by 69% and WHD by 74% in the South-oriented offices.
Table 5.
Thermal comfort indexes.
4.2. Visual Comfort Analysis
The effect of the energy efficiency measures, related to the building envelope on visual comfort, was mainly assessed through an analysis of daylighting for the building in the current configuration (Exist.B) and for the nearly zero energy building (nZEB*). The energy efficiency measures related to the building envelope in fact introduced a reduction in the window-to-wall ratio (WWR) of 0.25 to 0.20 (25% of reduction), a reduction in the glazing visible transmittance of 0.67 to 0.50 and an increase in the external wall thickness of 44 cm to 60 cm, and this corresponded to a greater obstruction and to a reduction in the horizontal and vertical sight angle.
The average hourly values of daylight illuminance obtained for the whole year’s occupied hours are shown in Figure 6. The data refer to representative North-oriented and South-oriented offices (Figure 6a,b, respectively). The sun shading system was considered in the simulations for the South-facing façade, considering the actual usage profile, while no shading devices were considered for the North-oriented offices. The results demonstrate a consistent reduction in daylighting, over the whole year, for both the South and North-oriented offices. Moreover, despite the presence of the solar shadings, the results highlight an impact of sun penetration on the South side of the building during the winter and mid-seasons.
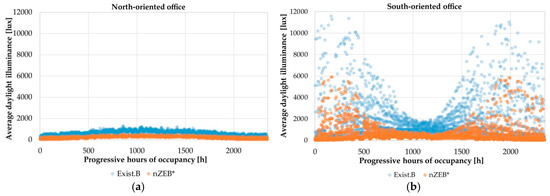
Figure 6.
Comparison of the average hourly values of daylight illuminance for the occupied hours over the whole year between the building in the present configuration (Exist.B) and after retrofitting of the building envelope (nZEB*): (a) North-oriented offices; (b) South-oriented offices.
The reduction in indoor daylighting is also demonstrated by the results of the calculation of the daylighting metrics. The UDI metrics for the Exist.B building and the nZEB* building for the occupied hours over the whole year showed:
- a consistent increase in the fraction of time with illuminance levels below 100 lux (UDI-f), that is, from 6.2% to 17.4% (variation: +177%);
- an increase in the fraction of time with illuminance levels between 100 lux and 500 lux (UDI-s), that is, from 38.7 to 43.4 (variation: +64%);
- a consistent reduction in the fraction of time with illuminance levels between 500 and 2500 lux (UDI-a), that is, from 48.3 to 16.1 (variation: −67%);
- a reduction in the fraction of time with illuminance levels above 2500 lux (UDI-e), that is, from 6.7% to 2.9% (variation: −56%).
Figure 7 shows the UDI metrics for the Exist.B building and the nZEB* building on a monthly basis. It can be observed, from the graph, how the fraction of time with illuminance levels between 500 lux and 2500 lux (UDI-a) is reduced more in the spring and summer periods. The average value for the April to August period is in fact 60% for Exist.B and 17.8% for nZEB*. On the other hand, UDI-e is also reduced during this period, which implies a reduction in high illuminance values that is likely to produce visual and thermal discomfort. Table 6 summarises the UDI values for the North and South-oriented offices.
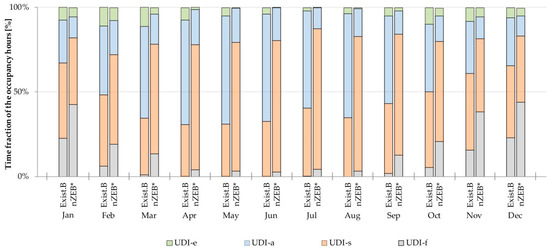
Figure 7.
Comparison of the UDI levels for the occupied hours over the whole year between the building in the present configuration (Exist.B) and after the retrofitting of the building envelope (nZEB*) on a monthly basis.
Table 6.
Comparison of UDI-f, UDI-s, UDI-a and UDI-e between the building in the current condition (Exist.B) and after the retrofitting of the building envelope (nZEB*) for the North and South-oriented offices, on an annual basis.
As far as the calculation of the Daylight Provision is concerned, the sDA500,50% pertaining to the target illuminance varied from 60.2% to 13.1%, while the sDA300,50% pertaining to the minimum target illuminance varied from 97.2% to 35.2%. It can be observed that, in the case of the nZEB* building, the calculated Daylight Provision is below the recommended values reported in EN 17037 (50% for sDA300,50% and 95% for sDA300,50%). The results for the North and South-oriented offices pertaining to the Exist.B and the nZEB* buildings are presented and compared in Table 7.
Table 7.
Results of the daylight provision analysis for the existing building and the nZEB* building.
As far as the artificial lighting is concerned, a new lighting system was designed for nZEB. The new system was designed in order to guarantee comfortable lighting conditions in accordance with the lighting requirements reported in EN 12464-1 [19]. The existing fluorescent luminaires, with manual ON/OFF controls, were replaced by more efficient LED luminaires (nZEB*), and a dimming daylight responsive control system was introduced (nZEB). As can be observed in Table 8, the existing lighting system was not able to reach the target average illuminance (500 lx) and was characterized by low uniformity and a high level of UGR. The new lighting system proposed in the nZEB allows the lighting performance and visual comfort to be increased and the installed LPD to be reduced.
Table 8.
Results of the lighting analysis for the existing and new electric lighting systems.
Figure 8 shows the illuminance distribution for a South-oriented office and the electric lighting usage profile. The different daylight availability between the existing building and nZEB is evident in the electric lighting usage profile. The measures on the envelope lead to an increase in electric lighting use. The introduction of a daylight responsive control in nZEB optimizes the electric lighting usage, with respect to the nZEB* building, with a consequent reduction in the energy consumption for lighting.
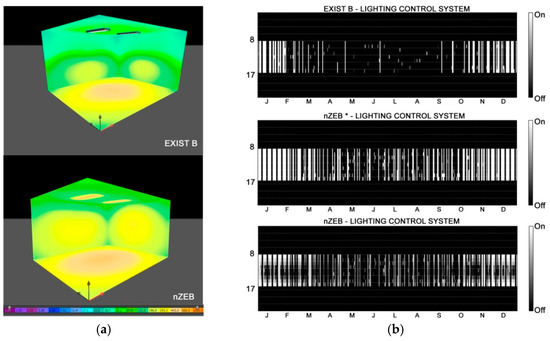
Figure 8.
Existing (Exist.B–nZEB*) and new (nZEB) lighting systems: (a) Comparison of the lighting performance; (b) Comparison of the use profile.
4.3. Energy Performance Assessment
The energy demand for electric lighting for Exist.B, nZEB* and nZEB is presented in Table 9. Compared to the pre-retrofit configuration, the annual electric lighting demand for nZEB* is 68% higher for the office rooms, which are the day-lit spaces of the building, and 4.2% higher for the common spaces (corridors, bathrooms and stairs). The more efficient lighting system and controls in the nZEB building lead to savings of 18% and 39% in the energy used for the lighting of the whole building storey compared to the Exist.B and nZEB* configurations, respectively.
Table 9.
Energy demand for the electric lighting system.
The building energy performance (EP), expressed in terms of both the overall and by service, non-renewable annual primary energy normalized by the conditioned net floor area of the building storey, is reported in Table 10 for the analysed cases. The energy efficiency measures introduced to the building envelope (nZEB*) led to a decrease of 37% for the annual primary energy for heating and an increase of 36% for the EP for lighting, compared to the pre-retrofit configuration (Exist.B). By implementing even more efficient technical systems (nZEB), the annual overall primary energy decreased by 48%, compared to Exist.B, in spite of space cooling and domestic hot water being added to the energy assessment.
Table 10.
Building energy performance (EP).
5. Discussion
The findings of the present research work allow the research questions presented in the Introduction to be answered:
- The transition from a low energy efficiency building to a nZEB with a highly insulated thermal envelope determined greater thermal comfort and a reduced energy demand for space heating. On the other hand, this transition has led to a lower supply of daylight and, consequently, a significant increase in the electric energy demand for lighting. Moreover, an increase in the energy demand for space cooling has been revealed, as a consequence of a higher insulation level. However, the overall energy performance of the nZEB has improved, due to the predominant weight of the heating use on the overall energy balance of this type of building.
- As far as thermal comfort is concerned, the analysis has highlighted that the nZEB configuration is more effective in the North-oriented offices than in the South-oriented ones. In the latter case, cold discomfort is completely absent during the free-floating periods, but the indoor operative temperature rises above the highest acceptable temperature for 8% of the time. The indoor overheating is due to both the higher thermal insulation level and to an ineffective solar shading device operation by the users.As far as the visual comfort is concerned, the study has highlighted a considerable reduction in the Daylight Provision (ΔsDA500,50% = −78%) and in the fraction of time during which daylight alone is able to provide the required target illuminance (UDI-a and UDI-e). The worsening of the indoor daylighting condition is more consistent in the North-oriented offices than in the South-oriented ones: in the latter case, the reduction in daylight illuminances can be beneficial in reducing the fraction of time during which lighting may be excessive (UDI-e). The reduction in the daylight amount available throughout the year is mainly due to the adoption of new windows with slightly larger frames (i.e., reduced glazed area) and low-transmittance glass, as well as the reduction of the window carcass as a result of the thickening of the external insulated walls.
- Despite the daylight reduction, visual comfort conditions can be reached by integrating daylighting with electric lighting, but this implies an increase in the lighting system usage profile. The daylight reduction causes a significant increase (36%) in the annual electric lighting demand for the whole office building. The introduction of a daylight responsive control determined significant reductions of both the energy demand for lighting (39%) and the annual overall primary energy (48%, compared to the existing building), even though the daylight supply is still limited.
6. Conclusions
The overall energy savings that result from retrofitting actions on existing buildings could be much more significant if the envelope retrofitting design strategies were optimised to enhance a sufficient daylight provision and visual comfort, while guaranteeing the same thermal comfort level. It should be noted that insulation is generally advantageous in a winter-dominated site to increase the thermal comfort on a yearly basis. In fact, compared to a uninsulated configuration, the cold discomfort periods in the nZEB decrease much more than the warm discomfort periods increase. Likewise, the increase in the free-floating hours is higher than the increase in the space cooling hours.
Future analysis will be addressed to the optimization of design strategies, and will concern the type and thickness of the insulation, and the choice of glazing and shading technologies. As far as the latter aspect is concerned, the optimisation will be focused on differentiating the optical properties of glass and solar shadings, and on the operation profiles of the shading components in relation to the window orientation, in order to increase daylight penetration for the North-facing rooms and solar control for the South-facing offices. This future work will involve investigating the effect of such design strategies implemented in nZEBs, including cooling-dominated sites and taking into account economic impacts.
Author Contributions
Conceptualization, I.B., A.P. (Anna Pellegrino) and V.C.; Formal analysis, G.D.L. and A.P. (Argun Paragamyan); Funding acquisition, V.C.; Methodology, I.B., G.D.L., A.P. (Argun Paragamyan), A.P. (Anna Pellegrino) and V.C.; Supervision, V.C.; Validation, I.B.; Visualization, G.D.L. and A.P. (Argun Paragamyan); Writing–original draft, I.B., G.D.L. and A.P. (Argun Paragamyan); Writing–review & editing, A.P. (Anna Pellegrino) and V.C.
Funding
The research has been carried out within the “Renovation of existing buildings in NZEB vision (nearly Zero Energy Buildings)” Project of National Interest (Progetto di Ricerca di Interesse Nazionale—PRIN), which was funded by the Italian Ministry of Education, University and Research (MIUR).
Acknowledgments
The authors would like to thank “Città Metropolitana di Torino” for having provided the data on the case study.
Conflicts of Interest
The authors declare no conflict of interest.
References
- European Parliament, Council of the European Union. Directive 2010/31/EU of 19 May 2010 on the Energy Performance of Buildings (Recast). Off. J. Eur. Union 2010, 18, 2010. [Google Scholar]
- Hee, W.J.; Alghoul, M.A.; Bakhtyar, B.; Elayeb, O.; Shameri, M.A.; Alrubaih, M.S.; Sopian, K. The role of window glazing on daylighting and energy savings in buildings. Renew. Sustain. Energy Rev. 2015, 42, 323–343. [Google Scholar] [CrossRef]
- Reinhart, C.F. Effects of Interior Design on the Daylight Availability in Open Plan Offices. In Proceedings of the ACEEE Summer Study of the American Commission for an Energy Efficient Environment, Pacific Grove, CA, USA, 18–23 August 2002. [Google Scholar]
- Mainini, A.G.; Bonatoa, D.; Polia, T.; Speroni, A. Lean strategies for window retrofit of Italian office buildings: Impact on energy use, thermal and visual comfort. Energy Procedia 2015, 70, 719–728. [Google Scholar] [CrossRef]
- Dussault, J.; Gosselin, L. Office buildings with electrochromic windows: A sensitivity analysis of design parameters on energy performance, and thermal and visual comfort. Energy Build. 2017, 153, 50–62. [Google Scholar] [CrossRef]
- Ajaji, Y.; André, P. Thermal comfort and visual comfort in an office building equipped with smart electrochromic glazing: An experimental study. Energy Procedia 2015, 78, 2464–2469. [Google Scholar] [CrossRef]
- Hernández, F.F.; López, J.M.C.; Suárez, J.M.P.; Muriano, M.C.G.; Rueda, S.C. Effects of louvers shading devices on visual comfort and energy demand of an office building. A case study. Energy Procedia 2017, 140, 207–216. [Google Scholar] [CrossRef]
- David, M.; Donn, M.; Garde, F.; Lenoir, A. Assessment of the thermal and visual efficiency of solar shades. Build. Environ. 2011, 46, 1489–1496. [Google Scholar] [CrossRef]
- Xue, P.; Li, Q.; Xie, J.; Zhao, M.; Liu, J. Optimization of window-to-wall ratio with sunshades in China low latitude region considering daylighting and energy saving requirements. Appl. Energy 2019, 233–234, 62–70. [Google Scholar] [CrossRef]
- Pellegrino, A.; Cammarano, S.; Lo Verso, V.R.M.; Corrado, V. Impact of daylighting on total energy use in offices of varying architectural features in Italy: Results from a parametric study. Build. Environ. 2017, 113, 151–162. [Google Scholar] [CrossRef]
- Altan, H.; Mohelnikova, J.; Hofman, P. Thermal and daylight evaluation of building zones. Energy Procedia 2015, 78, 2784–2789. [Google Scholar] [CrossRef]
- Jin, Y.; Xiong, Y.; Wang, L.; Liu, Y.X.; Zhang, Y. Eco-feedback for thermal comfort and cost efficiency in a nearly zero-energy residence in Guilin, China. Energy Build. 2018, 173, 1–10. [Google Scholar] [CrossRef]
- NZEBnet. The Italian Collaborative Platform for Near Zero Energy Building Development. Available online: http://www.nzebplatform.it/ (accessed on 10 January 2019).
- Italian Republic. Inter-Ministerial Decree of 26 June 2015, Applicazione delle Metodologie di Calcolo delle Prestazioni Energetiche e Definizione delle Prescrizioni e dei Requisiti Minimi Degli Edifici. Off. J. Ital. Repub. 2015, 162, 39. [Google Scholar]
- Ballarini, I.; De Luca, G.; Paragamyan, A.; Pellegrino, A.; Corrado, V. Integration of Thermal and Visual Comfort in the Retrofit of Existing Buildings. In Proceedings of the 2018 IEEE International Conference on Environment and Electrical Engineering and 2018 IEEE Industrial and Commercial Power Systems Europe, EEEIC/I and CPS Europe 2018, Palermo, Italy, 12–15 June 2018. [Google Scholar]
- European Committee for Standardization (CEN). EN 16798-1, Energy Performance of Buildings—Part 1: Indoor Environmental Input Parameters for Design and Assessment of Energy Performance of Buildings Addressing Indoor Air Quality, Thermal Environment, Lighting and Acoustics—Module M1-6; CEN: Brussels, Belgium, 2019. [Google Scholar]
- EnergyPlus. Available online: https://energyplus.net/ (accessed on 10 January 2019).
- European Committee for Standardization (CEN). EN ISO 7730, Ergonomics of the Thermal Environment—Analytical Determination and Interpretation of Thermal Comfort Using Calculation of the PMV and PPD Indices and Local Thermal Comfort Criteria; CEN: Brussels, Belgium, 2005. [Google Scholar]
- European Committee for Standardization (CEN). EN 12464-1, Light and Lighting. Lighting of Work Places. Part 1: Indoor Work Places; CEN: Brussels, Belgium, 2011. [Google Scholar]
- Mardaljevic, J.; Heschong, L.M.; Lee, E. Daylight metrics and energy savings. Lighting Res. Technol. 2009, 41, 261–281. [Google Scholar] [CrossRef]
- Nabil, A.; Mardaljevic, J. Useful Daylight Illuminance: A New Paradigm to Access Daylight in Buildings. Lighting Res. Technol. 2005, 37, 41–59. [Google Scholar] [CrossRef]
- IES Daylight Metrics Committee. IES Spatial Daylight Autonomy (sDA) and Annual Sunlight Exposure (ASE); Report LM-83-12; Illuminating Engineering Society: New York, NY, USA, 2012. [Google Scholar]
- European Committee for Standardization (CEN). EN 17037, Daylight in Buildings; CEN: Brussels, Belgium, 2018. [Google Scholar]
- Dialux EVO Software. Available online: https://www.dial.de/en/dialux/ (accessed on 10 January 2019).
- DIVA Software. Available online: https://daysim.ning.com/ (accessed on 10 January 2019).
- European Committee for Standardization (CEN). EN ISO 52000-1, Energy Performance of Buildings—Overarching EPB Assessment—Part 1: General Framework and Procedures; CEN: Brussels, Belgium, 2017. [Google Scholar]
- EnergyPlus Weather Data. Available online: https://energyplus.net/weather (accessed on 10 January 2019).
- Corrado, V.; Ballarini, I.; De Luca, G.; Primo, E. Riqualificazione Energetica Degli Edifici Pubblici Esistenti: Direzione nZEB. Studio Dell’edificio di Riferimento uso Uffici Della PA Nella Zona Climatica Nord Italia (Zona E: 2100<GG≤3000); Report RdS/PAR2017; in press. (In Italian)
- DesignBuilder Software. Available online: https://www.designbuilder.co.uk/ (accessed on 10 January 2019).
- European Committee for Standardization (CEN). EN 16798-7, Energy Performance of Buildings—Ventilation for Buildings—Part 7: Calculation Methods for the Determination of Air Flow Rates in Buildings Including Infiltration (Modules M5-5); CEN: Brussels, Belgium, 2017. [Google Scholar]
- American Society for Heating Refrigerating Air-conditioning Engineers (ASHRAE). Guideline 14—Measurement of Energy, Demand, and Water Savings; ASHRAE: Atlanta, GA, USA, 2014. [Google Scholar]
- Tian, Z.; Zhang, X.; Jin, X.; Zhou, X.; Si, B.; Shi, X. Towards adoption of building energy simulation and optimisation for passive building design: A survey and a review. Energy Build. 2018, 158, 1306–1316. [Google Scholar] [CrossRef]
© 2019 by the authors. Licensee MDPI, Basel, Switzerland. This article is an open access article distributed under the terms and conditions of the Creative Commons Attribution (CC BY) license (http://creativecommons.org/licenses/by/4.0/).