Article

Advantages of Minimizing Energy Exchange Instead of Energy Cost in Prosumer Microgrids

by
Eva González-Romera
1,*,
Mercedes Ruiz-Cortés
1,
María-Isabel Milanés-Montero
1,
Fermín Barrero-González
1,
Enrique Romero-Cadaval
1,
Rui Amaral Lopes
2,3 and
João Martins
2,3
1
Electrical, Electronic and Control Engineering Department, University of Extremadura, 06006 Badajoz, Spain
2
Faculty of Sciences and Technology—NOVA, University of Lisbon, 2829516 Caparica, Portugal
3
Center of Technology and Systems (CTS)—UNINOVA, 2829516 Caparica, Portugal
*
Author to whom correspondence should be addressed.
Energies 2019, 12(4), 719; https://doi.org/10.3390/en12040719
Submission received: 22 January 2019 / Revised: 18 February 2019 / Accepted: 19 February 2019 / Published: 22 February 2019

Abstract

:
Microgrids of prosumers are a trendy approach within the smart grid concept, as a way to increase distributed renewable energy penetration within power systems in an efficient and sustainable way. Single prosumer individual management has been previously discussed in literature, usually based on economic profit optimization. In this paper, two novel approaches are proposed: firstly, a different objective function, relative to the mismatch between generated and demanded power, is tested and compared to classical objective function based on energy price, by means of a genetic algorithm method; secondly, this optimization procedure is applied to batteries’ coordinated scheduling of all the prosumers composing a community, instead of single one, which better matches the microgrid concept. These approaches are tested on a microgrid with two household prosumers, in the context of Spanish regulation for self-consumption. Results show noticeably better performance of mismatch objective function and coordinated schedule, in terms of self-consumption and self-sufficiency rates, power and energy interchanges with the main grid, battery degradation and even economic benefits.

1. Introduction

Within a context of reinforcing consumers’ roles in the energy system and improving energy efficiency in Europe [
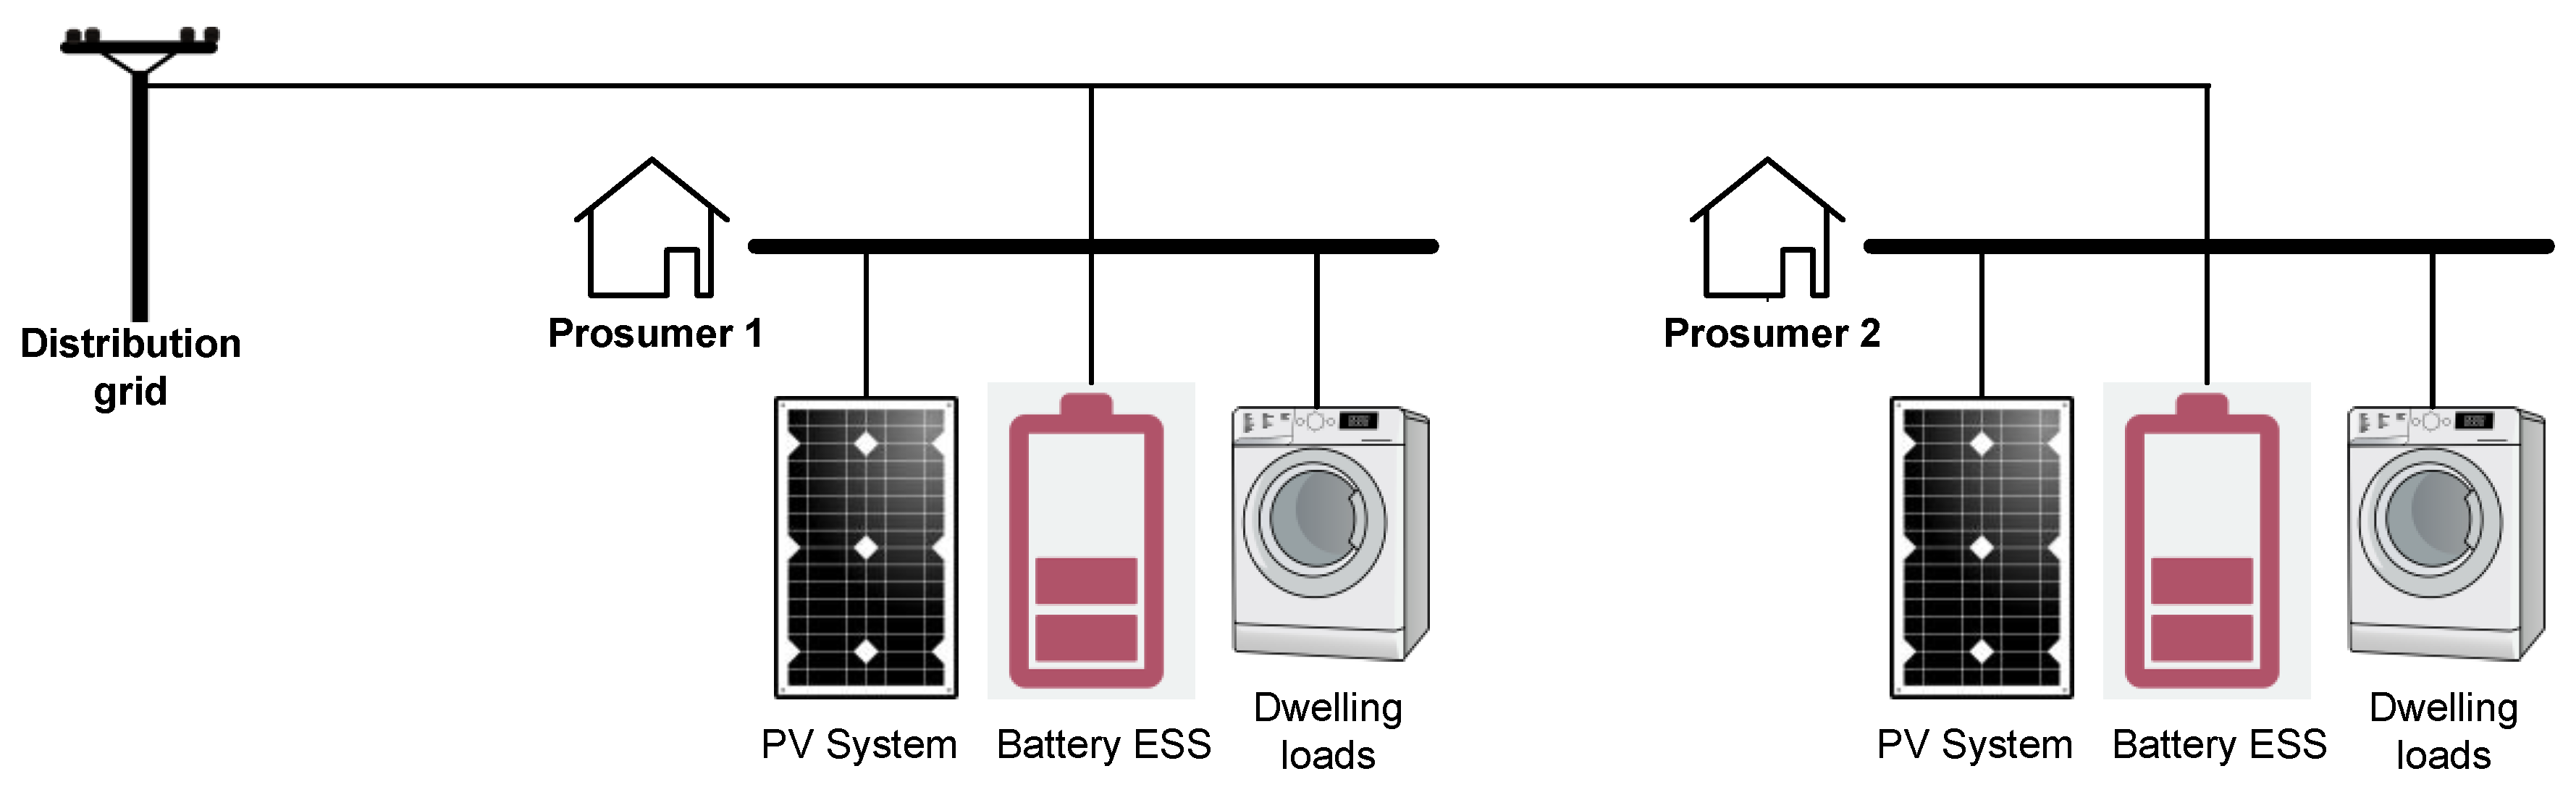
1], the concept of prosumer has become common in the power system context. A prosumer is a consumer with the ability of producing electric energy to be either self-consumed or injected into the grid. A group of prosumers connected and coordinated to manage their energy resources are considered to be a microgrid [2]. The microgrid can be either isolated or grid-connected, in which energy management and economic profitability are the main targets.
Many studies can be found in literature analyzing microgrids’ financial feasibility and the correct sizing of their respective Distributed Energy Resources (DERs) [3,4]. In most of the published works the main objective of the microgrid energy management system is to achieve the highest possible economic benefit by minimizing its operational costs [5,6]. Generation costs [6] and market prices, for the purchased/sold energy [5], are used to define optimization techniques’ objective functions. However, economic incentives and additional costs have a great importance in the microgrids’ financial sustainability and they must be considered in their design and operation [3]. Incentives are due to advantages of self-consumption improvement, that lie on empowering consumers by means of their participation in energy management programs, encouraging smarter consumption patterns, reducing peak demand and energy costs, decreasing transmission losses, due to the local generation and consumption, and contributing to finance energy transition [7].
Household prosumers usually count on locally available renewable energy generation, which, in most cases, is enabled by photovoltaic (PV) systems located at the dwellings [8]. In many countries, the decreasing cost of PV system devices has led to a grid-parity in self-generated PV energy in comparison to energy purchased from the grid. In this context, self-consumption achieves economic sustainability, even without financial support from governments.
Under deregulated electricity markets, extended all over Europe, general costs of power systems for building and operating infrastructures are covered by network tariffs and taxes. Network tariffs can be composed by two possible components: volumetric tariffs, according to which consumers pay per unit of purchased energy (€/kWh); and capacity tariffs, applied to the power capacity contracted with the energy provider (€/kW). In both cases tariffs can be classified as flat type, variable with consumption or capacity level and time-of-use type (different tariffs in peak/off-peak hours) [7]. Higher volumetric tariffs motivate for demand reduction, by means of energy efficiency and self-consumption. On the other hand, predominant capacity tariffs lead to peak-shaving.
Regarding energy prices, they are based on a spot market where a clearing price is obtained by the point at which the supply and demand curves meet, according to the European algorithm EUPHEMIA [9]. This market price establishes both purchase and sale prices for consumers and producers, respectively. In addition, the undeniable interest to increase the penetration of energy conversion systems based on renewable primary energy resources and the related motivation to improve self-consumption ratios has led to several promotion policies in different countries. An interesting classification of common incentives to introduce renewable energy resources can be found in [10]. According to this work, promotion policies can be focused on investment or on energy generation, but the most common type of policies in Europe are related to feed-in tariffs (FIT). There are two types of FIT systems: fixed and premium [7,10]. The first one is independent on the electricity market price, facilitating the assumption of investment risks, whereas the second one is an overprice above market price, with the advantage of being attached to the market behavior and thus avoiding excessive remuneration for producers and market distortion [7].
In the case of surplus energy fed into the grid, from prosumers using renewable energy resources, there is not a common understanding in the different European countries about the promotion policies. While many countries support investment or establish FIT frameworks, others prefer net metering approaches. Under this concept, the electricity excess injected into the grid can be later used during higher consumption hours, when self-generated energy is not sufficient [7]. Therefore, the main grid acts as a backup or a virtual storage system to manage the prosumers’ energy surplus/deficit. Since energy price may be different during the hours of the day, and it is not considered in net-metering framework, this approach is commonly not favorable from the power system point of view and it is limited to small-size systems. As a consequence, some countries apply the so-called net-billing, which calculates the value of the energy fed into the grid at wholesale price to be used as a credit to purchase energy at other time period [7]. A survey of policies in European countries can be found in [7], although some of them have experienced variations during the last years.
Promotion policies make sense while immature technologies are trying to be introduced or while their marginal costs, when compared to conventional generation systems, do not allow them to participate in a competition market with equal conditions. The natural trend for any promotion policy is to converge into a market approach when grid-parity has been reached.
The case of Spain has been singular both in renewable energy, mainly PV, and in self-consumption promotion policies. The installation of renewable technologies and, especially, PV plants, was strongly boosted from 2007 to 2012, under high incentives in the form of fixed and premium FIT. In 2012 a high so-called “tariff-deficit” was reached which led to the extinction of support schemes for new plants and to changes in remuneration for existing plants, causing financial issues to many investors [11]. PV power plants were primarily promoted during the former years 2007 and 2008 which led to an extraordinary proliferation of this kind of generation systems and improved the experience and background of Spanish renewable energy companies all over the world. Since 2012, new PV power plants can only compete for extra economic support under a capacity-based aid to recover investment [12]. Regarding self-consumption, former regulation [13] stablished a specific cost to be paid as a consequence of self-consumed energy. Only low-voltage low-power prosumers who did not feed surplus energy into the grid were exempted from paying that specific cost. Additionally, self-consumption installations and energy could not be shared among prosumers, preventing the development of prosumers communities. This policy strongly discouraged the investment in new self-consumption installations. The situation has recently changed by means of a new law [14], which exempts self-consumed energy from paying any extra cost regardless of whether the prosumer feeds the excessive energy into the grid or not. Moreover, energy management can already be shared within a community. Therefore, in the absence of further regulation, current economic situation for Spanish prosumers can be summarized as the possibility of purchasing or selling energy from/to the power system at market price (no energy-based aids are planned for generated energy). In addition, payment of network tariffs for energy fed into or demanded from the grid must be paid, but no extra costs for self-consumed energy. Also, either individual or shared management are possible.
In order to maximize the advantage of self-consumption for end users, flexibility to match generated energy with demanded one is essential. This flexibility can be achieved by means of two possible mechanisms: demand-side response (DSR) and/or energy storage systems (ESS). The first one had a wide attention in literature [15,16]. As household electricity demand has a limited potential to apply restrictive DSR programs, the work described in this paper is focused on ESS usage instead, whose operation is scheduled according to different targets.
The role of ESS in microgrids is usually related to peak shaving [3], leading to a reduction of distribution system costs, which are based on the available power capacity instead of the volume of circulating energy. Other classical target is to mitigate fluctuation of PV generation [8] or other intermittent renewable energy source. ESS scheduling with economic target within a microgrid has also been discussed in literature [5,6,17,18]. Choi et al. [5] schedule a unique ESS to minimize traded energy cost based on energy price. In [6], the authors schedule batteries aiming at microgrid energy generation cost minimization, with no grid interchange. Both energy sale/purchase prices and operation and maintenance (O&M) costs of DERs are used in the optimization process in [17], although O&M costs of every DER (both renewable generation and ESS) are considered equal in this paper. Depreciation and environmental costs are also added to objective function in [18], being their values obtained from previous published papers. In all these works optimal ESS scheduling is performed and evaluated considering energy price as the only economic parameter to be considered in the interconnection of the microgrid with the main grid, i.e., to authors’ knowledge, no previous work considers network tariffs to evaluate the economic advantages of an ESS scheduling method.
On the other hand, the coordination of several storage systems, owned by different prosumers, is not usually considered within a microgrid’s common energy management strategy. The concept of “peer-to-peer (P2P)” supply [19,20] explains energy sharing within a community of prosumers. However, in these works, P2P supply is provided only by the generation surplus, without the involvement of stored energy. A wide review of possibilities of grouping prosumers as a community can be found in [21], which reveals that the common objectives of these communities are to maximize distributed production, to minimize losses or to optimize revenues. According to [21,22], further research is required in the area of prosumers’ objectives and motivations.
The main goal of the present work is to evaluate the advantages of scheduling microgrid’s ESS with an objective function based on minimizing generation-demand mismatch within the microgrid (thus minimizing energy exchange with the main grid) when compared to classical cost minimization. Benefits are observed for both prosumers, with PV generation and ESS, and the main grid. The case study is focused on a community of prosumers under Spanish regulation. Besides the expected advantages related to self-consumption, self-sufficiency and peak shaving, also economic benefits are achieved using the proposed objective function, because it reduces the prosumers electricity bill, at least in the absence of energy-based incentives, and better preserves battery lifetime. The economic evaluation of a scheduled optimization process that does not consider economic variables in the objective function is a novel contribution of this work. Furthermore, the study has been developed aiming to prove that cooperation between community prosumers, under the concept of microgrid, improves the global economic benefit for the community, compared to an individual management.
The paper is organized as follows: Section 2 describes the case study, the optimization methodology and the objective functions tested. Results are shown in Section 3. Finally, Section 4 discusses results and summarizes the conclusions.

2. Materials and Methods

2.1. Microgrid under Study

The microgrid considered in this study consists of two dwellings with typical household electrical devices, both equipped with a PV system and a battery based ESS (see Figure 1).
Starting from measured values in real households, demand of each house has been established considering typical residential appliances (lighting, air conditioning, washing machine, etc.) and a 4.6 kW peak power house (very common in Spanish dwellings). According to Spanish technical regulations the line capacity must be higher than the peak demand. House number 1 presents a higher demand during the 24 h of the day under study. Both houses are equipped with the same generation system and ESS (a 4 kW-rated power PV system and a battery with 6 kWh capacity and 2/−2 kW maximum charging/discharging power). Due to the proximity of the dwellings and the same characteristics of the PV systems, the same irradiation (based on climate data from a nearby weather station) and the same PV production has been assumed for both houses. Hourly average active power, generated and demanded, is shown in Figure 2 for both houses. The profiles from Figure 2 are used by the EES energy management system, assumed as a previous day forecast. One-hour resolution has been chosen not only for being an adequate resolution for one-day-horizon demand and generation forecasting, but also due to the time resolution of published market energy prices. In the scenario shown in Figure 2 one of the households has excess generated energy whereas the other one presents excess demand compared to the produced energy. Note that neither demanded power nor generated power exceeds peak demand (4.6 kW) and therefore, power lines’ capacity is not exceeded.

2.2. Optimization Process for the Battery Scheduling

In this paper, the charging/discharging power of both batteries is scheduled with different target objectives, both in individual and in cooperative mode. The optimization process is performed using a genetic algorithm (GA) technique, as it was discussed in authors’ previous work [23].
Generation and demand hourly power forecasted values (see Figure 2) of a prosumer are collected in 24-element vectors G (t) and D (t), t = 1, 2, …, 24 h, respectively. In cooperative mode these vectors collect the sum of both prosumers. A 24-element vector P B i ( t ) , t = 1, 2, …, 24 h, is composed of the dispatched active power schedule of prosumer’s battery i. In cooperative mode all batteries within the community are considered. The adopted sign convention is positive for charging and negative for discharging. Elements P B i ( t ) (hourly dispatched active power scheduled for every battery) are the values to be scheduled according to the optimization process; therefore, they will be the result of the GA technique. Original demand D (t) is then modified to D m o d ( t ) , according to the battery contribution, as shown in Equation (1).
D m o d ( t ) = D ( t ) + i P B i ( t ) .
Since batteries’ charging/discharging efficiency rates present similar values, their effect has been neglected in this work.
The GA optimization process (described in [23]) finds the best solution for the elements P B i ( t ) . If an individual prosumer constitutes the objective to be optimized, the number of values to be obtained is 24. In a coordinated mode batteries of both prosumers are scheduled jointly, generating a vector composed of concatenated strings P B 1 ( t ) and P B 2 ( t ) . This algorithm was programmed in MATLAB® to minimize the objective function subjected to a set of constraints, as explained below.
As previously pointed out, economic profit of prosumers is the most common optimization target addressed in literature. Energy cost is the preferred parameter to weight the scheduled battery power and, consequently, the purchased/sold energy from/to the main grid. Although this cost is not, by its own, sufficient to perform a complete optimization of the energy bill, the complexity of tariffs, premiums and prices encourages to adopt this value as weight for the objective function to be reached. As a consequence, in this work the price of traded energy is used to perform a first approach for the objective function. As discussed earlier, the purchased energy is usually paid at market prices, while the sold energy suffers from strong variations depending on the country. In Spain, currently, neither premiums nor fixed FIT are planned for energy sold by prosumers, therefore market price is also considered as the price for the sold energy. Final hourly price for each hour of an average day (average value for a day in a whole year, between 1 December 2017 and 30 November 2018 [24]) is collected in the 24-element vector Pr(t) and shown in Figure 3.
This preliminary approach for the objective function is called cost objective function (COF) and is determined by Equation (2), aiming to minimize energy cost where f cost ( t ) denotes the amount of money to be paid for the purchased energy minus the income received for the sold energy, at every hour t = 1, 2, …, 24. The contribution of the batteries is included in the vector D m o d ( t ) , defined in Equation (1). Since PV generation and battery ESS O&M costs are not clearly related to their power scheduling, they have not been considered in the objective function:
f cost ( t ) = P r ( t ) [ D m o d ( t ) G ( t ) ] .
In contrast, the novel objective function, proposed in this paper, is called mismatch objective function (MOF) and tries to improve not only the economic profit, but also the system efficiency (lower losses) and the exploitation of the DER. It intends to minimize the mismatch between generation and modified demand at every hour, i.e., the power in the interconnection with the main grid as shown in Equation (3). The square operator is introduced to penalize the highest errors. This objective function implicitly pursues self-consumption and self-sufficiency rates maximization, peak shaving, energy losses minimization in the distribution grid and network tariff costs reduction:
f m i s m a t c h ( t ) = [ D m o d ( t ) G ( t ) ] 2 .
A set of constraints is added to the algorithm in order to assure safe performance and to prevent battery’s early degradation. These constraints are the same in both optimization processes:
  • State of charge (SoC) range: Battery manufacturers recommend keeping the SoC (percentage of charge related to the rated capacity) within a safe operational range [SoCmin, SoCmax]. Dynamic equation for SoC calculation is shown in Equation (4), under the assumption of unity charging/discharging efficiency. A discretization of Equation (4) is done in this constraint, which is shown in Equation (5), and minimum and maximum limits are assumed to be 20% and 100% respectively, taking [25] as reference:
    SoC i ( t ) = SoC i ( 0 ) + 1 C n o m i 0 t P B i ( t ) d t ,
    SoC m i n i SoC i n i t i + t = 1 24 P B i ( t ) Δ t C n o m i SoC m a x i .
For each battery i, C n o m i is the nominal capacity (6000 Wh for both prosumers) and SoC i n i t i is the SoC at the beginning of the day. In this study initial SoC of 83% and 50% have been considered for prosumers’ batteries 1 and 2, respectively. The time interval Δt is 1 h.
  • Charge/discharge power: The charging/discharging power is bounded by the battery specifications and by the battery’s power electronics converter rated power. Equation (6) describes this constraint, in which P max , d i s i and P max , c h i are the maximum allowed power for discharging and charging (−2000 W and 2000 W have been respectively assumed).
    P max , d i s i P B i ( t ) P max , c h i .
  • Power gradient limitation: It is desirable that batteries’ SoC presents a smooth variation along the day. Abrupt changes in SoC along with frequent alternating between charge and discharge modes negatively affect the battery lifetime [26,27]. Therefore, an additional constraint has been included to avoid large power oscillations between two consecutive hours. A maximum power gradient ΔPB is considered with that purpose, as presented in Equation (7). A value of 300 W has been selected for ΔPB, obtained from the maximum difference observed between consecutive hours in a daily profile averaged for a year in a real house.
    | P B i ( t ) P B i ( t + 1 ) | Δ P B .
The ability of GA to search for the solution in the entire solution space and to find the global optimum solution even in non-convex, non-linear and non-smooth optimization problems has led to its use in this type of optimization problems [23,28]. This evolutionary algorithm emulates natural selection process. Starting from a random initial population of possible solutions (chromosomes) within a proper range (−2000 to 2000 W for each battery in this case study) of the solution space, GA iteratively creates new populations (children) according to their fitness for the objective function. Stopping criteria related to fitness value and computation time are included to finish the optimization procedure.
In this case study, chromosomes consist of 24 or 48 values of PB, depending on whether individual or coordinated scheduling is being performed. The final solution will consist in the set of hourly battery charging/discharging power values which minimizes the objective function subject to defined constraints.

3. Results

The performance of the proposed algorithm with the aim of comparing the different objective functions and evaluating the advantages of prosumers’ cooperation is quantified by means of usual indicators in literature. Self-consumption (SC) and self-sufficiency (SS) rates are well known indicators and they are presented in Equations (8) and (9), respectively. In both cases, the numerator computes the load instantly matched by the local production, using the considered batteries. Therefore, SC describes the percentage of on-site generation that is instantly consumed by the prosumer and SS the percentage of demand instantly satisfied by the on-site generation [29]:
SC = t = 1 24 m i n [ D m o d ( t ) , G ( t ) ] t = 1 24 G ( t ) ,
SS = t = 1 24 m i n [ D m o d ( t ) , G ( t ) ] t = 1 24 D ( t ) .
Other technical indicators to evaluate the results are the power interchanged with the main grid Pgrid, obtained from the nodal (in individual operation) or the whole system (coordinated operation) power balance, computed by Equation (10), and the accumulated energy import Eimp and export Eexp during the whole day, computed by Equations (11) and (12) respectively. One must note that Pgrid should not be higher than the line capacity (4.6 kW for each dwelling or 9.2 kW for the common supply line):
P g r i d ( t ) = D m o d ( t ) G ( t ) ,
E i m p = t = 1 24 P g r i d ( t ) P g r i d ( t ) > 0 ,
E exp = t = 1 24 P g r i d ( t ) P g r i d ( t ) < 0 .
Finally, economic indicators are used to evaluate the profitability of the obtained solution for the prosumers. Based on the energy trading prices, Costbnt denotes the energy cost before network tariffs in €/day, and is calculated by Equation (13):
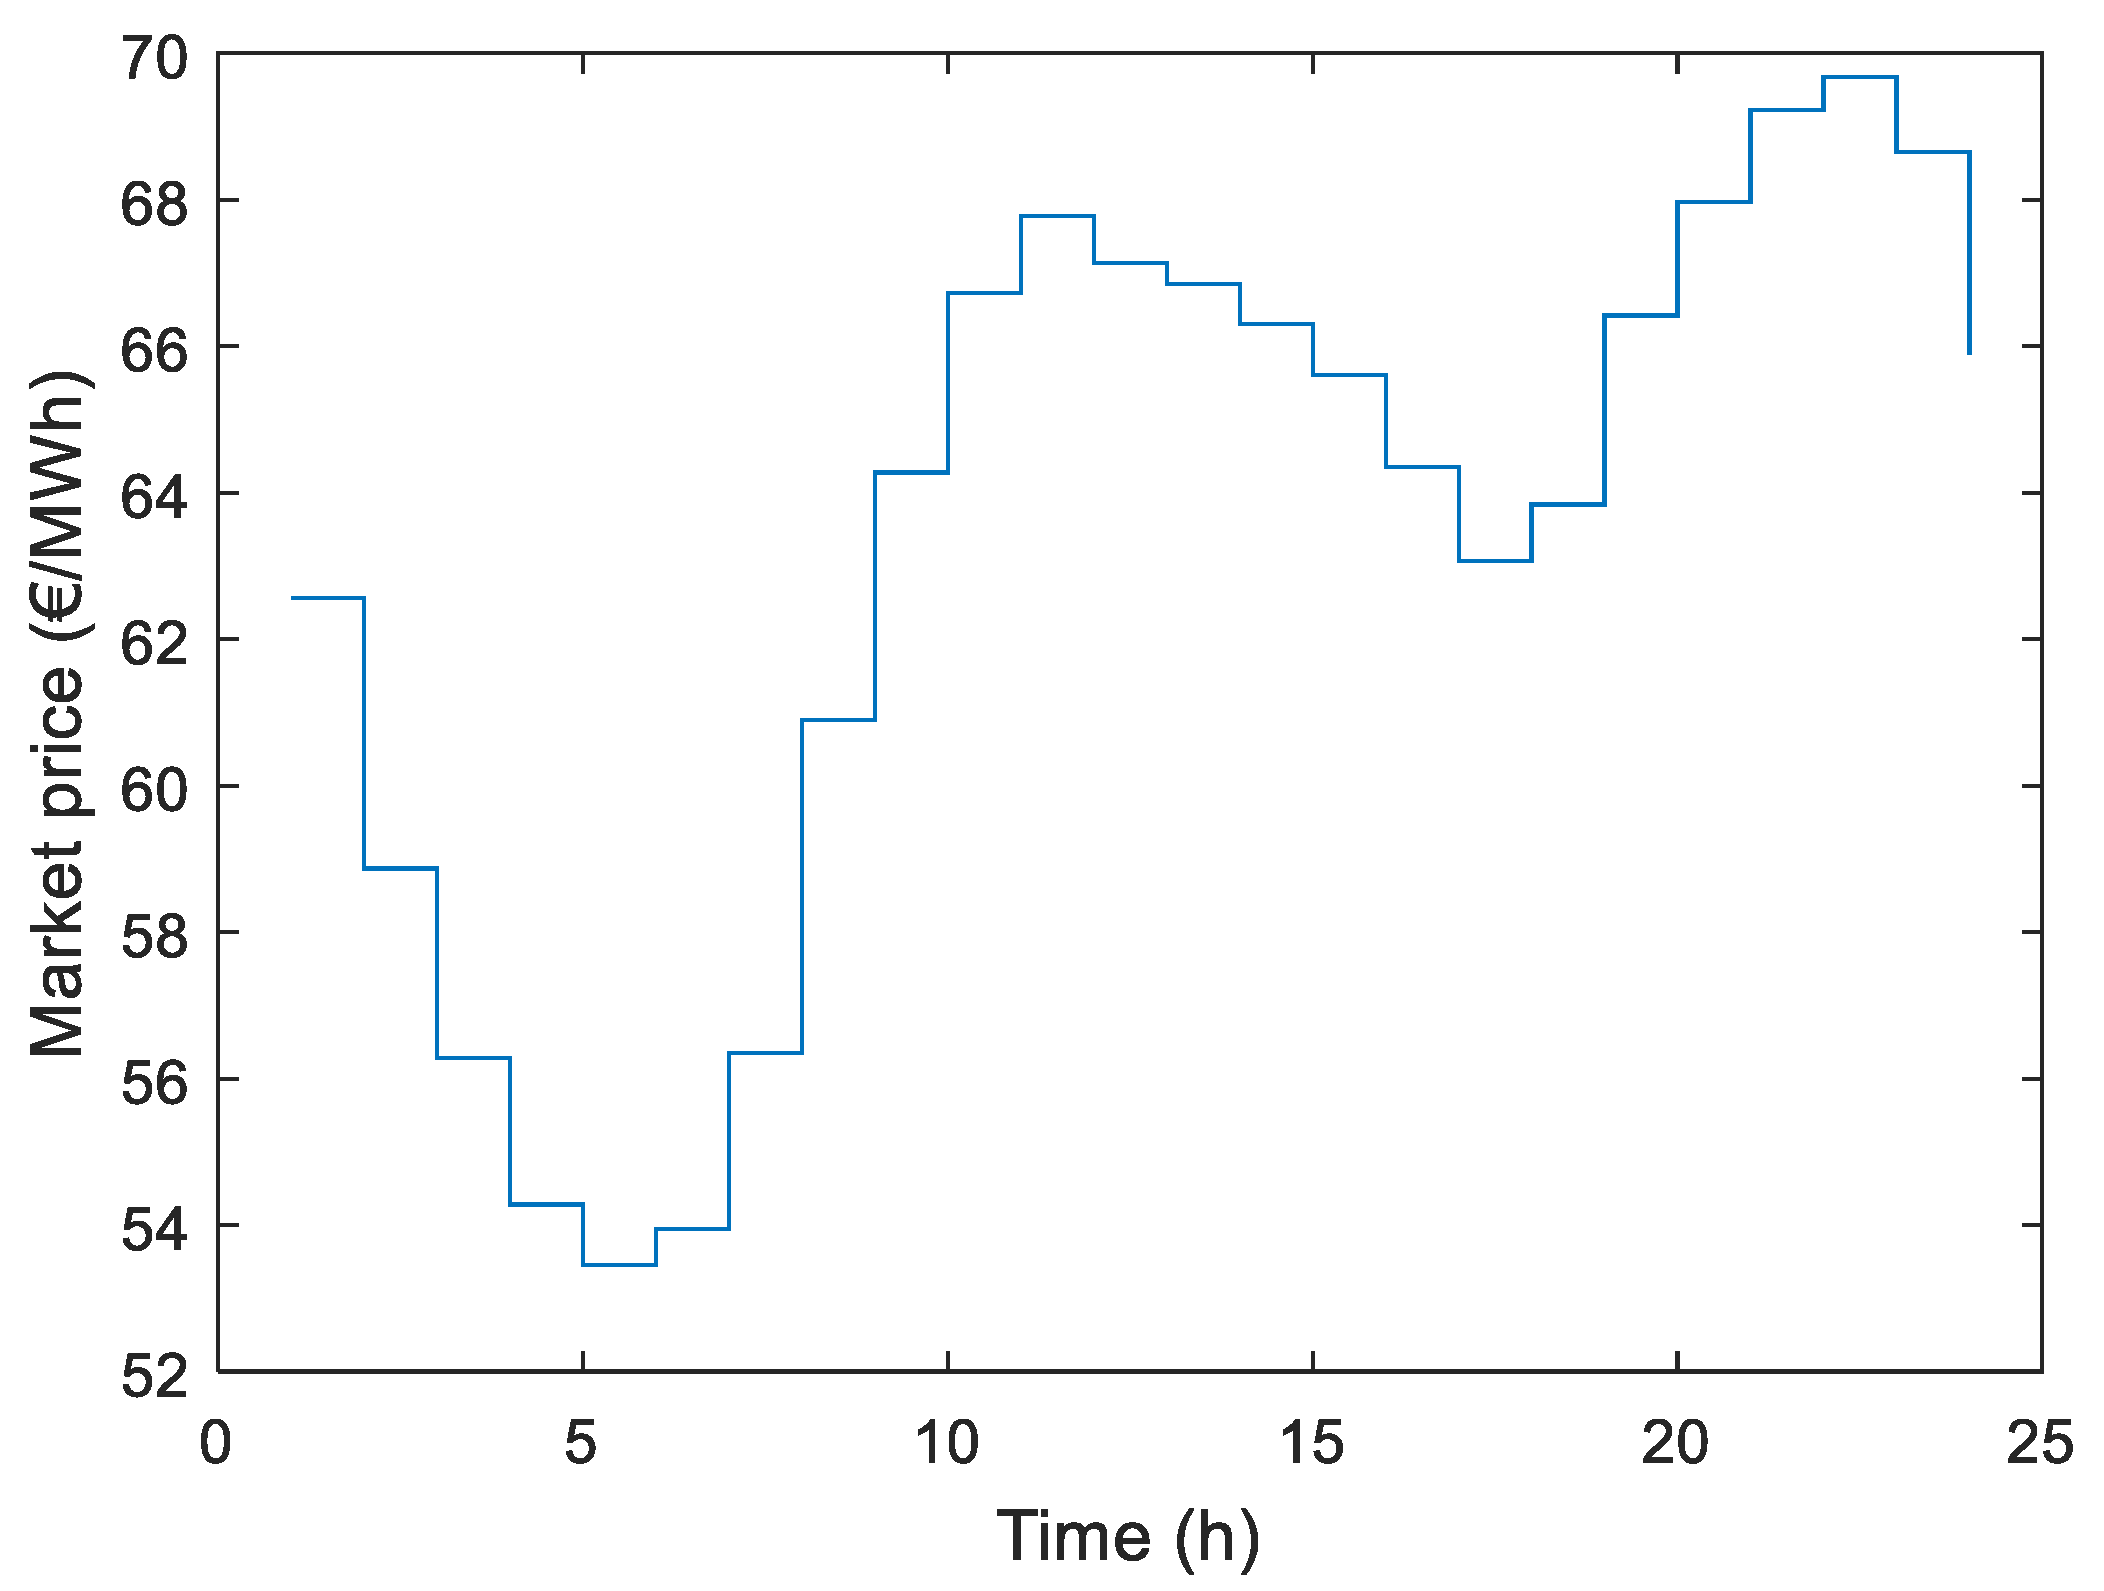
C o s t b n t = t = 1 24 P r ( t ) P g r i d ( t ) .
Pr(t) is the set of hourly prices of the Spanish Electricity Market (Figure 3). According to Pgrid sign, the cost is positive when the energy is imported.
Network tariffs have two components for consumers in Spain: a capacity-based term, Consumer Power Tariff (CPT, in €/kW·year), which is multiplied by the contracted power (CP), and a volumetric term, Consumer Energy Tariff (CET, in €/kWh). On the other hand, a volumetric term is only established for producers, Producer Energy Tariff (PET, in €/MWh). Values for these tariff terms have been obtained from Spanish regulation for low voltage consumers, with the so-called 2.0 A tariff [30], and for any producers [31], being CPT = 38.043426 €/kW·year, CET = 0.044027 €/kWh and PET = 0.5 €/MWh.
CP can be selected as any value of power, rounded by multiples of 0.1 kW, over the maximum demanded power [14]. In each case, CP (kW) has been obtained for the day under study, starting from the maximum absolute value of Pgrid.
These values have been used to calculate the daily cost of the electric energy after network tariffs Costant by means of Equation (14):
C o s t a n t = CPT CP 365 + CET | E i m p | + PET | E exp | .
The mentioned indicators are used to evaluate the performance of both tested objective functions (cost objective function COF and mismatch objective function MOF), to compare them with each other and with the case without ESS. Firstly, individual scheduling for each dwelling is considered, and afterwards, results are compared to the case where coordinated community management is considered.

3.1. Individual Schedule of Batteries

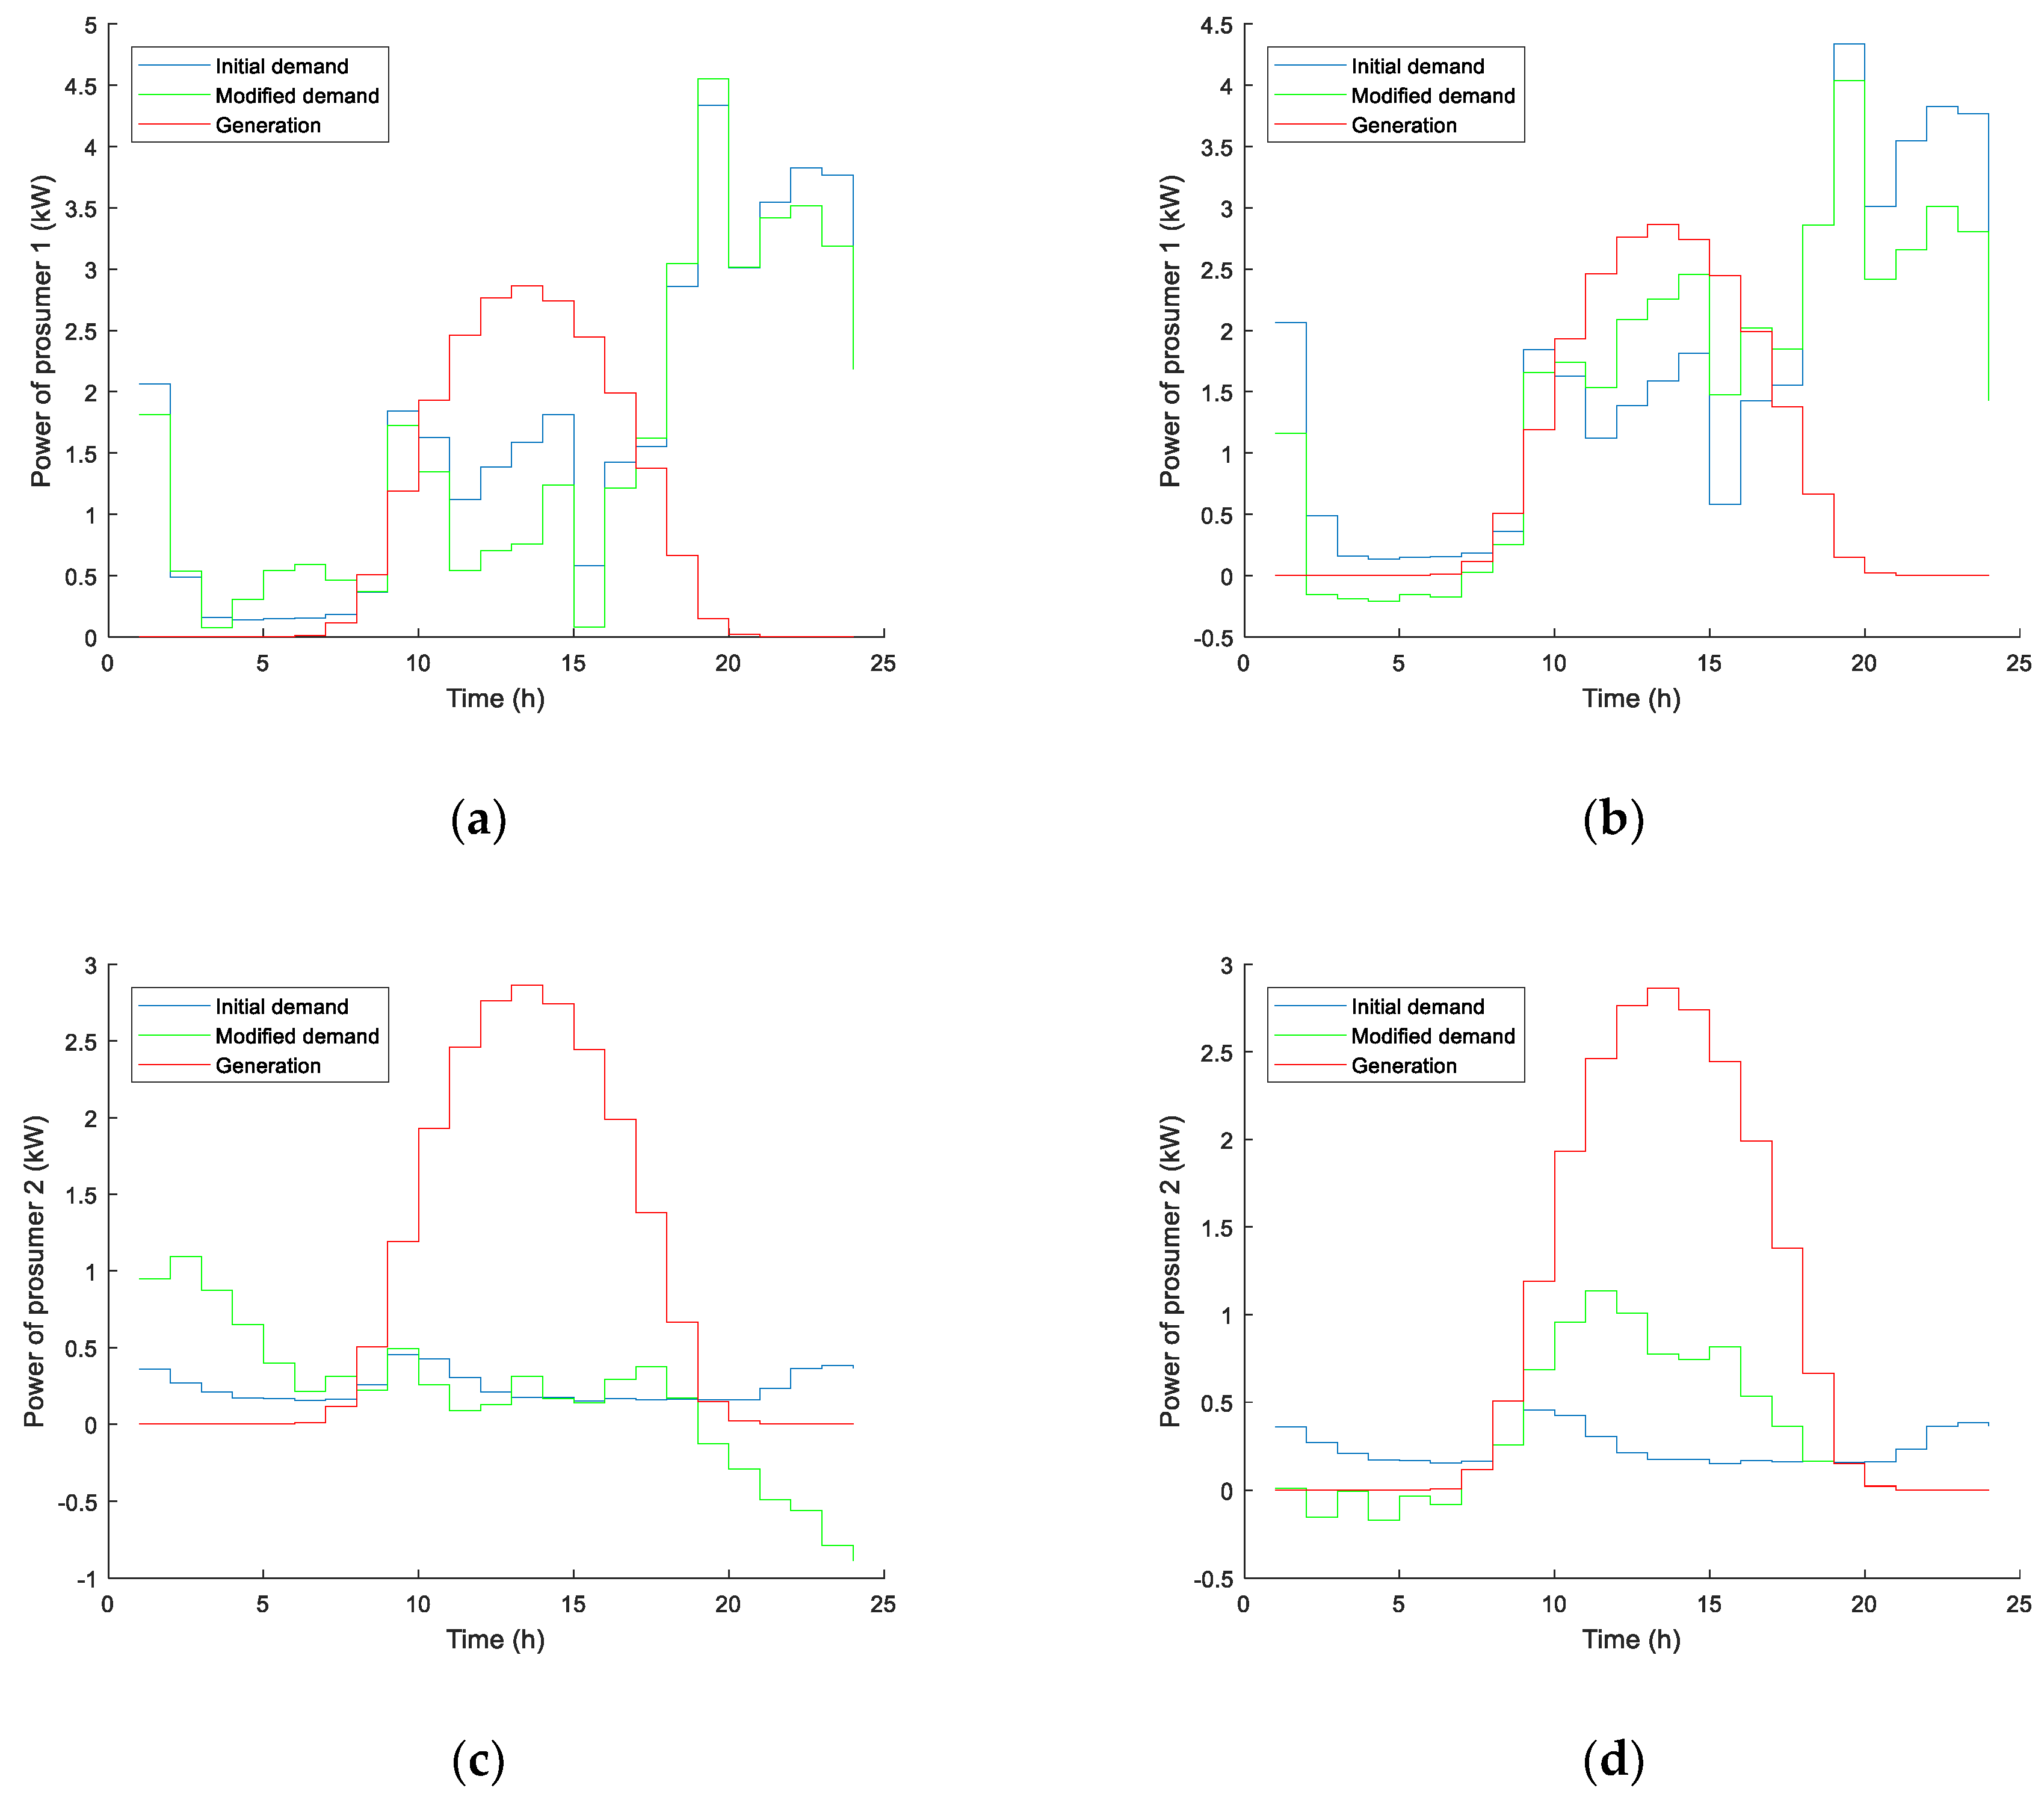
Taking into account the objective functions presented in Section 2, Figure 4 shows generation, initial demand and demand modified by the action of the batteries for both prosumers.
Table 1 shows the SC and SS indicators obtained with each of the proposed objective functions and the situation without ESS.
As it was expected, COF leads prosumers to buy energy at night (when the price is low) and to avoid buying or even to sell energy at evening peak price hours. This procedure has economic advantages in energy cost but penalizes SC and SS rates, as shown in Table 1. These indicators are even worse with COF than those obtained without ESS in the households. On the contrary, MOF significantly improves SC and SS of both prosumers, since its main target is to match generated and demanded power as much as possible.
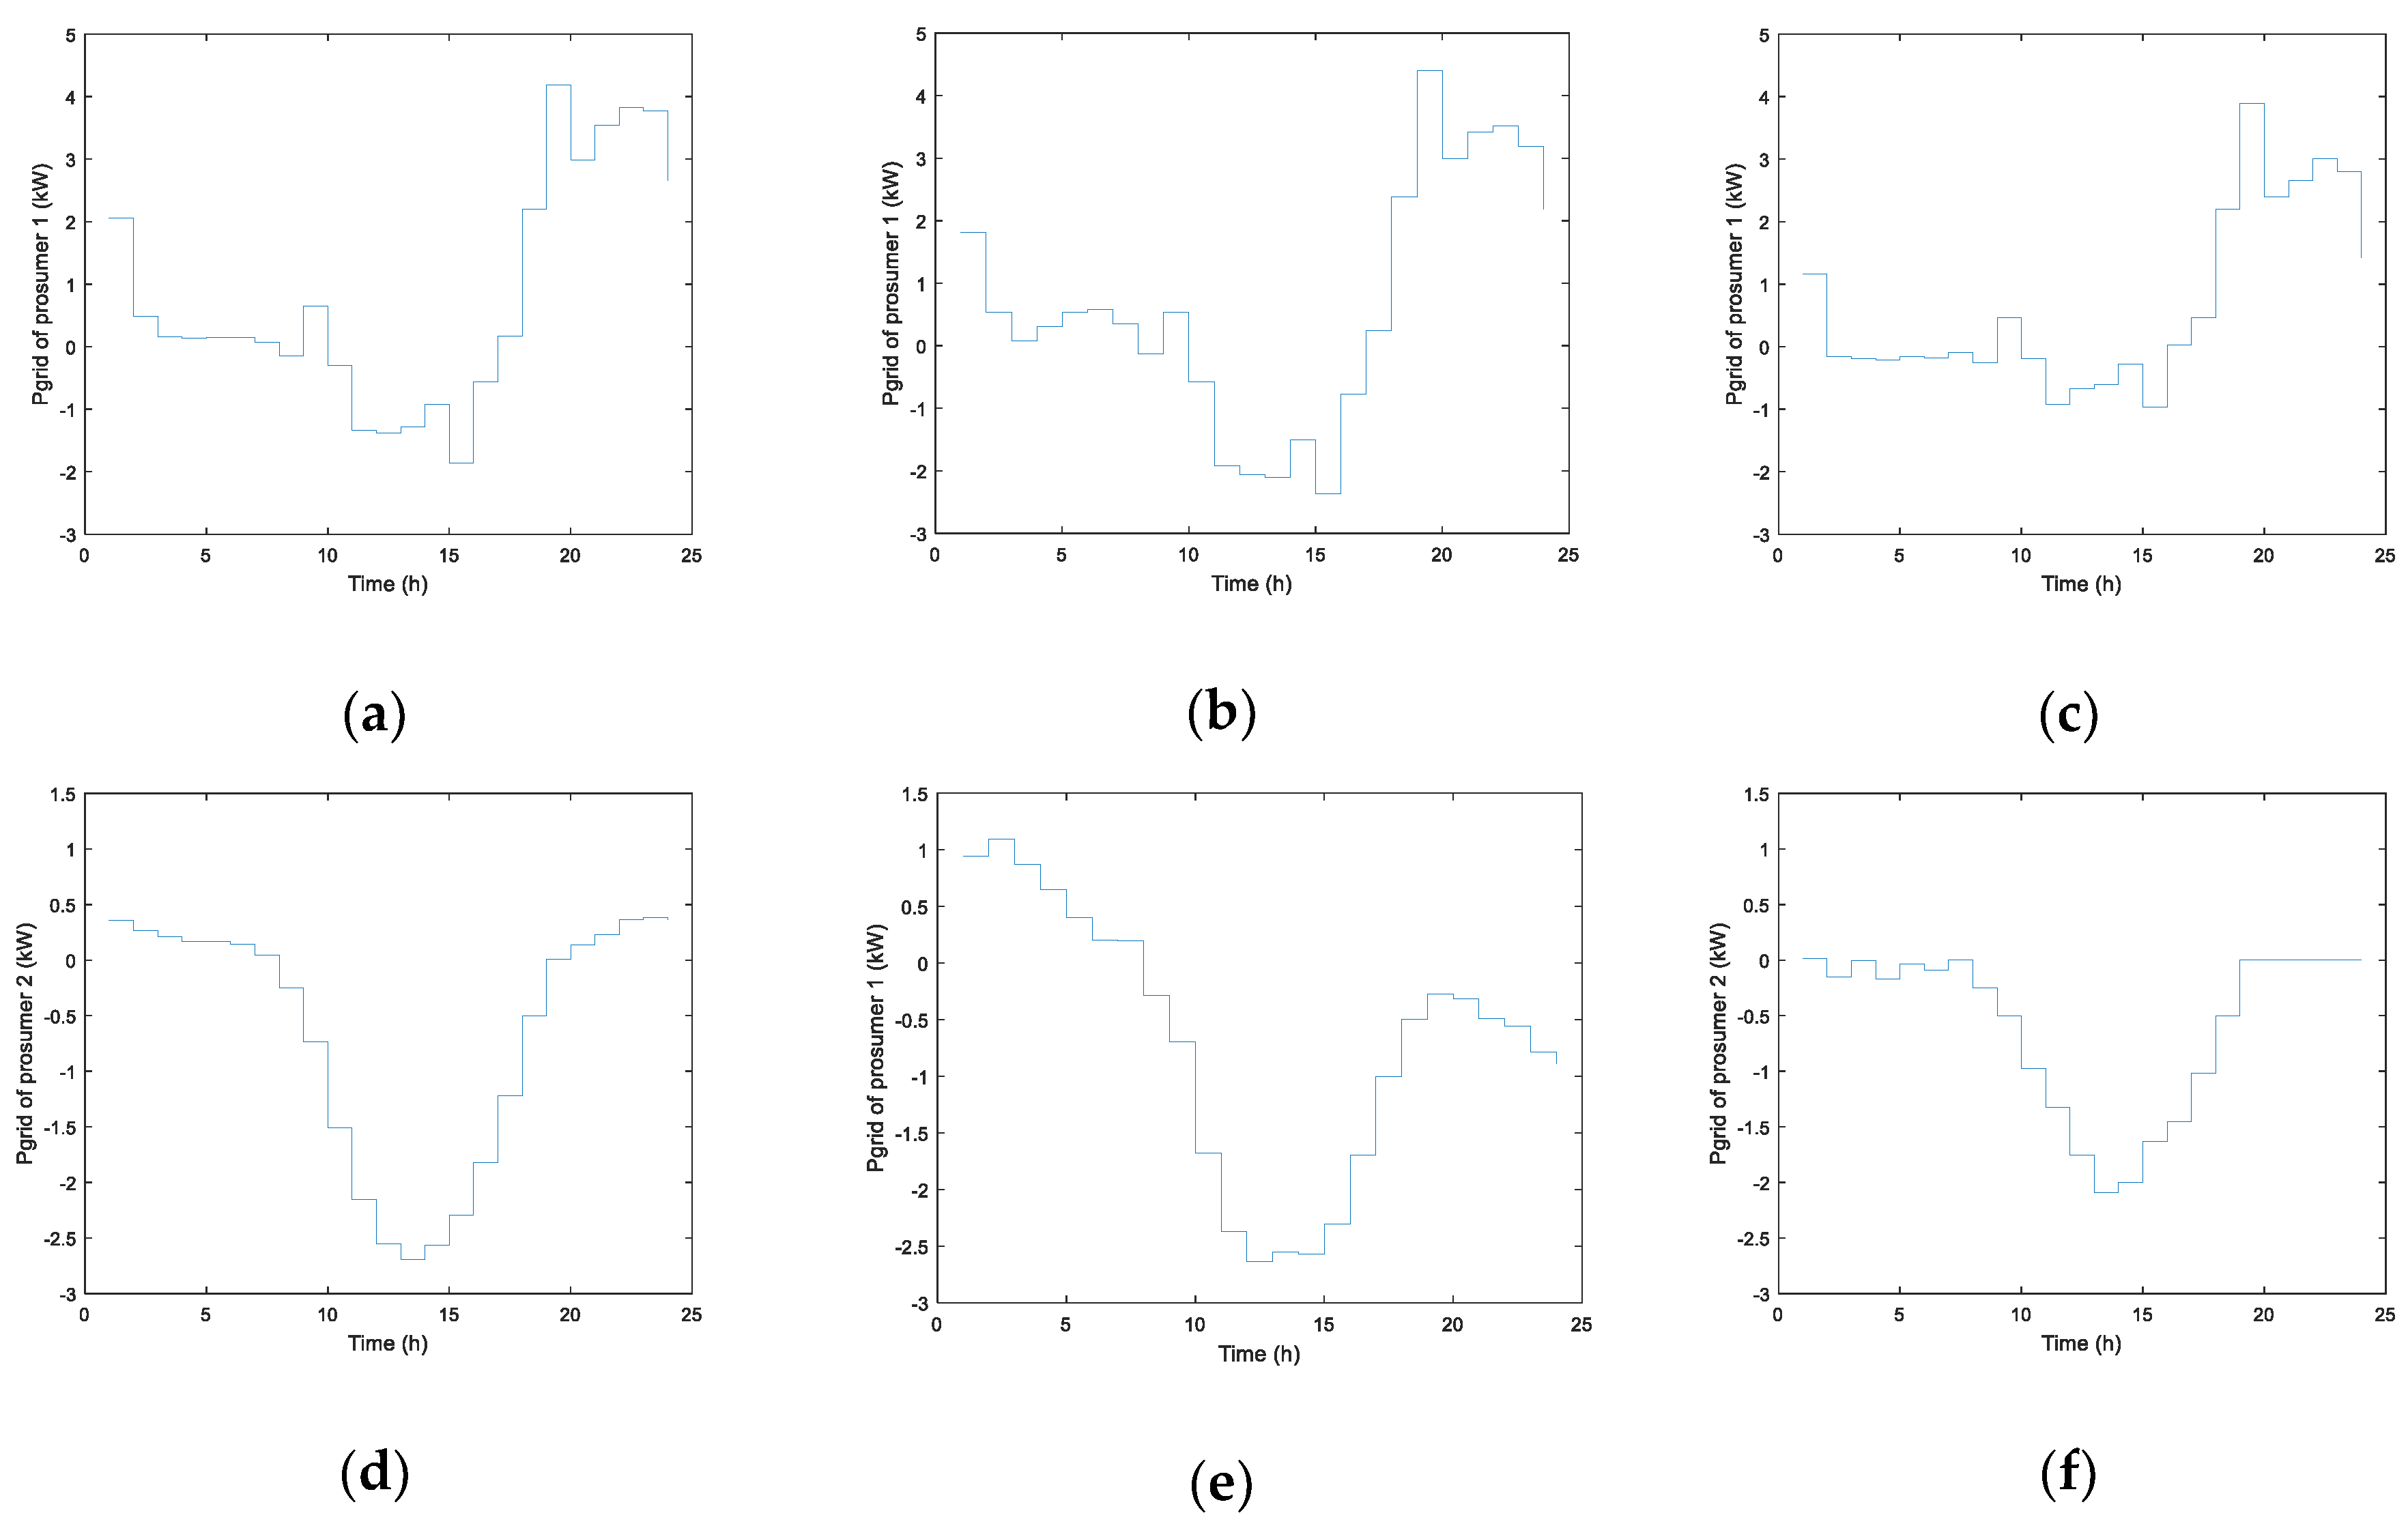
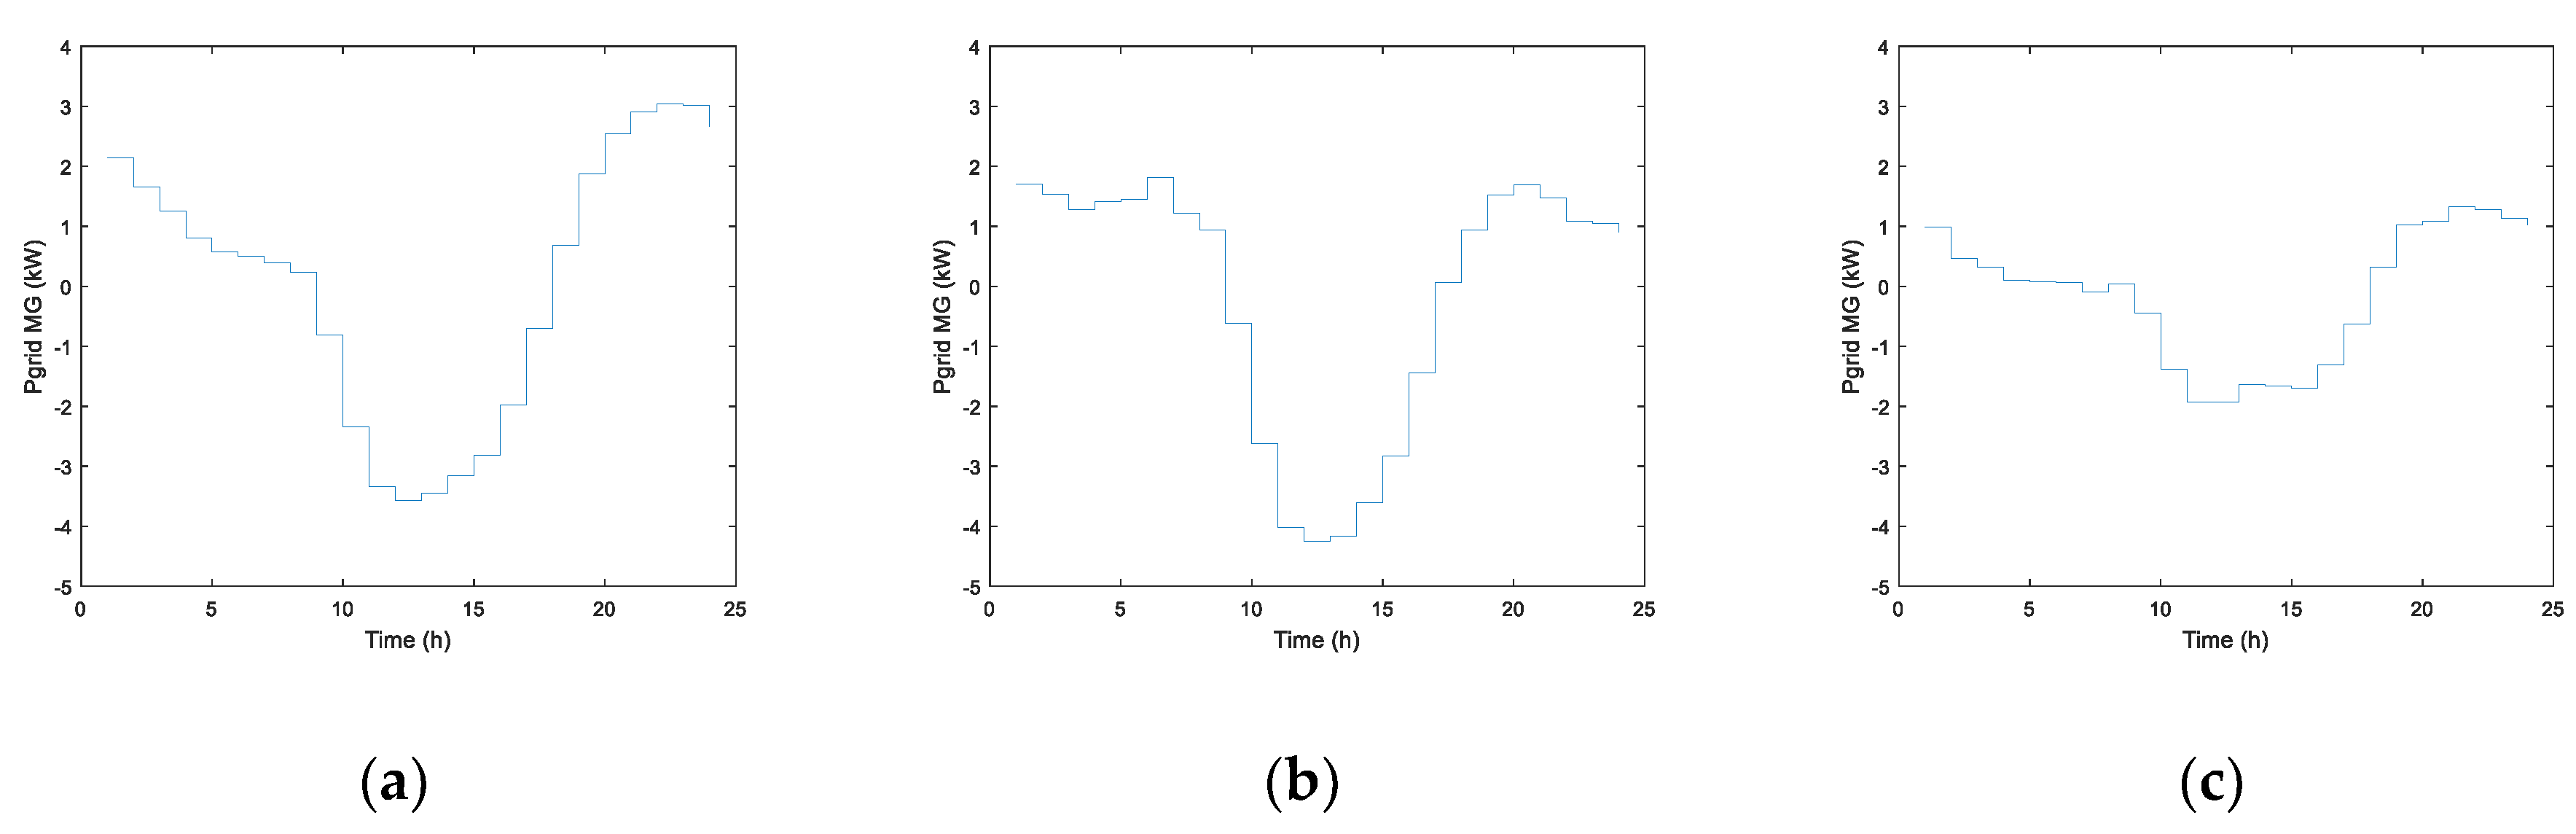
Figure 5 shows the power interchanged with the main grid Pgrid, according to Equation (10). It can be observed that line capacity of each dwelling is not exceeded in any cases.
Absolute values for energy imported Eimp and exported Eexp (according to Equations (11) and (12) respectively), are reported in Table 2.
Figure 5 and Table 2 confirm the conclusion previously reached. The dependence of both prosumers on the main grid can be, when COF is used, even higher than in the absence of ESS (either in terms of power or energy). This is a consequence of considering energy price as the unique variable to perform the battery management and leads to other drawbacks, such as higher required capacity of the distribution grid and higher transmission losses. However, MOF reduces the dependence on the main grid, both in power and energy terms, thus assuring advantages also for the distribution system. The previous indicators used for evaluating the performance of the proposed objective functions are related to technical performance. Table 3 below summarizes the economic indicators to evaluate eventual prosumer benefits.
Table 3 proves that MOF presents economic advantages as well. Although Costbnt is obviously lower when COF is used, this approach leads to higher energy interchange with the grid, which adds costs in terms of network tariffs both when importing and exporting energy (although with different unitary cost). In the case of MOF, CP is reduced as well as imported and exported energy, leading to considerably lower network tariffs. As a consequence, this is the approach with the lowest Costant for prosumer 1 and produces similar revenues for prosumer 2.
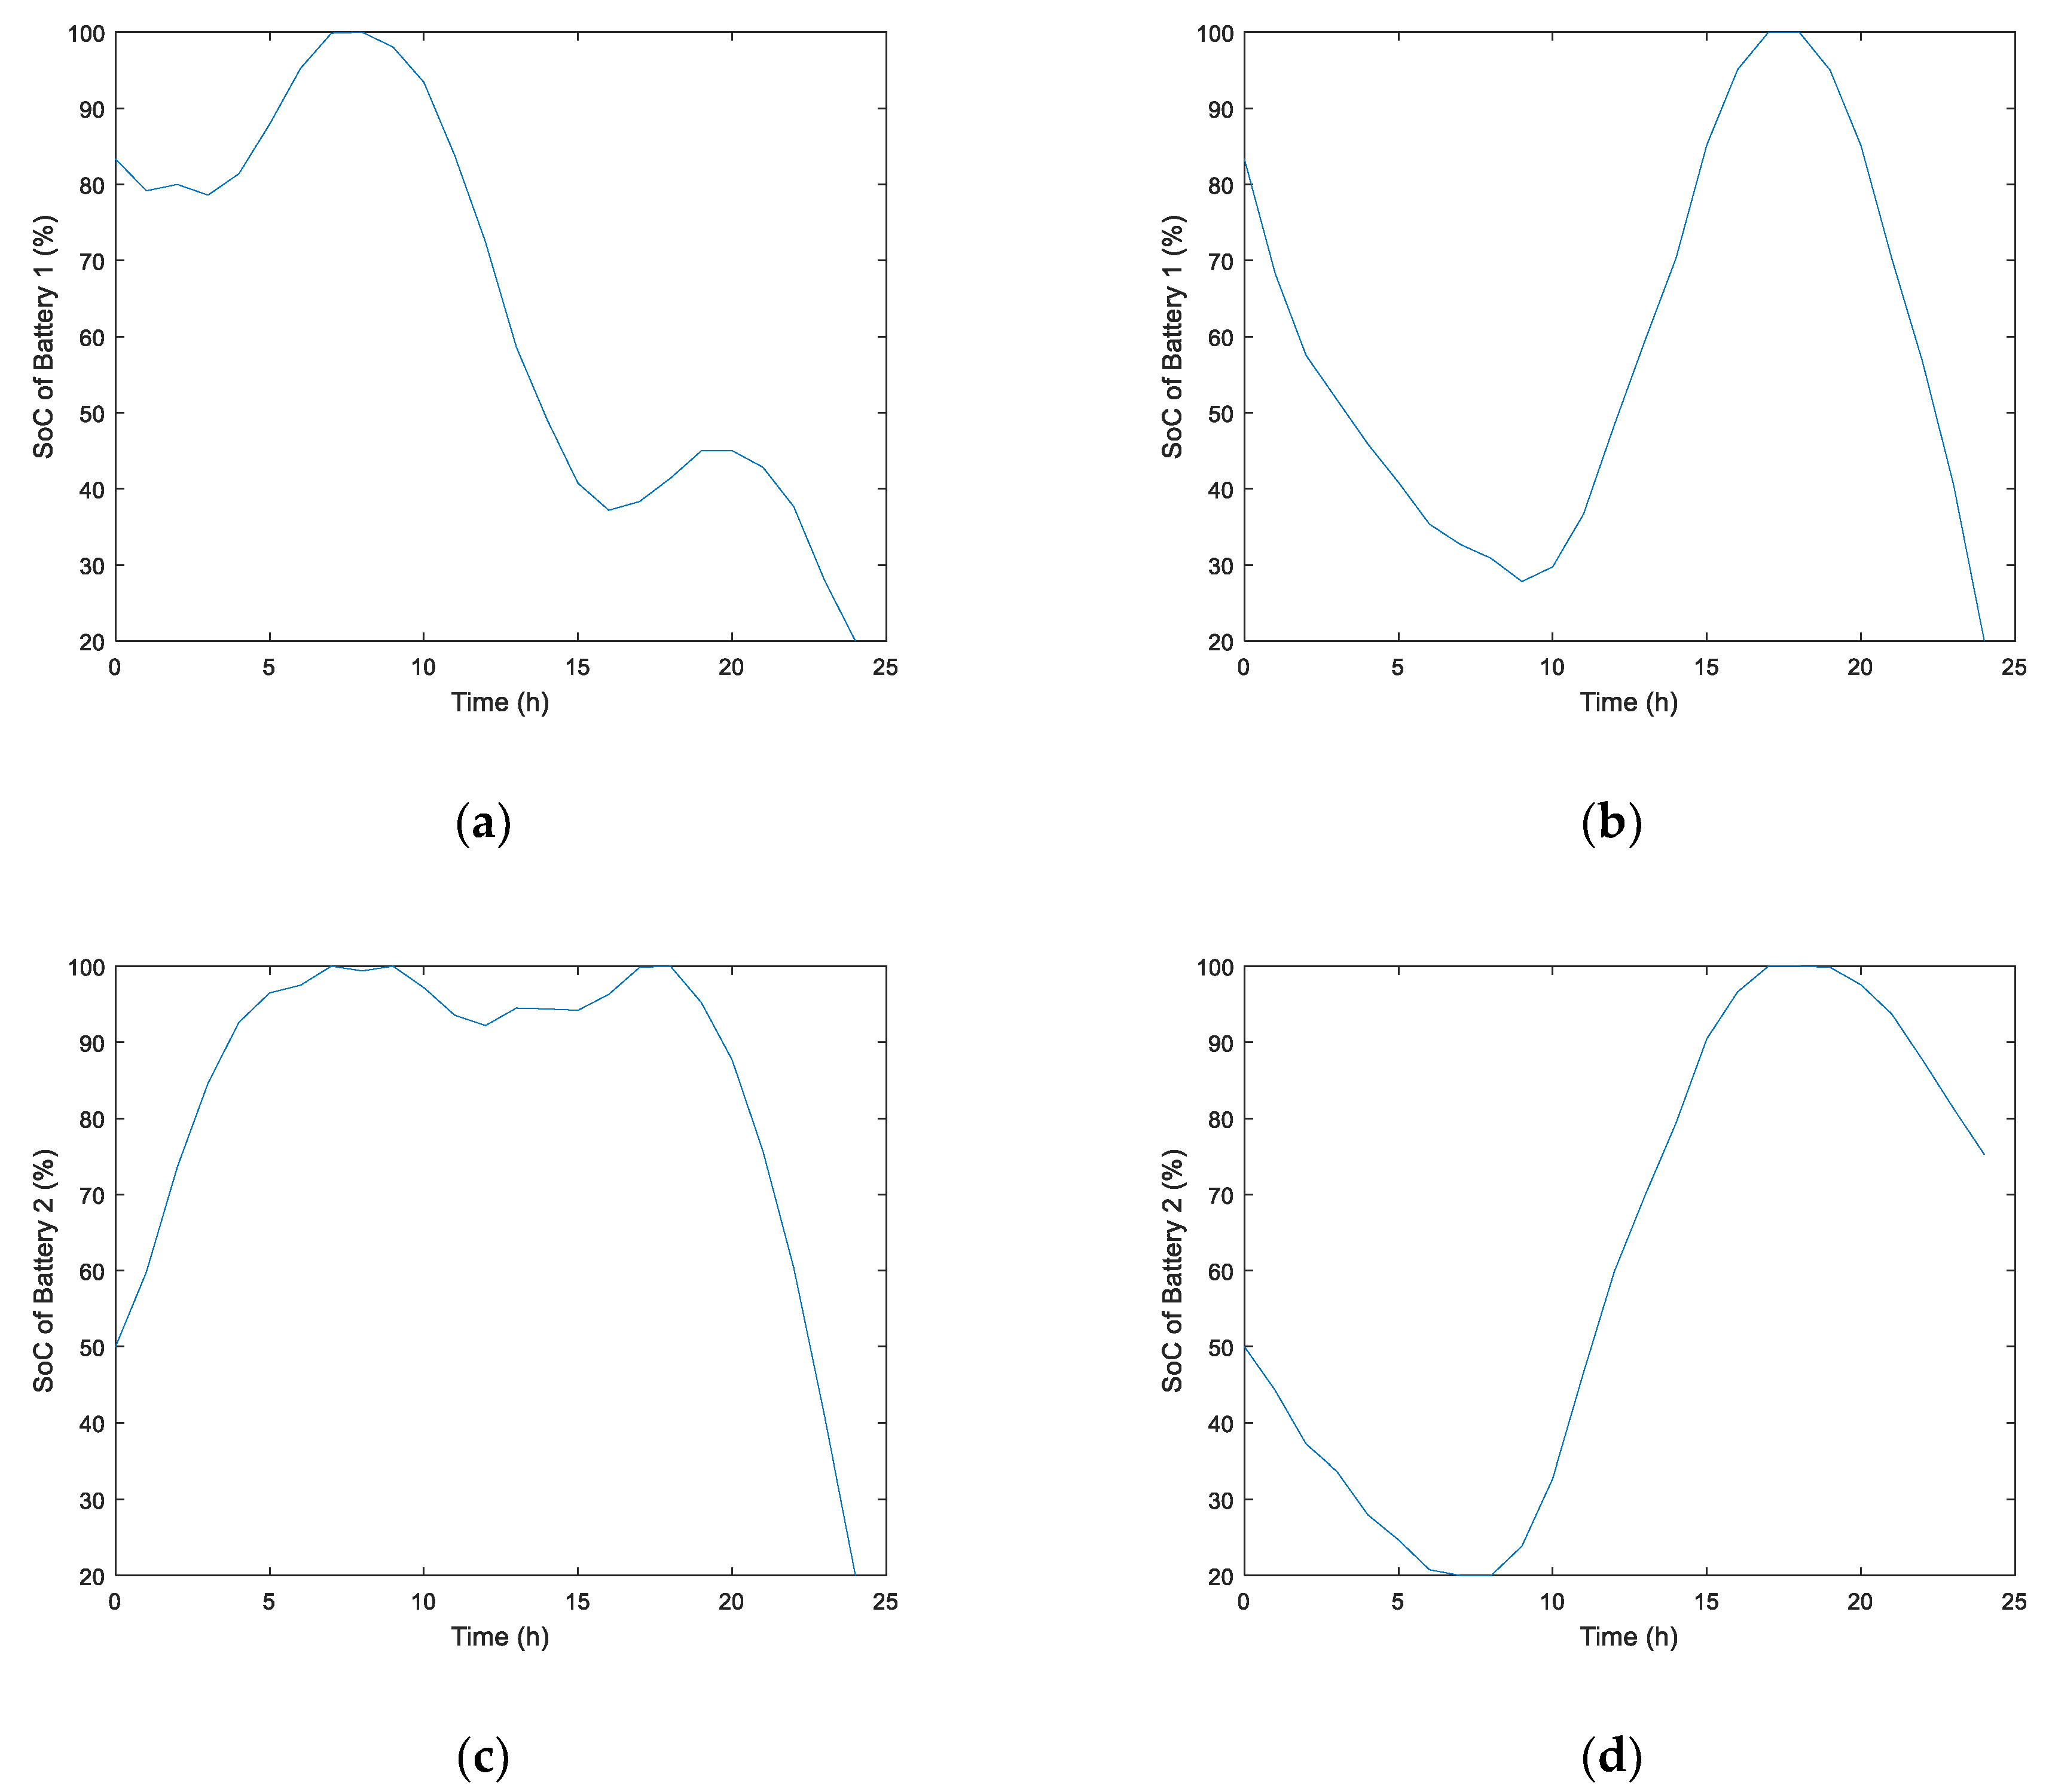
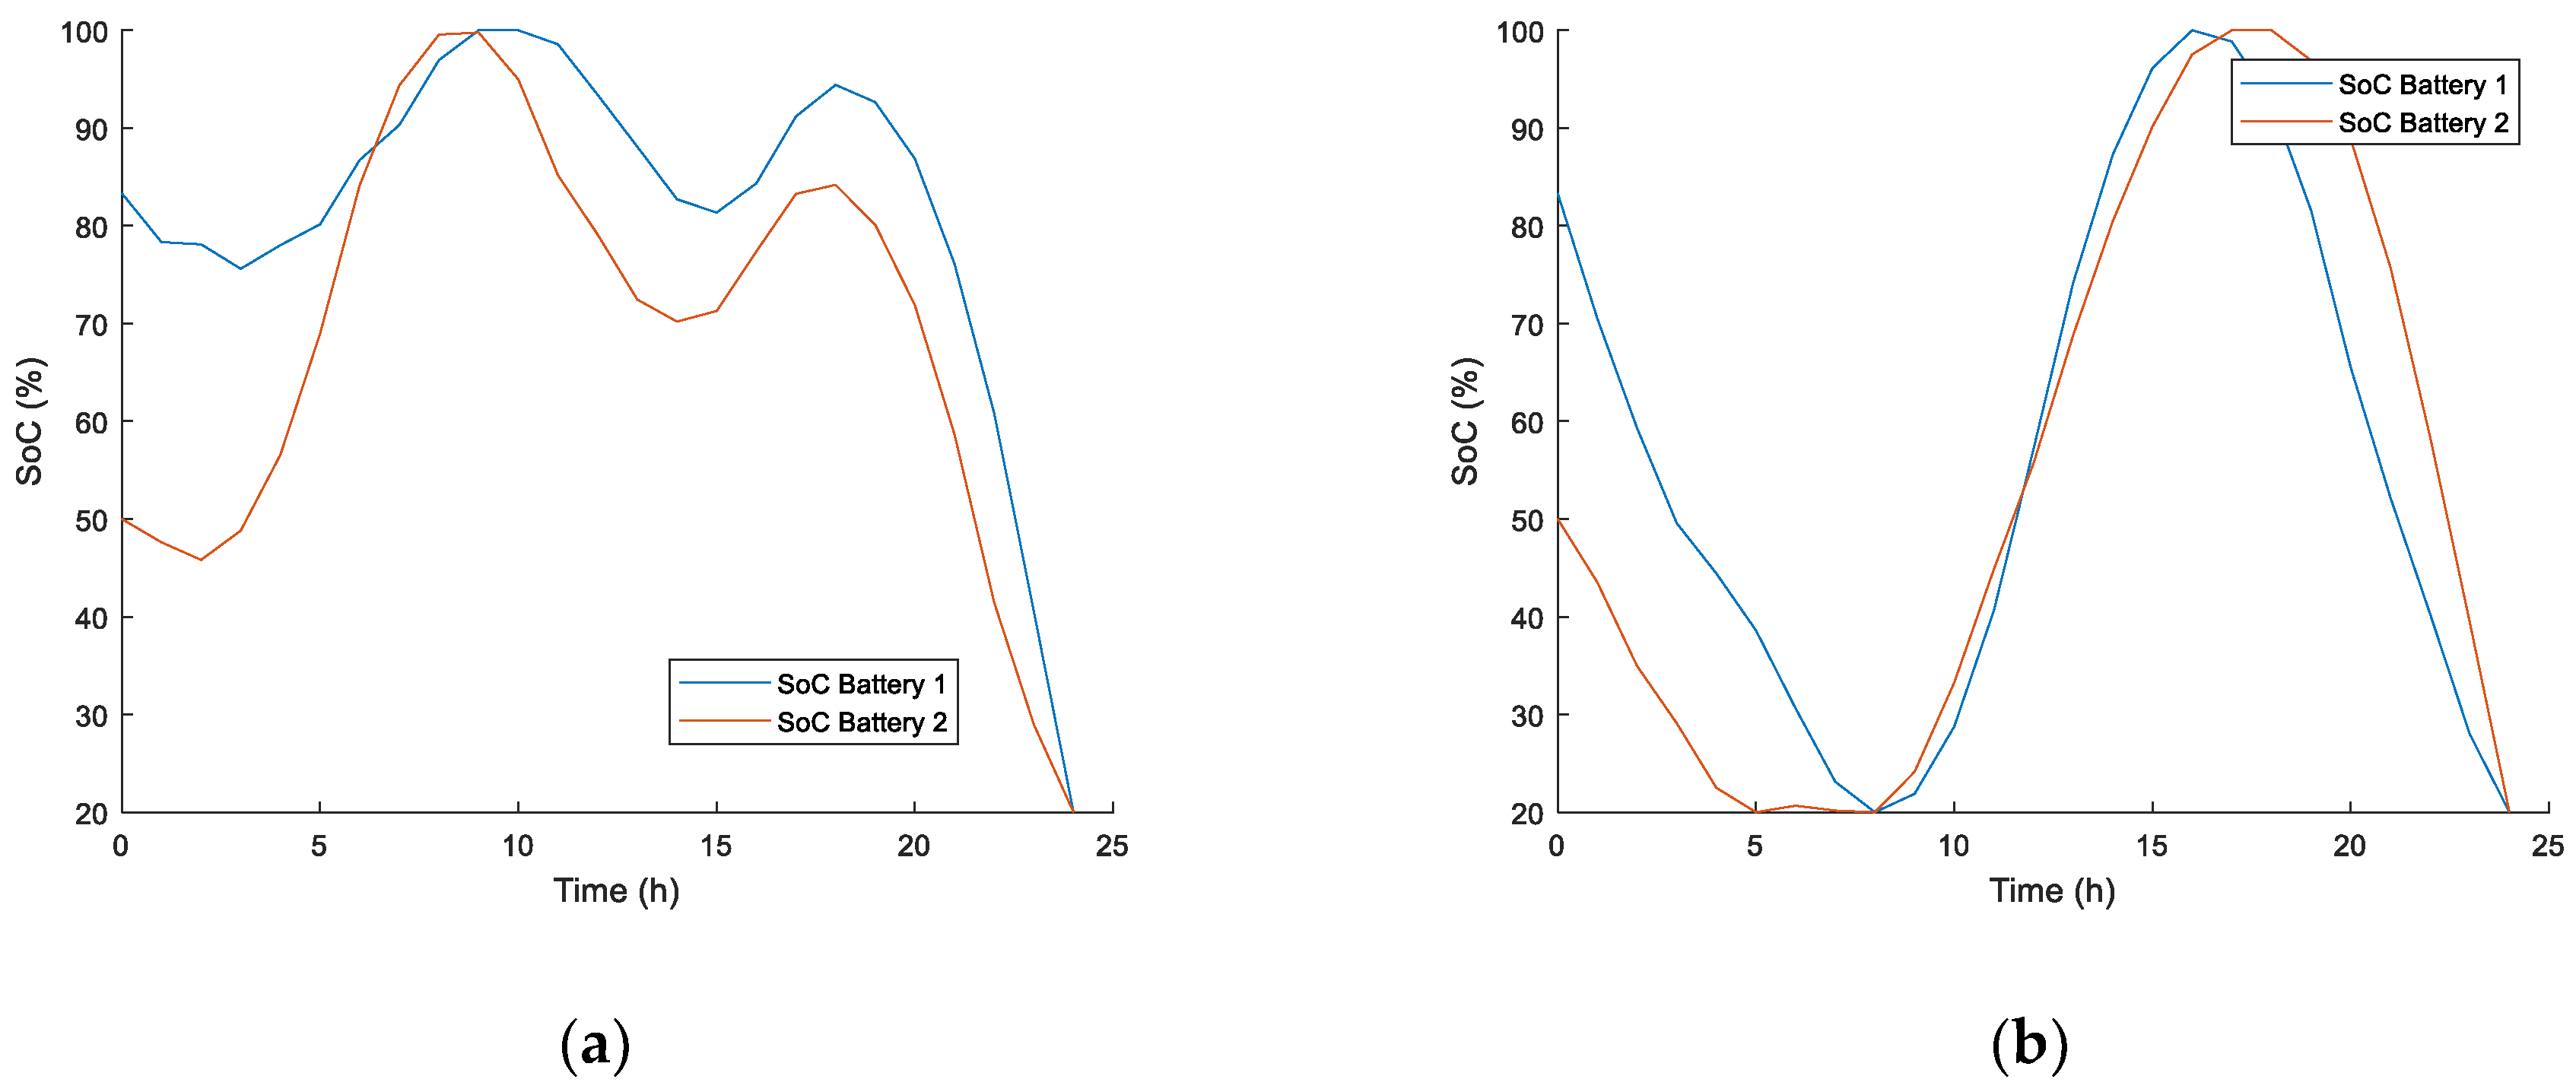
Additional benefits are obtained from MOF related to batteries lifetime. As discussed earlier, a higher frequency of charge/discharge cycles increases battery degradation, leading to a lifetime decrease. Figure 6 compares batteries’ SoC evolution when the different objective functions are used. It can be observed that oscillation between charge/discharge modes is less frequent using MOF than using COF, thus contributing to slow down battery degradation.

3.2. Coordinated Schedule of Batteries

At this stage, both prosumers are considered as one management unit (prosumers community), under the concept of microgrid, where DERs are shared to reach a joint optimization target. In this case, the output vector to be obtained, P B , by means of the GA is composed of 48 values, corresponding to the 24 h scheduling of both batteries, while constraints are still applied to each of the batteries. The obtained results are shown below, with the aim of comparing this scenario to the individual management of each prosumer.
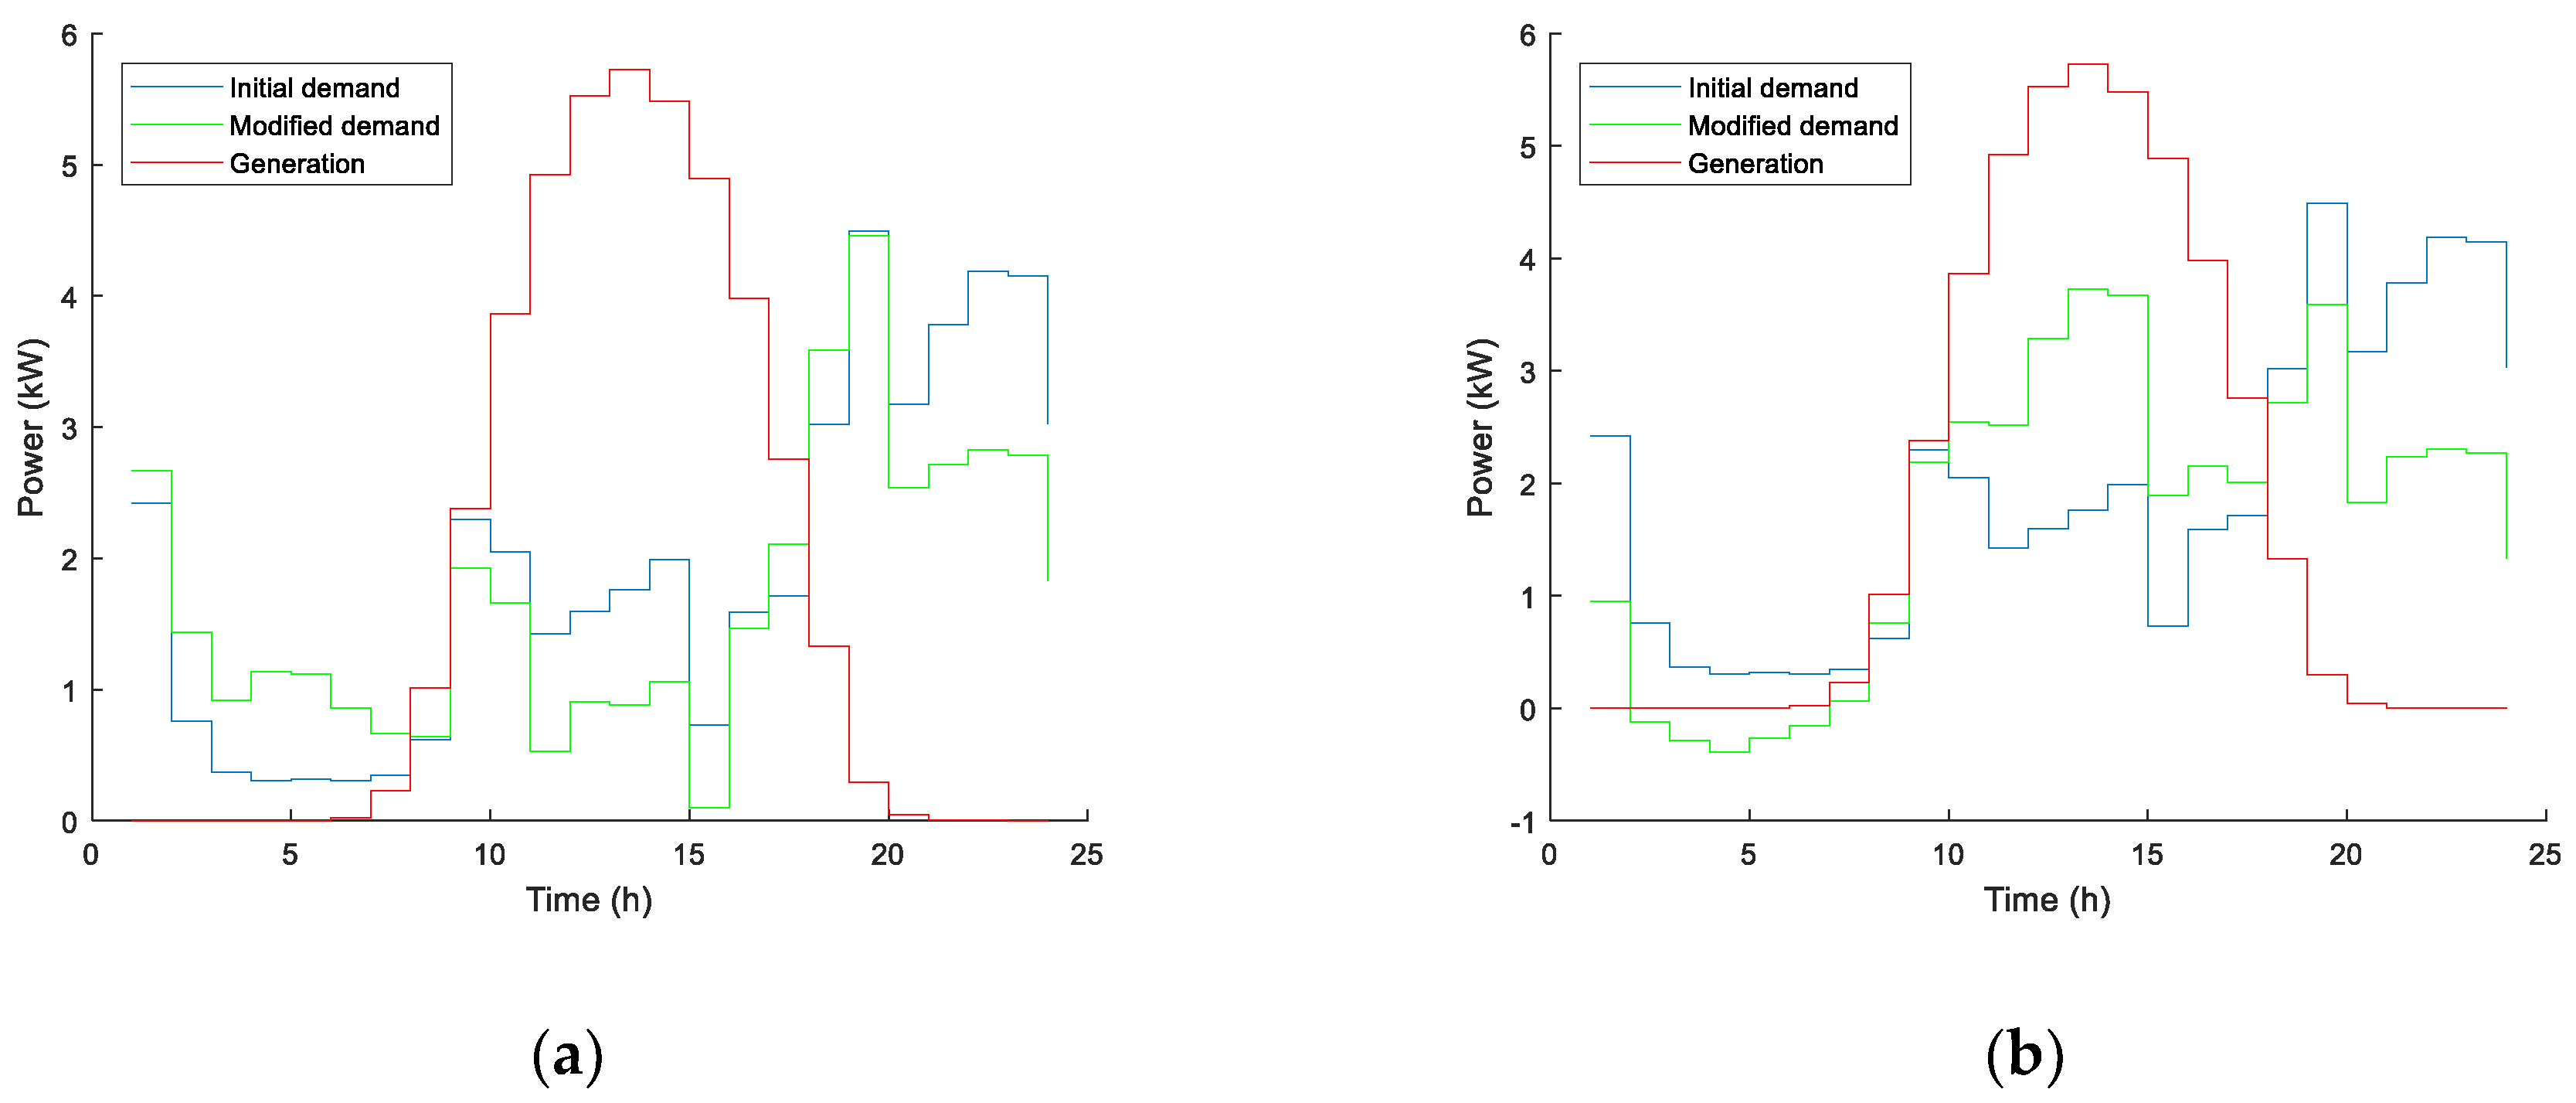
Figure 7 shows generation, initial demand and demand modified by the action of batteries, with both objective functions. It is important to note that these results refer to the whole microgrid.
SC and SS indicators obtained for each objective function and for the situation without ESS can be found in Table 4. The same conclusions can be drawn as in the case of individual scheduling of batteries: MOF improves both SC and SS indicators, whereas they reach lower values when COF is used. This is due to a higher dependence on the main grid in this last case, as it is also shown in
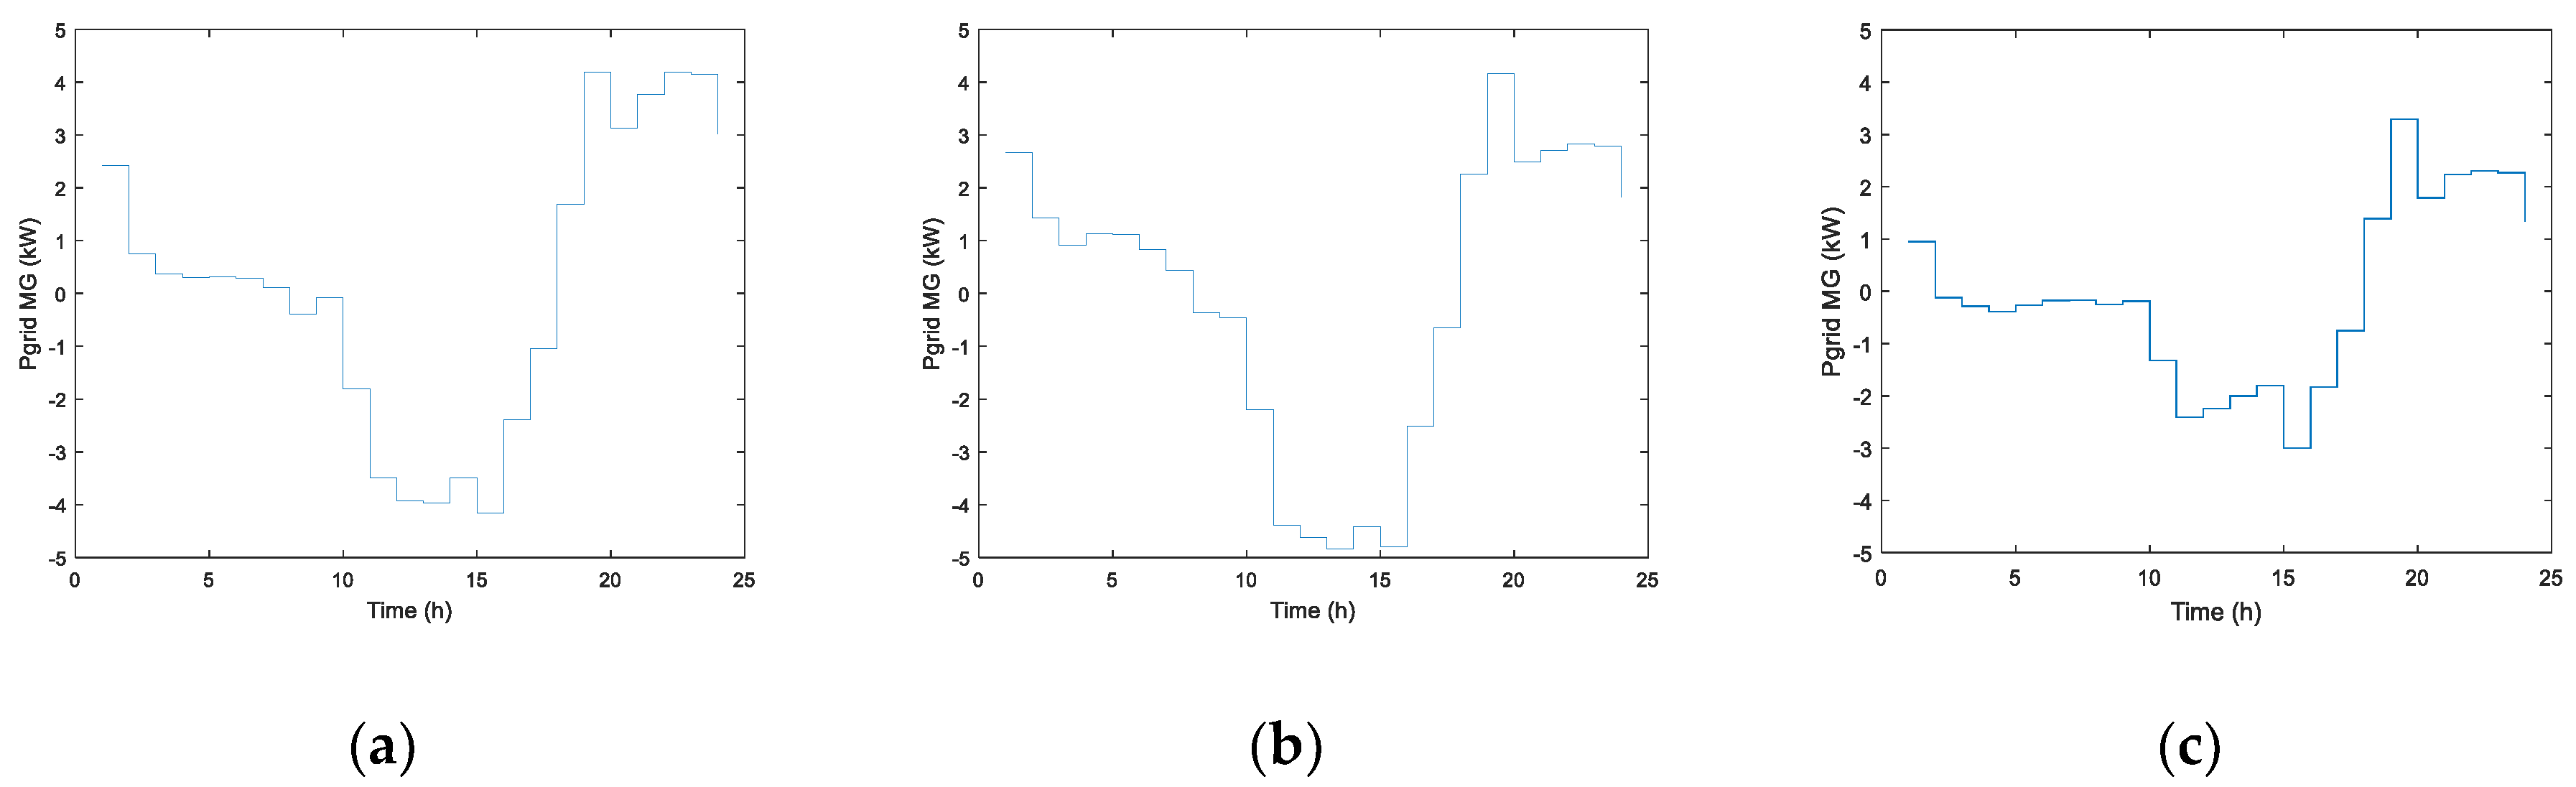
 Figure 8 and Table 5.
Both power and energy interchange with the main grid are significantly improved when MOF is used. Note that Pgrid is always far from the capacity of the common supply line (9.2 kW). In the case of COF, energy import is reduced in comparison to the case without ESS, but energy export is increased, since only economic factors are considered to reach the optimal solution.
The economic indicators are shown in Table 6, where the sum of both prosumers’ costs with individual schedule has been added for comparison.
A very interesting conclusion can be drawn from Table 6. MOF also improves the economic profit of the microgrid in comparison to COF and moreover it significantly reduces the cost of the electricity bill for the whole microgrid compared to individual schedule of the battery of each prosumer. Obviously, the advantage is for the set of prosumers, as each of them is not equally affected. Prosumer 2 is a net energy exporter and earned money along the day (see Table 3). Therefore, if equitable share is done of the whole microgrid bill, this prosumer would be adversely affected. A fair rule based on energy balance of each prosumer should be developed to assign costs to each prosumer of the microgrid, as proposed in [
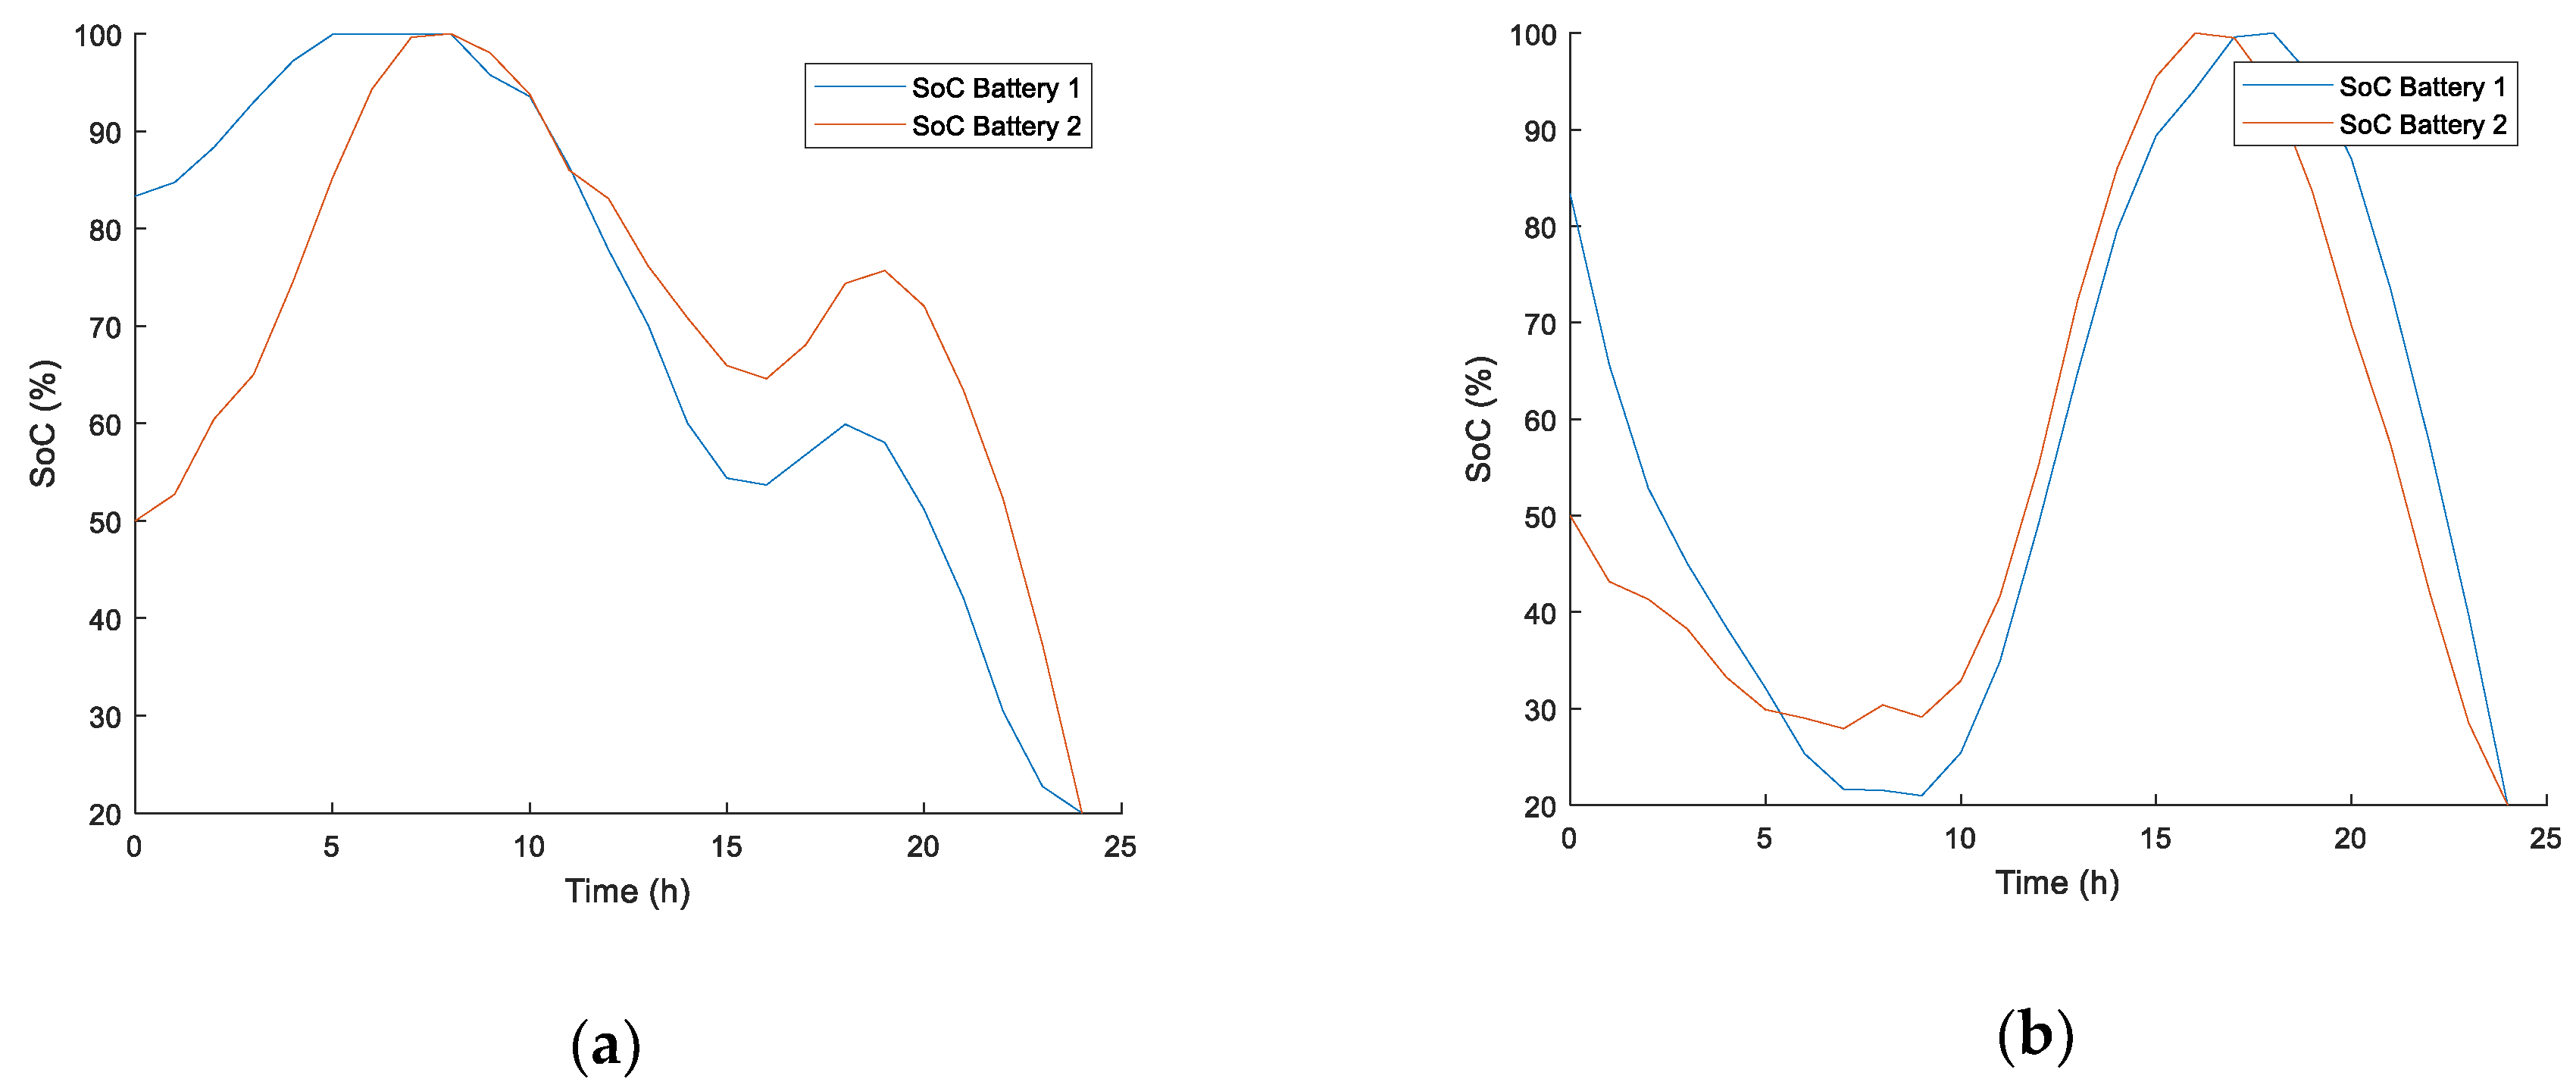
21]. Regarding the evolution of battery SoC, Figure 9 depicts those regarding both objective functions, showing that MOF also reduces battery degradation.
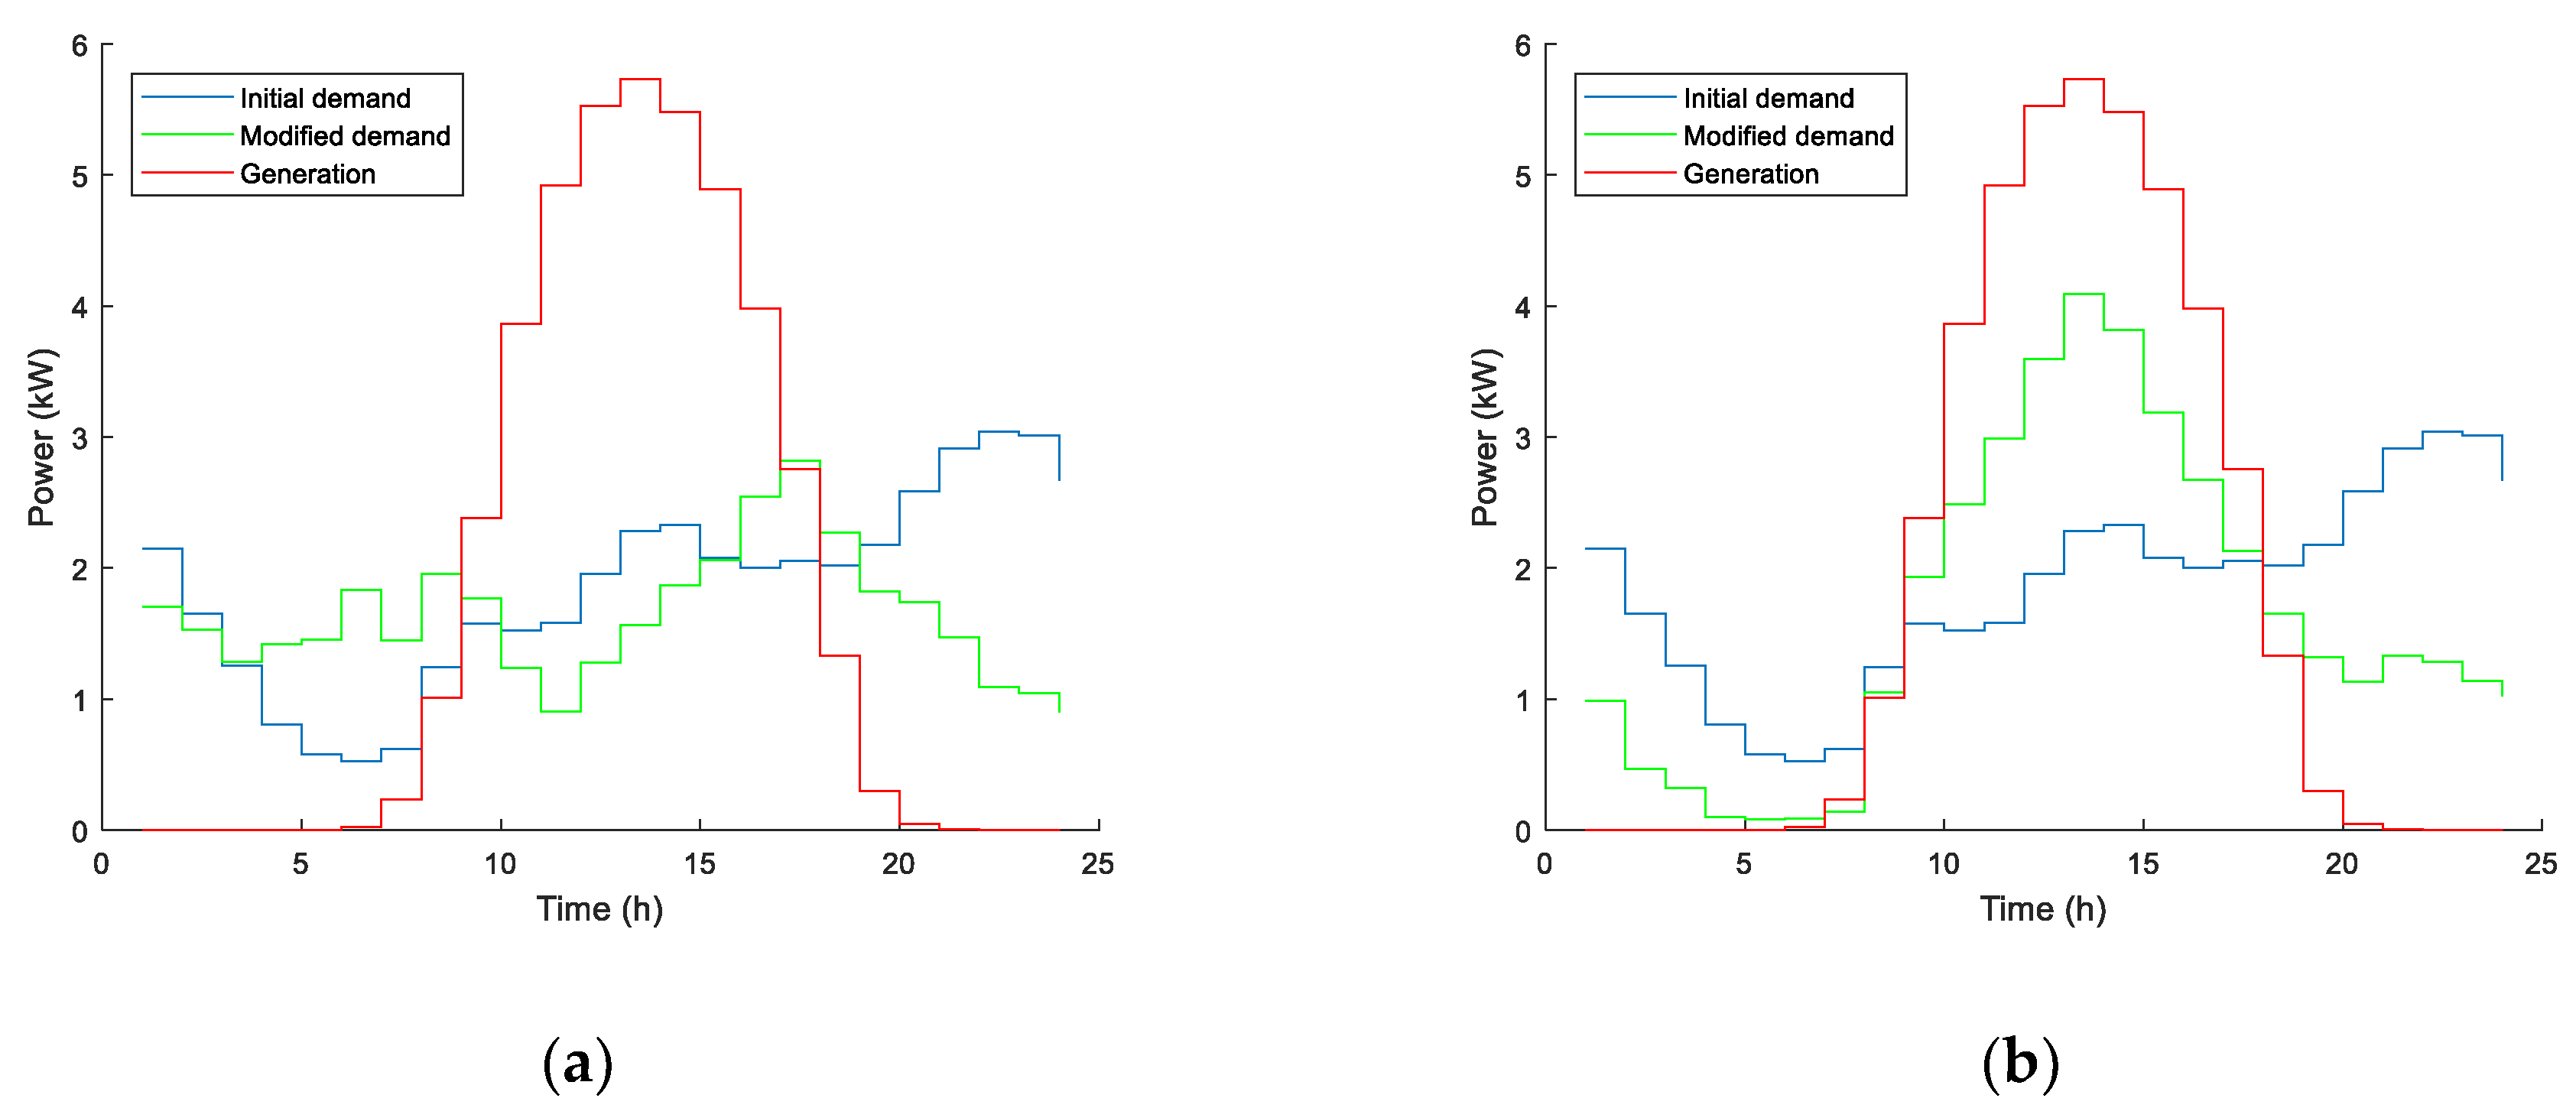
The previously tested case study presented the advantages of batteries’ coordinated scheduling in comparison to individual operation. In this case study, different demand levels have been considered to evaluate distinct performance between both operation modes. The proposed objective function was also tested using for both prosumers the average yearly demand profile obtained from a real measured dwelling. Figure 10 and Table 7 depict the generation, demand and modified demand of the whole microgrid and the main performance indicators obtained for this new case study, respectively.
Pgrid and the evolution of the SoC of batteries are also shown in Figure 11 and Figure 12 respectively.
This new case study demonstrates that the proposed objective function, in a measured average demand situation, clearly outperforms the objective function based on energy cost in all the parameters previously discussed. It improves SC and SS indicators, significantly reduces the interchanged power and energy, decreases electricity bill and better exploits battery capacity, reducing the number of charging/discharging cycles a day.

4. Discussion and Conclusions

In this paper a microgrid of prosumers with PV generation and battery ESS is managed using a GA to schedule the batteries’ charging/discharging power in a daily timeframe with one-hour resolution. Two management strategies were tested: individual and coordinated scheduling. Moreover, two objective functions were evaluated and compared. The first one (COF) aims to minimize the cost associated with energy consumption, while the second one (MOF) is focused on improving both SC and SS indices.
Regarding objective functions, the proposed MOF outperforms COF, which is based on traded energy price. This improvement is mainly reached in terms of SC and SS rates, and in the interconnection power and energy with the main grid. As a consequence, a better exploitation of DER is achieved, along with a lower impact into the distribution grid, both in capacity (which must be enough to match peak power) and in losses (which are related to the volume of flowing energy). But also economic advantages are shown when this new objective function is used comparing to an objective function based on the cost of the traded energy. Although COF leads to lower energy cost, before network tariffs, it also causes an increase in the required CP and in the daily imported and exported energy, thus increasing networks tariffs. This conclusion is valid in the absence of support for surplus energy of self-consumers, which tends to be the policy in European countries once grid-parity for the activity has been achieved. Finally, battery cycling is favorable to avoid premature degradation, as only one charge/discharge cycle is completed during the day with MOF, unlike the result of using COF. Results obtained from this study conclude that reducing the dependence on the main grid, both in power and energy terms, not only improves energy efficiency, distribution losses, exploitation of DERs and empowers consumers, but also economic advantages are reached for prosumers both in the electricity bill and battery lifetime. Therefore, this objective outperforms classical cost minimization techniques widely proposed in literature.
Another important conclusion is attained related to microgrid coordination. Performing the schedule of batteries as a set of resources to jointly optimize the microgrid energy management shows a noticeable improvement compared to individual scheduling, in terms of power and energy interchanges as well as economic benefits. Coordinated schedule of prosumers with average demand also shows clearly higher benefits when MOF is used instead of COF. This case study represents a realistic self-consumption situation and conclusions can be easily extended to bigger communities with several household prosumers. This result reinforces the interest for microgrids and smart communities as a way to improve energy efficiency and exploitation of DER. An effective method for assigning the resulting total costs of the microgrid to each of the prosumers is pending for future research.

Author Contributions

Conceptualization, E.G.-R. and F.B.-G.; Formal analysis, E.G.-R. and E.R.-C.; Funding acquisition, E.G.-R., M.-I.M.-M., F.B.-G. and E.R.-C.; Investigation, E.G.-R. and M.R.-C.; Methodology, M.R.-C. and J.M.; Project administration, E.G.-R.; Software, M.R.-C. and R.A.L.; Supervision, M.-I.M.-M., F.B.-G. and E.R.-C.; Validation, E.G.-R. and M.-I.M.-M.; Writing—original draft, E.G.-R.; Writing—review & editing, M.R.-C. and R.A.L.

Funding

This research was funded by the Spanish Agencia Estatal de Investigación (AEI), Fondo Europeo de Desarrollo Regional (FEDER), grant number TEC2016-77632-C3-1-R (AEI/FEDER, UE), Junta de Extremadura (Regional Government), Spain, under the Mobility Scholarship Program for Teaching and Research Staff of the Autonomous Community of Extremadura 2018 and Portugal national funds through FCT-Fundacão para a Ciência e a Tecnologia, under project UID/EEA/00066/2013.

Conflicts of Interest

The authors declare no conflict of interest.

Nomenclature

CET:Consumer Energy Tariff
Cinom:Nominal capacity of battery i
COF:Cost objective function
Costant:Cost after network tariffs
Costbnt:Cost before network tariffs
CP:Contracted Power
CPi:Contracted Power of prosumer i
CPMG:Contracted Power of the whole microgrid
CPT:Consumer Power Tariff
D (t):Demanded power at hour t
DER:Distributed Energy Resource
Dmod (t):Modified demand at hour t
DSR:Demand-Side Response
Eexp:Exported energy along the whole day
Eimp:Imported energy along the whole day
ESS:Energy Storage System
fcost:Fitness function to be minimized according to COF
FIT:Feed-in Tariffs
fmismatch:Fitness function to be minimized according to MOF
G (t):Generated power at hour t
GA:Genetic Algorithm
MOF:Mismatch objective function
O&M:Operation and Maintenance
P2P:Peer-to-Peer
PBi (t):Battery power of battery i at hour t
PET:Producer Energy Tariff
Pgrid:Power in the interconnection with the main grid
Pimax,ch:Maximum charge power for battery i
Pimax,dis:Maximum discharge power for battery i
Pr (t):Energy market price at hour t
PV:Photovoltaic
SC:Self-Consumption rate
SoC:State of Charge
SoCiinit:State of Charge of battery i at the beginning of the day
SoCimax:Maximum allowed State of Charge of battery i
SoCimin:Minimum allowed State of Charge of battery i
SS:Self-Sufficiency rate
ΔPB:Maximum power gradient between consecutive hours

References

  1. European Commission. The Strategic Energy Technology (SET) Plan. At the heart of Energy Research & Innovation in Europe. Available online: https://setis.ec.europa.eu/sites/default/files/setis%20reports/2017_set_plan_progress_report_0.pdf (accessed on 21 December 2018).
  2. Albaker, A.; Khodaei, A. Elevating prosumers to provisional microgrids. In Proceedings of the 2017 IEEE Power & Energy Society General Meeting, Chicago, IL, USA, 16–20 July 2017; pp. 1–5. [Google Scholar] [CrossRef]
  3. Hau, V.B.; Husein, M.; Chung, I.-Y.; Won, D.-J.; Torre, W.; Nguyen, T. Analyzing the Impact of Renewable Energy Incentives and Parameter Uncertainties on Financial Feasibility of a Campus Microgrid. Energies 2018, 11, 2446. [Google Scholar] [CrossRef]
  4. Scalfati, A.; Iannuzzi, D.; Fantauzzi, M.; Roscia, M. Optimal sizing of distributed energy resources in smart microgrids: A mixed integer linear programming formulation. In Proceedings of the 2017 IEEE 6th International Conference on Renewable Energy Research and Applications (ICRERA), San Diego, CA, USA, 5–8 November 2017; pp. 568–573. [Google Scholar] [CrossRef]
  5. Choi, J.; Shin, Y.; Choi, M.; Park, W.; Lee, I. Robust Control of a Microgrid Energy Storage System using Various Approaches. IEEE Trans. Smart Grid. In press. [CrossRef]
  6. Luna, A.C.; Diaz, N.L.; Graells, M.; Vasquez, J.C.; Guerrero, J.M. Mixed-Integer-Linear- Programming-Based Energy Management System for Hybrid PV-Wind-Battery Microgrids: Modeling, Design, and Experimental Verification. IEEE Trans. Power Electron. 2017, 32, 2769–2783. [Google Scholar] [CrossRef]
  7. European Commission. Best practices on Renewable Energy Self-consumption. Available online: https://ec.europa.eu/energy/sites/ener/files/documents/1_EN_autre_document_travail_service_part1_v6.pdf (accessed on 11 January 2019).
  8. Kharseh, M.; Wallbaum, H. How Adding a Battery to a Grid-Connected Photovoltaic System Can Increase its Economic Performance: A Comparison of Different Scenarios. Energies 2019, 12, 30. [Google Scholar] [CrossRef]
  9. PCR. EUPHEMIA: Description and Functioning. Available online: https://www.epexspot.com/document/40114/Euphemia%20Public%20Documentation (accessed on 17 January 2019).
  10. Milanés-Montero, P.; Arroyo-Farrona, A.; Pérez-Calderón, E. Assessment of the Influence of Feed-In Tariffs on the Profitability of European Photovoltaic Companies. Sustainability 2018, 10, 3427. [Google Scholar] [CrossRef]
  11. Roldan-Fernandez, J.M.; Gómez-Quiles, C.; Merre, A.; Burgos-Payán, M.; Riquelme-Santos, J.M. Cross-Border Energy Exchange and Renewable Premiums: The Case of the Iberian System. Energies 2018, 11, 3277. [Google Scholar] [CrossRef]
  12. Ministerial Order ETU/315/2017 of 6 April, which Regulates the Procedure for Assignment Specific Remuneration Regime in the Call for New Electric Energy Production Installations Using Renewable Resources, Based of Royal Decree 359/2017, 31th March, and Sanctions Remuneration Parameters. Available online: https://www.boe.es/diario_boe/txt.php?id=BOE-A-2017-3880 (accessed on 14 January 2019).
  13. Royal Decree 900/2015 of 9 October, which Regulates Administrative, Technical and Economic Conditions of Energy Supply with Self-Consumption and Energy Generation with Self-Consumption. Available online: http://www.omie.es/files/r.d._900-2015.pdf (accessed on 14 January 2019).
  14. Royal Decree-Law 15/2018 of 5 October, of Urgent Actions for Energy Transition and Consumer Protection. Available online: http://www.omie.es/files/r.d.l._15-2018de_5_de_octubre_0.pdf (accessed on 14 January 2019).
  15. Arif, A.; Wang, Z.; Wang, J.; Mather, B.; Bashualdo, H.; Zhao, D. Load Modeling—A Review. IEEE Trans. Smart Grid 2018, 9, 5986–5999. [Google Scholar] [CrossRef]
  16. Tayade, A.; Dhote, V.P.; Thosar, A. Study on demand side management in microgrid using electric spring. In Proceedings of the 2018 International Conference on Current Trends towards Converging Technologies (ICCTCT), Coimbatore, India, 1–3 March 2018; pp. 1–6. [Google Scholar] [CrossRef]
  17. Eseye, A.T.; Zheng, D.; Li, H.; Zhang, J. Grid-price dependent optimal energy storage management strategy for grid-connected industrial microgrids. In Proceedings of the 2017 Ninth Annual IEEE Green Technologies Conference (GreenTech), Denver, CO, USA, 29–31 March 2017; pp. 124–131. [Google Scholar] [CrossRef]
  18. Liu, C.; Wang, X.; Wu, X.; Guo, J. Economic Scheduling Model of Microgrid Considering the Lifetime of Batteries. IET Gener. Transm. Distrib. 2017, 11, 759–767. [Google Scholar] [CrossRef]
  19. Bellekom, S.; Arentsen, M.; van Gorkum, K. Prosumption and the Distribution and Supply of Electricity. Energy. Sustain. Soc. 2016, 6, 1–17. [Google Scholar] [CrossRef]
  20. Zame, K.K.; Brehm, C.A.; Nitica, A.T.; Richard, C.L.; Schweitzer, G.D. Smart Grid and Energy Storage: Policy Recommendations. Renew. Sustain. Energy Rev. 2018, 82, 1646–1654. [Google Scholar] [CrossRef]
  21. Espe, E.; Potdar, V.; Chang, E. Prosumer Communities and Relationships in Smart Grids: A Literature Review, Evolution and Future Directions. Energies 2018, 11, 2528. [Google Scholar] [CrossRef]
  22. Milanés-Montero, M.-I.; Barrero-González, F.; Pando-Acedo, J.; González-Romera, E.; Romero-Cadaval, E.; Moreno-Muñoz, A. Active, Reactive and Harmonic Control for Distributed Energy Micro-Storage Systems in Smart Communities Homes. Energies 2017, 10, 448. [Google Scholar] [CrossRef]
  23. Ruiz-Cortés, M.; González-Romera, E.; Amaral-Lopes, R.; Romero-Cadaval, E.; Martins, J.; Milanés-Montero, M.I.; Barrero-González, F. Optimal Charge/Discharge Scheduling of Batteries in Microgrids of Prosumers. IEEE Trans. Energy Convers. 2018. [Google Scholar] [CrossRef]
  24. OMIE. Iberian electricity Market Report. Available online: http://www.omie.es/reports/ (accessed on 2 January 2019).
  25. Zhao, J.; Liu, N.; Lei, J. Co-benefit and profit sharing model for operation of neighboring industrial PV prosumers. In Proceedings of the 2015 IEEE Innovative Smart Grid Technologies—Asia (ISGT ASIA), Bangkok, Thailand, 17–20 February 2015; pp. 1–6. [Google Scholar] [CrossRef]
  26. Zeh, A.; Müller, M.; Naumann, M.; Hesse, H.; Jossen, A.; Witzmann, R. Fundamentals of Using Battery Energy Storage Systems to Provide Primary Control Reserves in Germany. Batteries 2016, 2, 29. [Google Scholar] [CrossRef]
  27. Uddin, K.; Gough, R.; Radcliffe, J.; Marco, J.; Jennings, P. Techno-Economic Analysis of the Viability of Residential Photovoltaic Systems Using Lithium-Ion Batteries for Energy Storage in the United Kingdom. Appl. Energy 2017, 206, 12–21. [Google Scholar] [CrossRef]
  28. Mahesh, A.; Sandhu, K.S. A Genetic Algorithm Based Improved Optimal Sizing Strategy for Solar-Wind-Battery Hybrid System Using Energy Filter Algorithm. Front. Energy 2017, 1–13. [Google Scholar] [CrossRef]
  29. Quoilin, S.; Kavvadias, K.; Mercier, A.; Pappone, I.; Zucker, A. Quantifying Self-Consumption Linked to Solar Home Battery Systems: Statistical Analysis and Economic Assessment. Appl. Energy 2016, 182, 58–67. [Google Scholar] [CrossRef]
  30. Ministerial Order ETU/1282/2017 of 22 December, which Establishes Electric Energy Network Tariffs for 2018. Available online: https://www.boe.es/buscar/pdf/2017/BOE-A-2017-15521-consolidado.pdf (accessed on 16 January 2019).
  31. Royal Decree 1544/2011 of 31 October, Which Establishes Transmission and Distribution Network Tariffs That Must Be Satisfied by Electric Energy Producers. Available online: http://www.omie.es/files/r.d_1544-2011_de_31_de_octubre.pdf (accessed on 16 January 2019).
Figure 1. Schematic of the microgrid under study.
Energies 12 00719 g001
Figure 2. Generated and demanded average hourly power in both households.
Energies 12 00719 g002
Figure 3. Spanish market yearly-average clearing price.
Energies 12 00719 g003
Figure 4. Generation, demand and modified demand hourly power curves during scheduled 24 h: (a) Prosumer 1, COF; (b) Prosumer 1, MOF; (c) Prosumer 2, COF; (d) Prosumer 2, MOF.
Energies 12 00719 g004
Figure 5. Pgrid during scheduled 24 h (positive values for import energy flow and negative for export): (a) Prosumer 1, without ESS; (b) Prosumer 1, COF; (c) Prosumer 1, MOF; (d) Prosumer 2, without ESS; (e) Prosumer 2, COF; (f) Prosumer 2, MOF.
Energies 12 00719 g005
Figure 6. SoC of batteries during scheduled 24 h: (a) Prosumer 1, COF; (b) Prosumer 1, MOF; (c) Prosumer 2, COF; (d) Prosumer 2, MOF.
Energies 12 00719 g006
Figure 7. Generation, demand and modified demand hourly power curves of the whole microgrid, during scheduled 24 h: (a) COF; (b) MOF.
Energies 12 00719 g007
Figure 8. Pgrid of the whole microgrid during scheduled 24 h (positive values for export energy flow and negative for import): (a) Without ESS; (b) COF; (c) MOF.
Energies 12 00719 g008
Figure 9. SoC of batteries during scheduled 24 h: (a) COF; (b) MOF.
Energies 12 00719 g009
Figure 10. Generation, demand and modified demand hourly power curves of the whole microgrid, during scheduled 24 h, in the new case study: (a) COF; (b) MOF.
Energies 12 00719 g010
Figure 11. Pgrid during scheduled 24 h (positive values for export energy flow and negative for import), in the new case study: (a) Without ESS; (b) COF; (c) MOF.
Energies 12 00719 g011
Figure 12. SoC of batteries during scheduled 24 h, in the new case study: (a) COF; (b) MOF.
Energies 12 00719 g012
Table 1. SC and SS indicators for each of the prosumers with individual schedule.
ProsumerIndicatorWithout ESSCOFMOF
Prosumer 1SC0.63270.46110.7568
SS0.33060.24100.3955
Prosumer 2SC0.1384−0.0177 10.3427
SS0.5083−0.0651 11.2582 2
1SS < 0 is due to negative values of Dmod(t) in Equation (9). 2 SS > 1 means that imported energy is higher than household daily demand.
Table 2. Energy import and export for each of the prosumers with individual schedule.
ProsumerIndicatorWithout ESSCOFMOF
Prosumer 1|Eimp| (kWh)27.20327.04720.495
|Eexp| (kWh)7.80111.4454.893
Prosumer 2|Eimp| (kWh)2.8444.3610.014
|Eexp| (kWh)18.29721.61413.952
Table 3. Economic indicators for each of the prosumers with individual schedule.
ProsumerIndicatorWithout ESSCOFMOF
Prosumer 1CP (kW)4.24.43.9
Costbnt (€/day)1.29591.02581.0610
Costant (€/day)2.93512.68092.3723
Prosumer 2CP (kW)2.72.62.1
Costbnt (€/day)−1.0278−1.1826−0.9135
Costant (€/day)−0.6120−0.7088−0.6871
Table 4. SC and SS indicators for the whole microgrid with coordinated scheduling.
IndicatorWithout ESSCOFMOF
SC0.41680.31120.5950
SS0.38140.28470.5444
Table 5. Energy import and export for the whole coordinated microgrid.
IndicatorWithout ESSCOFMOF
|Eimp| (kWh)28.72027.60615.553
|Eexp| (kWh)24.77129.25717.204
Table 6. Economic indicators for the whole microgrid, and individual CP and sum of both prosumers costs with individual schedule.
Type of ScheduleIndicatorWithout ESSCOFMOF
Coordinated (whole microgrid)CPMG(kW)4.24.83.3
Costbnt (€/day)0.2680−0.1604−0.0756
Costant (€/day)1.98261.57000.9617
Individual (sum of both prosumers)CP1/CP2 (kW)4.2/2.74.4/2.63.9/2.1
Costbnt (€/day)0.2681−0.15680.1475
Costant (€/day)2.32311.97211.6852
Table 7. SC and SS rates, energy import and export and economic indicators for the whole coordinated microgrid, in the new case study.
IndicatorsWithout ESSCOFMOF
SC0.47830.44560.7004
SS0.45550.42440.6671
|Eimp| (kWh)24.28520.0719.248
|Eexp| (kWh)22.16123.54712.724
CP (kW)3.64.21.9
Costbnt (€/day)0.1059−0.3326−0.2308
Costant (€/day)1.56141.00060.3807

