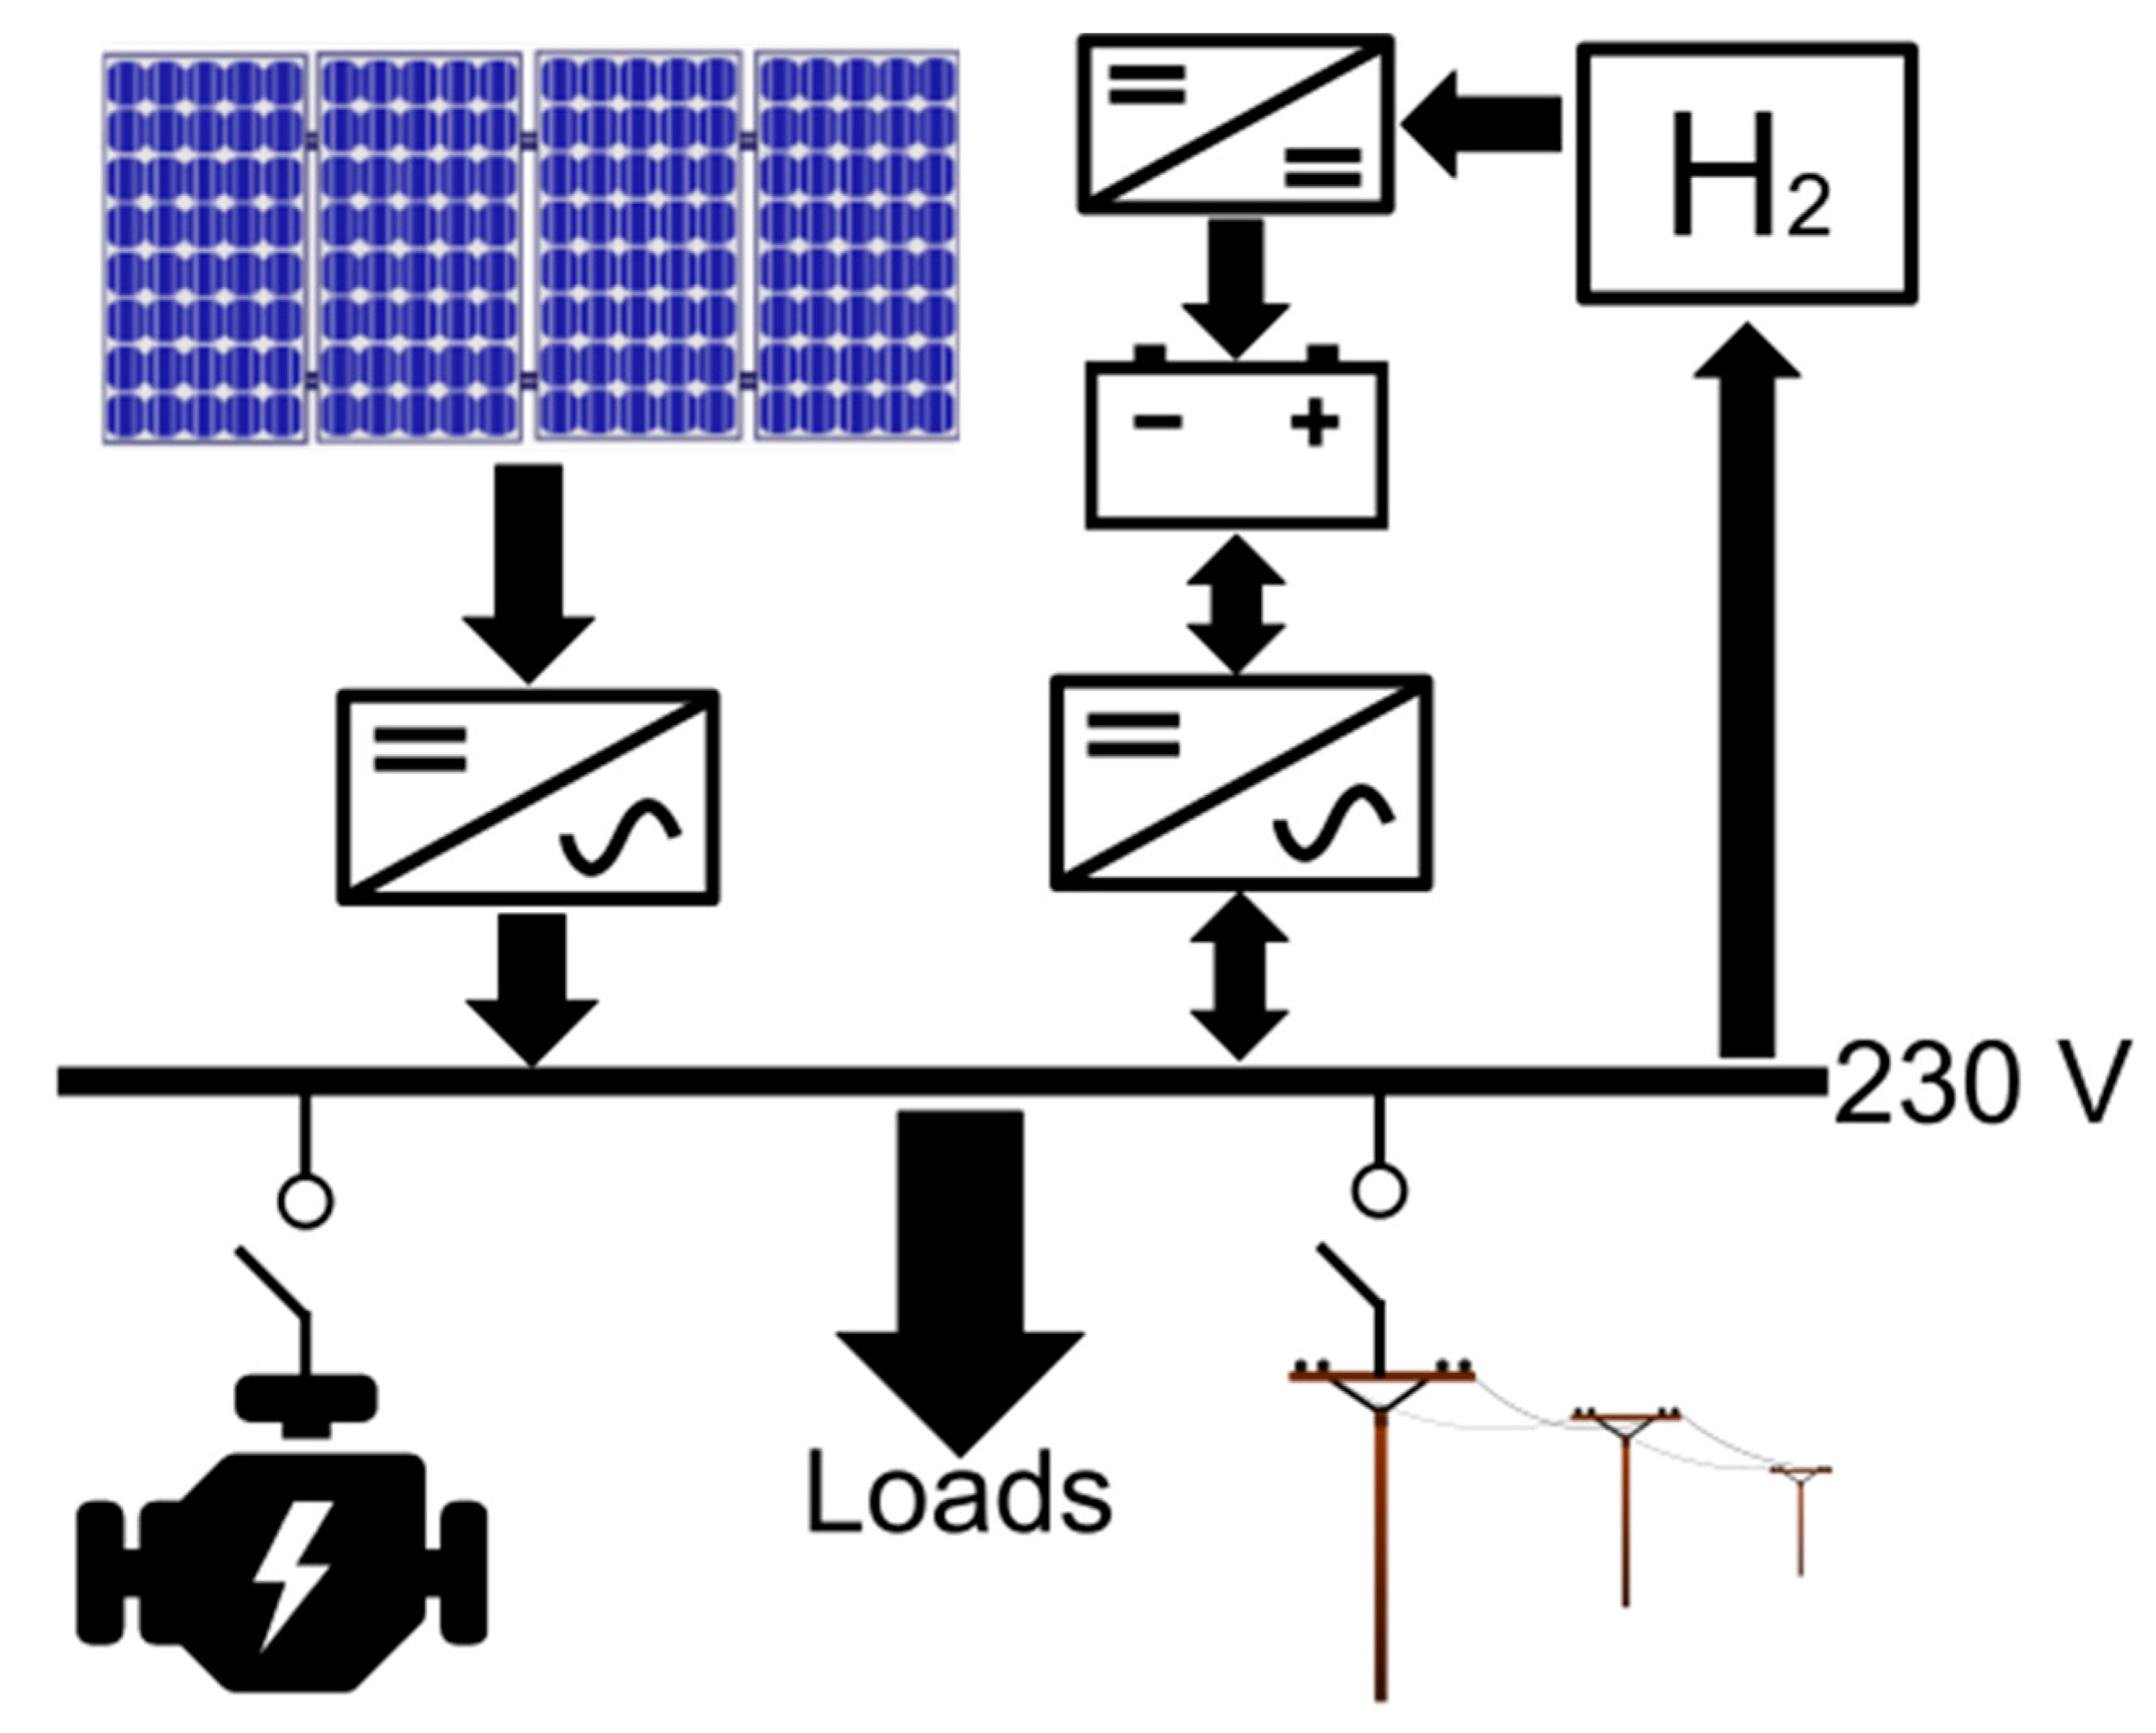
Figure 1.
Simplified schematic of the energy system for the nanogrid. Reproduced with permission from [
7], Nömm, J.; Rönnberg, S.K.; Bollen, M.H.J. An Analysis of Frequency Variations and its Implications on Connected Equipment for a Nanogrid during Islanded Operation. Energies 2018, 11, 2456.
Figure 1.
Simplified schematic of the energy system for the nanogrid. Reproduced with permission from [
7], Nömm, J.; Rönnberg, S.K.; Bollen, M.H.J. An Analysis of Frequency Variations and its Implications on Connected Equipment for a Nanogrid during Islanded Operation. Energies 2018, 11, 2456.
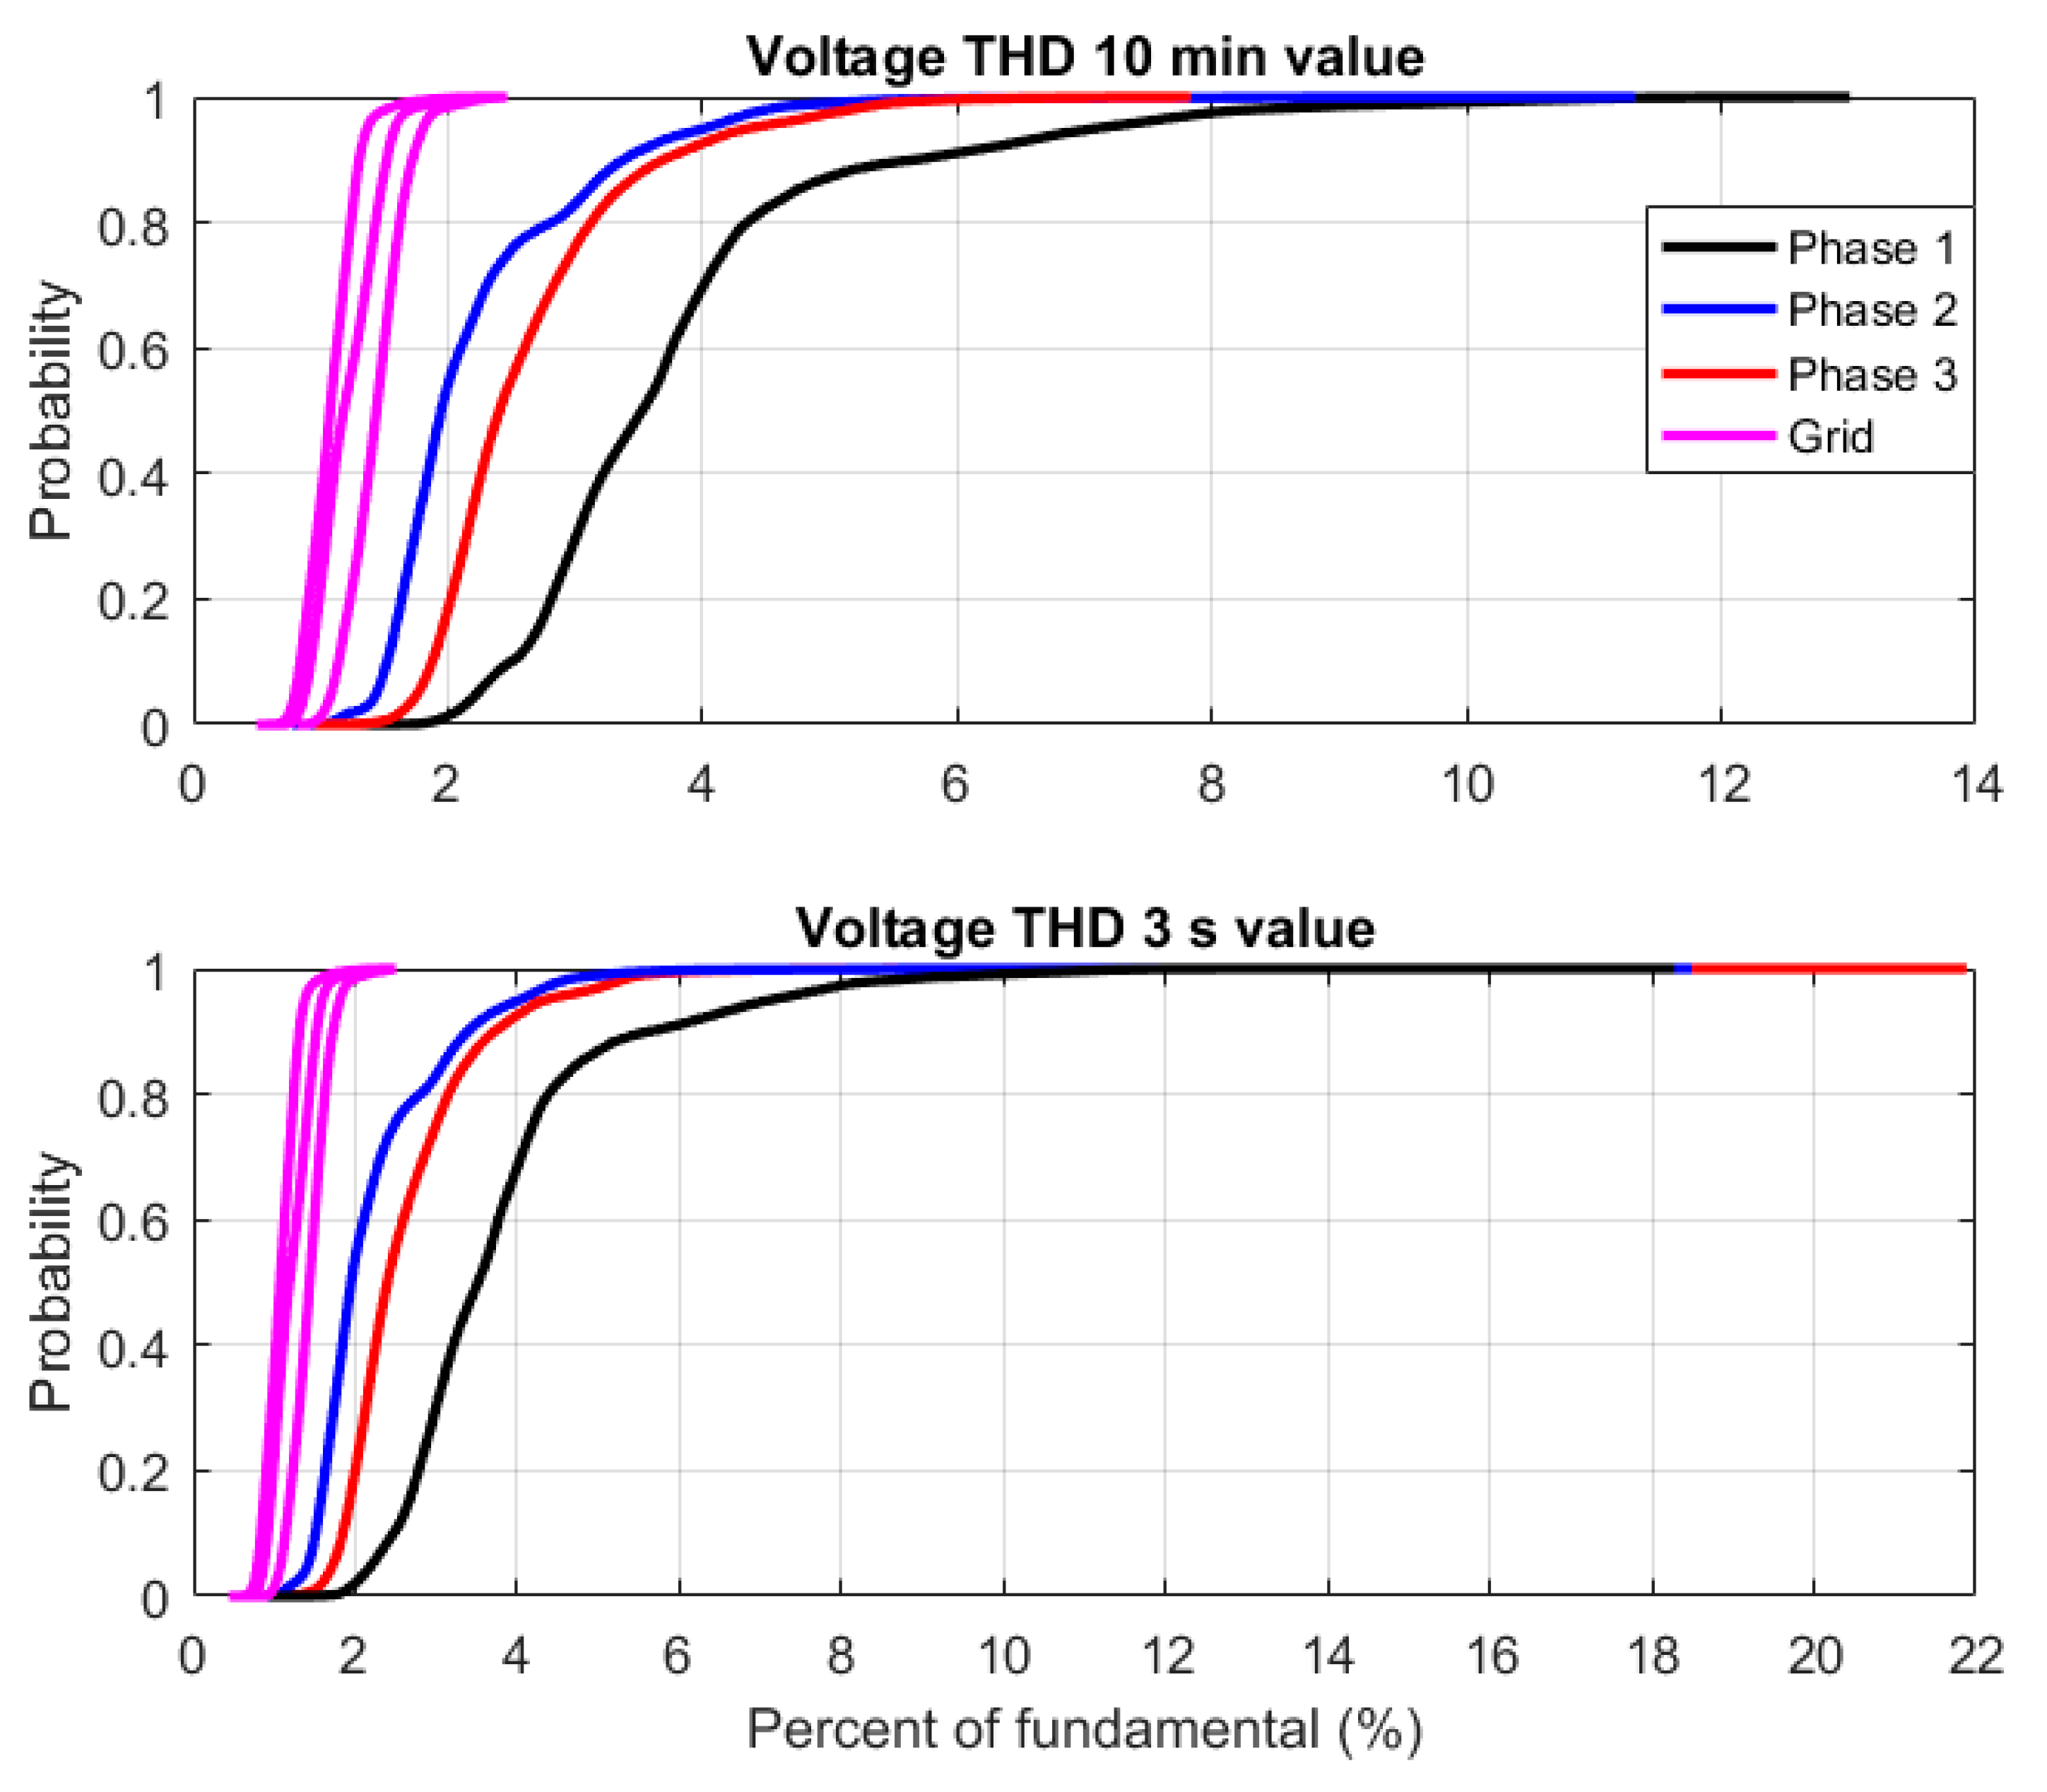
Figure 2.
Cumulative distribution function (CDF) for the 10 min voltage Total Harmonic Distortion (THD) for the nanogrid during islanded and grid-connected operation (top) and the CDF for the 3 s voltage THD during grid-connected and islanded operation (bottom). Note that the horizontal axis is different for each plot.
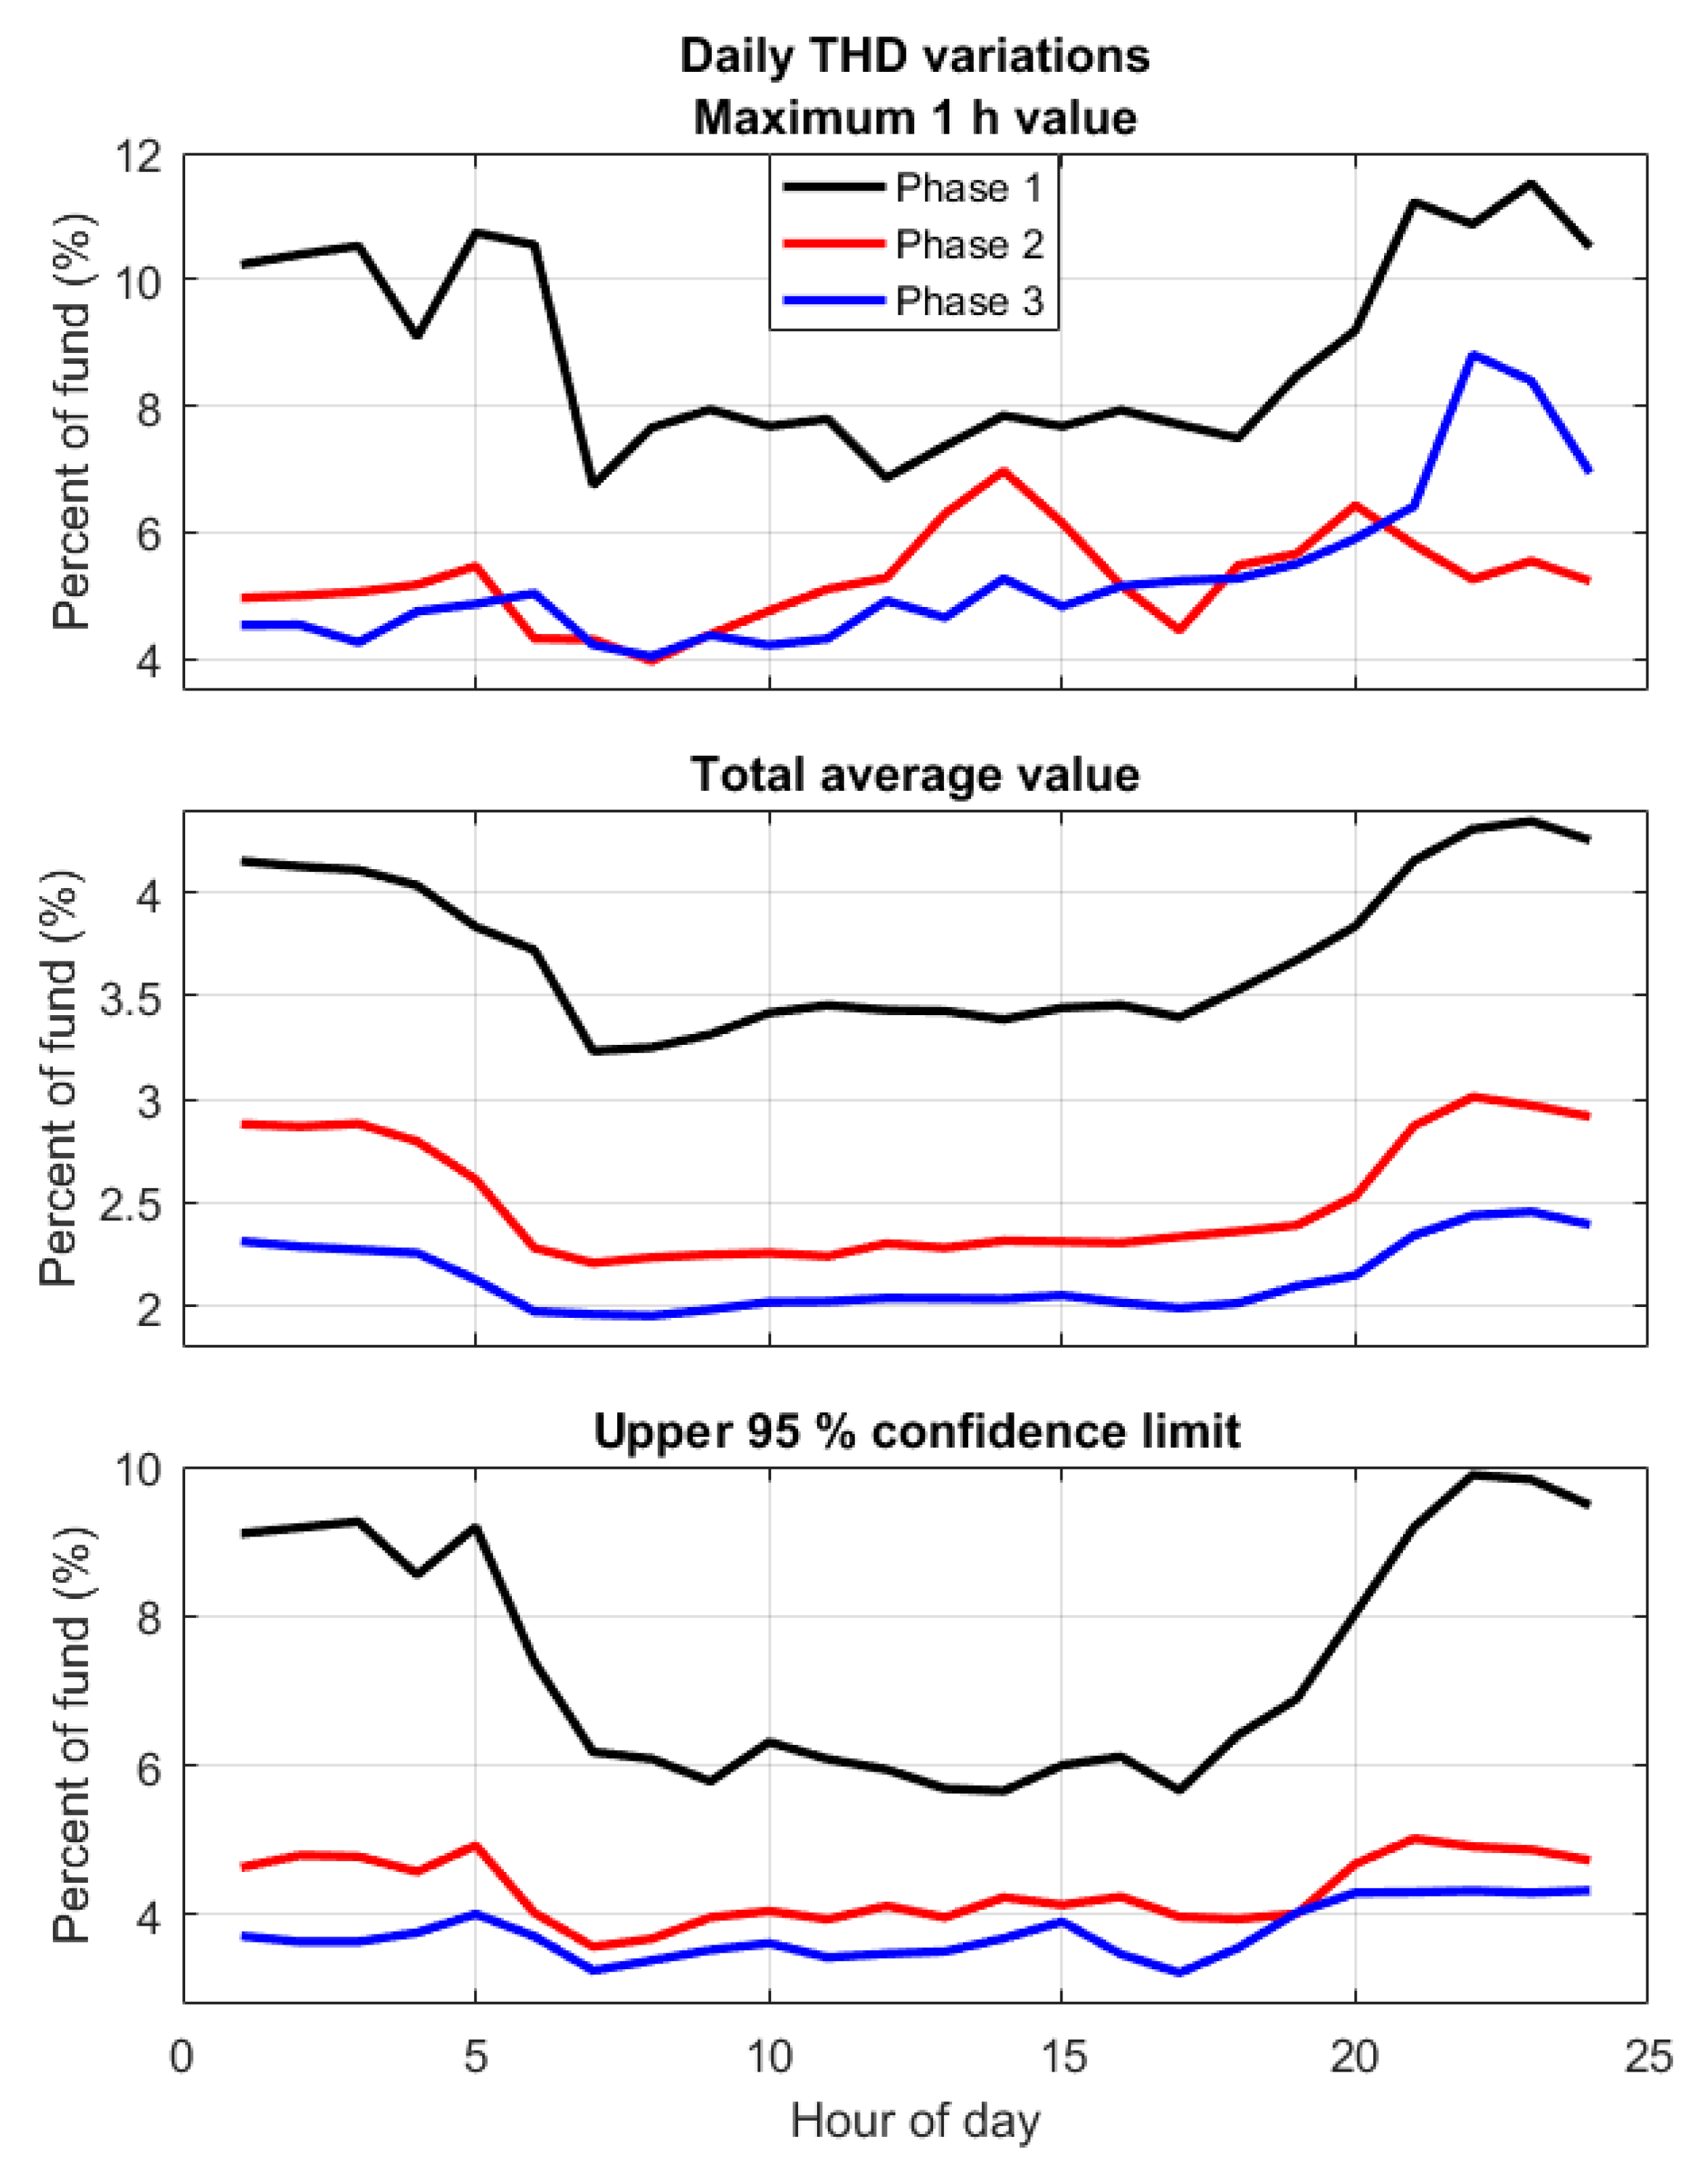
Figure 3.
The 1 h maximum THD value, total average THD value and upper 95% confidence limit for every hour during the day for 29 weeks of continuous islanded operation. The black, red and blue color represents the three phases. Note the difference in vertical scale for each plot.
Figure 3.
The 1 h maximum THD value, total average THD value and upper 95% confidence limit for every hour during the day for 29 weeks of continuous islanded operation. The black, red and blue color represents the three phases. Note the difference in vertical scale for each plot.
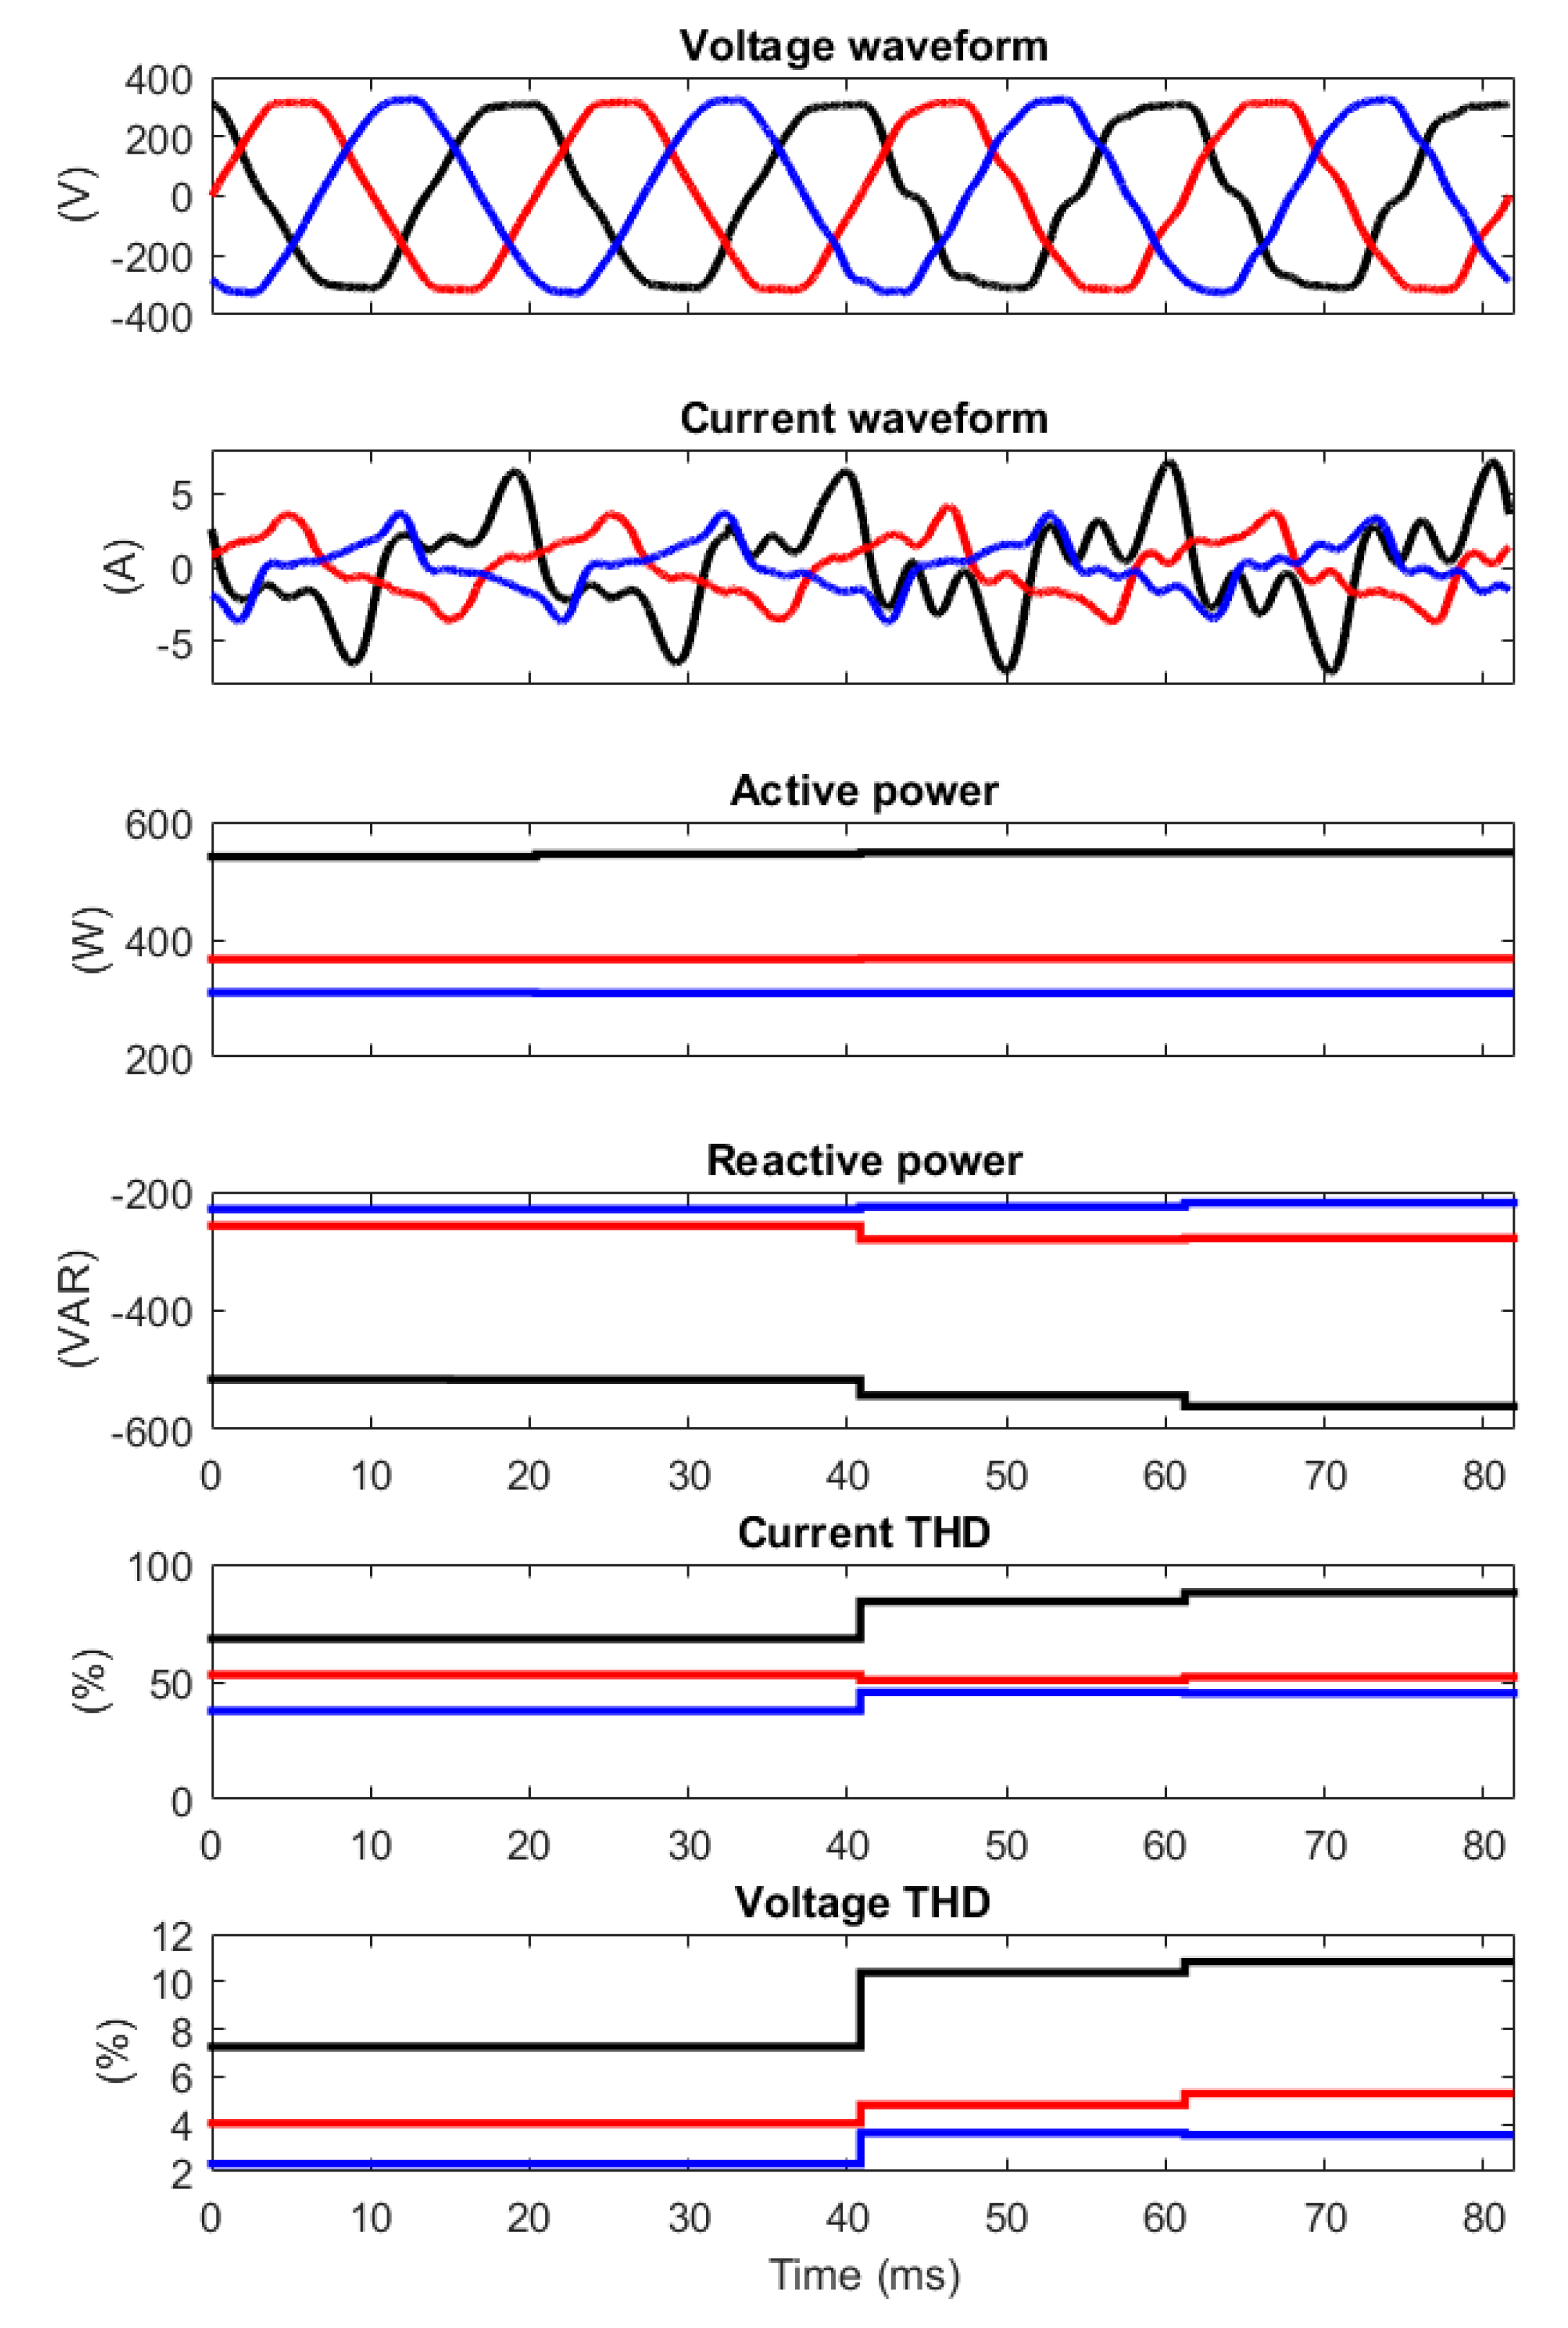
Figure 4.
Example of an occasion when the voltage THD increases in the evening. The voltage waveform is at the top followed by the current waveform, active power, reactive power, current THD and voltage THD. The black, red and blue color represents the three phases.
Figure 4.
Example of an occasion when the voltage THD increases in the evening. The voltage waveform is at the top followed by the current waveform, active power, reactive power, current THD and voltage THD. The black, red and blue color represents the three phases.
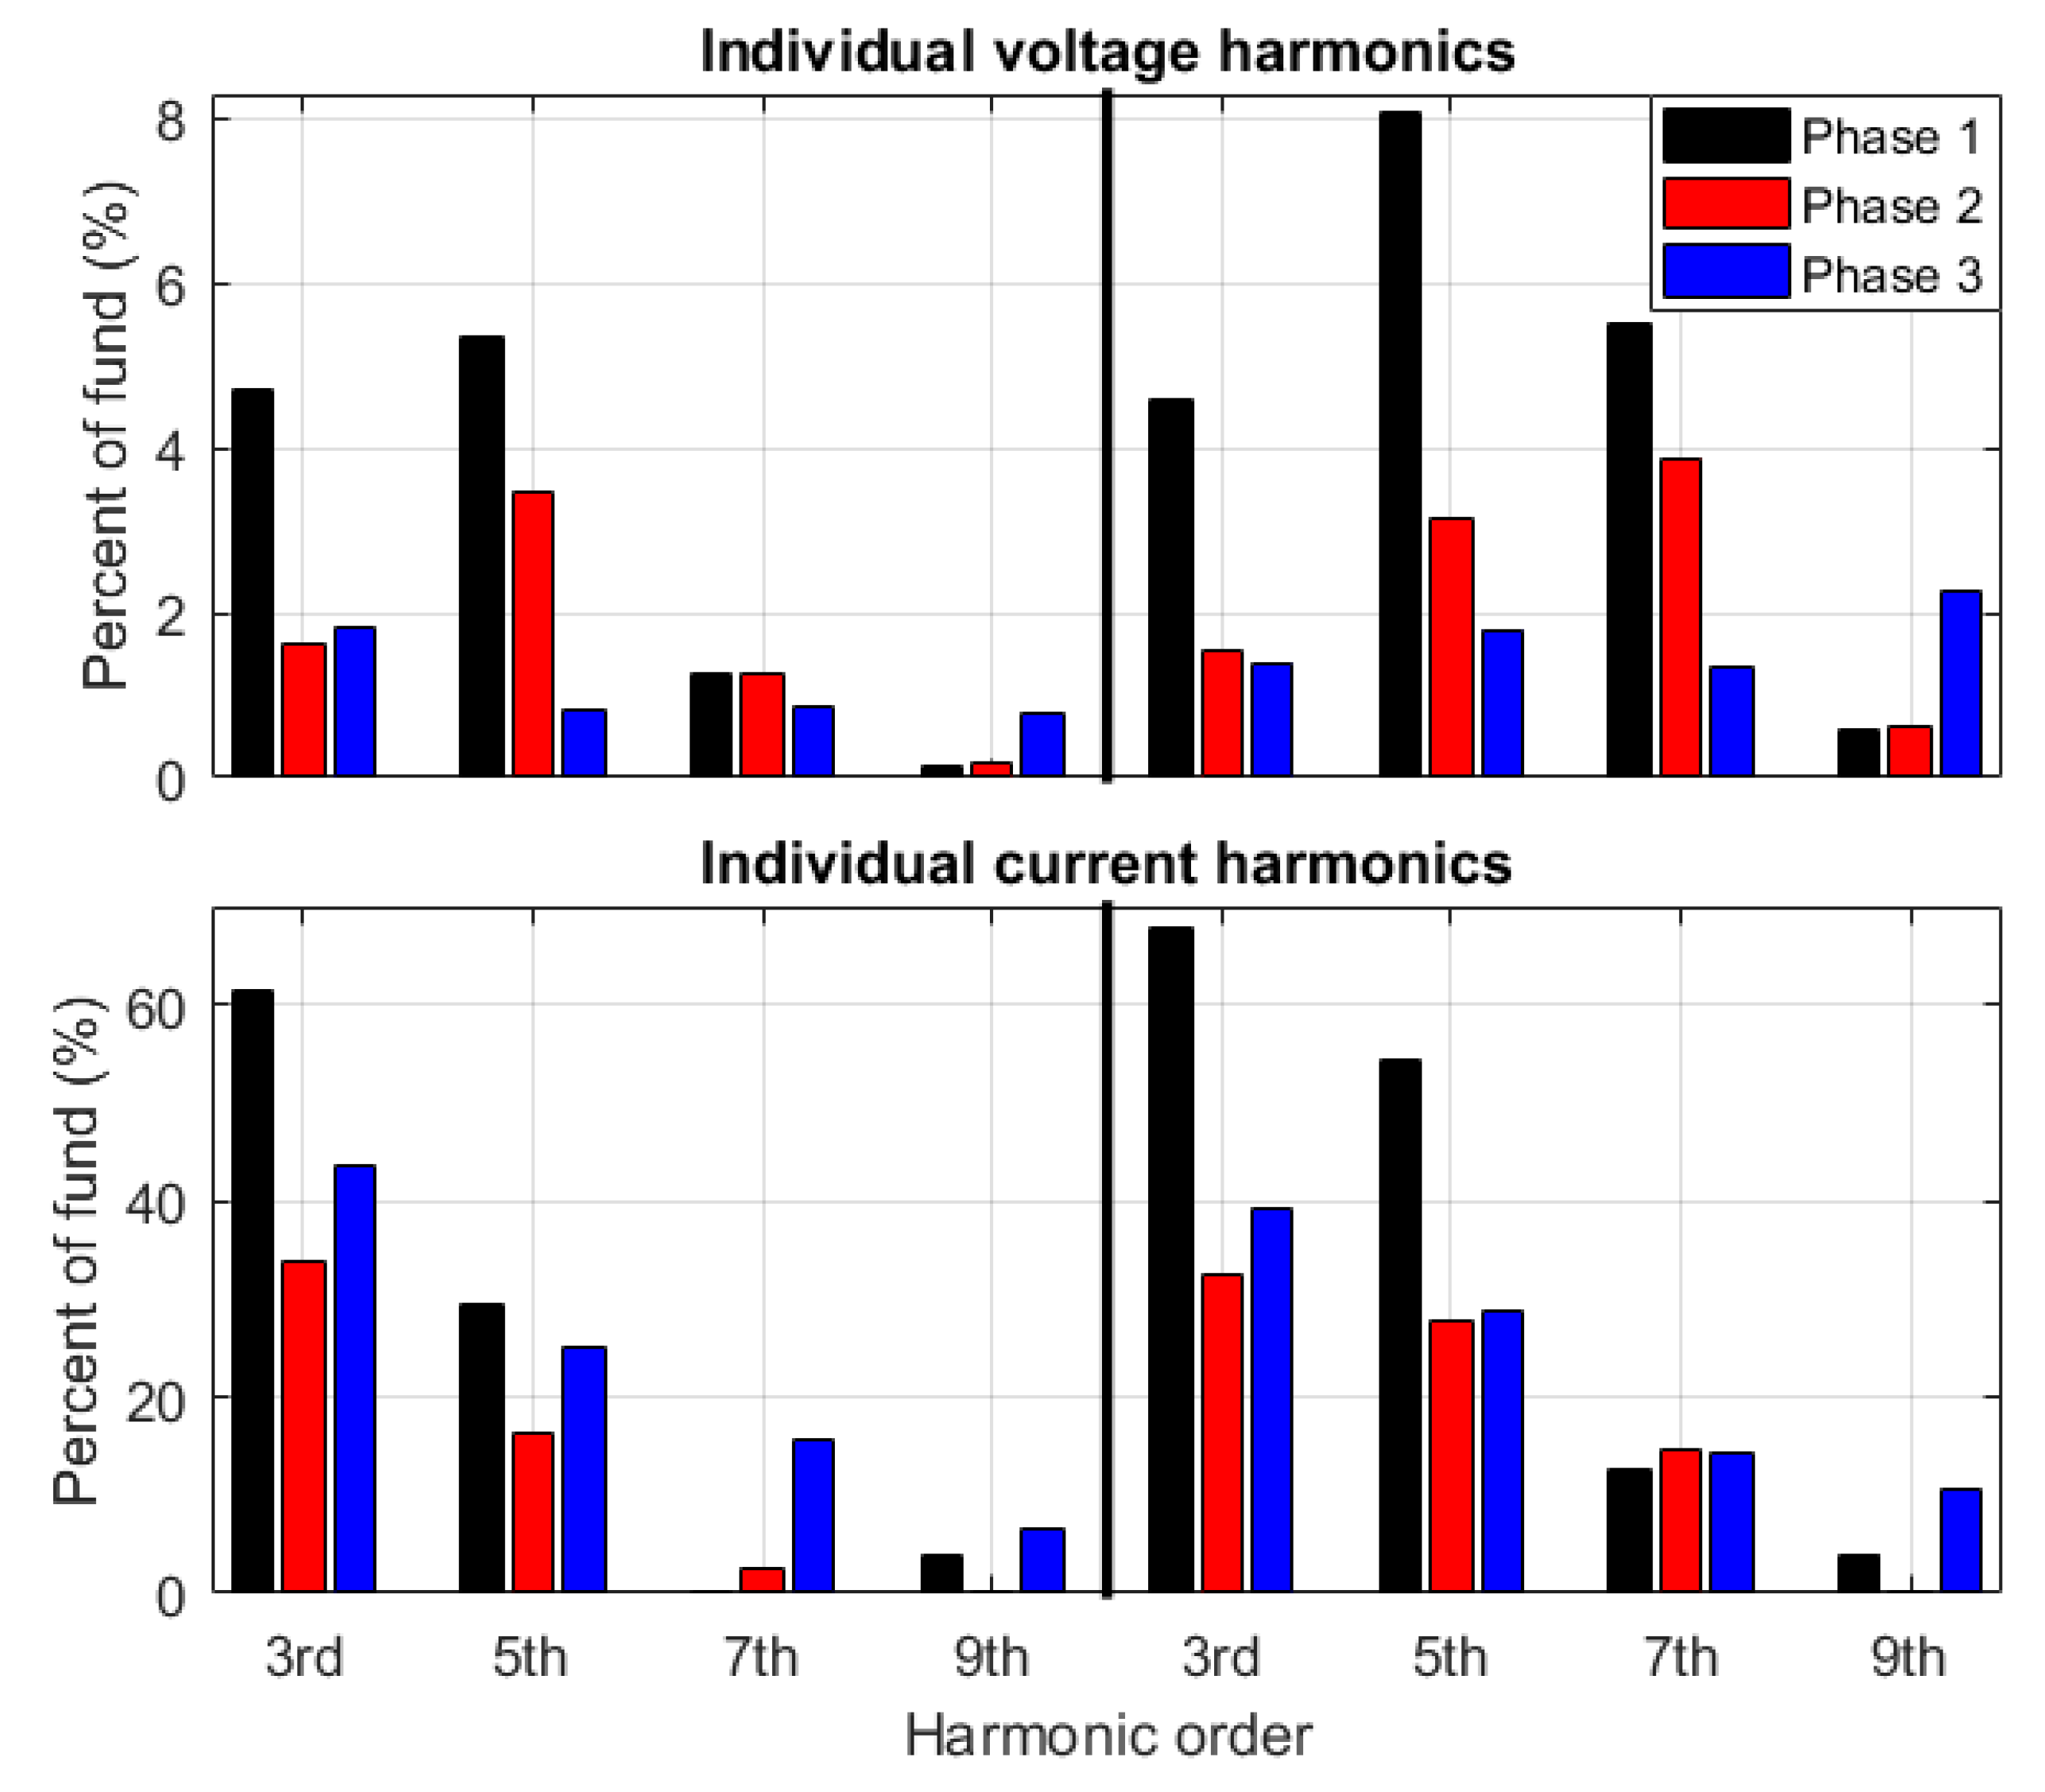
Figure 5.
Individual harmonics of the voltage THD in
Figure 4 where the left side is the individual harmonics at the end of the 1-cycle period at about 20 ms and the right side at about 80 ms.
Figure 5.
Individual harmonics of the voltage THD in
Figure 4 where the left side is the individual harmonics at the end of the 1-cycle period at about 20 ms and the right side at about 80 ms.
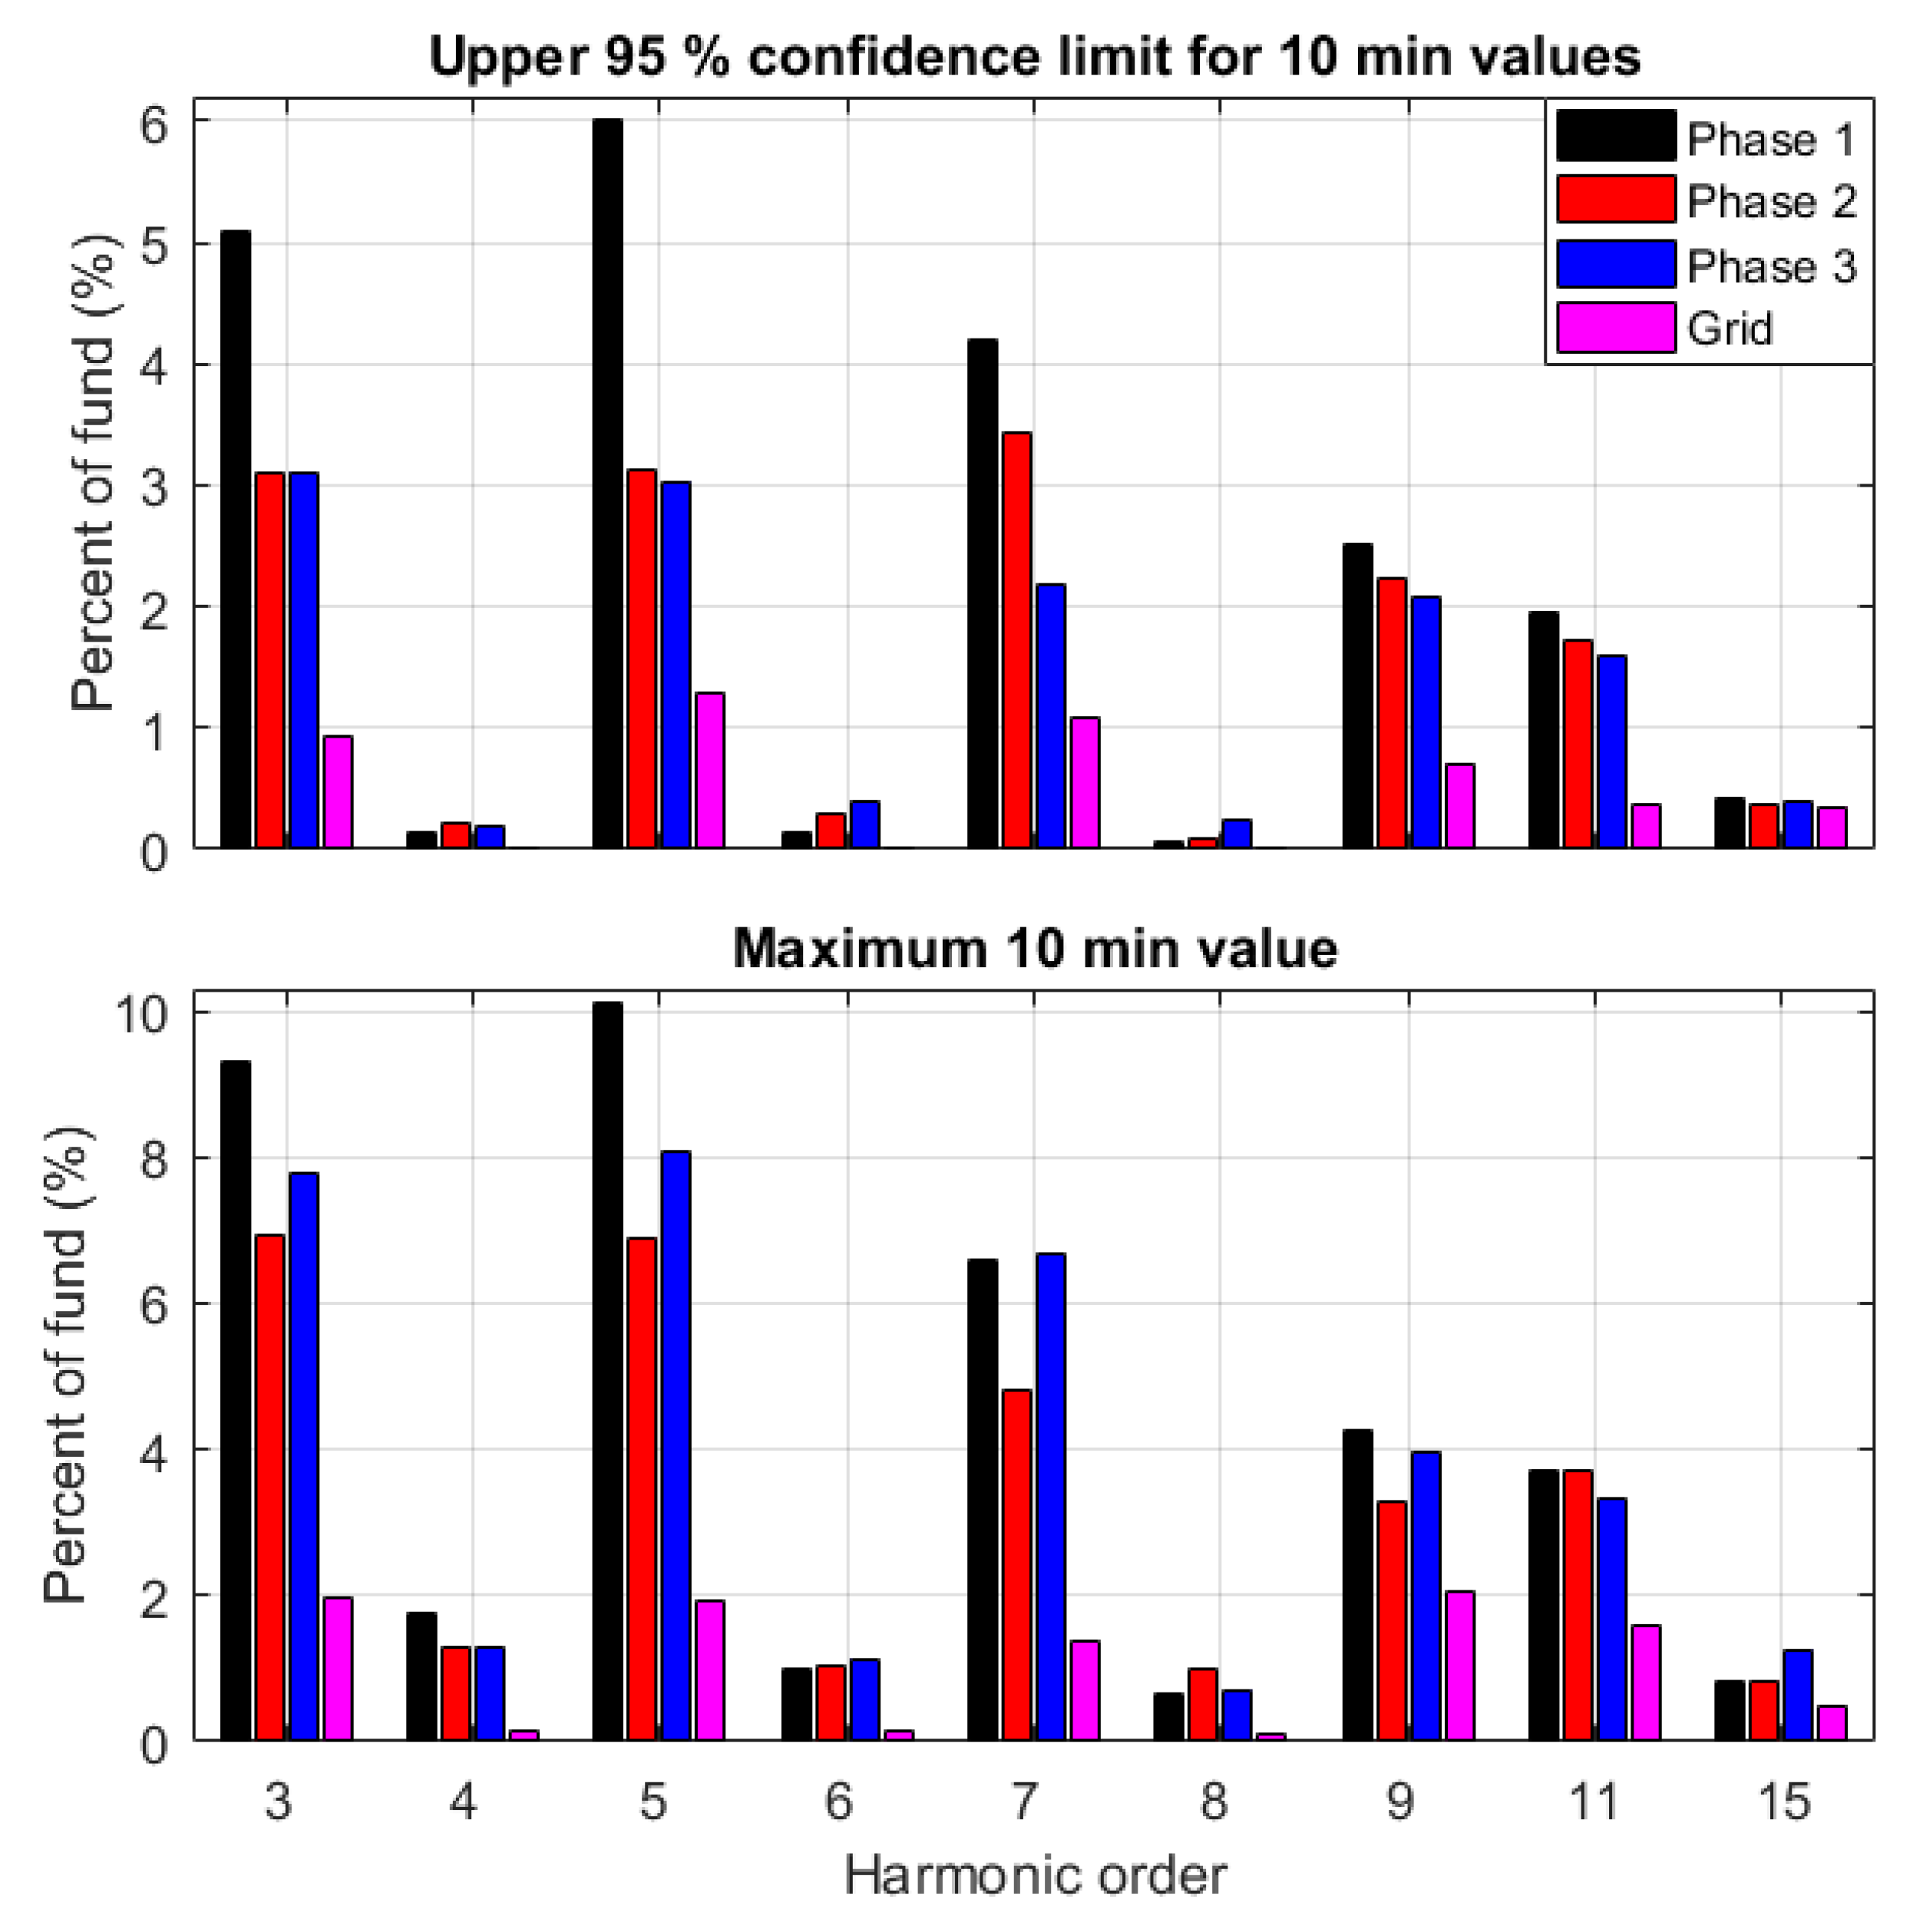
Figure 6.
10 min 95% confidence limit value (top) and the maximum 10 min value in the measurements (bottom) for the odd harmonics 3rd to 11th and 15th and even harmonics 4th to 8th. The black, red and blue color represents phase 1 to 3 in islanded mode. Purple color represents all three phases during grid-connected operation since the distortion differs substantially less between the phases in comparison to islanded operation.
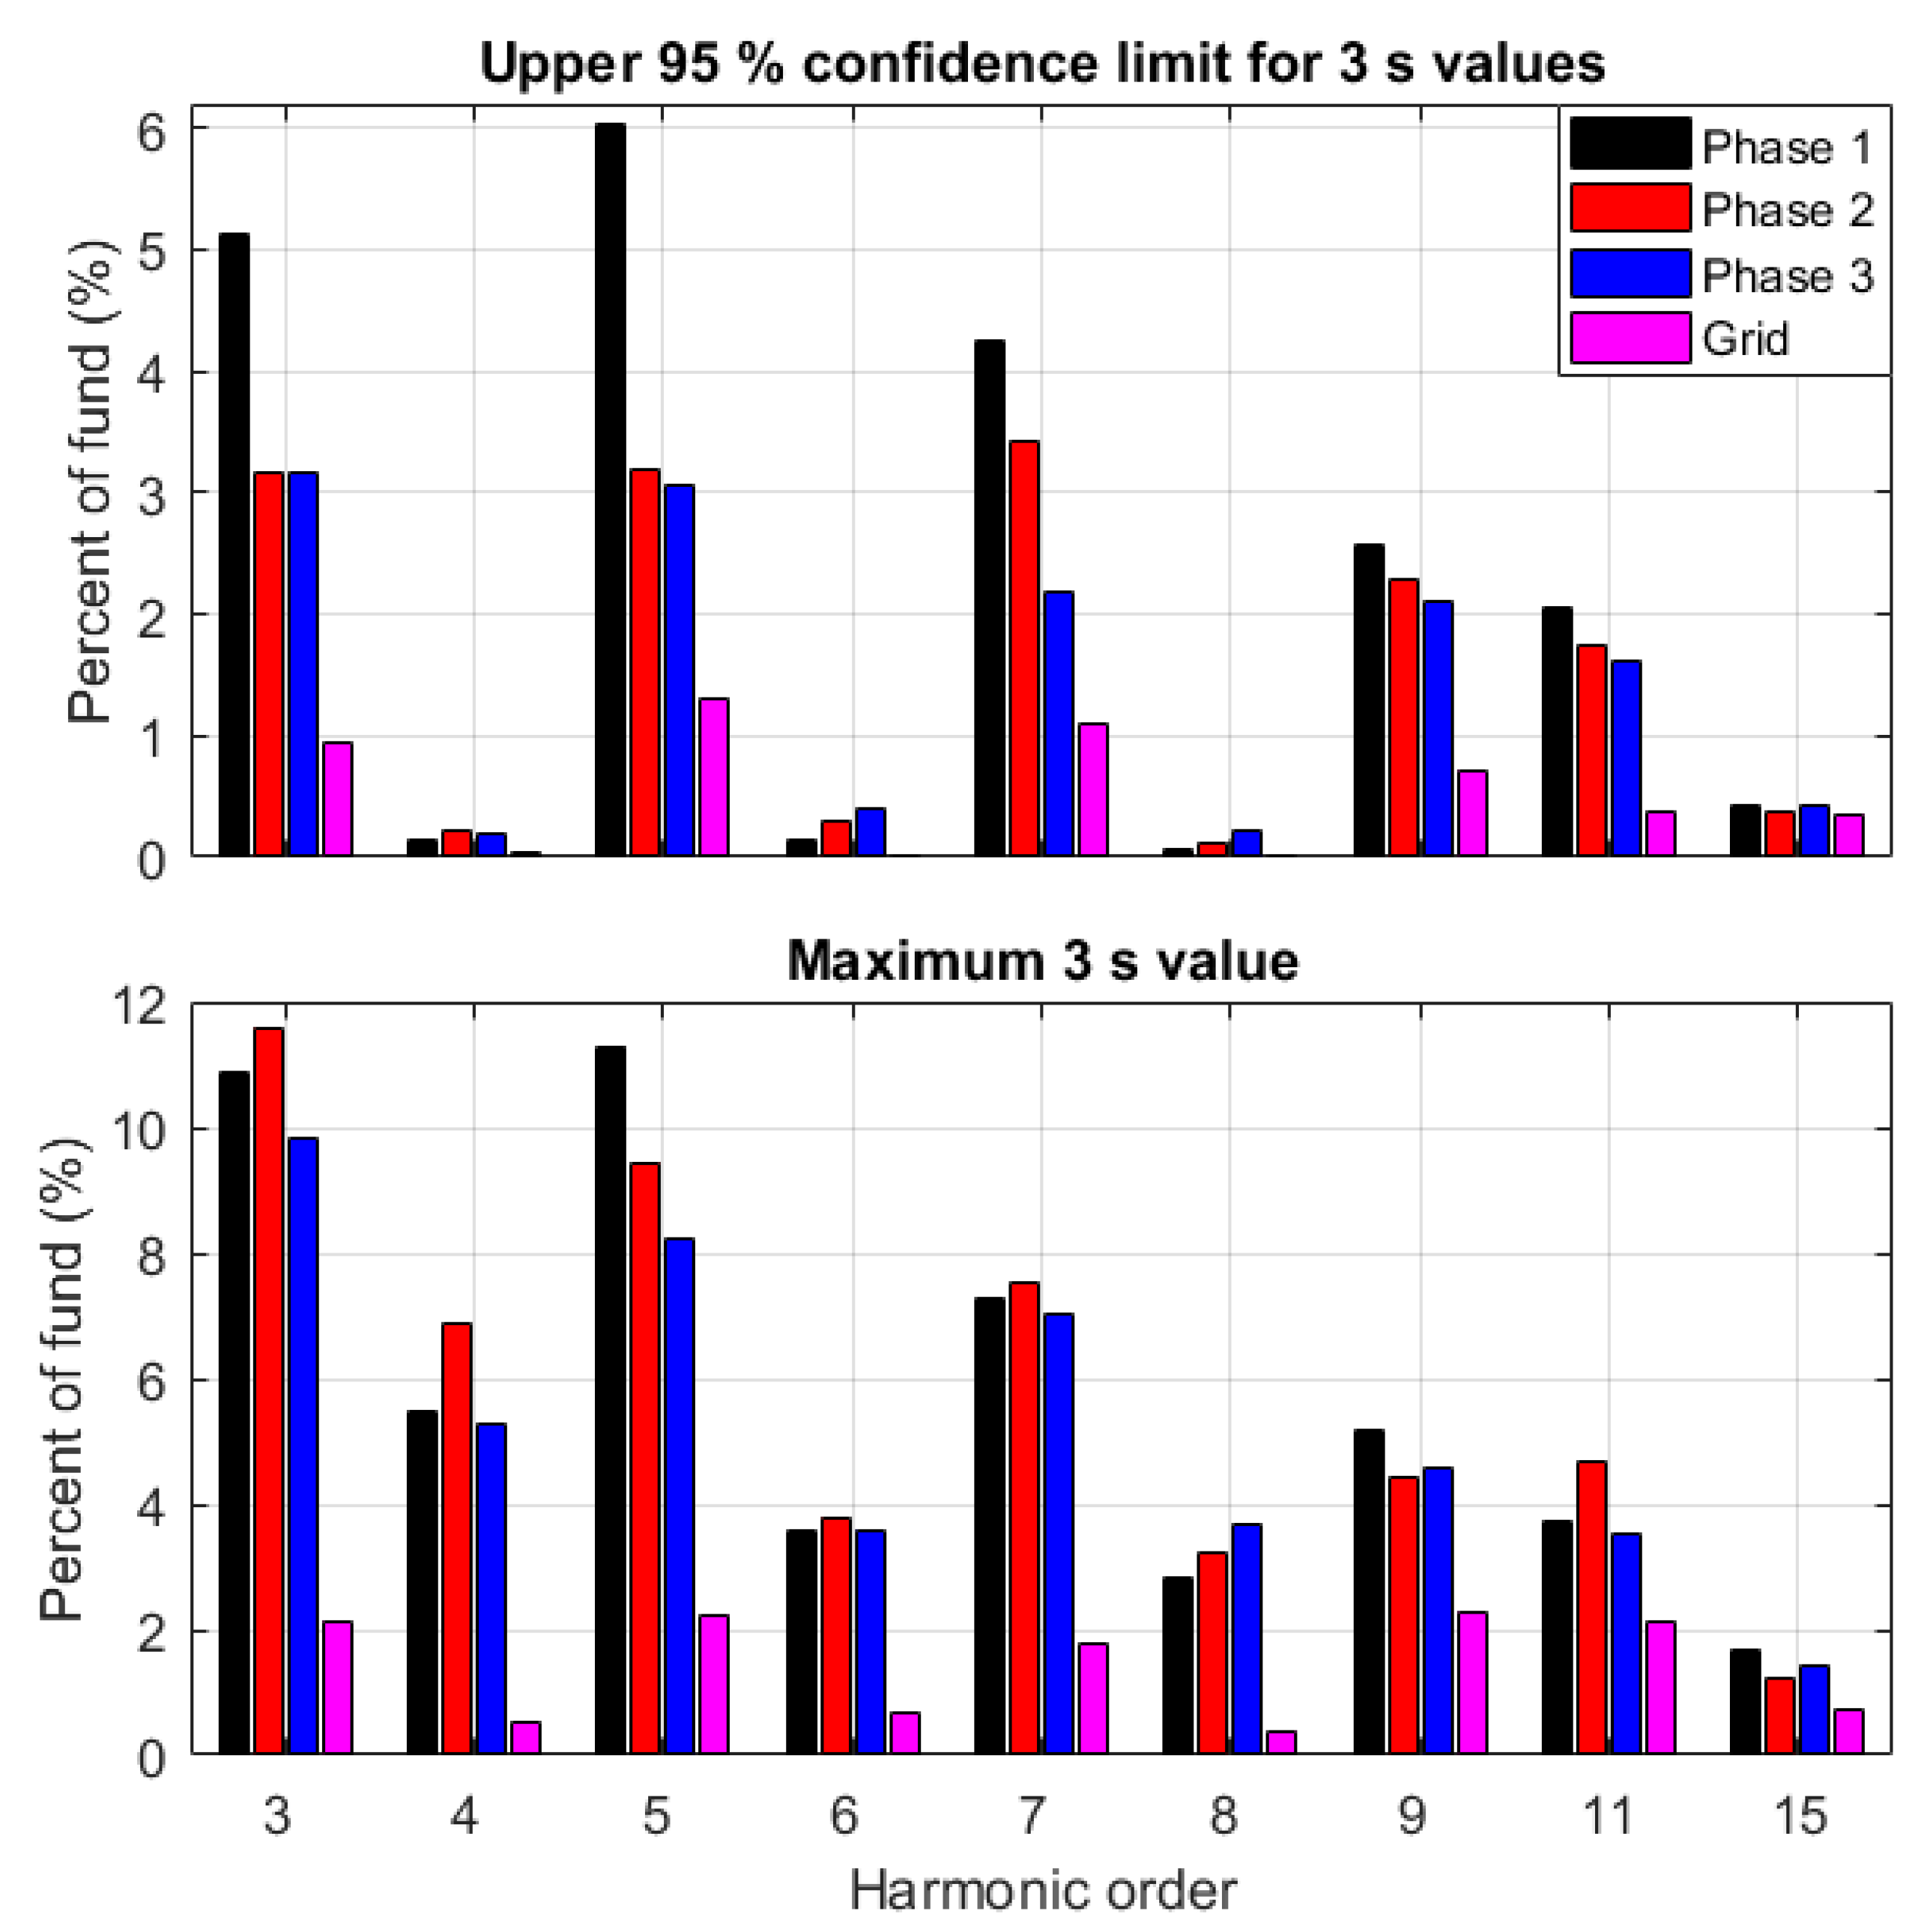
Figure 7.
3 s maximum 95% confidence limit value (top) and the maximum 3 s value in the measurements (bottom) for the odd harmonics 3rd to 11th and 15th and even harmonics 4th to 8th. The black, red and blue color represents phase 1 to 3 in islanded mode. Purple color represents all three phases during grid-connected operation.
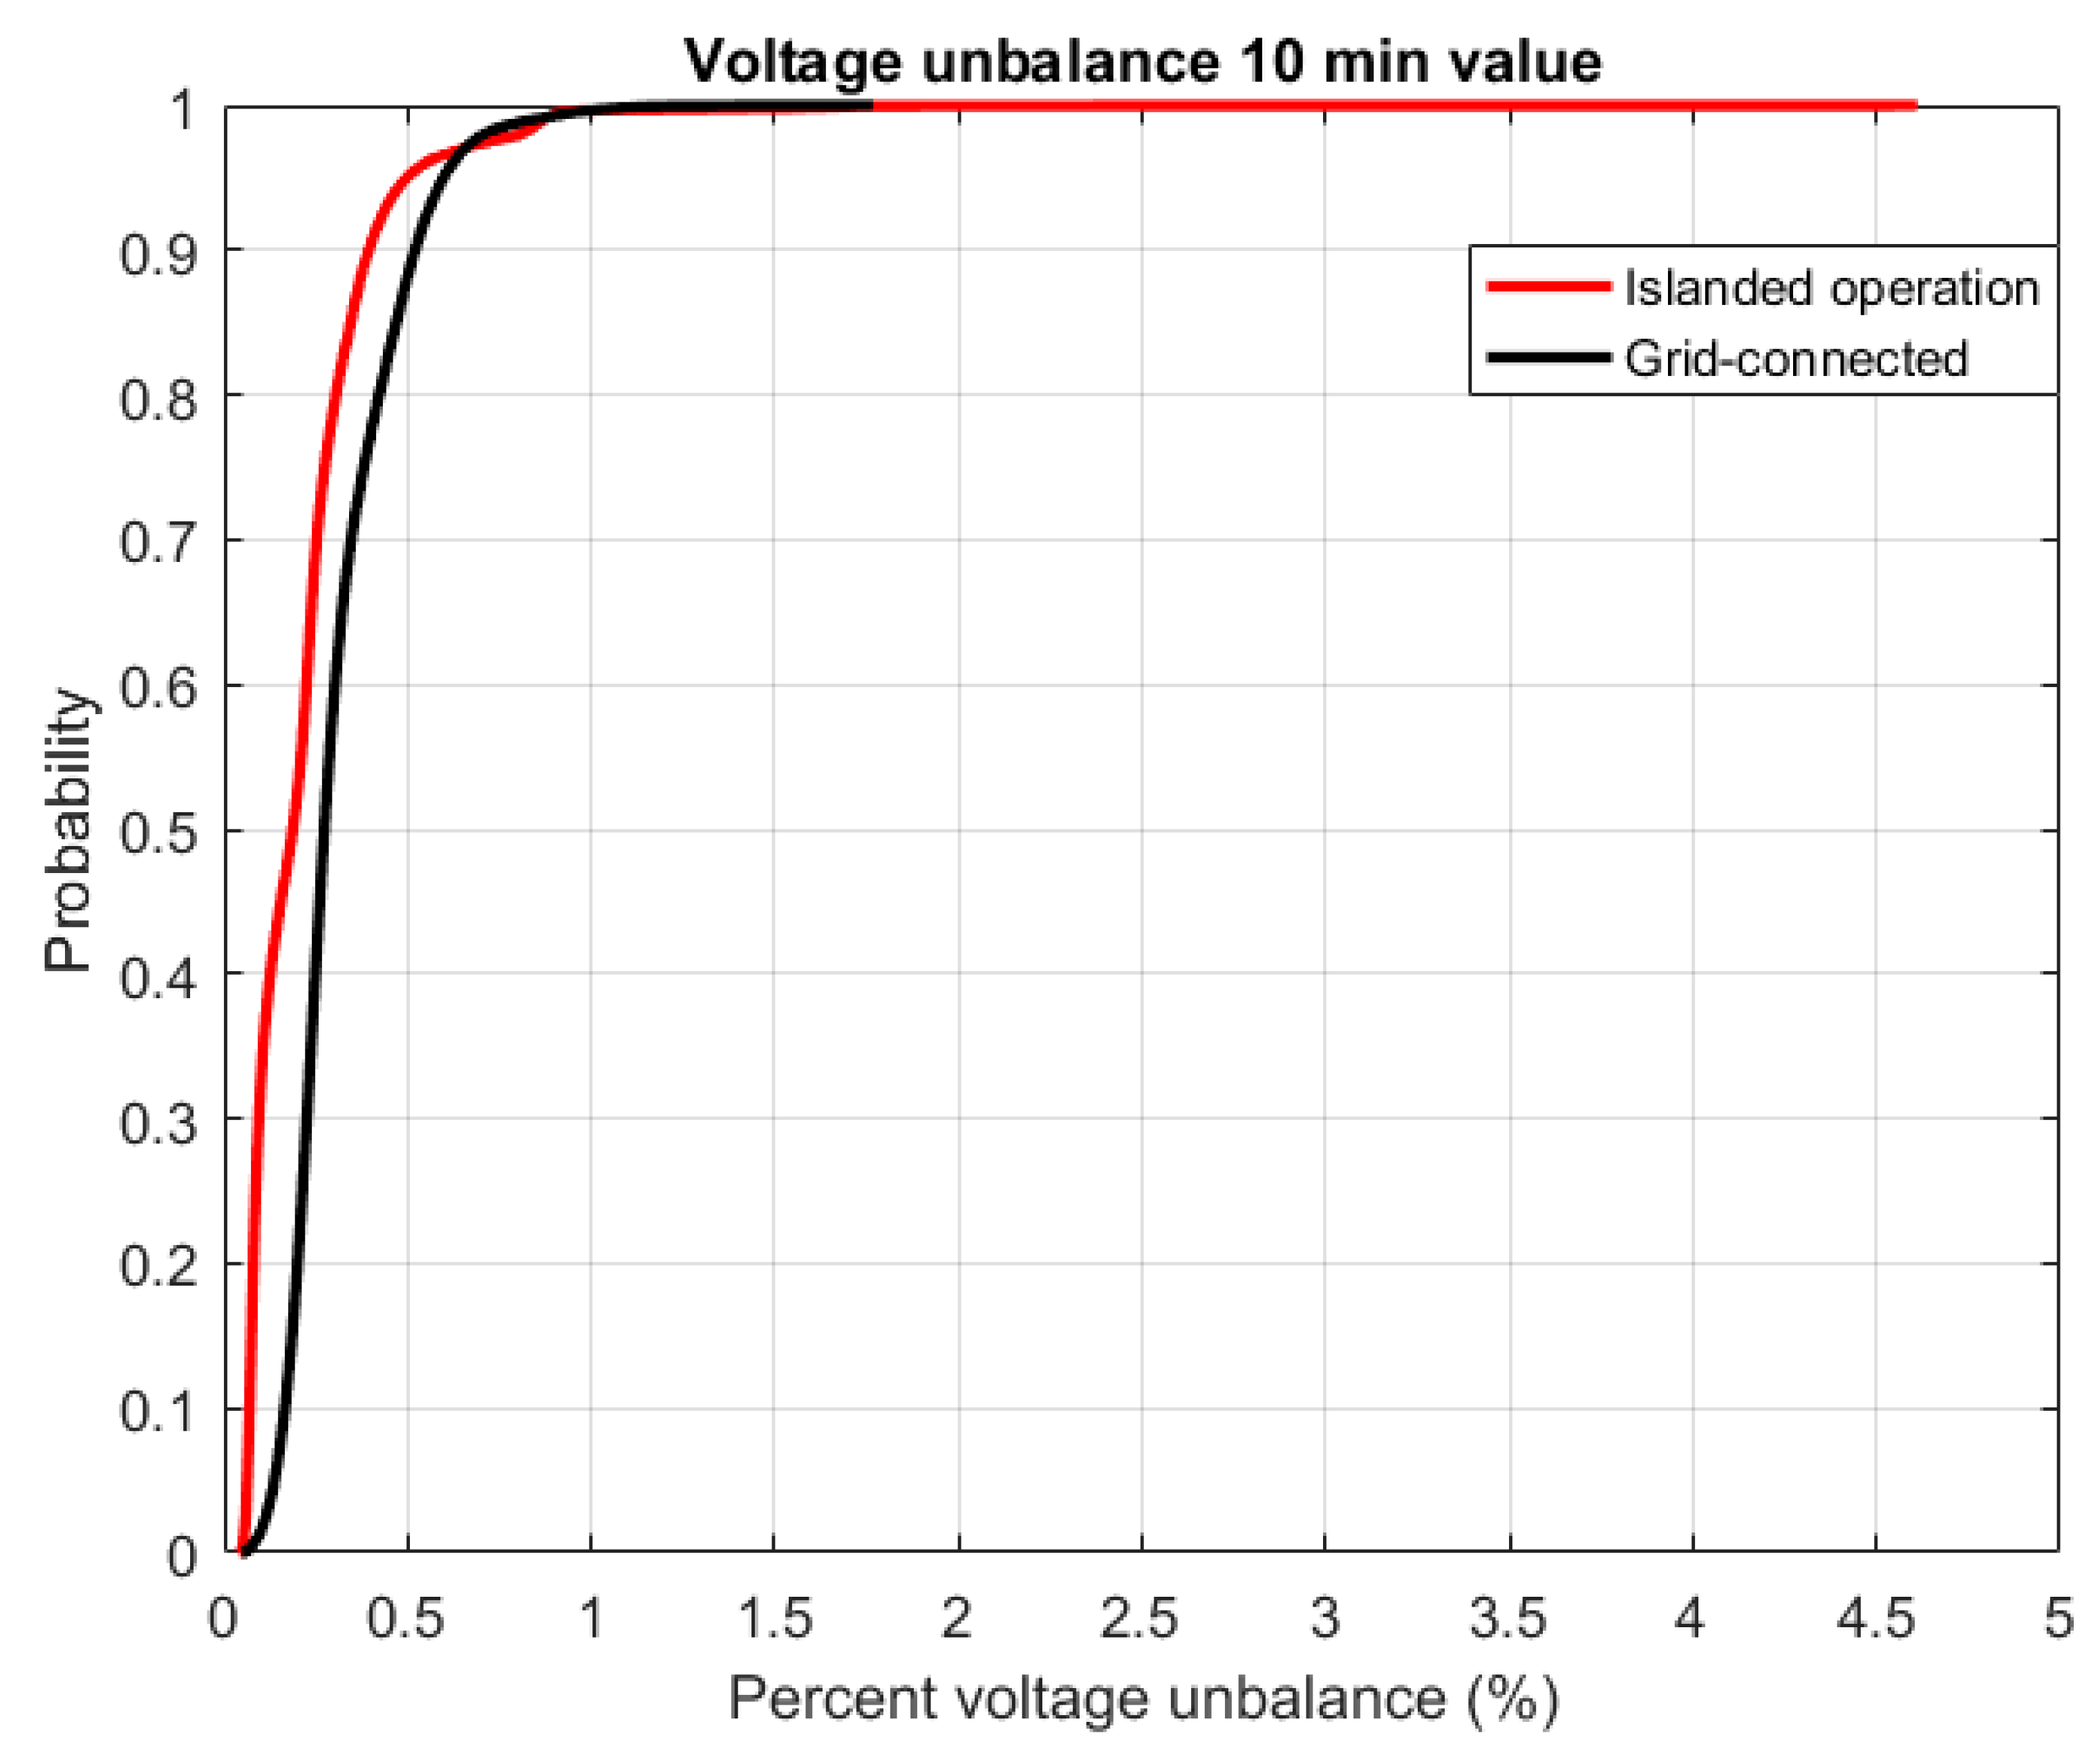
Figure 8.
CDF for the 10 min voltage unbalance values in the nanogrid during islanded and grid-connected operation.
Figure 8.
CDF for the 10 min voltage unbalance values in the nanogrid during islanded and grid-connected operation.
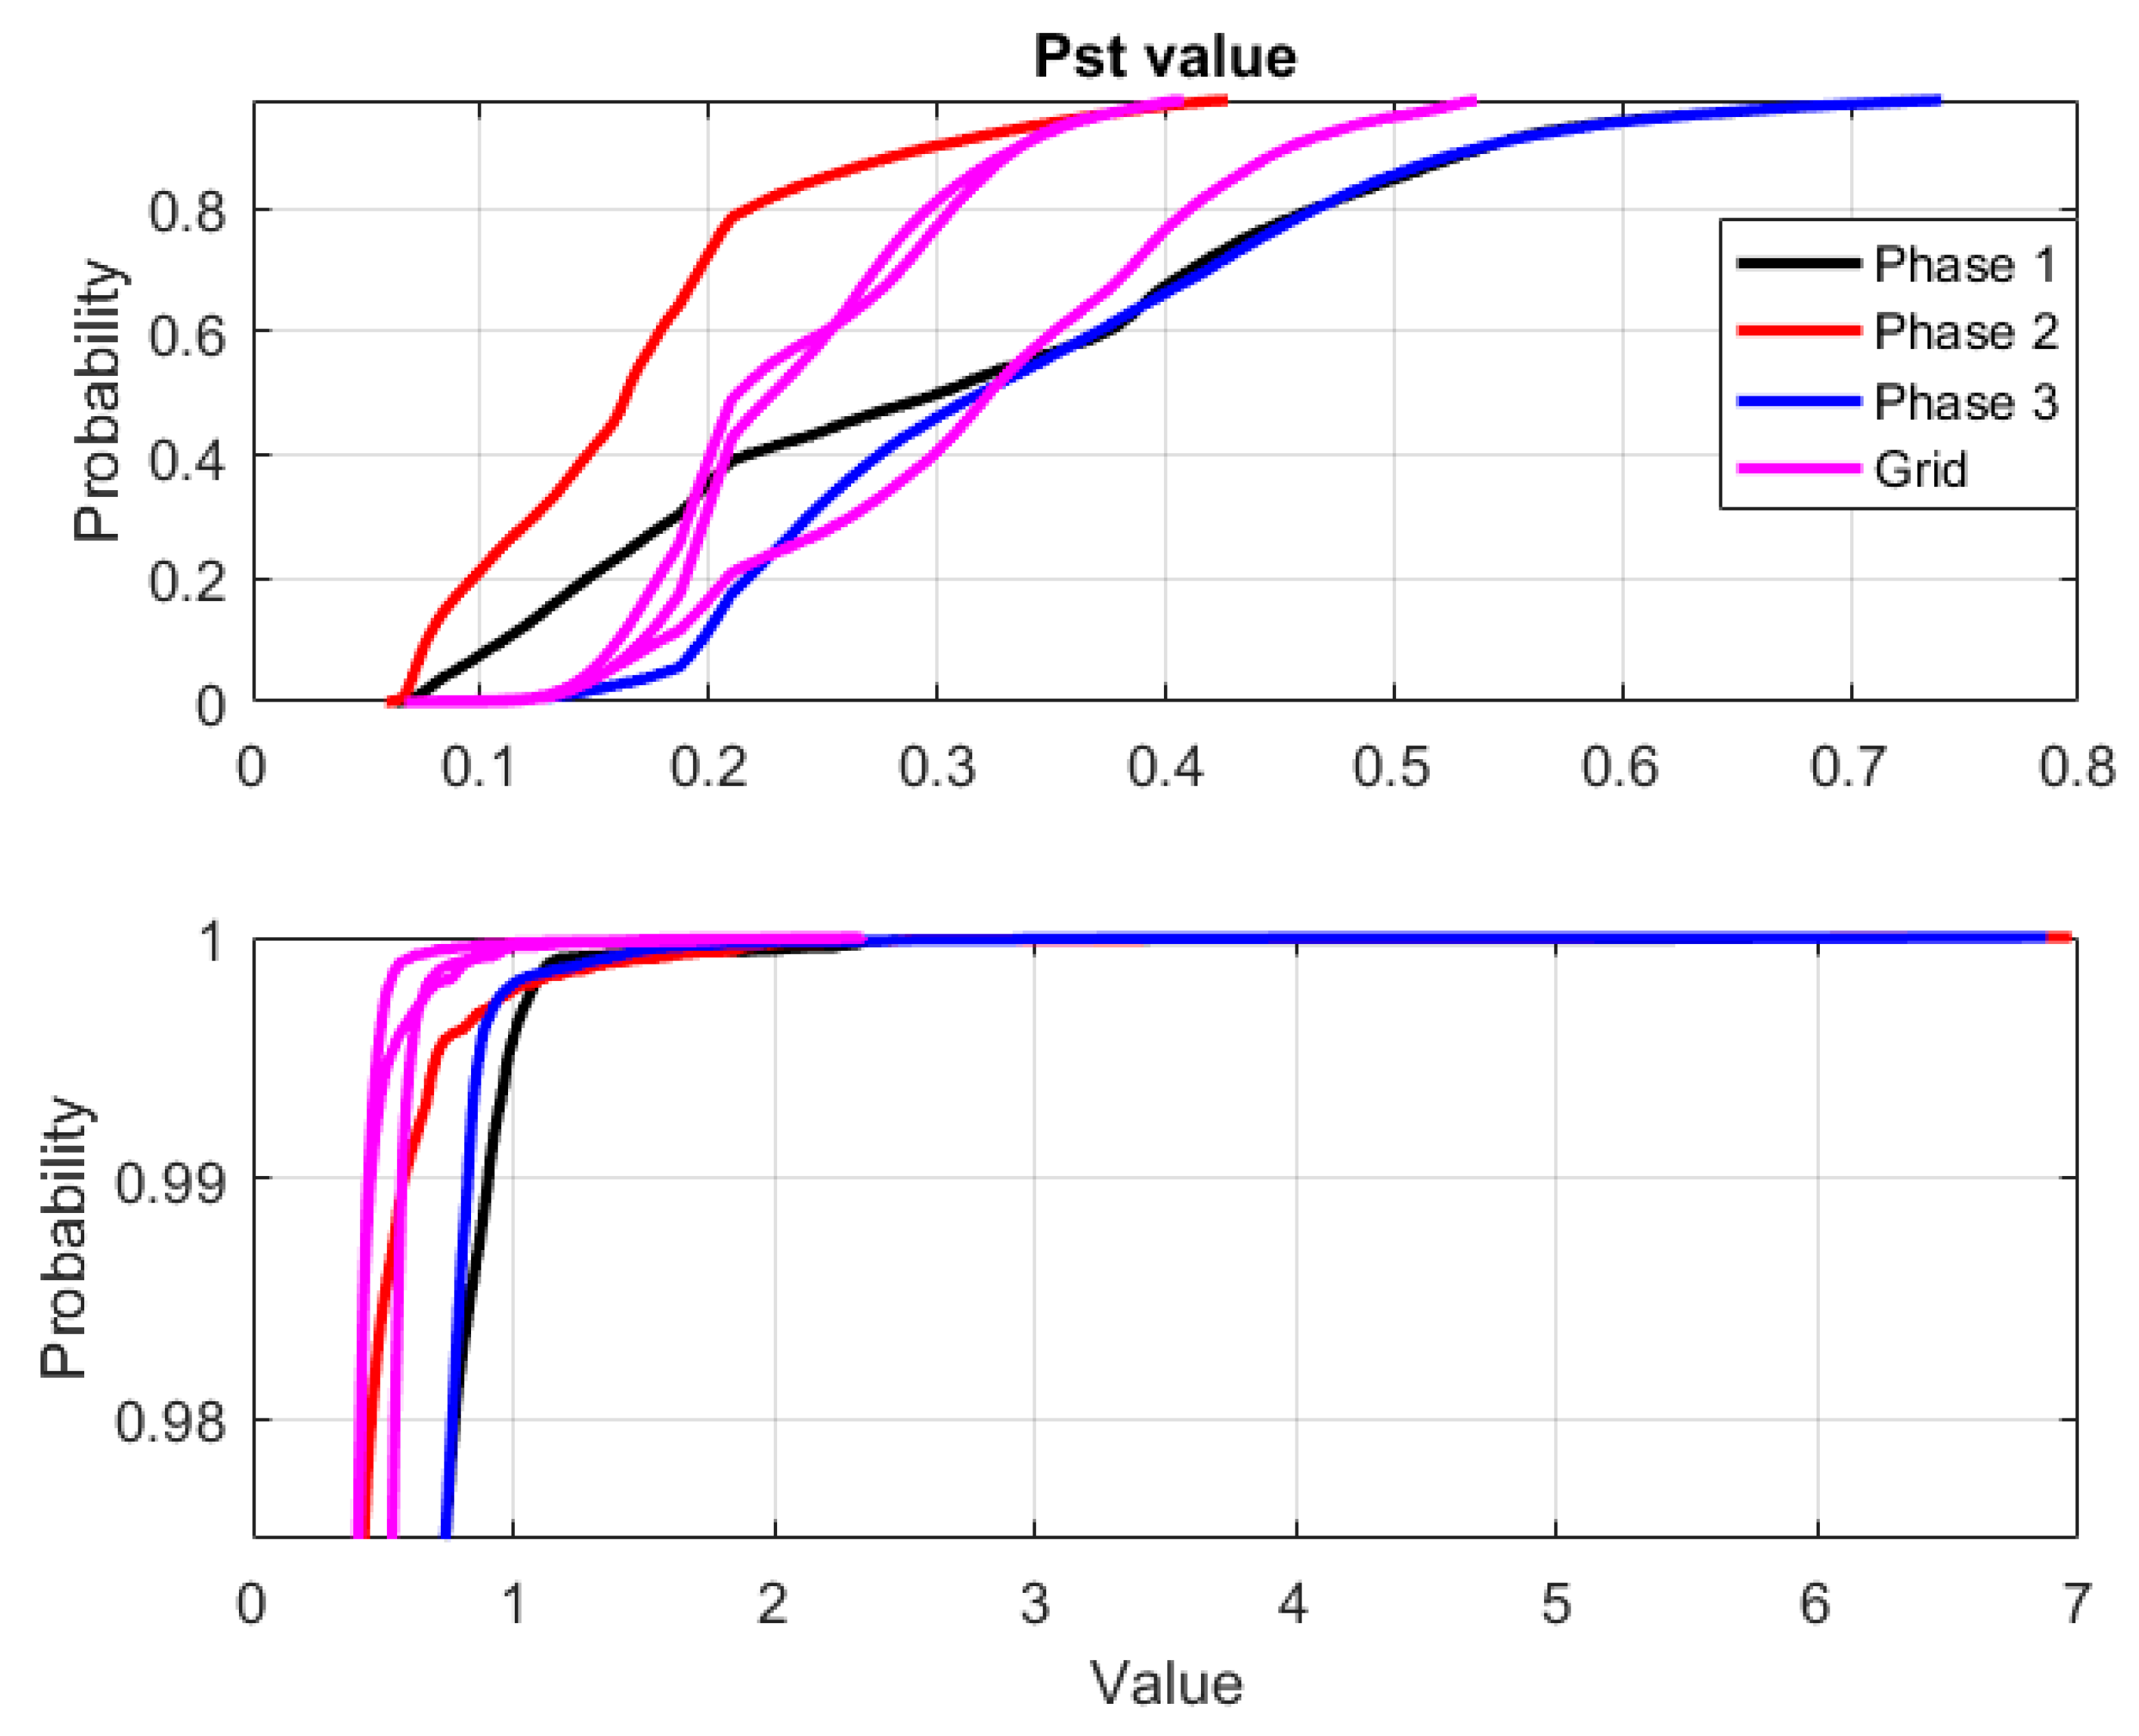
Figure 9.
CDF for the Pst values for grid-connected and islanded operation where the interval 0 to 97.5% is displayed at the top and the remaining upper 2.5% is displayed in the bottom. The black, red and blue color represents phase 1 to 3 in islanded mode. Purple color represents all three phases during grid-connected operation.
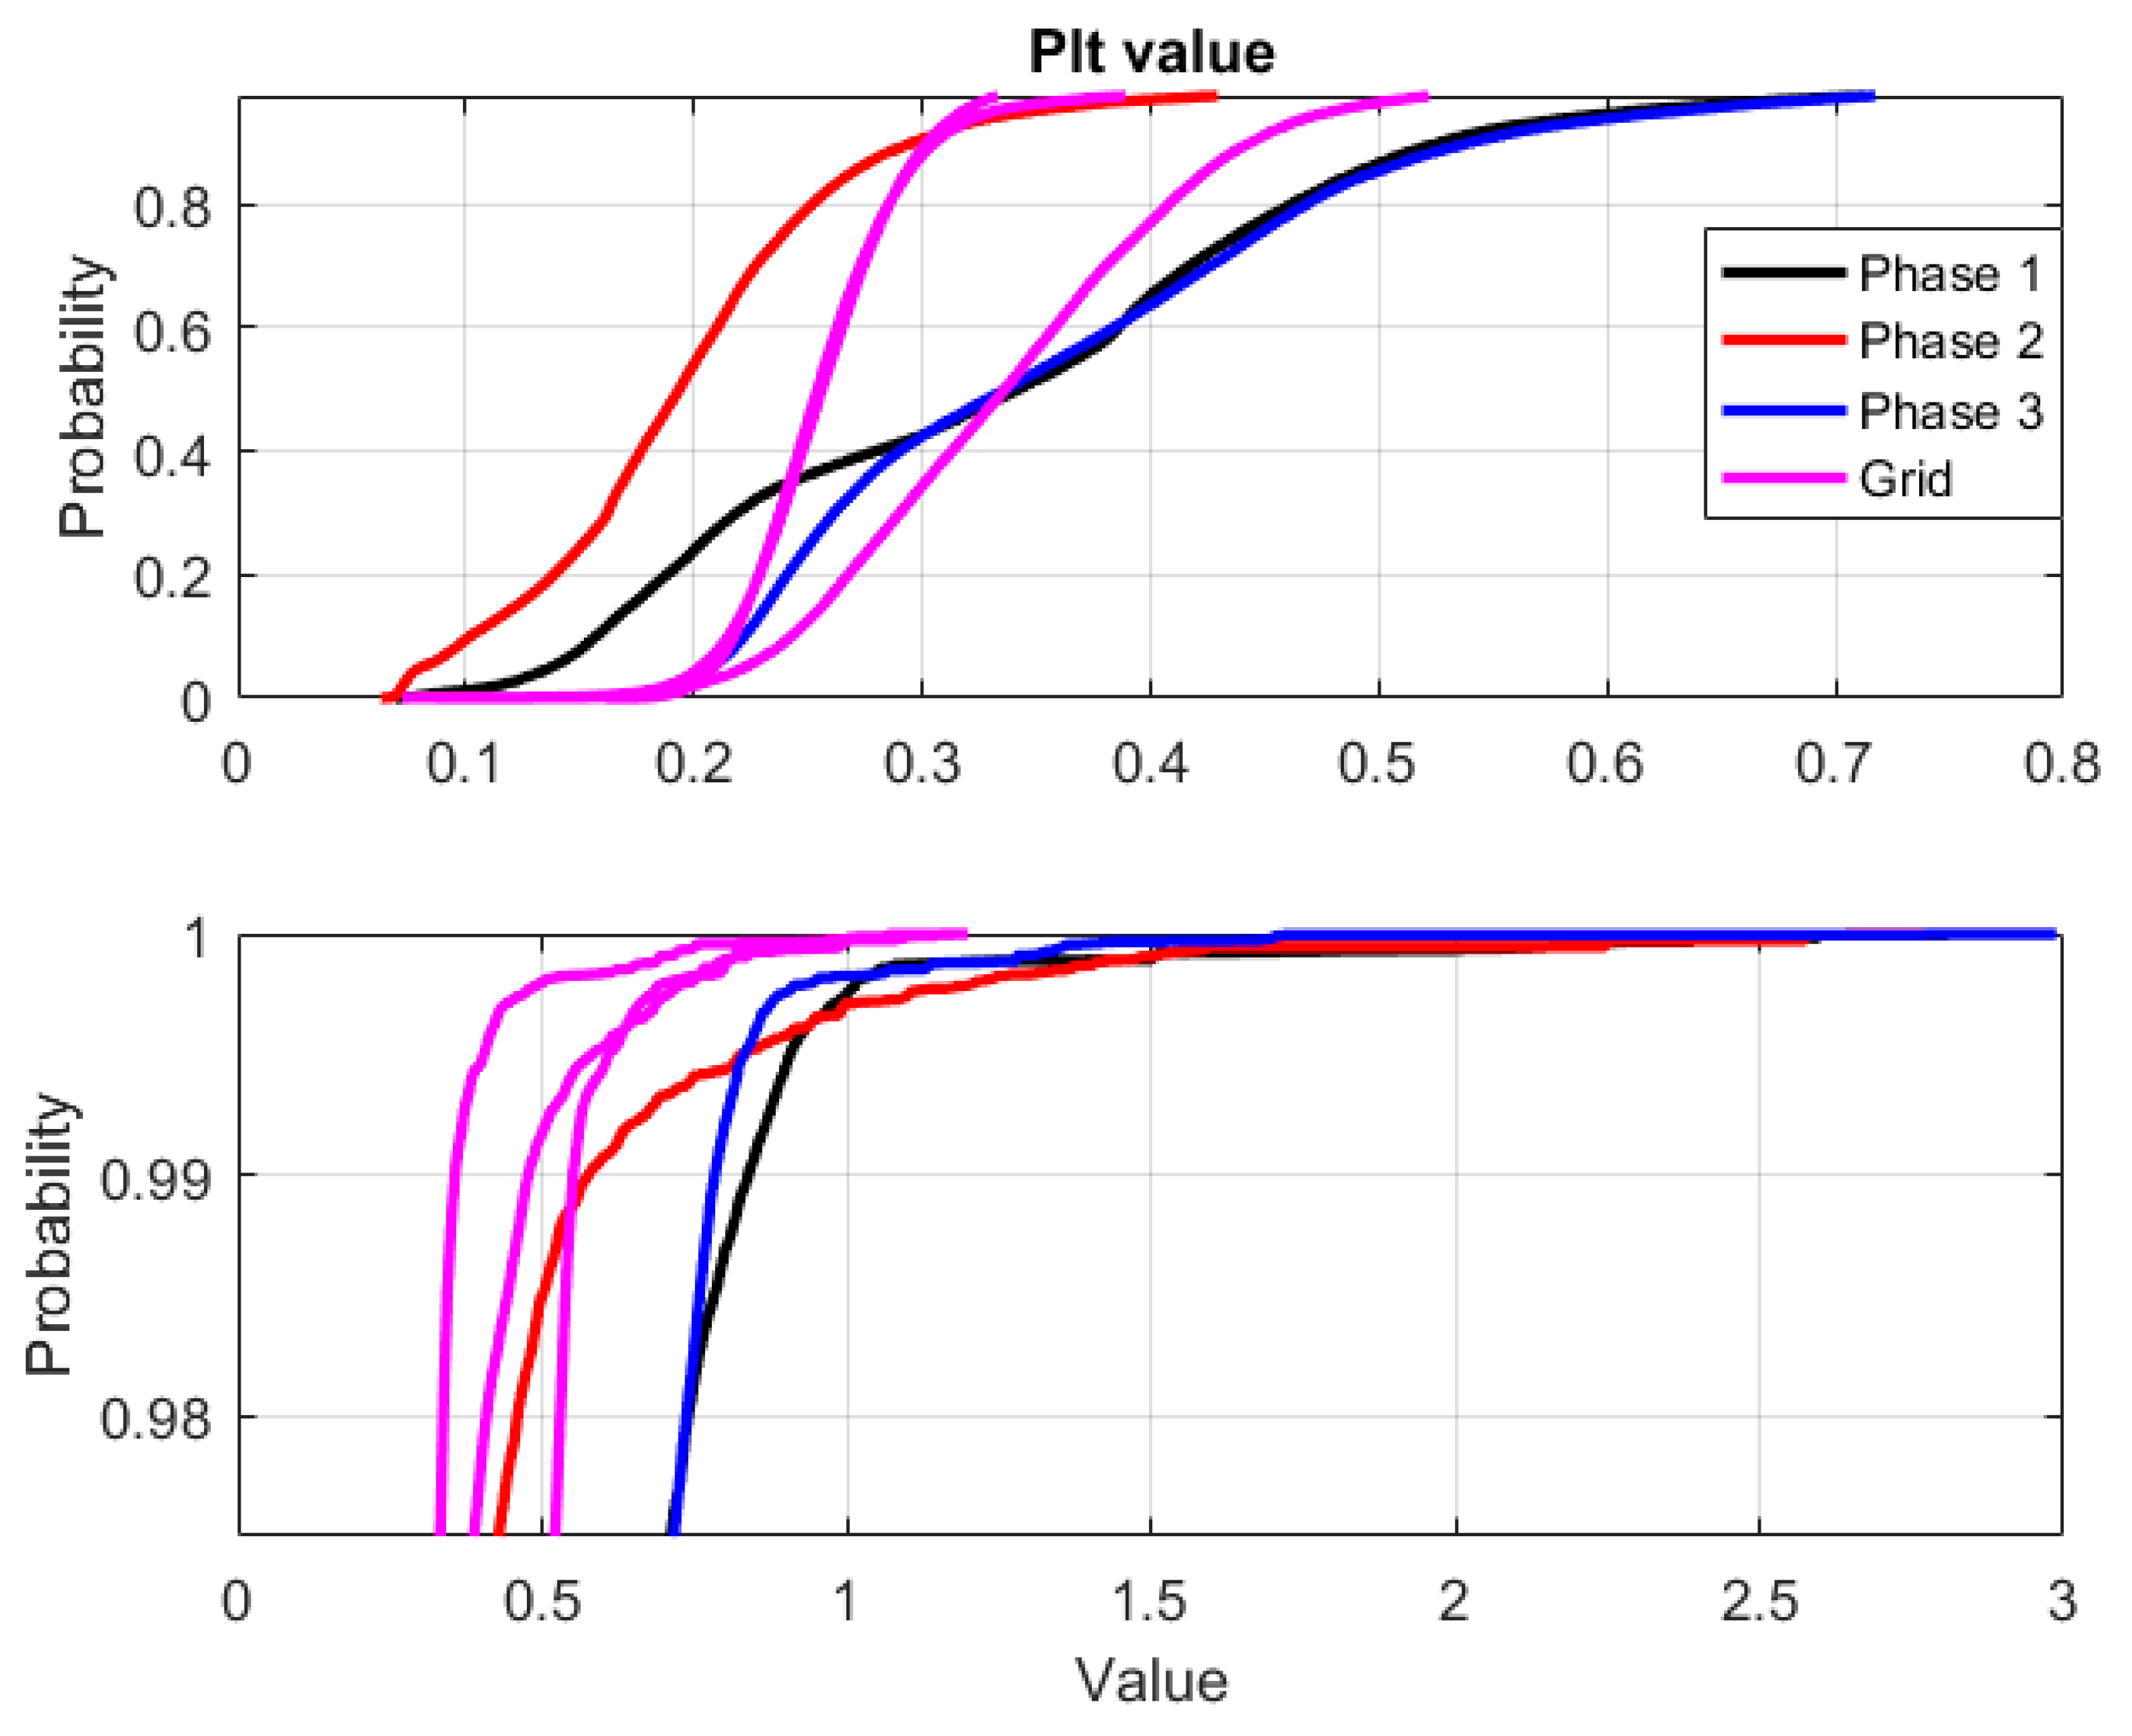
Figure 10.
CDF for the Plt values in grid-connected and islanded operation where the interval 0 to 97.5% is displayed at the top and the remaining upper 2.5% is displayed in the bottom. The black, red and blue color represents phase 1 to 3 in islanded mode. Purple color represents all three phases during grid-connected operation.
Figure 11.
CDF for the 10 min very short variations (VSV) values (top) and the 3 s VSV values (bottom) for islanded and grid-connected operation.
Figure 11.
CDF for the 10 min very short variations (VSV) values (top) and the 3 s VSV values (bottom) for islanded and grid-connected operation.
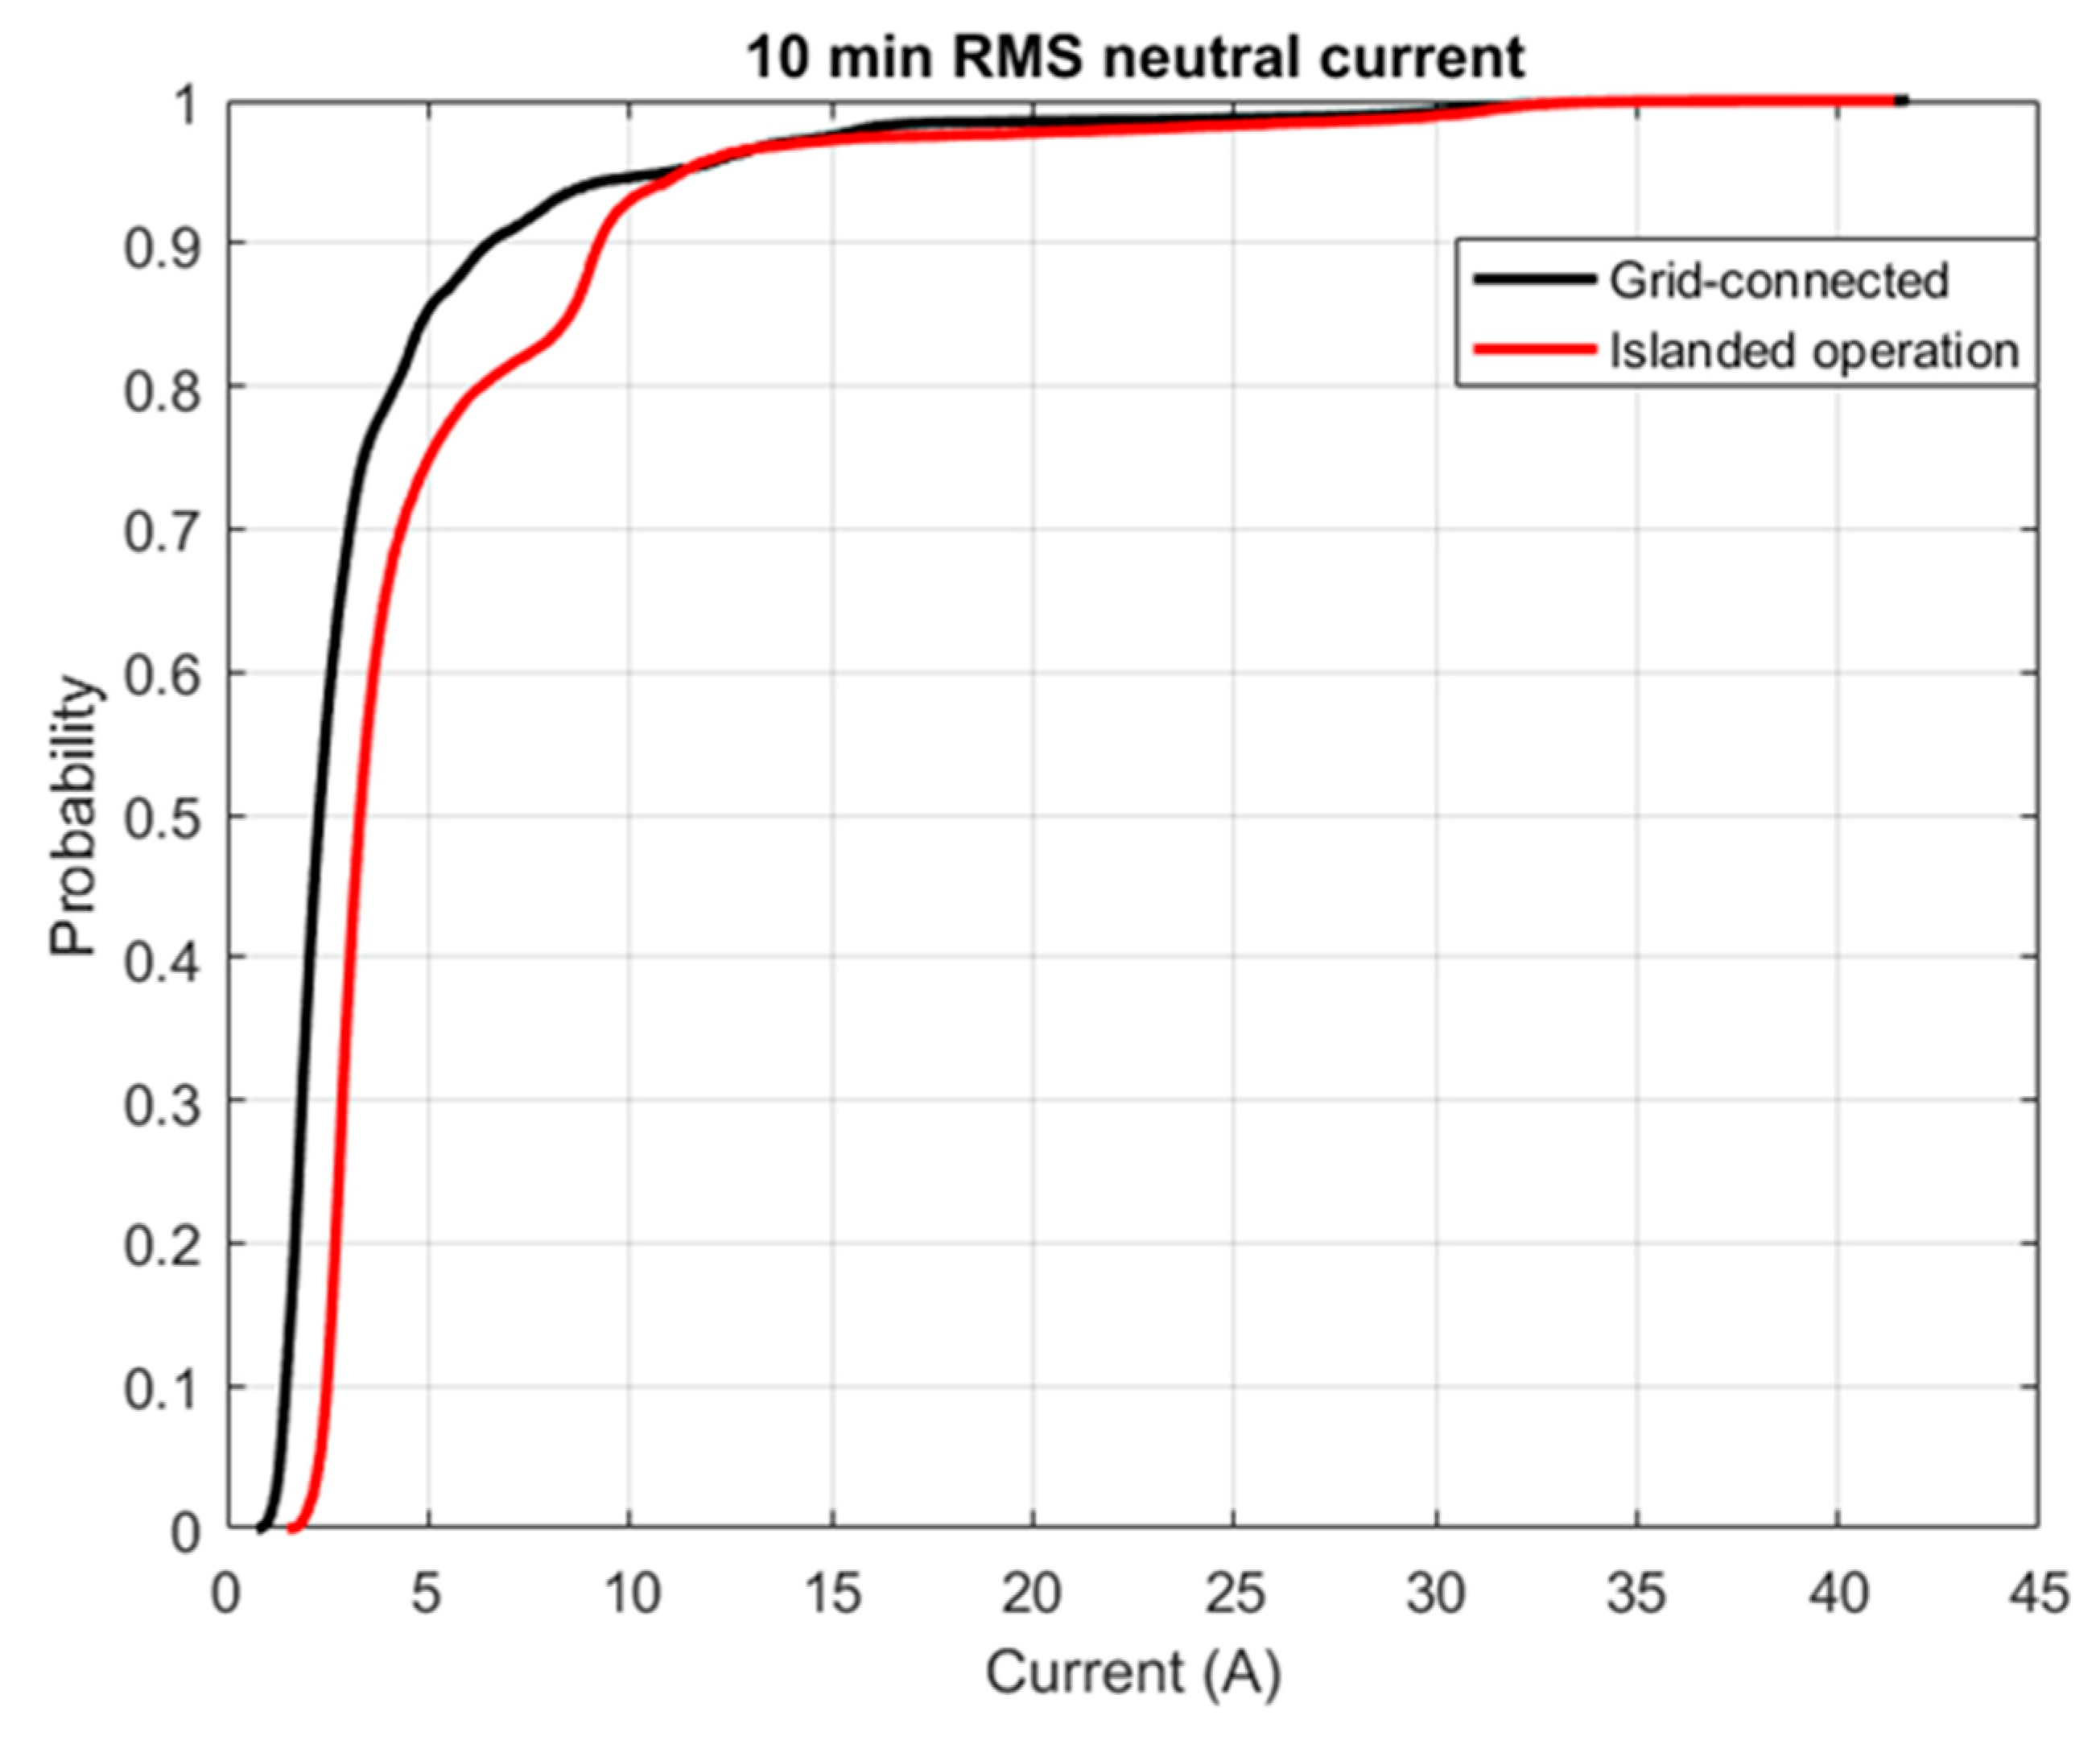
Figure 12.
CDF for the 10 min RMS neutral current during islanded and grid-connected operation.
Figure 12.
CDF for the 10 min RMS neutral current during islanded and grid-connected operation.
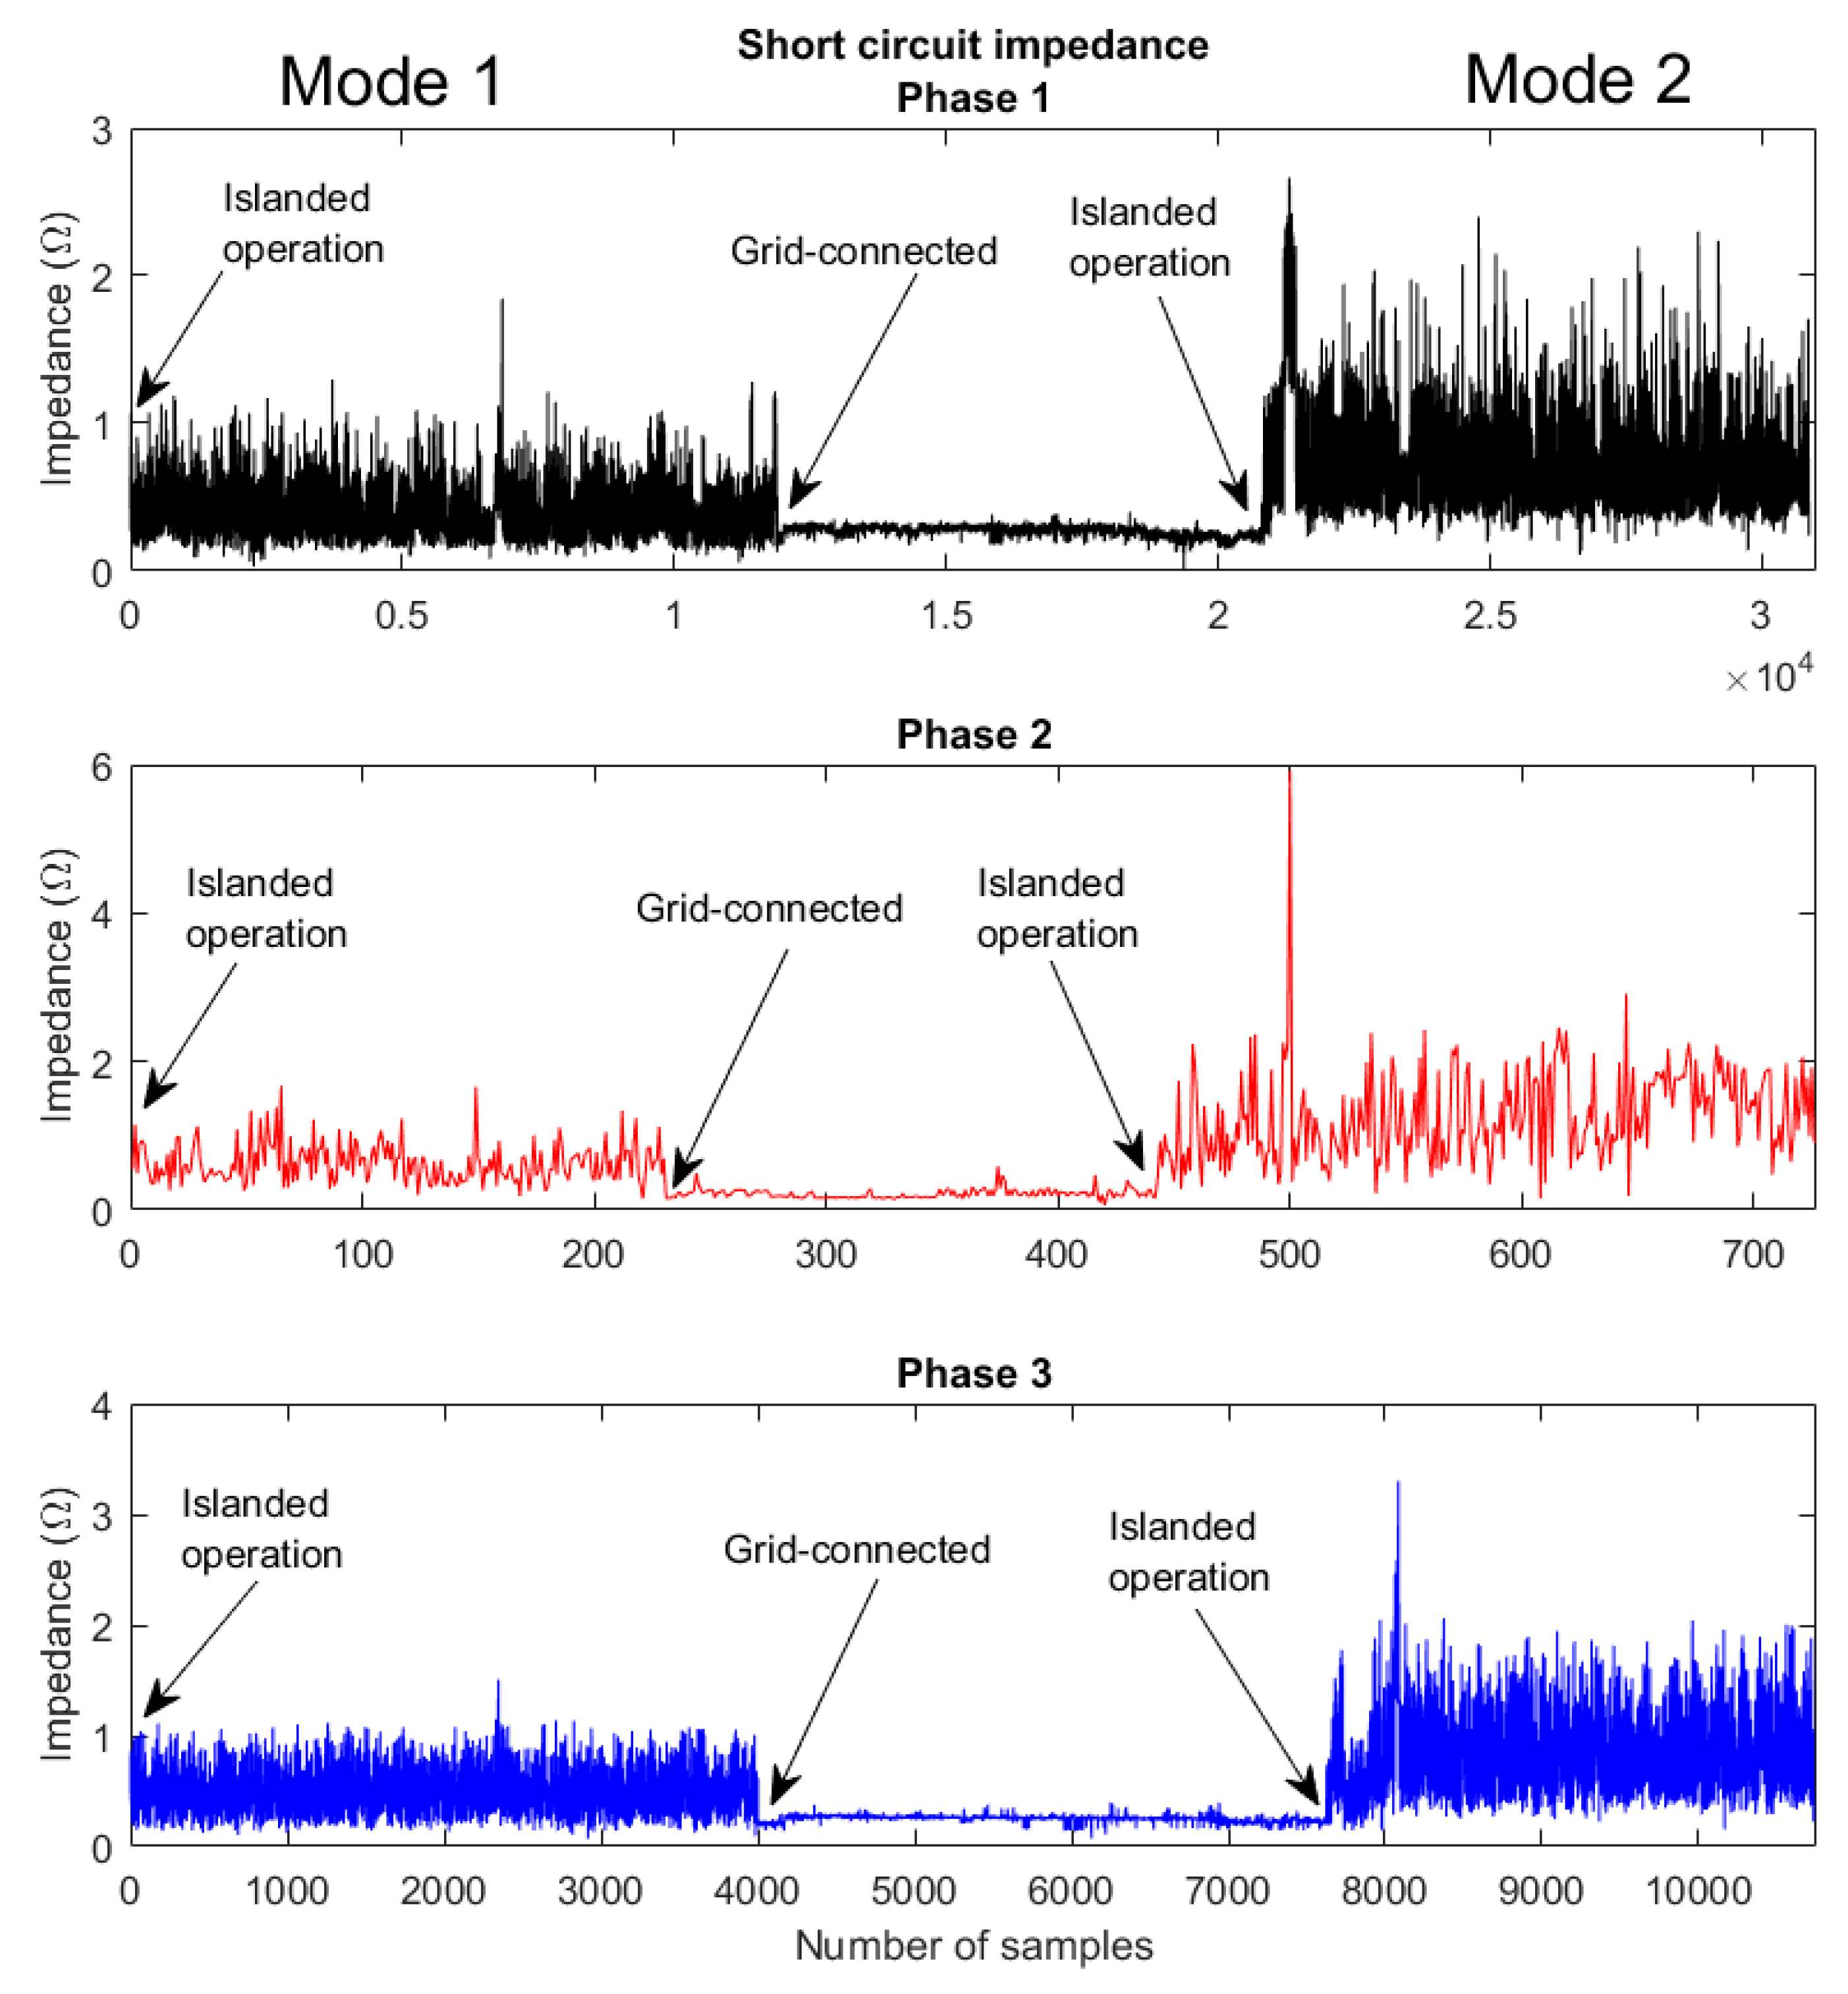
Figure 13.
Short circuit impedance for 13 weeks of islanded and grid-connected measurements. The number of samples are around 31,000, 730 and 11,000 for phase 1 to 3 respectively. Note the difference in horizontal scale for each sub-plot.
Figure 13.
Short circuit impedance for 13 weeks of islanded and grid-connected measurements. The number of samples are around 31,000, 730 and 11,000 for phase 1 to 3 respectively. Note the difference in horizontal scale for each sub-plot.
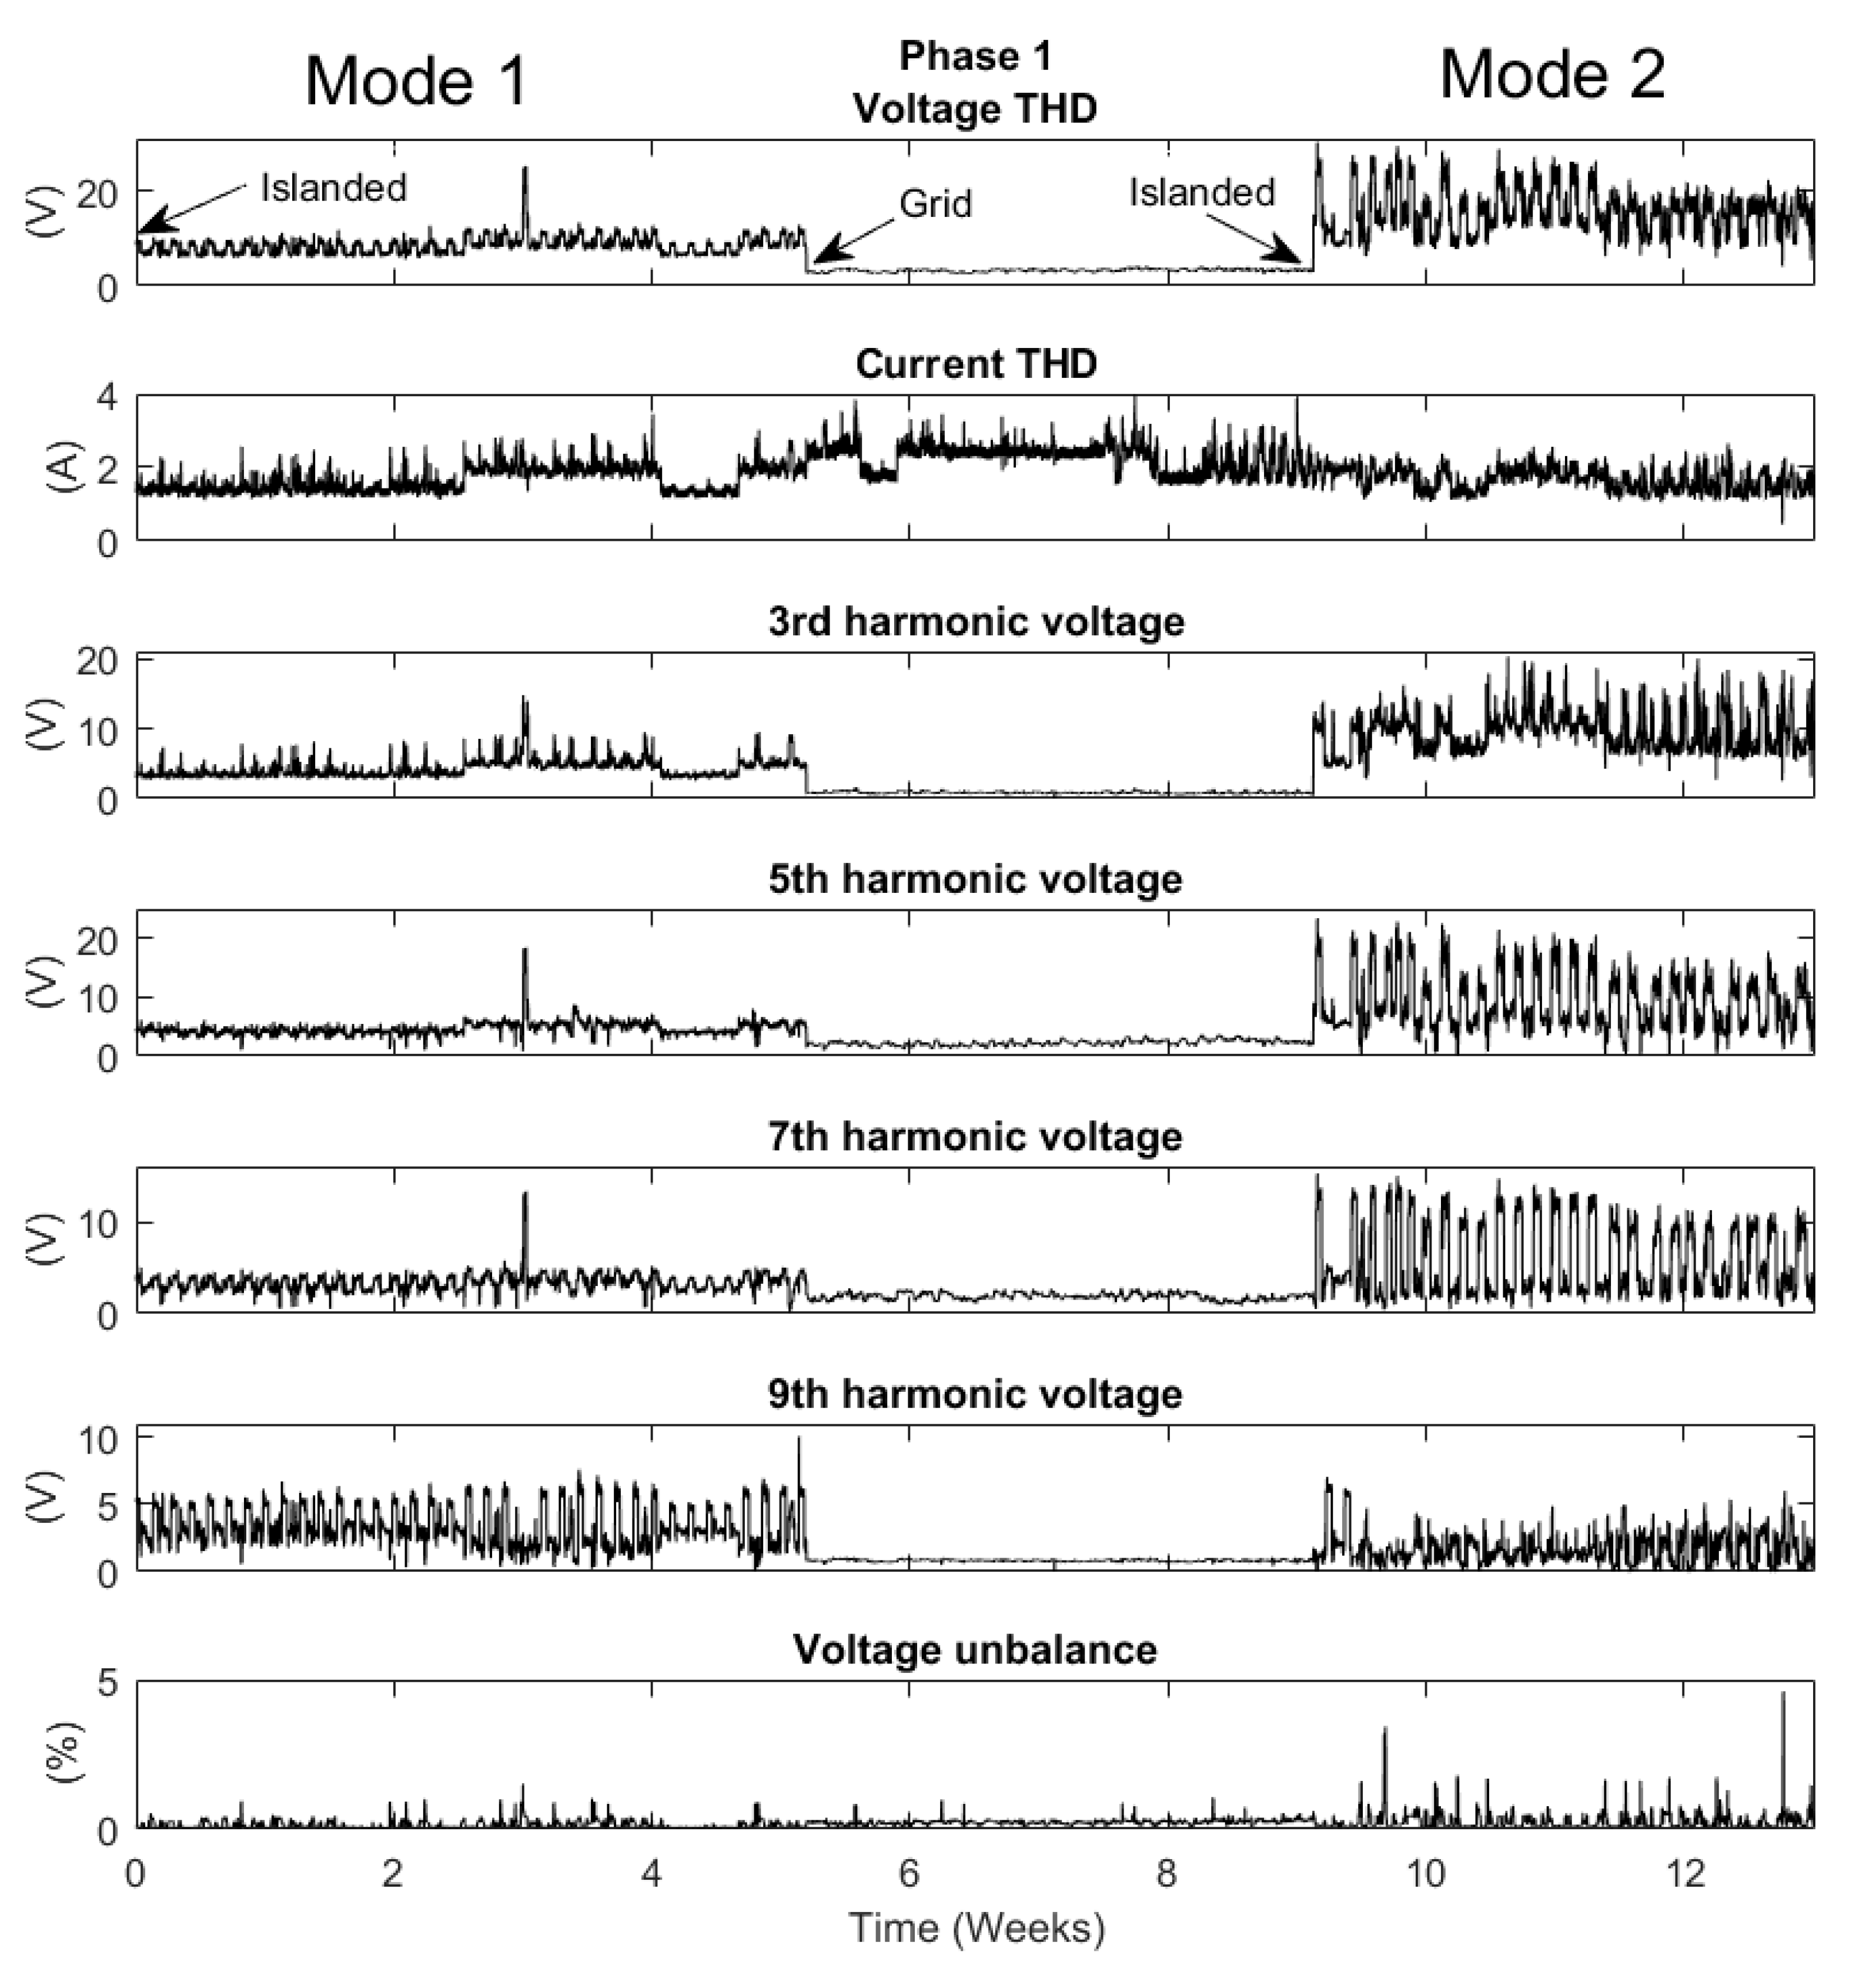
Figure 14.
The voltage and current THD, 3rd, 5th, 7th, 9th harmonic voltage and voltage unbalance for phase 1 during a 13 week period in which the samples was extracted for a current rise larger than 4 A within 2 cycles.
Figure 14.
The voltage and current THD, 3rd, 5th, 7th, 9th harmonic voltage and voltage unbalance for phase 1 during a 13 week period in which the samples was extracted for a current rise larger than 4 A within 2 cycles.
Figure 15.
The voltage and current THD, 3rd, 5th, 7th, 9th harmonic voltage and voltage unbalance for phase 2 during a 13 week period in which the samples was extracted for a current rise larger than 4 A within 2 cycles.
Figure 15.
The voltage and current THD, 3rd, 5th, 7th, 9th harmonic voltage and voltage unbalance for phase 2 during a 13 week period in which the samples was extracted for a current rise larger than 4 A within 2 cycles.
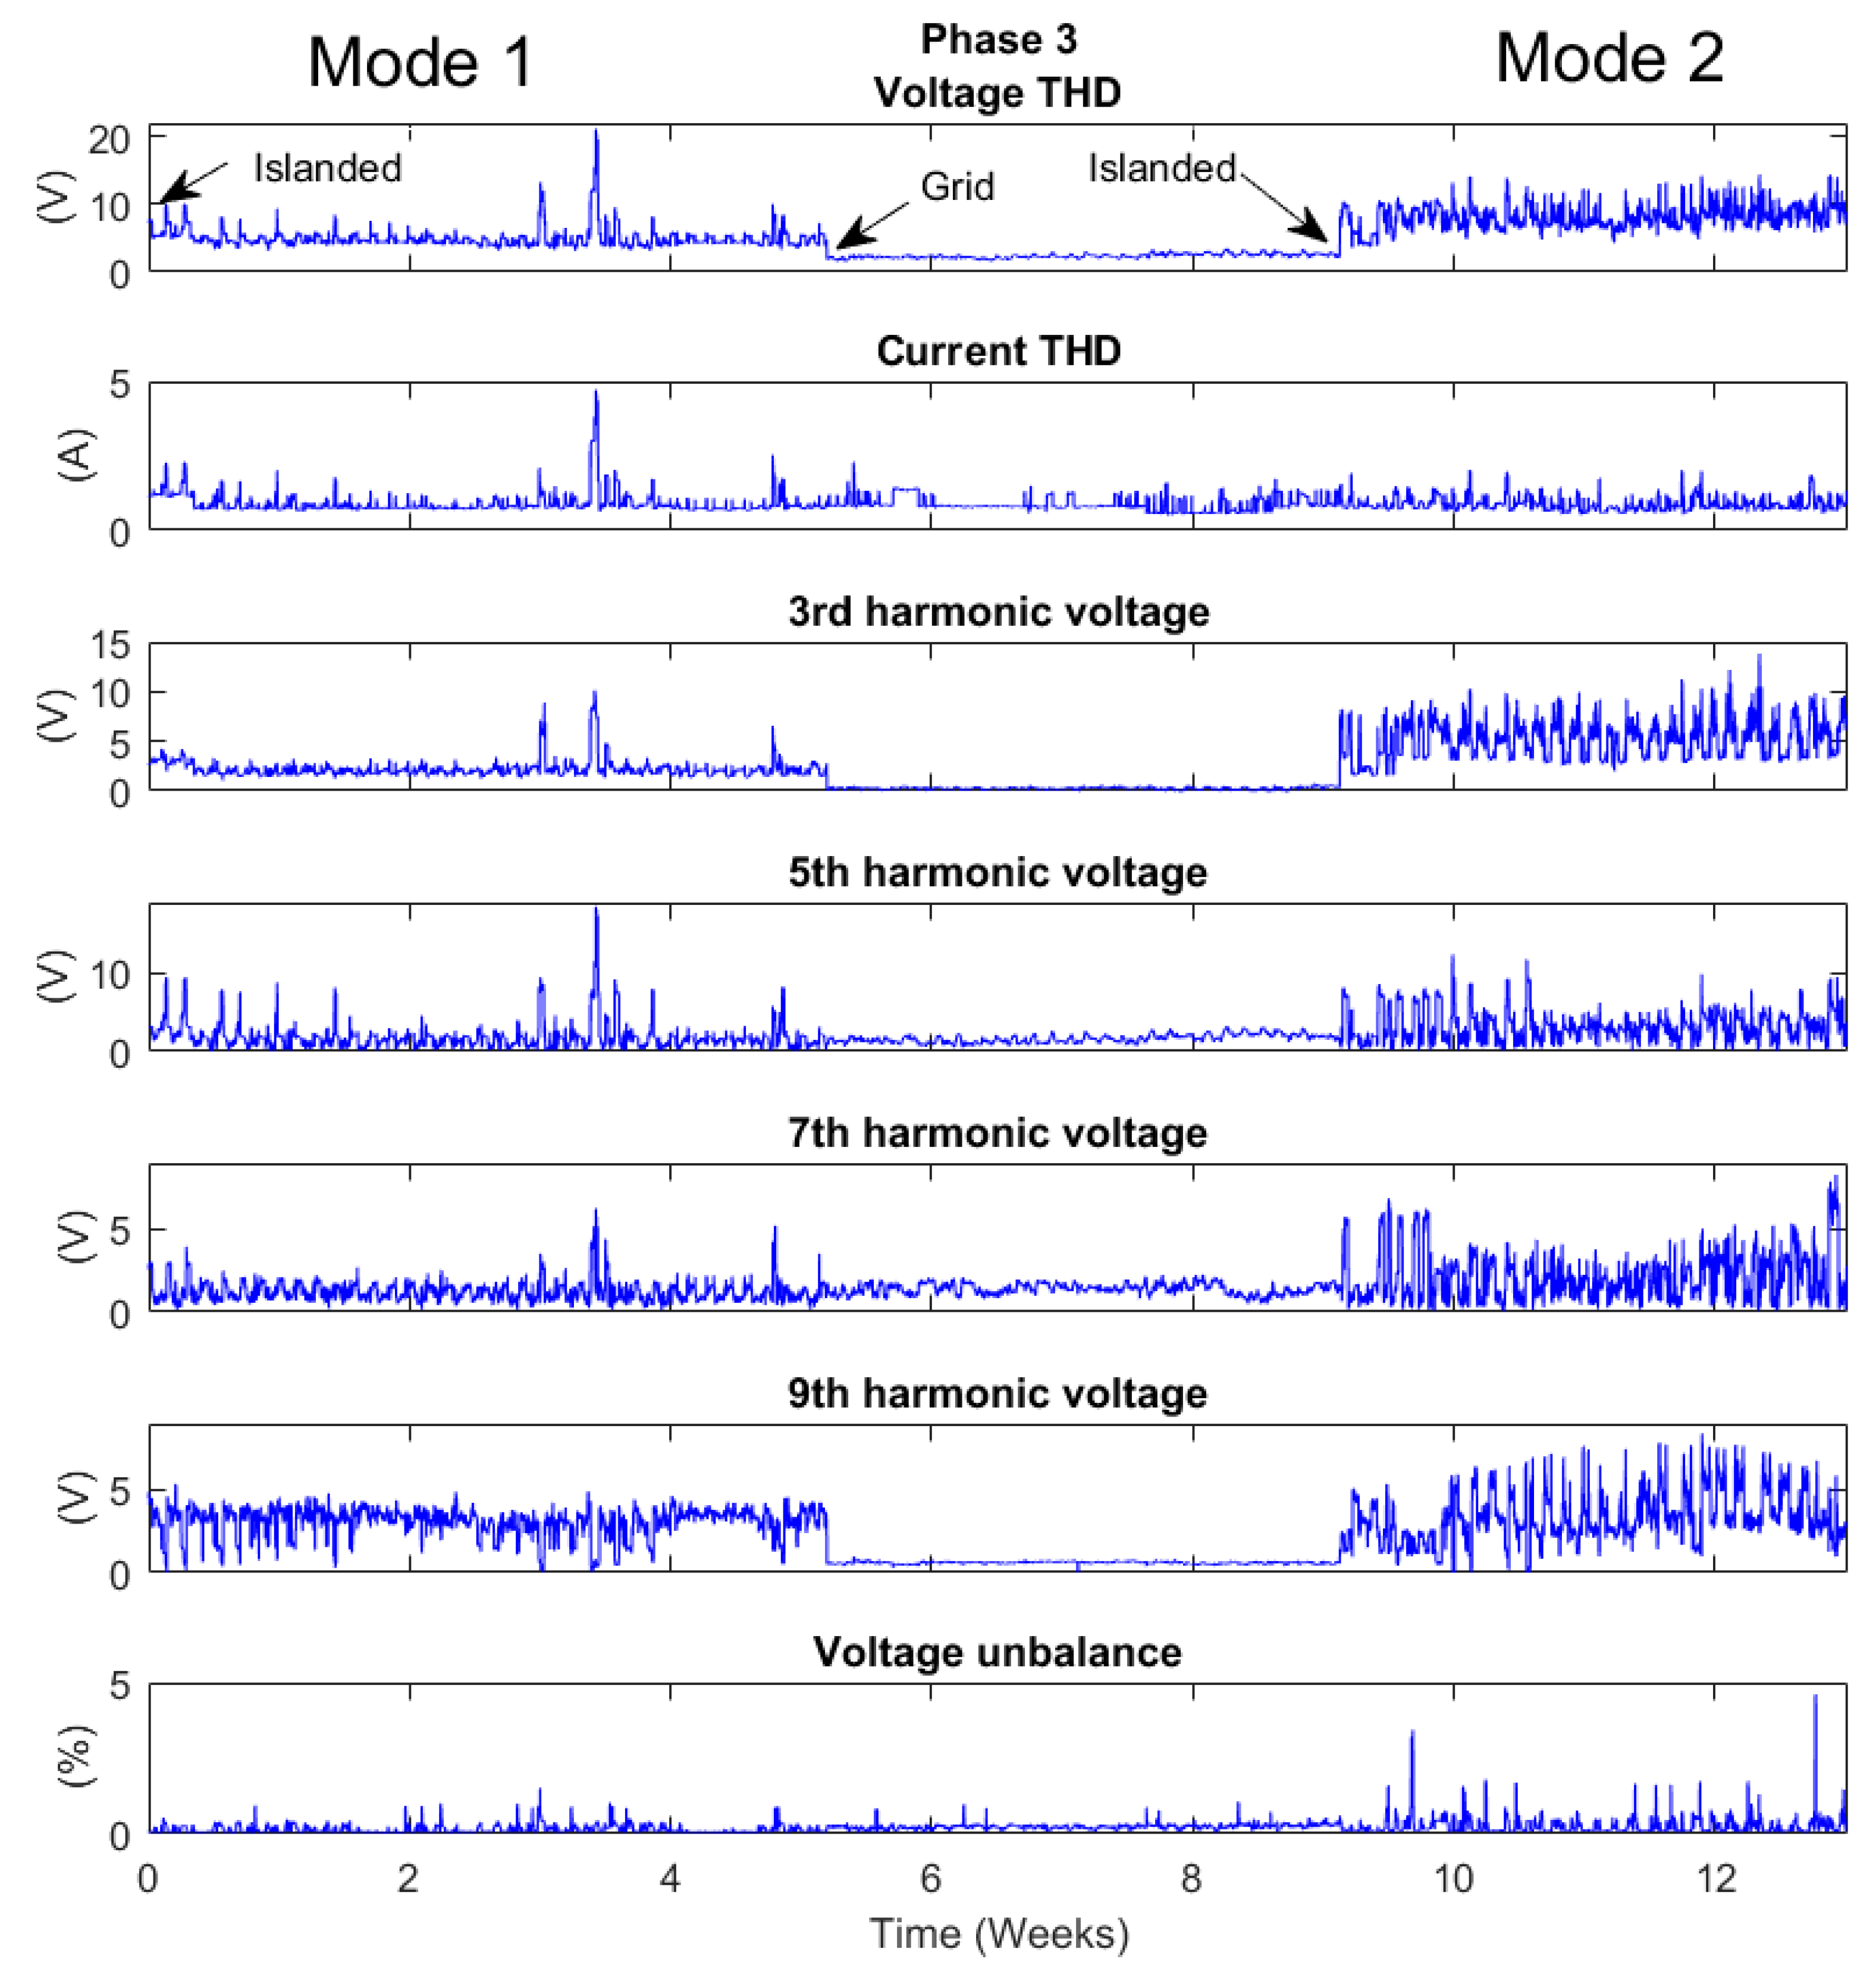
Figure 16.
The voltage and current THD, 3rd, 5th, 7th, 9th harmonic voltage and voltage unbalance for phase 3 during a 13 week period in which the samples was extracted for a current rise larger than 4 A within 2 cycles.
Figure 16.
The voltage and current THD, 3rd, 5th, 7th, 9th harmonic voltage and voltage unbalance for phase 3 during a 13 week period in which the samples was extracted for a current rise larger than 4 A within 2 cycles.
Figure 17.
The average short circuit impedance for each hour of the day for around 8 weeks in islanded operation for Mode 1 and Mode 2 seen in
Figure 13.
Figure 17.
The average short circuit impedance for each hour of the day for around 8 weeks in islanded operation for Mode 1 and Mode 2 seen in
Figure 13.
Figure 18.
(
a) The odd harmonic voltage 3rd to 9th and THD for mode 1 in
Figure 14,
Figure 15 and
Figure 16. (
b) The odd harmonic current 3rd to 9th and THD for mode 1 in
Figure 14,
Figure 15 and
Figure 16. The average values are grouped for each hour of the day for around 8 weeks of islanded operation. Note also the difference in vertical scale for the different plots.
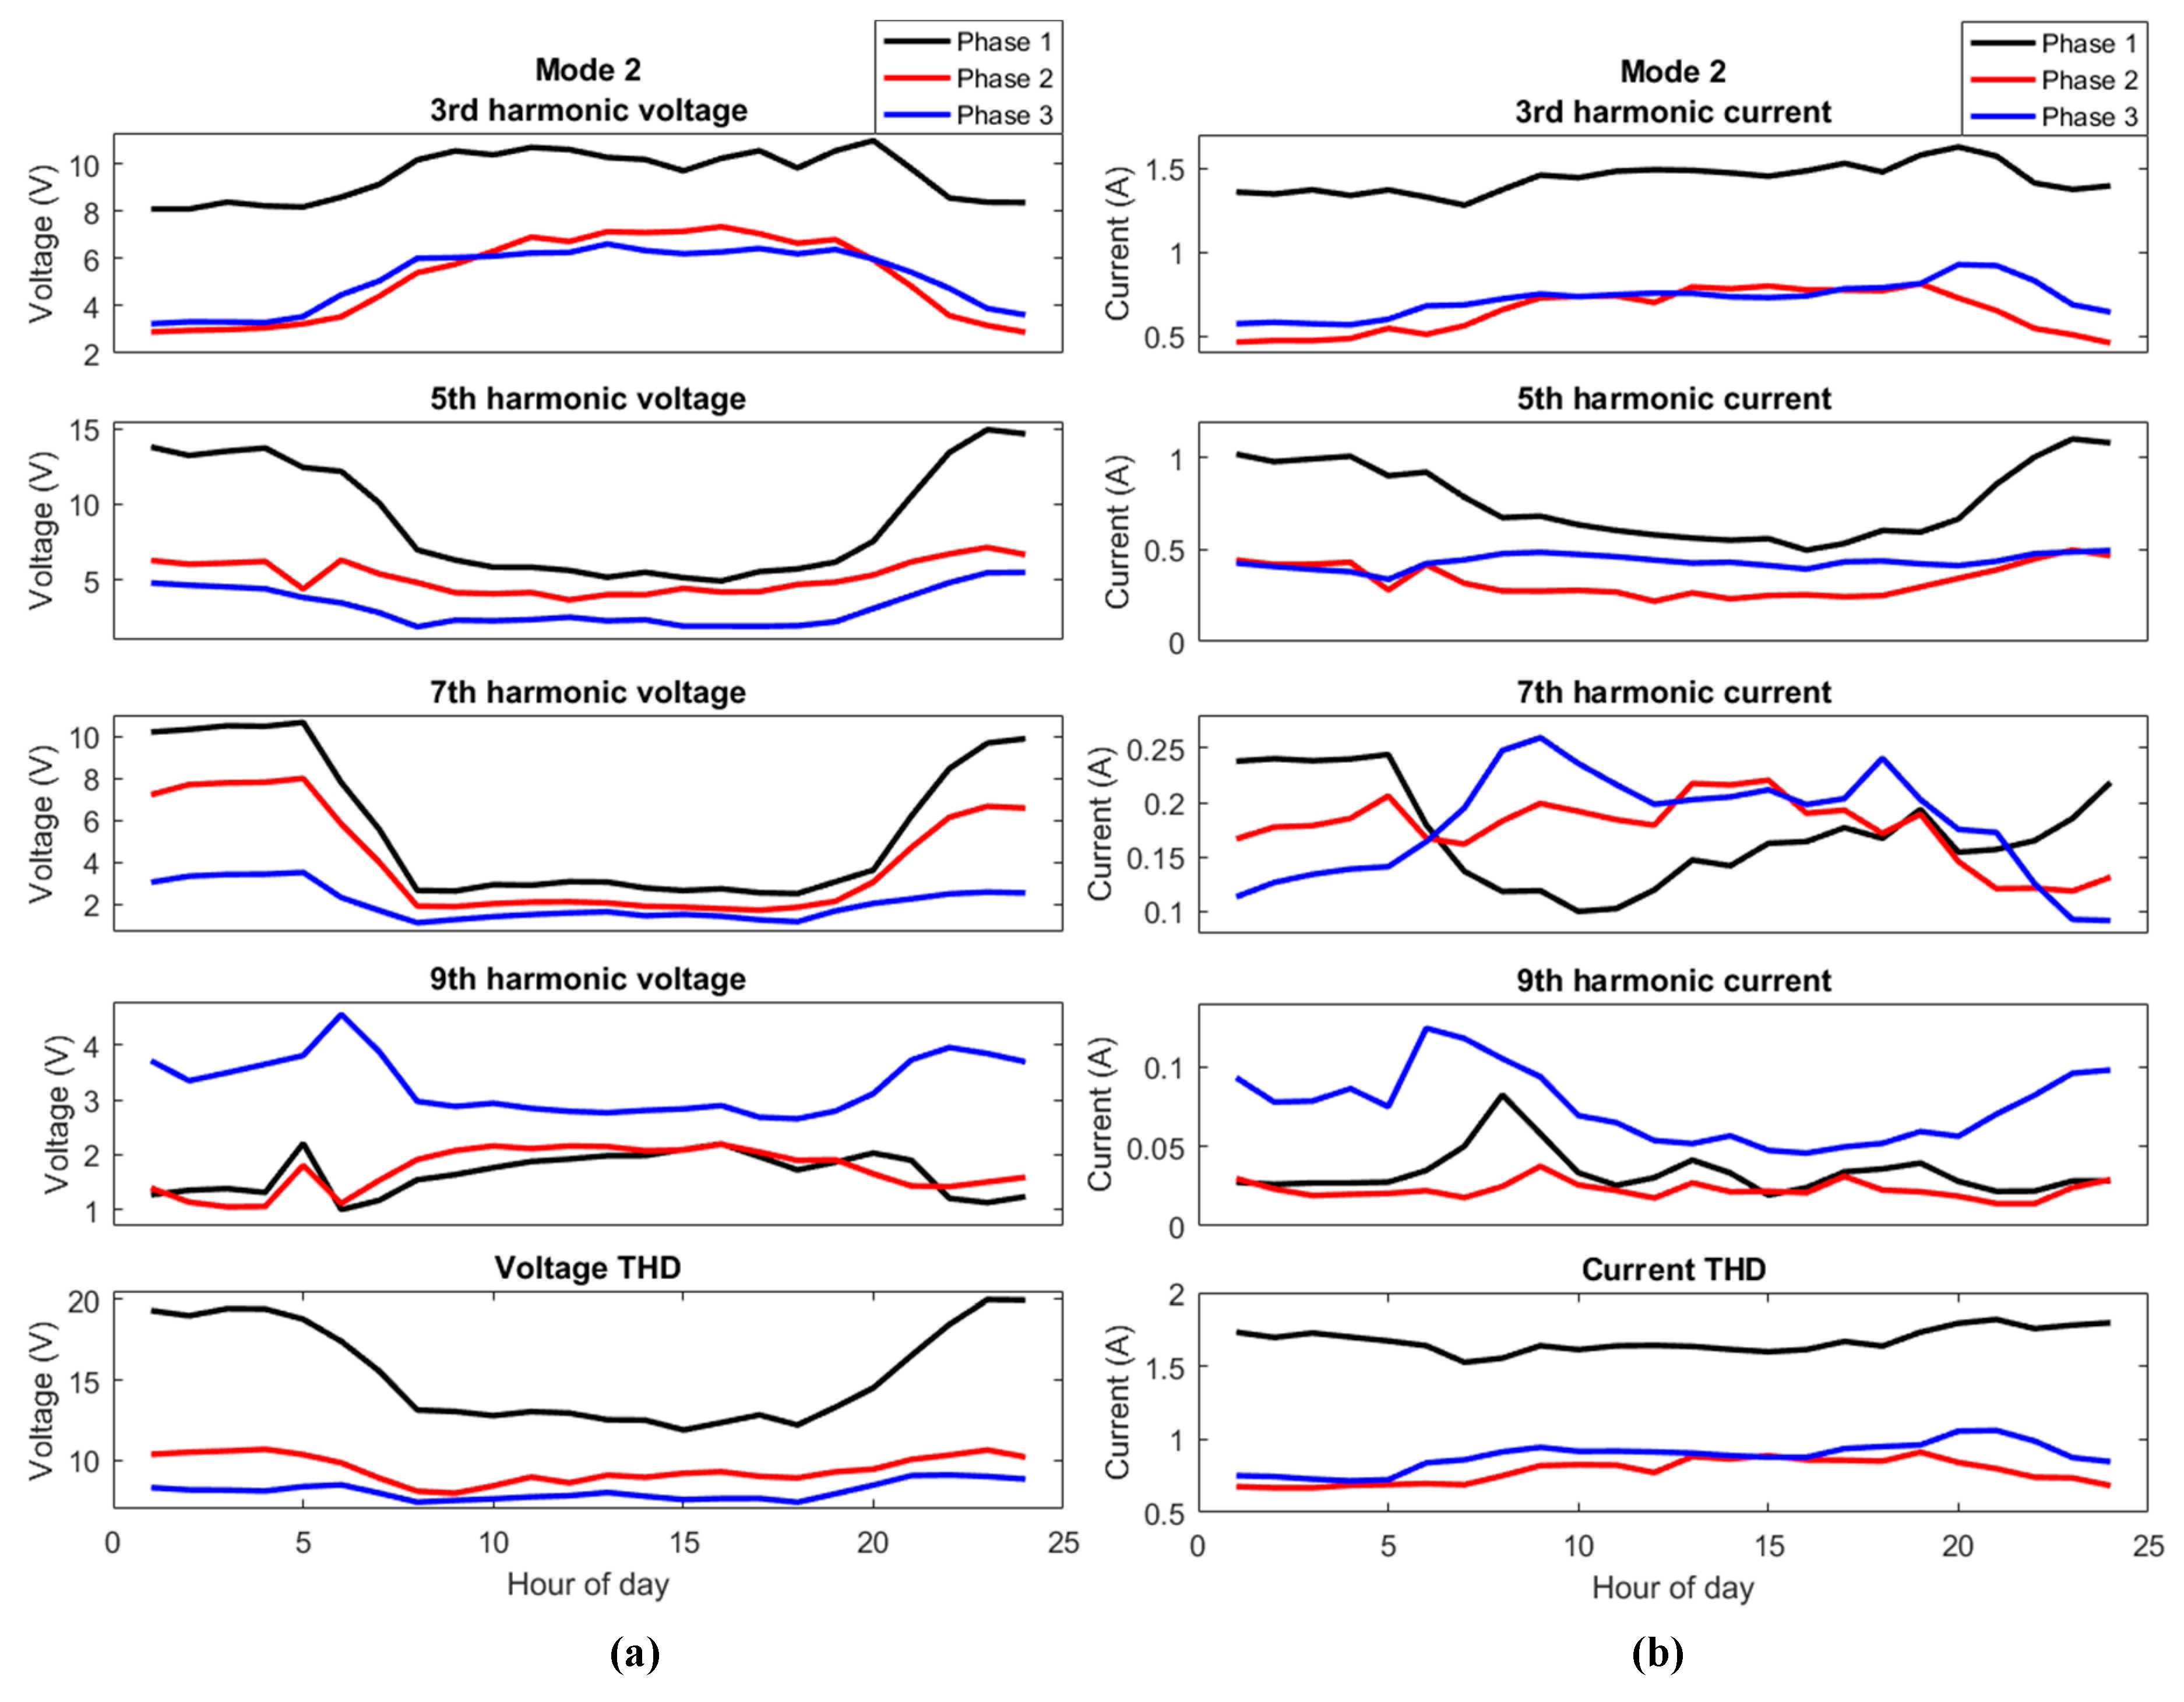
Figure 19.
(
a) The odd harmonic voltage 3rd to 9th and THD for mode 2 in
Figure 14,
Figure 15 and
Figure 16. (
b) The odd harmonic current 3rd to 9th and THD for mode 2 in
Figure 14,
Figure 15 and
Figure 16. The average values are grouped for each hour of the day for around 8 weeks of islanded operation. Note also the difference in vertical scale for the different plots.
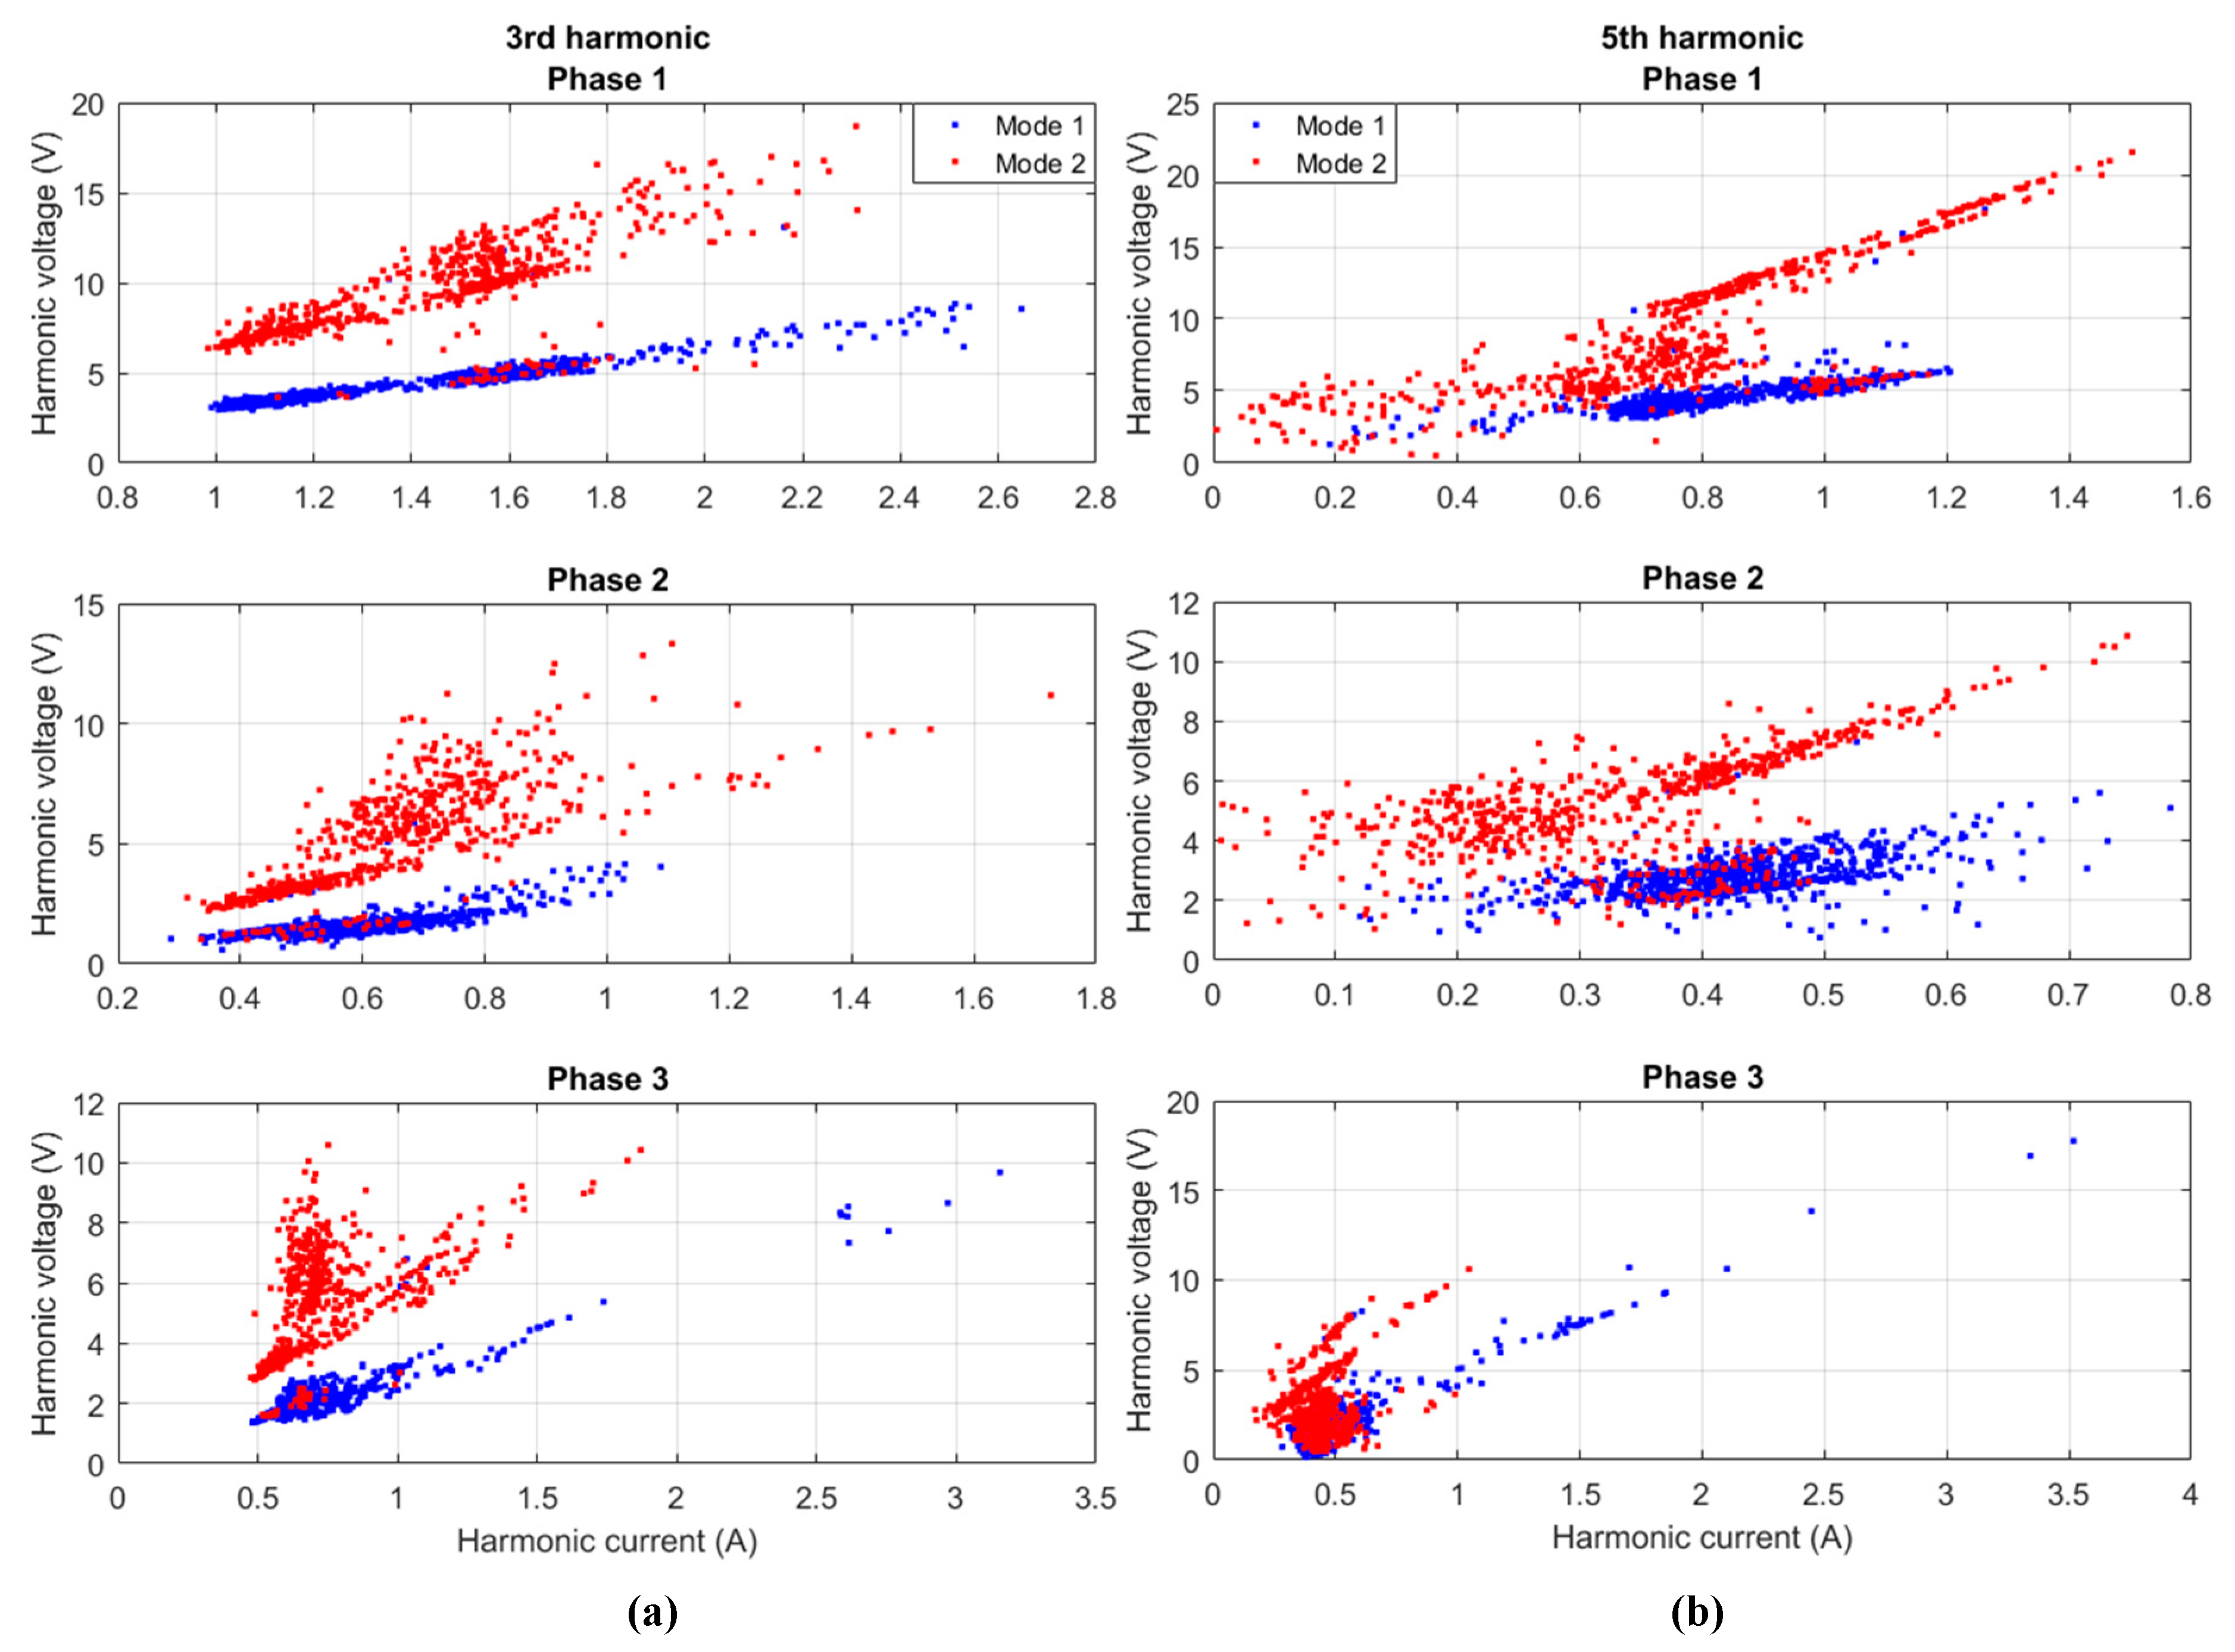
Figure 20.
(
a) The 1 h 3rd harmonic voltage and current values plotted against each other for Mode 1 and 2 seen in
Figure 14,
Figure 15 and
Figure 16. (
b) The 1 h 5th harmonic voltage and current values plotted against each other for Mode 1 and 2 seen in
Figure 14,
Figure 15 and
Figure 16.
Figure 20.
(
a) The 1 h 3rd harmonic voltage and current values plotted against each other for Mode 1 and 2 seen in
Figure 14,
Figure 15 and
Figure 16. (
b) The 1 h 5th harmonic voltage and current values plotted against each other for Mode 1 and 2 seen in
Figure 14,
Figure 15 and
Figure 16.
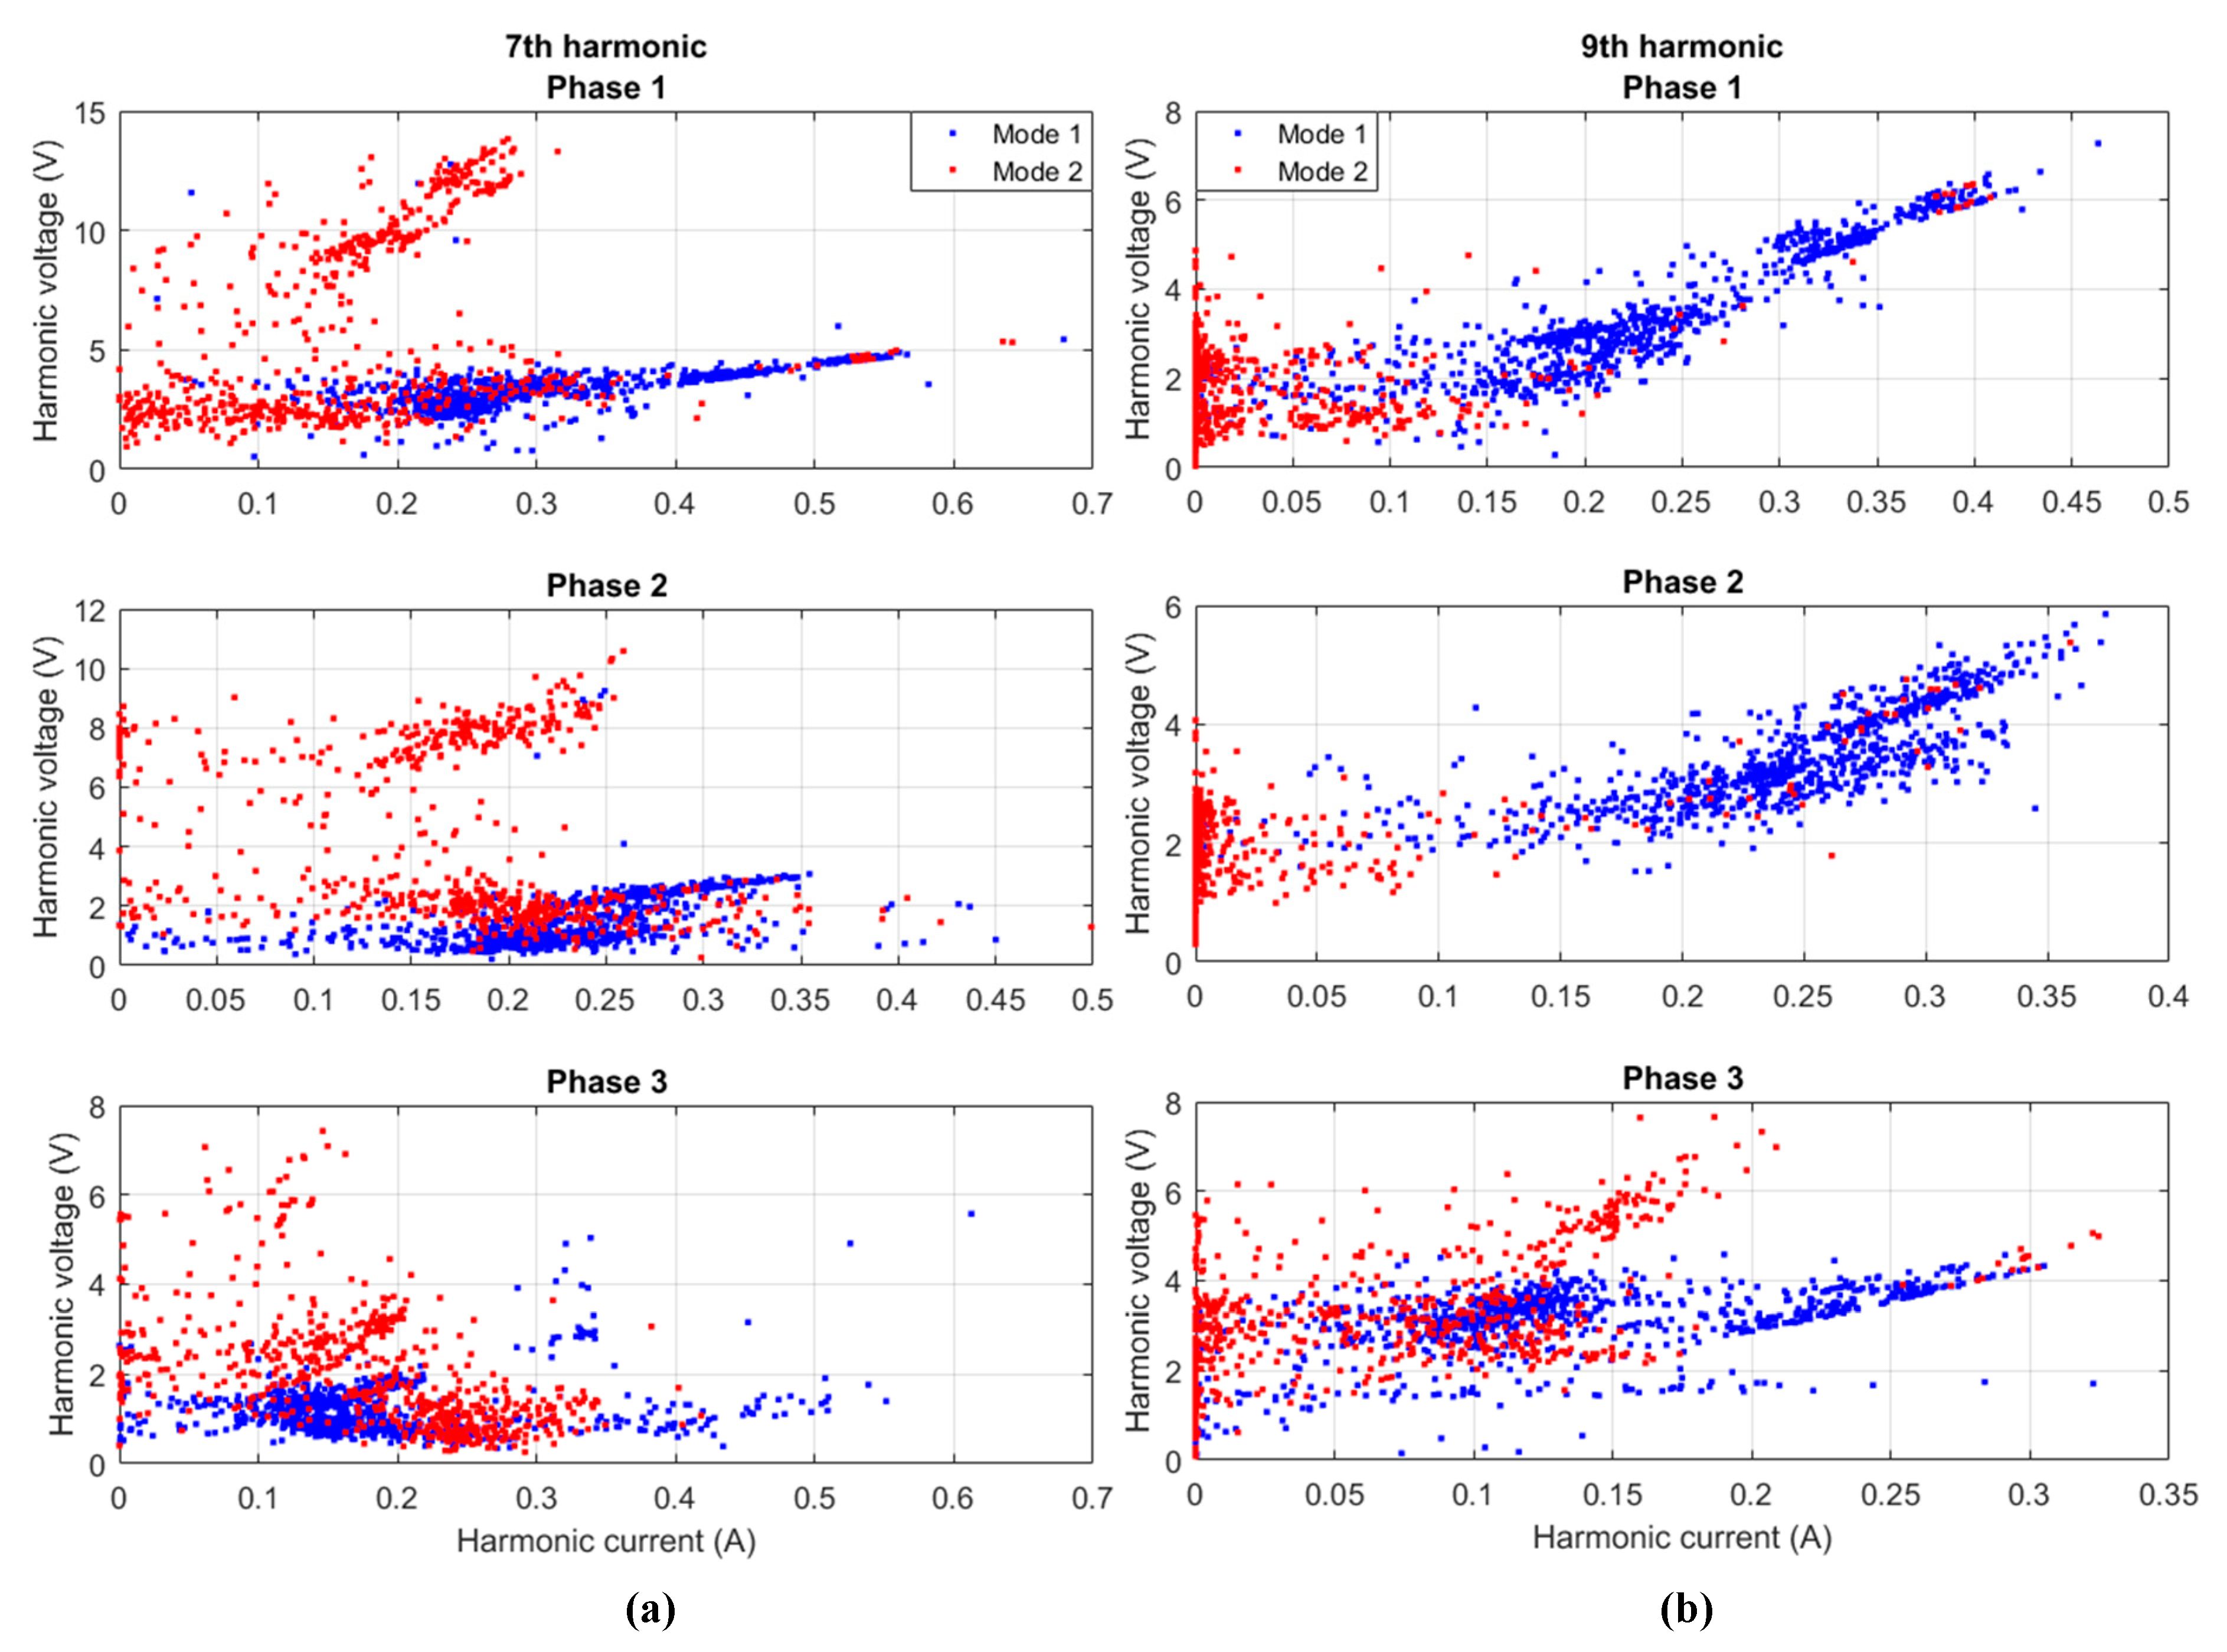
Figure 21.
(
a) The 1 h 7th harmonic voltage and current values plotted against each other for mode 1 and 2 seen in
Figure 14,
Figure 15 and
Figure 16. (
b) The 1 h 9th harmonic voltage and current values plotted against each other for mode 1 and 2 seen in
Figure 14,
Figure 15 and
Figure 16.
Figure 21.
(
a) The 1 h 7th harmonic voltage and current values plotted against each other for mode 1 and 2 seen in
Figure 14,
Figure 15 and
Figure 16. (
b) The 1 h 9th harmonic voltage and current values plotted against each other for mode 1 and 2 seen in
Figure 14,
Figure 15 and
Figure 16.
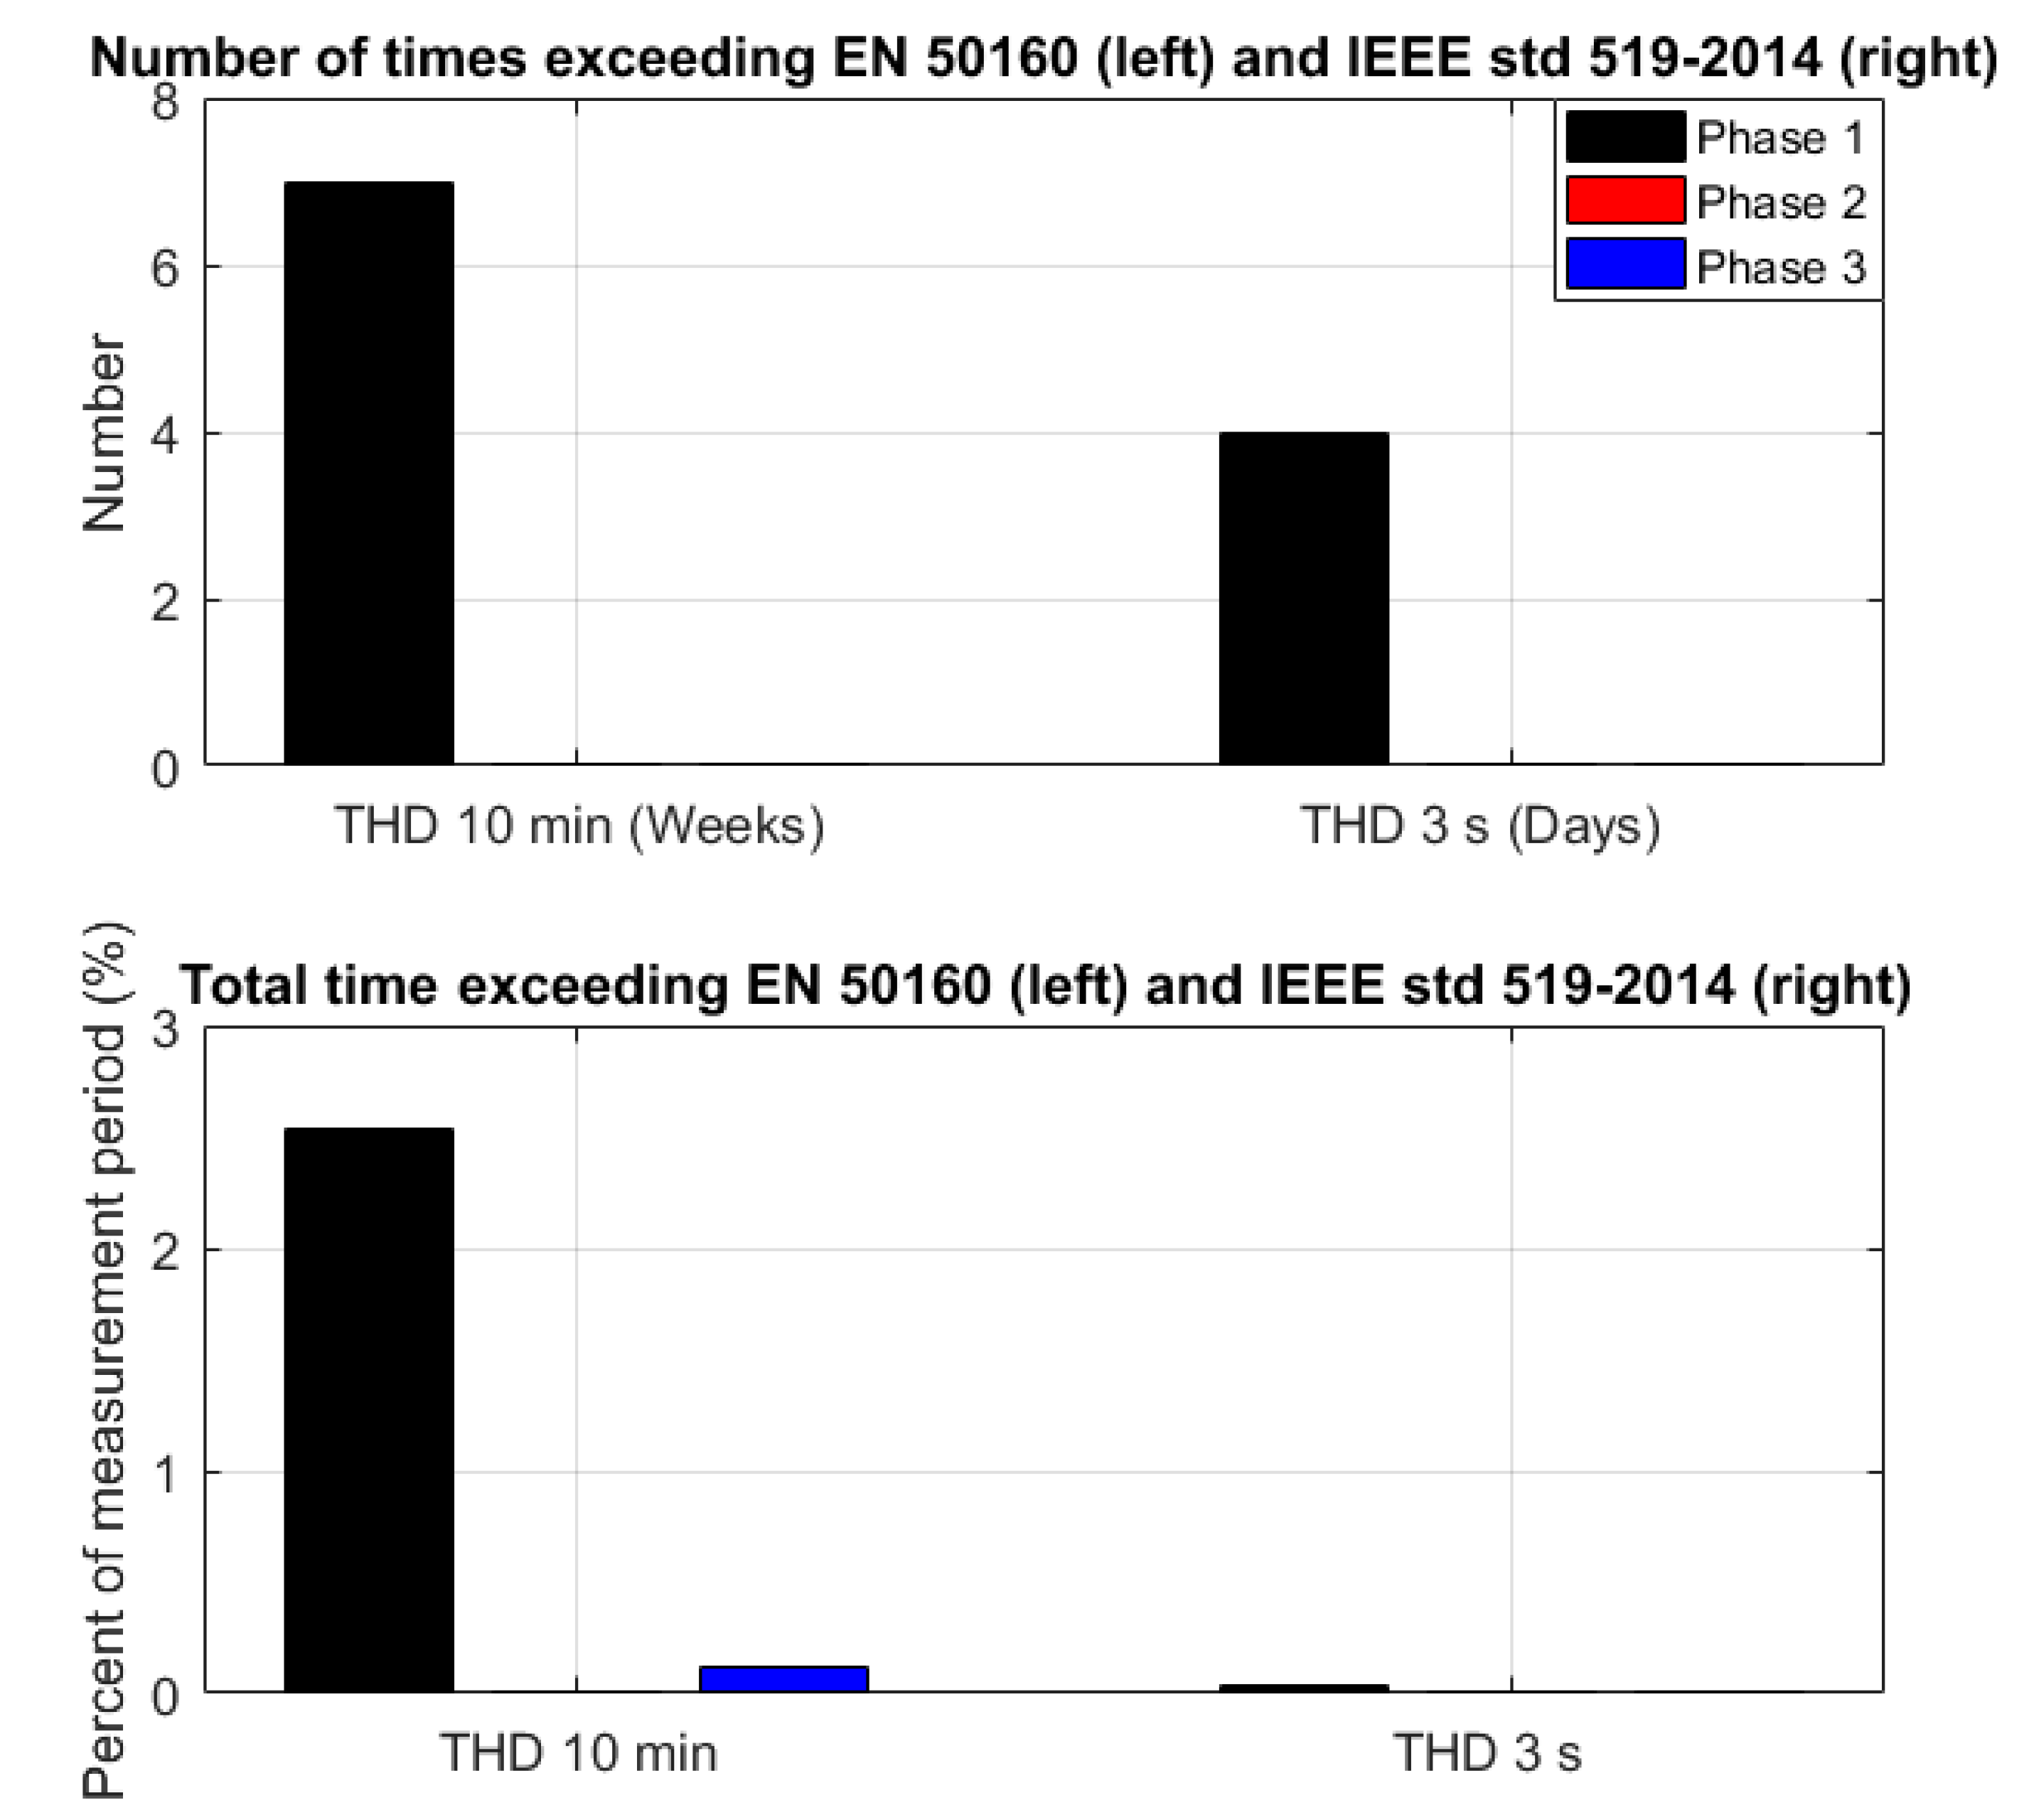
Figure 22.
The number of times the voltage THD exceeded the limits in EN 50160 and IEEE 519-2014 for the 10 min (in weeks) and 3 s (in days) (top) and the amount of time in which the voltage THD exceeded the 8% and 12% limits in EN 50160 and IEEE 519-2014 (bottom) for all three phases during islanded operation. The measurement period was 48 weeks.
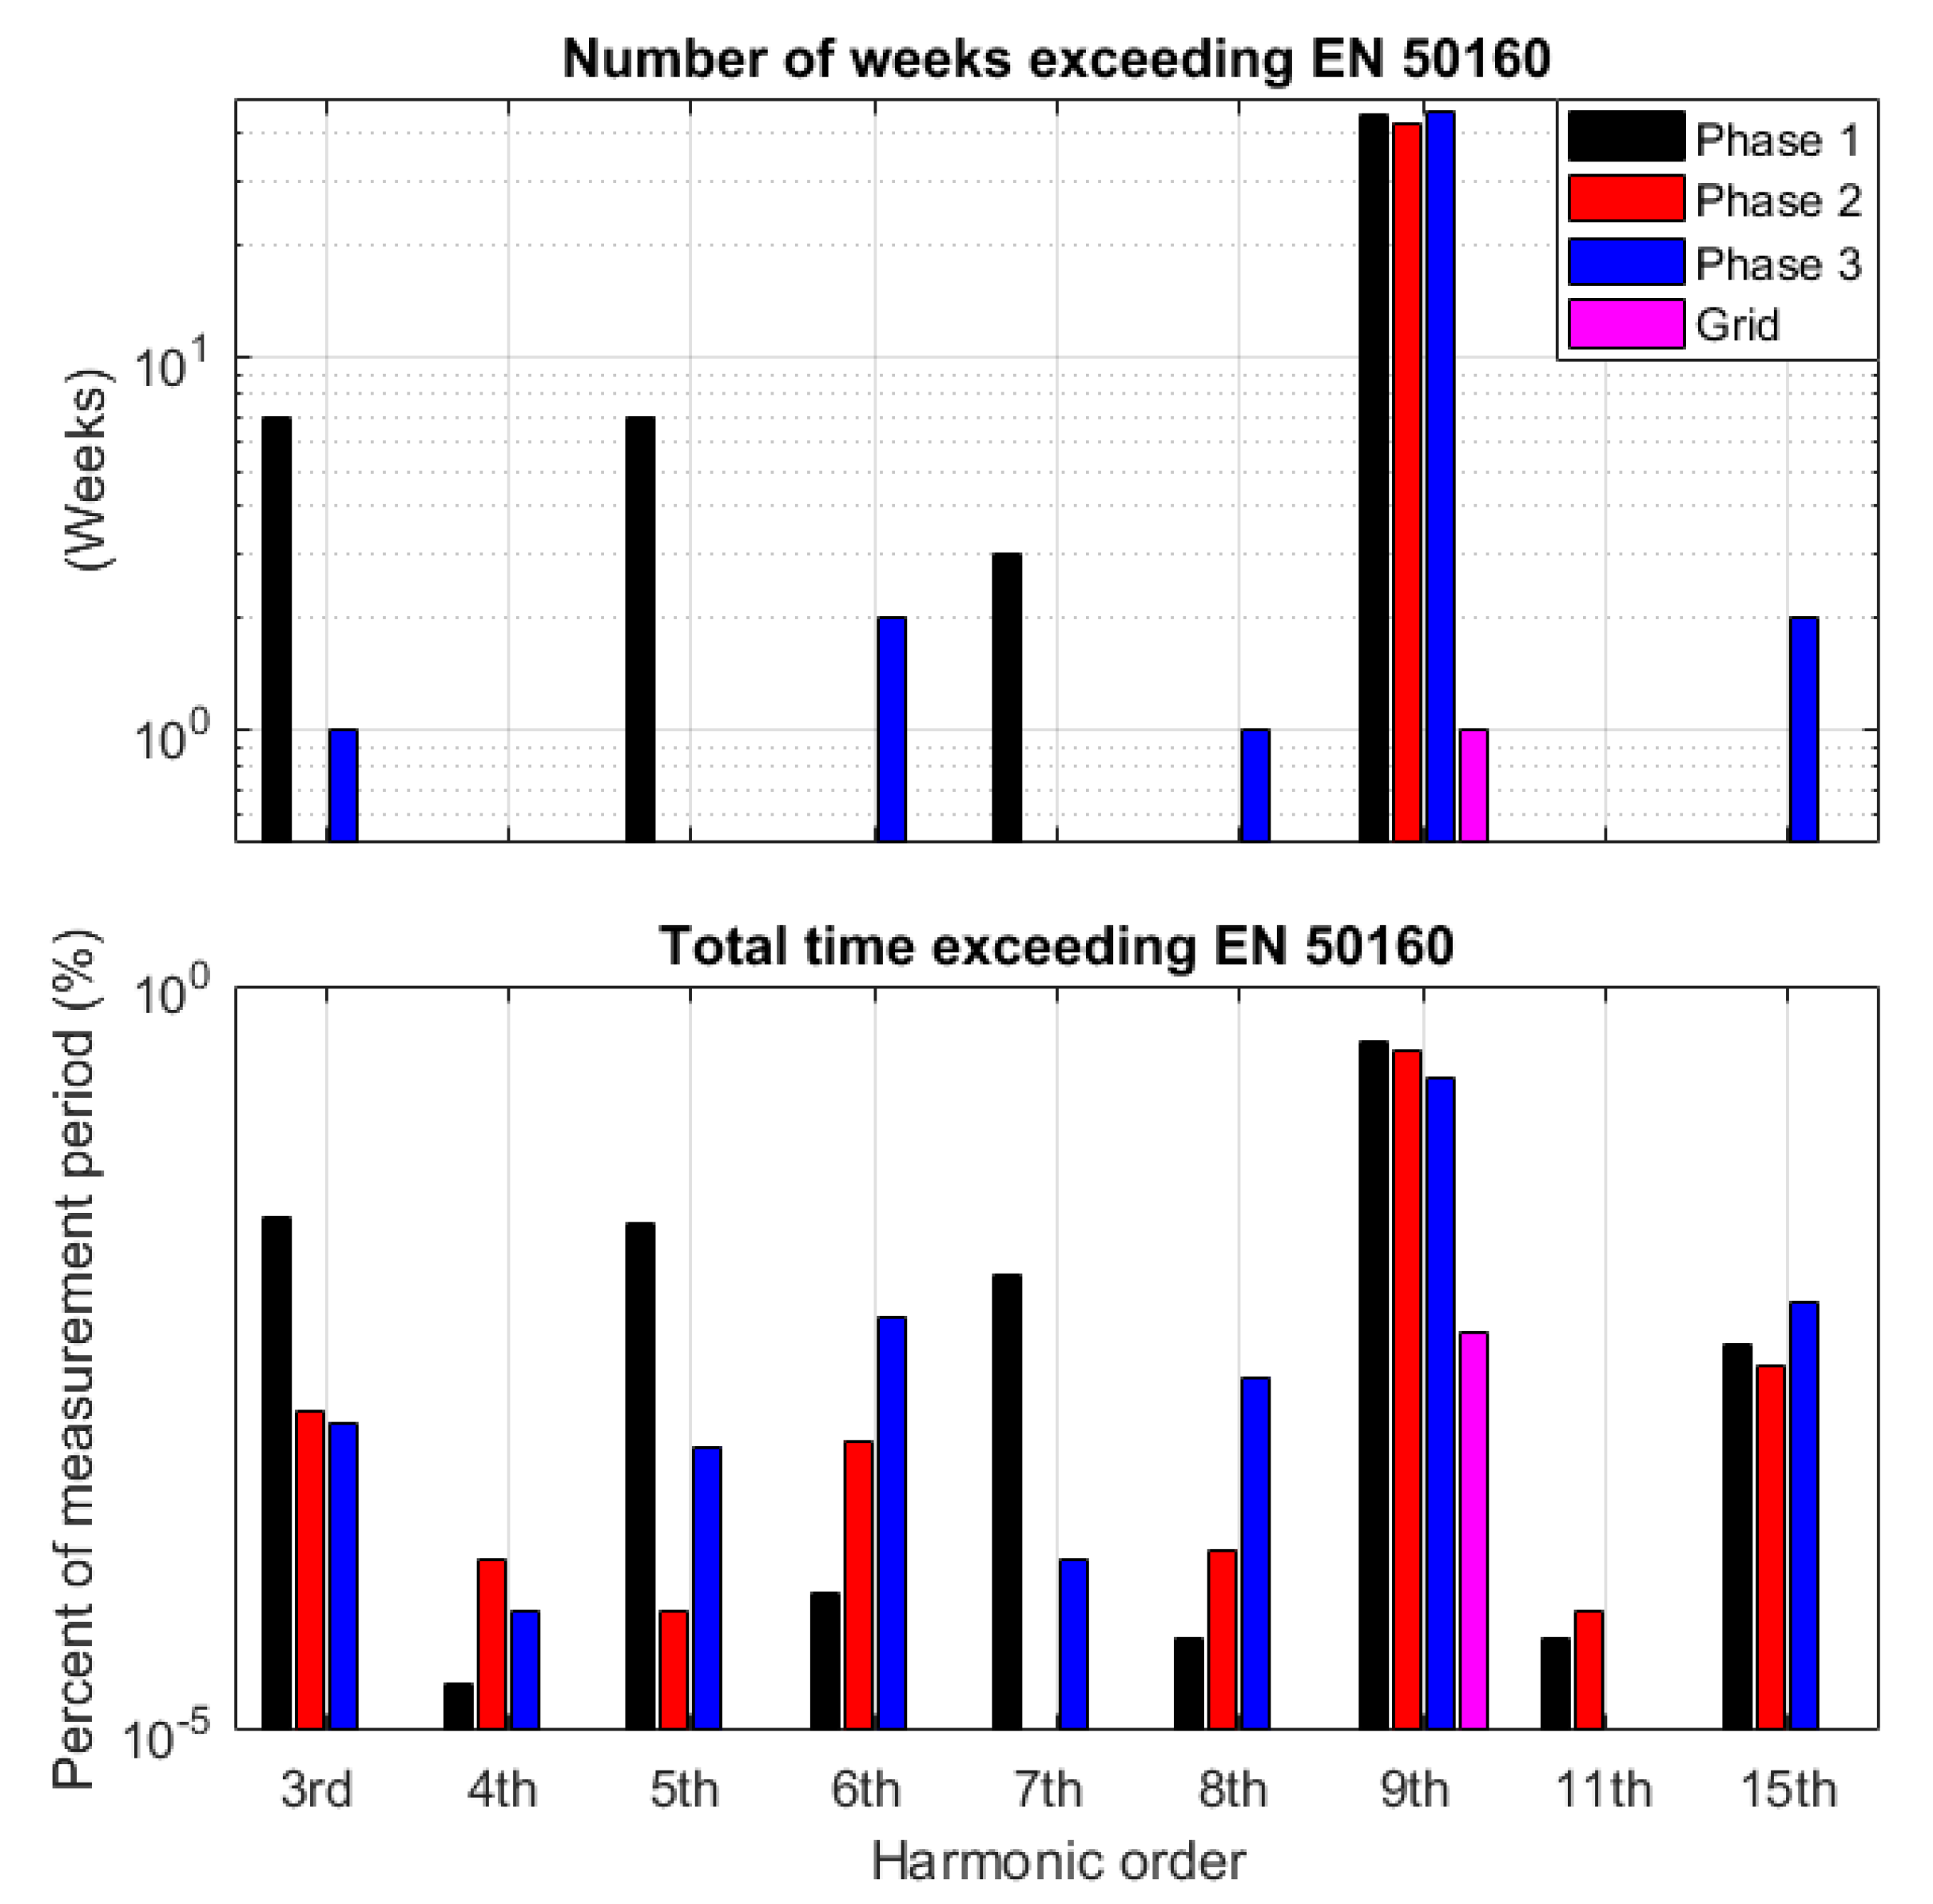
Figure 23.
The number of times the individual harmonics exceeded the 10 min limits in EN 50160 (top) and the amount of time during the measurement period (48 weeks in islanded operation and 54 weeks in grid-connected operation) in which the individual harmonics exceeded the limits in EN 50160 (bottom) for islanded and grid-connected operation. Note the logarithmic vertical scale.
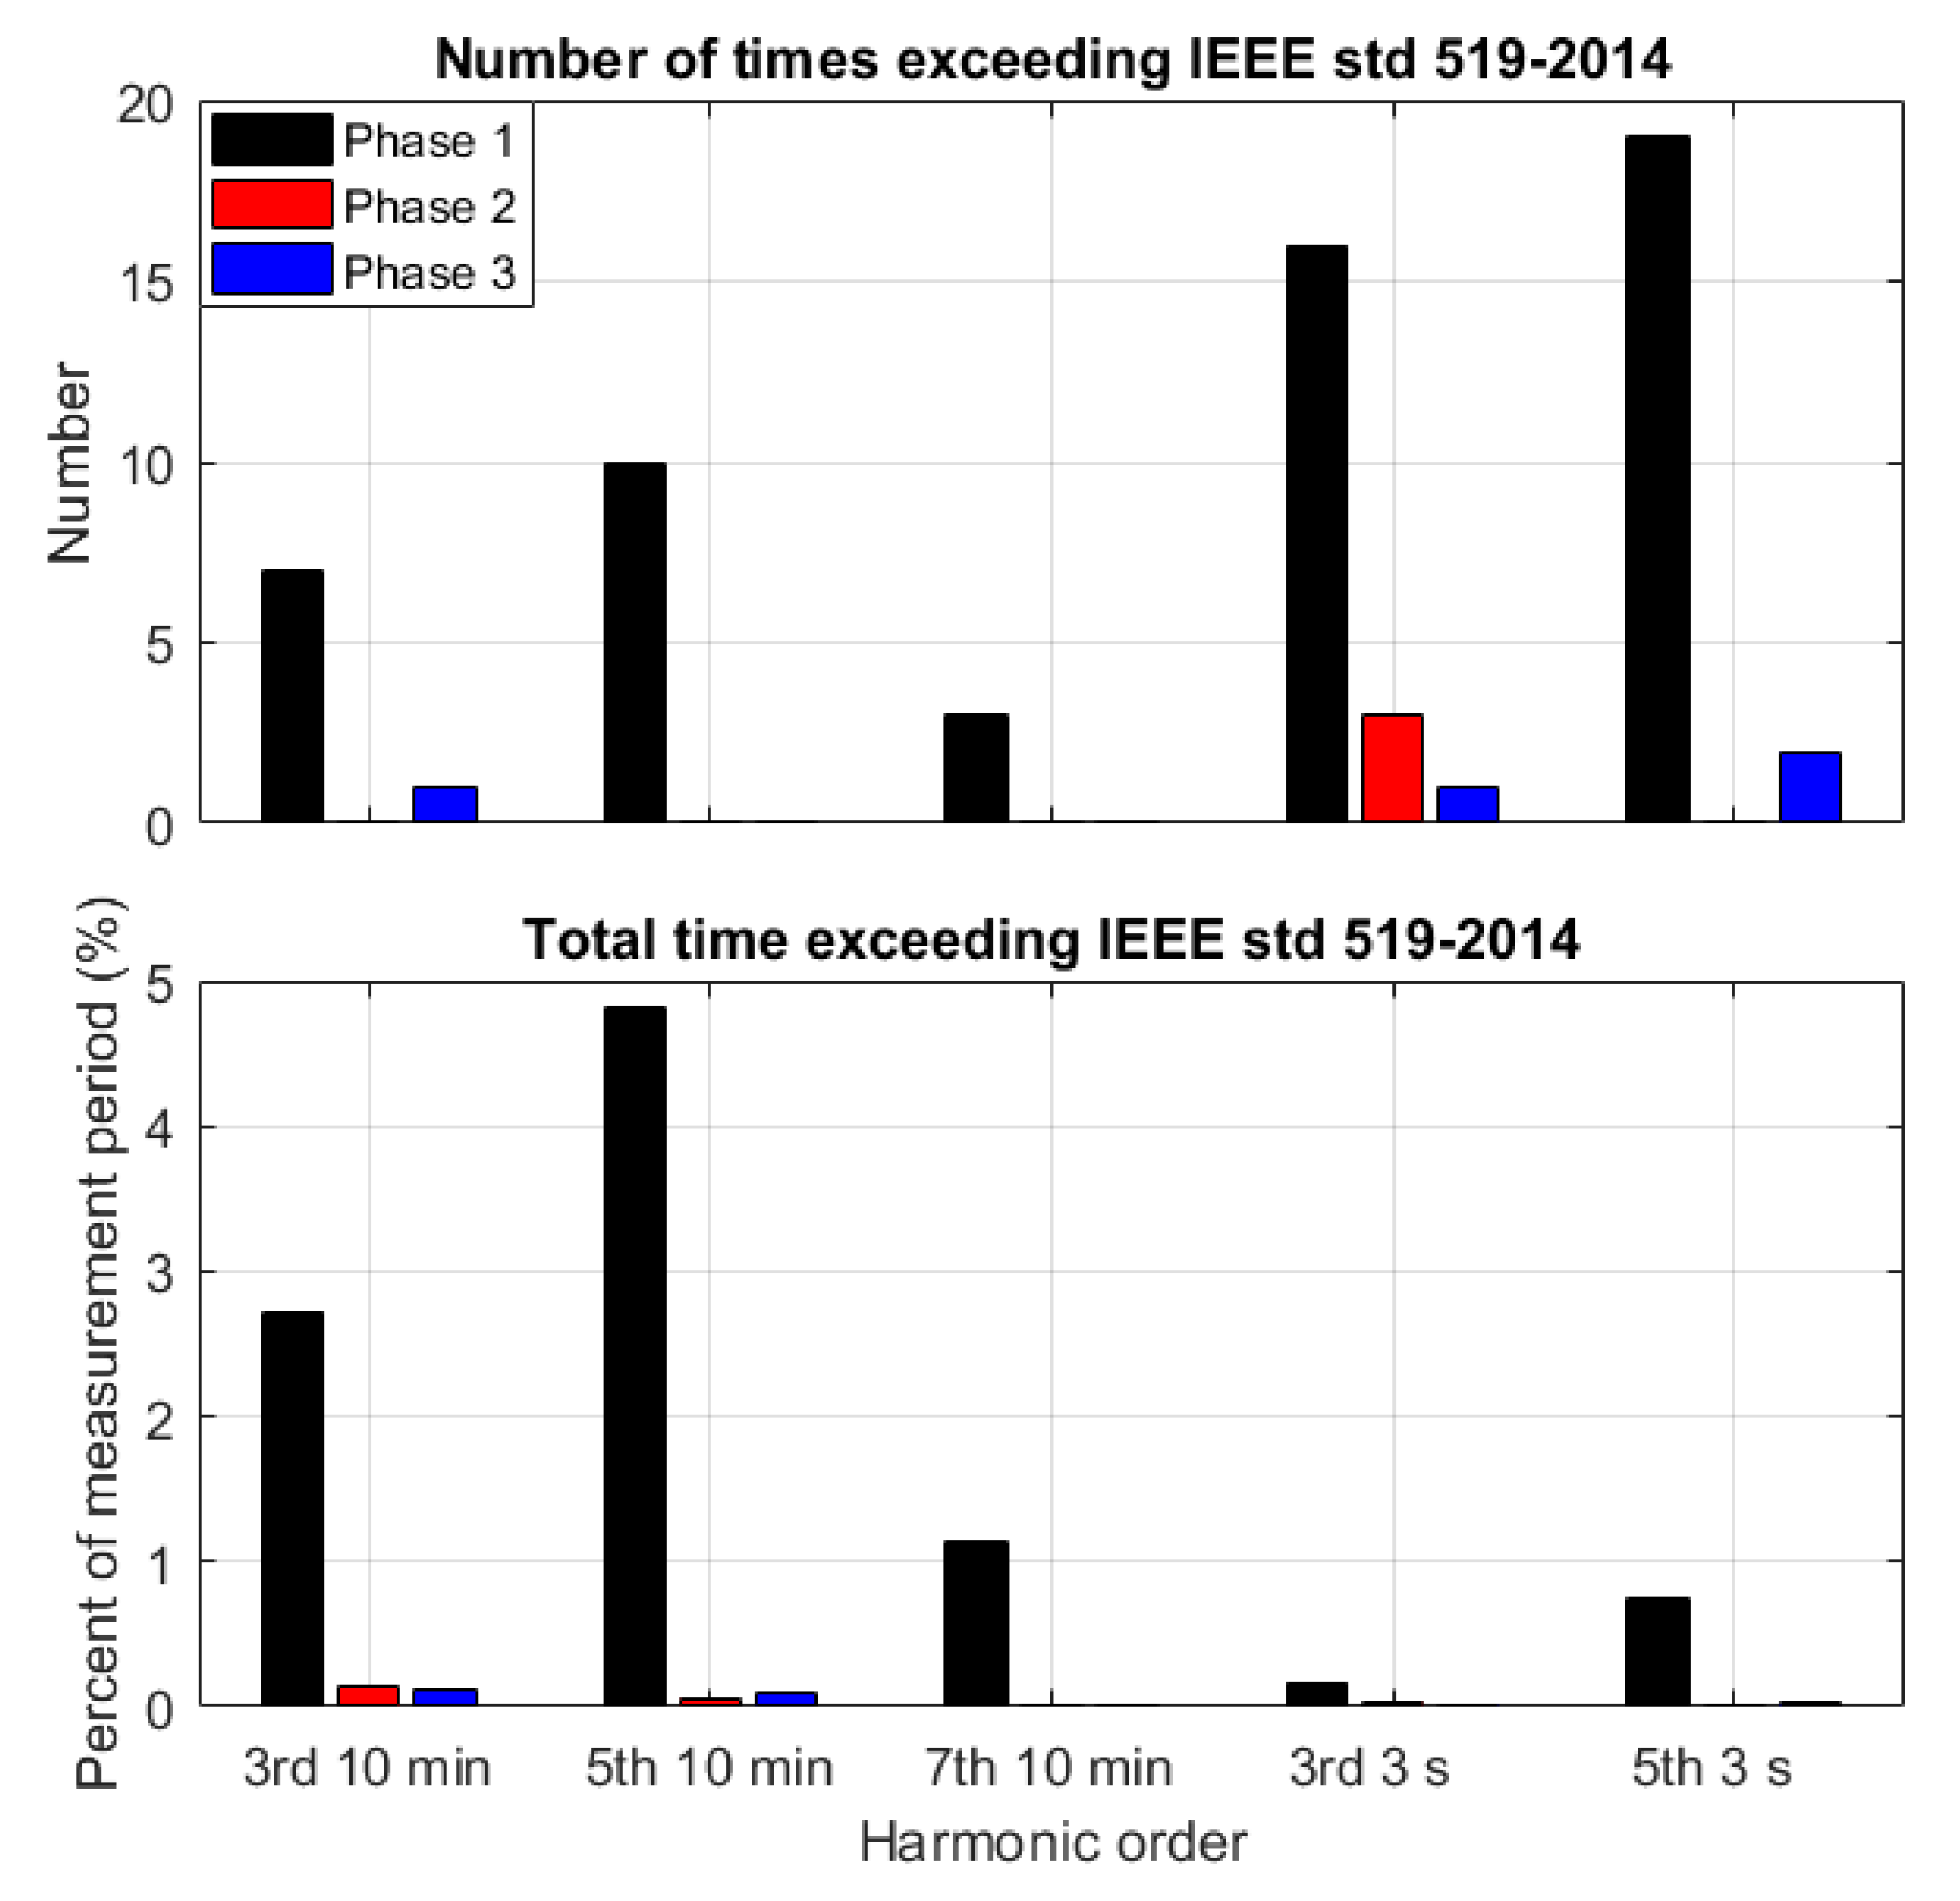
Figure 24.
The number of times the individual harmonics exceeded the 10 min (in weeks) and 3 s limit (in days) in IEEE 519-2014 (top) and the amount of time during the measurement period of 48 weeks in which the individual harmonics exceeded the limits in IEEE 519-2014 (bottom) for islanded operation.
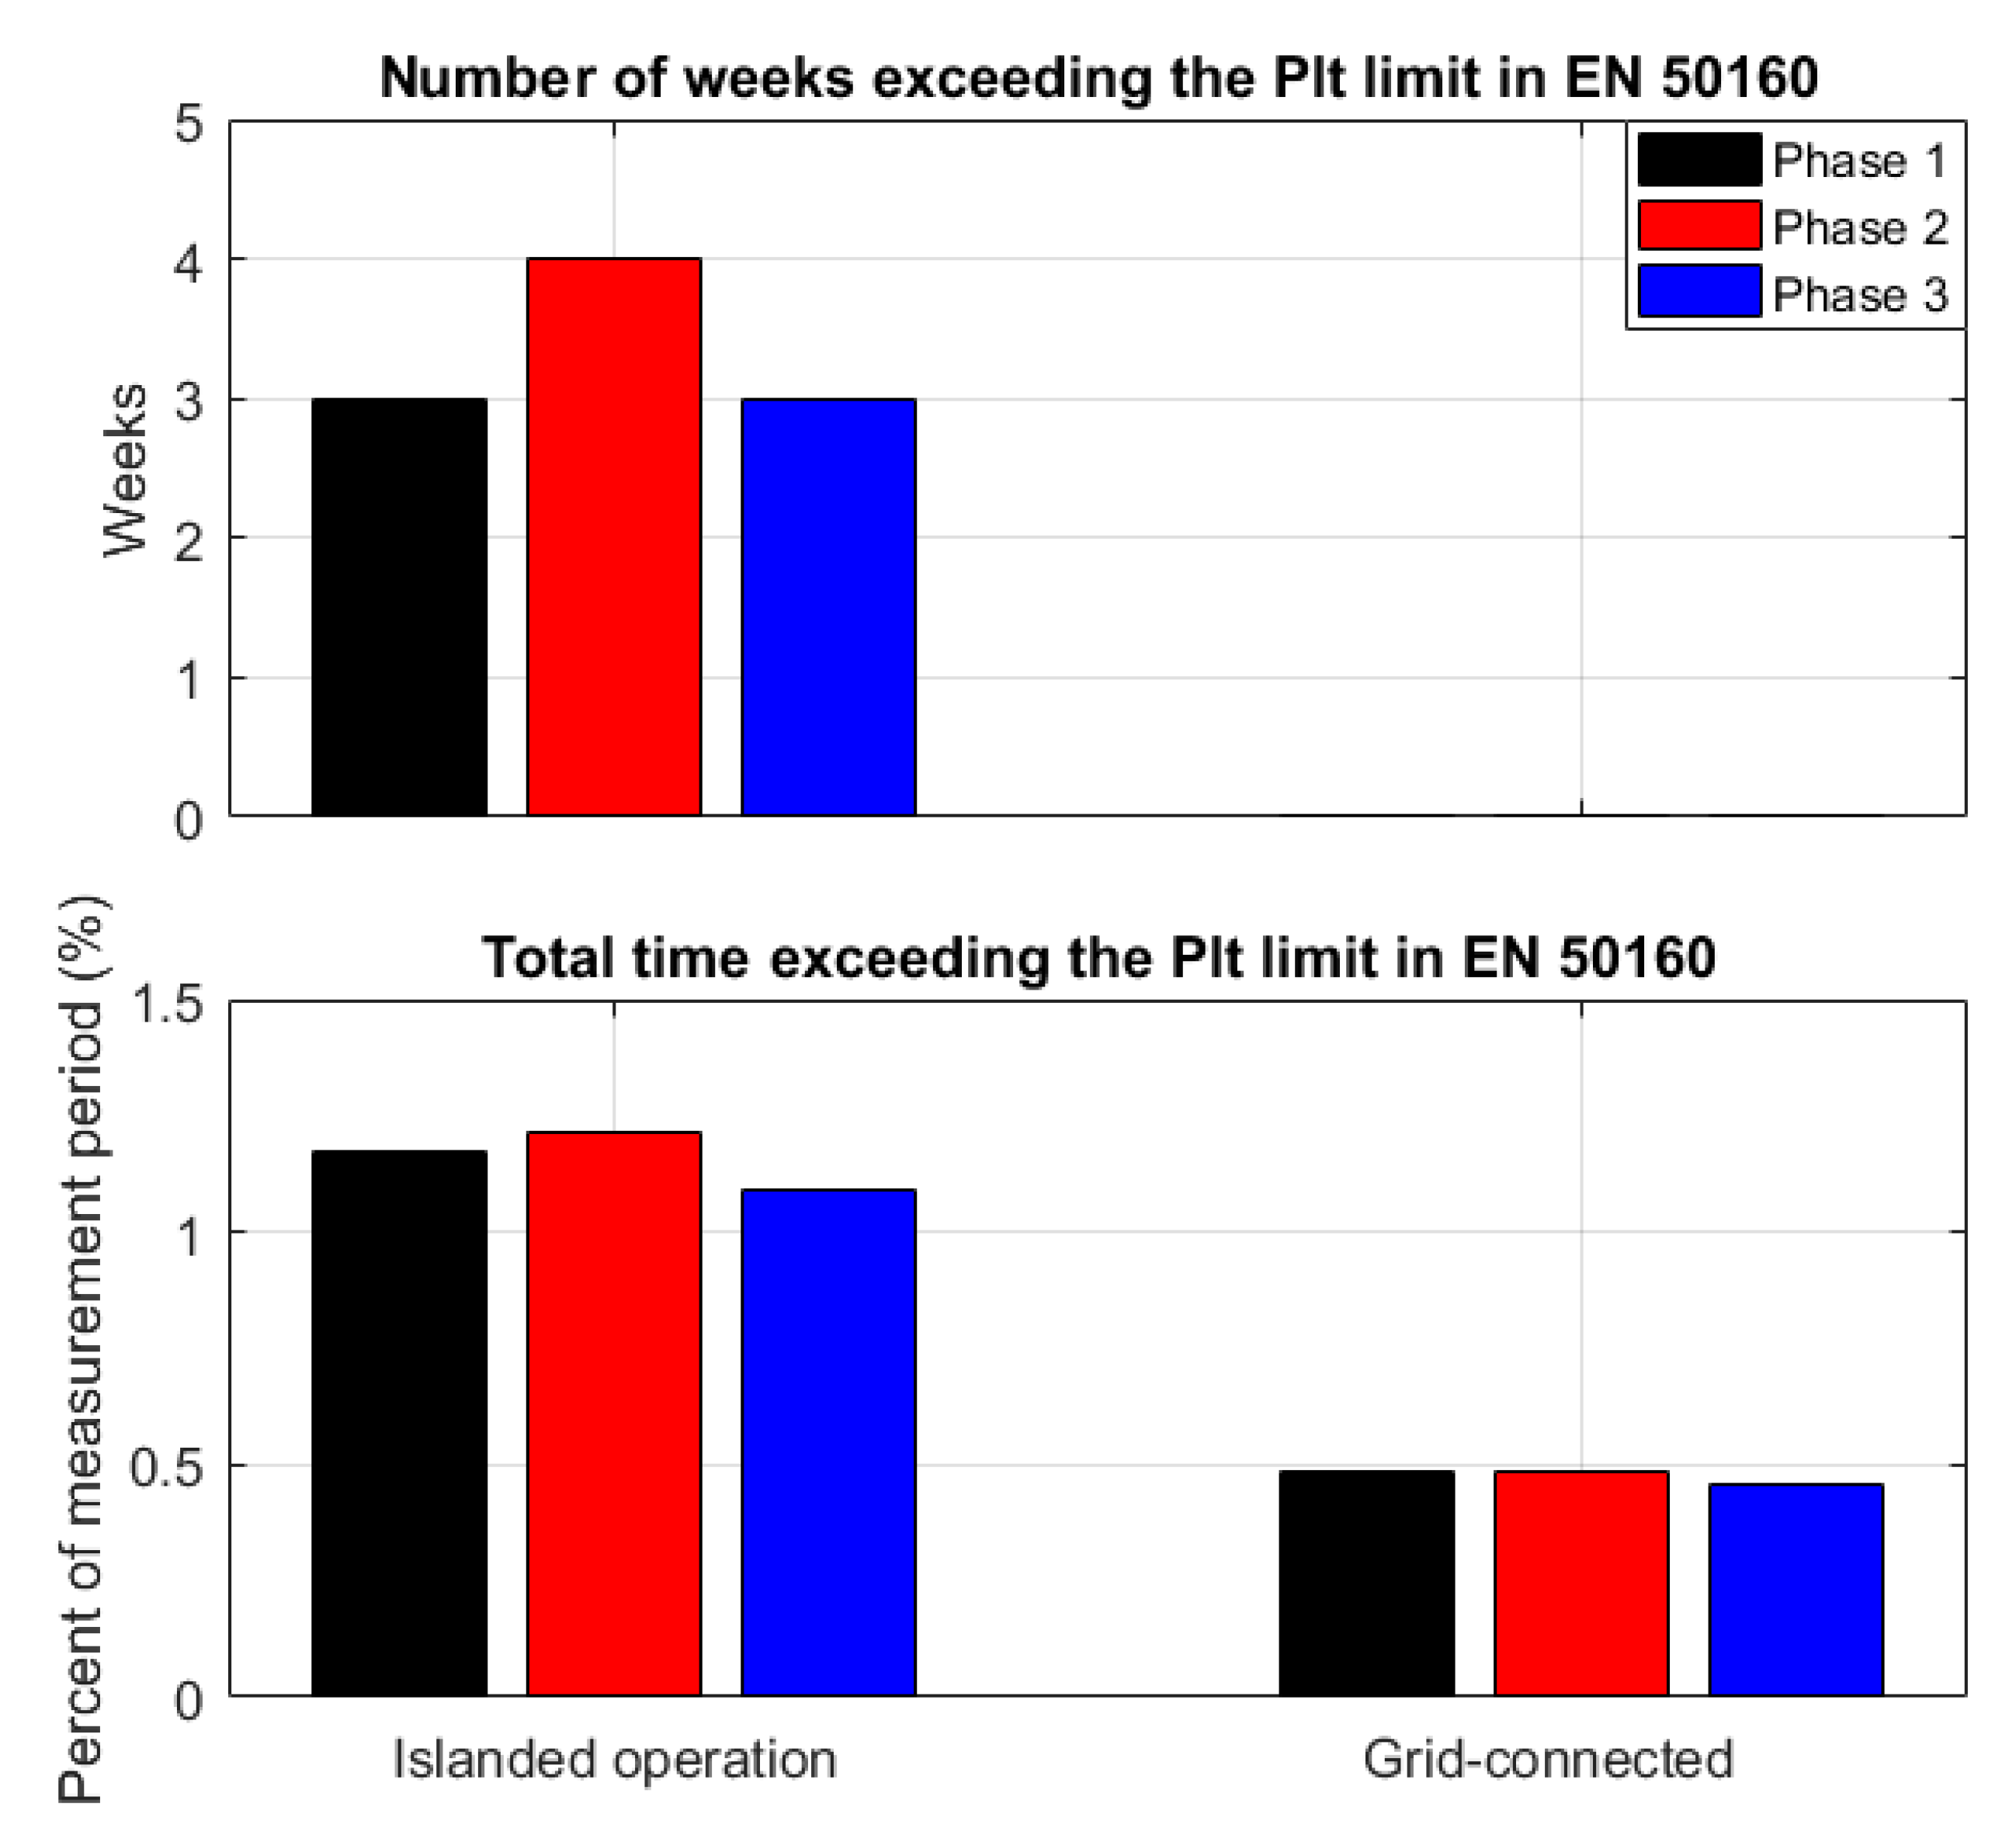
Figure 25.
The number of times the Plt values exceeded the limits in EN 50160 (top) and the amount of time during the measurement period of 48 weeks in which the Plt values exceeded the limits in EN 50160 (bottom) for islanded operation.
Figure 25.
The number of times the Plt values exceeded the limits in EN 50160 (top) and the amount of time during the measurement period of 48 weeks in which the Plt values exceeded the limits in EN 50160 (bottom) for islanded operation.
Table 1.
95% Confidence interval (CI) for the 10 min values, the maximum 10 min value and total average value for all three phases in islanded and grid-connected operation.
Table 1.
95% Confidence interval (CI) for the 10 min values, the maximum 10 min value and total average value for all three phases in islanded and grid-connected operation.
| Operational State | 95% CI 10 min Value | Max 10 min Value | 95% CI 3 s Value | Max 3 s Value | Total Average Value |
|---|
| Islanded | 1.34 to 8% | 7.83 to 13.01% | 1.28 to 8.06% | 18.3 to 21.9% | 2.23 to 3.82% |
| Grid-connected | 0.77 to 1.88% | 2.41 to 2.47% | 0.76 to 1.88% | ≈2.5% | 1.08 to 1.44% |
Table 2.
Total average value for each measured voltage harmonic for all three phases.
Table 2.
Total average value for each measured voltage harmonic for all three phases.
| Operational State | 3rd (%) | 4th (%) | 5th (%) | 6th (%) | 7th (%) | 8th (%) | 9th (%) | 11th (%) | 15th (%) |
|---|
| Islanded | 0.95 to 1.96 | 0.01 to 0.02 | 0.83 to 2.0 | 0.016 to 0.04 | 0.61 to 1.45 | 0.008 to 0.016 | 1.20 to 1.38 | 0.63 to 0.66 | 0.20 to 0.18 |
| Grid-connected | 0.30 to 0.52 | ≈0.001 | 0.66 to 0.90 | ≈10-4 | 0.55 to 0.60 | ≈10-5 | 0.34 to 0.44 | 0.14 to 0.17 | 0.10 to 0.15 |
Table 3.
95% confidence interval, the maximum 10 min value and total average value for all three phases in islanded and grid-connected operation.
Table 3.
95% confidence interval, the maximum 10 min value and total average value for all three phases in islanded and grid-connected operation.
| Operational State | 95% CI 10 min Value | Max 10 min Value | Total Average Value |
|---|
| Islanded | 0.06 to 0.72% | 4.6% | 0.22% |
| Grid-connected | 0.11 to 0.68% | 1.77% | 0.31% |
Table 4.
95% confidence interval, the maximum 10 min value and total average value for all three phases in islanded and grid-connected operation.
Table 4.
95% confidence interval, the maximum 10 min value and total average value for all three phases in islanded and grid-connected operation.
| Operational State | 95% CI | Max Value | Total Average Value |
|---|
| Islanded | 0.06 to 0.74 | 6.43 to 7 | 0.18 to 0.35 |
| Grid-connected | 0.14 to 0.52 | 2.3 to 2.34 | 0.24 to 0.32 |
Table 5.
95% confidence interval, the maximum 10 min value and total average value for all three phases in islanded and grid-connected operation.
Table 5.
95% confidence interval, the maximum 10 min value and total average value for all three phases in islanded and grid-connected operation.
| Operational State | 95% CI | Maximum Value | Total Average Value |
|---|
| Islanded | 0.07 to 0.72 | 2.78 to 2.99 | 0.21 to 0.36 |
| Grid-connected | 0.19 to 0.52 | 1.16 to 1.2 | 0.26% 0.34 |
Table 6.
95% confidence interval, the maximum 10 min value and total average value for all three phases in islanded and grid-connected operation.
Table 6.
95% confidence interval, the maximum 10 min value and total average value for all three phases in islanded and grid-connected operation.
| Operational State | 95% CI 10 min | Max 10 min Value | Total Average Value |
|---|
| Islanded | 0.013 to 0.56 | 4.6 to 6.34 | 0.095 to 0.15 |
| Grid-connected | 0.18 to 1.9 | 5.75 to 7.89 | 0.61 to 0.81 |
Table 7.
95% confidence interval, the maximum 3 s value and total average value for all three phases in islanded and grid-connected operation.
Table 7.
95% confidence interval, the maximum 3 s value and total average value for all three phases in islanded and grid-connected operation.
| Operational State | 95% CI 3 s | Max 3 s Value | Total Average Value |
|---|
| Islanded | ≈0 to 0.58 | 15.52 to 18.3 | 0.07 to 0.11 |
| Grid-connected | 0.015 to 2.32 | 10.6 to 15.7 | 0.50 to 0.66 |
Table 8.
95% confidence interval, the maximum 10 min value and total average value for all three phases in islanded and grid-connected operation.
Table 8.
95% confidence interval, the maximum 10 min value and total average value for all three phases in islanded and grid-connected operation.
| Operational State | 95% CI 10 min | Max 10 min Value | Total Average Value |
|---|
| Islanded | 2.15 to 17.6 | 41.4 | 5 |
| Grid-connected | 1.2 to 15.1 | 41.8 | 3.6 |
Table 9.
EN 50160 limits for individual harmonics at the low voltage Point of Common Coupling (PCC).
Table 9.
EN 50160 limits for individual harmonics at the low voltage Point of Common Coupling (PCC).
| Harmonic Order | Percent of Fund (%) |
|---|
| 3rd | 5 |
| 4th | 1 |
| 5th | 6 |
| 6th | 0.5 |
| 7th | 5 |
| 8th | 0.5 |
| 9th | 1.5 |
| 11th | 3.5 |
| 15th | 0.5 |


