Article

Mitigating Energy System Vulnerability by Implementing a Microgrid with a Distributed Management Algorithm

by
Juan M. Lujano-Rojas
,
José M. Yusta
and
José Antonio Domínguez-Navarro
*
Department of Electrical Engineering, University of Zaragoza, Calle María de Luna 3, 50018 Zaragoza, Spain
*
Author to whom correspondence should be addressed.
Energies 2019, 12(4), 616; https://doi.org/10.3390/en12040616
Submission received: 3 December 2018 / Revised: 29 January 2019 / Accepted: 12 February 2019 / Published: 15 February 2019
(This article belongs to the Special Issue Smart Energy Management for Smart Grids 2019)

Abstract

:
This work presents a management strategy for microgrid (MG) operation. Photovoltaic (PV) and wind generators, as well as storage systems and conventional units, are distributed over a wide geographical area, forming a distributed energy system, which is coordinated to face any contingency of the utility company by means of its isolated operation. The management strategy divides the system into three main layers: renewable generation, storage devices, and conventional units. Interactions between devices of the same layer are determined by solving an economic dispatch problem (EDP) in a distributed manner using a consensus algorithm (CA), and interactions between layers are determined by means of a load following strategy. In this way, the complex behaviour of PV and wind generation, the battery storage system, and conventional units has been effectively combined with CA to solve EDP in a distributed manner. MG performance and its vulnerability are deeply analysed by means of an illustrative case study. From the observed results, vulnerability under extreme conditions could be reduced up to approximately 30% by coupling distributed renewable generation and storage capacity with an energy system based on conventional generation.

1. Introduction

The constant development of information and communication technologies and the depletion of natural resources accompanied by climate change have exposed infrastructures required for industrial and manufacturing processes and the provision of services and products to new, unique threats. As a consequence, the definition of vulnerability and the manners to mitigate it are being widely studied.
Energy systems are undergoing an important transformation by adopting communication capabilities to improve monitoring procedures and consumer interactions. This represents a transition from a traditional energy system to an intelligent one.
Similar to other industrial infrastructures, an intelligent system is exposed to risks from the interaction between the power system and the communication infrastructure (CI), as well as natural phenomena [1]. A representative example is the December 2015 cyber-attack in Ukraine, where a six-hour blackout affected hundreds of thousands of consumers in Kiev [2].
To provide a resilient power supply, this panorama has encouraged the development of the microgrid (MG) concept. In this regard, problems caused by Hurricane Sandy on the East Coast of the United States have motivated the installation of an MG as a part of the energy system rebuilding plan [3,4]. Similarly, an MG installed at Stafford Hill is able to provide energy to critical infrastructures in a resilient and effective manner [5].
Resilient power generation can be achieved by linking together equipment spread over a community to build an MG capable of operating in stand-alone mode. Thus, distributed energy conversion equipment combined with CI can be coordinated to supply the energy demand, reduce the negative effects of cascading failure, speed up system restoration, and avoid a massive loss of load [6].
An MG can be managed by using centralised or decentralised algorithms, which in most cases, aim to minimize operating costs. On one hand, centralised systems have been traditionally used for the control and optimisation of power systems. In this type of implementation, management is carried out by applying mathematical optimisation techniques, such as linear programming [7,8], mixed-integer linear programming [9,10], and mixed-integer nonlinear programming [11], among other approaches. In addition, heuristic optimisation techniques, such as the gravitational search algorithm, particle swarm optimisation, and the genetic algorithm [12], have also been suggested. On the other hand, interest in decentralised systems has grown with the incorporation of distributed generation. Decentralised management can be performed by using the alternating direction method of multipliers with proximal message passing, gradient dynamics, dynamic programming with message passing, and the consensus algorithm (CA) [13], among other techniques.
Discussion of the pros and cons of centralised and decentralised strategies began some time ago. A comparison of both strategies, in terms of cost, latency, and reliability, revealed that decentralised approaches could produce better latency and reliability with similar costs to their centralised counterpart [14].
As the main contribution of this paper, the MG operation to reduce distribution system (DS) vulnerability is extensively analysed, with special attention given to the management strategy. Experience obtained from the analysis of hybrid energy systems (HESs) [15] is used in this work to study the MG behaviour under emergency conditions. Load following, which is a management strategy frequently used on HESs, is combined with CA to determine the optimal power dispatch of the MG in a distributed manner.
To prevent power disruption as a result of voltage collapse, a strategy based on the maximum loadability index (MLI) is introduced so that distributed resources, such as wind and photovoltaic (PV) generation, as well as conventional generation and battery energy storage systems (BESS), are effectively used to prevent voltage problems. Additionally, stand-alone operating mode is deeply studied; this condition results from the disconnection of the corresponding feeder as a consequence of operating problems of a utility company.
Essentially, this paper presents an algorithm for the solution of the economic dispatch problems (EDP) on energy systems with distributed generators and storage devices while working in stand-alone mode. Important features related to the interaction between renewable generation and BESS operation and the relationship between storage capacity and power generation with electricity prices are extensively analysed. Daily and yearly simulations with a time step of 15 min and 1 h, respectively, were performed to illustrate the behaviour of the proposed management algorithm.
The remainder of the paper is organized as follows: Section 2 describes the models used to represent renewable resources and energy demand; Section 3 carefully describes the MG management algorithms proposed in this work; Section 4 illustrates the developed strategies using representative case studies; and, finally, conclusions are clearly presented in Section 5.

2. Microgrid Simulation and Modelling

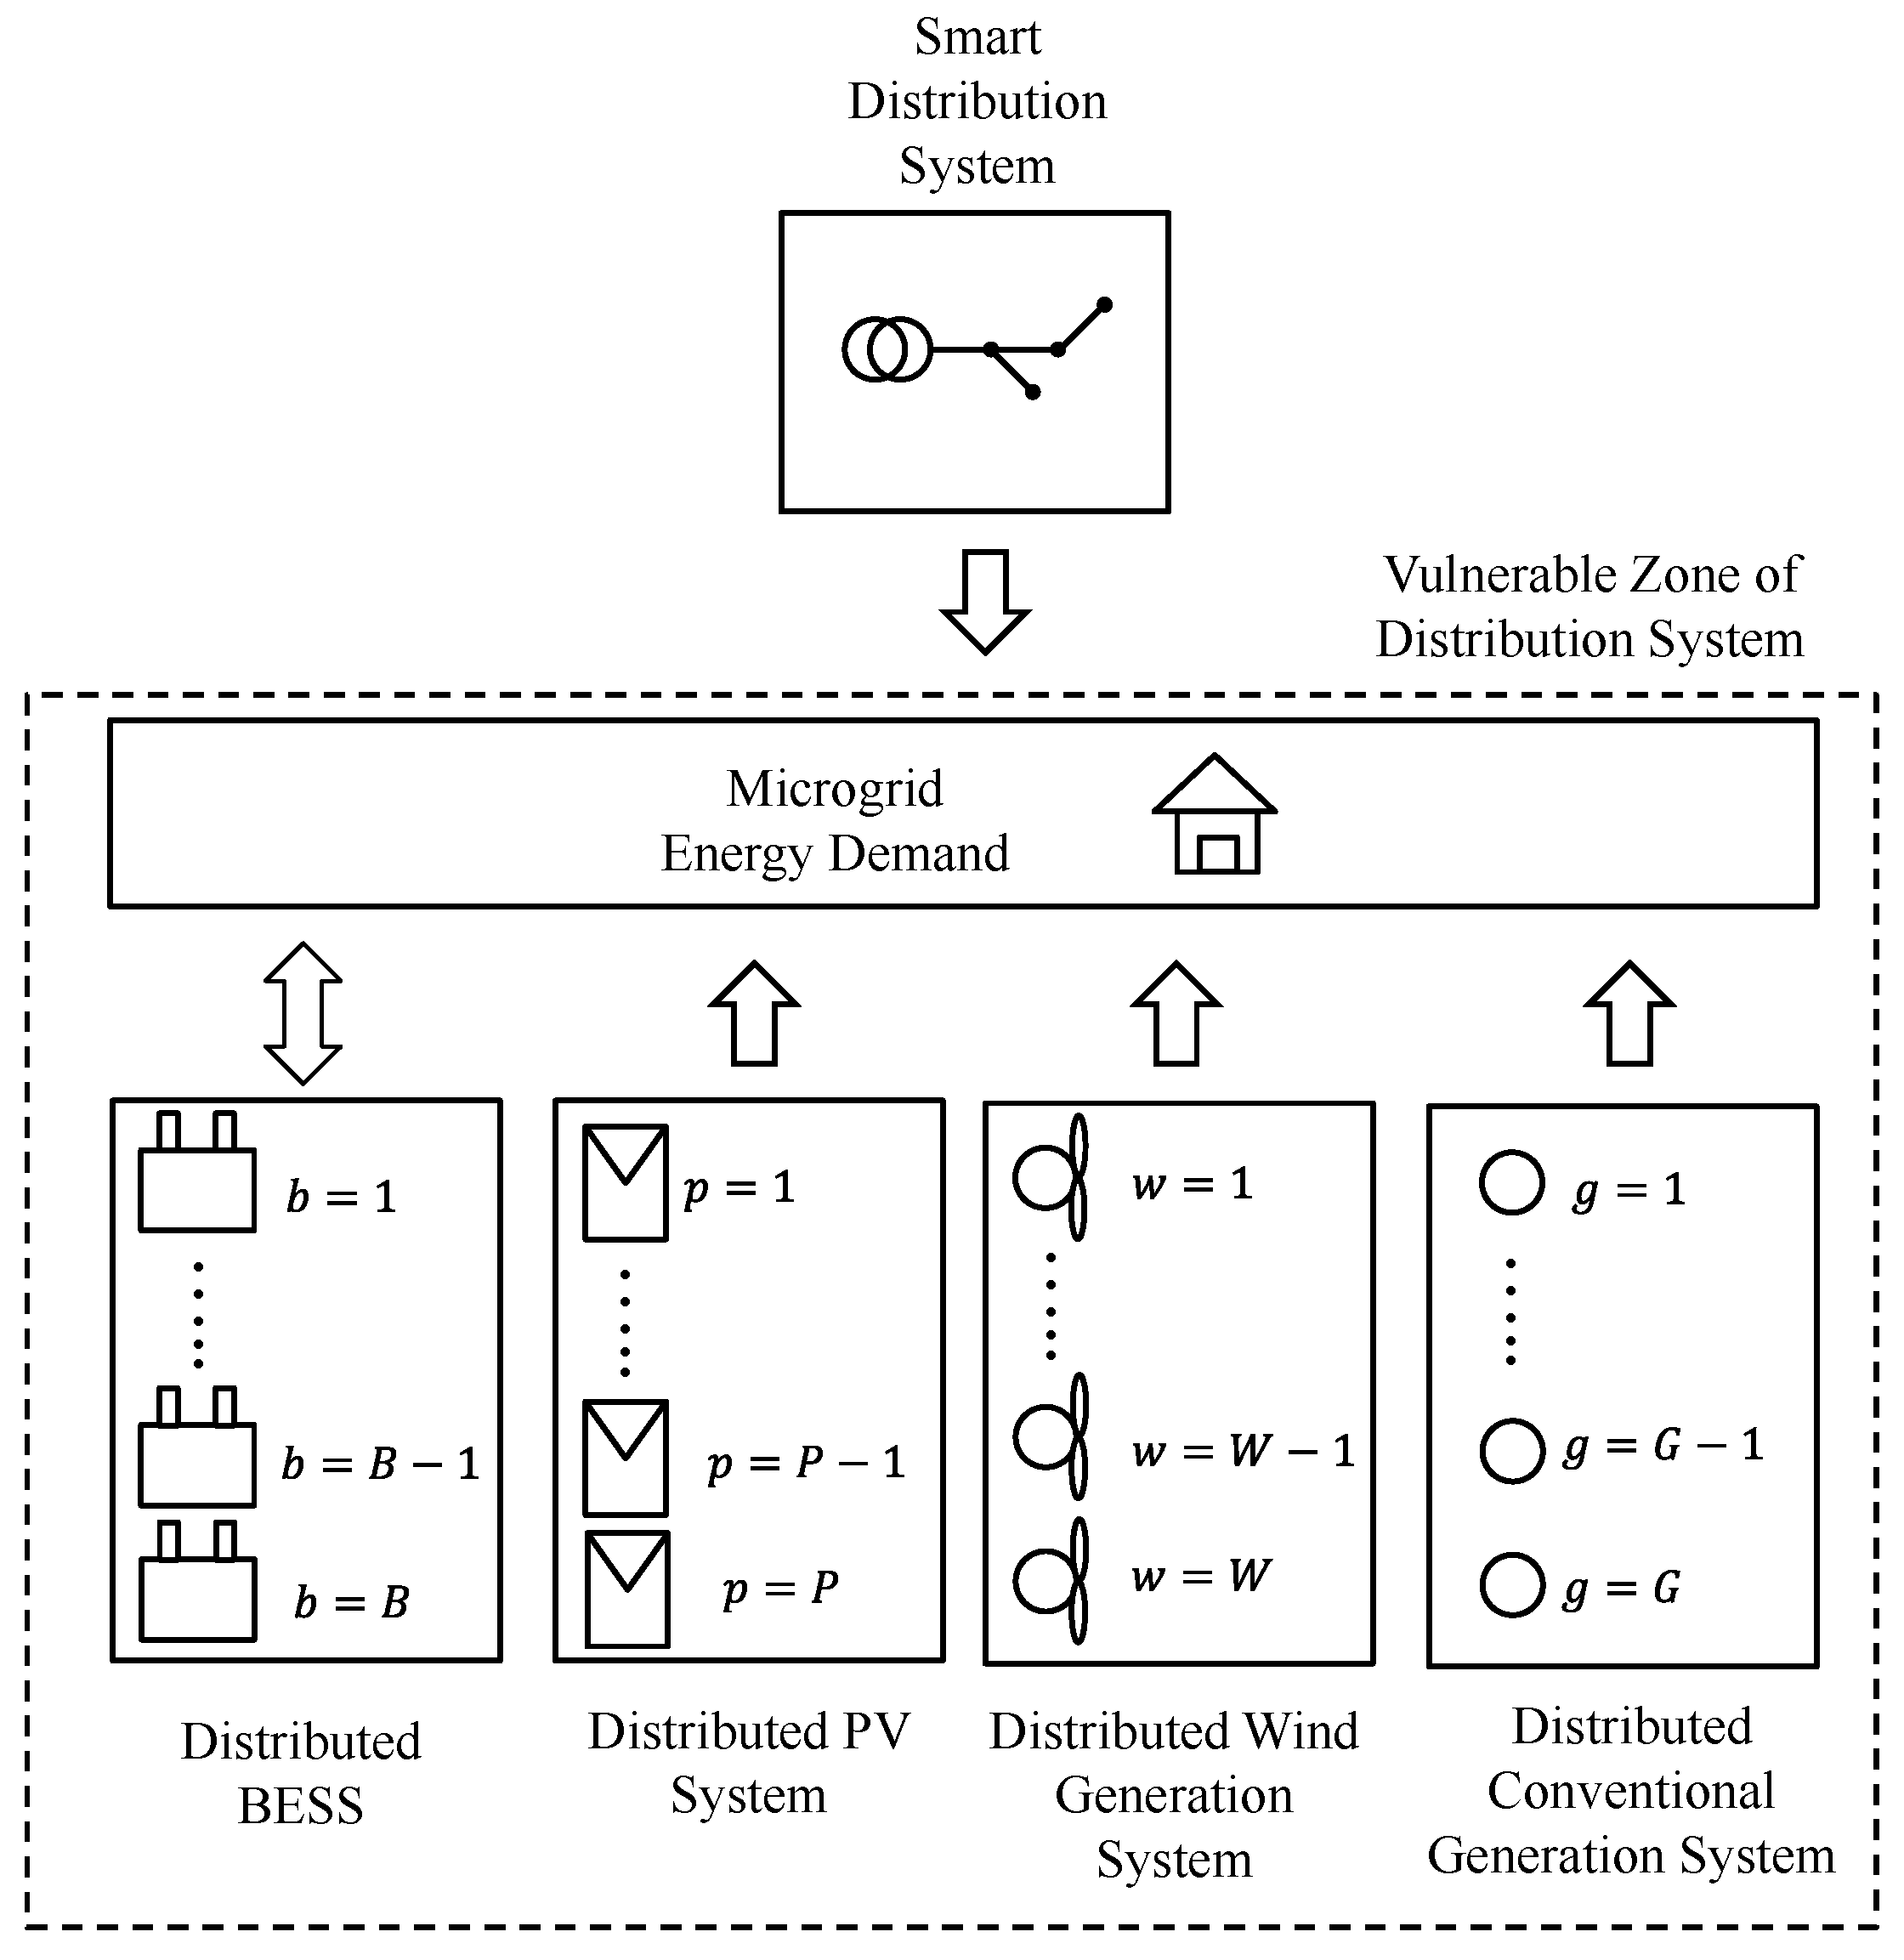
The structure of the system under analysis is briefly shown in Figure 1. As can be observed, an MG is adopted to preserve determined sensitive load (MG energy demand) functioning. Renewable and conventional sources provide energy to the MG system, while energy storage devices offer flexibility by absorbing or providing energy through the charging and discharging processes, respectively.
In a general sense, an MG load is supposed to be within the vulnerable zone of a DS, and its operation is crucial, so this load deserves special attention from the energy system designer and operator. To guarantee energy supply in a feasible manner, distributed power generation and storage devices can be managed to provide the critical load, thus reducing the vulnerability of the whole system.
BESS, renewable power sources, and conventional generators (CGs) are intended to be distributed around the geographical area of the location of interest. BESS is distributed into B units ( b = 1 , , B ), and renewable generation is distributed into P photovoltaic generators ( p = 1 , , P ) and W wind farms ( w = 1 , , W ), while conventional units are distributed into G generators ( g = 1 , , G ).
The next subsections describe the models used to represent natural resources, energy demand, distributed generators, and storage devices, as well as the CI required to manage the entire energy system.

2.1. Natural Resources and Load Demand Modelling

Characterisation of meteorological variables, such as wind speed, solar radiation ( G ( t ) ), and ambient temperature ( T A ( t ) ), is a crucial step in the analysis of an energy system. Estimation methodology based on retrospective reanalysis presented in [16,17] and publically available in [18] was used in this work as a data source for the hourly representation of the aforementioned variables.
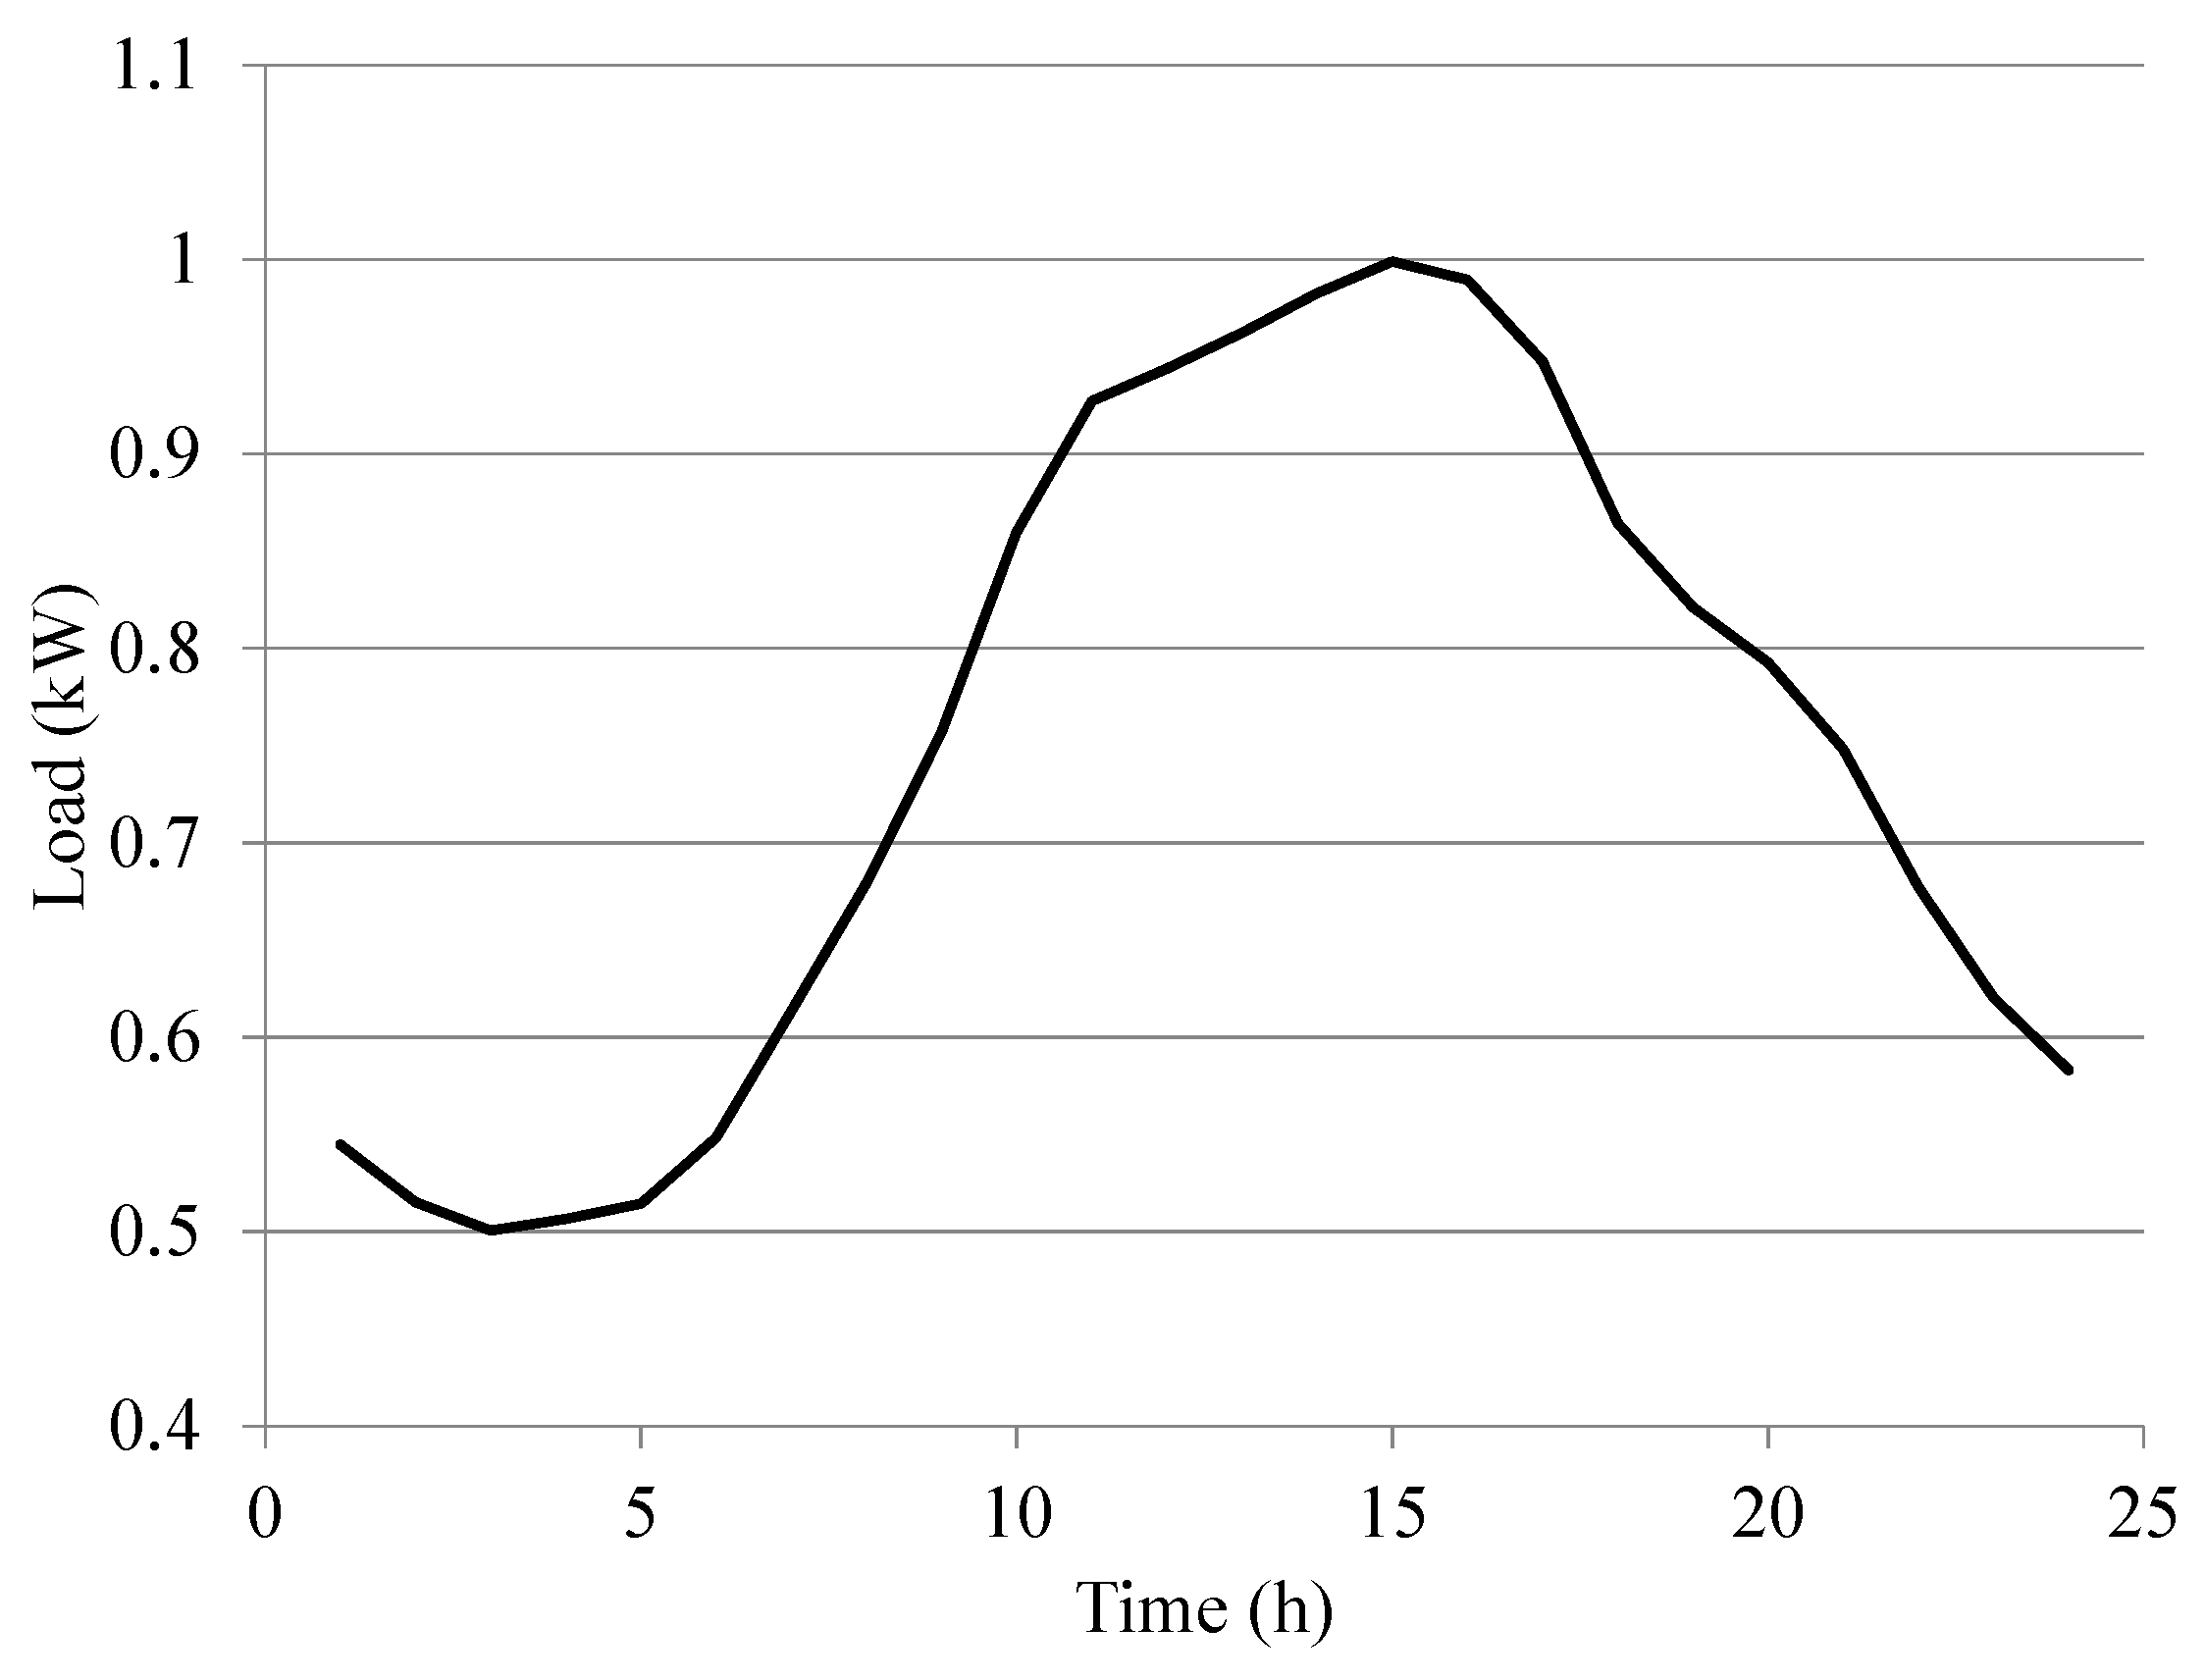
Load demand modelling was simulated by using the load profile shown in Figure 2 [19] combined with the model presented in (1)–(6).
The methodology used for load modelling is based on [20] and has been widely used for the analysis of HESs. It aims to create a yearly time series from the daily profile of Figure 2. The first step consists of creating a correlated random time series according to (1). Randomness is introduced by using the variable ξ ( t ) , which is modeled as a Gaussian random number with a mean equal to zero and standard deviation equal to 1 ( Ø L ) 2 . The second step consists of normalising the daily profile of Figure 2. The variable L ( n , t ) is obtained by repeating the daily profile of interest (Figure 2) in a periodic manner. Then, the normalised time series ( l ( n , t ) ) is obtained by applying (2). The addition of correlated ( φ ( n , t ) ) and normalised ( l ( n , t ) ) time series according to (3) results in a time series with some correlation degree ( Ø L ) and the diurnal profile of Figure 2. Based on the equality presented in (4), which is in fact a probability transformation, the simulated load time series ( P T ( n , t ) ) can be obtained according to (5). The cumulative distribution function (CDF) of the simulated load demand ( f L ) can be modeled by using a log-normal distribution or beta distribution [21].
φ ( n , t ) = Ø L ( φ ( n , t 1 ) ) + ξ ( t ) ;
l ( n , t ) = L ( n , t ) μ σ ;
z ( n , t ) = l ( n , t ) + φ ( n , t ) ;    
f Z ( z ( n , t ) ) = f L ( P T ( n , t ) ) ;
P T ( n , t ) = f L 1 ( f Z ( z ( n , t ) ) ) .
P L ( n , t ) = [ P T ( n , t ) m i n ( P T ( n , t ) ) m a x ( P T ( n , t ) ) m i n ( P T ( n , t ) ) ] ( P L m a x P L m i n ) + P L m i n .
Characteristics of demand time series ( P T ( n , t ) ) can be modified by scaling the values between two different limits ( P L m i n and P L m a x ) according to (6), resulting in a time series ( P L ( n , t ) ) with a diurnal profile similar to that shown in Figure 2, limited within a pre-defined load interval.

2.2. Model of Distributed PV Generator

A mathematical model of the distributed PV generator is presented in (7)–(23). The whole system is composed of several ( P ) PV generators. For a determined PV system ( p ), cell temperature ( T P V ( p , t ) ) is shown in (7) [20]. Equations (8)–(16) [22] represent the model of the PV cell, which establishes the relationship between voltage, current, and power. Simulated maximum power point tracking (MPPT) has been performed by applying the golden section search algorithm (GSSA) on (16) according to [23]. The rated capacity of the power converter has been estimated using (17), while the effects of the variable efficiency have been represented through (18) and (19) [24]. A typical quadratic cost curve for each PV generator is shown in (20). These cost curves can be rewritten according to (21) and (22), which facilitates the CA implementation. In constraint (23), variable P P V ( p , t ) m a x not only considers the power production obtained from the operation of MPPT on (16) using GSSA, but also takes into account the efficiency curve of the power converter in (19). P P V ( p , t ) m a x represents the available power from each PV generator, while P P V ( p , t ) o p t is the power obtained as a result of CA implementation, which considers the impact of cost curve (20) or (21).
T P V ( p , t ) = T A ( t ) + G ( t ) [ N O C T ( p ) 20   ° C 800   W / m 2 ] [ 1 η P V ( p ) ( 1 α P V ( p ) 25   ° C ) k P V ] 1 + [ N O C T ( p ) 20   ° C ] [ G ( t ) 800   W / m 2 ] [ α P V ( p ) η P V ( p ) k P V ( p ) ] ;
U P V ( p , t ) e = m P V k B T P V ( p , t ) e P V ;          
U P V ( p , t ) O C = U P V , S T C ( p ) O C N P V ( p ) C S + α P V ( p ) [ T P V ( p , t ) 25   ° C ] + U P V ( p , t ) e l o g [ G ( t ) 1000   W / m 2 ] ;
u P V ( p , t ) O C = U P V ( p , t ) O C U P V ( p , t ) e ;
F F P V ( p , t ) o = u P V ( p , t ) O C l o g ( u P V ( p , t ) O C + 0.72 ) u P V ( p , t ) O C + 1 ;    
I P V ( p , t ) S C = I P V , S T C ( p ) S C N P V ( p ) C P ( G ( t ) 1000   W / m 2 ) ;
F F P V ( p ) = U P V ( p ) M A X I P V ( p ) M A X U P V , S T C ( p ) O C I P V , S T C ( p ) S C ;            
R P V ( p , t ) S = ( 1 F F P V ( p ) F F P V ( p , t ) o ) ( U P V ( p , t ) O C I P V ( p , t ) S C ) ;      
I P V ( p , t ) = I P V ( p , t ) S C [ 1 e x p ( U P V ( p , t ) U P V ( p , t ) O C + I P V ( p , t ) R P V ( p , t ) S U P V ( p , t ) e ) ] ;    
P P V ( p , t ) = I P V ( p , t ) [ U P V ( p , t ) O C I P V ( p , t ) R P V ( p , t ) S + U P V ( p , t ) e l o g ( 1 I P V ( p , t ) I P V ( p , t ) S C ) ] ;
P I ( p ) = [ I P V ( p ) M A X U P V ( p ) M A X ] [ N P V ( p ) P S N P V ( p ) P P ] ;    
p I ( p , t ) = P P V ( p , t ) ( N P V ( p ) C S N P V ( p ) C P ) ( N P V ( p ) P S N P V ( p ) P P ) P I ( p ) ;
η I ( p , t ) = p I ( p , t ) p I ( p , t ) + α I ( p ) + β I ( p ) ( p I ( p , t ) ) + θ I ( p ) ( p I ( p , t ) ) 2 .    
F P V ( p , t ) = δ P V ( p ) 1 ( P P V ( p , t ) ) 2 + δ P V ( p ) 2 ( P P V ( p , t ) ) + δ P V ( p ) 3 ;      
F P V ( p , t ) = ( P P V ( p , t ) α P V ( p ) ) 2 2 ( β P V ( p ) ) + γ P V ( p ) ;      
α P V ( p ) = δ P V ( p ) 2 2 ( δ P V ( p ) 1 ) ;   β P V ( p ) = 1 2 ( δ P V ( p ) 1 ) ;   γ P V ( p ) = δ P V ( p ) 3 ( δ P V ( p ) 2 ) 2 4 ( δ P V ( p ) 1 ) ;
0 P P V ( p , t ) o p t P P V ( p , t ) m a x .        

2.3. Model of Distributed Wind Generator

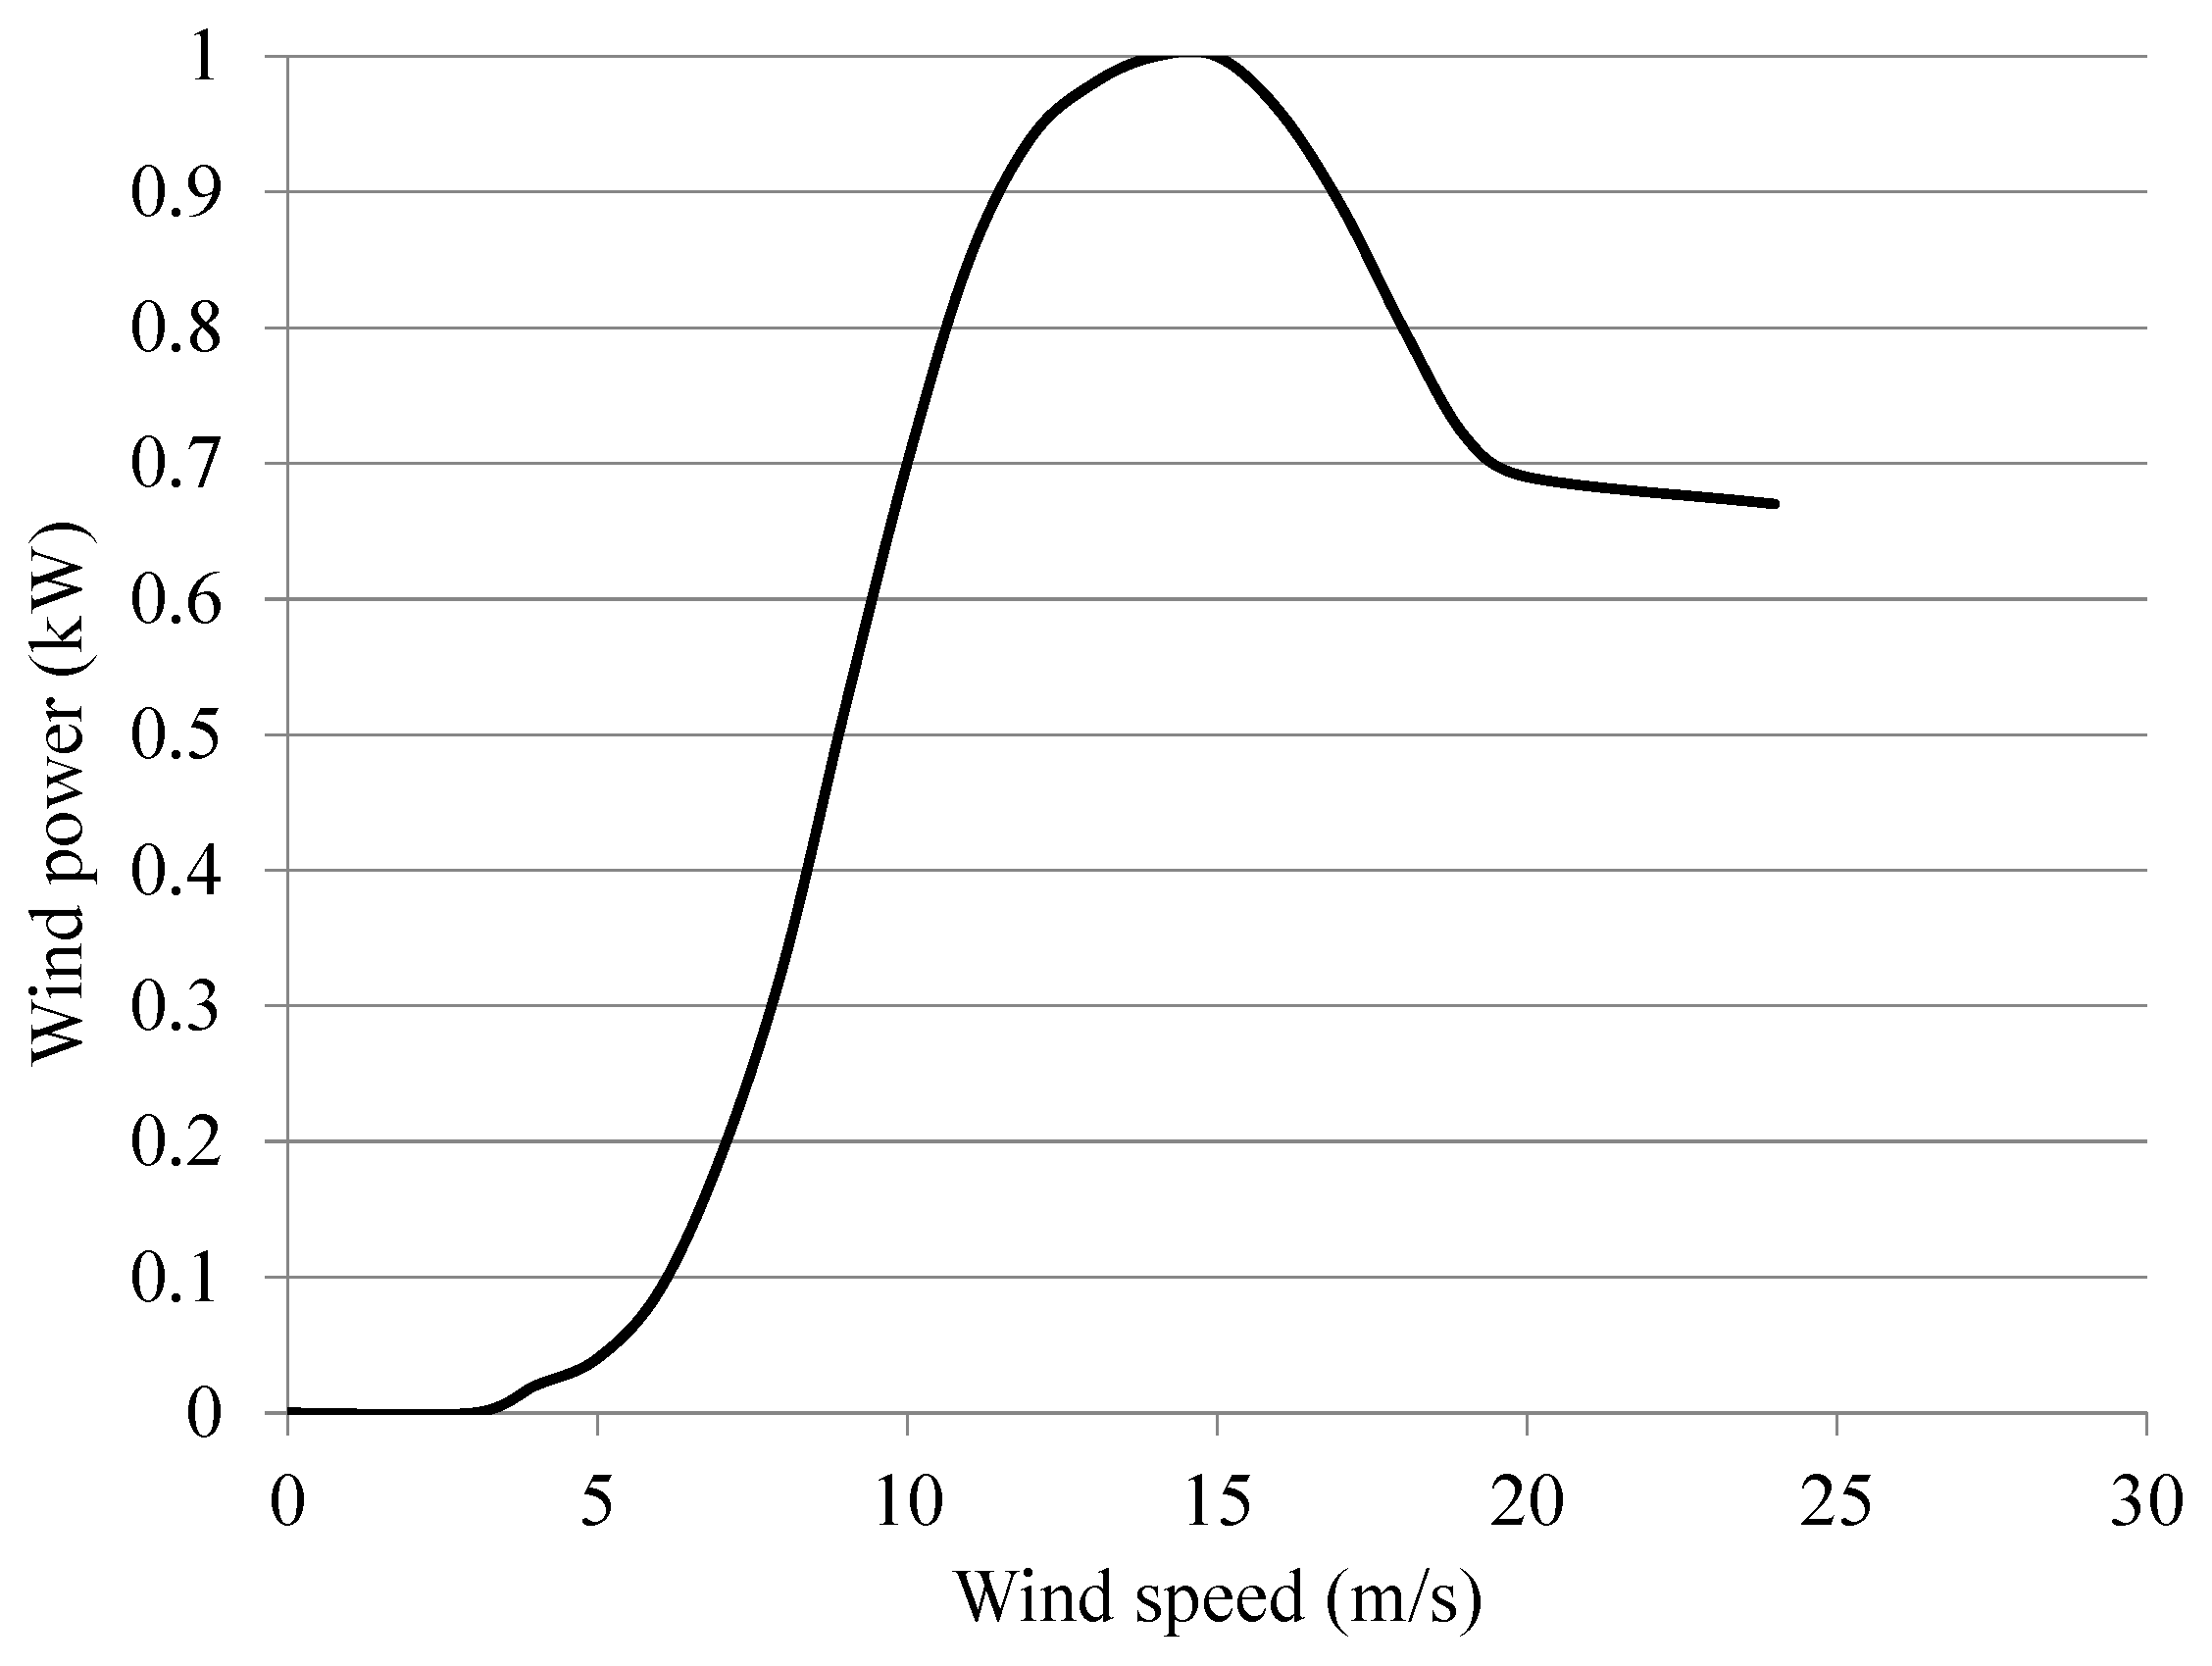
Power production from a typical wind generator can be estimated by means of a power curve similar to the one shown in Figure 3 [20]. Equations (24)–(26) present the cost curve for each wind generator. In constraint (27), P W ( w , t ) m a x is directly obtained from the evaluation of Figure 3, and P W ( w , t ) o p t is obtained from the implementation of CA.
F W ( w , t ) = δ W ( w ) 1 ( P W ( w , t ) ) 2 + δ W ( w ) 2 ( P W ( w , t ) ) + δ W ( w ) 3 ;
F W ( w , t ) = ( P W ( w , t ) α W ( w ) ) 2 2 ( β W ( w ) ) + γ W ( w ) ;      
α W ( w ) = δ W ( w ) 2 2 ( δ W ( w ) 1 ) ;   β W ( w ) = 1 2 ( δ W ( w ) 1 ) ;   γ W ( w ) = δ W ( w ) 3 ( δ W ( w ) 2 ) 2 4 ( δ W ( w ) 1 ) ;
0 P W ( w , t ) o p t P W ( w , t ) m a x .

2.4. Model of Distributed BESS

Due to its promising characteristics, a vanadium redox battery (VRB) was selected among BESS technologies. The mathematical model previously proposed in [25,26,27] was used in its modelling. The simulation approach consists of scaling a single battery of 5 kW/20 kWh by connecting elements in serial ( N B ( b ) S ) and parallel ( N B ( b ) P ). Important variables, such as voltage, power, efficiency, and state of charge (SOC) during charging ( P B ( b , t ) > 0 ) and discharging ( P B ( b , t ) 0 ) conditions have been estimated. Definitions of battery voltage, efficiency, and SOC are shown in (28), (29), and (30), respectively, while some of their operating constraints are presented in (31) and (32). Calculation of battery voltage during charging and discharging is explained in (33) and (34), respectively. The general values for voltage and energy efficiency for charging processes are computed according to (35)–(37); for discharging processes, these variables can be calculated by using (38)–(40). Constraint (41) indicates that battery power has to be limited to the rating power of the cell stack. The operating cost of BESS is described in (42)–(44), which represents the cost of cycling energy through the storage system. Constraint (45) is related to the power dispatch for charging and discharging processes ( P B ( b , t ) o p t ); therefore, the power to be charged or discharged to or from BESS has to be limited to the charging and discharging power available ( P B ( b , t ) ) at a determined time instant t . Values of the parameters involved on VRB modelling are reported in Table 1.
U B ( b , t ) = { U B ( b , t ) c h ;   P B ( b , t ) > 0 U B ( b , t ) d i s ;   P B ( b , t ) 0 ;
η B ( b , t ) = { η B ( b , t ) c h ;   P B ( b , t ) > 0 η B ( b , t ) d i s ;   P B ( b , t ) < 0 ;
S O C B ( b , t ) = S O C B ( b , t 1 ) + t Δ t t P B ( b , τ ) η B ( b , τ ) E B ( b ) m a x d τ ;        
S O C B ( b ) m i n S O C B ( b , t ) S O C B ( b ) m a x ;                      
U B ( b ) m i n U B ( b , t ) U B ( b ) m a x ;      
U B ( b , t ) c h = ( δ B 1 S O C B ( b , t ) + δ B 2 ) P B ( b , t ) + δ B 3 S O C B ( b , t ) + δ B 4 ;
U B ( b , t ) d i s = δ B 5 | P B ( b , t ) | + δ B 6 S O C B ( b , t ) + δ B 7 ;    
η B , V ( b , t ) c h = δ B 8 T B ( S O C B ( b , t ) δ B 9 ) + δ B 10 ( δ B 11 S O C B ( b , t ) + δ B 12 ) P B ( b , t ) + δ B 13 S O C B ( b , t ) + δ B 14 ;
η B , E ( b , t ) c h = ( δ B 15 S O C B ( b , t ) + δ B 16 ) P B ( b , t ) + δ B 17 S O C B ( b , t ) δ B 18 P B ( b , t ) ;
η B ( b , t ) c h = η B , V ( b , t ) c h η B , E ( b , t ) c h ;    
η B , V ( b , t ) d i s = δ B 19 | P B ( b , t ) | + δ B 20 S O C B ( b , t ) + δ B 21 δ B 22 T B ( S O C B ( b , t ) δ B 23 ) + δ B 24 ;
η B , E ( b , t ) d i s = | P B ( b , t ) | δ B 25 | P B ( b , t ) | + δ B 26 S O C B ( b , t ) ( S O C B ( b , t ) 1 ) + δ B 27 ;
η B ( b , t ) d i s = η B , V ( b , t ) d i s η B , E ( b , t ) d i s ;            
P B ( b ) m a x P B ( b , t ) P B ( b ) m a x ;    
F B ( b , t ) = δ B ( b ) 28 ( P B ( b , t ) ) 2 + δ B ( b ) 29 ( P B ( b , t ) ) + δ B ( b ) 30 ;      
F B ( b , t ) = ( P B ( b , t ) α B ( b ) ) 2 2 ( β B ( b ) ) + γ B ( b ) ;    
α B ( b ) = δ B ( b ) 29 2 ( δ B ( b ) 28 ) ;   β B ( b ) = 1 2 ( δ B ( b ) 28 ) ;   γ B ( p ) = δ B ( b ) 30 ( δ B ( b ) 2 ) 29 4 ( δ B ( b ) 28 ) ;    
P B ( b , t ) P B ( b , t ) o p t P B ( b , t ) .        

2.5. Model of Distributed CG

CGs are capable of providing controllable power within a determined interval. Power generation is adjusted to minimise the operating cost, which is described according to (46) and rewritten in (47) and (48). Power generation should be limited to its minimum ( P C ( g ) m i n ) and maximum ( P C ( g ) m a x ) operating values according to (49).
F C ( g , t ) = δ C ( g ) 1 ( P C ( g , t ) ) 2 + δ C ( g ) 2 ( P C ( g , t ) ) + δ C ( g ) 3 ;
F C ( g , t ) = ( P C ( g , t ) α C ( g ) ) 2 2 ( β C ( g ) ) + γ C ( g ) ;
α C ( g ) = δ C ( g ) 2 2 ( δ C ( g ) 1 ) ;   β C ( g ) = 1 2 ( δ C ( g ) 1 ) ;   γ C ( g ) = δ C ( g ) 3 ( δ C ( g ) 2 ) 2 4 ( δ C ( g ) 1 ) ;
P C ( g ) m i n P C ( g , t ) o p t P C ( g ) m a x .

2.6. Architecture and CI

As stated previously, the management strategy proposed in this paper for vulnerability mitigation on DSs is based on EDP solved by CA. Figure 4 describes the general structure of CI, where all PV and wind generators are connected to the same infrastructure. Similarly, BESS and CGs interact within their corresponding communications network.
The energy management system (EMS) continuously interacts with the DS through the smart grid so that distributed HES can start operation under any contingency. During normal operating conditions, HES is supposed to be fully integrated on the electricity market to maximise its profits by managing renewable generators, BESS, and CGs in the appropriate manner.
Once the distributed autonomous operation has been activated to face any threat, the EMS distributes PV and wind generation with the highest priority to take advantage of renewable sources. Distributed BESS provides storage capabilities for excess renewable resources, which can be used later when no wind or solar energy is available. Finally, fossil-fuel-based generation is used to supply the power needs not yet satisfied.
CA implementation proposed by Yang et al. [28] has been used in this paper to carry out the solution of EDP for distributed PV and wind generation, BESS, and CG. CA is traditionally formulated to solve EDP in systems vertically integrated, considering the cost curves previously described in (20)–(22) for the PV generators, (24)–(26) for wind generators, (42)–(44) for BESS, and (46)–(48) for CG.
Instead of considering the operating cost for each technology, the energy selling price specified by the generation/storage device owner has been adopted. In the case of PV generation, δ P V ( p ) 1 0 , δ P V ( p ) 2 > 0 , and δ P V ( p ) 3 = 0 have been assumed, where δ P V ( p ) 2 is the energy selling price of the corresponding PV generator. Similarly, δ W ( w ) 1 0 , δ W ( w ) 2 > 0 , and δ W ( w ) 3 = 0 have been assumed for each wind generator. δ B ( b ) 28 0 , δ B ( b ) 29 > 0 , and δ B ( b ) 30 = 0 have been assumed for each BESS, while δ C ( g ) 1 0 , δ C ( g ) 2 > 0 , and δ C ( g ) 3 = 0 have been assumed for each CG. This approach incorporates the economic benefit of each generator and storage device.
As mentioned, PV and wind generators are integrated into a single CI managed by means of CA. For the sake of simplicity, CA implementation only considering PV generation will be described. For the other generation/storage technologies, the formulation is similar. Minimum ( λ P V ( p ) m i n ) and maximum ( λ P V ( p ) m a x ) incremental cost values are shown in (50) and (51), respectively. Evolution of incremental cost ( λ P V ( i ) C A ) through each CA iteration ( i ), as well as the power generation ( P P V ( t , i ) C A ) and mismatch ( Δ P P V ( t , i ) C A ), are described in (52)–(54). The solution of the power dispatch problem is obtained by applying (55)–(57), iteratively.
λ P V ( p ) m i n = α P V ( p ) β P V ( p ) ;        
λ P V ( p ) m a x = ( P P V ( p , t ) m a x α P V ( p ) ) β P V ( p ) ;
λ P V ( i ) C A = [ λ P V ( 1 , i ) C A λ P V ( p , i ) C A λ P V ( P , i ) C A ] ;
P P V ( t , i ) C A = [ P P V ( 1 , t , i ) C A P P V ( p , t , i ) C A P P V ( P , t , i ) C A ] ;
Δ P P V ( t , i ) C A = [ Δ P P V ( 1 , t , i ) C A Δ P P V ( p , t , i ) C A Δ P P V ( P , t , i ) C A ] ;    
λ P V ( i + 1 ) C A = [ C I P P V ] λ P V ( i ) C A + ε Δ P P V ( t , i ) C A ;    
P P V ( t , i + 1 ) C A = f P V ( λ P V ( i + 1 ) C A ) ;
Δ P P V ( t , i + 1 ) C A = [ C I Q P V ] Δ P P V ( t , i ) C A ( P P V ( t , i + 1 ) C A P P V ( t , i ) C A ) .
Equations (50)–(57) can also be used to estimate the power dispatch of systems based on wind generation, BESS, and CG. Assuming P C ( g ) m i n 0 , CG owners can offer power production at a determined selling price ( δ C ( g ) 2 ) limited to its rated capacity ( P C ( g ) m a x ). Under this context, the proprietary of each device of the energy system (PV and wind generator, BESS, and CG) only needs to specify its energy price and power available.

3. MG Management Strategy

As this work aims to create a management strategy to reduce DS vulnerability, the primary effort has been applied to analysis of the system under emergency. Variables involved in the system modelling and management are shown in Figure 5. EMS is continuously monitoring state variables of the DS, such as voltage ( U S ( n , t ) ) and power ( P S ( n , t ) and Q S ( n , t ) ) at medium voltage (MV). The operation of EMS is performed at a low voltage (LV) level using local resources. The management technique is based on a load following strategy [15], wherein renewable generation and BESS are committed to reducing fuel-based power sources and increasing the long-term autonomy of energy systems.
Specifically, two operating modes have been considered. In the first, MG is operated to prevent voltage problems. In the second, MG operates independently from the utility company, thus avoiding total collapse. These modes are carefully described in the next subsections.

3.1. Microgrid Operation to Avoid Voltage Collapse

Depending on the technical design of the DS under study, the rate of demand growth, lack of investment in adequacy and overhauling of the DS, and other factors, problems related to voltage stability could occur during extreme operating conditions. In this regard, Venkatesh et al. [29] proposed the evaluation of MLI as a quantitative measure of how far the system is from voltage collapse. MLI depends on active and reactive power flows at the MV feeder, as well as the system voltage. MLI is evaluated according to (58):
M L I ( n , t ) = U S ( n 1 , t ) 2 [ ( R S ( n ) P S ( n , t ) + X S ( n ) Q S ( n , t ) ) + ( R S ( n ) 2 + X S ( n ) 2 ) ( P S ( n , t ) 2 + Q S ( n , t ) 2 ) ] 2 ( X S ( n ) P S ( n , t ) R S ( n ) Q S ( n , t ) ) 2 .
Voltage problems occur when the condition M L I ( n , t ) < 1 is fulfilled. This condition is then resolved by reducing the power flow on Δ P M L I ( n , t ) , which is calculated using (59):
Δ P M L I ( n , t ) = [ M L I ( n , t ) 1 ] [ P S ( n , t ) + j Q S ( n , t ) ] .

3.2. Microgrid Operation under Substation Contingency

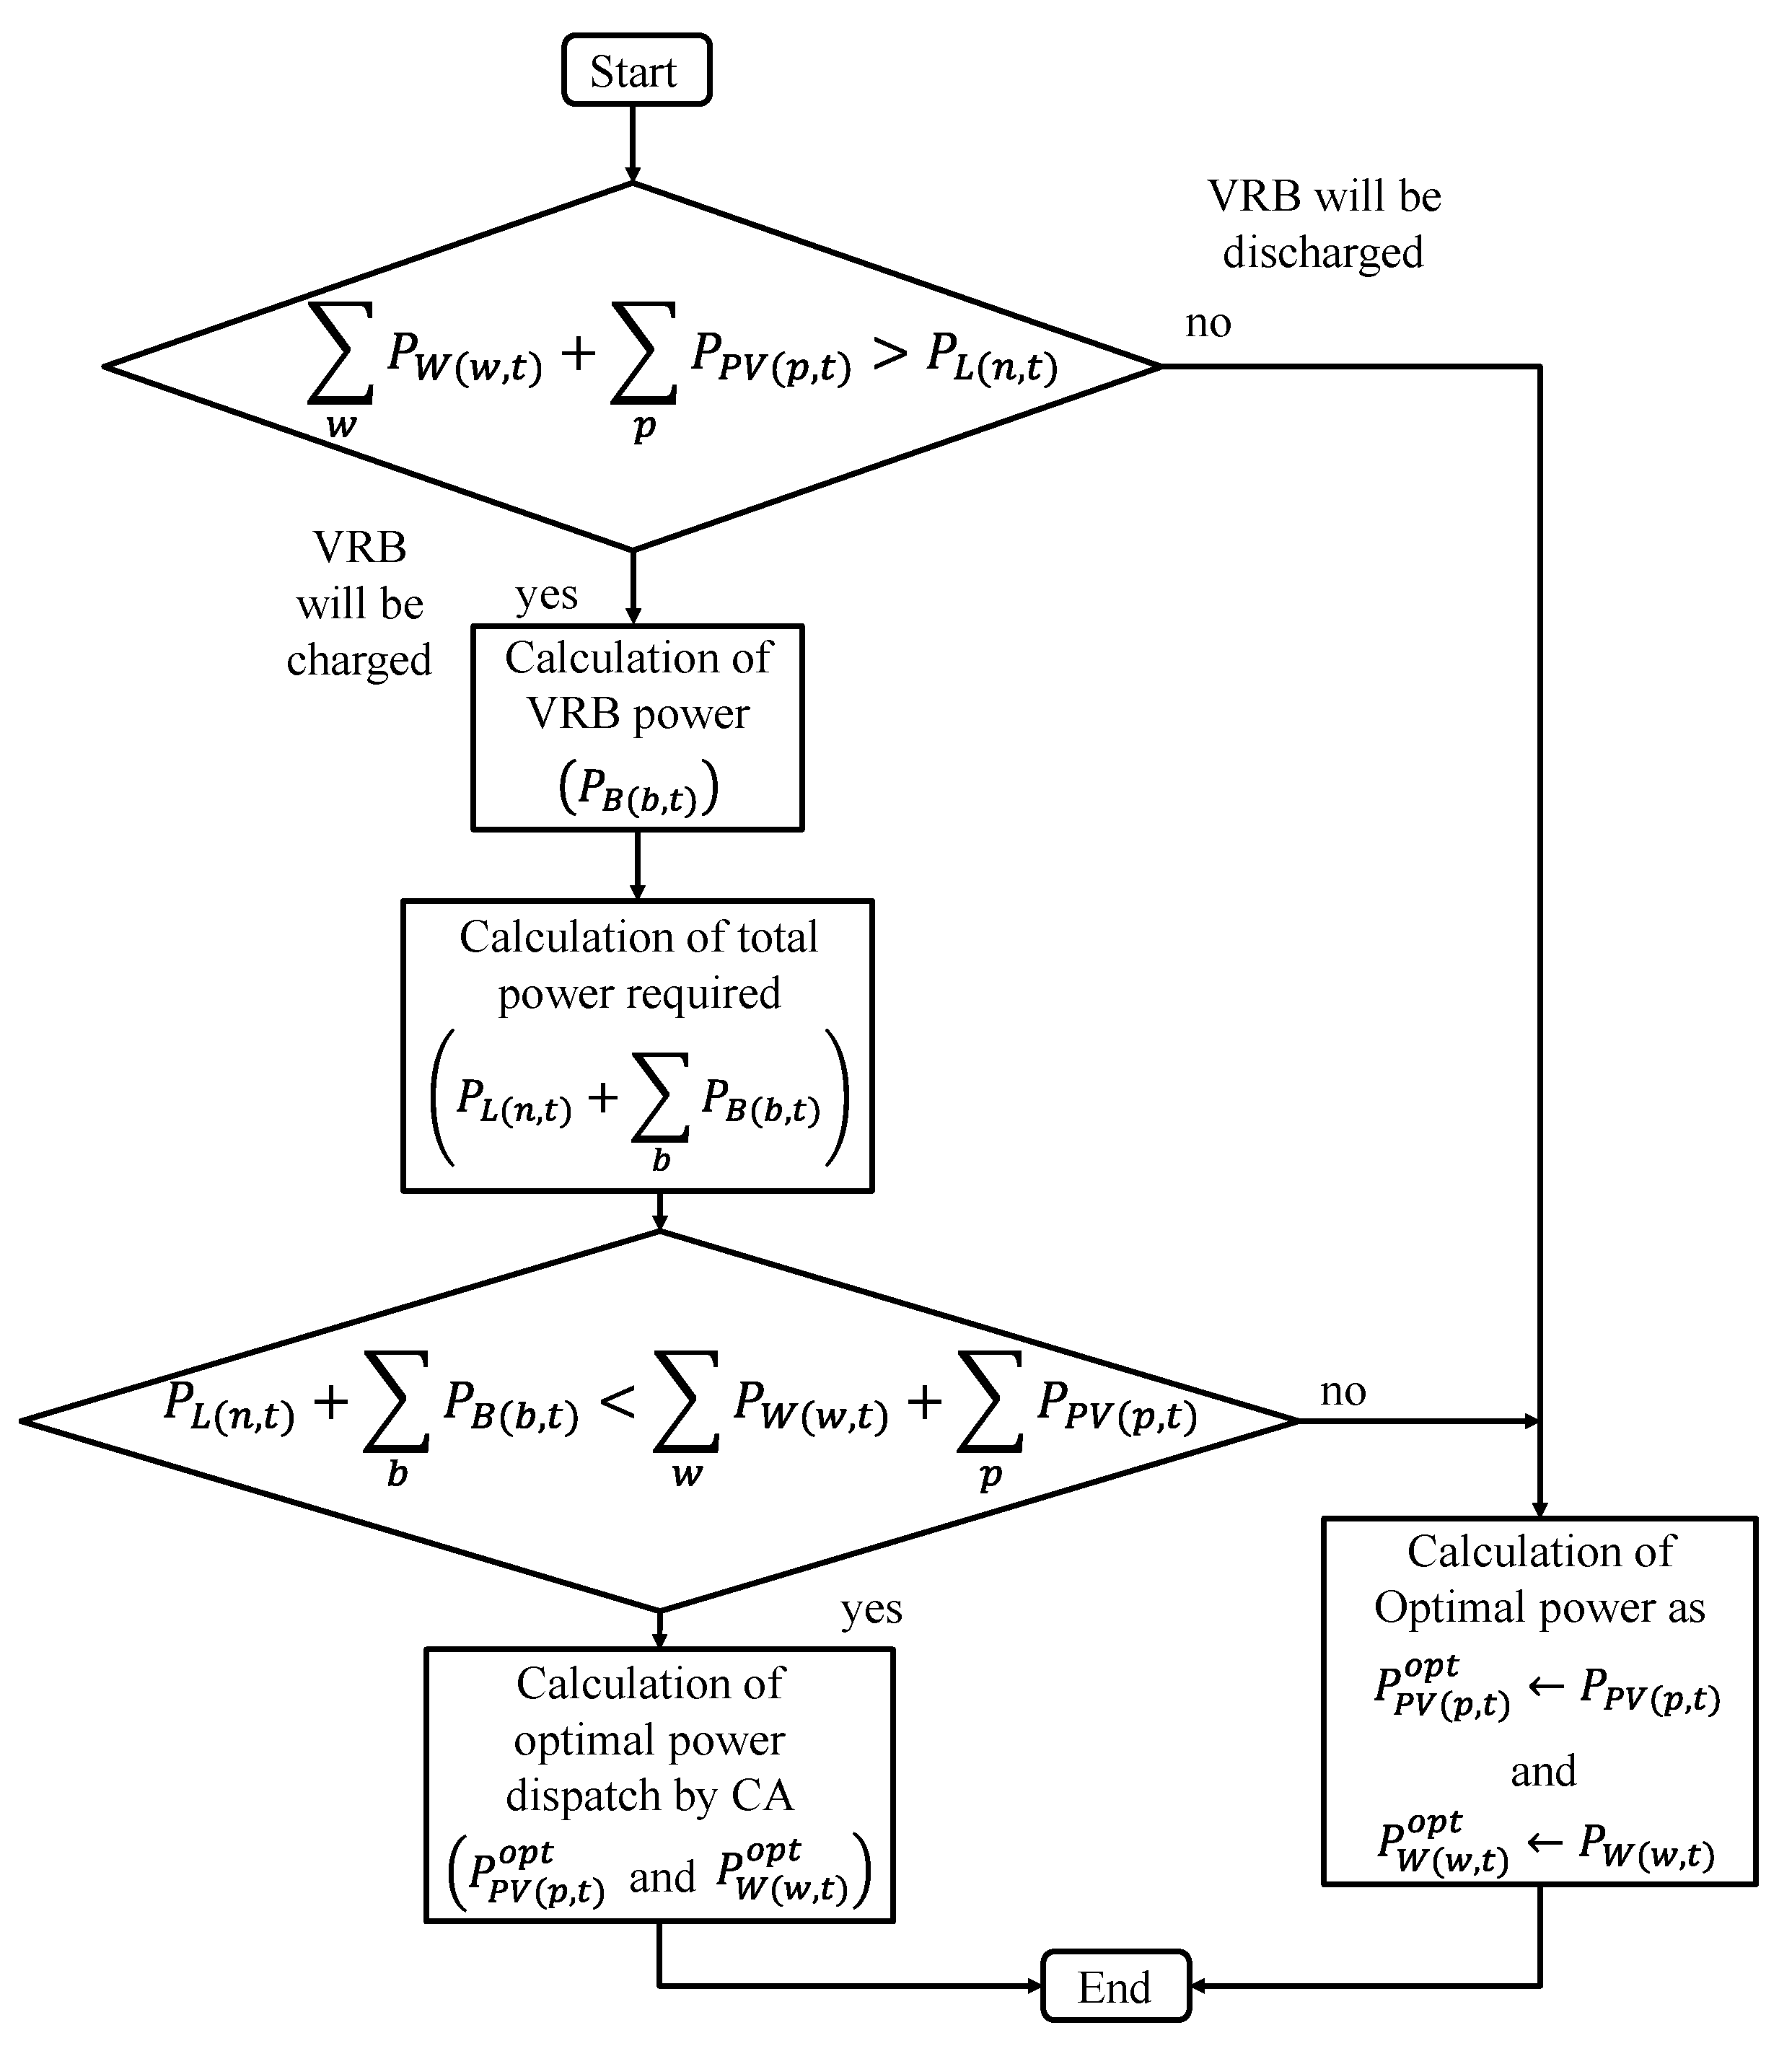
Distributed PV and wind generators are tightly related to distributed-BESS operation. As previously explained, MG management is based on a load following strategy, wherein the surplus of renewable generation is used for charging VRB. However, the amount of power being purchased from renewable generation must be known to operate the entire MG cost-effectively. In other words, the amount of power not consumed by the MG energy demand and not stored on VRB can be understood as a cost increment; however, this condition can be prevented by carefully predetermining the power to be supplied by renewable sources. Figure 6 presents the algorithm applied to dispatch the available PV and wind power. If the available renewable power is higher than the MG load, the power surplus should be used for charging VRB. Under these conditions, the VRB maximum charging power is calculated by using (28)–(33), (35)–(37), and (41). This procedure results in generating the power required by the entire BESS ( P B ), which is later added to the MG load ( P L ) to estimate the power to be supplied by PV and wind systems. If the available renewable power is higher than the power required for charging VRB and for satisfying the MG demand, CA is applied according to Section 2.6 to calculate the power to be purchased from each PV ( P P V ( p , t ) o p t ) and wind system ( P W ( w , t ) o p t ), taking into account their respective energy prices ( δ P V ( p ) 2 and δ W ( w ) 2 ). On the contrary, if renewable resources are not enough to supply the MG demand and VRB charging power, they are entirely committed without any optimization process. In other words, P P V ( p , t ) o p t P P V ( p , t ) and P W ( w , t ) o p t P W ( w , t ) are assumed.
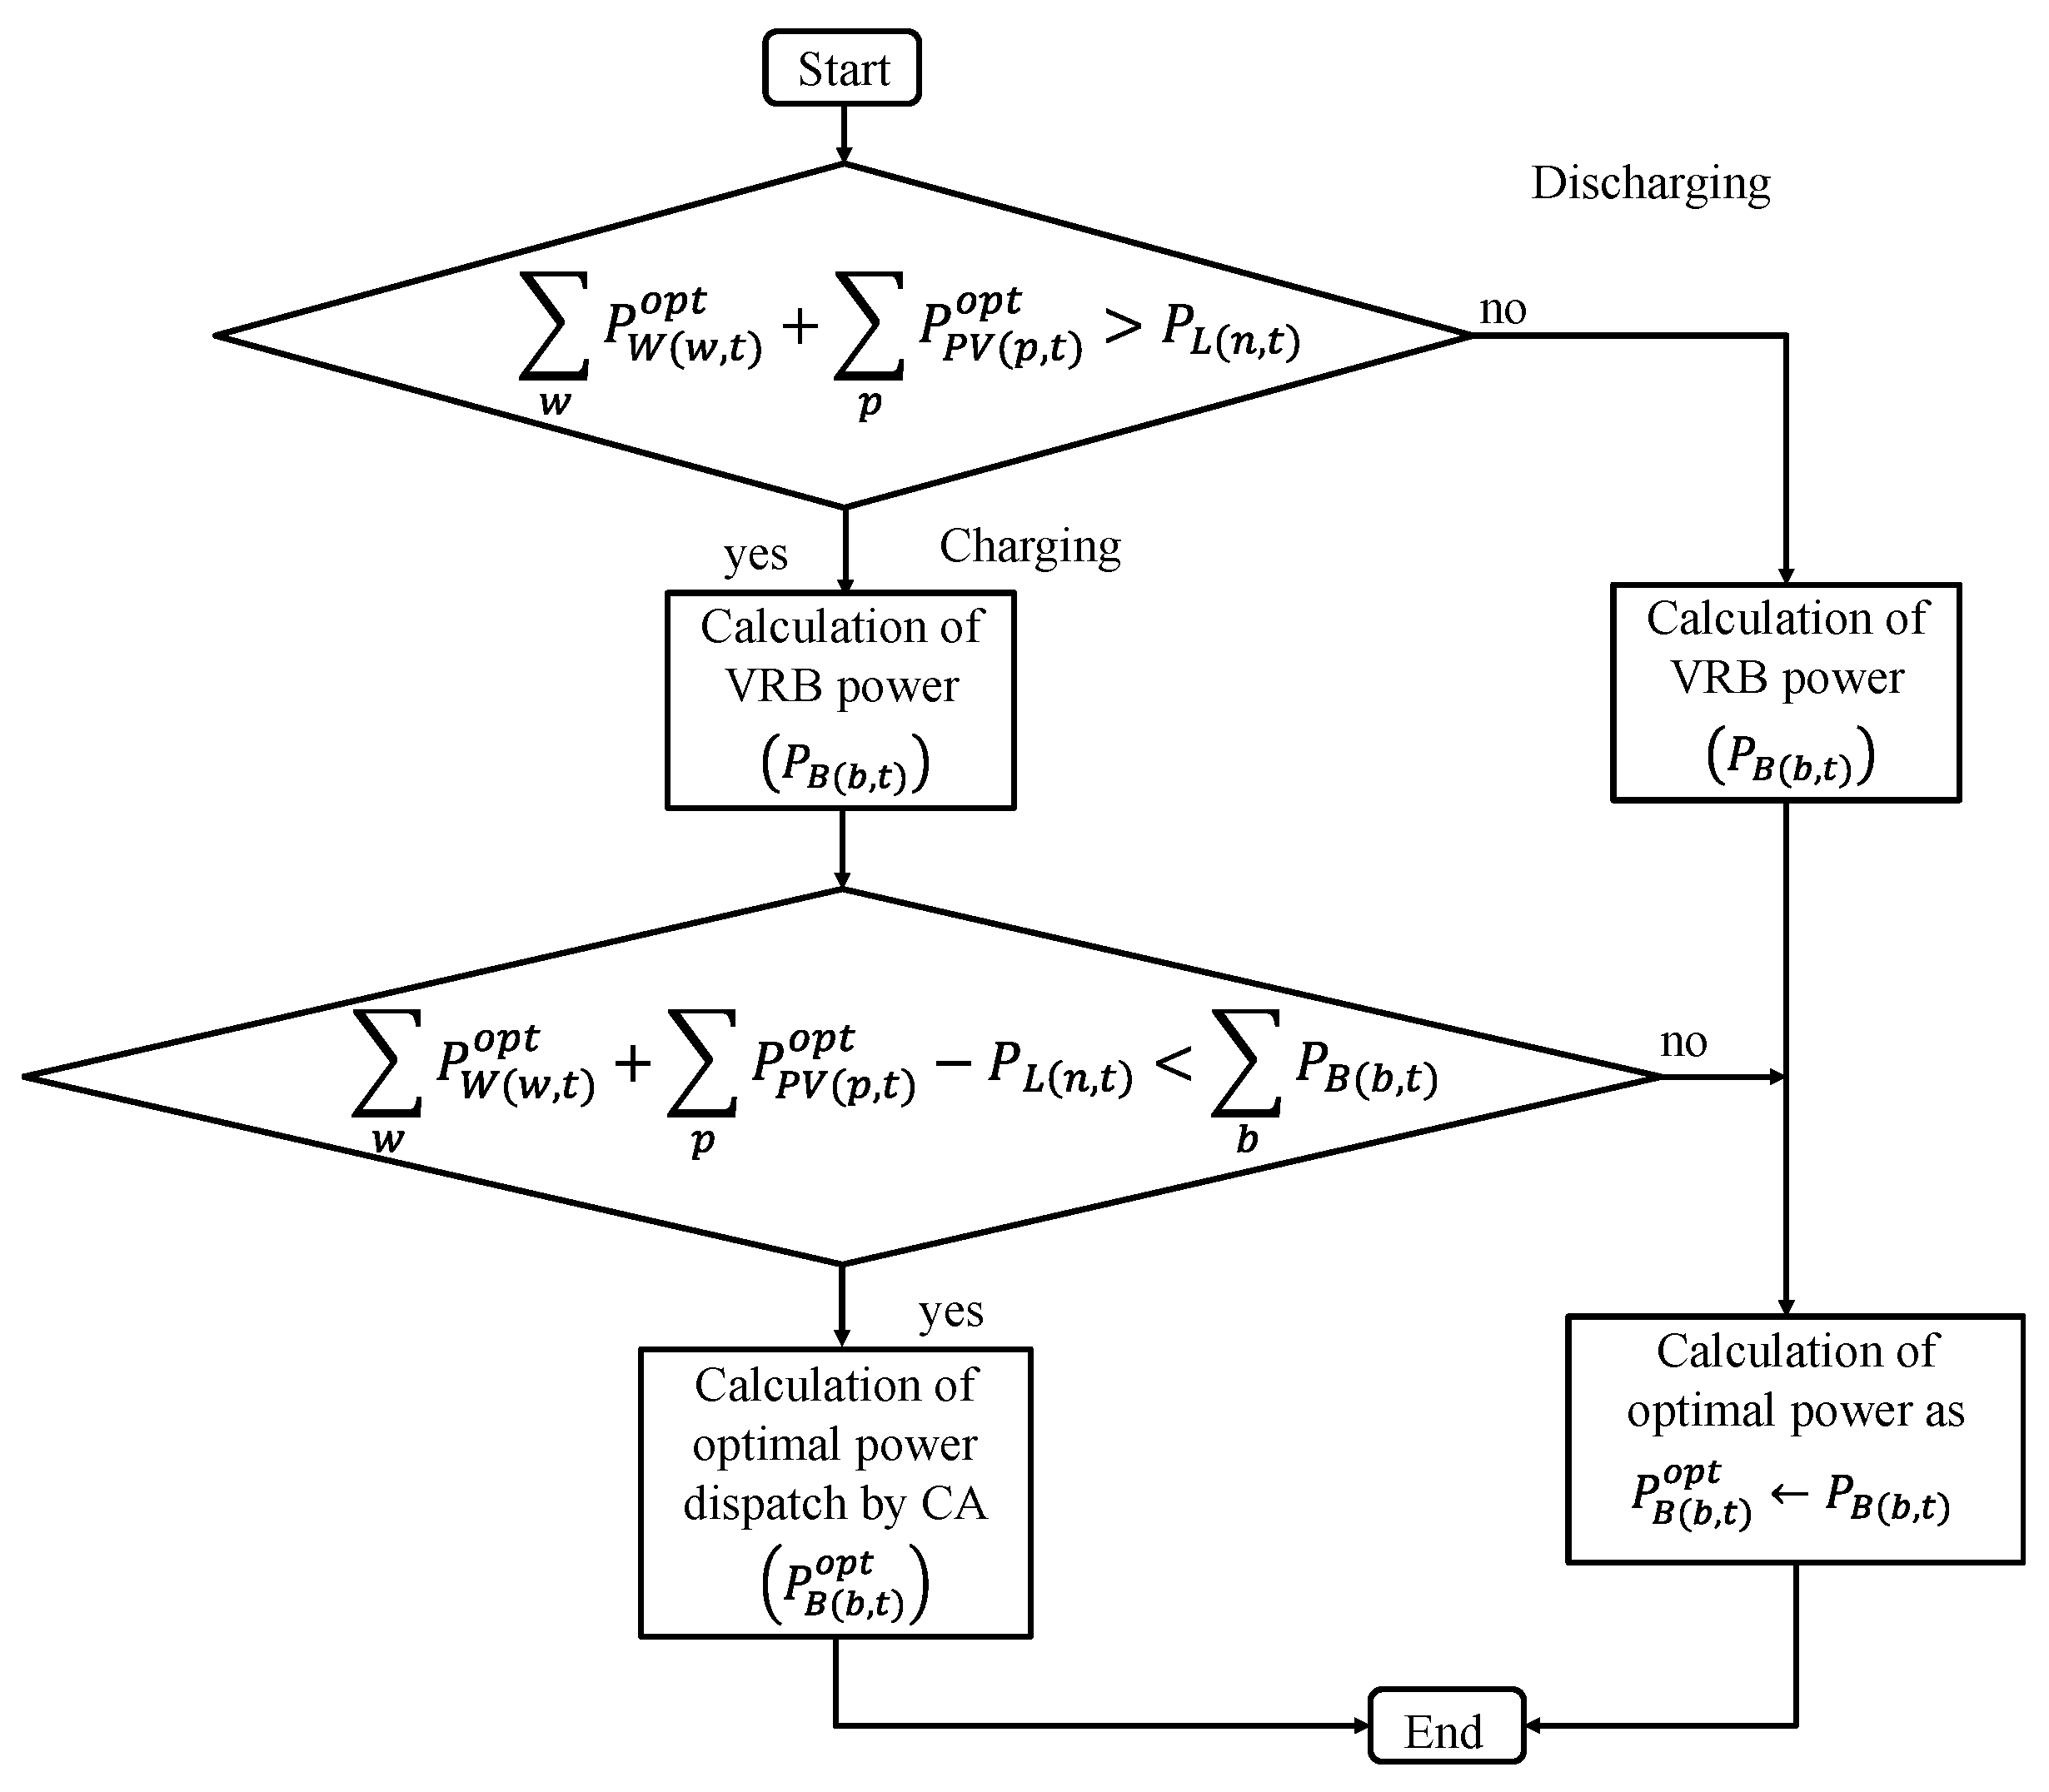
Once the contribution of renewable sources ( P P V ( p , t ) o p t and P W ( w , t ) o p t ) has been determined, the results are used to analyse the behaviour of distributed VRB. Management of BESS is carried out using the flowchart shown in Figure 7. Depending on the amount of renewable energy available, BESS is charged or discharged.
If dispatched renewable power is higher than the load demand, distributed VRB is charged. Under these conditions, the VRB maximum charging power is calculated by using (28)–(33), (35)–(37), and (41). If excess energy results in lower than the maximum energy to be stored by BESS, EDP by CA is applied to determine how energy charging is distributed. The energy distribution among BESS depends upon their respective prices. Conversely, if the renewable power dispatched is not enough to supply the energy demand, BESS is fully discharged. The VRB maximum discharging power is calculated by using (28)–(32), (34), and (38)–(41).
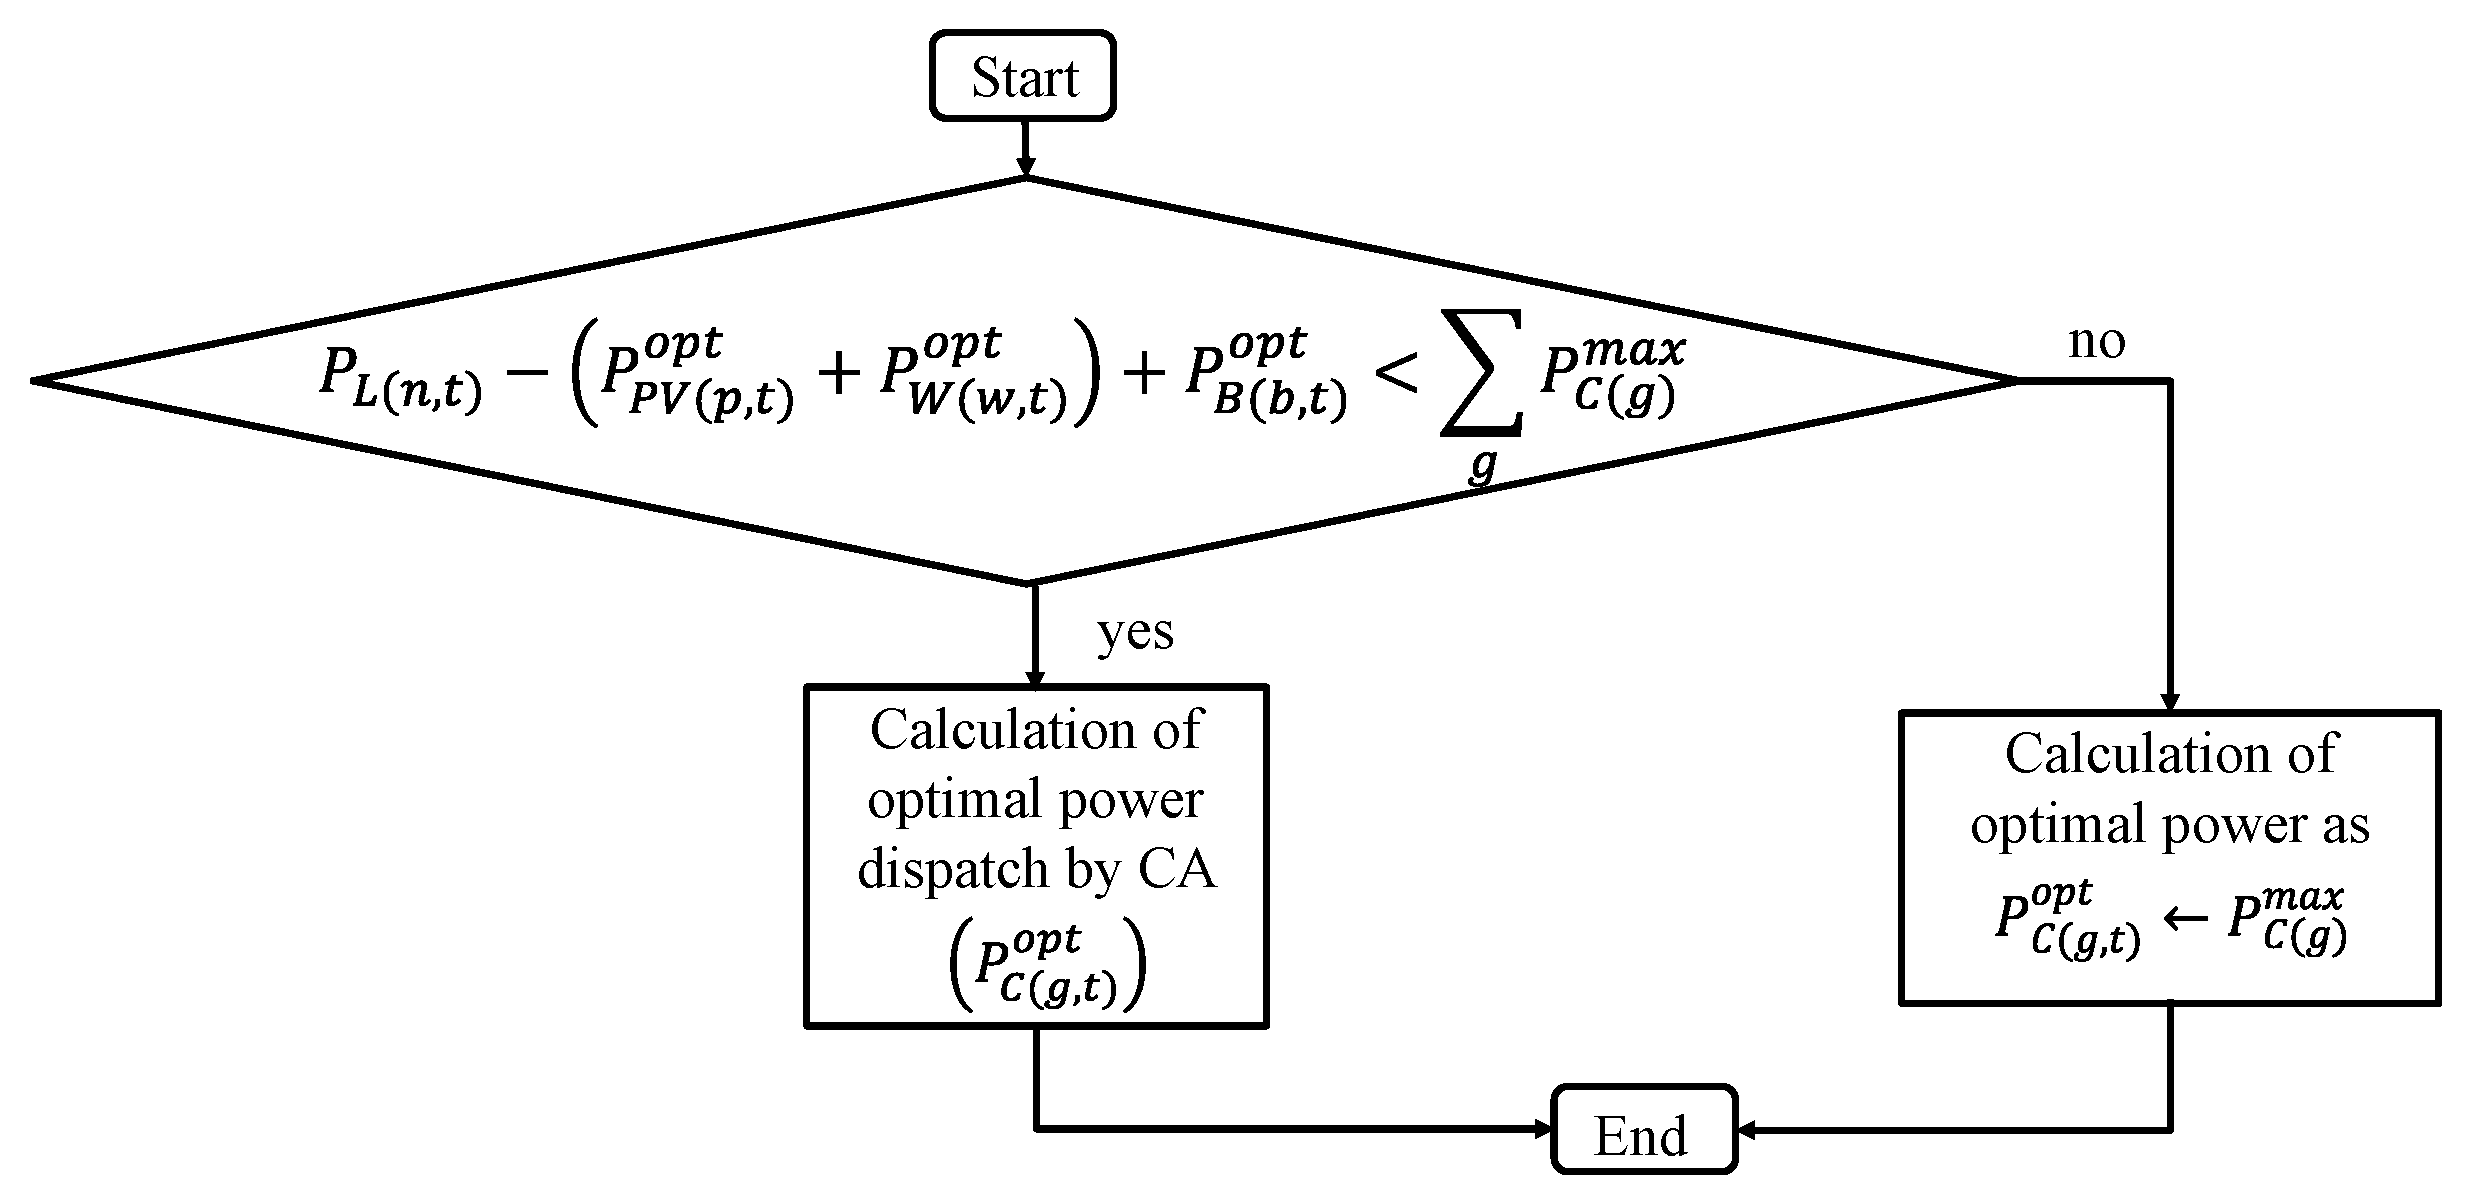
CG provides the remaining power to supply the MG demand. The flowchart presented in Figure 8 describes the management algorithm. If distributed CG is capable of supplying the entire demand, power dispatch is performed by using CA. In the contrary case, all units are dispatched at their maximum or rated capacity, and the load demand is cut to some degree.

4. Case Studies

The proposed approach to reduce the vulnerability of a smart DS is illustrated in this section by analysing a hypothetical energy system to be located in Puerto Rico (latitude 18.022° and longitude −66.0168°). Time series of wind speed, solar radiation ( G ( t ) ), and ambient temperature ( T A ( t ) ) were found in [18]. A load demand time series was created according to the methodology described in Section 2 using the parameters specified in Table 2 and a time step of 1 h ( Δ t = 1 h). Data of distributed PV and wind generators are presented in Table 3 and Table 4, respectively. The number of PV cells on each panel ( N P V ( p ) C P ) and the ideality factor ( m P V ) were assumed to be 1. BESS and CG data are shown in Table 5 and Table 6, respectively. The proposed management strategy was implemented in MATLAB© on a personal computer with an i7-3630QM CPU at 2.4 GHz with 8 GB of memory and a 64-bit operating system.
The nominal voltage of the DS was assumed to be 4.16 kV. The peak load was assumed to be 700 kVA, with a power factor equal to 95%. The distribution feeder was assumed to be built using a conductor 26.24 kcmil (7 strands) type AAC, operating in a system of 60 Hz. CA was considered as having a tolerance value of 0.001 ( ε   = 0.001) and 150 iterations ( I = 150). CI for the management of renewable power sources, BESS, and CG are shown in Figure 9, Figure 10 and Figure 11, respectively. These structures were used to build the weighting matrices for each layer of Figure 4 ( C I P P V and C I Q P V for PV generators).
The following subsections describe in detail how the proposed management strategy can be used to avoid voltage collapse on a typical distribution feeder and how an MG can be operated when the substation is unable to provide service.

4.1. Case Study 1: MG Operation to Avoid Voltage Collapse

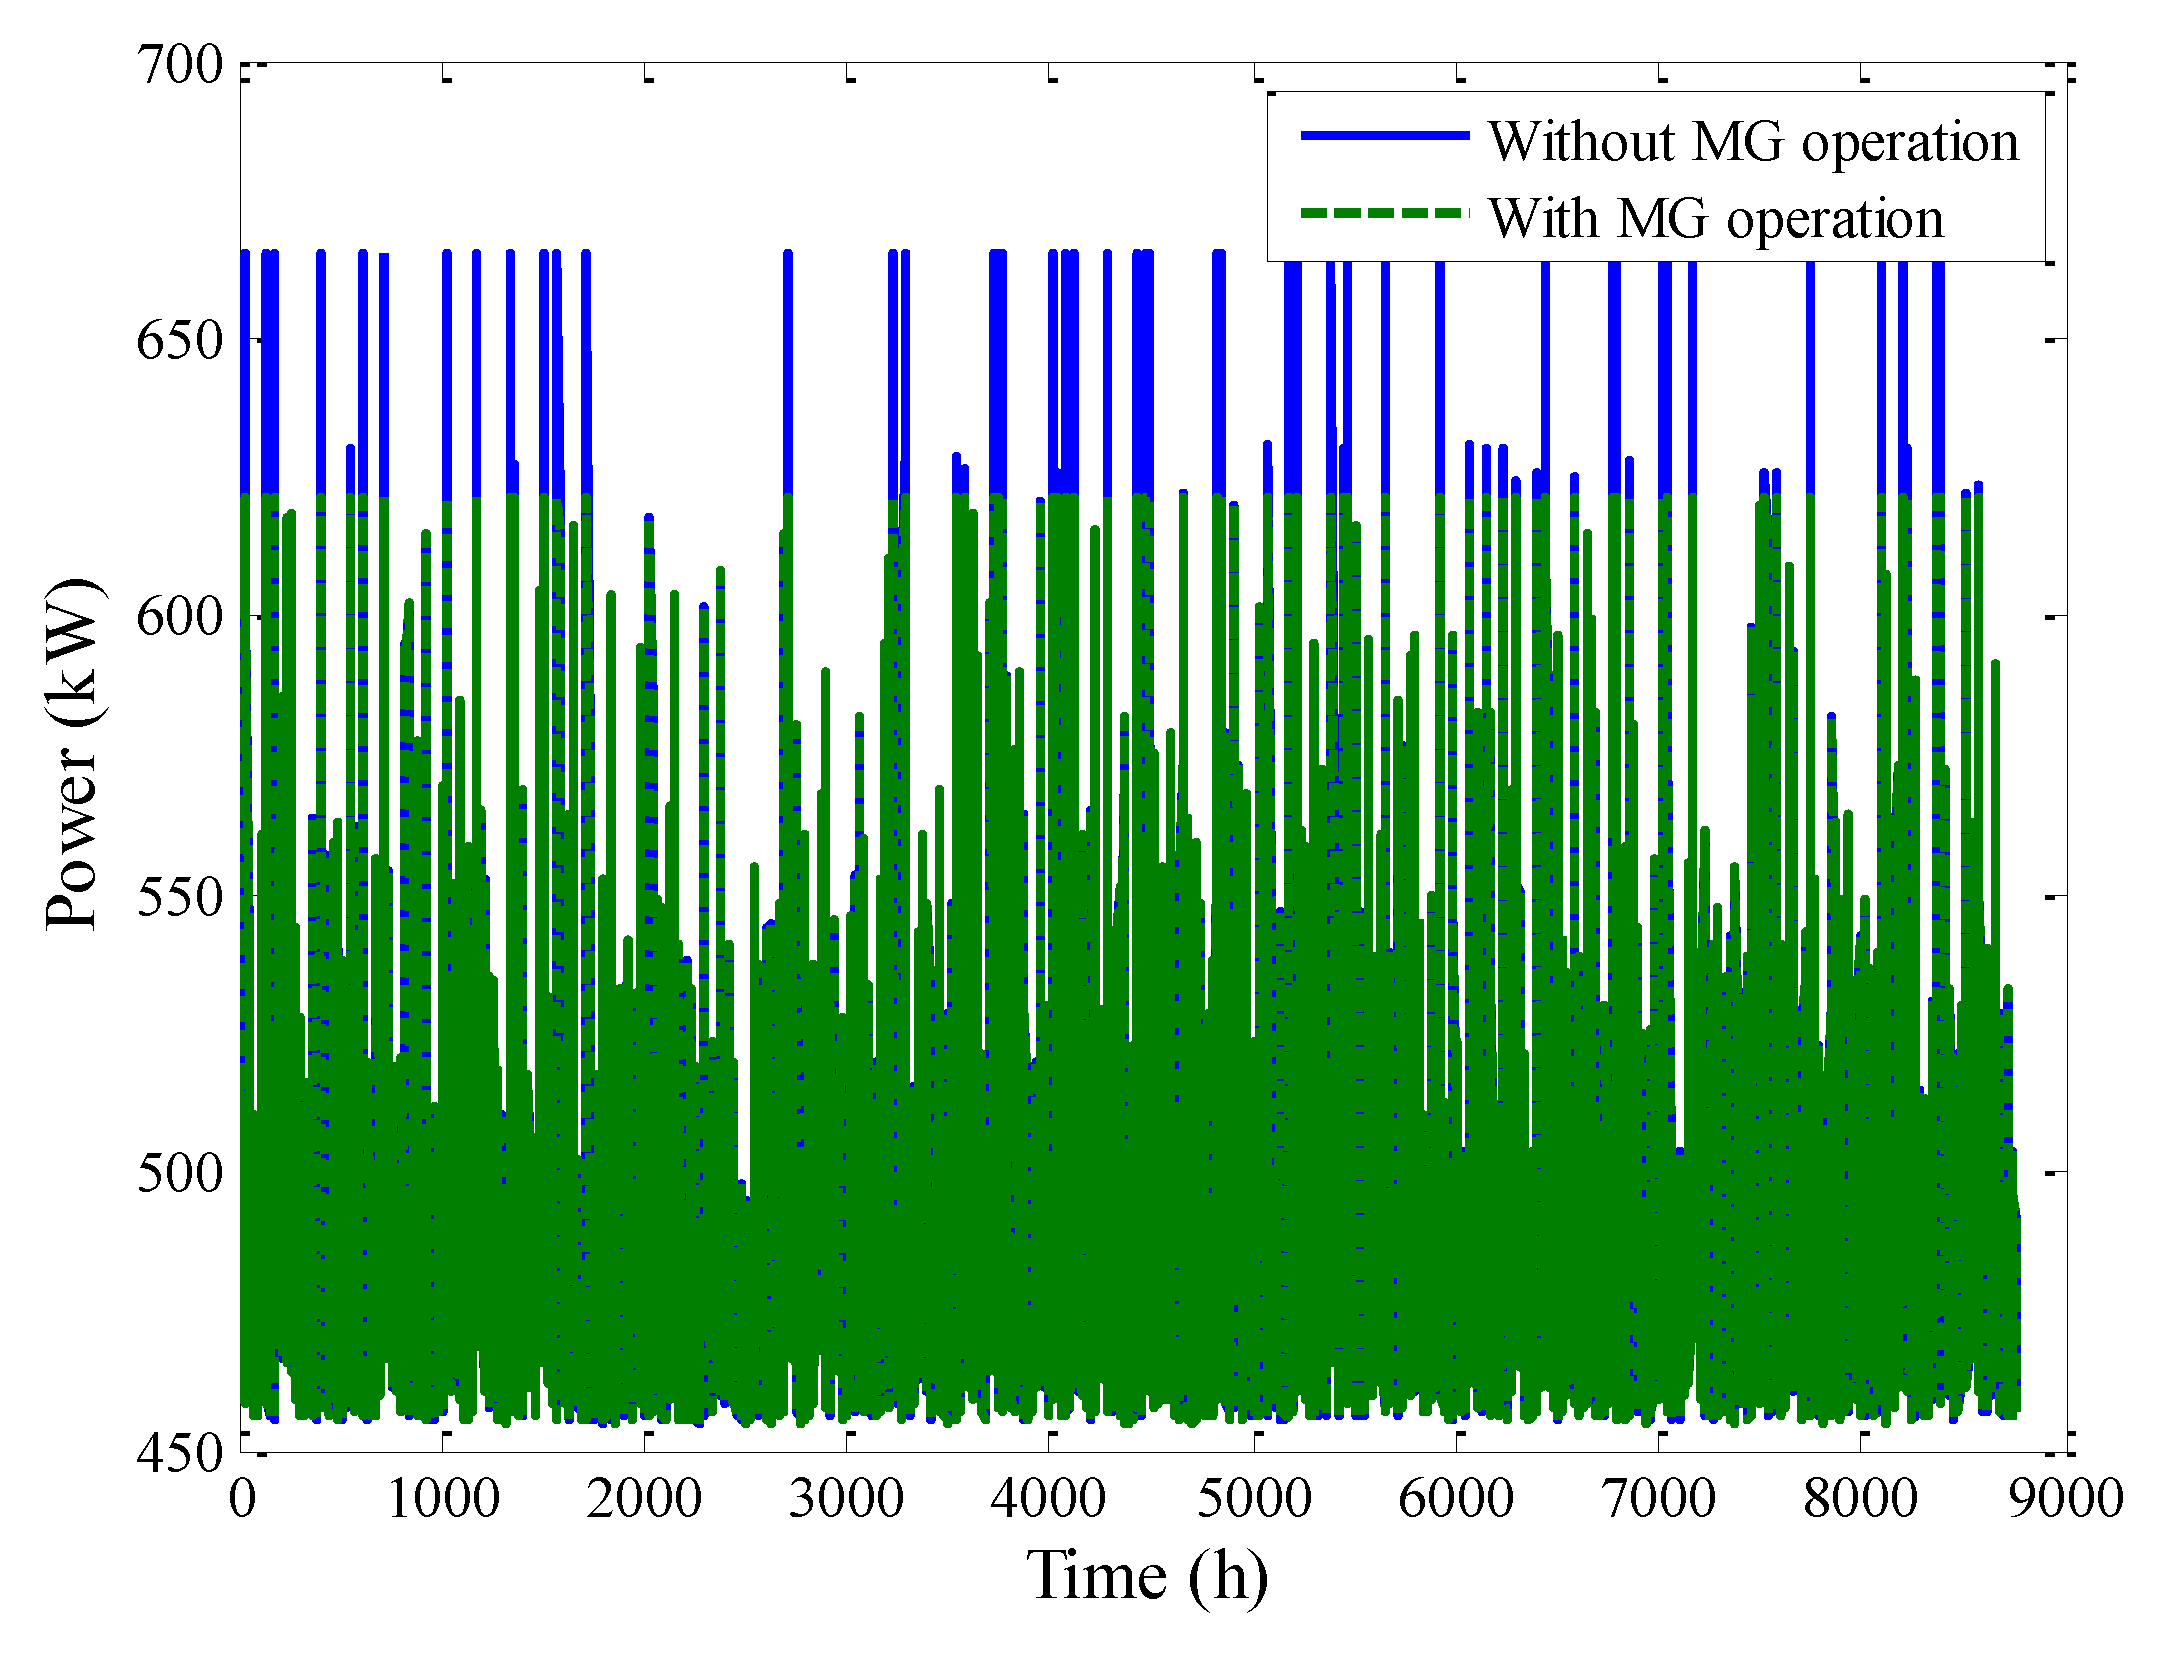
In this subsection, the operation of distributed HES to prevent voltage collapse of a distribution feeder is analysed. For the sake of simplicity, the MG is composed of only CGs with the characteristics previously shown in Table 6 and CI presented in Figure 11. As explained in Section 3.1, MLI was evaluated using (58). Then, at those hours when M L I ( n , t ) < 1 , power from CGs was dispatched to mitigate the instability of the distribution feeder. As mentioned, the power of CGs ( Δ P M L I ( n , t ) ) is adjusted according to (59). Figure 12 presents load demand time series taking into account the effects of CGs. System instability was observed 128 times, which represents 1.461187% of the year duration (loss of load probability equal to 1.461187%).
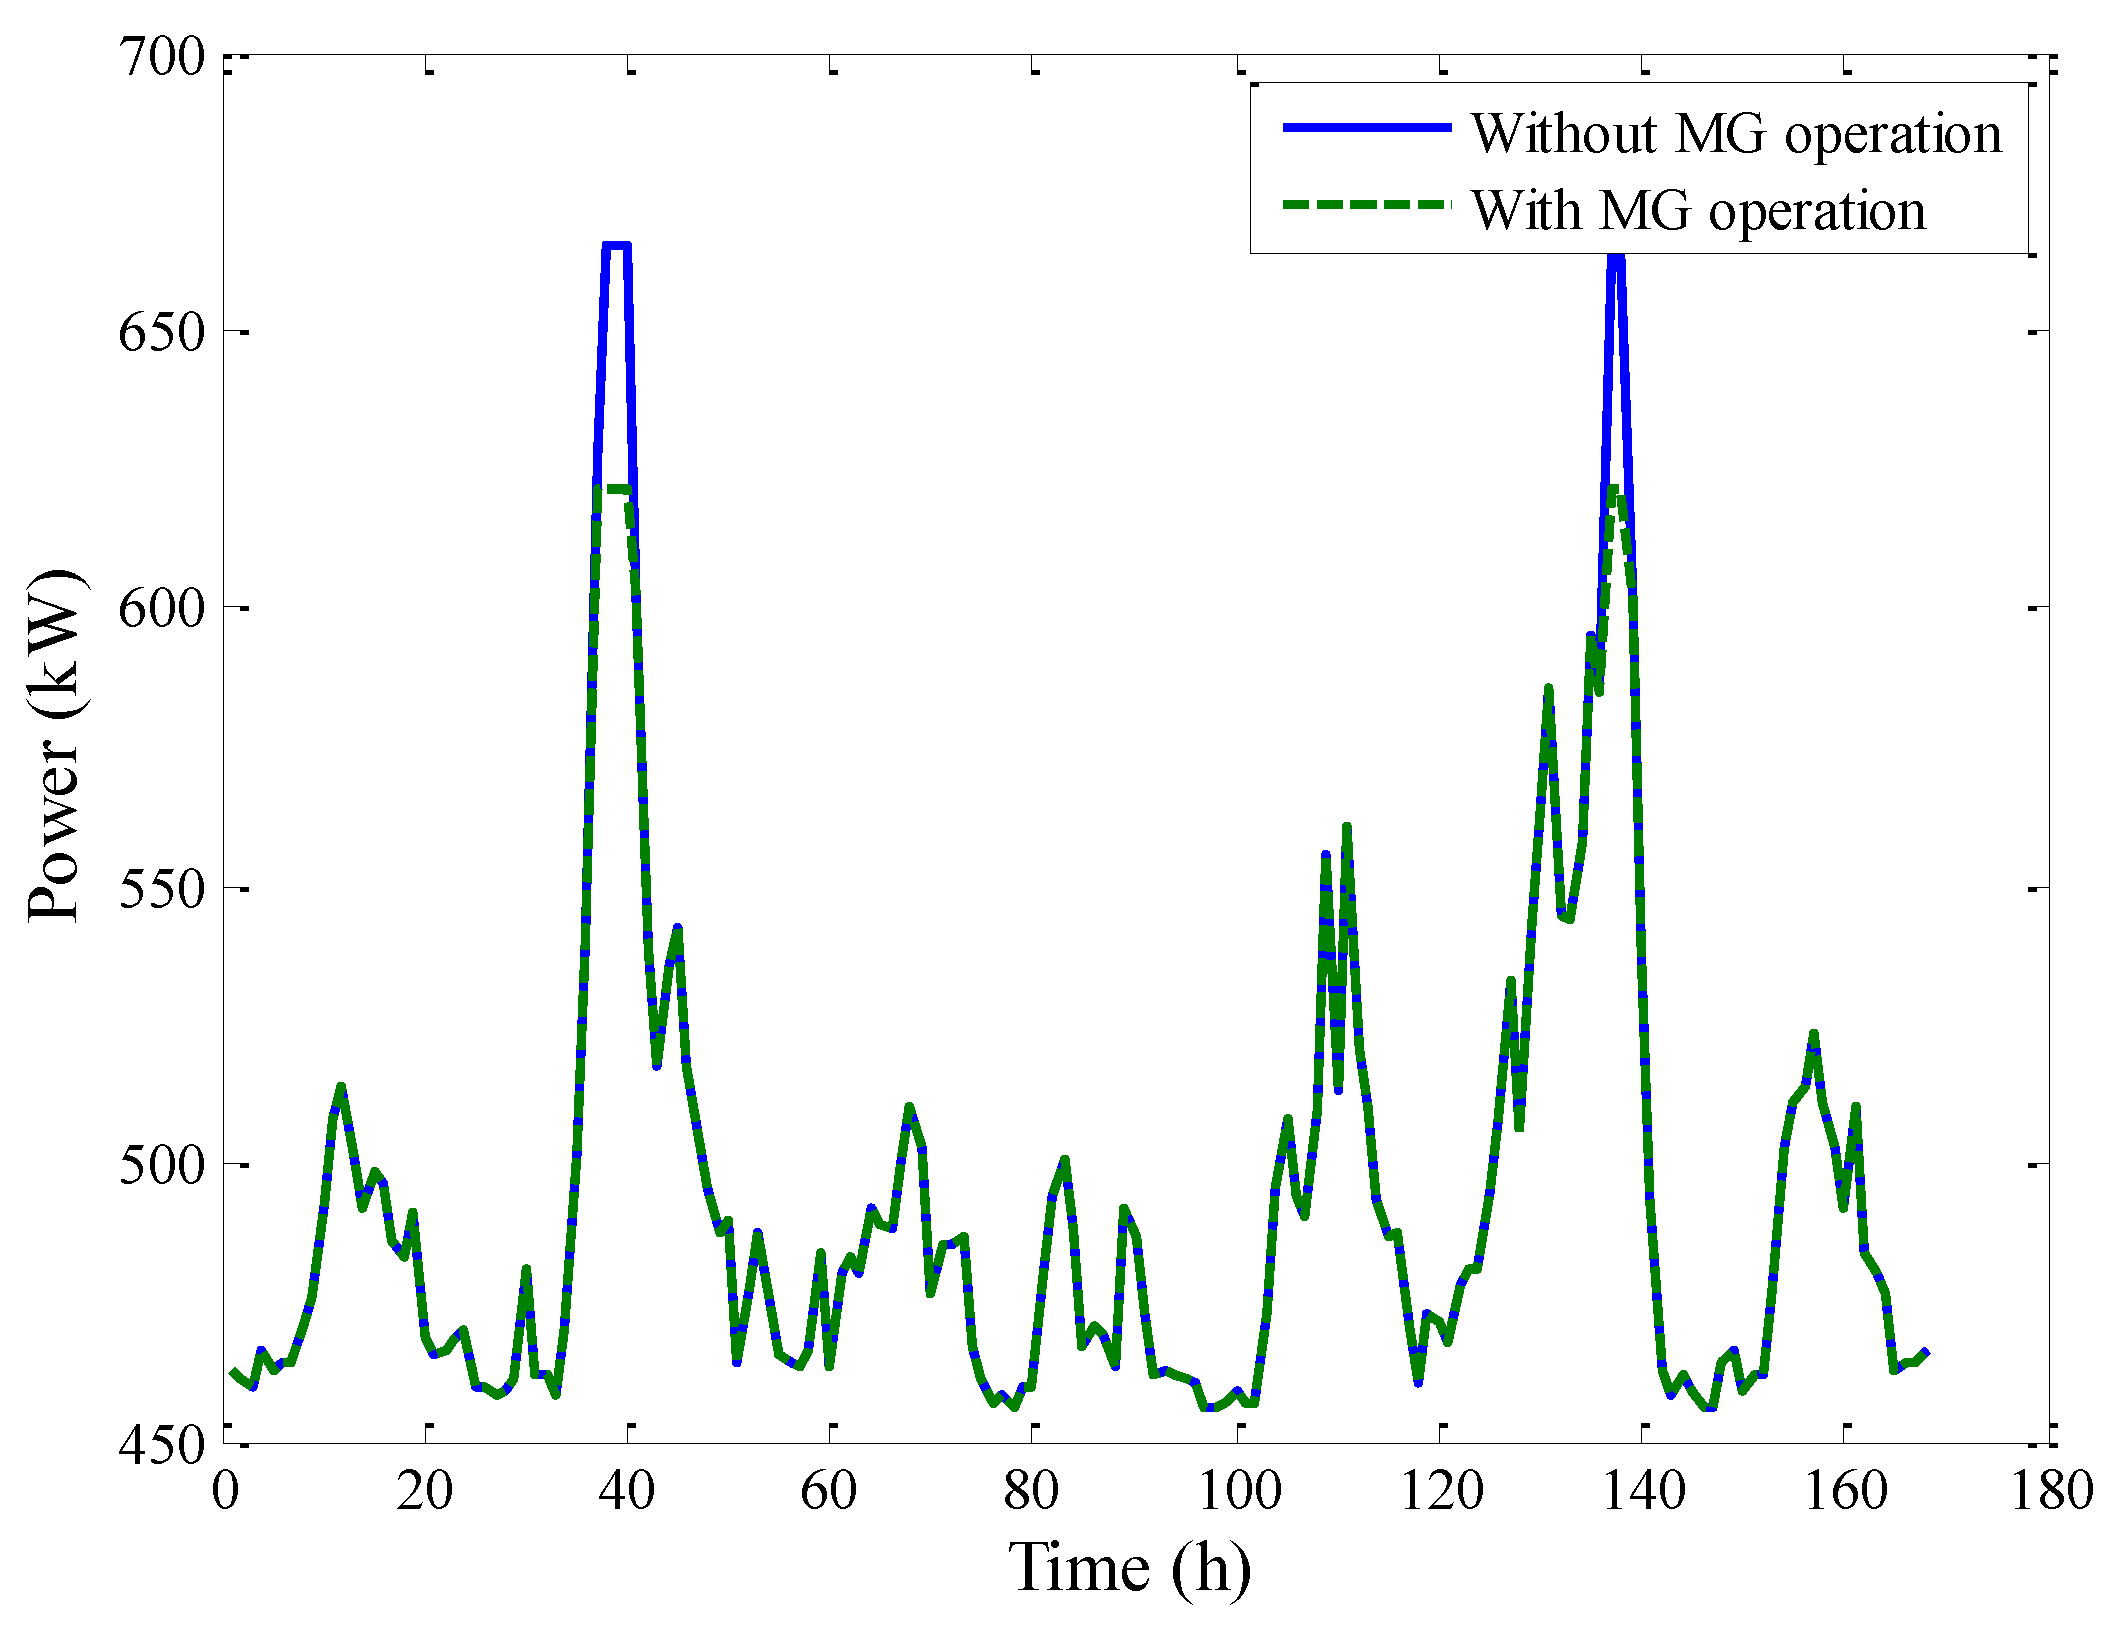
For a better understanding, Figure 13 shows the first week (168h) of time series previously shown in Figure 12. As can be observed, the MG operation reduces the load demand during peak load hours. In other cases, this problem is mitigated by means of demand response resources. In this paper, the operation of properly coordinated distributed resources has been used.
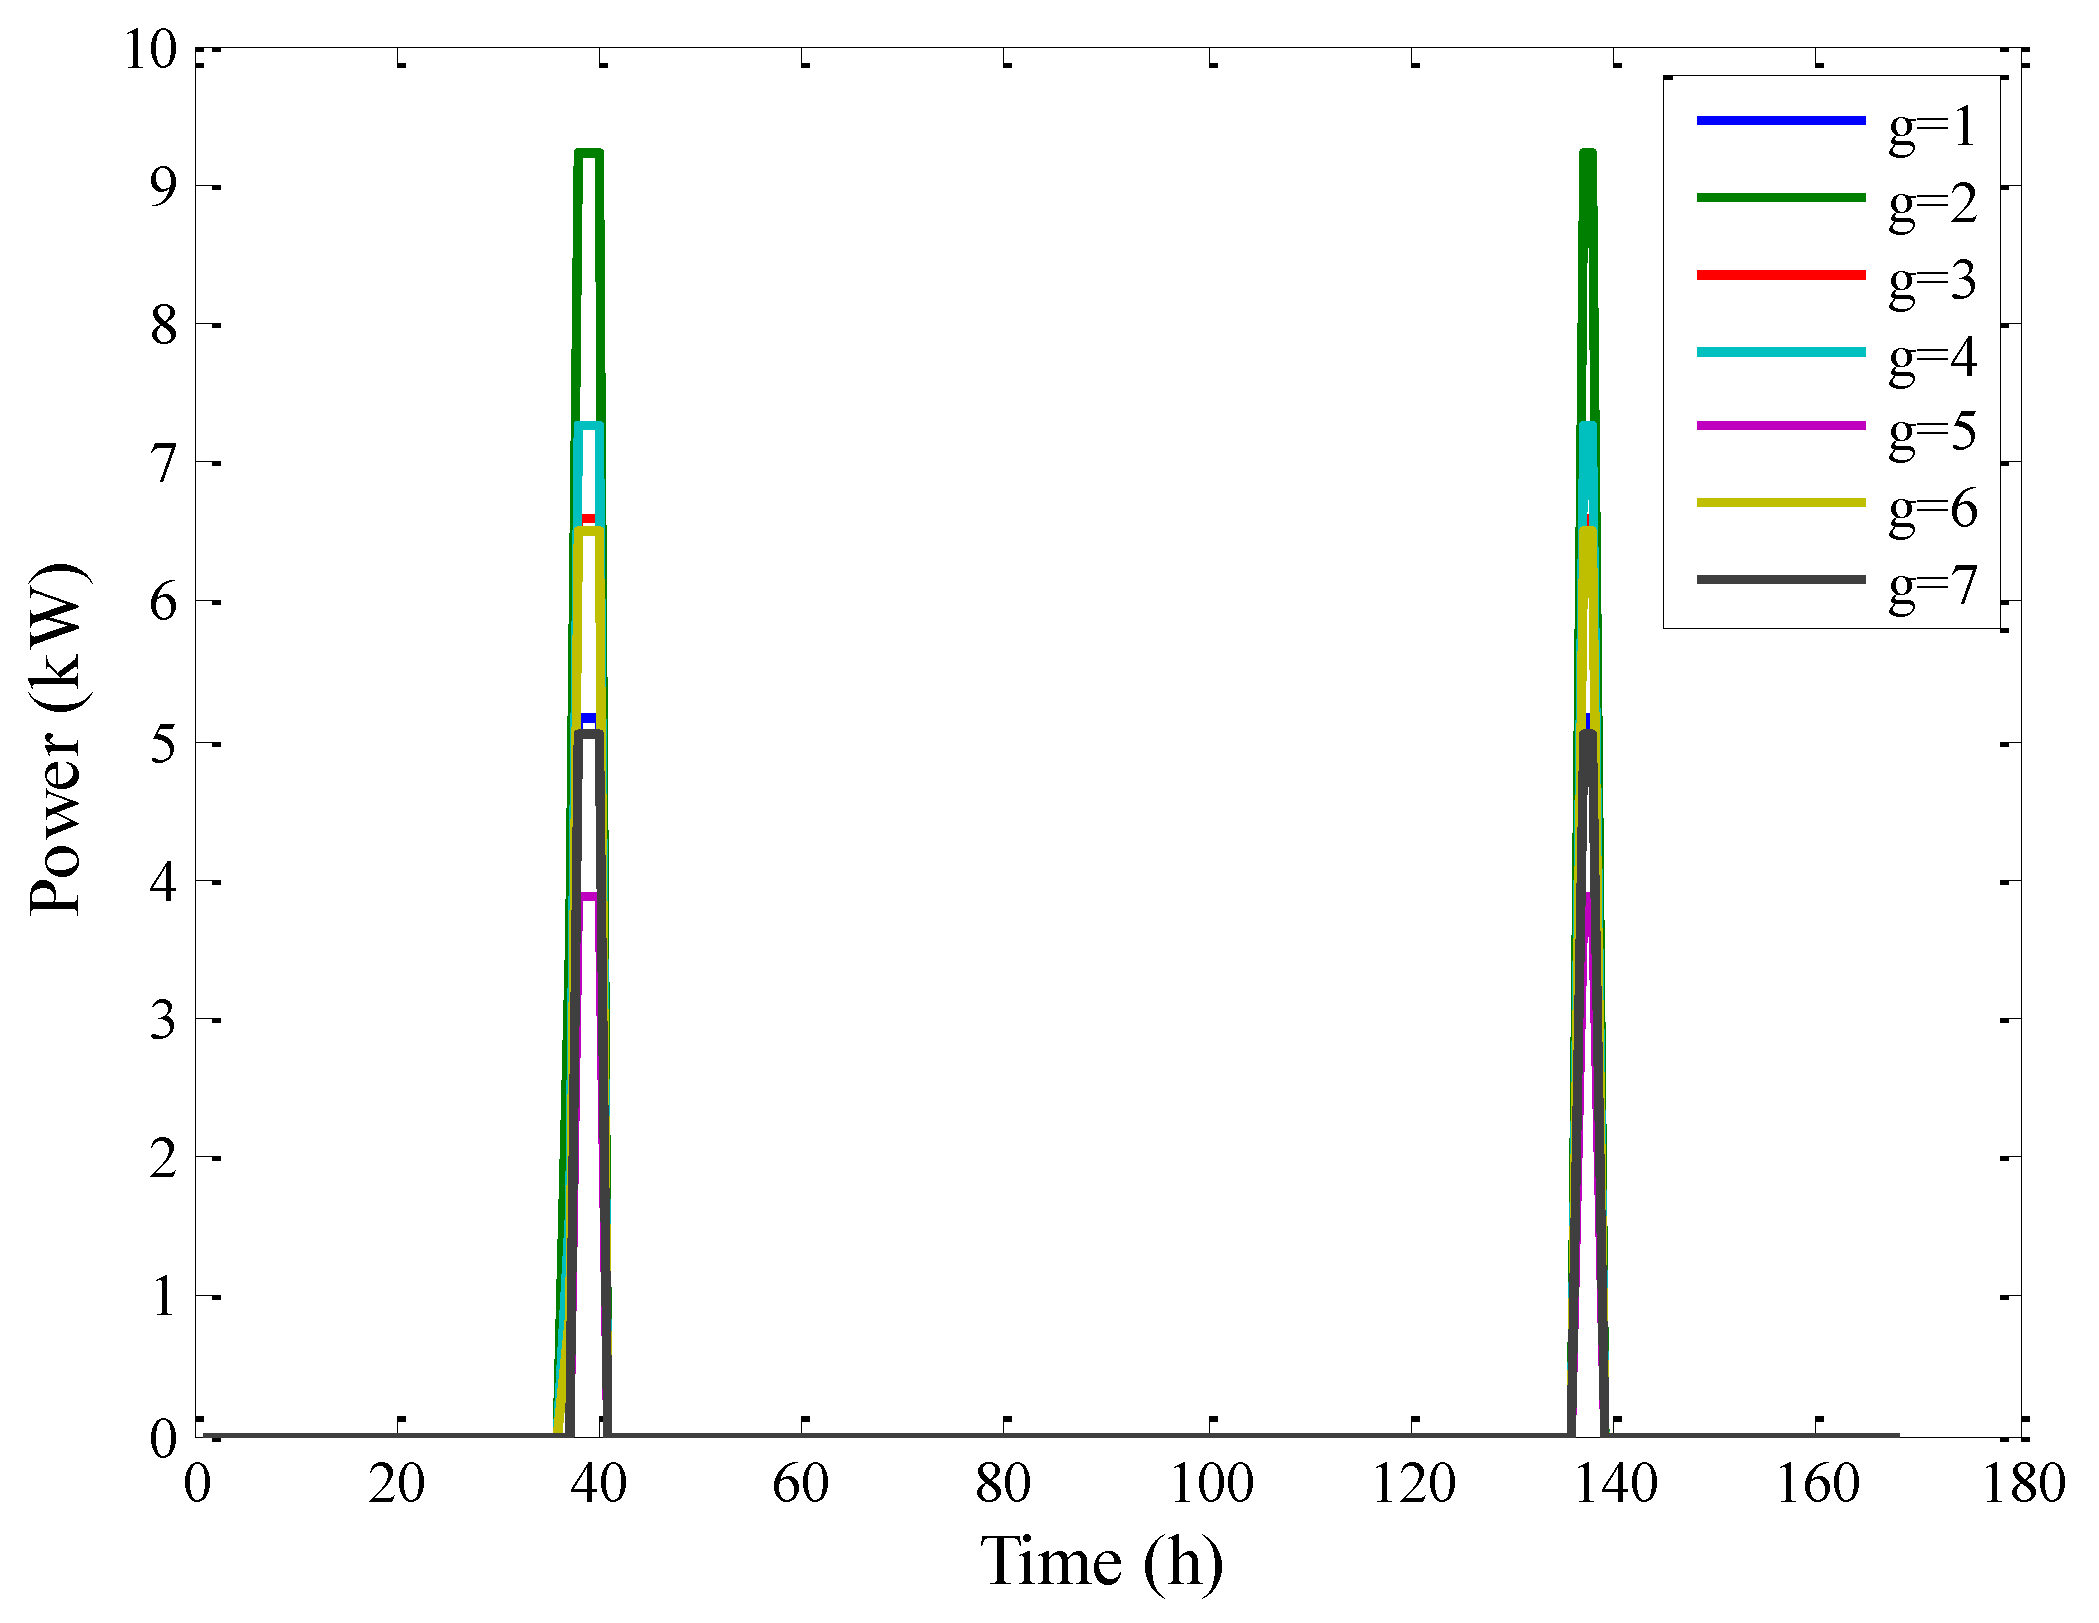
Figure 14 shows the power production of each CG for the first week; such a power dispatch is optimised according to the prices specified by the owner of each generator (Table 6).
Probability distribution of MLI for both series, previously shown in Figure 12 (with and without MG operation), is presented in Figure 15. According to these results, the incorporation of an MG system based on distributed CG guarantees the stable functioning of a DS. When CGs are committed to supplying power to maintain system stability ( Δ P M L I ( n , t ) ), MLI takes a value of 1 or higher.
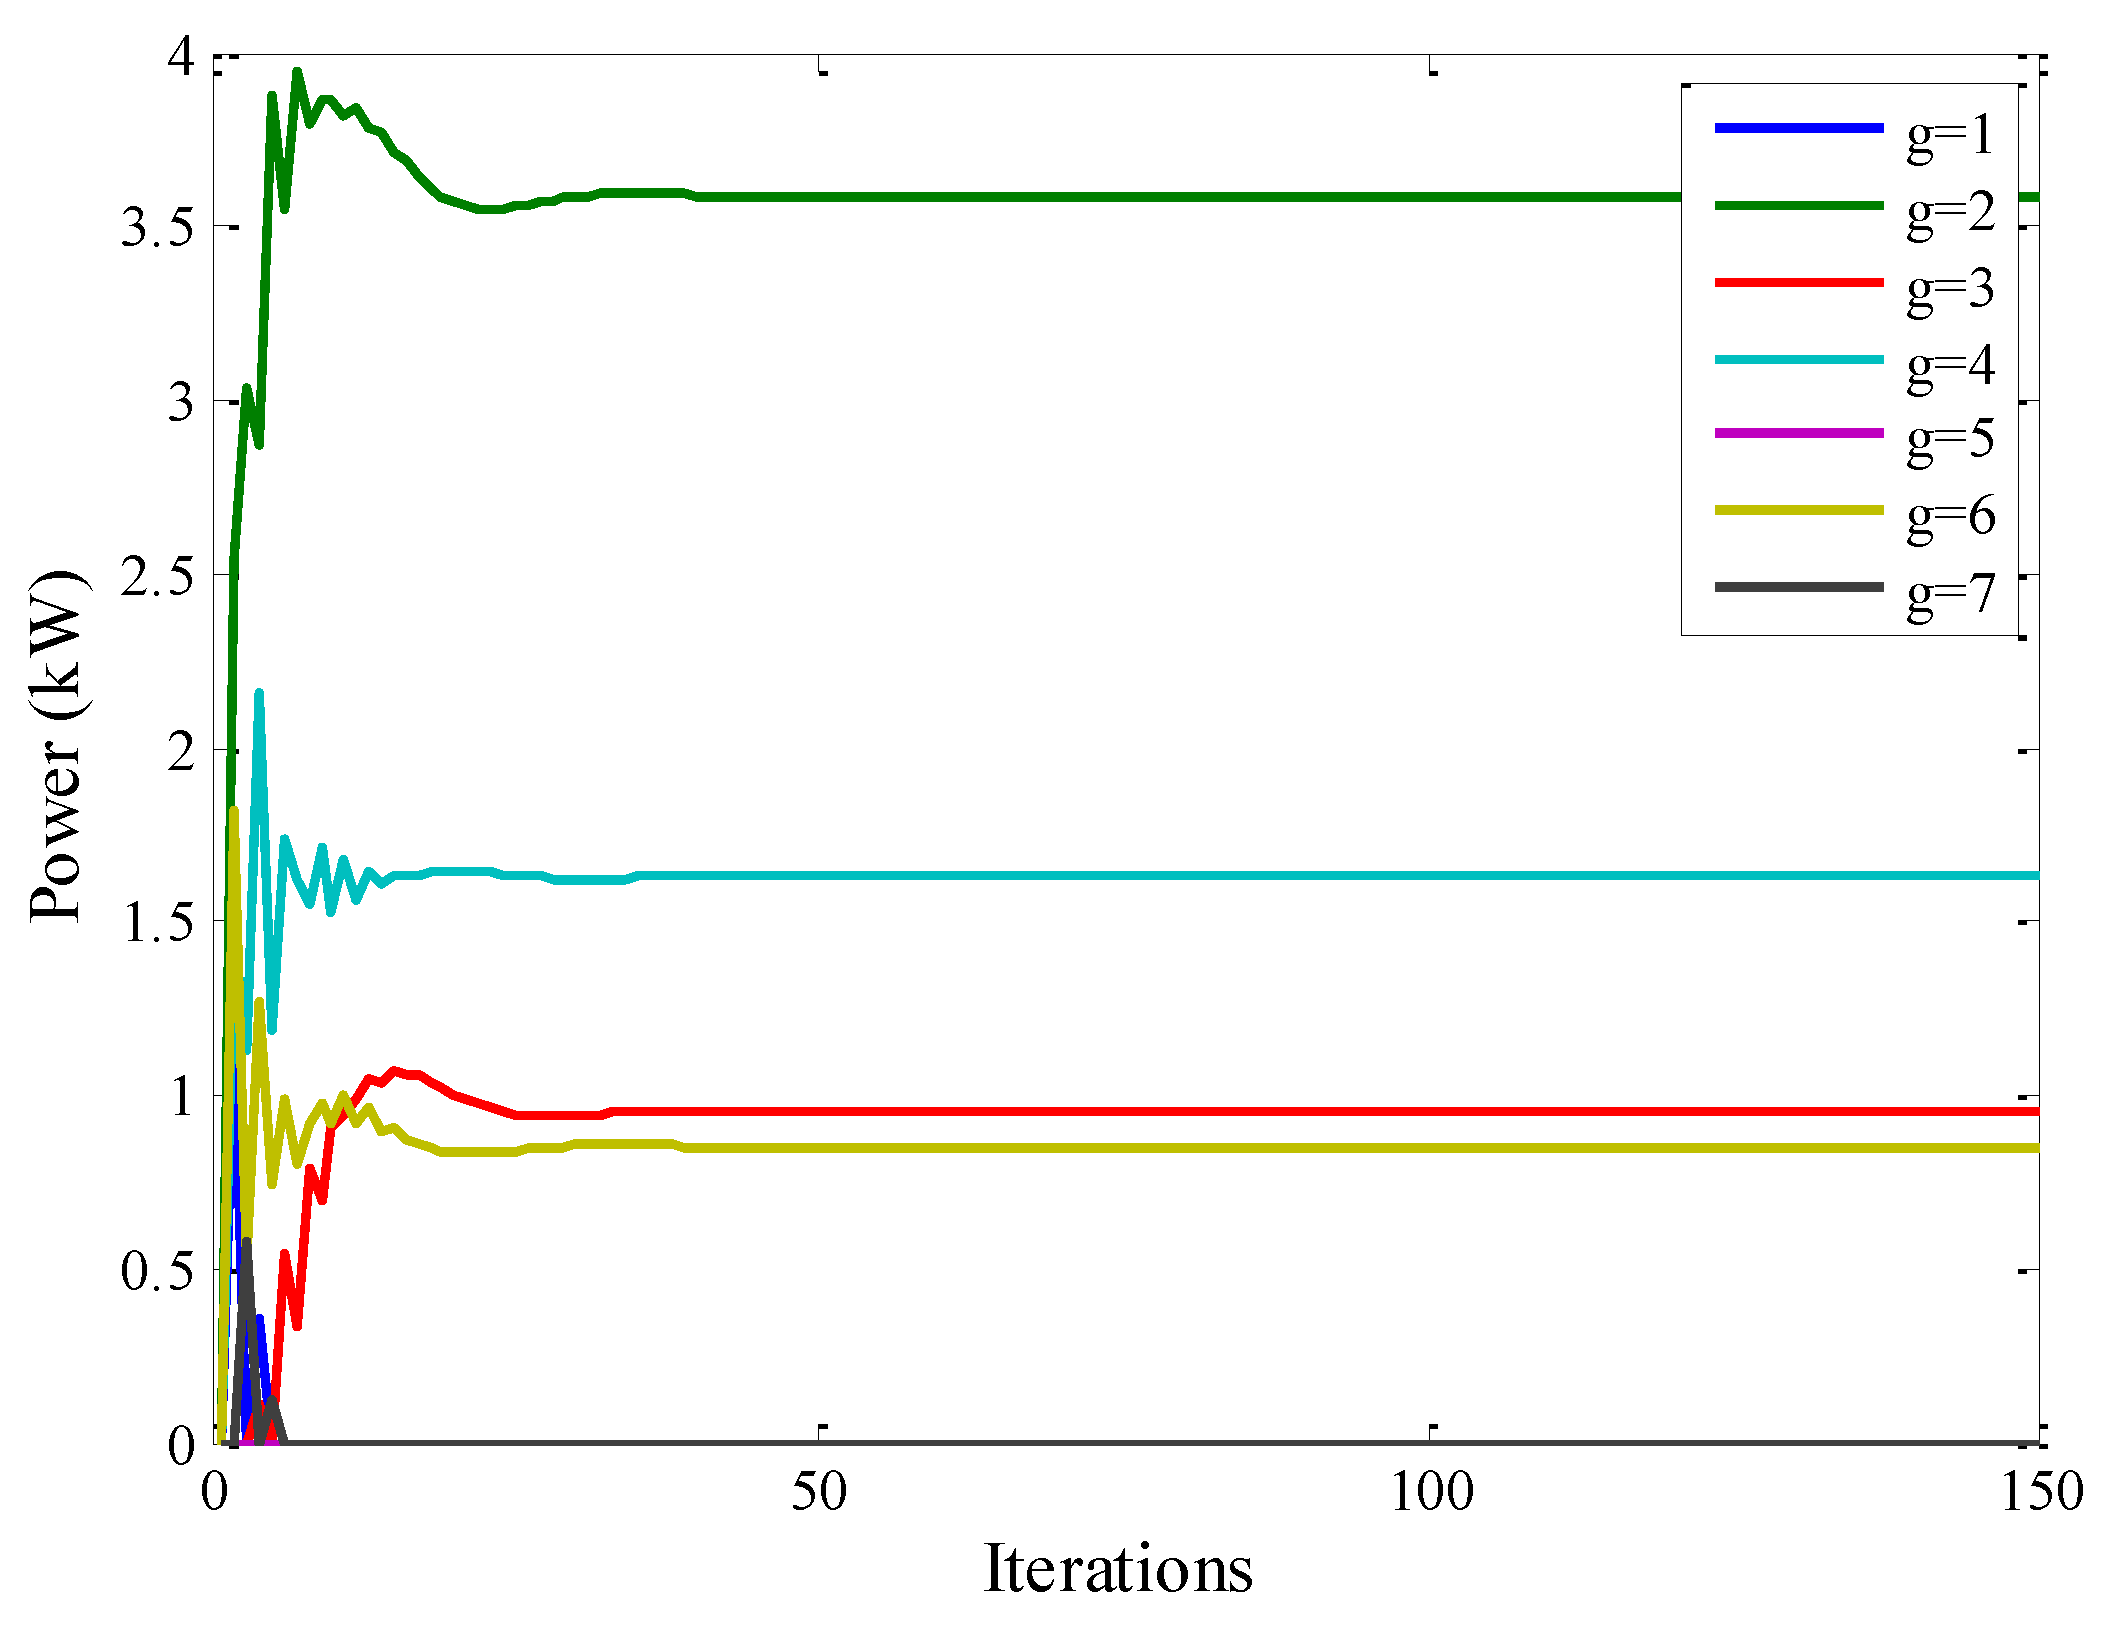
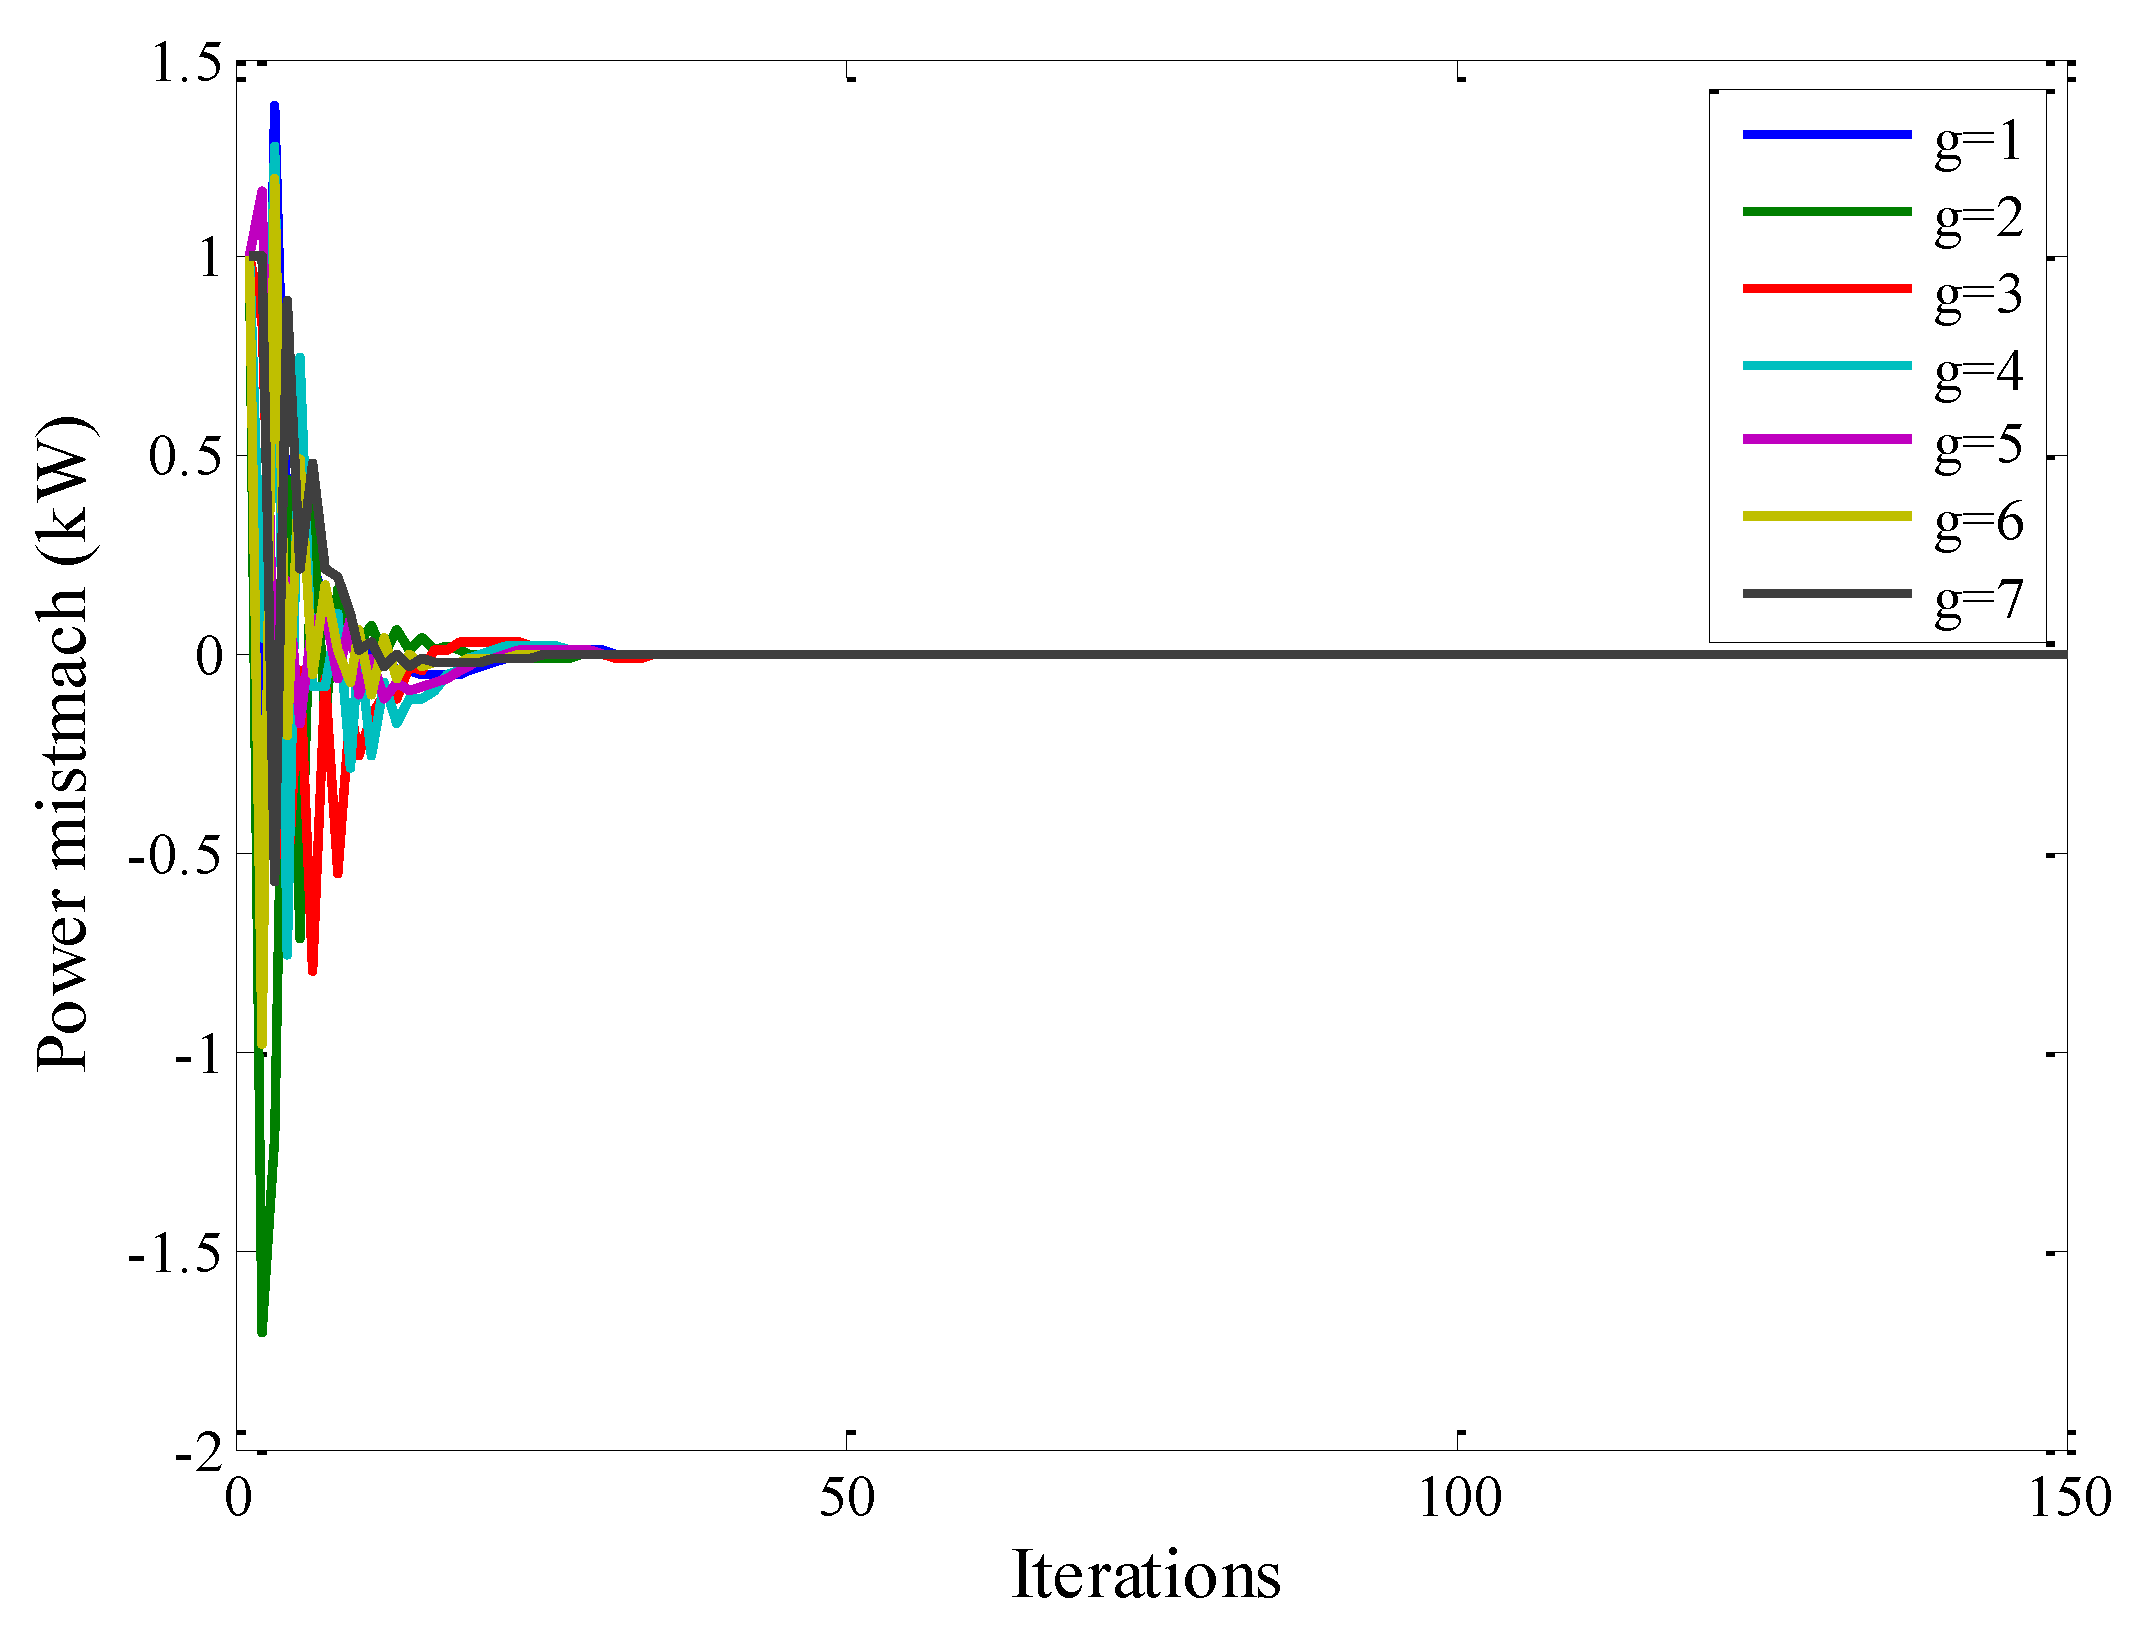
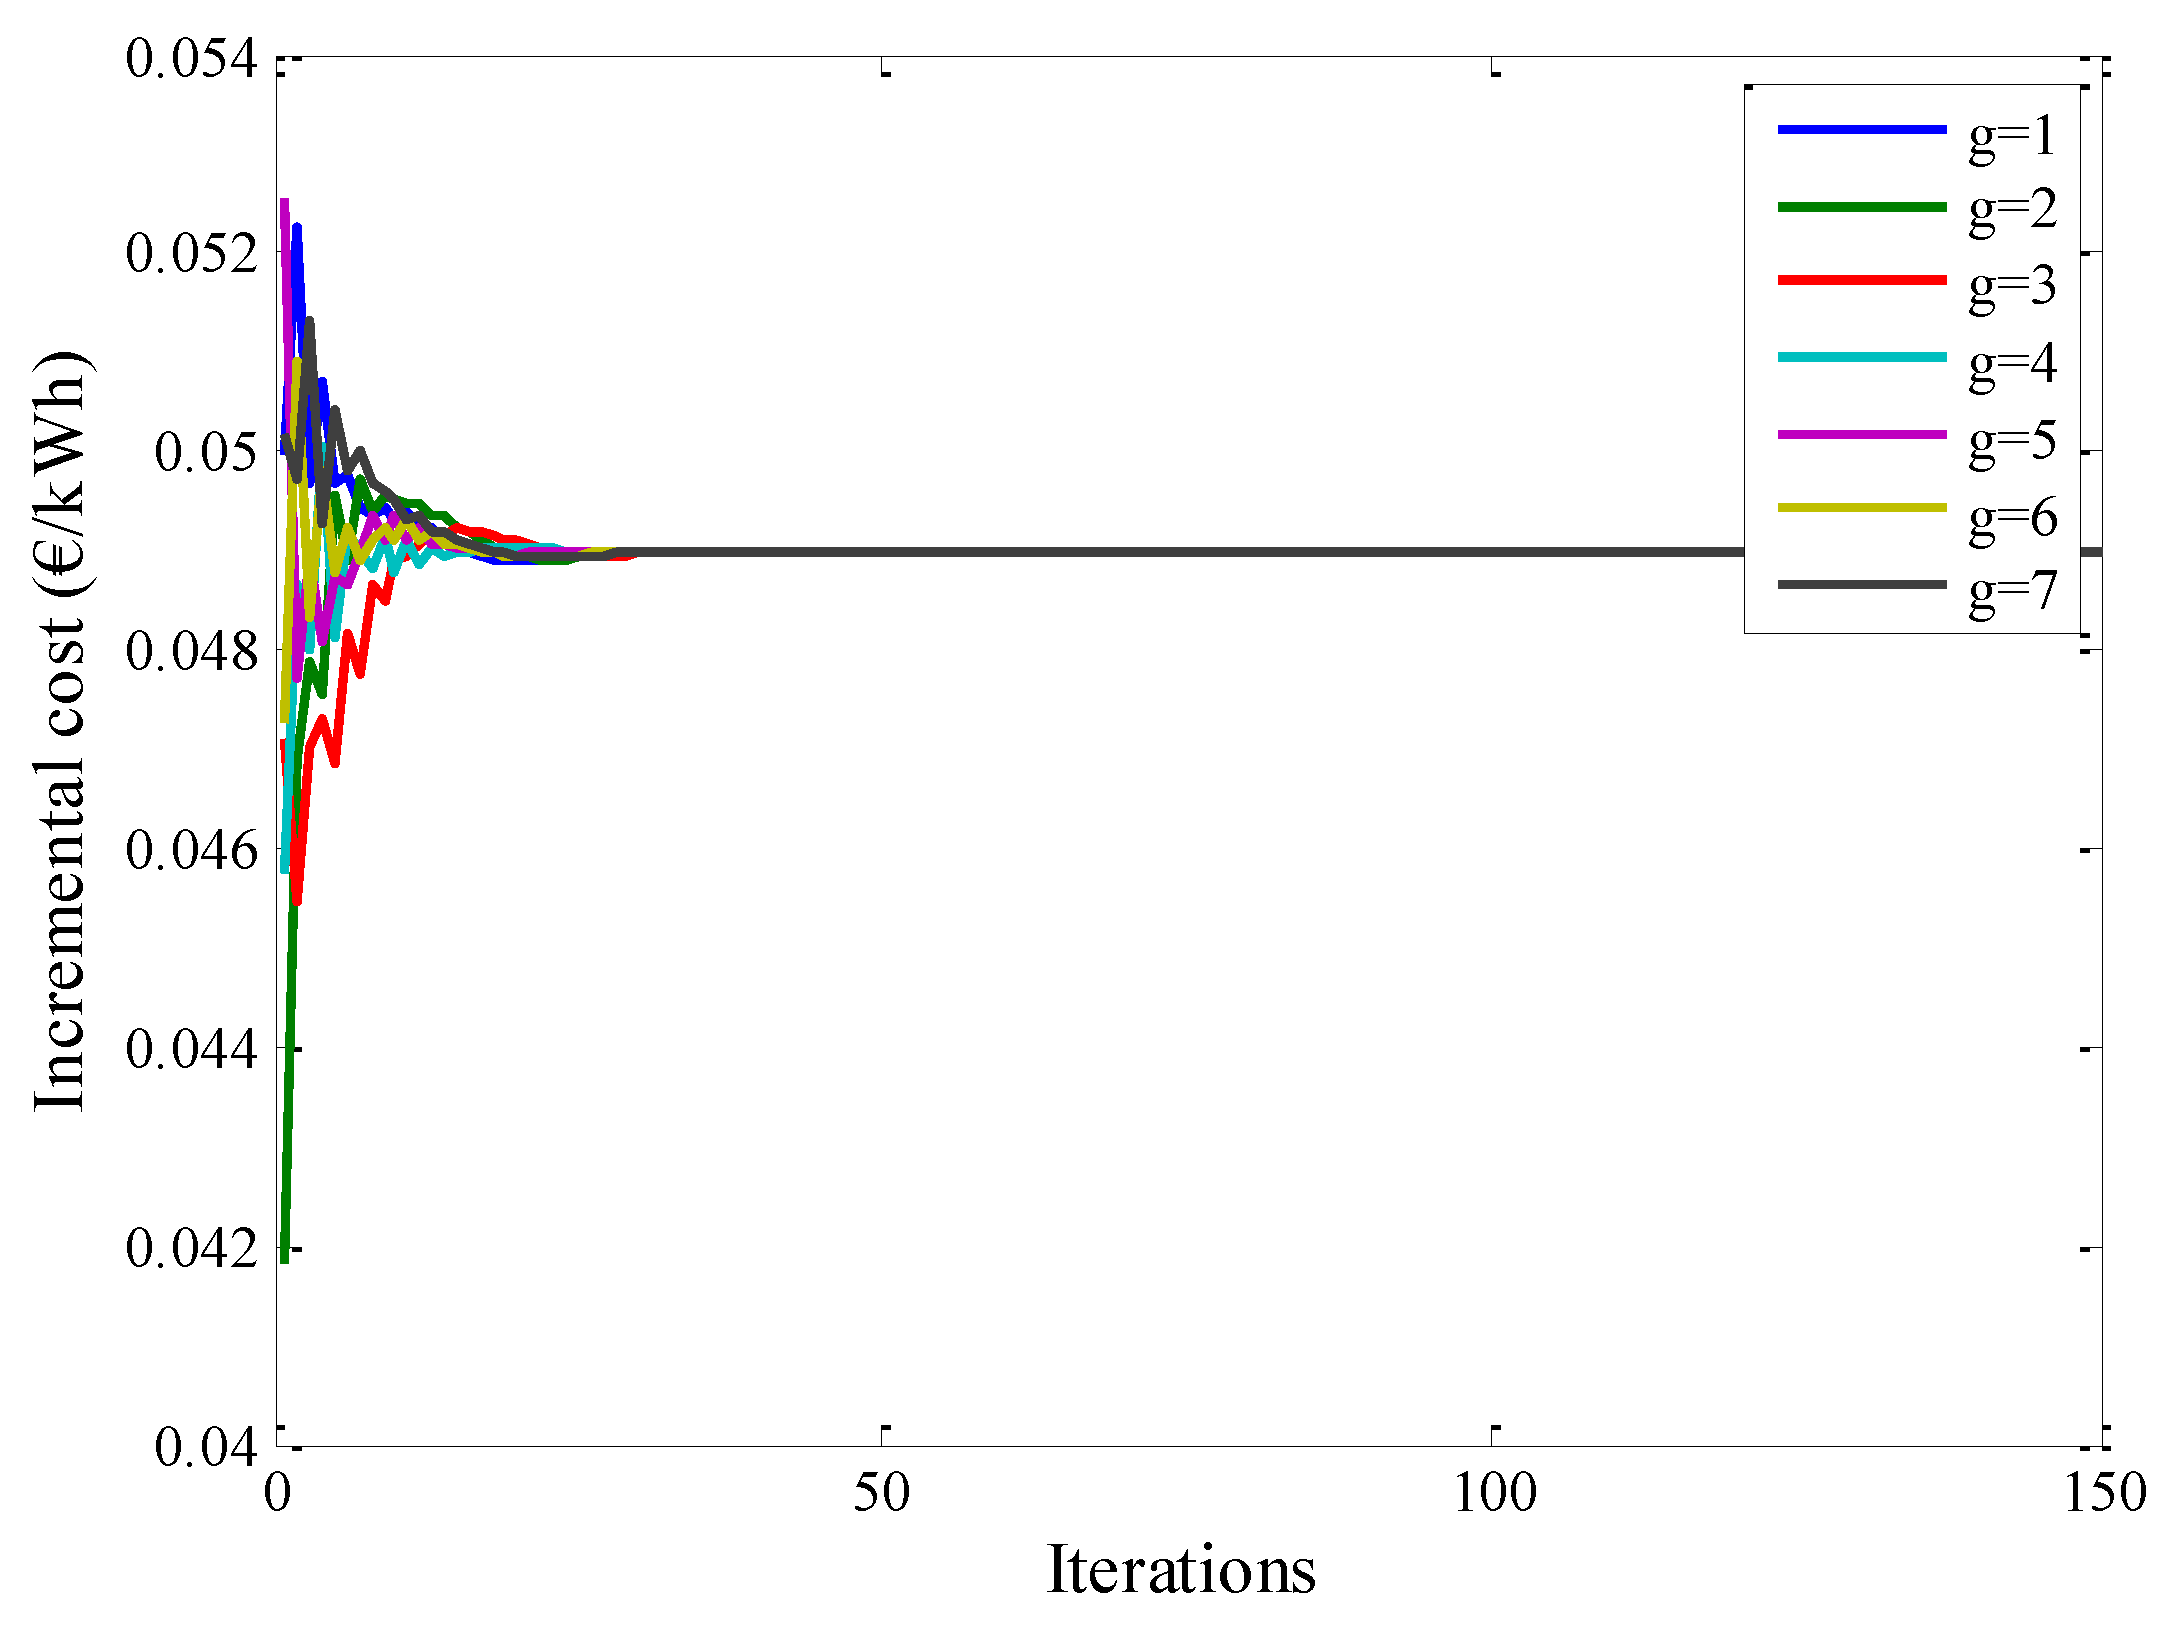
For example, Table 7 and Figure 16, Figure 17 and Figure 18 show the results for t   = 37 h. Power dispatch is shown in Table 7, where it can be observed how required power can be cost-effectively provided. Evolution of CA is shown in Figure 16, which converges to the optimal values shown in Table 7. Power mismatch and incremental cost are shown in Figure 17 and Figure 18, respectively.

4.2. Case Study 2: Long-Term Autonomous MG Operation

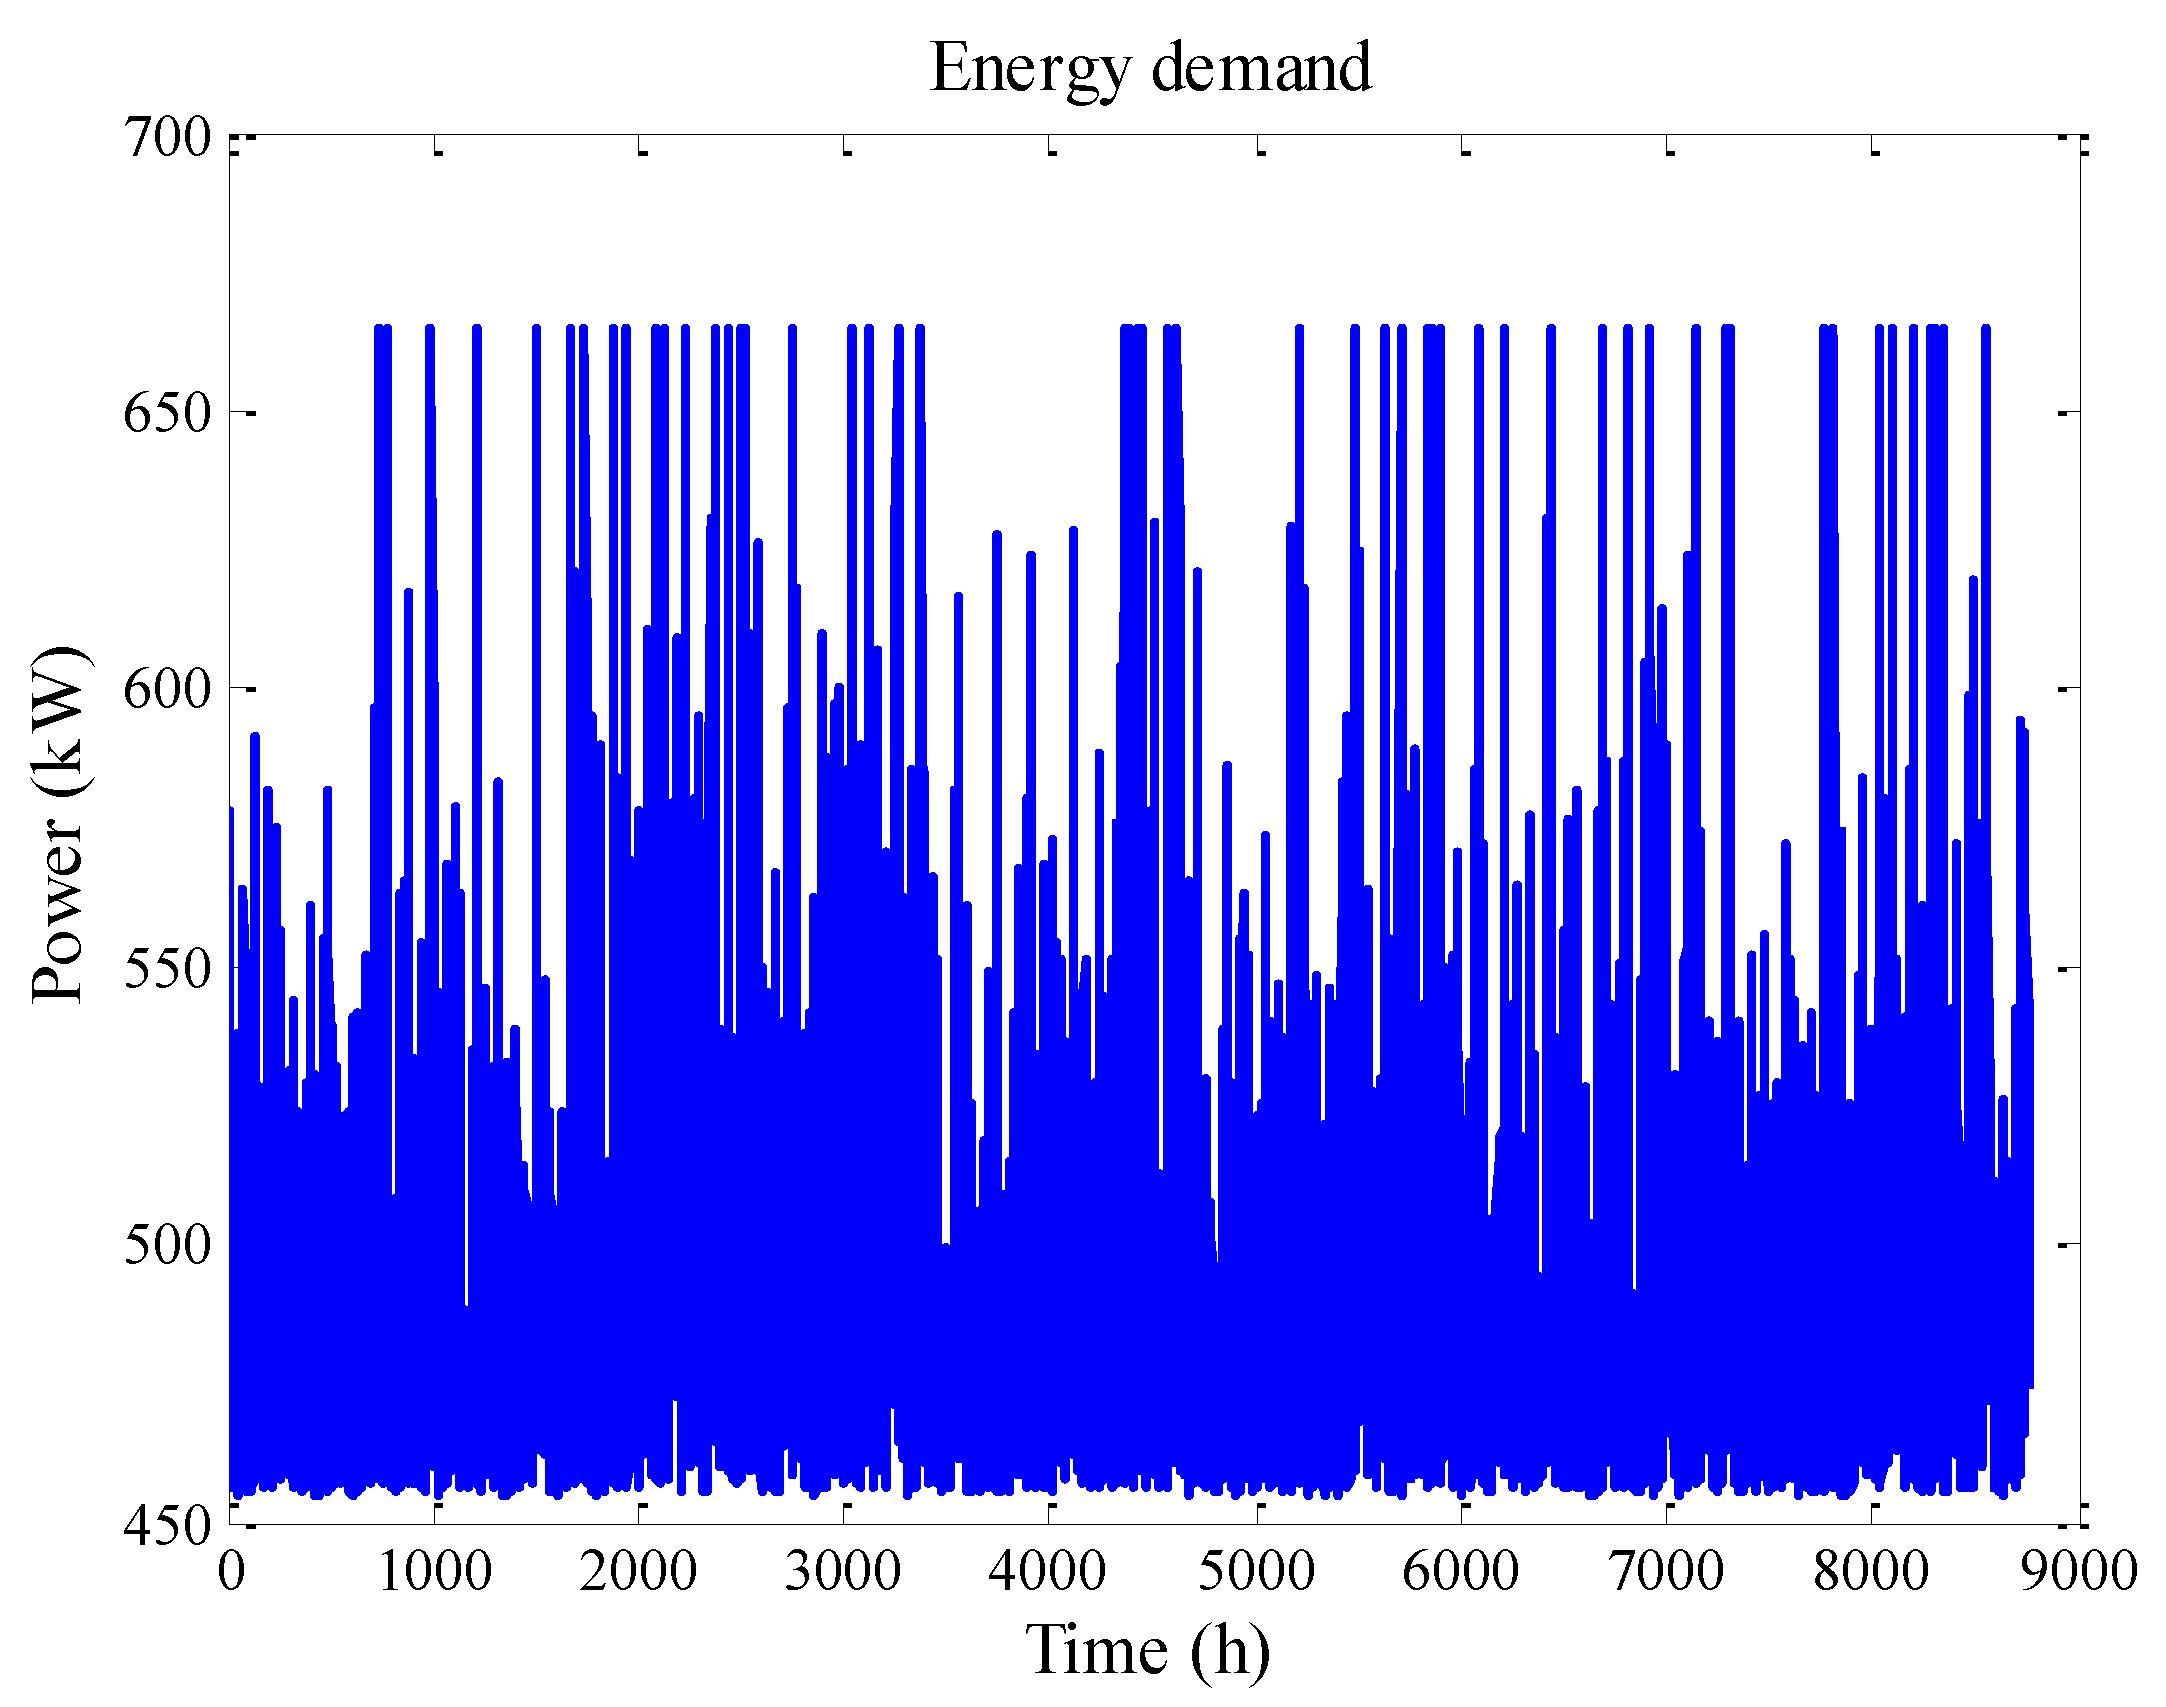
In this subsection, the operation of distributed HES to prevent a power shortage of critical loads is analysed. In this case, the MG operates independently of the DS. Simulations were performed with a time step of 1 h ( Δ t   = 1 h). The load-demand time series used in this case is shown in Figure 19.
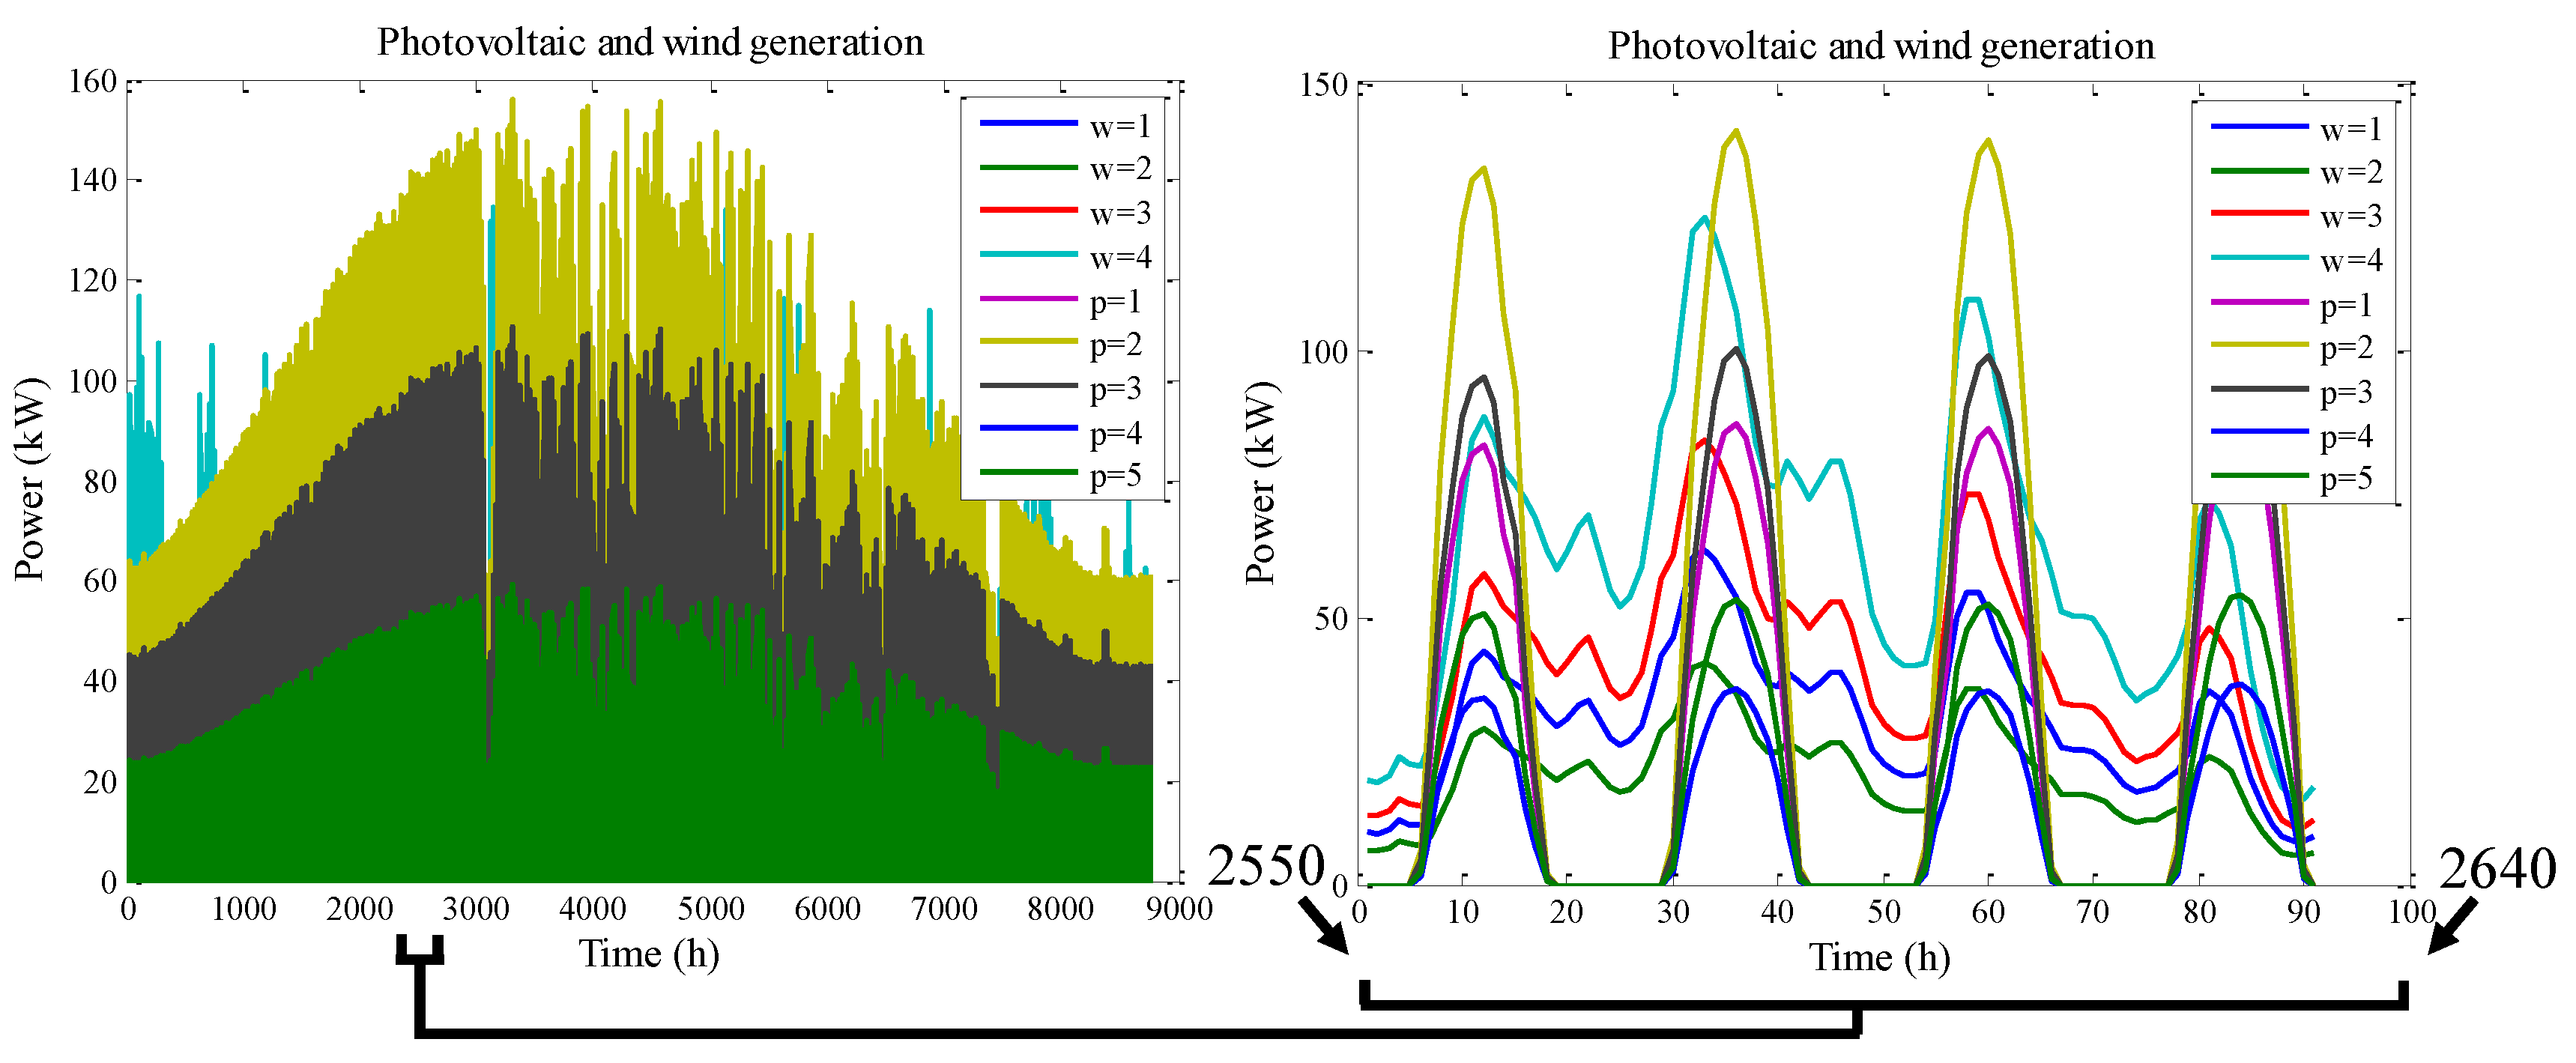
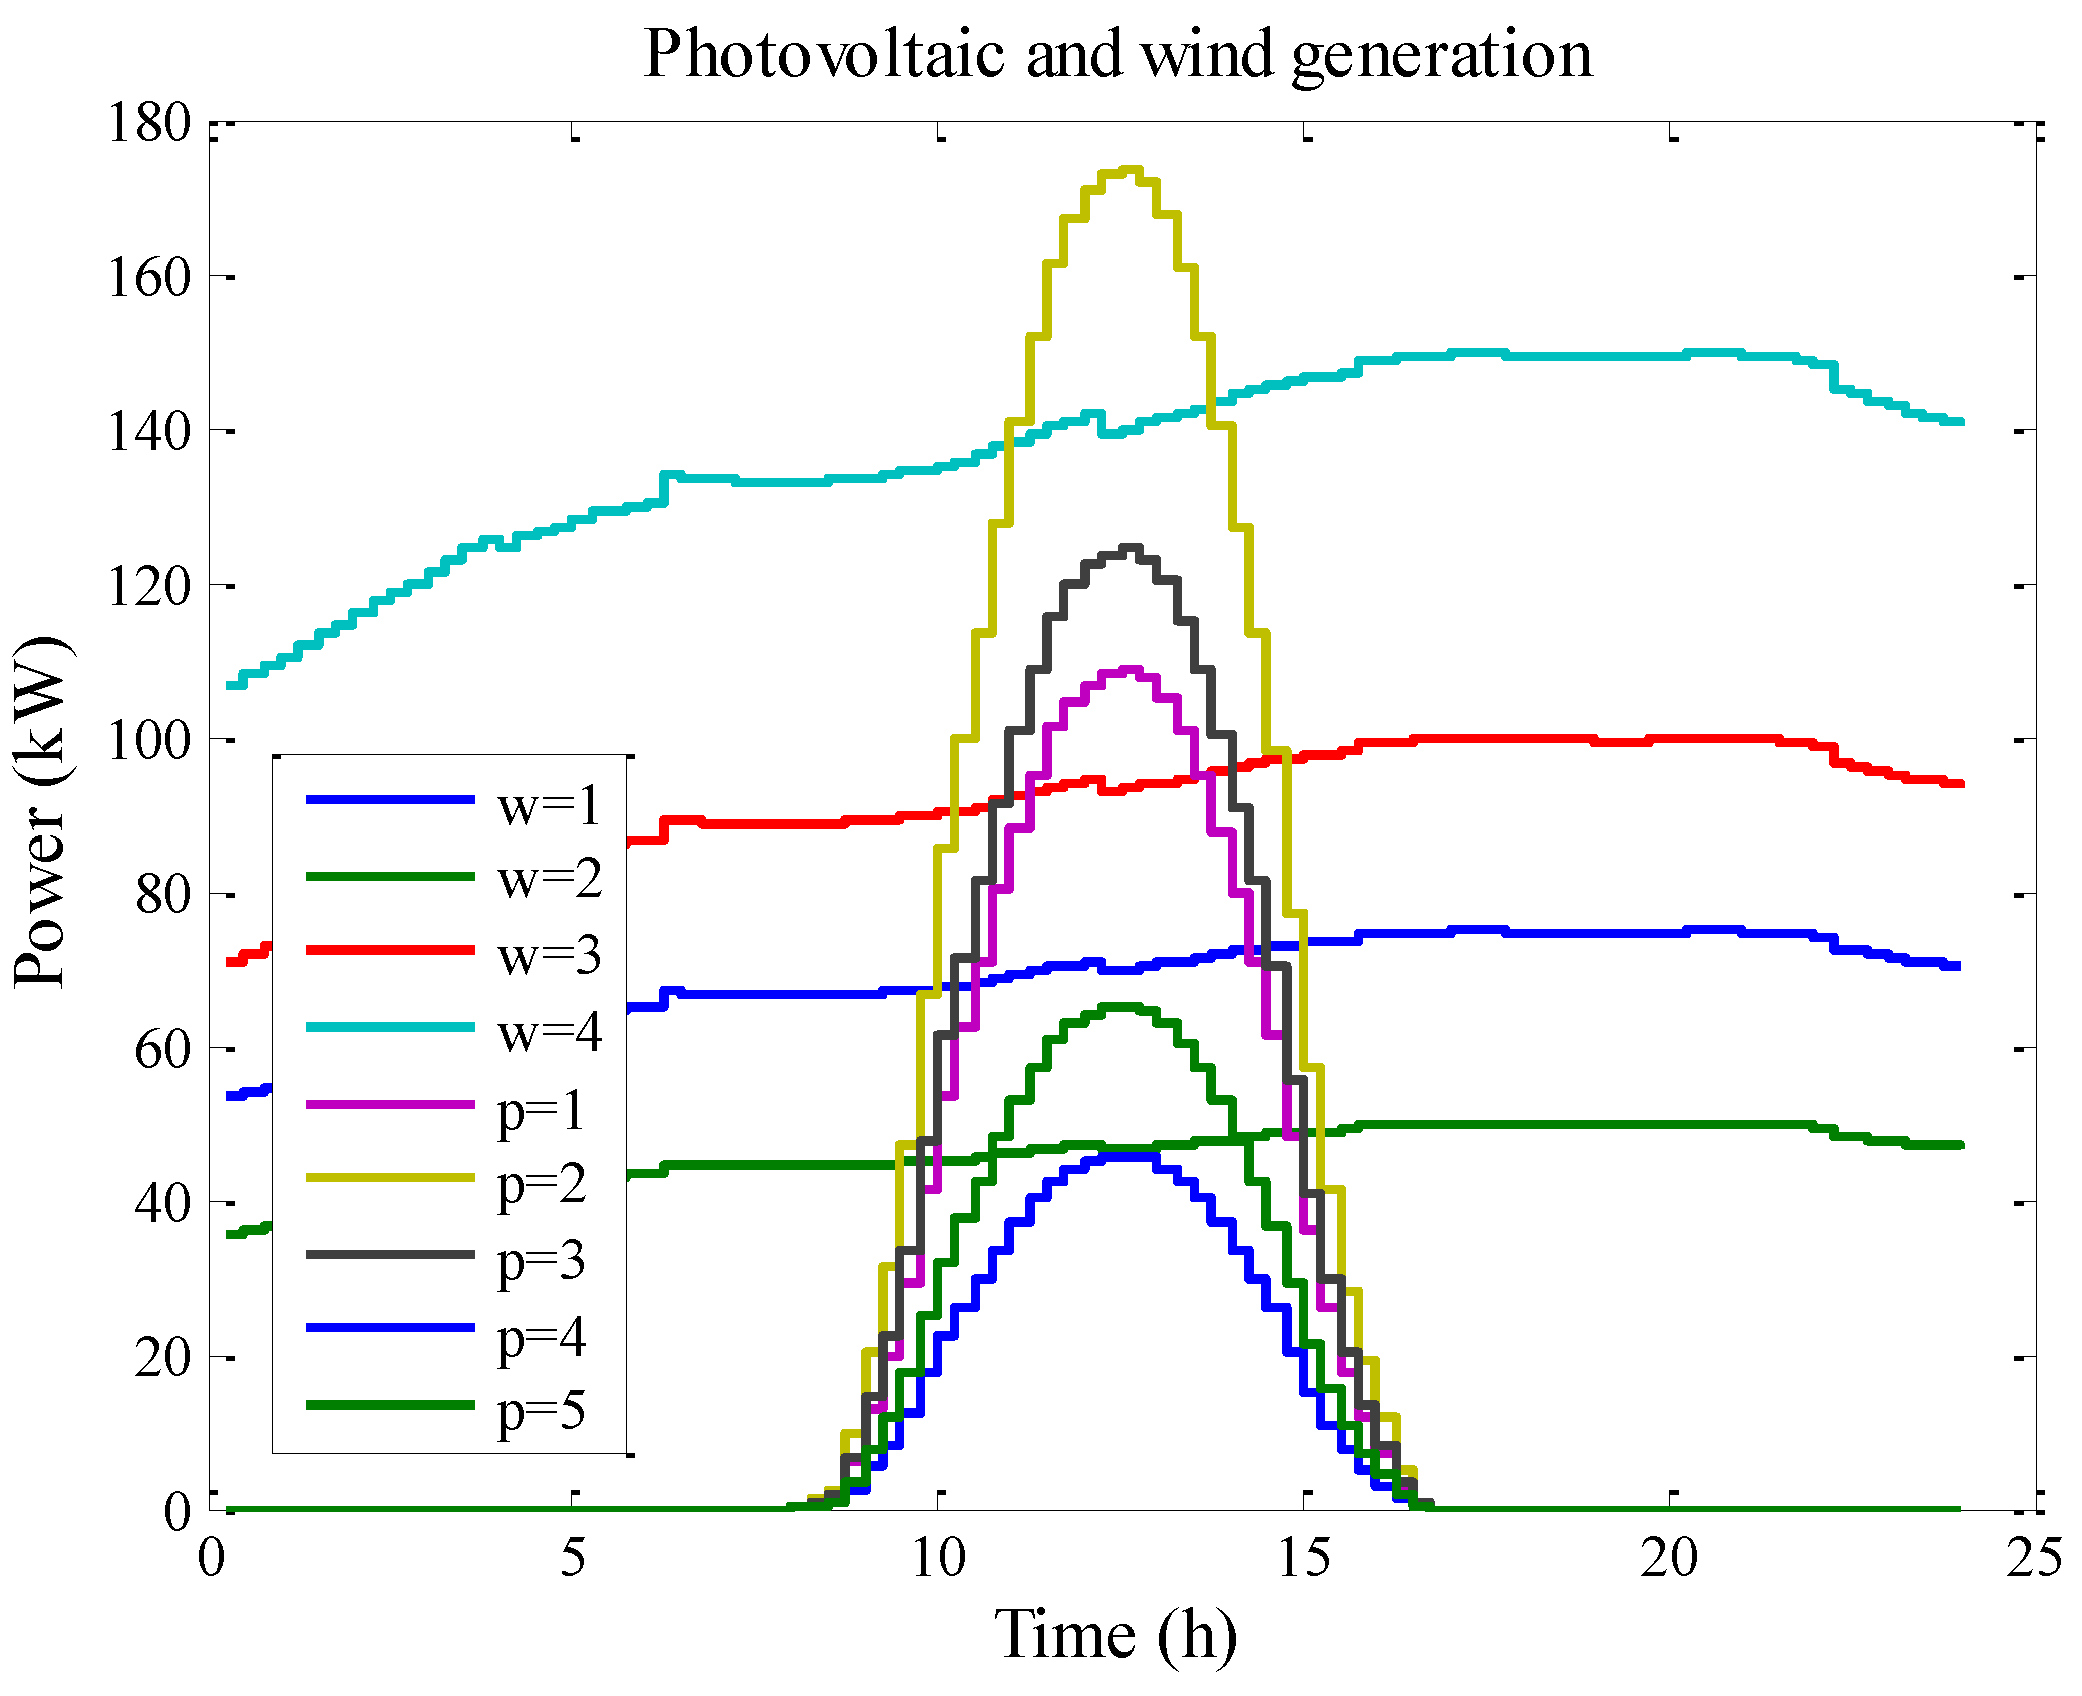
PV and wind power time series are shown in Figure 20. On the left side, time series are fully presented. As an example and to improve understanding of the figure, values between t = 2550 h and t   = 2640 h are shown on the right side. As can be observed, the system takes advantage of the entire renewable generation during this time interval.
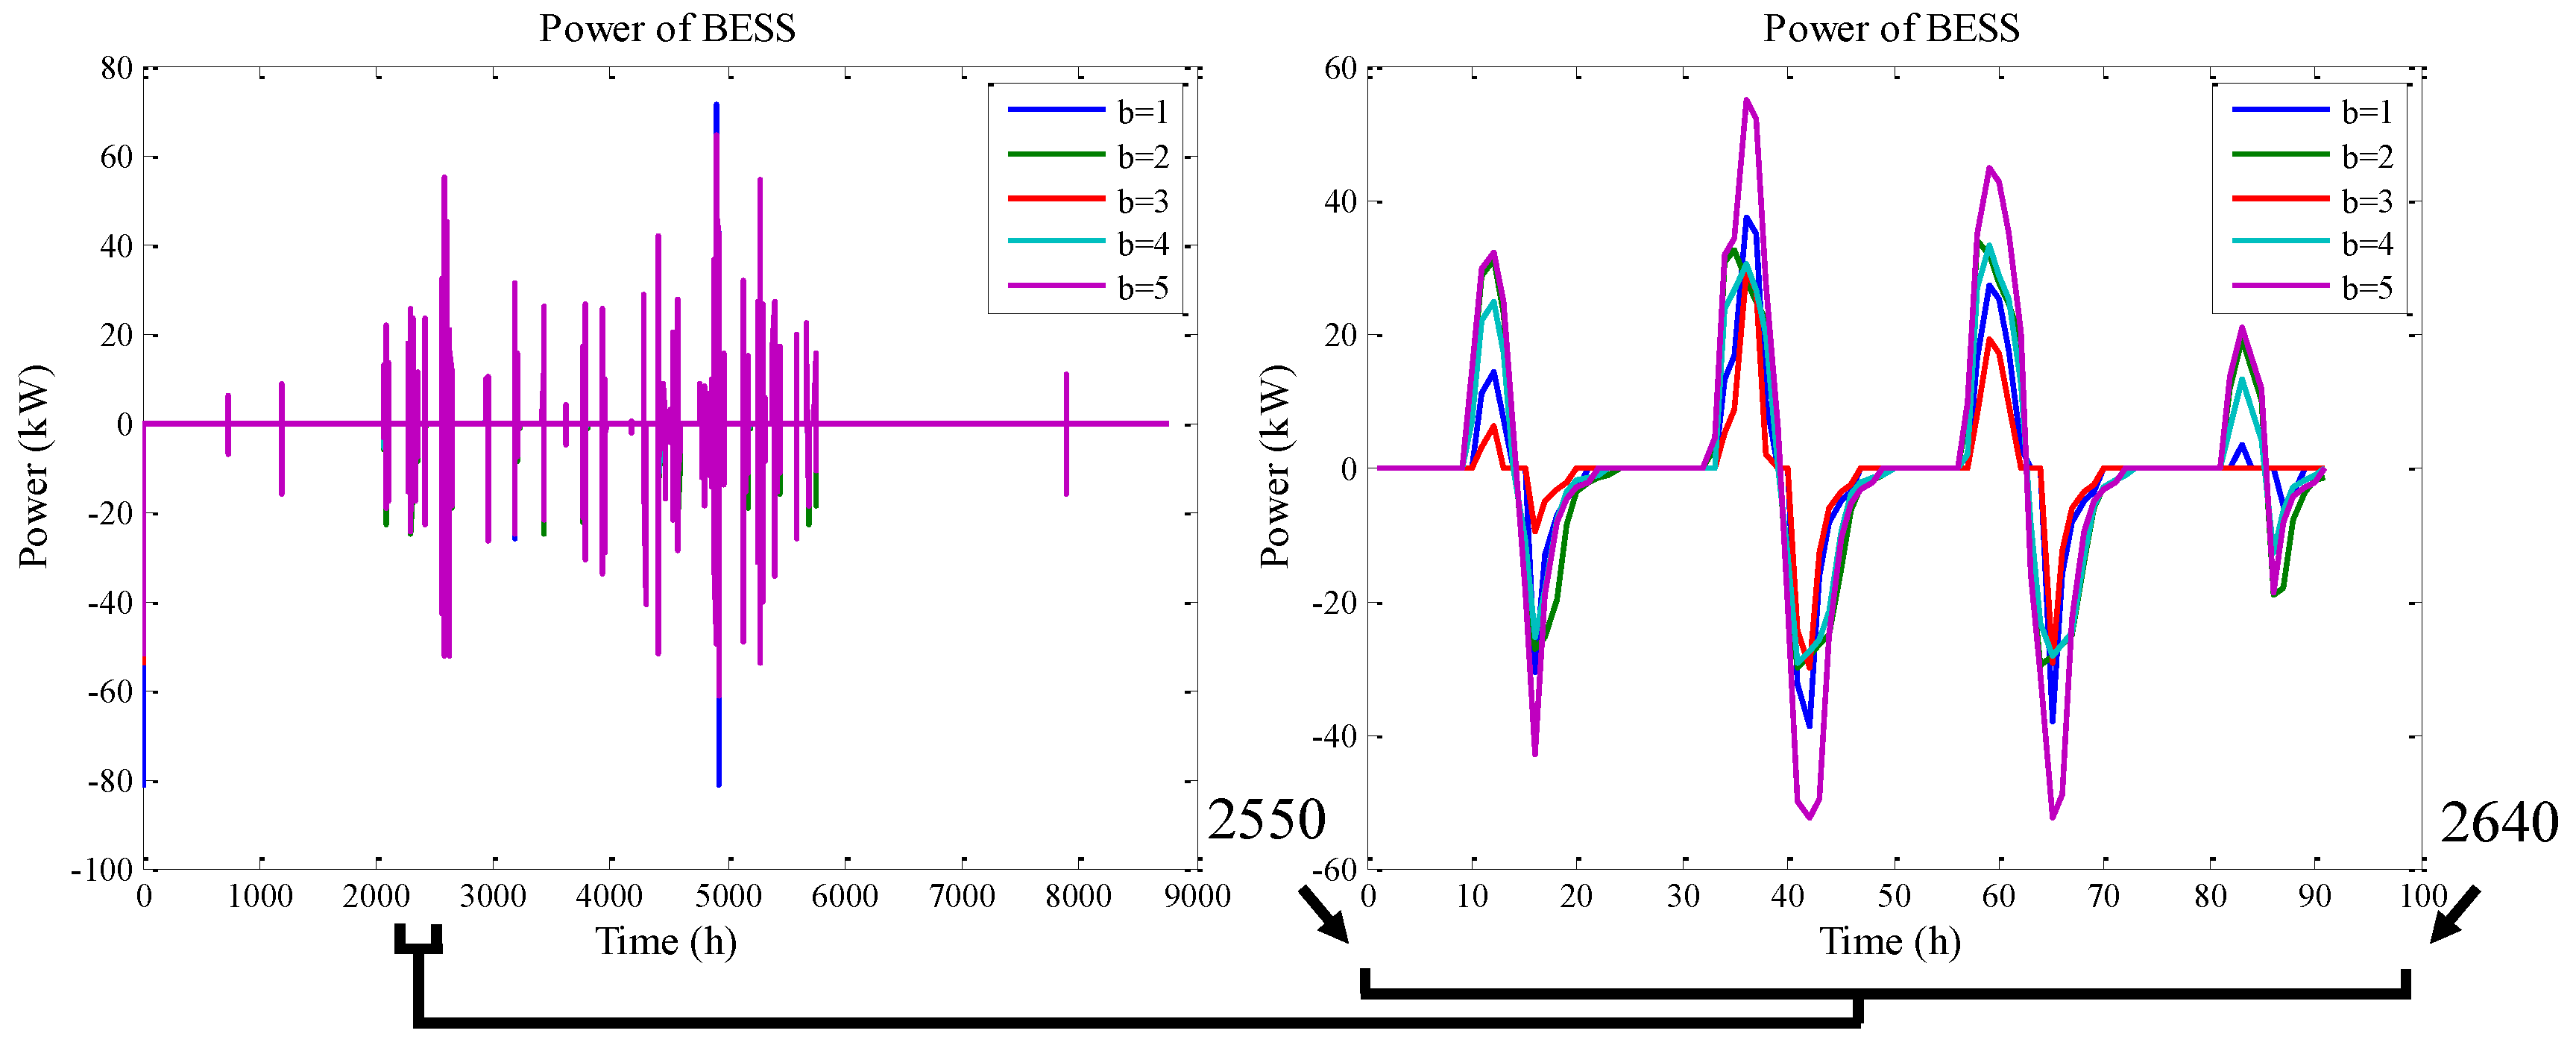
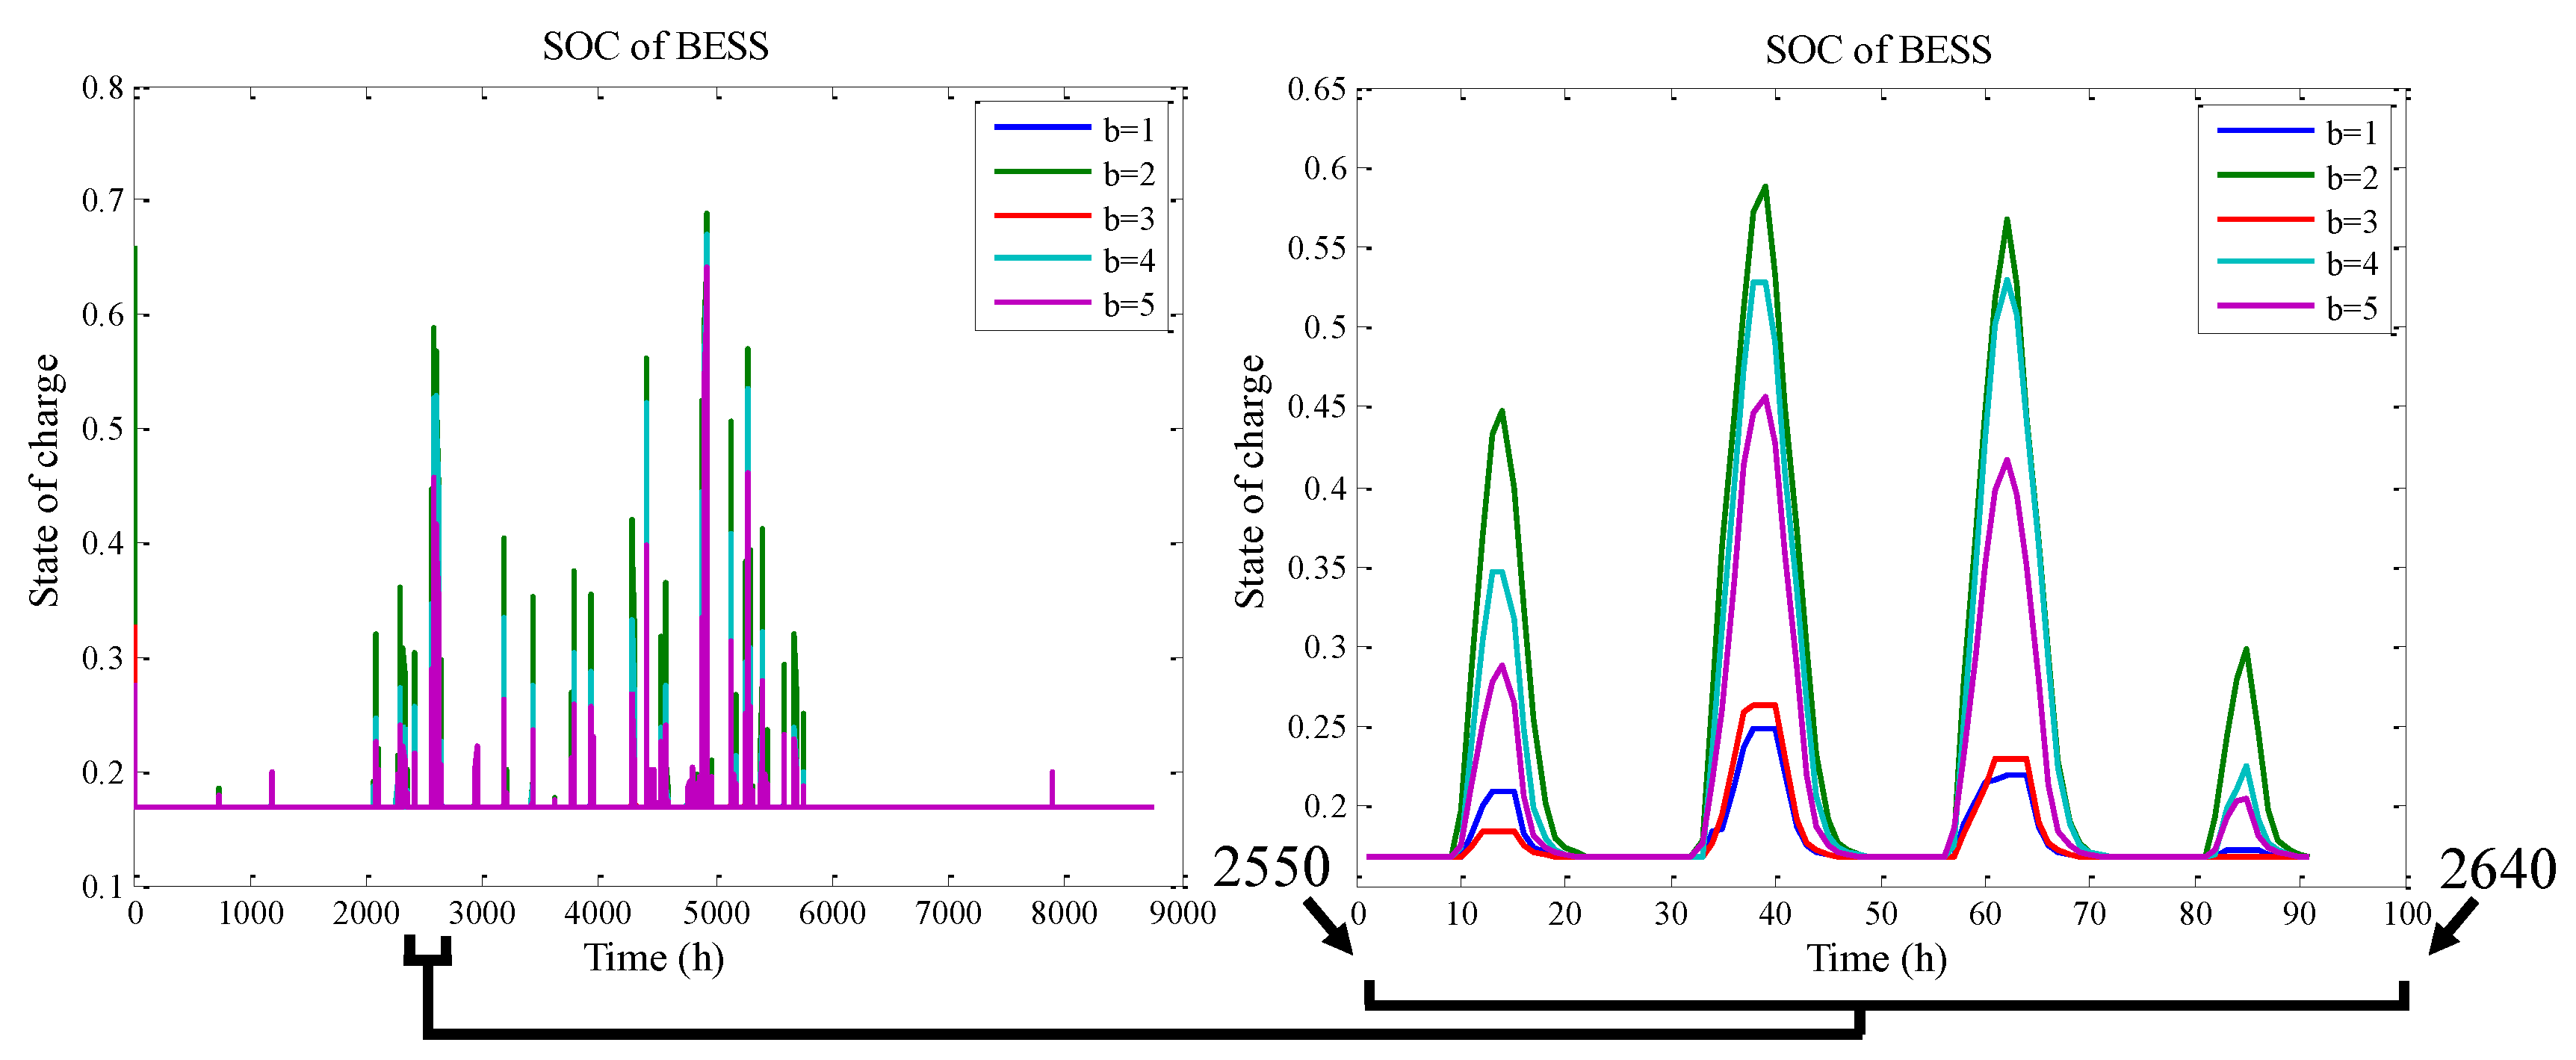
Figure 21 and Figure 22 describe the whole behaviour of distributed VRB. Figure 21 presents VRB power, and Figure 22 shows VRB SOC. On the right side of Figure 21, it is possible to observe how the cheapest BESS ( b   = 5) has the most important role due to its low selling price and its considerable high storing capacity ( N B ( 5 ) P   = 20). It is also possible to observe how the second BESS ( b   = 2) gets the highest SOC due to its low storing capacity ( N B ( 2 ) P =10) and its relatively low selling price.
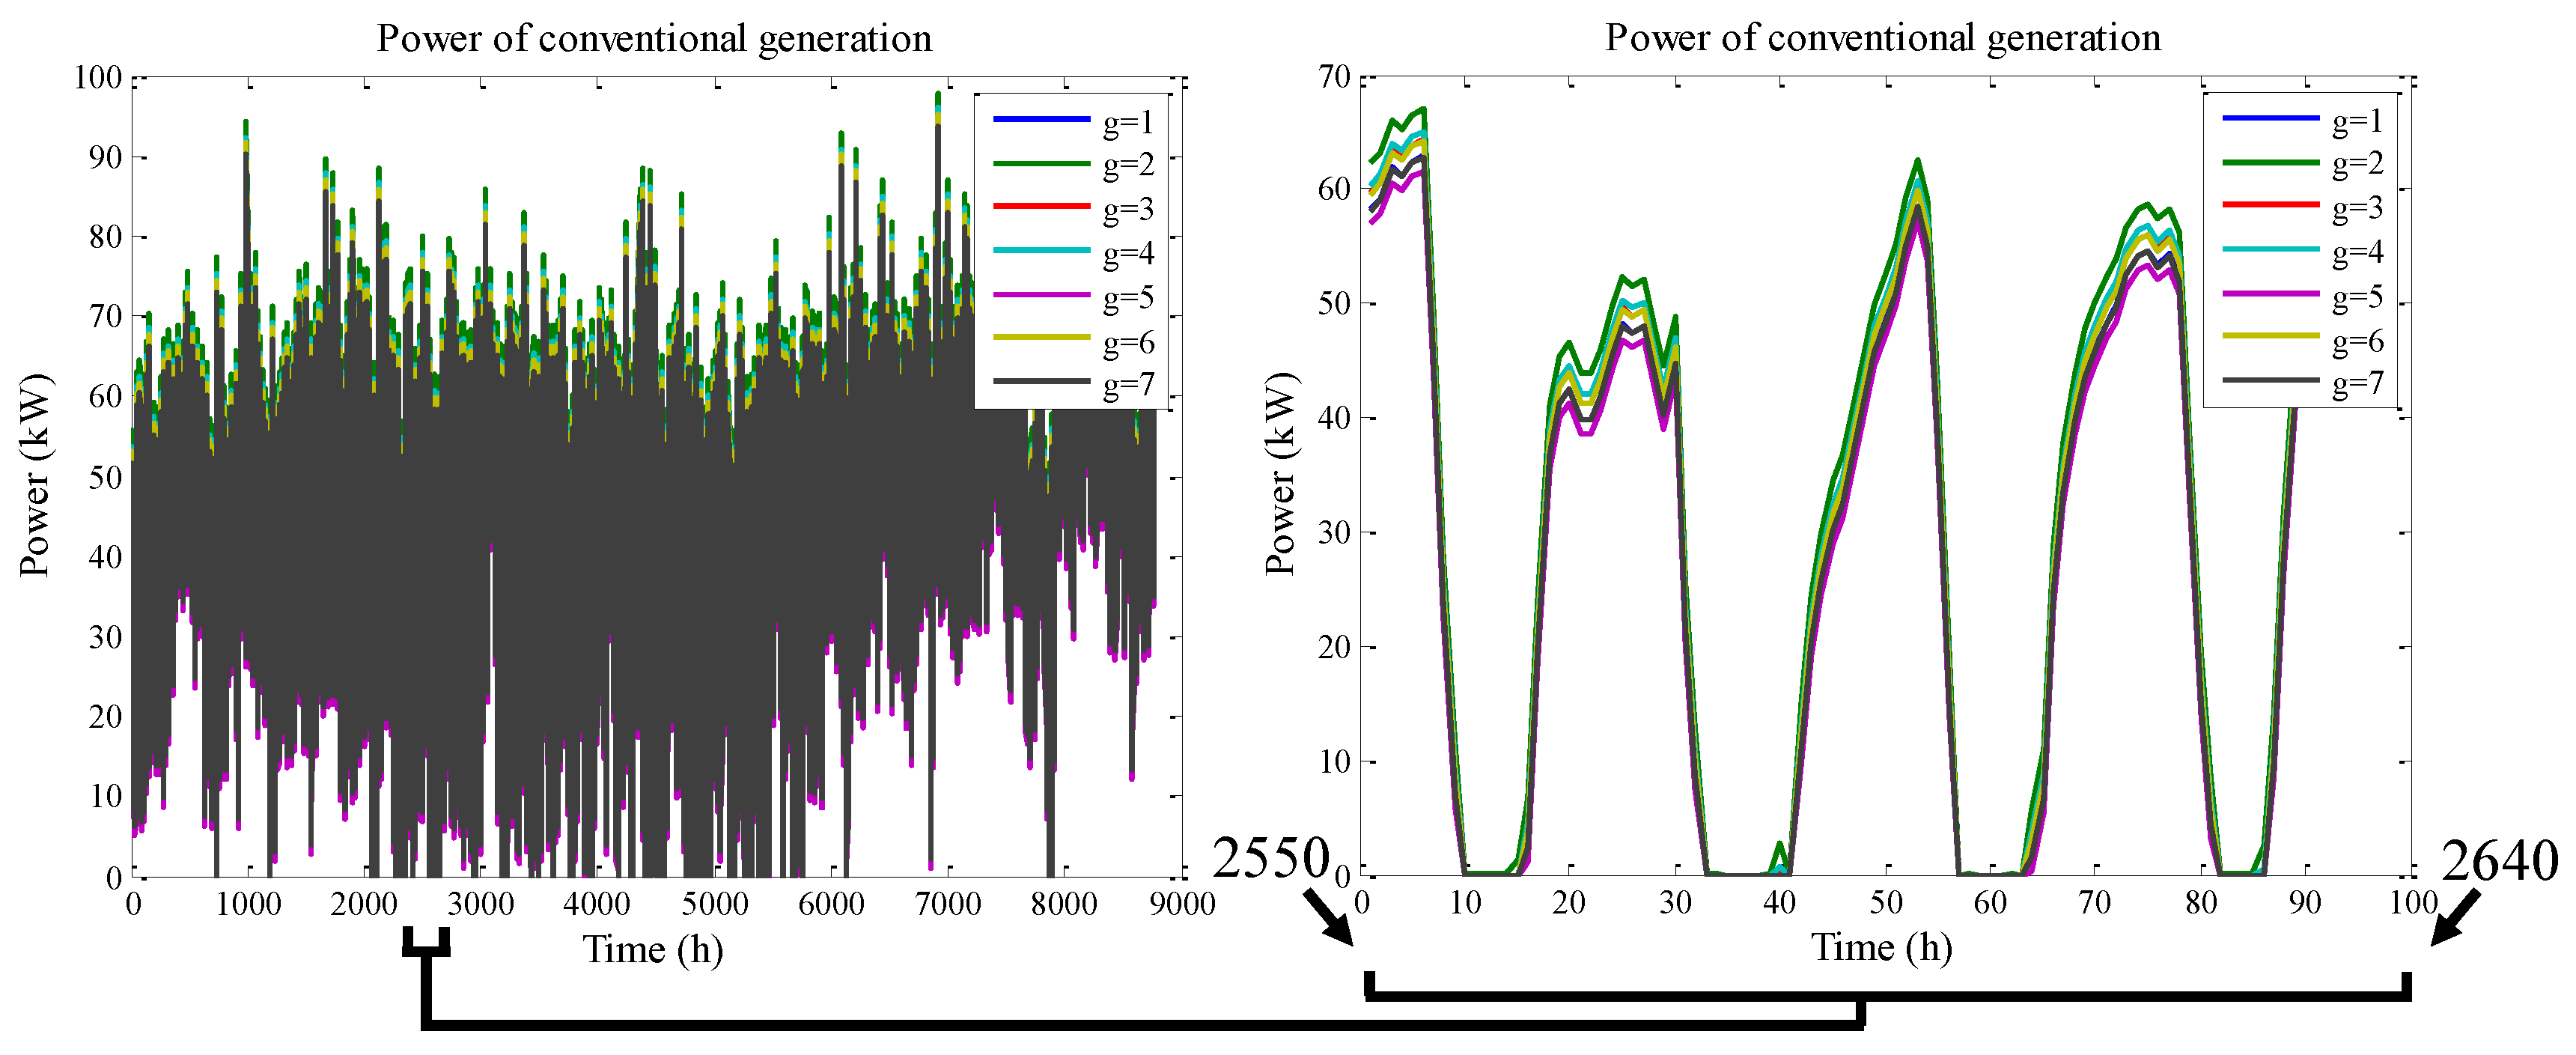
Finally, Figure 23 shows time series of a CG power dispatch, which illustrates how power generation is similarly shared around the cheapest units.

4.3. Case Study 3: Short-Term Autonomous MG Operation

In this subsection, short-term operation of the distributed HES is studied. In this case, a time step of 15 min ( Δ t   = 0.25 h) was considered. Power dispatch on an hourly basis requires a forecasting tool in four steps ahead of 15 min each. A forecasting tool can be based on time series analysis [30] so that historical data recorded by EMS can be used to accomplish new tasks.
For illustrative purposes, information publically available at [31] has been scaled according to the magnitudes previously presented in Table 3 and Table 4 for a typical day. In other words, renewable power and load time series of 24 h with a step of 0.25 h were artificially created for simulation purposes; each series has 96 values.
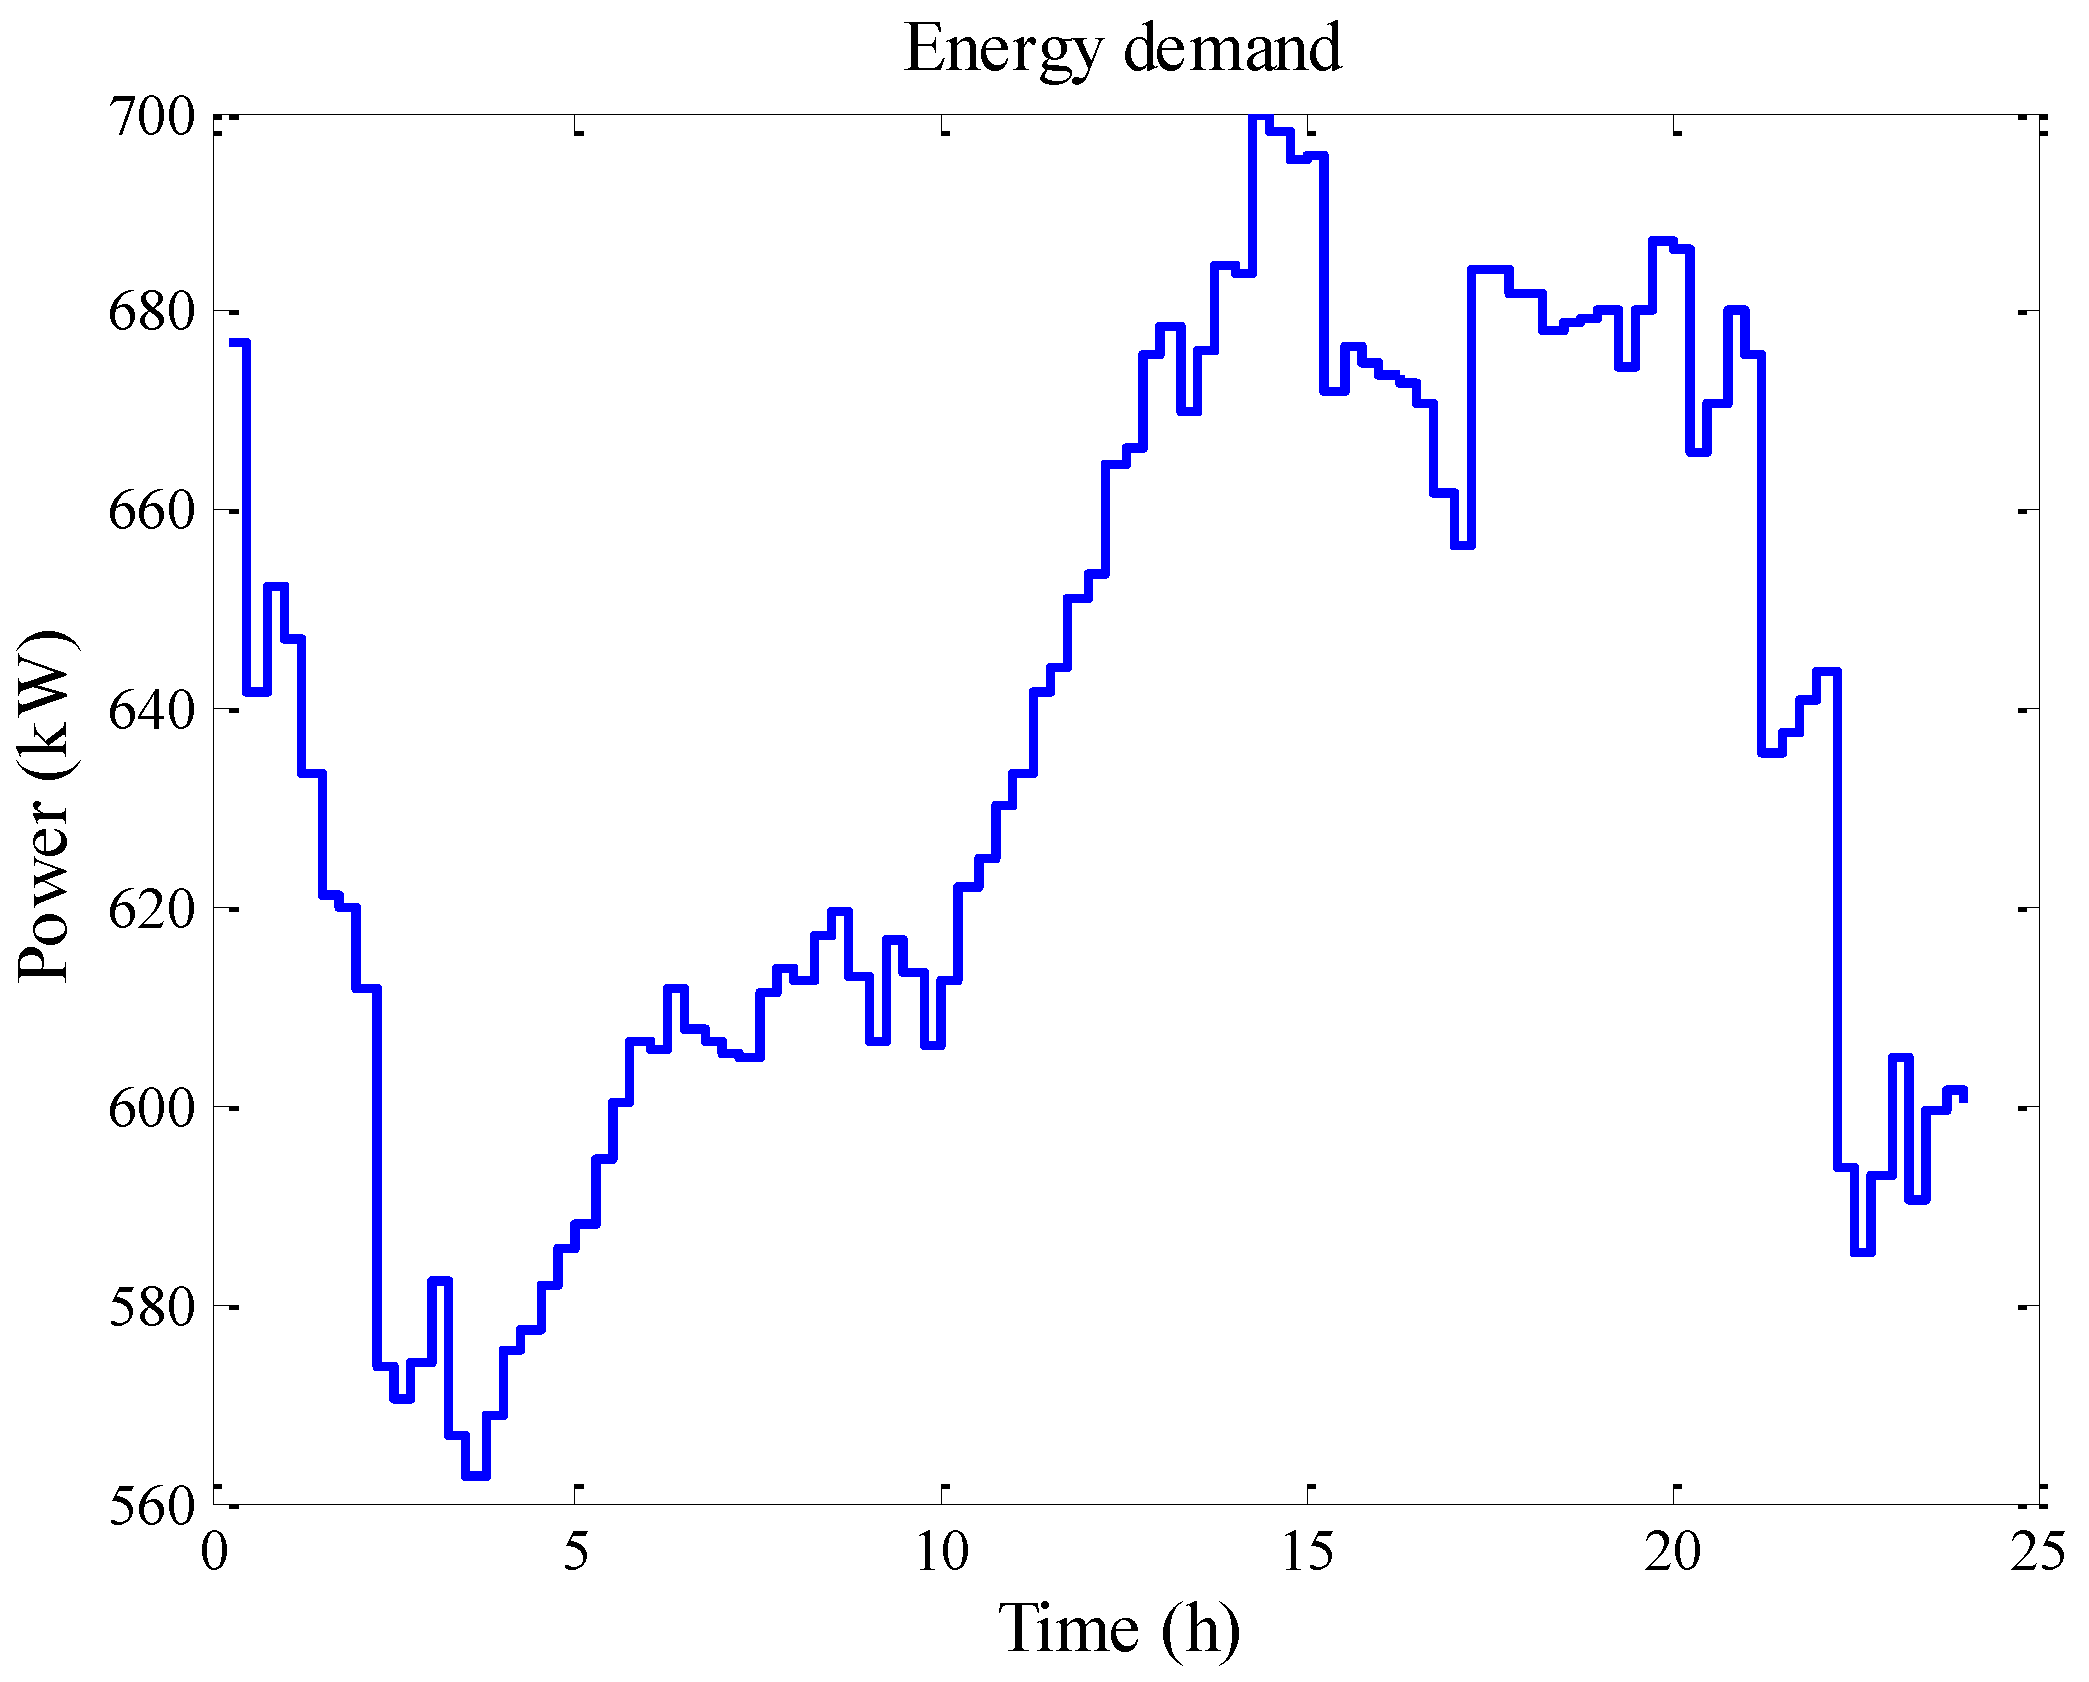
Figure 24 shows load time series of MG under analysis. It is supposed to be the result of a determined forecasting process applied to get a one-hour prediction (four steps ahead) that works 24 h of a typical day. The load series was created by scaling to a maximum value of 700 kVA and power factor close to 1. Figure 25 presents PV and wind generation time series artificially created as previously mentioned.
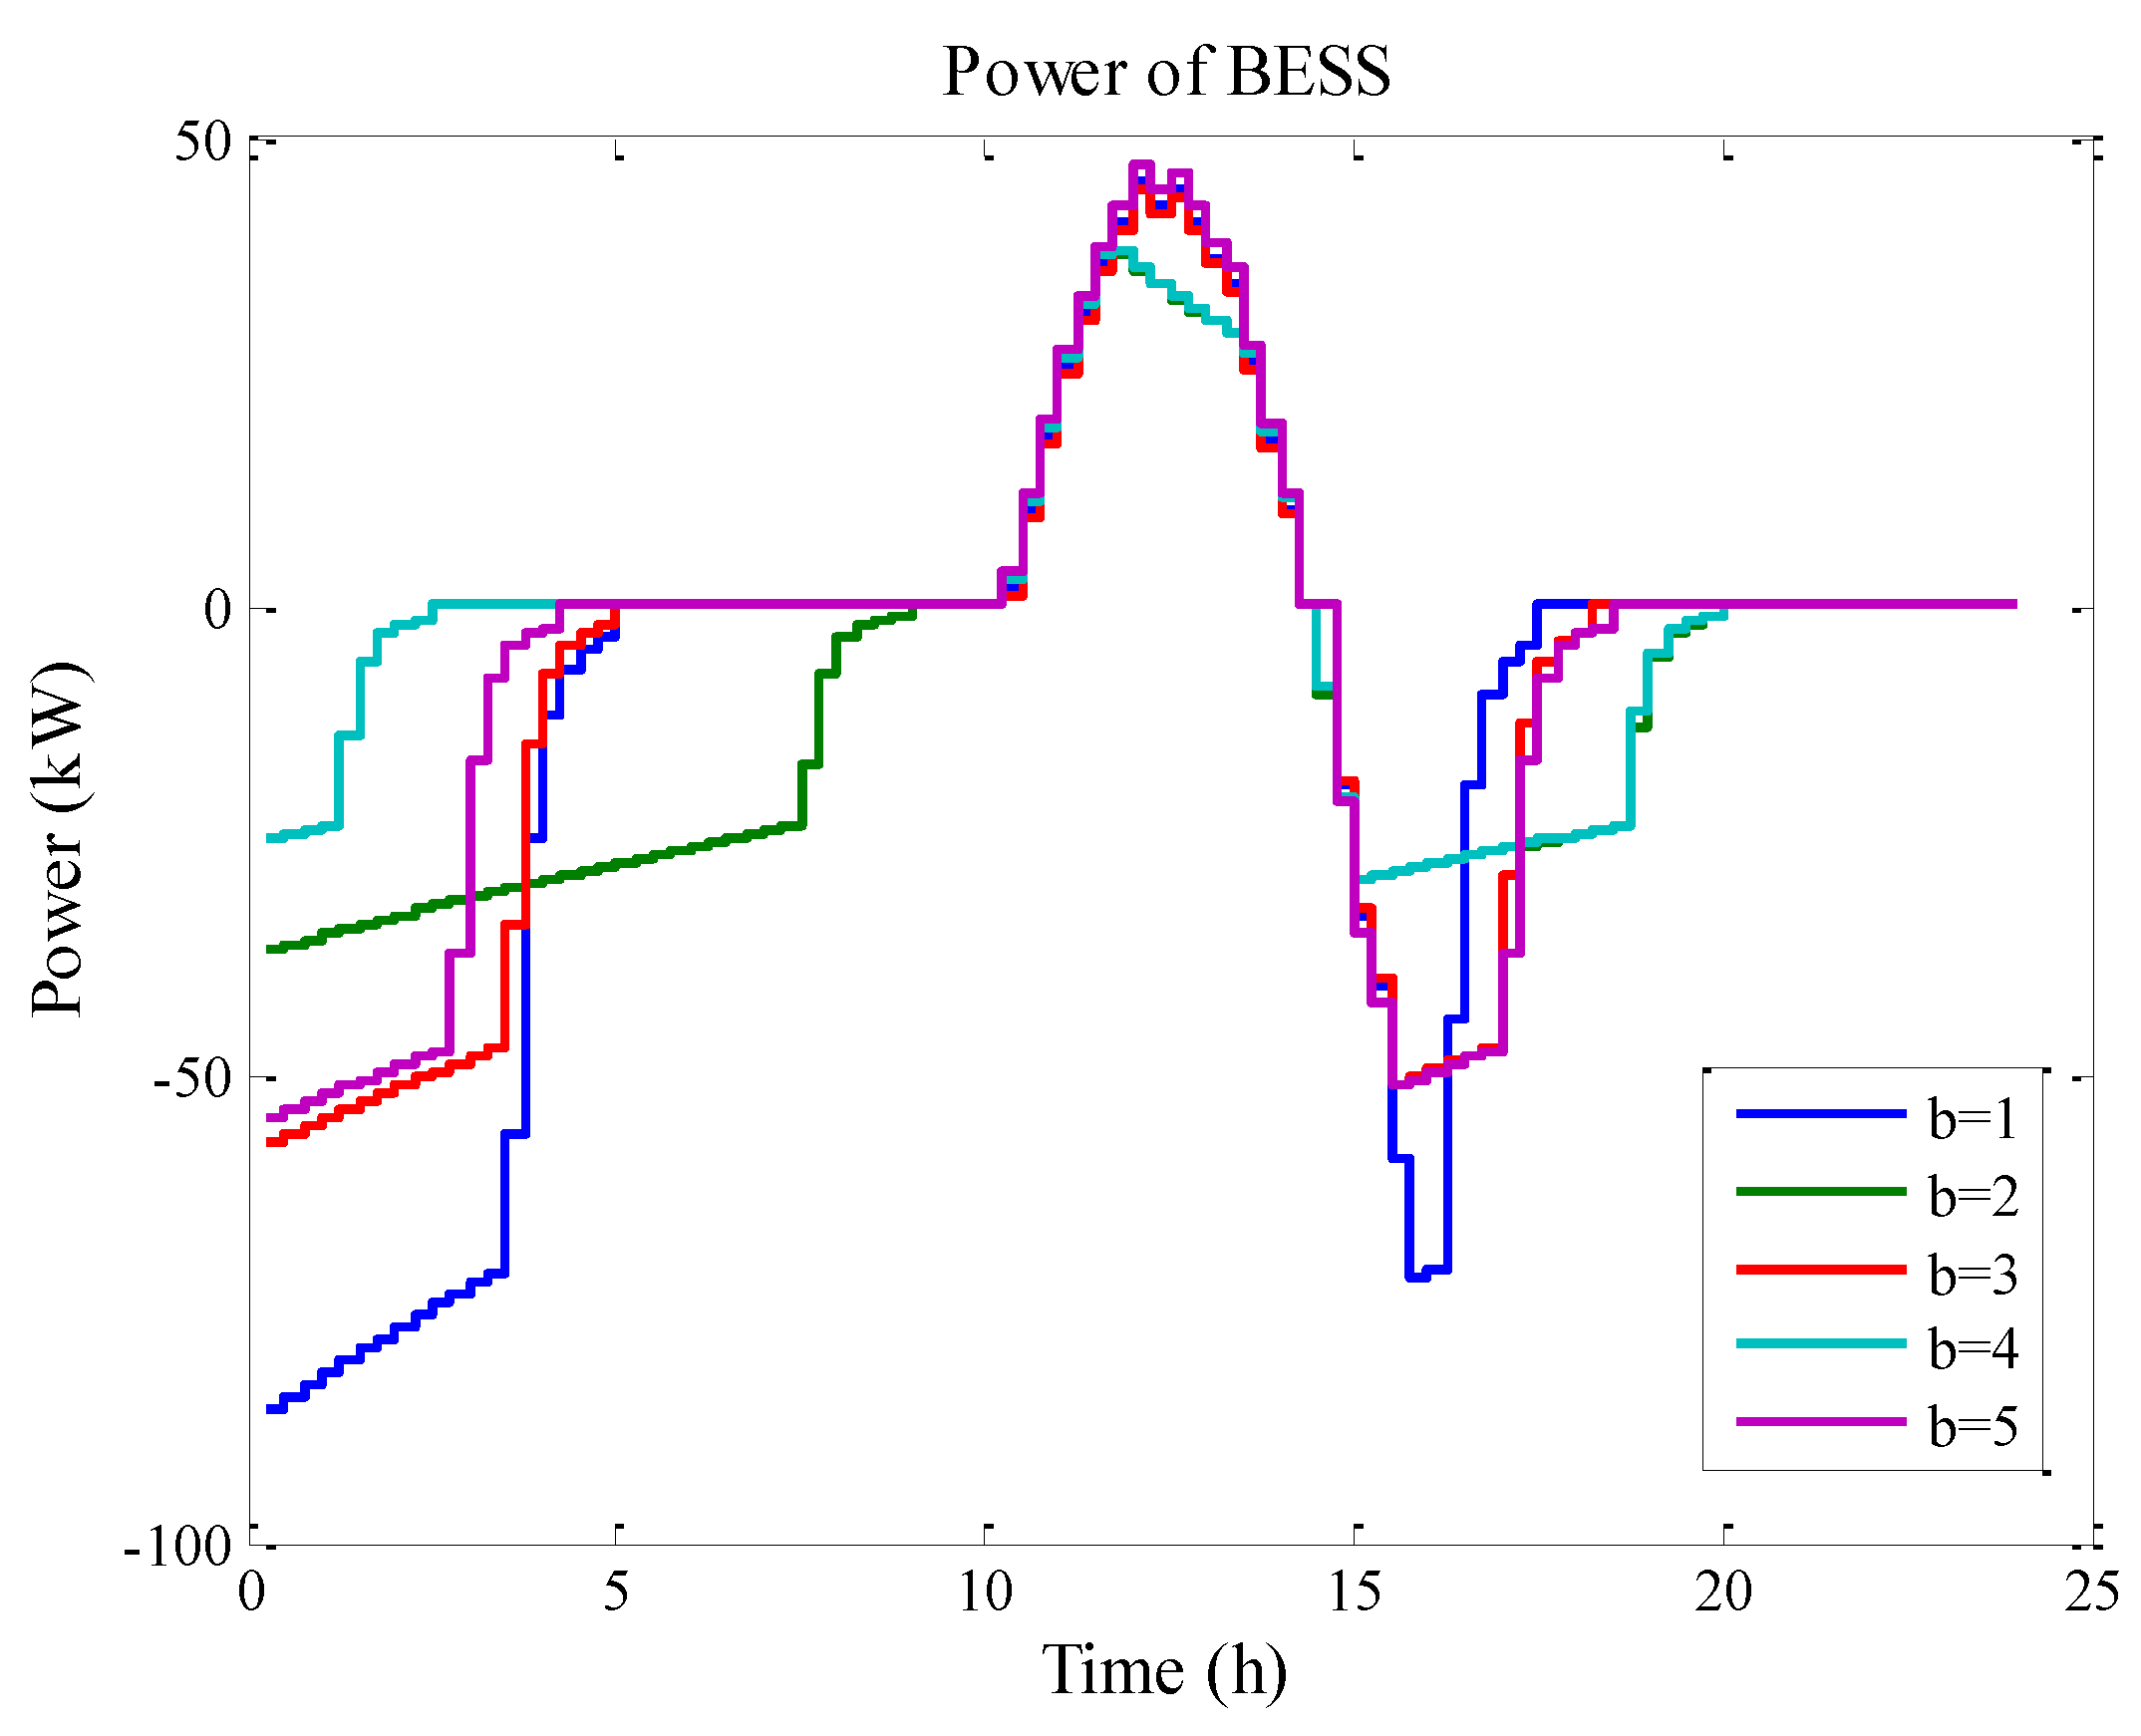
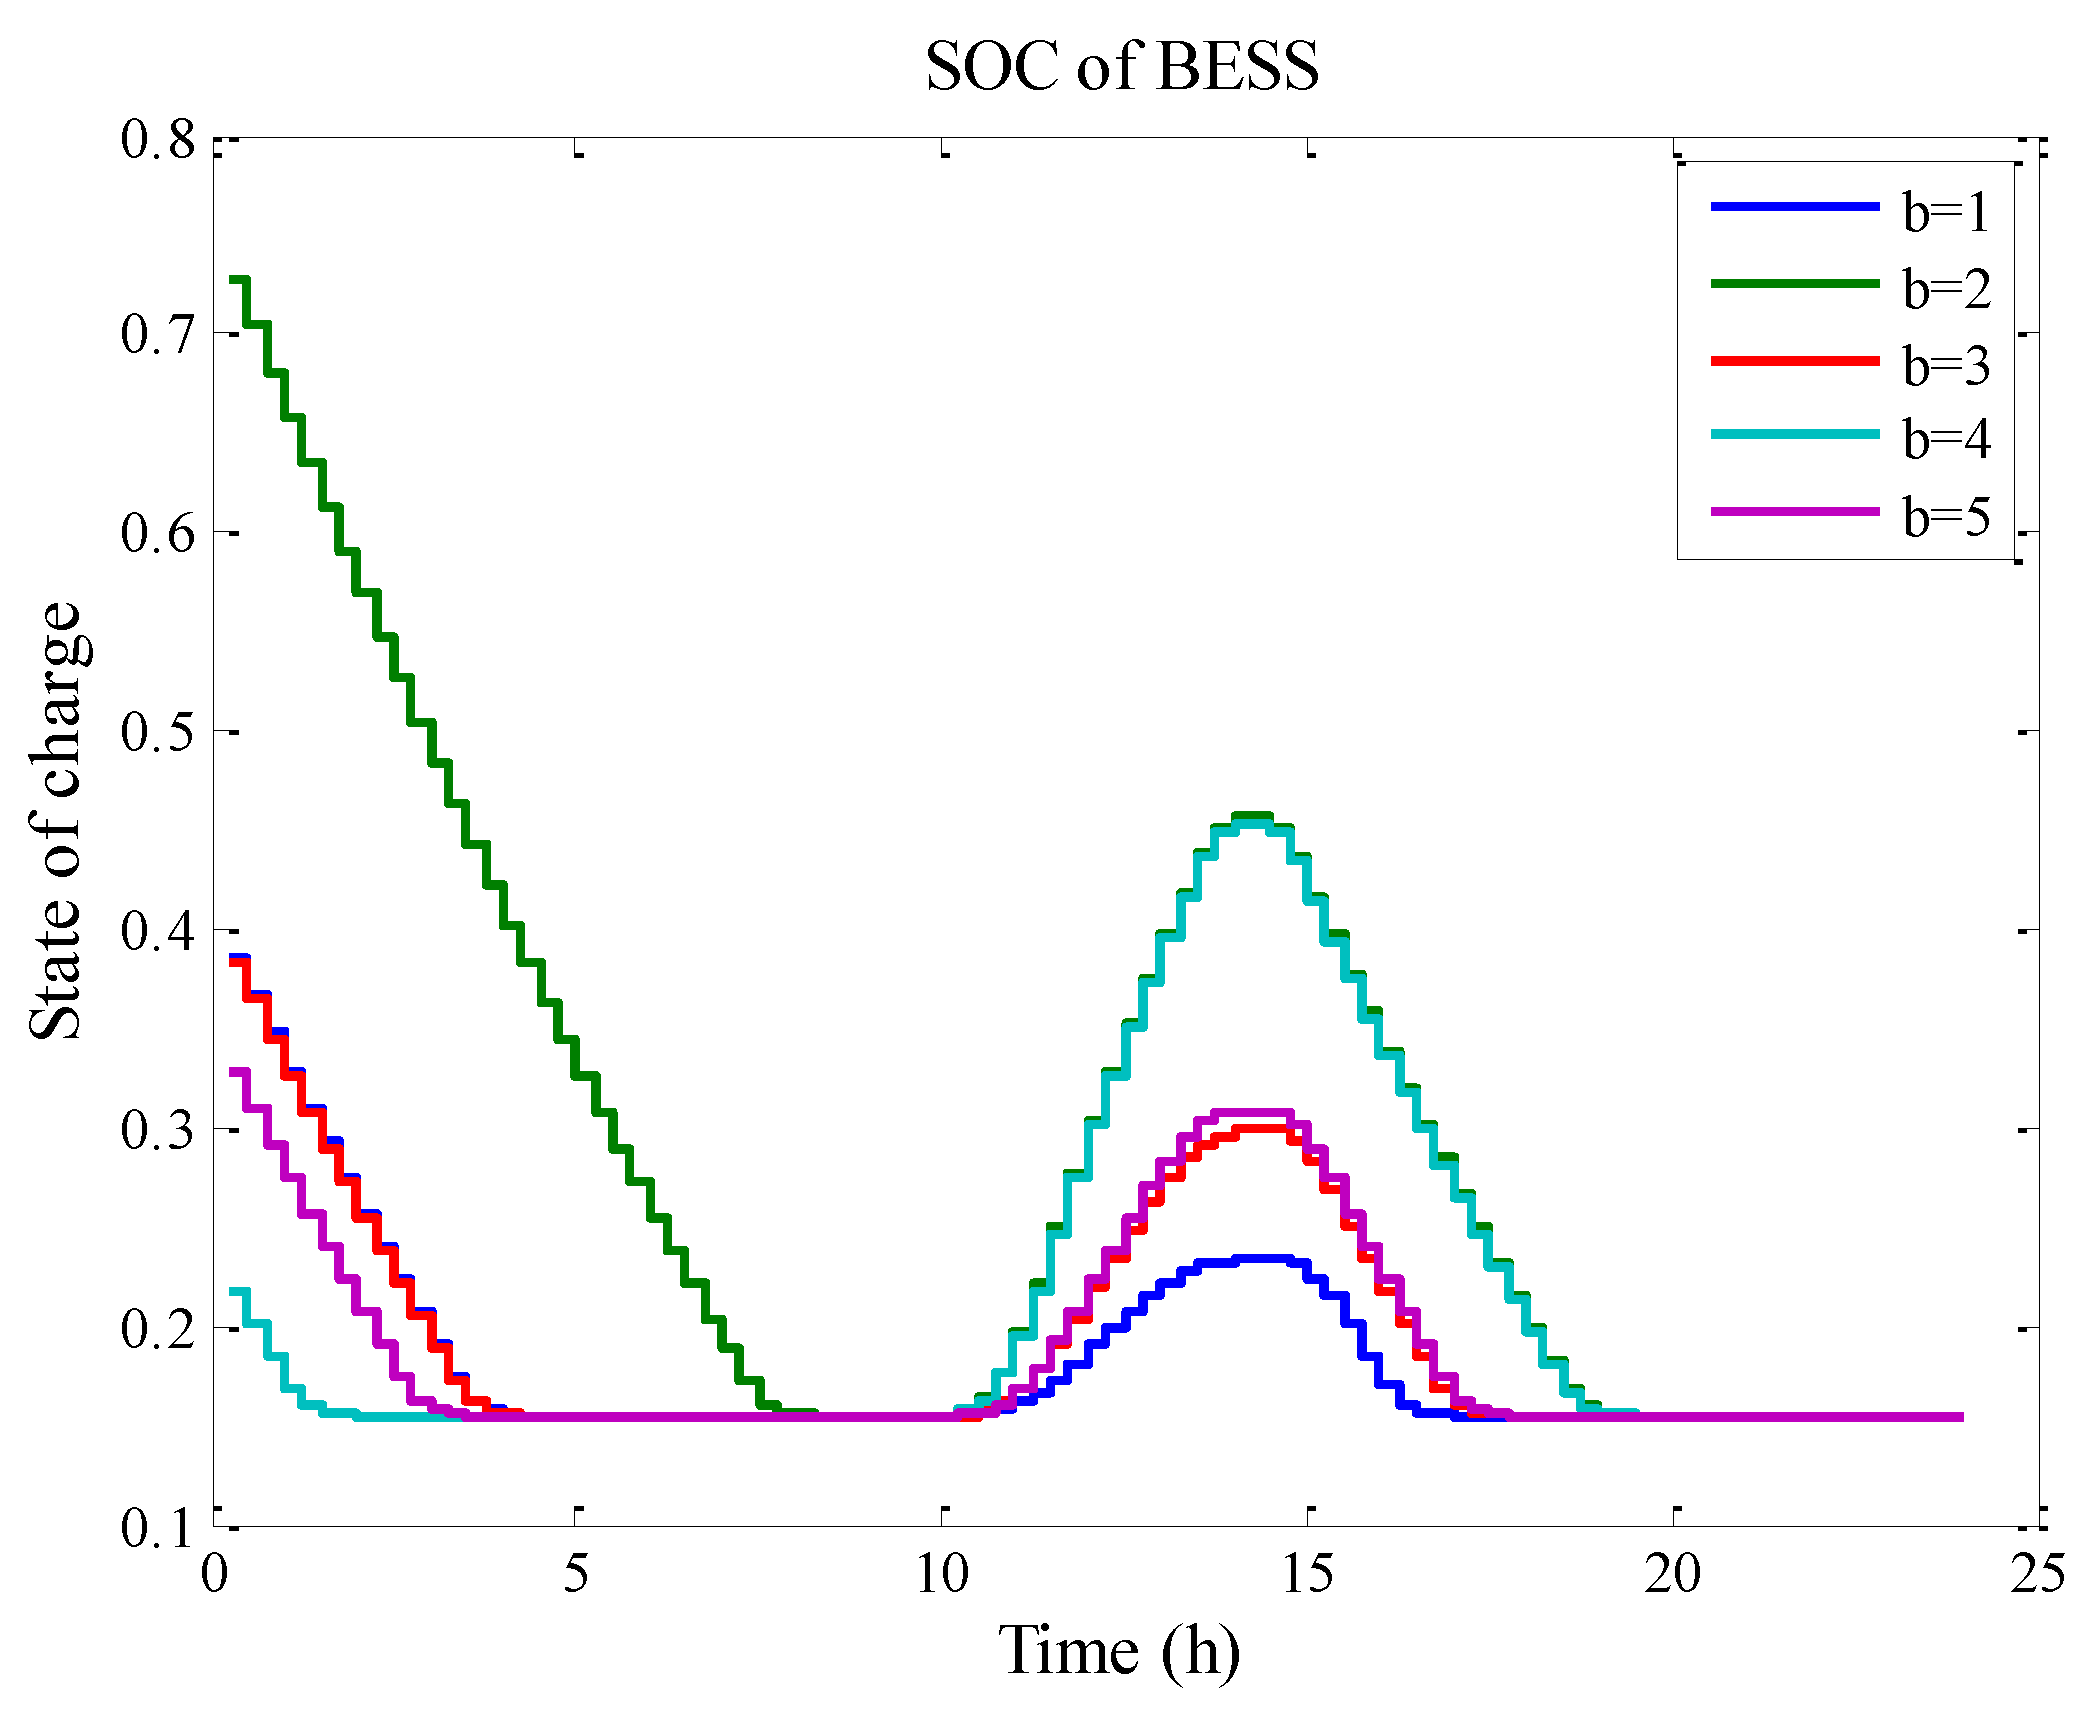
Figure 26 and Figure 27 show the simulation of VRB in terms of power and SOC, respectively. According to these results, the VRB operation is highly influenced by the behaviour of renewable generation, especially PV.
Initially, VRB should be discharged to reduce the load demand jointly with wind generation. Excess PV generation leads VRB to be continuously charged. It can be observed that the relationship between the energy prices and storing capacities is similar to those previously discussed in Section 4.2 (Case study 2).
Finally, Figure 28 shows how CGs work at similar power production due to their similarities in electricity prices (Table 6) established by their corresponding owners.

4.4. Vulnerability Assessment of Autonomous MG

In this subsection, the vulnerability [32] of MG configuration of Figure 4 is analysed. Specifically, CIs shown in Figure 9 and Figure 11 have been used to evaluate the vulnerability of the whole system against contingencies intentionally created (CIC) on the renewable and CG subsystems, respectively. Failures or contingencies in the distributed BESS layer have not been considered in this study.
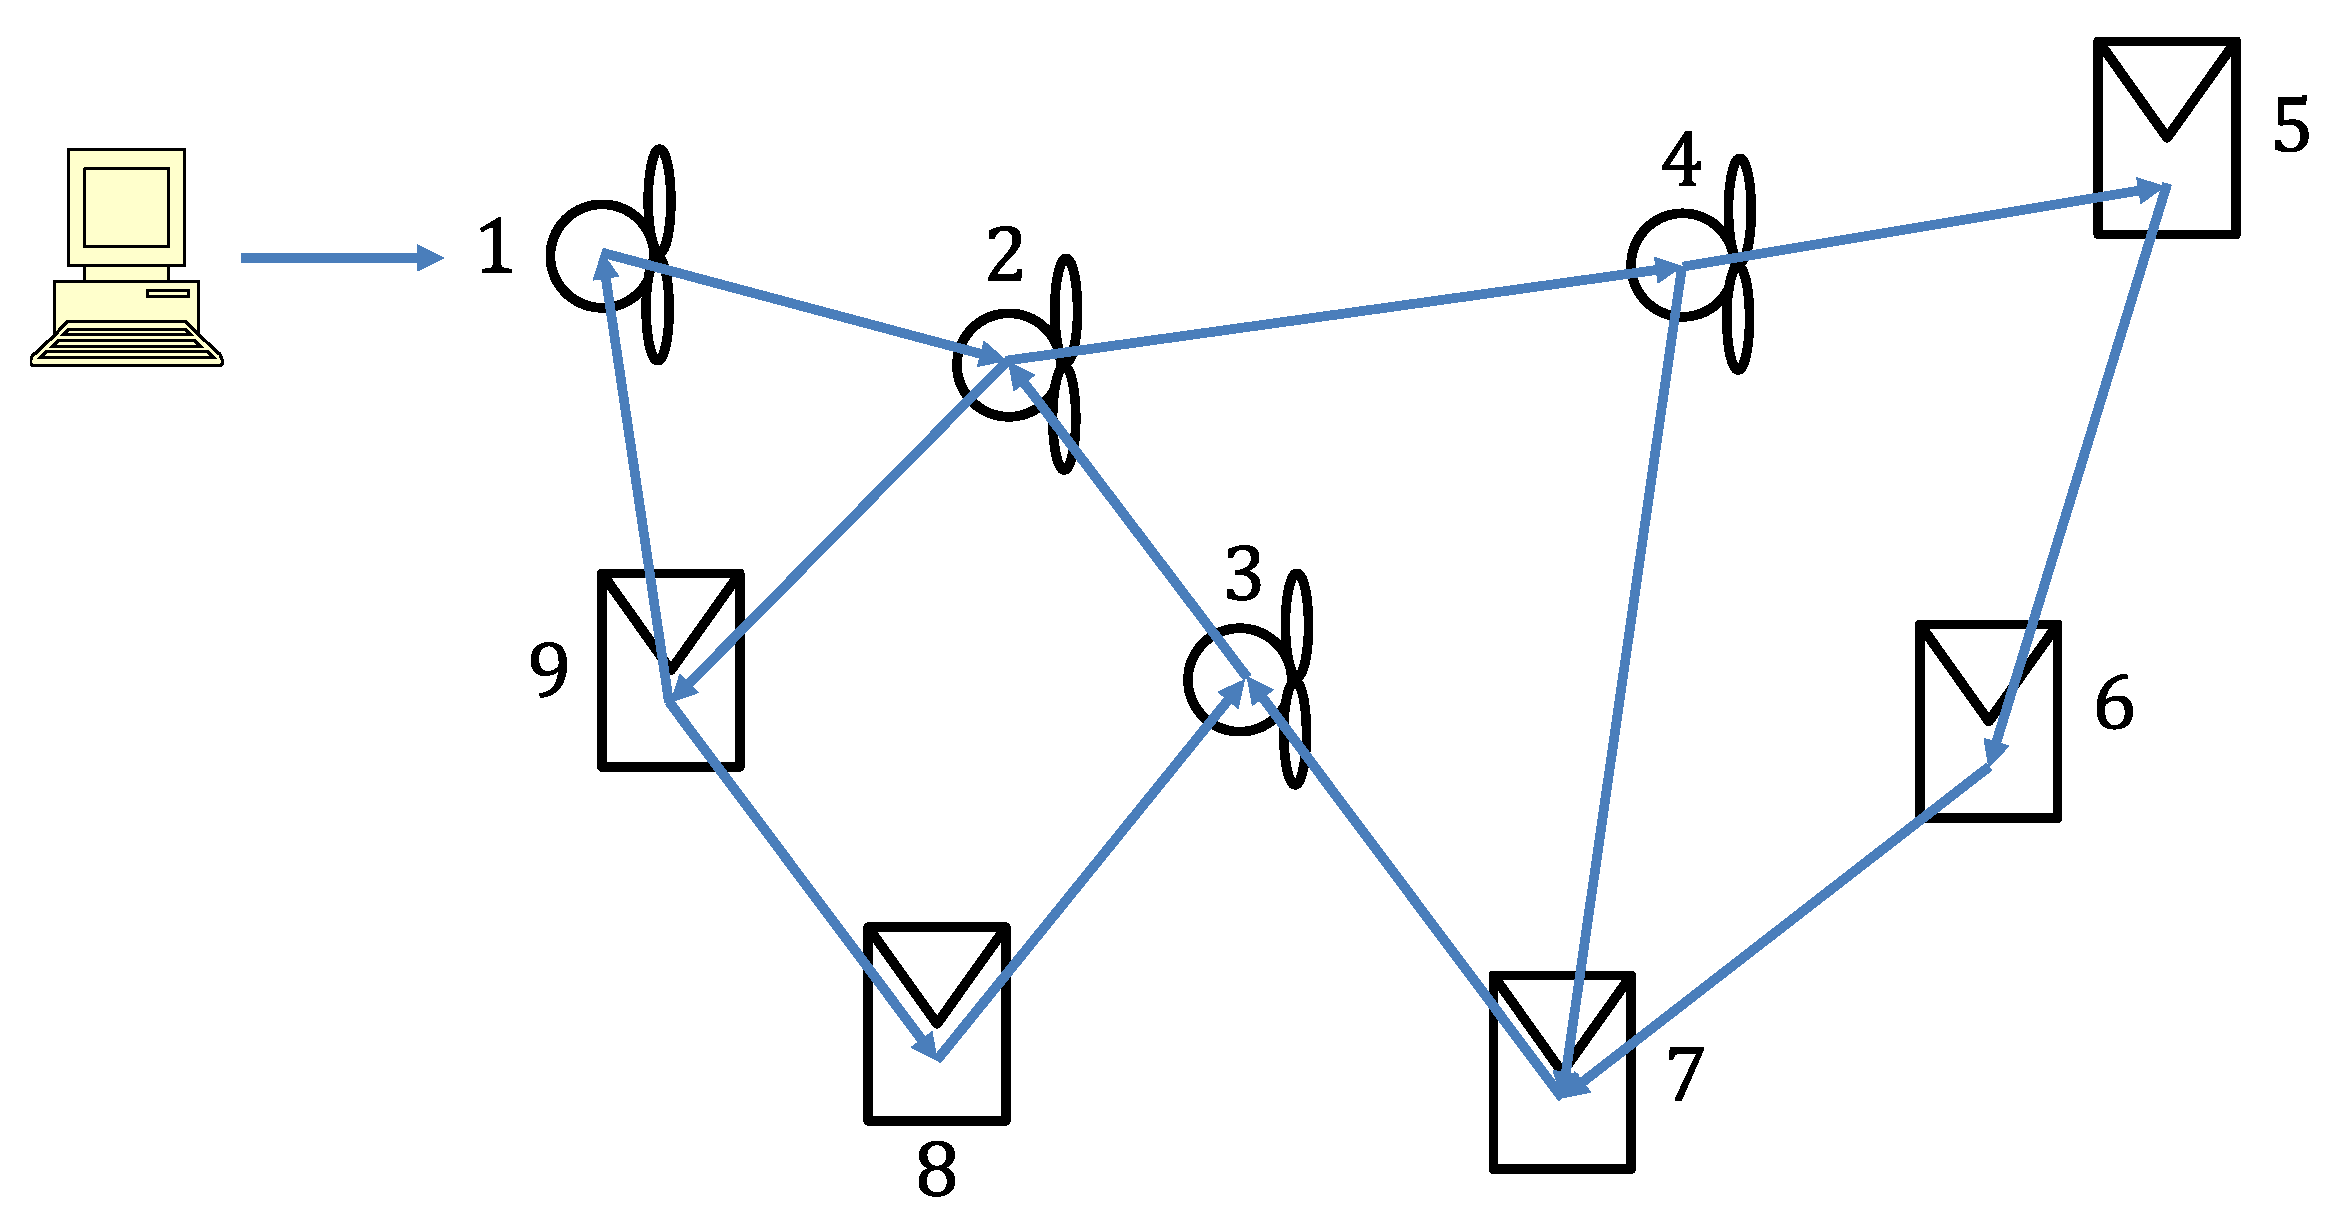
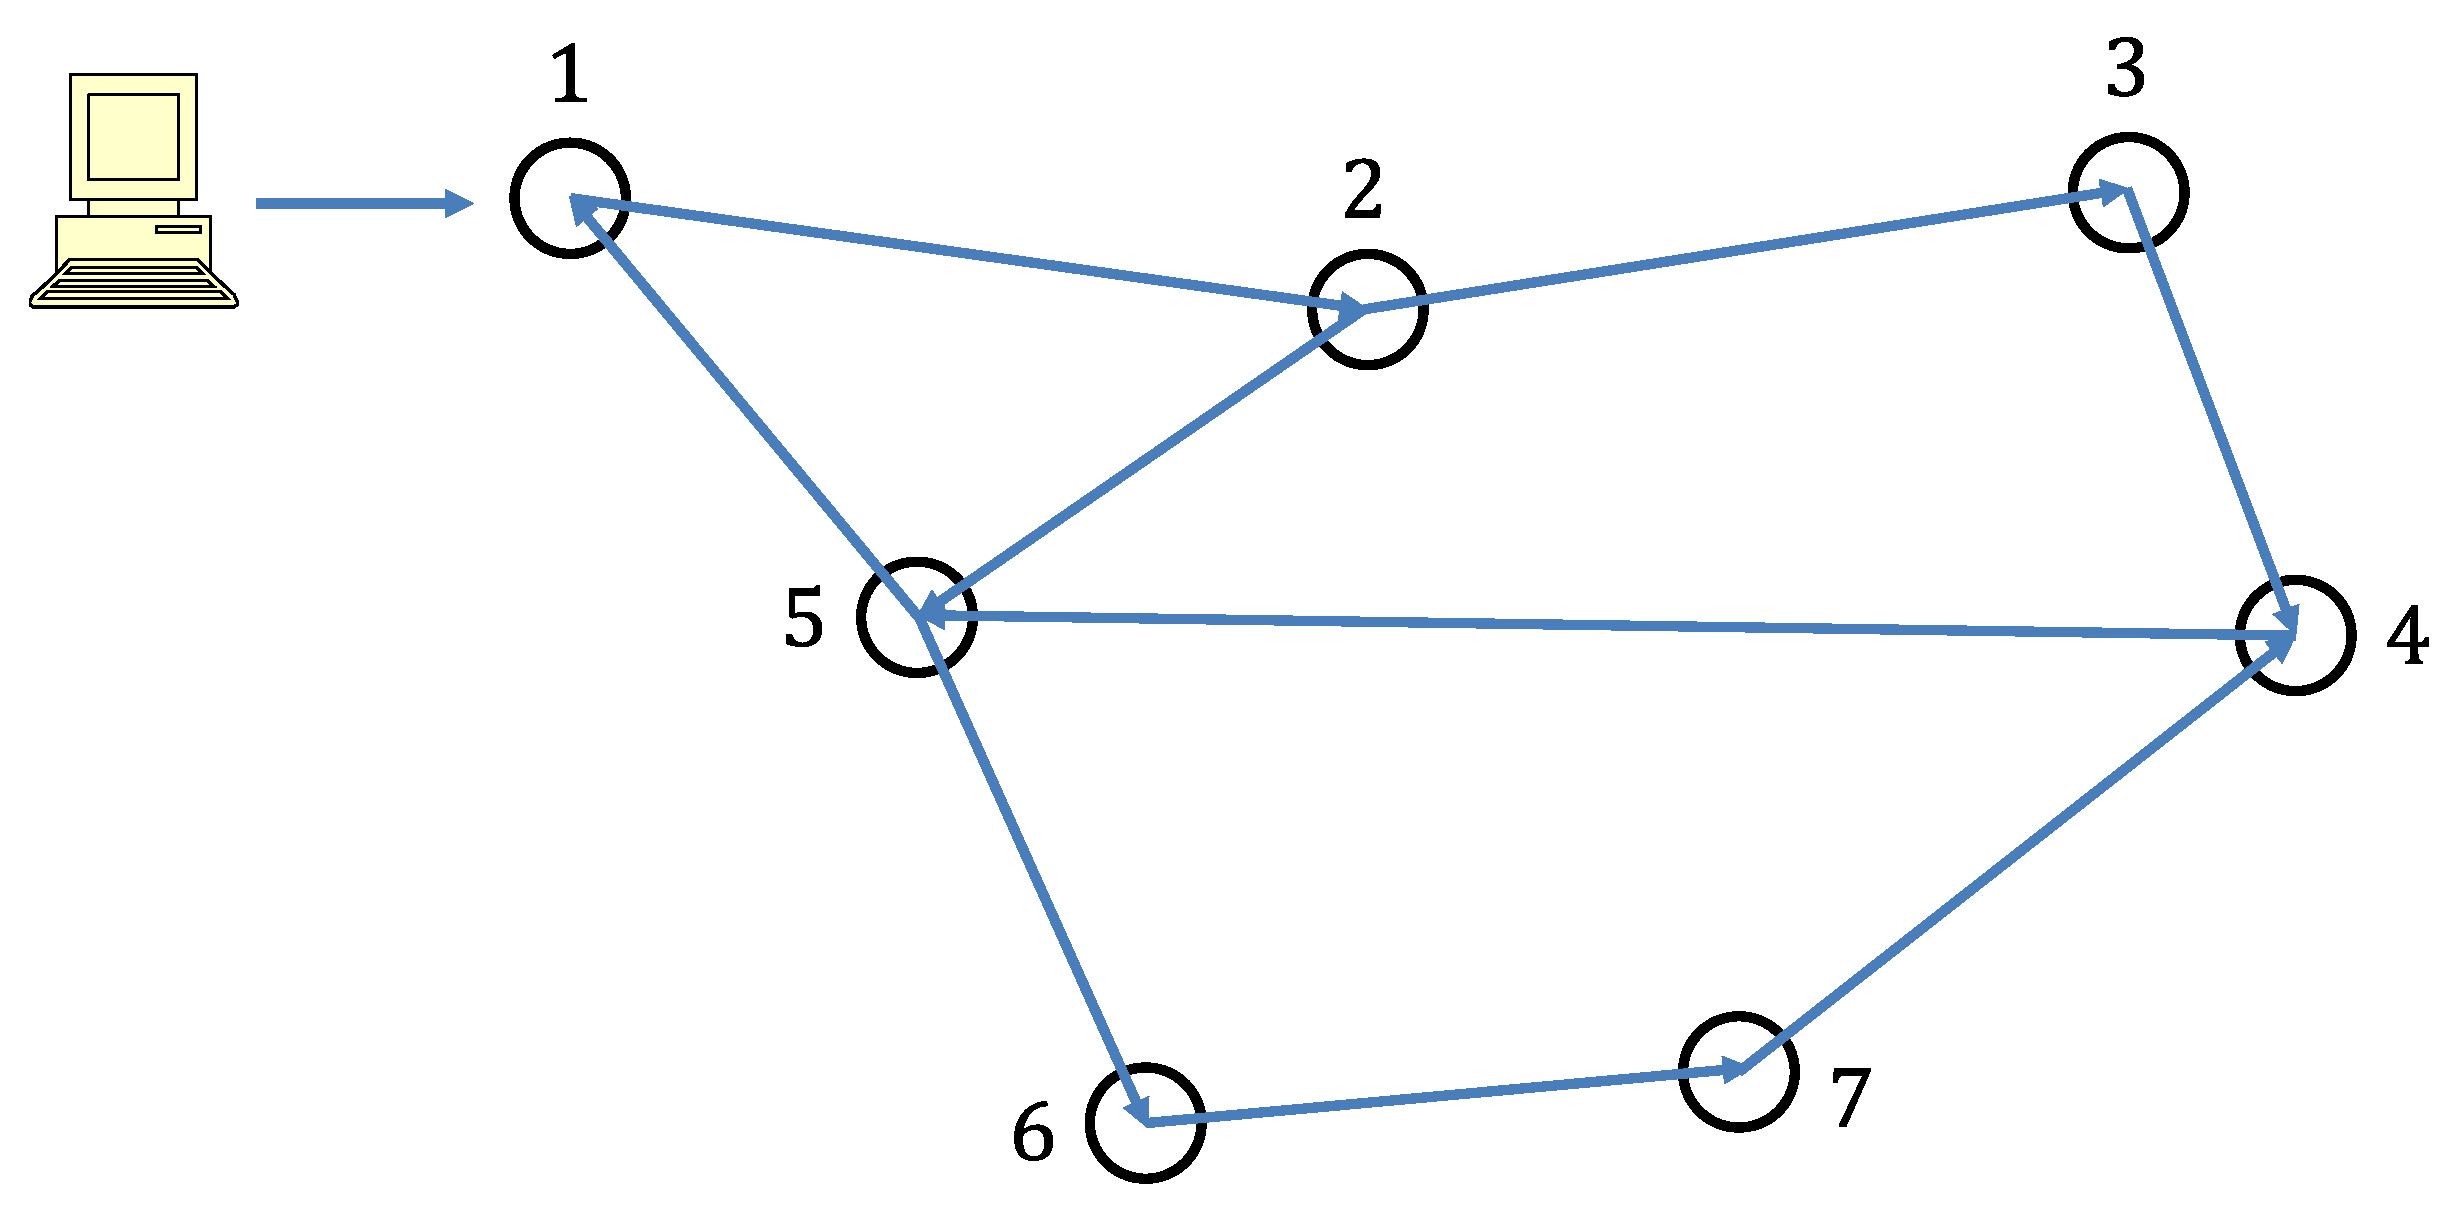
In this regard, Figure 29 and Figure 30 explain how the contingencies were treated. First, vertex 1 of each CI was assumed to be the command vertex, which receives information from EMS. Through this vertex, the load demand at each time instant is reported to each layer.
Once any edge is removed from CI, those vertices directly connected to the command vertex (vertex 1) are assumed to be active and consequently under the control of EMS. Contrarily, those vertices out of the compass of the command vertex are supposed to be offline (inactive). After all CICs are realized, information is exchanged among active vertices forming a ring. This is done because a strongly connected directed graph is required for solving EDP by CA. Finally, EDP is solved by following the procedure explained in Section 3, just considering the active vertices.
At the left side of Figure 29, edges between vertices 2 and 4, 4 and 7, 6 and 7, and 5 and 6 have been removed from the CI of renewable generation. Under this scenario, vertices 4, 5, and 6 are inactive, while vertices 1, 2, 3, 7, 8, and 9 remain connected to the command vertex (vertex 1). At the right side of Figure 29, it is observed how the information is changed according to a ring topology, as previously explained.
At the left side of Figure 30, edges between vertices 2 and 3, 4 and 5, 5 and 6, and 6 and 7 have been removed from the CI of the CG. Under this context, vertices 3, 4, 6, and 7 are inactive, while vertices 1, 2, and 5 remain connected to the command vertex (vertex 1). At the right side of Figure 30, it is observed how the information in changed according to a ring topology.
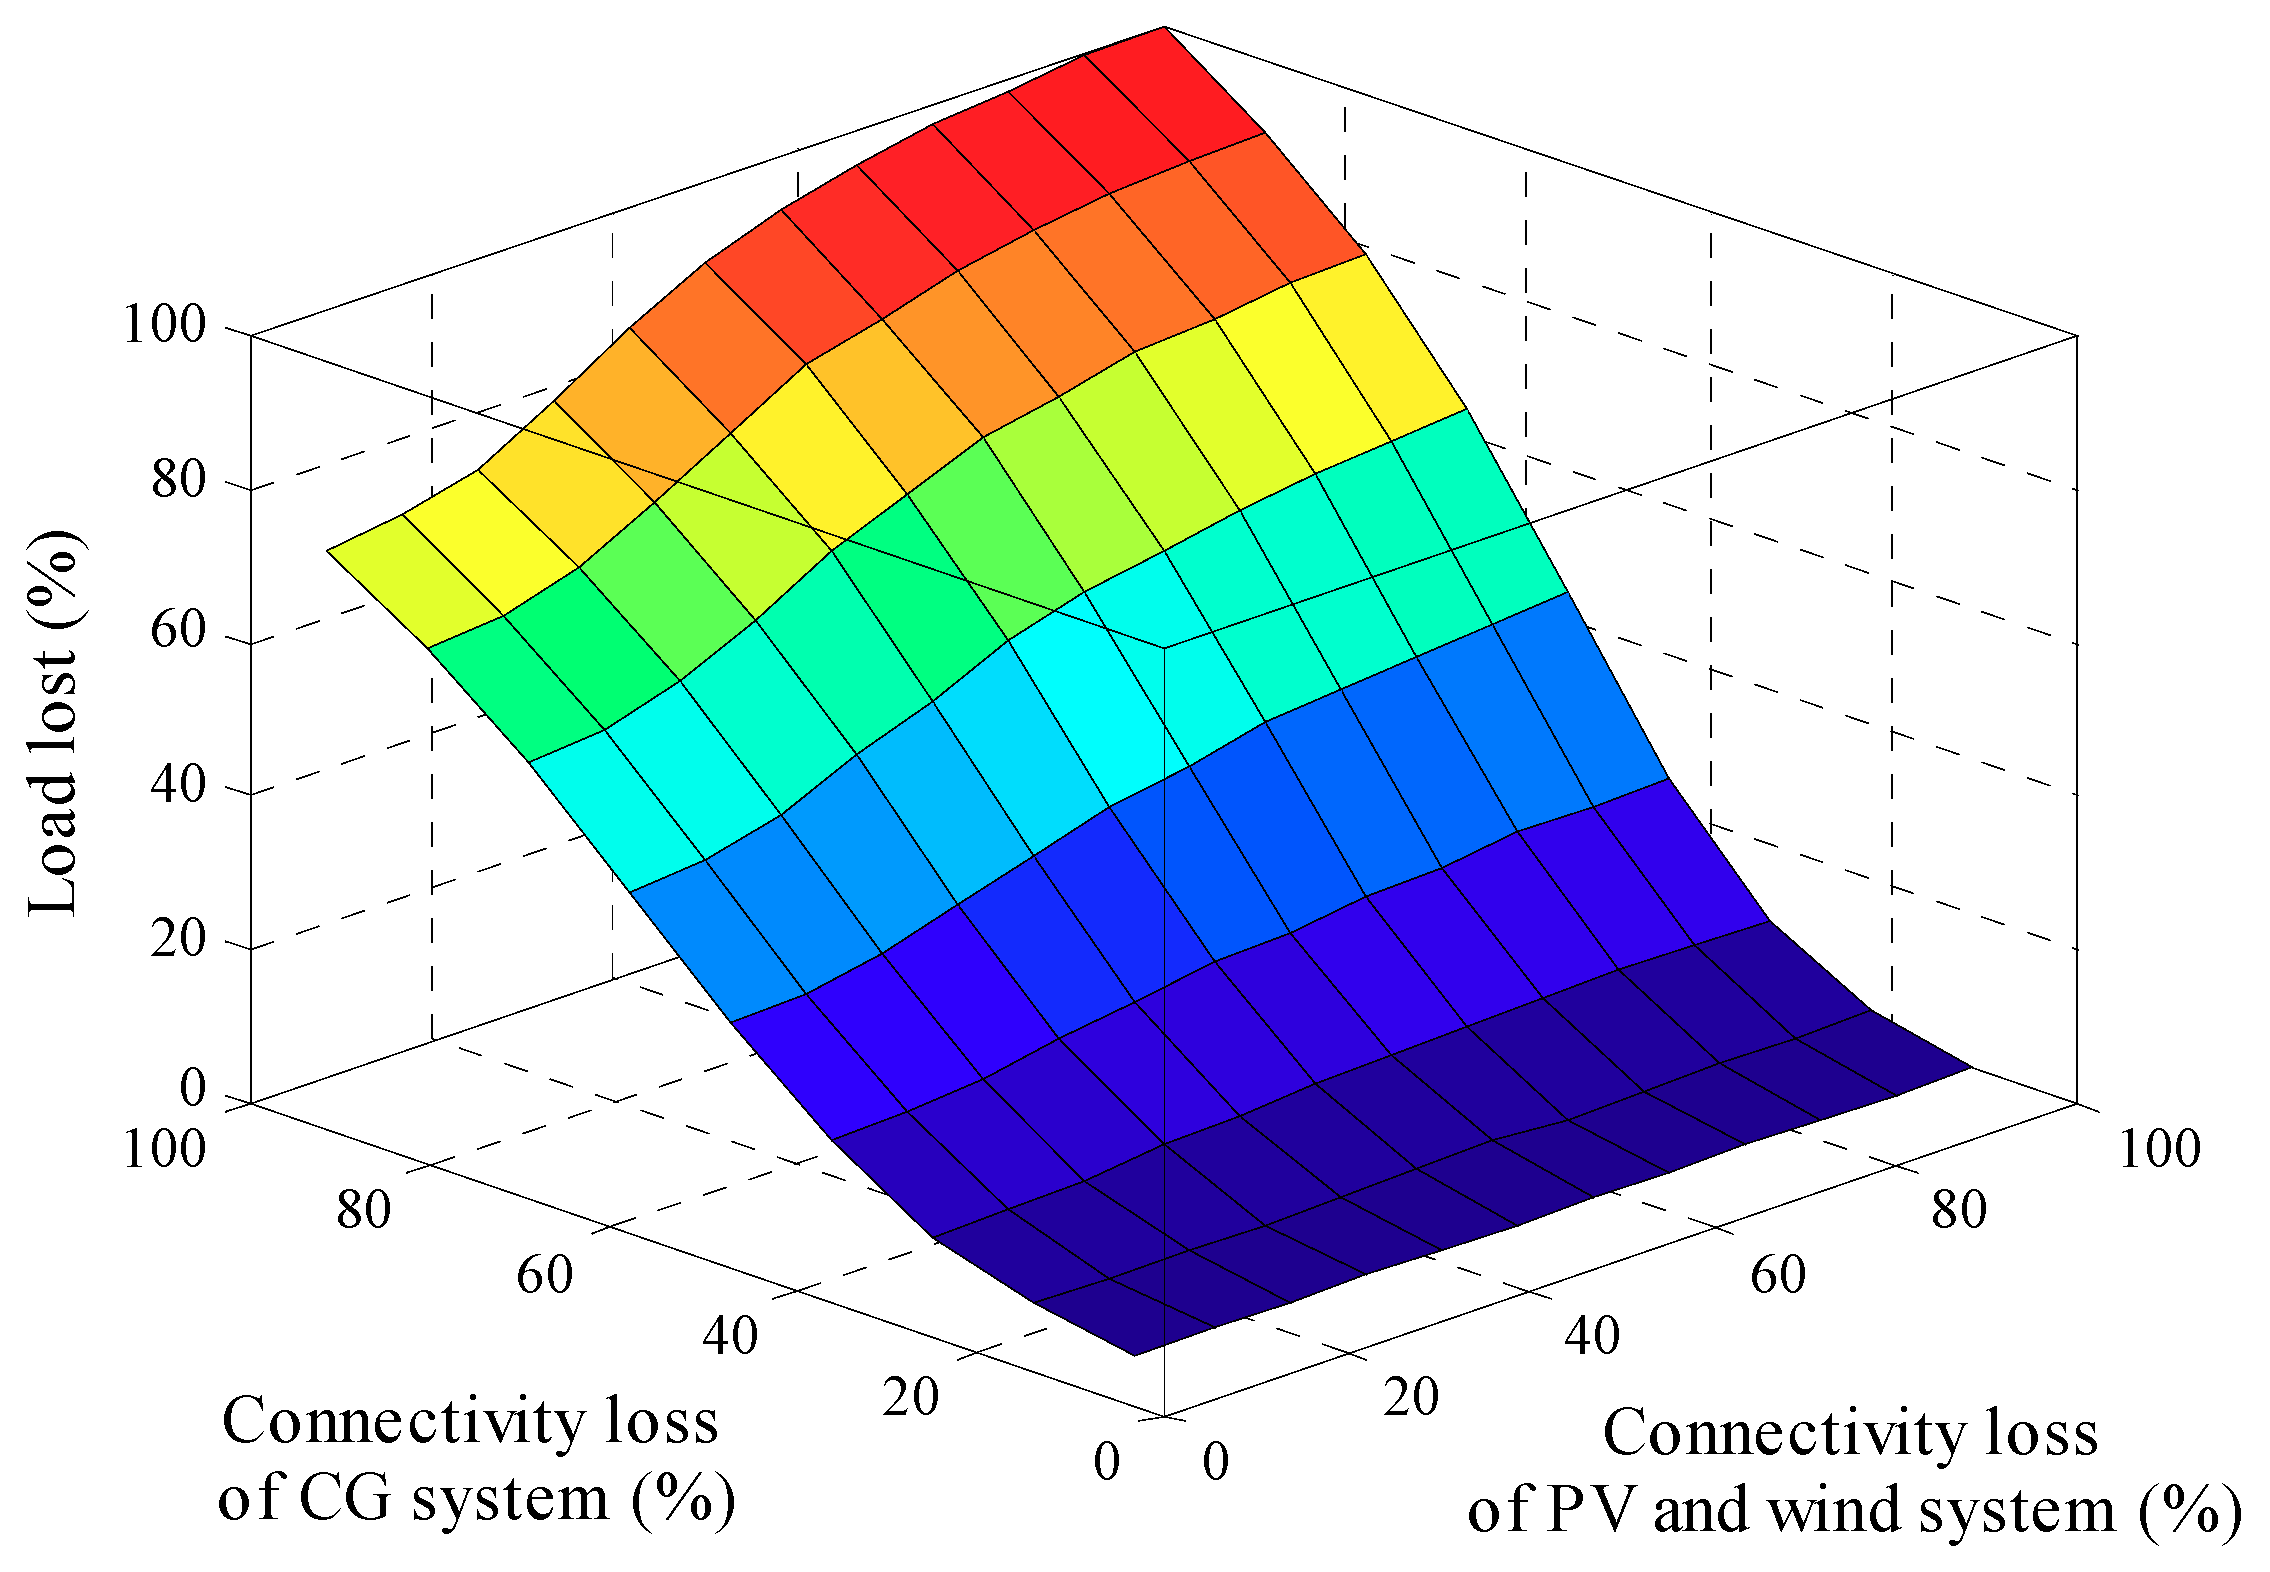
Vulnerability assessment is performed by means of hourly simulations. In this regard, yearly time series of wind speed, solar radiation, ambient temperature, and load demand are used. The study consists of estimating the load lost as a result of several CIC. A CIC consists of removing a determined edge or edges randomly chosen from a determined CI.
The procedure for vulnerability assessment can be explained with greater details through the following steps: First, obtain the hourly ( Δ t   = 1 h) time series of renewable resources and load demand; second, select a determined number of edges to be removed from a determined CI; third, considering those vertices connected to the command vertex, as well as the renewable resources and load demand at each time instant ( t ), solve EDP by CA; fourth, determine the load lost (kW) for each hour of the year; fifth, calculate the load lost in percentage by dividing the annual load lost and the MG annual load; and sixth, calculate the connectivity loss of CI by dividing the number of edges to be removed (Step 2) and the total amount of edges on the CI under study. This procedure is repeated until all edges on CI are removed.
Considering the topology of Figure 29, if the number of edges to be removed is set to 5, it means that five edges randomly chosen would be removed at each hour ( t = 1 , , T =   8760 h) of the year. Then, the loss of load would be estimated in percentage from the yearly simulation, and connectivity loss would be equal to 41.6% (5/12). This procedure is repeated until 100% connectivity loss is reached.
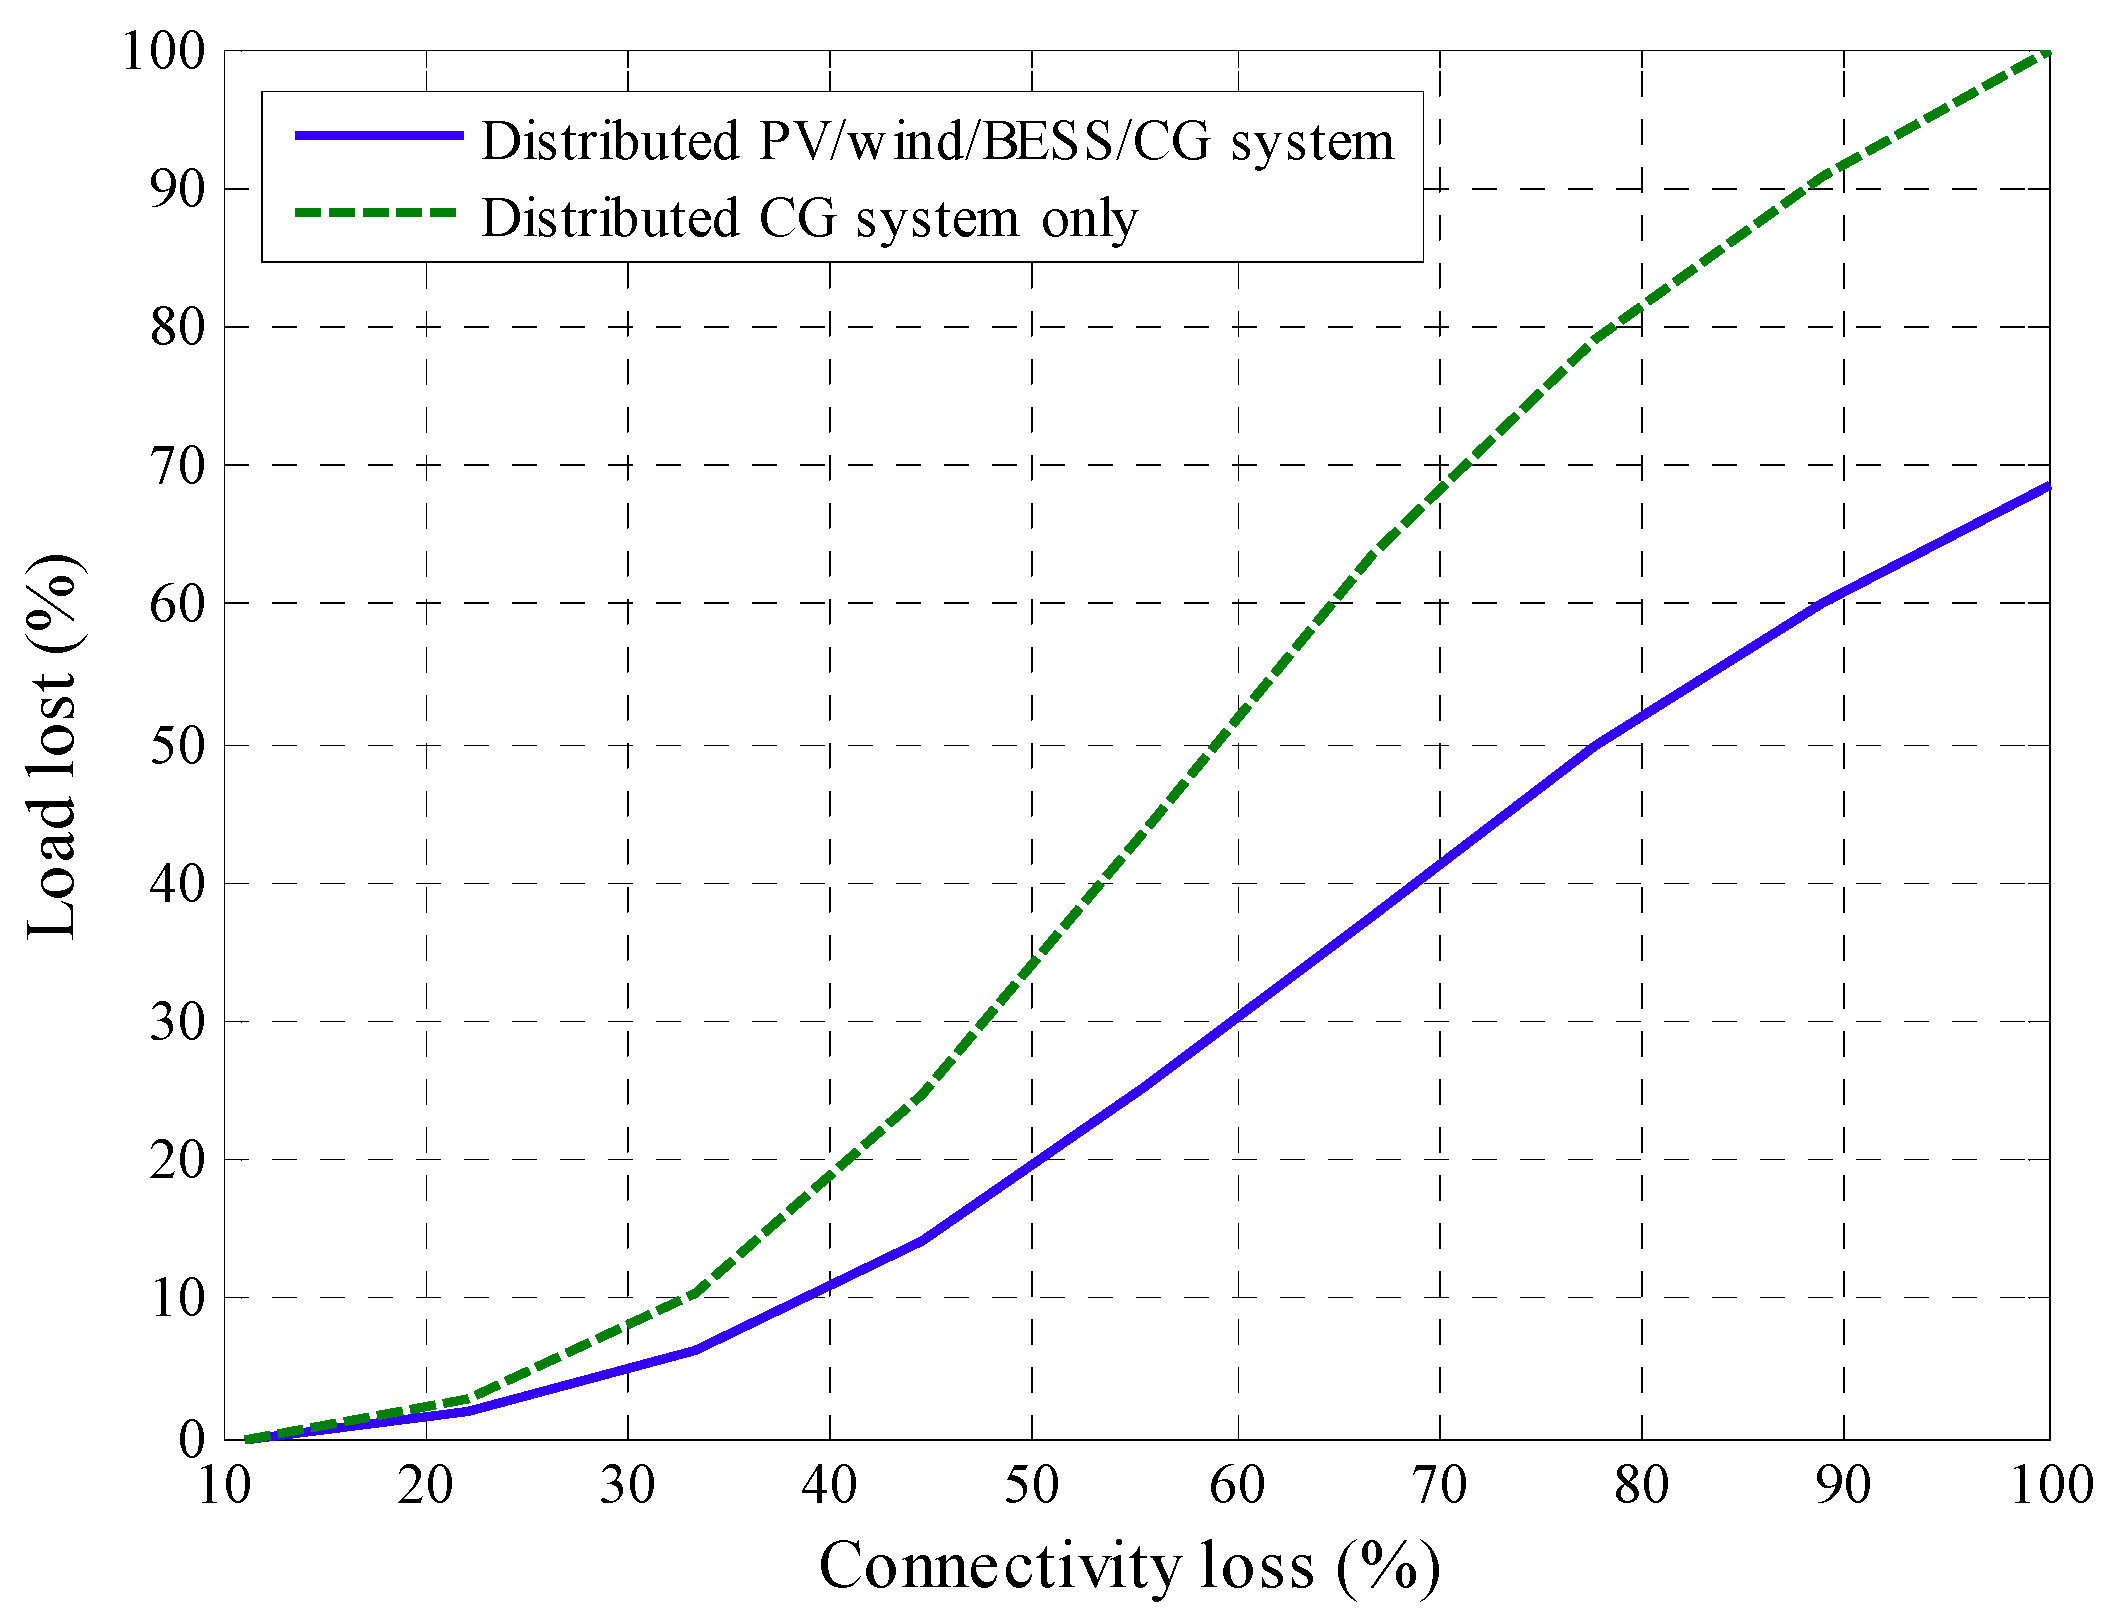
The vulnerability of an energy system used in Section 4.1 (distributed CG system only) was compared to the vulnerability of that used in Section 4.2 (distributed PV/wind/BESS/CG system) when only contingencies on a CG subsystem were considered. This exercise revealed the importance of renewable generation and energy storage on the vulnerability of a conventional system. Corresponding results are presented in Figure 31, where it can be observed how renewable generation and energy storage reduce the load to be supplied by a CG, which reduces the load lost and, consequently, the vulnerability of the whole system. On the other hand, under extreme conditions (connectivity loss equal to 100%, as in Figure 31), the vulnerability reduces by approximately 30%.
Similarly, vulnerability analysis considering contingencies on renewable generation and CG subsystems is presented in Figure 32. This analysis incorporates the results previously reported in Figure 31 with additional information. When connectivity loss is equal to 0% on a renewable generation subsystem, the vulnerability curve shown in Figure 31 for the distributed PV/wind/BESS/CG system (blue line) is obtained. From this point, it is possible to observe how fast the whole system collapses when the renewable subsystem is subject to intentional contingencies. This fact reveals the important interdependence between renewables and CG subsystems.

5. Conclusions and Remarks

In this paper, HES to reduce DS vulnerability has been studied, and detailed computational models representing behaviours of renewable generation, VRB, and fossil fuel power generation have been combined with a decentralised management strategy to develop an energy system able to face the negative consequence of utility company malfunctioning. Management of the proposed configuration has been discussed under two different conditions: voltage stability of the DS and autonomous operation of the entire distributed HES.
Traditionally, HESs located in remote areas are frequently composed of single power generation and storage devices. In addition, these devices belong to a single owner so that they are managed to minimise the generating cost, satisfying load requirements. In the configuration considered in this paper, elements of HES are dispersed over a wide region composed of many power generation and storage devices. Each of these elements can be owned by a different investor, which specifies its appropriate energy selling price. Moreover, HES for power supply in isolated areas is designed to provide energy in a cost-effective manner, while the distributed configuration proposed in this paper is designed to provide electricity for minimising system vulnerability by splitting power generation and storage devices into many components. Of note, investments in DS updating and overhauling can be directed to increase the deployment of distributed systems around the geographical regions with load demand of high relevance, not just concentrating economic resources on DS.
The results observed from the analysis of the case studies illustrate how the proposed management strategy can be used to perform the coordination of generators and BESSs as independent aggregated units, where the owner of each device establishes a determined price by the energy produced (generation units) or cycled (storage devices). Moreover, vulnerability analysis revealed how important interdependence is between renewable and conventional generation. In fact, a reduction of 30% for system vulnerability was observed with respect to the traditional system only based on CG.

Author Contributions

Conceptualization, J.M.L.-R. and J.A.D.-N.; Methodology, J.M.Y.; Validation, J.M.Y.; Investigation, J.M.L.-R.; Writing-Original Draft Preparation, J.M.L.-R.; Writing-Review & Editing, J.M.Y. and J.A.D.-N.; Supervision, J.A.D.-N.

Funding

This work was funded by Ministerio de Economía, Industria y Competitividad of Spanish government under project number ENE2016-77172-R, by Government of Aragon and the European Union, T28_17R, “building Aragon from Europe”.

Acknowledgments

This work was supported by Ministerio de Economía, Industria y Competitividad of Spanish government under project number ENE2016-77172-R, by Government of Aragon and the European Union, T28_17R, “building Aragon from Europe”.

Conflicts of Interest

The authors declare no conflict of interest.

List of symbols

b Index for each battery system ( b = 1 , , B ).
g Index for each conventional generator ( g = 1 , , G ).
i Index for consensus algorithm iterations ( i = 1 , , I ).
n Index for each node of distribution system.
p Index for each photovoltaic generator ( p = 1 , , P ).
t Index for each hour of the year ( t = 1 , , T ).
Δ t Time step (h).
w Index for each wind generator ( w = 1 , , W ).
T A ( t ) Ambient temperature at time t (°C).
T P V ( p , t ) Photovoltaic cell temperature of generator p at time t (°C).
G ( t ) Solar radiation at time t (W/m2).
N O C T ( p ) Nominal operating cell temperature of generator p (°C).
α P V ( p ) Temperature coefficient of generator p .
k P V Parameter of solar transmittance and absorptance.
m P V Photovoltaic cell ideality factor.
k B Boltzmann constant (J/K).
e P V Electron charge (C).
N P V ( p ) C S Number of cells connected in serial on generator p .
N P V ( p ) C P Number of cells connected in parallel on generator p .
N P V ( p ) P S Number of panels connected in serial on generator p .
N P V ( p ) P P Number of panels connected in parallel on generator p .
N B ( b ) S Number of batteries connected in serial.
N B ( b ) P Number of batteries connected in parallel.
φ ( n , t ) Value of correlated time series at time t for node n .
ξ ( t ) Value of white noise at time t .
μ Mean of load demand time series (kW).
σ Standard deviation of load demand time series (kW).
Ø L Autocorrelation coefficient.
ε Parameter of consensus algorithm implementation.
l ( n , t ) Normalized load demand at time t for node n (kW).
L ( n , t ) Load demand at time t for node n (kW).
z ( n , t ) Correlated and profiled load demand at time t for node n .
f Z ( · ) Cumulative distribution of z ( n , t ) time series.
f L ( · ) Cumulative distribution of P T ( n , t ) time series.
f P V ( · ) Projection operator for dispatch of photovoltaic system.
P S ( n , t ) Flow of active power of branch n at time t (kW).
P T ( n , t ) Simulated load demand at time t for node n (kW).
P L ( n , t ) Scaled load demand at time t for node n (kW).
P L m i n Minimum load demand (kW).
P L m a x Maximum load demand (kW).
P P V ( p , t ) Photovoltaic cell power at time t for generator p (W).
P I ( p ) Rated power of converter of generator p (kW).
p I ( p ) Normalized power of inverter at time t for generator p .
P B ( b , t ) Power of battery system b at time t (kW).
P P V ( p , t ) m a x Maximum power of photovoltaic generator p at time t (kW).
P W ( w , t ) m a x Maximum power of wind generator w at time t (kW).
P B ( b ) m a x Maximum charging/discharging power of battery system b (kW).
P C ( g ) m i n Minimum power generation of conventional generator g (kW).
P C ( g ) m a x Maximum power generation of conventional generator g (kW).
P P V ( p , t ) o p t Optimal power dispatch of photovoltaic generator p at time t (kW).
P W ( w , t ) o p t Optimal power dispatch of wind generator w at time t (kW).
P B ( b , t ) o p t Optimal power dispatch of battery system b at time t (kW).
P C ( g , t ) o p t Optimal power dispatch of conventional generator g at time t (kW).
U P V ( p , t ) e Thermal voltage of generator p at time t (V).
U P V ( p , t ) O C Photovoltaic cell open circuit voltage of generator p at time t (V).
U P V , S T C ( p ) O C Open-circuit voltage under standard conditions of photovoltaic unit p (V).
u P V ( p , t ) O C Relative photovoltaic cell open circuit voltage at time t for generator p .
U P V ( p ) M A X Voltage at maximum power production for generator p (V).
U P V ( p , t ) Photovoltaic cell voltage at time t for generator p (V).
U B ( b , t ) c h Battery charging voltage at time t and battery system b (V).
U B ( b , t ) d i s Battery discharging voltage at time t and battery system b (V).
U B ( b , t ) Battery voltage at time t and battery system b (V).
U B ( b ) m a x Maximum allowed voltage of battery system b (V).
U B ( b ) m i n Minimum allowed voltage of battery system b (V).
U P V , R T D ( p ) Voltage of photovoltaic system (V).
U S ( n , t ) Voltage of node n of distribution system at time t (kV).
I P V ( p , t ) S C Short-circuit current at time t for generator p (A).
I P V , S T C ( p ) S C Short-circuit current under standard conditions at time t for generator p (A).
I P V ( p ) M A X Current at maximum power production for generator p (A).
I P V ( p , t ) Photovoltaic cell current at time t for generator p (A).
Q S ( n , t ) Flow of reactive power of branch n at time t (kVAr).
F F P V ( p , t ) o Maximum fill factor at time t for generator p .
F F P V ( p ) Fill factor of photovoltaic of generator p .
R P V ( p , t ) S Photovoltaic cell resistance at time t for generator p (Ω).
α I ( p ) , β I ( p ) , θ I ( p ) Parameters of inverter efficiency model for generator p .
α P V ( p ) , β P V ( p ) , γ P V ( p ) , δ P V ( p ) 1 δ P V ( p ) 3 Parameters of cost curve of photovoltaic generator p .
α W ( w ) , β W ( w ) , γ W ( w ) , δ W ( w ) 1 δ W ( w ) 3 Parameters of cost curve of wind generator w .
α B ( b ) , β B ( b ) , γ B ( b ) , δ B ( b ) 1 δ B ( b ) 3 Parameters of cost curve of battery system b .
α C ( g ) , β C ( g ) , γ C ( g ) , δ C ( g ) 1 δ C ( g ) 3 Parameters of cost curve of conventional generator g .
η P V ( p ) Cell efficiency of generator p .
η I ( p , t ) Inverter efficiency at time t for generator p .
η B ( b , t ) Battery efficiency at time t and battery system b .
η B ( b , t ) c h Battery charging efficiency at time t and battery system b .
η B ( b , t ) d i s Battery discharging efficiency at time t and battery system b .
η B , V ( b , t ) c h Battery charging voltage efficiency at time h .
η B , E ( b , t ) c h Battery charging power efficiency at time h .
η B , V ( b , t ) d i s Battery discharging voltage efficiency at time h .
η B , E ( b , t ) d i s Battery discharging power efficiency at time h .
F P V ( p , t ) Cost curve of conventional generator p at time t ($).
F W ( w , t ) Cost curve of conventional generator w at time t ($).
F B ( b , t ) Cost curve of conventional generator b at time t ($).
F C ( g , t ) Cost curve of conventional generator g at time t ($).
E B ( b ) m a x Rated capacity of battery system b (kWh).
S O C B ( b , t ) Battery state of charge at time t and battery system b .
S O C B ( b ) m i n Minimum value of state of charge of battery system b .
S O C B ( b ) m a x Maximum value of state of charge of battery system b .
R S ( n ) Resistance of branch n (Ω).
X S ( n ) Reactance of branch n (Ω).
M L I ( n , t ) Maximum loadability index at time t for node n .
Δ P M L I ( n , t ) Power required for avoiding voltage collapse (kVA).
C I P P V , C I Q P V Matrices related to communication infrastructure of photovoltaic system.
λ P V ( p ) m i n Minimum value of incremental cost for photovoltaic system p ($/kWh).
λ P V ( p ) m a x Maximum value of incremental cost for photovoltaic system p ($/kWh).
λ P V ( i ) C A Vector of photovoltaic incremental cost for iteration i ($/kWh).
λ P V ( p , i ) C A Element p of incremental cost vector λ P V ( i ) C A ($/kWh).
Δ P P V ( t , i ) C A Vector of power mismatch at iteration i (kW).
Δ P P V ( p , t , i ) C A Element p of mismatch vector Δ P P V ( t , i ) C A (kW).
P P V ( t , i ) C A Vector of power charged/discharged for iteration i (kW).
P P V ( p , t , i ) C A Element p of power charged/discharged vector P P V ( t , i ) C A (kW).

References

  1. Zio, E.; Aven, T. Uncertainties in smart grids behavior and modeling: What are the risks and vulnerabilities? How to analyze them? Energy Policy 2011, 39, 6308–6320. [Google Scholar] [CrossRef]
  2. Sullivan, J.E.; Kamensky, D. How cyber-attacks in Ukraine show the vulnerability of the US power grid. Electr. J. 2017, 30, 30–35. [Google Scholar] [CrossRef]
  3. Hurricane Sandy Rebuilding Task Force. Hurricane Sandy Rebuilding Strategy. Stronger Communities, a Resilient Region; US Department of Housing and Urban Development: Washington, DC, USA, August 2013.
  4. Hurricane Sandy Rebuilding Task Force. Hurricane Sandy Rebuilding Strategy; Progress report; US Department of Housing and Urban Development: Washington, DC, USA, 2014.
  5. Schoenung, S.; Byrne, R.H.; Olinsky-Paul, T.; Borneo, D.R. Green Mountain Power (GMP): Significant Revenues from Energy Storage; Sandia National Laboratories: Albuquerque, NM, USA, 2017.
  6. Chi, Y.; Xu, Y. Resilience-oriented microgrids: A comprehensive literature review. In Proceedings of the 2017 IEEE Innovative Smart Grid Technologies—Asia (ISGT-Asia), Auckland, New Zealand, 4–7 December 2017. [Google Scholar]
  7. Bagchi, A.; Goel, L.; Wang, P. Adequacy assessment of generating systems incorporating storage integrated virtual power plants. IEEE Trans. Smart Grid 2018, in press. [Google Scholar] [CrossRef]
  8. Bagchi, A.; Goel, L.; Wang, P. Generation adequacy evaluation incorporating an aggregated probabilistic model of active distribution network components and features. IEEE Trans. Smart Grid 2018, 9, 2667–2680. [Google Scholar] [CrossRef]
  9. Liang, Z.; Alsafasfeh, Q.; Jiin, T.; Pourbabak, H.; Su, W. Risk-constrained optimal energy management for virtual power plants considering correlated demand response. IEEE Trans. Smart Grid 2018, in press. [Google Scholar] [CrossRef]
  10. Pourghaderi, N.; Fotuhi-Firuzabad, M.; Moeini-Aghtaie, M.; Kabirifar, M. Commercial demand response programs in bidding of a technical virtual power plant. IEEE Trans. Ind. Inform. 2018, in press. [Google Scholar] [CrossRef]
  11. Wei, C.; Xu, J.; Liao, S.; Sun, Y.; Jiang, Y.; Ke, D.; Zhang, Z.; Wang, J. A bi-level scheduling model for virtual power plants with aggregated thermostatically controlled loads and renewable energy. Appl. Energy 2018, 224, 659–670. [Google Scholar] [CrossRef]
  12. Azar, A.G.; Nazaripouya, H.; Khaki, B.; Chu, C.-C.; Gadh, R.; Jacobsen, R.H. A non-cooperative framework for coordinating a neighborhood of distributed prosumers. IEEE Trans. Ind. Inform. 2018, in press. [Google Scholar]
  13. Molzahn, D.K.; Dörfler, F.; Sandberg, H.; Low, S.H.; Chakrabarti, S.; Baldick, R.; Lavaei, J. A survey of distributed optimization and control algorithms for electric power systems. IEEE Trans. Smart Grid 2017, 8, 2941–2962. [Google Scholar] [CrossRef]
  14. Shahraeini, M.; Javidi, M.H.; Ghazizadeh, M.S. Comparison between communication infrastructures of centralized and decentralized wide area measurement systems. IEEE Trans. Smart Grid 2011, 2, 206–211. [Google Scholar] [CrossRef]
  15. Barley, C.D.; Winn, C.B. Optimal dispatch strategy in remote hybrid power systems. Sol. Energy 1996, 58, 165–179. [Google Scholar] [CrossRef]
  16. Pfenninger, S.; Staffell, I. Long-term patterns of European PV output using 30 years of validated hour reanalysis and satellite data. Energy 2016, 114, 1251–1265. [Google Scholar] [CrossRef]
  17. Staffell, I.; Pfenninger, S. Using bias-corrected reanalysis to simulate current and future wind power output. Energy 2016, 114, 1224–1239. [Google Scholar] [CrossRef]
  18. Pfenninger, S.; Staffell, I. Renewables.ninja. Available online: https://www.renewables.ninja/ (accessed on 21 January 2019).
  19. Short, T.A. Electric Power Distribution Handbook; CRC Press LLC: Boca Raton, FL, USA, 2004. [Google Scholar]
  20. Lambert, T.; Gilman, P.; Lilienthal, P. Micropower system modeling with HOMER. In Integration of Alternative Sources of Energy; John Wiley & Sons: Hoboken, NJ, USA, 2006; pp. 379–418. [Google Scholar]
  21. Stephen, B.; Mutanen, A.J.; Galloway, S.; Burt, G.; Järventausta, P. Enhanced load profiling for residential network customers. IEEE Trans. Power Deliv. 2014, 29, 88–96. [Google Scholar] [CrossRef]
  22. Lorenzo, E.; Araujo, G.; Cuevas, A.; Egido, M.; Minano, J.; Zilles, R. Solar Electricity: Engineering of Photovoltaic Systems; Progensa: Seville, Spain, 1994. [Google Scholar]
  23. Kheldoun, A.; Bradai, R.; Boukenoui, R.; Mellit, A. A new golden section method-based maximum power point tracking algorithm for photovoltaic systems. Energy Convers. Manag. 2016, 111, 125–136. [Google Scholar] [CrossRef]
  24. Rampinelli, G.A.; Krenzinger, A.; Romero, F.C. Mathematical models for efficiency of inverters used in grid connected photovoltaic systems. Renew. Sustain. Energy Rev. 2014, 34, 578–587. [Google Scholar] [CrossRef]
  25. Qiu, X.; Nguyen, T.A.; Guggenberger, J.D.; Crow, M.L.; Elmore, A.C. A field validated model of a vanadium redox flow battery for microgrids. IEEE Trans. Smart Grid 2014, 5, 1592–1601. [Google Scholar] [CrossRef]
  26. Nguyen, T.A.; Qiu, X.; Guggenberger, J.D.; Crow, M.L.; Elmore, A.C. Performance characterization for photovoltaic-vanadium redox battery microgrid systems. IEEE Trans. Sustain. Energy 2014, 5, 1379–1388. [Google Scholar] [CrossRef]
  27. Nguyen, T.A.; Crow, M.L.; Elmore, A.C. Optimal sizing of a vanadium redox battery system for microgrid systems. IEEE Trans. Sustain. Energy 2015, 6, 729–737. [Google Scholar] [CrossRef]
  28. Yang, S.; Tan, S.; Xu, J.-X. Consensus based approach for economic dispatch problem in a smart grid. IEEE Trans. Power Syst. 2013, 28, 4416–4426. [Google Scholar] [CrossRef]
  29. Venkatesh, B.; Rost, A.; Chang, L. Dynamic voltage collapse index—Wind generator application. IEEE Trans. Power Deliv. 2007, 22, 90–94. [Google Scholar] [CrossRef]
  30. Osório, G.J.; Matias, J.C.O.; Catalão, J.P.S. Short-term wind power forecasting using adaptive neuro-fuzzy inference system combined with evolutionary particle swarm optimization, wavelet transform and mutual information. Renew. Energy 2015, 75, 301–307. [Google Scholar] [CrossRef]
  31. Tennet. Available online: https://www.tennet.eu/electricity-market/transparency-pages/transparency-germany/ (accessed on 21 January 2019).
  32. Correa, G.J.; Yusta, J.M. Structural vulnerability in transmission systems: Cases of Colombia and Spain. Energy Convers. Manag. 2014, 77, 408–418. [Google Scholar] [CrossRef]
Figure 1. General structure of energy system.
Energies 12 00616 g001
Figure 2. Load profile of small commercial loads [19].
Energies 12 00616 g002
Figure 3. Wind turbine power curve.
Energies 12 00616 g003
Figure 4. General CI.
Energies 12 00616 g004
Figure 5. MG structure.
Energies 12 00616 g005
Figure 6. Flowchart of PV and wind power dispatch.
Energies 12 00616 g006
Figure 7. Flowchart of BESS power dispatch.
Energies 12 00616 g007
Figure 8. Flowchart of CG power dispatch.
Energies 12 00616 g008
Figure 9. Communication topology of renewable generation.
Energies 12 00616 g009
Figure 10. Communication topology of distributed BESS.
Energies 12 00616 g010
Figure 11. Communication topology of distributed CG.
Energies 12 00616 g011
Figure 12. Power demand time series (Case study 1).
Energies 12 00616 g012
Figure 13. Power demand during the first week.
Energies 12 00616 g013
Figure 14. Power production of CG during the first week.
Energies 12 00616 g014
Figure 15. Probability distribution of MLI.
Energies 12 00616 g015
Figure 16. Evolution of power of each CG.
Energies 12 00616 g016
Figure 17. Evolution of power mismatch.
Energies 12 00616 g017
Figure 18. Evolution of incremental cost.
Energies 12 00616 g018
Figure 19. Power demand time series (Case study 2).
Energies 12 00616 g019
Figure 20. PV and wind power time series.
Energies 12 00616 g020
Figure 21. Battery power time series.
Energies 12 00616 g021
Figure 22. SOC time series.
Energies 12 00616 g022
Figure 23. Conventional power time series.
Energies 12 00616 g023
Figure 24. Power demand time series (Case study 3).
Energies 12 00616 g024
Figure 25. PV and wind power time series (Case study 3).
Energies 12 00616 g025
Figure 26. Battery power time series (Case study 3).
Energies 12 00616 g026
Figure 27. SOC time series (Case study 3).
Energies 12 00616 g027
Figure 28. Conventional power time series (Case study 3).
Energies 12 00616 g028
Figure 29. Operation of distributed PV and wind system under CIC.
Energies 12 00616 g029
Figure 30. Operation of distributed CG system under CIC.
Energies 12 00616 g030
Figure 31. Vulnerability evaluation. (Distributed CG system under CIC).
Energies 12 00616 g031
Figure 32. Vulnerability evaluation. (Distributed renewable and CG systems under CIC).
Energies 12 00616 g032
Table 1. Parameters of VRB model [25,26,27].
ParameterValueParameterValue
δ B 1 1.895 V/kW δ B 15 −0.128
δ B 2 1.552 V/kW δ B 16 1.05
δ B 3 6.82 V δ B 17 0.19 kW
δ B 4 46.79 V δ B 18 0.59 kW
δ B 5 −2.72 V/kW δ B 19 −2.72 V/kW
δ B 6 6.3606 V δ B 20 6.3606 V
δ B 7 47.335 V δ B 21 47.335 V
δ B 8 0.038 V/K δ B 22 0.038 V/K
δ B 9 1.1755 δ B 23 1.1755
δ B 10 61.2674 V δ B 24 61.2674 V
δ B 11 1.895 V/kW δ B 25 1.0334
δ B 12 1.552 V/kW δ B 26 1.727 kW
δ B 13 6.82 V δ B 27 0.596 kW
δ B 14 46.79 V T B 298.15 K
Table 2. Load demand characteristics.
P L m i n P L m a x Ø L
0.650.950.85
Table 3. Characteristics of distributed wind generator.
w m a x { P W ( w , t ) } (kW) δ W ( w ) 2 ($/kWh)
w = 1750.042130815
w = 2500.052067507
w = 31000.047324725
w = 41500.048936062
Table 4. Characteristics of distributed PV generator.
Parameter p = 1 p = 2 p = 3 p = 4 p = 5
N O C T ( p ) (°C)4847.9444444
U P V , S T C ( p ) O C (V)39.432.4938.538.447.2
I P V , S T C ( p ) S C (A)9.979.959.259.189.79
α P V ( p ) (%/°C)−0.4−0.377−0.41−0.41−0.39
η P V ( p ) (%)18.319.8216.816.518.5
U P V ( p ) M A X (V)31.227.5331.130.938.9
I P V ( p ) M A X (A)9.639.38.848.739.26
N P V ( p ) C S 6048606072
N P V ( p ) P P 16015010075120
U P V , R T D ( p ) (V)150200250130140
δ P V ( p ) 2 ($/kWh)0.0513220.0612010.0612130.0575260.050374
Table 5. Characteristics of distributed BESS.
b S O C B ( b , 0 ) N B ( b ) S N B ( b ) P δ B ( b ) 29 ($/kWh)
b = 10.405787355300.55008958
b = 20.7503541110100.518354626
b = 30.4030221615200.566317978
b = 40.233573975100.53061395
b = 50.347508265200.515127906
Table 6. Characteristics of distributed CG.
g P C ( g ) m a x (kW) δ C ( g ) 2 ($/kWh)
g = 11000.049981535
g = 21100.04181234
g = 31000.047082976
g = 41200.045733707
g = 51000.052562019
g = 61150.047283012
g = 71000.050180334
Table 7. Power dispatch of CG at t = 37 h.
g P C ( g , 37 ) o p t
g = 10.000000
g = 23.588322
g = 30.953004
g = 41.627638
g = 50.000000
g = 60.852986
g = 70.000000