Article

Structure Function Analysis of Temperature-Dependent Thermal Properties of Nm-Thin Nb2O5

Materials Center Leoben Forschung GmbH, Roseggerstrasse 12, 8700 Leoben, Austria
*
Author to whom correspondence should be addressed.
Energies 2019, 12(4), 610; https://doi.org/10.3390/en12040610
Submission received: 29 December 2018 / Revised: 8 February 2019 / Accepted: 14 February 2019 / Published: 15 February 2019
(This article belongs to the Special Issue Thermal and Electro-thermal System Simulation)

Abstract

:
A 166-nm-thick amorphous Niobium pentoxide layer (Nb2O5) on a silicon substrate was investigated by using time domain thermoreflectance at ambient temperatures from 25 °C to 500 °C. In the time domain thermoreflectance measurements, thermal transients with a time resolution in (sub-)nanoseconds can be obtained by a pump-probe laser technique. The analysis of the thermal transient was carried out via the established analytical approach, but also by a numerical approach. The analytical approach showed a thermal diffusivity and thermal conductivity from 0.43 mm2/s to 0.74 mm2/s and from 1.0 W/mK to 2.3 W/mK, respectively to temperature. The used numerical approach was the structure function approach to map the measured heat path in terms of a RthCth-network. The structure function showed a decrease of Rth with increasing temperature according to the increasing thermal conductivity of Nb2O5. The combination of both approaches contributes to an in-depth thermal analysis of Nb2O5 film.

1. Introduction

Energy efficiency and saving in microelectronic devices go along with thermal management, as their failure rate increases exponentially with the operating temperature. The miniaturization and increase of device packing density trigger the importance of the heat dissipation, as well as the thermal management in microelectronics. Thus, it is necessary to develop heat dissipation strategies, which requires knowledge of devices’ thermophysical properties. The devices themselves are composed of multiple layers of submicrometer thin films. The thermal properties of thin films can deviate from their bulk values and thermal boundary resistance becomes more dominant for the heat dissipation [1].
In this study, nm-thin Niobium pentoxide (Nb2O5) layer was characterized by thermal properties and their temperature dependencies were presented in the temperature range of 25 °C to 500 °C. Nb2O5 films can be found in optical filter, electrochromic device, sensors, capacitors, and microelectronic devices. Therefore, lots of investigations were done in terms of Nb2O5’s optical and structural properties [2,3]. However, as far as we know, investigations about their thermal properties and temperature dependency can rarely be found in the literature, although these are important parameters for a device´s efficiency and reliability [4].
The Nb2O5 films were thermally investigated with the time domain thermal reflectance (TDTR) method [5]. The TDTR records the response of a thin film in high speed (down to picoseconds (ps)) after a heating laser pulse. In this work, in addition to the common analytical evaluation of TDTR measurements, a numerical analysis is presented. This numerical analysis maps the sample’s heat path in a one-dimensional way as the structure function, introduced by Székely et al. [6]. The structure function is a numerical approach, containing values of the materials’ thermal resistance ( R t h ) and thermal capacitance ( C t h ) [7,8]. Here, a modified calculation of the structure function was applied to the TDTR measurements. This structure function overcomes certain up-front assumptions, which are necessary when applying analytical solution. Furthermore, the TDTR measurements were simulated via finite volume simulations to understand the structure function and get absolute R t h values [9].

2. Materials and Methods

An amorphous 166-nm-thin Nb2O5 film on Si was investigated at temperatures from 25 °C to 500 °C, obtaining the Nb2O5 temperature-dependent thermal properties. The amorphous nature of the Nb2O5 was confirmed by Raman measurements (see Appendix AFigure A1). The experimental thermal investigations were done by two TDTR systems (PicoTR and NanoTR from Netzsch Group in representative of PicoTherm [10]) with different time resolutions and, therefore, different heat penetration depths. These TDTR measurements were additionally simulated to assess temperatures of the thermal transient. Both, the TDTR measurement and simulation were transformed into the structure function for thermal analysis.

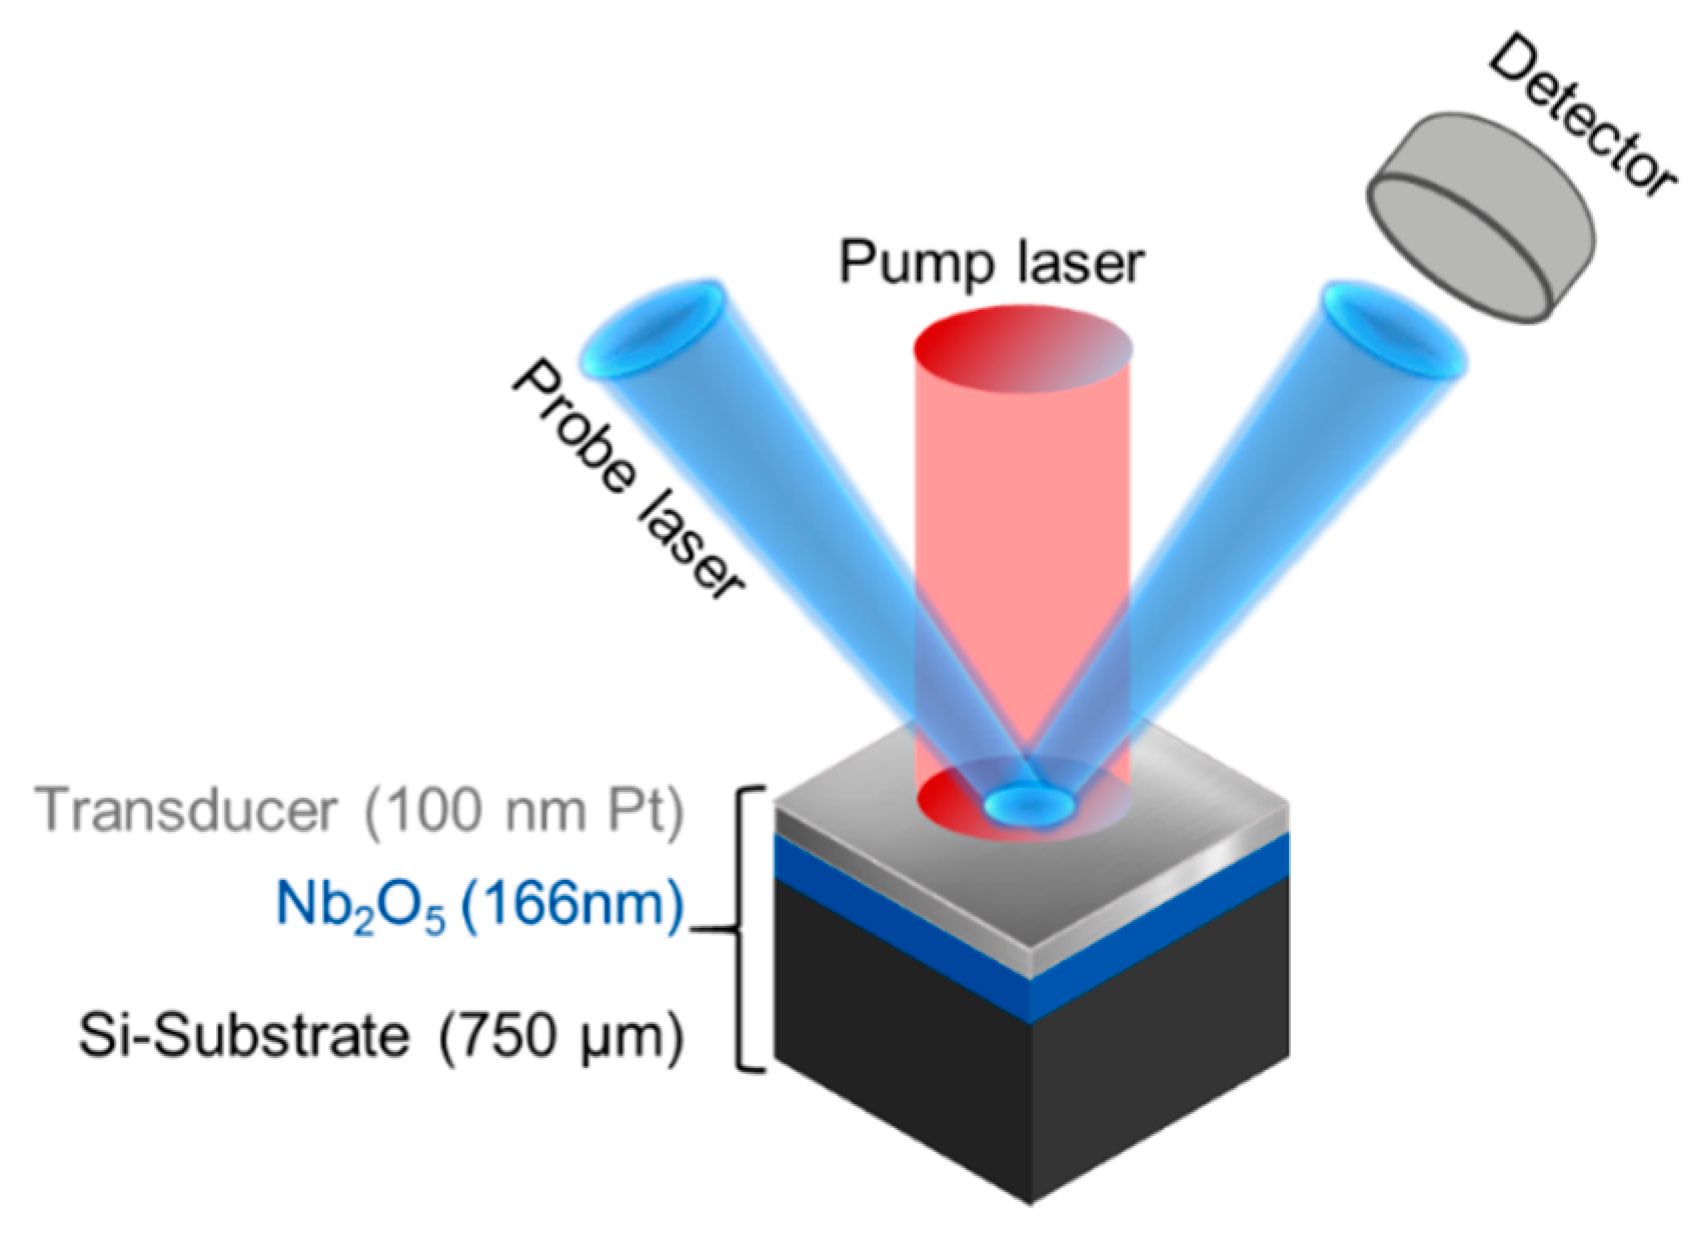
2.1. Time Domain Thermoreflectance

Both TDTR systems, PicoTR and NanoTR (see Table 1), provide a non-contact method in the field of thin film thermal properties metrology. The TDTR systems are based on a pump–probe technique with fiber laser beams. A pulse of the pump beam heats up the sample with a power of 25 mW on the Pt-layer (Front Heating). The probe beam, which has a lesser power of 0.8 mW, has to be focused on the heated area of the pump beam. The probe beam detects the temperature change caused by the pump beam. The temperature change is monitored by the reflectivity change with a differential photodetector (Front Detection). The photodetector’s signal is used for further signal processing. So there are no absolute temperature values for the thermal transient, but the amplitude is directly proportional to temperature (thermo-reflectance principle).
To measure the temperature dependency of the thermal properties, there is an oven integrated into the TDTR systems. The measurements with the NanoTR were performed from room temperature to 300 °C and the PicoTR from room temperature up to 500 °C. All the measurements were done under nitrogen atmosphere to avoid oxidation.
Nb2O5 is transparent for both laser wavelengths, λProbe and λPump, so an optical transducer on the top surface of the sample was needed to get an optical reflectance of the probe laser. Therefore, a Pt-layer (100 nm thickness) was sputtered above the Nb2O5 [11].
The PicoTR and NanoTR measurement systems vary by their time resolution. The PicoTR records the response of pulse heating in picoseconds (ps) and NanoTR in nanoseconds (ns). Both systems also have a different repetition time of pulse heating (Tp), which restricts the maximal recording time of the thermal transient. These facts enable an investigation of the sample in different length scales.

2.2. Finite Volume Simulation

To validate the application of the proposed methodology, thermal simulations were carried out, visualizing the heat path of the Nb2O5 film.
A fully 3D geometrical model of the Nb2O5 sample was built in FloTHERM® (12.1., Mentor Graphics, Wilsonville, OR, USA) (see schematic in Figure 1). The initial thermal properties of the materials (e.g., thickness (d), cross-sectional area (A), density (ρ), specific heat (cp)) were added to the simulation model according to literature values and experimental results. The thermal conductivity (λ) and the thermal interface resistance (TIR) were adjusted to the measurements. The experimental parameters, as time resolution (tp), length of measurement period (Tp), laser power (PPump), and illuminated area (ØPump) were reconstructed in the simulation according to PicoTR and NanoTR. The input of thermal power was placed from the surface 10 nm deep into the transducer, taking into account the optical penetration depth of the pump laser in Pt [12]. The temperature change was recorded with monitor points in the middle of the simplified uniformly heated area of ØPump.

2.3. Theoretical Background

An established analysis for thermal transients, typically used for thermal transients of microelectronic devices, is the structure function. The thermal transient is transformed into a one-dimensional heat path representation. The heat path is represented in the structure function as a ladder network of R t h s and C t h s . These network elements contain information about the involved materials. The R t h is a function of d / ( λ · A ) and the C t h is c p · d · A · ρ [8].
In this work, the transformation of the thermal transient into its structure function was applied on the thermal transient of a TDTR measurement. The transformation is valid when the heat source as well as the probing of the thermal transient happens on the same place of the sample. For the Nb2O5 sample, this happened at the Pt-transducer. Furthermore, the validity of a diffusive and a one-dimensional heat transport has to be assured, using the structure function for validation. These demands were met, as the diameter of the laser spot is larger than the thermal diffusion length of the excited layer. [13] The error caused by the assumption of the one-dimensional heat transport was estimated by the comparison of the fully 3D simulation model with the 1D simulation model. The relative error was 3% for the PicoTR measurement and 8% for the NanoTR measurement [14].
The thermal path investigation of microelectronic devices is realized by recording the switching-off response of the device [15,16]. So the power excitation is a step-function. However, in the TDTR measurement, the thermal transient originates a laser pulse excitation. [10] Therefore, the calculation of the structure function has to be modified, which is described in the following sections.

2.3.1. Structure Function for Dirac-Delta Function Excitation (NanoTR)

To apply the same calculation of the structure function as it is used for a step-function thermal transient, the calculations of the structure function have to be modified. The thermal excitation of the pump laser has to be regarded as a Dirac delta function ( δ ) [17].
The thermal transient T ( t ) is the product of power P and thermal impedance Z t h . Z t h in the Laplace domain as a function of the complex frequency (s), is written in Equation (1). Z t h ( s ) can be transformed into an analogous R t h C t h -network [18], a Foster-type network, where τ i = R t h , i · C t h , i [19].
Z t h ( s ) = i R t h , i ( 1 + τ i s ) ,
The power excitation in the form of a Heaviside step-function ( H ) is in the time domain P ( t ) = P 0 · H ( t ) and in the Laplace domain P ( s ) = P 0 · 1 / s . P 0 is the absolute power value. The temperature change in terms of the R t h C t h -network is:
T H ( s ) = P 0 i R t h , i s ( 1 + τ i s ) ,
T H ( t ) = P 0 i R t h , i   ( 1 e t τ i )
The power excitation by δ can be written as P ( t ) = P 0 δ ( t ) or as P ( s ) = P 0 , so the temperature change is Equation (4) and its inverse Laplace transformation is Equation (5).
T δ ( s ) = P 0 i R t h , i ( 1 + τ i s )
T δ ( t ) = P 0 i R t h , i   e t τ i τ i
Equation (3) is the time derivative of Equation (5); the integration of the temperature change of a δ ( t ) -excitation over time results in a temperature change of a H ( t ) -excitation. Therefore, the time integration of the thermal transients of a TDTR measurement allows for calculating the time constant spectrum in the same way as it is done for the step-function thermal transient (NID-method [20]). The time constant spectrum is a function of R t h , i over τ i , and hence, the values for the Foster network after discretization. The Foster network [21] has to be transformed into a Cauer network to get a physical meaning of R t h and C t h . The cumulative Cauer network’s C t h as a function of its cumulative R t h is the structure function [22].

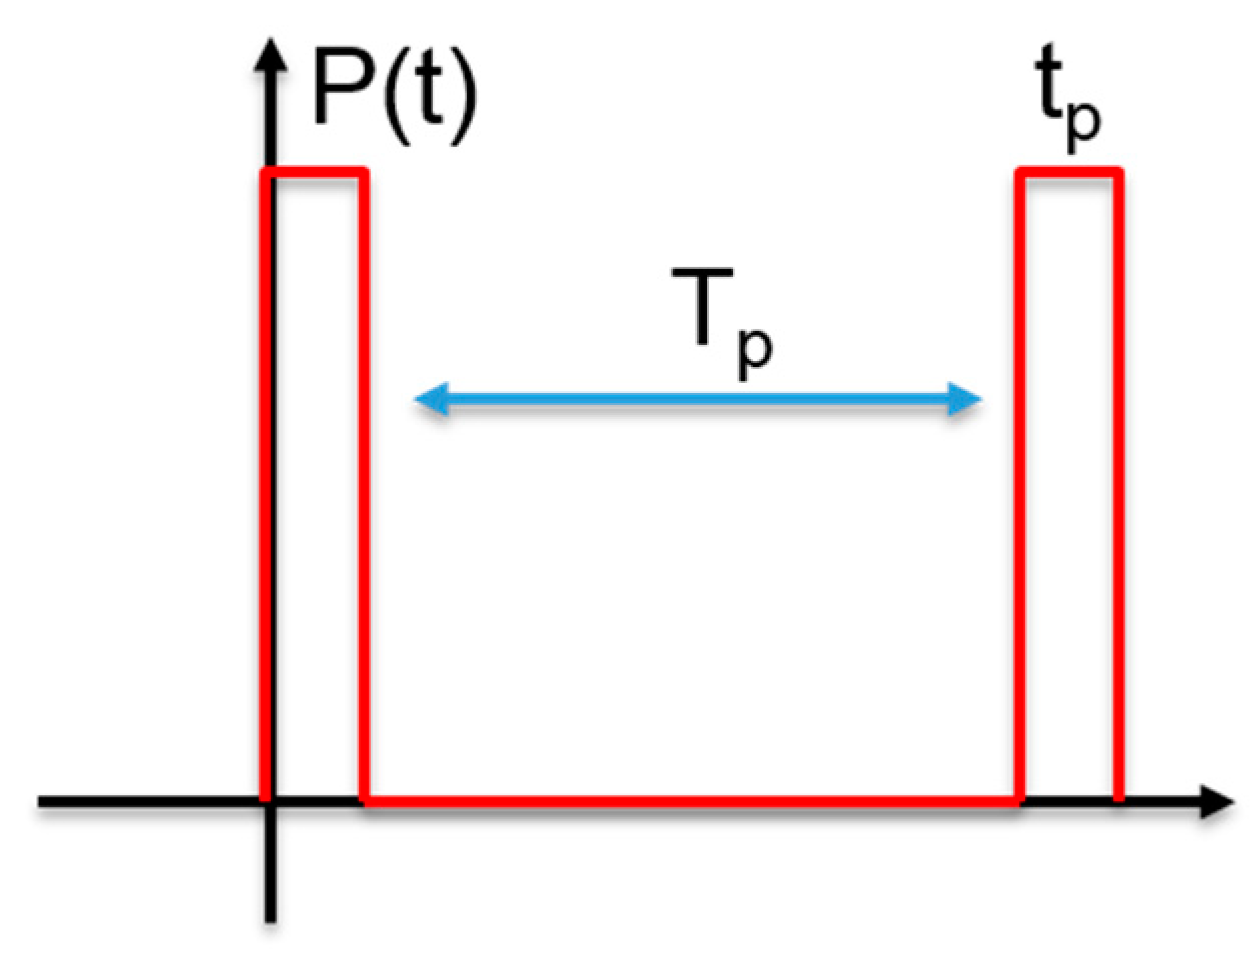
2.3.2. Structure Function for Cycled Pulsed Excitation (PicoTR)

The above-mentioned structure function calculation is only valid if the repetitive laser pulse excitations do not affect each other. Therefore, the thermal transient has to reach a thermal equilibrium during Tp. This demand is not always fulfilled with regards to a TDTR measurement—especially a PicoTR measurement with a Tp of 50 ns.
Therefore, the power excitation has to be assumed as a single Dirac-delta function, but as a pulsed cycled excitation event (Figure 2). The thermal transient of the TDTR has to be regarded as a pulsed thermal transient [23,24]. There, the repeated pulse train of the pump beam (Tp) is assumed to appear in a square shape, with a certain peak width (tp). Now, Z t h ( t ) is not only a function of time but also a function of the duty, the ratio between tp and Tp. Z t h ( t ) of an intercycle is described in Equation (6).
Z t h ( t , t p T p ) =   j Z t h ( j T p ) Z t h ( j T p t p )
With the use of Equation (3), the equation above can be rewritten as,
Z t h , i ( t , t p T p ) = j R t h , i ( 1 e j T p τ i ) R t h , i ( 1 e j ( T p t p ) τ i ) = R t h , i   ( e T p τ i 1 )   j e j T p τ i
and with the identity j a j = 1 a 1 , Equation (7) can be transformed to Equation (8).
Z t h , i ( t , t p T p ) = R t h , i   e t p τ i 1 e T p τ i 1 = R t h , i   e t τ i 1 e t ( T p \ t p ) τ i 1 Σ i Z t h ( t , t p T p ) = i R t h , i   e t τ i 1 e t ( T p \ t p ) τ i 1
To get the time constant spectrum out of this equation, the logarithm of the time variables ( z = log ( t ) ;   ξ = log ( τ ) ) is used:
Z t h =   i R t h , i   e e z ξ 1 e ( T p \ t p ) e z ξ 1 R ( z ) e e z 1 e ( T p \ t p ) e z 1
Equation (9) takes into account the influence of repetitive pump laser pulses.

3. Results

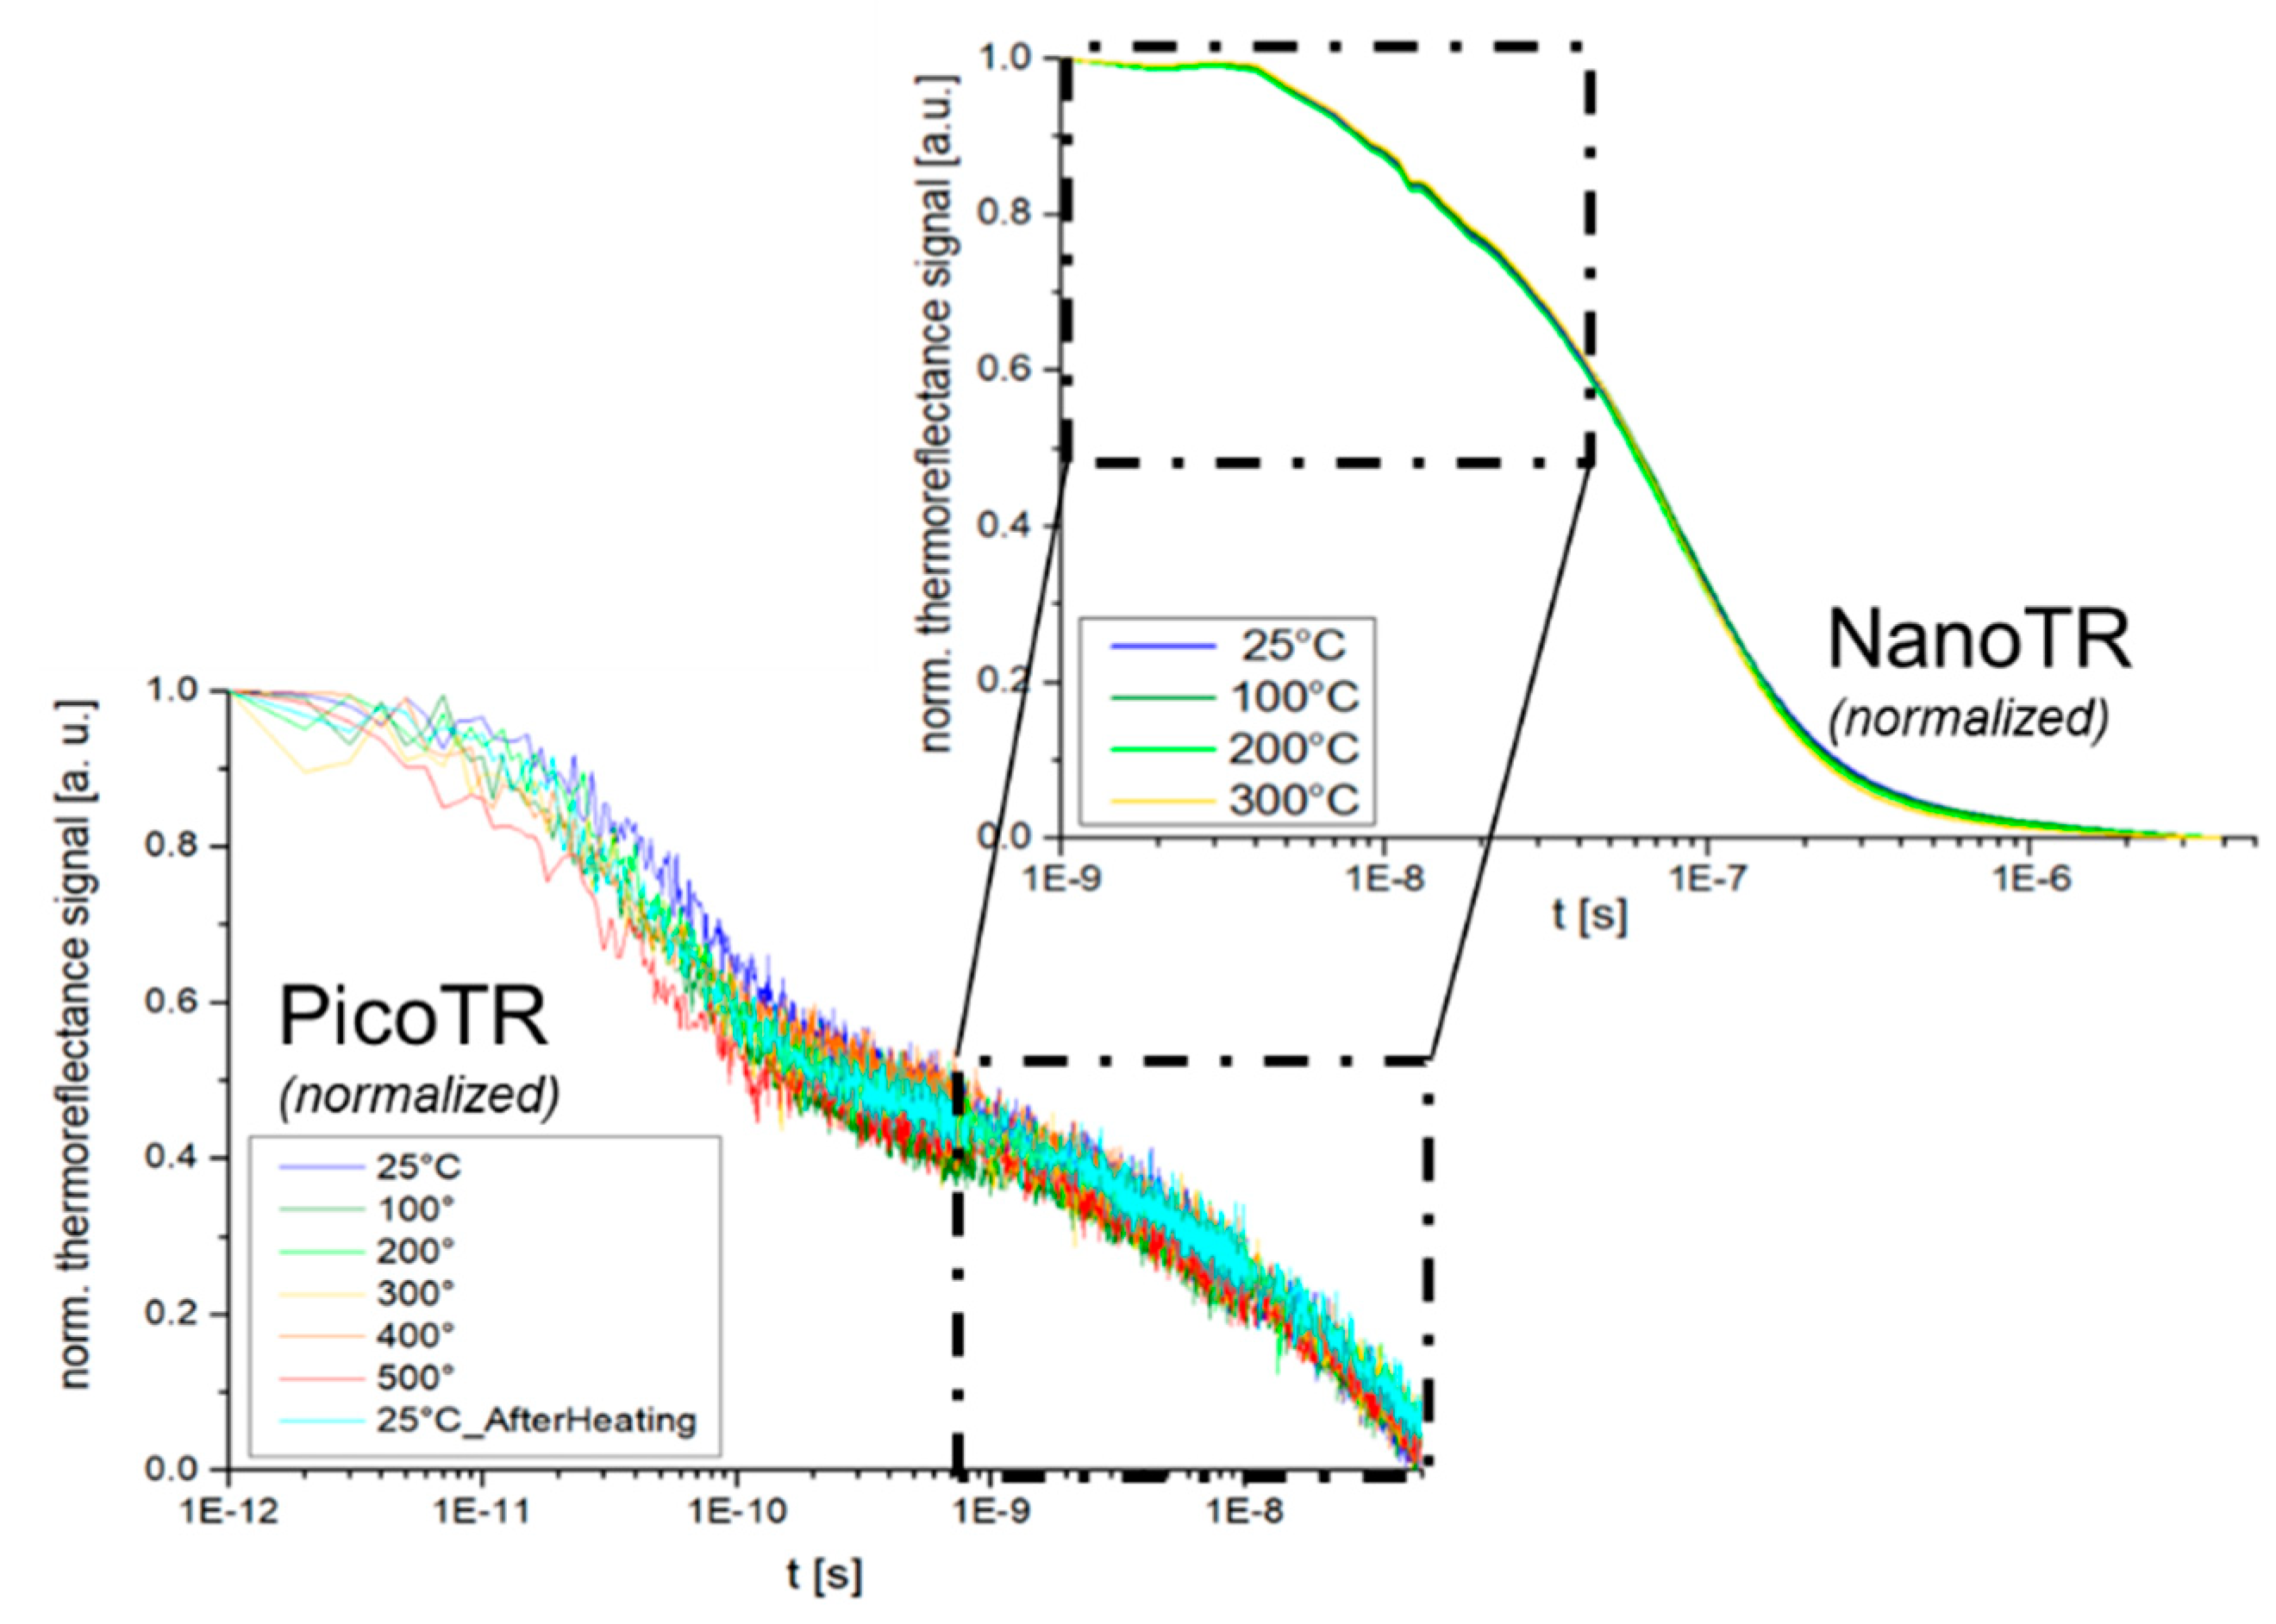
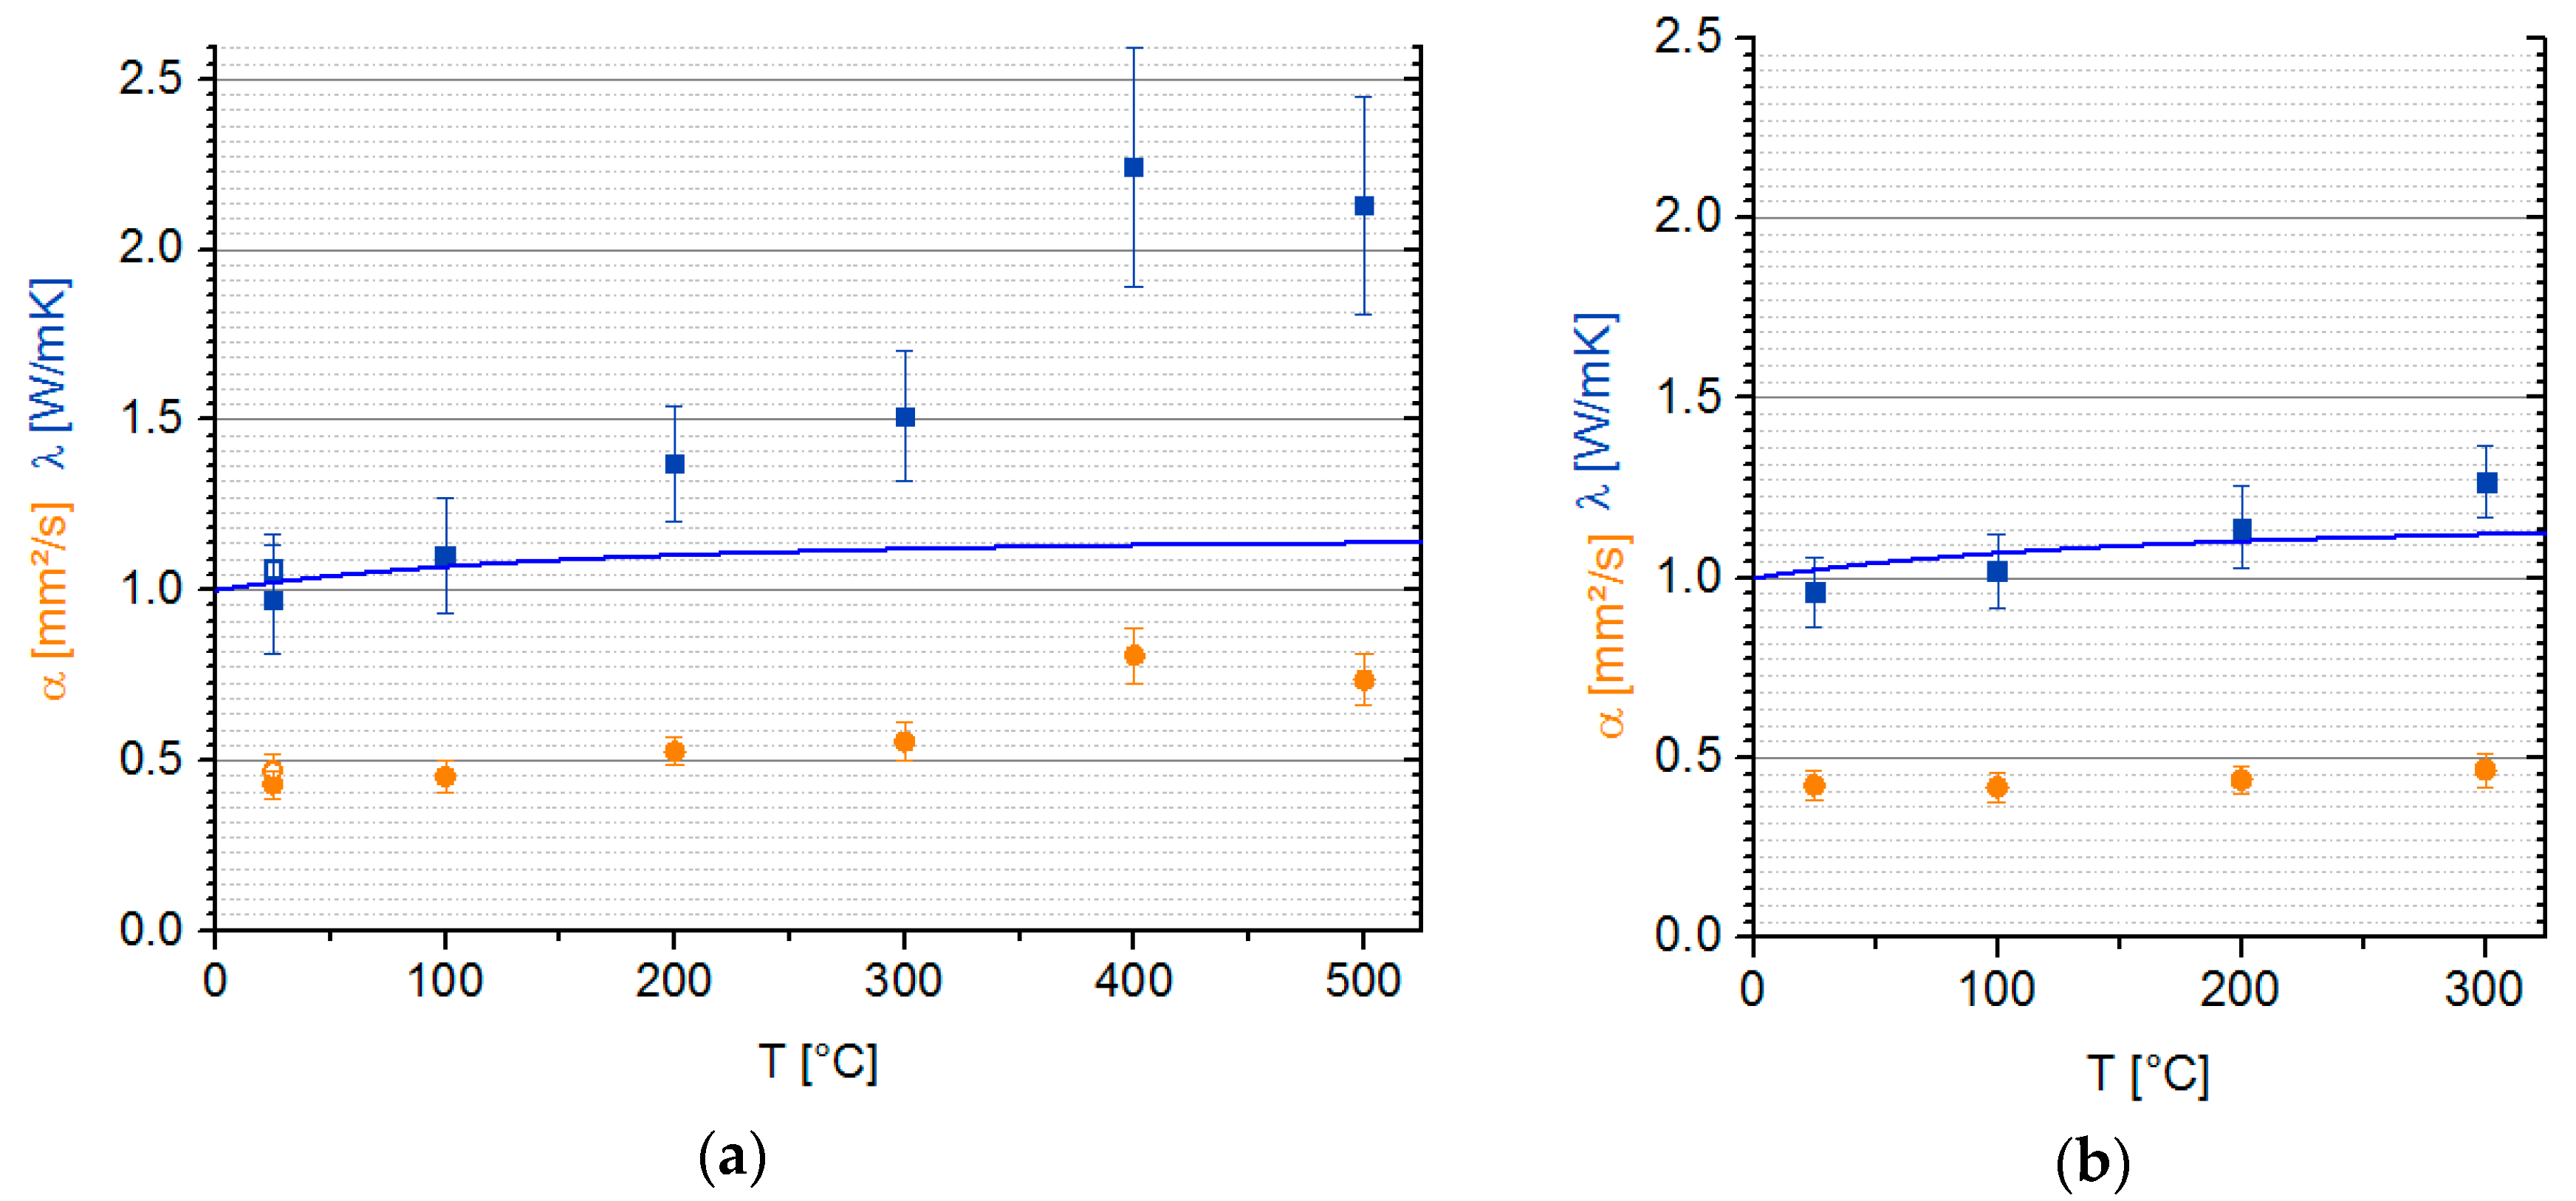
3.1. Analytical Solution of Fourier’s Law to Evaluate Thermal Diffusivity

The Nb2O5 film was measured with both PicoTR and NanoTR at different ambient temperatures. The measured and normalized thermal transients are shown in Figure 3. An established way to obtain the thermal properties of the Nb2O5 film is fitting Fourier’s heat equation to these thermal transients [5]. As there is Pt as the transducer [25] and Si as the substrate, the heat equation of multiple layers was used for further analysis. The temperature-dependent properties of Nb2O5 [26], Pt [27,28,29] and Si [29,30,31] were based on values from the literature. The values for α of Nb2O5 resulted from the fit are presented in Figure 4. From α , the λ can be calculated:
α = λ c p · ρ
The c p of Nb2O5 as a function of temperature was taken from Reference [32]. This increasing behaviour of c p with temperature was confirmed by Reference [33] due to the excitation of more high-energy phonon modes. The Nb2O5 density was measured via XRR (Rigaku SmartLab 5-circle diffractometer). XRR curves were recorded over a range of 6 degrees and evaluated by GenX software [34], resulting in a value of 4750 kg/m³.
The sample was measured by the PicoTR (Figure 4a). Figure 4a shows that α increased with the ambient temperature from 0.43 mm2/s to 0.74 mm2/s. The thermal interface resistance (TIR) between Pt and Nb2O5 of 18 Km2/GW was obtained by the evaluation of the thermal transient. The TIR showed no significant temperature dependency in the measured temperature range. The value of the TIR was in a comparable range to the results of References [36,37].The thermal conductivity was calculated with Equation (10) and had a value of (0.98 ± 0.16) W/mK at 25 °C. The thermal conductivity values at 25 °C and 100 °C agreed with the measurements of Reference [33]. The error of the PicoTR measurements was dominated by the signal to noise ratio of the thermal transient and the uncertainty of the Nb2O5 density. The thermal conductivity showed the characteristic temperature dependence of an amorphous solid: an increase of the thermal conductivity with increasing temperature [38,39]. An increase of thermal conductivity by more than a factor of two was observed from 25 °C to 500 °C.
For amorphous solids, Cahill et al. [35] developed a minimum thermal conductivity model, which was compared to the measurement results.
λ min = ( π 6 ) 1 3 k B n 2 3 i v i ( T θ D , i ) 2 0 θ D , i T x 3   e x ( e x 1 ) 2   d x ,
where k B is the Boltzmann constant and n is the number density of atoms (n = 7.53 × 1022 cm−3). Equation (11) considers the three sound modes (two transverse and one longitudinal) with the speed of sound v i . The transverse speed of sound had a value of 3202 m/s and was calculated with the shear modulus of 49 GPa [40]; the longitudinal speed of sound was 5311 m/s according to Young’s modulus of 134 GPa [41]. θ D , i , the cutoff frequency for each mode expressed as a temperature unit, was calculated via θ D , i = v i ( / k B ) ( 6 π 2 n ) 1 3 . The calculated and measured thermal conductivities of Nb2O5 (Figure 4) are comparable at 25 °C and 100 °C. However, at 200 °C, the measured thermal conductivity started to increase, whereas the calculated thermal conductivity stayed nearly constant (Δλ = 0.04 W/mK between 200 °C and 500 °C). This discrepancy is still under investigation and not clearly understood yet.
After the PicoTR measurement, the sample was again measured at 25 °C (Figure 4a—open marker), to see if the sample was affected by the temperature treatment during measurement. α and therefore λ , were nearly equal before and after the heating: 0.43 mm2/s to 0.47 mm2/s and 1.0 W/mK to 1.1 W/mK. The variation of these values were within the measurement error range. So further investigation was carried out at the NanoTR on the same sample. The measurements with the NanoTR were done up to an ambient temperature of 300 °C. The NanoTR error arose mainly from the uncertainty of the Nb2O5 thickness and density. The results of α and λ of Nb2O5 fitted to the ones of PicoTR, according to the measurement error range. Differences between NanoTR and PicoTR may appear due to the different time resolution and time range.

3.2. Structure Function to Analyse the Heat Path in Nb2O5

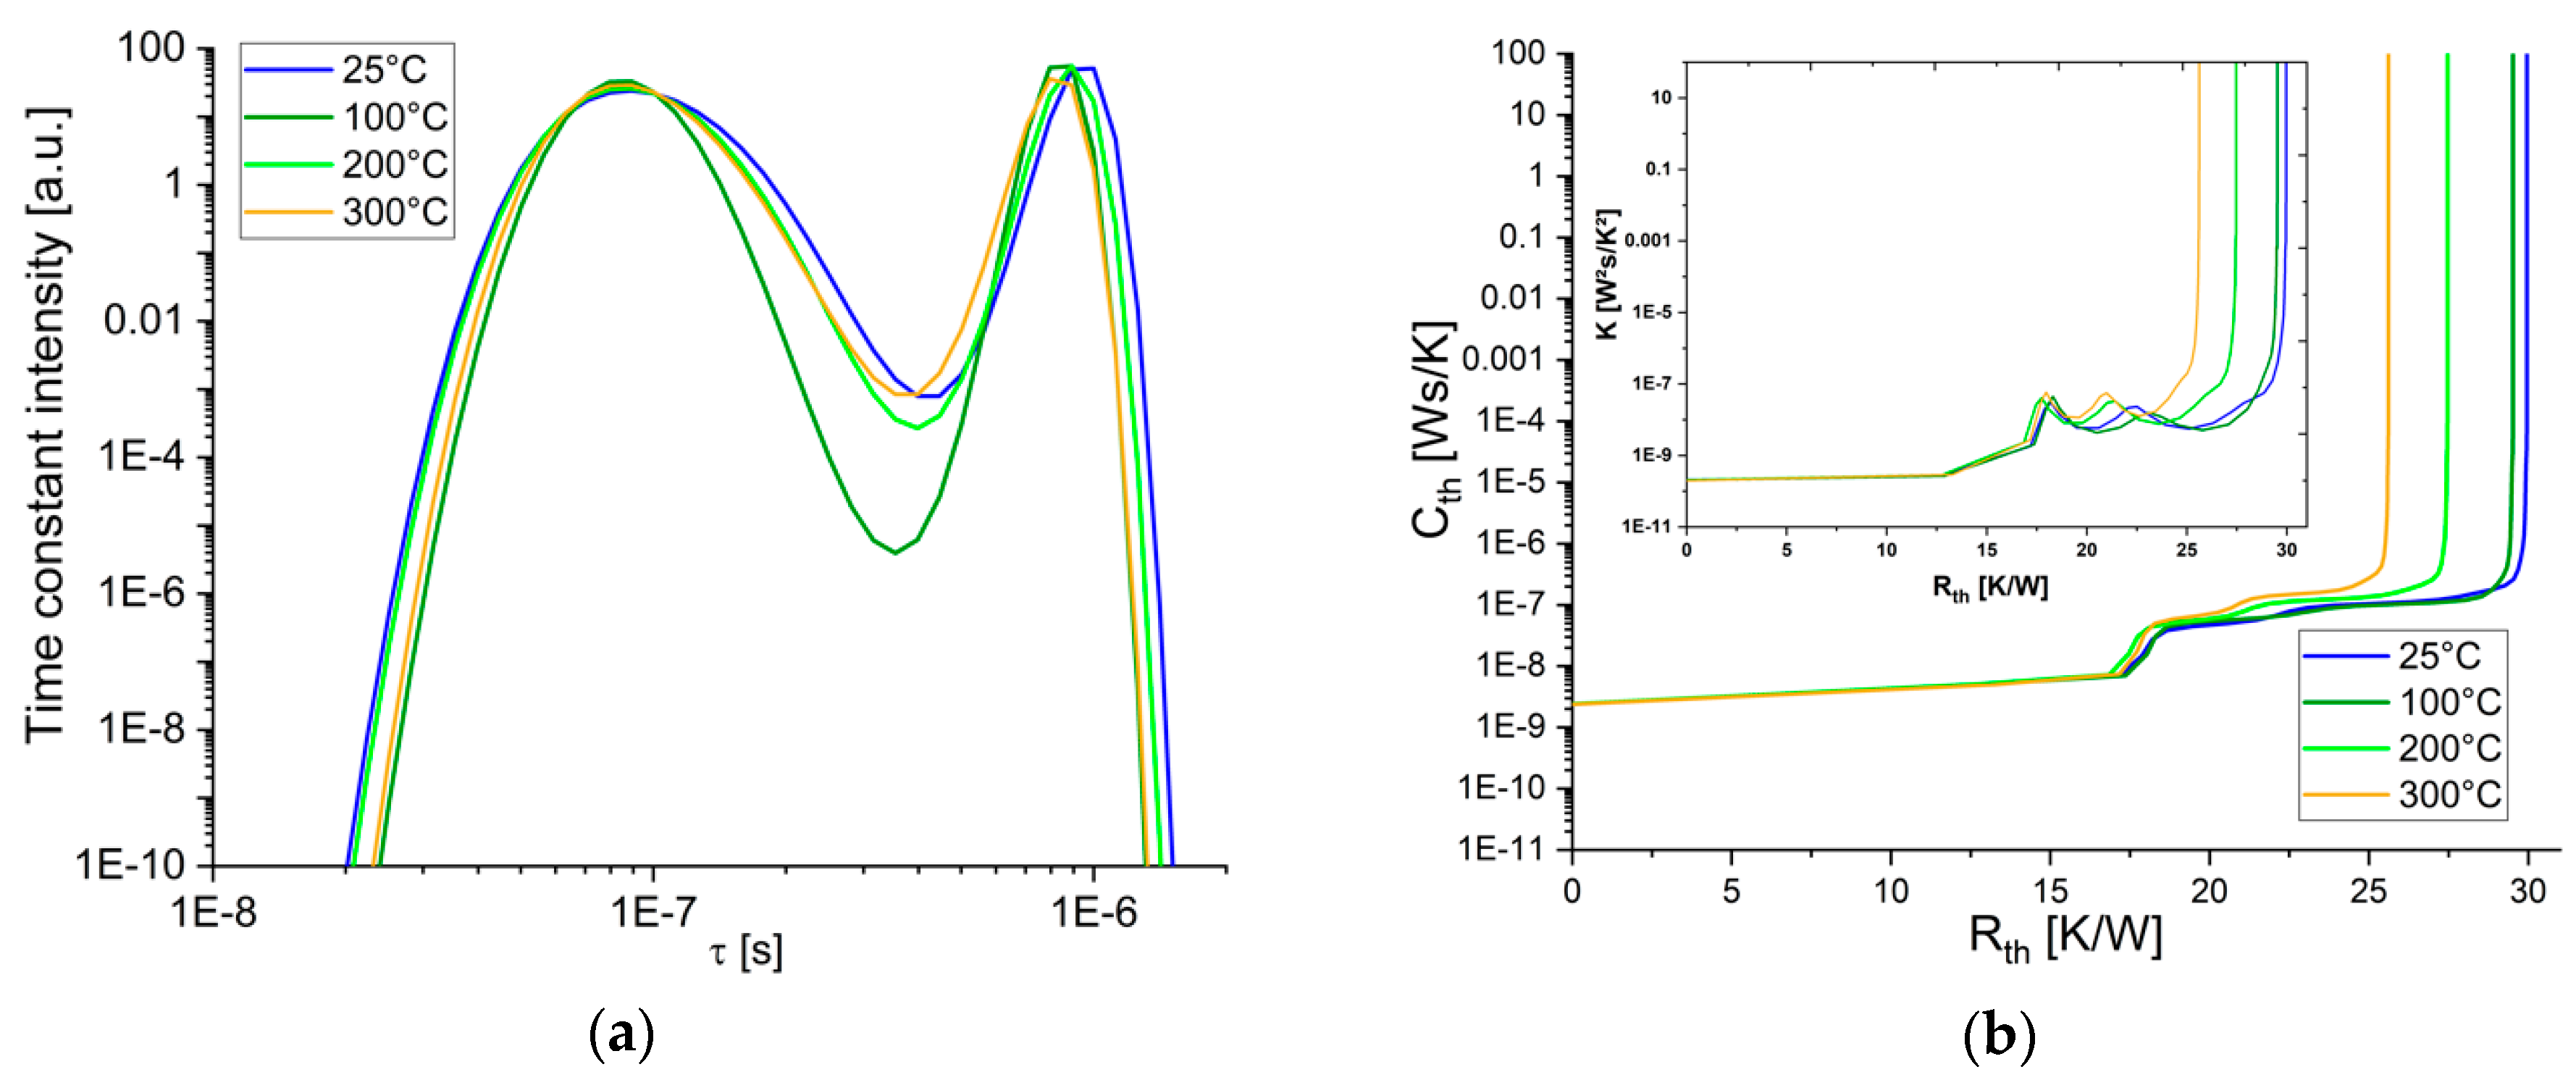
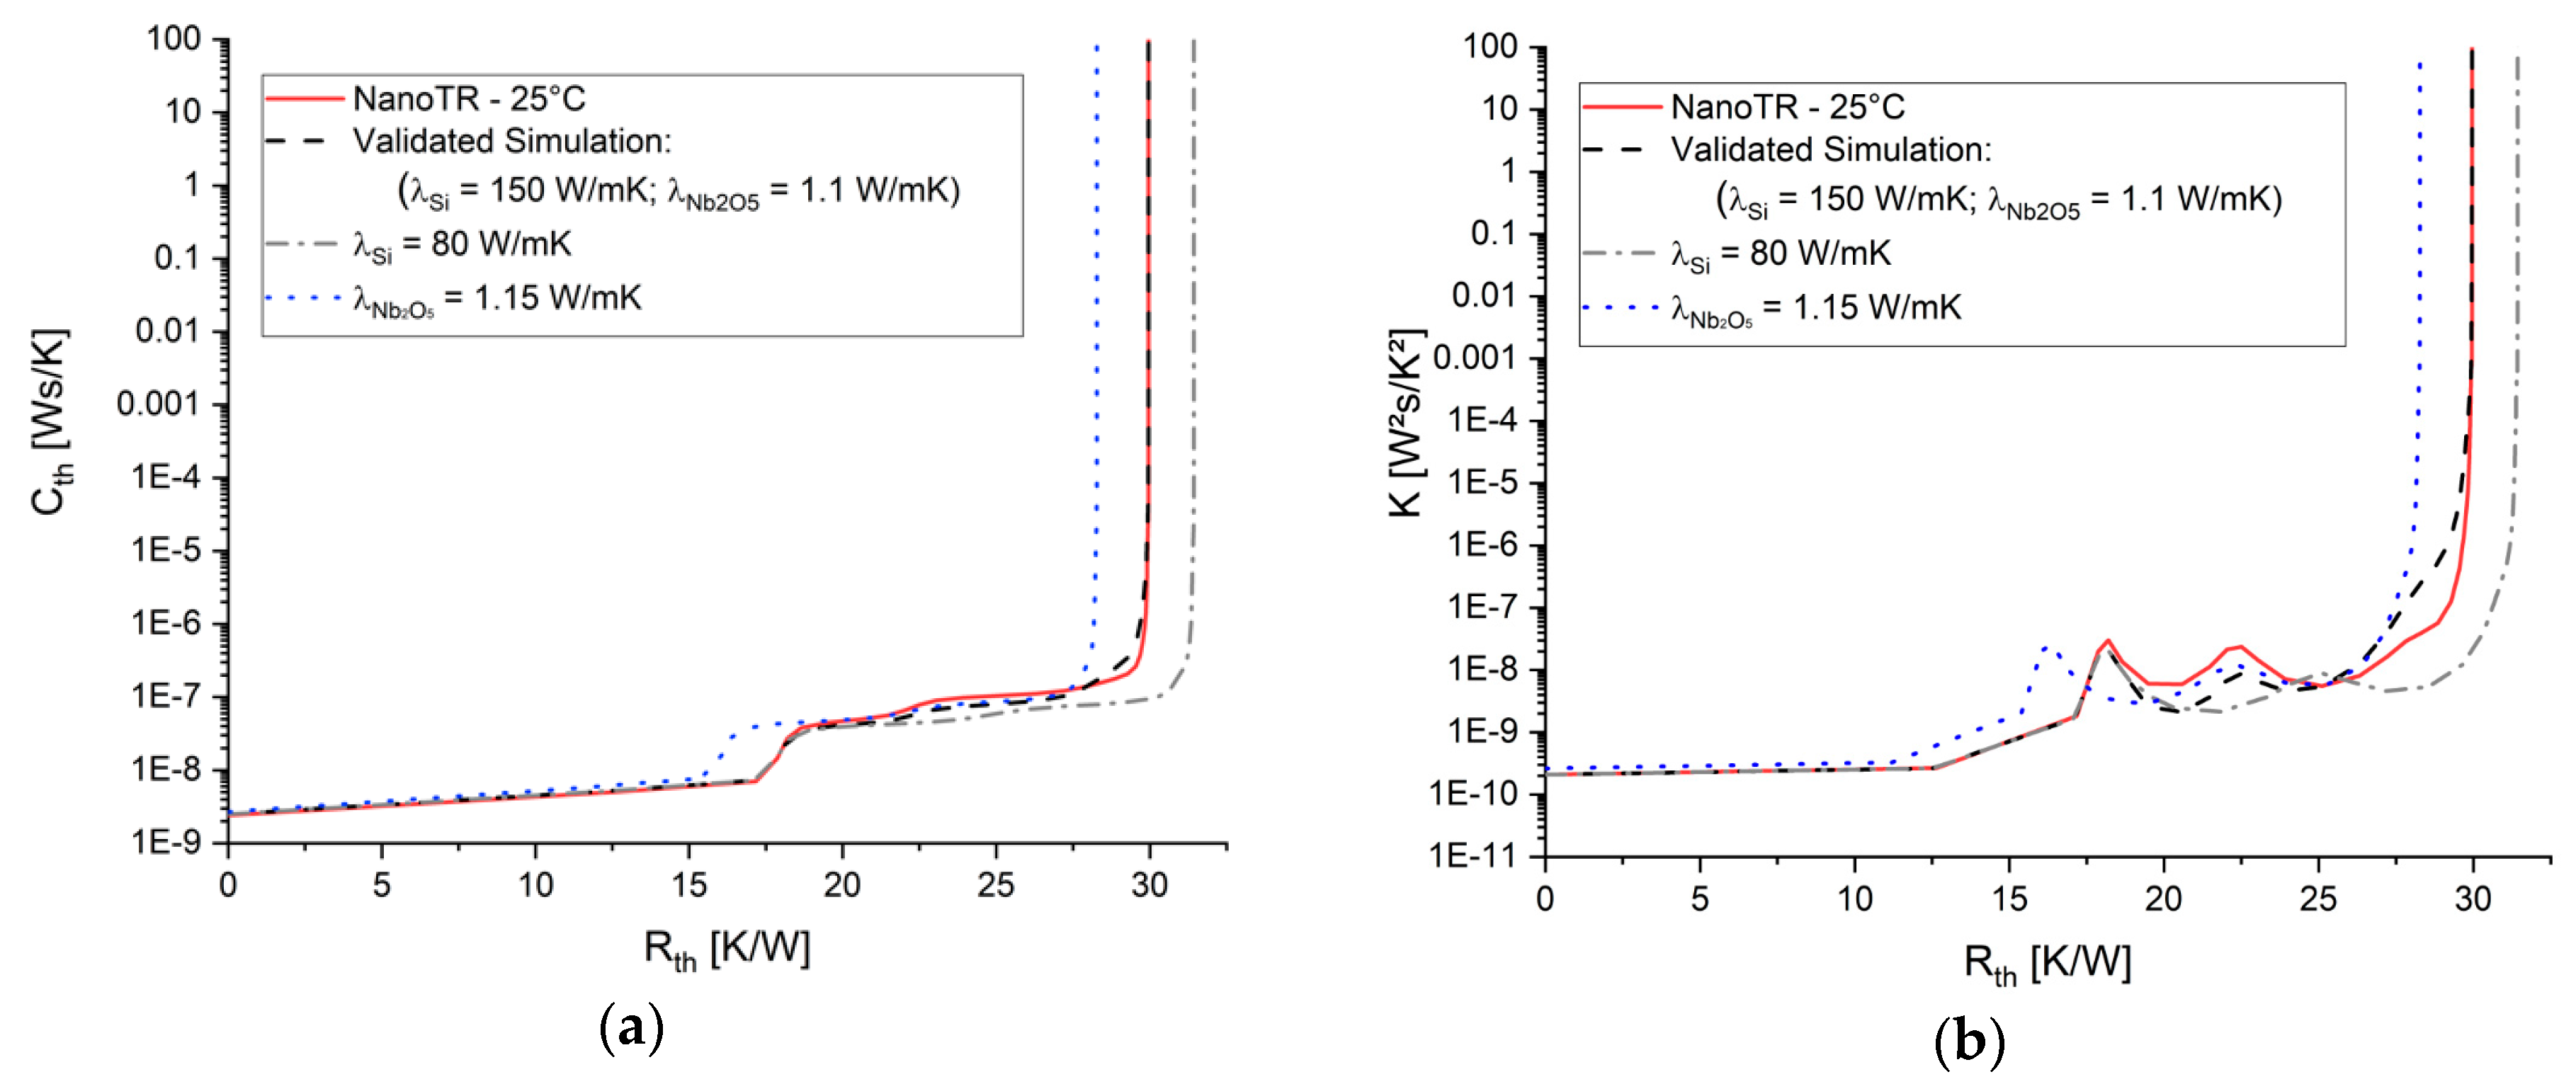
3.2.1. Structure Function for Delta Function Excitation of Nanosecond Thermal Transients

The structure function calculation of Section 2.3.1. was applied on the normalized thermal transients of a NanoTR measurement. The trend of the thermal properties respectively to temperature can be seen here in terms of total R t h (Figure 5) like in Section 3.1. The resulting time constant spectrum of the NanoTR measurements showed two peaks, at 100 ns and 900 ns (Figure 5 inlet). The structure function comprised two step-like features, accordingly. It could be assumed that two different materials, dominating the thermal path, contribute to these features. However, the thermal transients of the NanoTR provided only relative temperature values. Therefore, a scaling factor (x) had to be applied on the structure function to get quantitative values (x−1 · R t h and x · C t h ).
To verify this assumption and determine the scaling factor x, the NanoTR measurement was reconstructed by numerical simulation. The simulation showed that the time resolution of NanoTR was not able to catch the heat path of the transducer, the Pt-layer. The characteristic time of a 100 nm Pt-layer lies under 1 ns according to Equation (1). The simulation revealed that the first step-like feature in the structure function depended on both TIR, between Pt and Nb2O5, between Nb2O5 and Si, and on the Nb2O5 film itself. These parameters were relevant for the R t h value of the step-feature. The λ of Nb2O5 also influenced the ratio between R t h and C t h , not only the position on the x-axis but also the height of the step-feature. The rear part of the structure function appeared to be sensitive to the thermal properties of the Si substrate (Figure 6).
Both the measured at 25 °C and simulated thermal transients were normalized, from which the structure functions were calculated. Then, the structure function of the simulation was adjusted to the measured one. The resulting parameters of the best structure functions’ match (validated simulation) were: T I R P t N b 2 O 5 = 13 Km2/GW; λ N b 2 O 5 = 1.0 W/mK; T I R P t N b 2 O 5 = 15 Km2/GW; λ S i = 150 W/mK. The used parameters for the validated simulation were in accordance with the analytical solutions (compare to Figure 4). After validation, the scaling factor x and the absolute values of R t h and C t h can be determined using the non-normalized simulated thermal transient. The scaling factor x in the case of NanoTR measurements had a value of 4.53 × 10⁻⁹. With the assumption that the thermoreflectance coefficient stayed the same for all the NanoTR measurements (Figure 5)—their Rth values are 30 K/W to 26 K/W from 25 °C and 300 °C respectively.

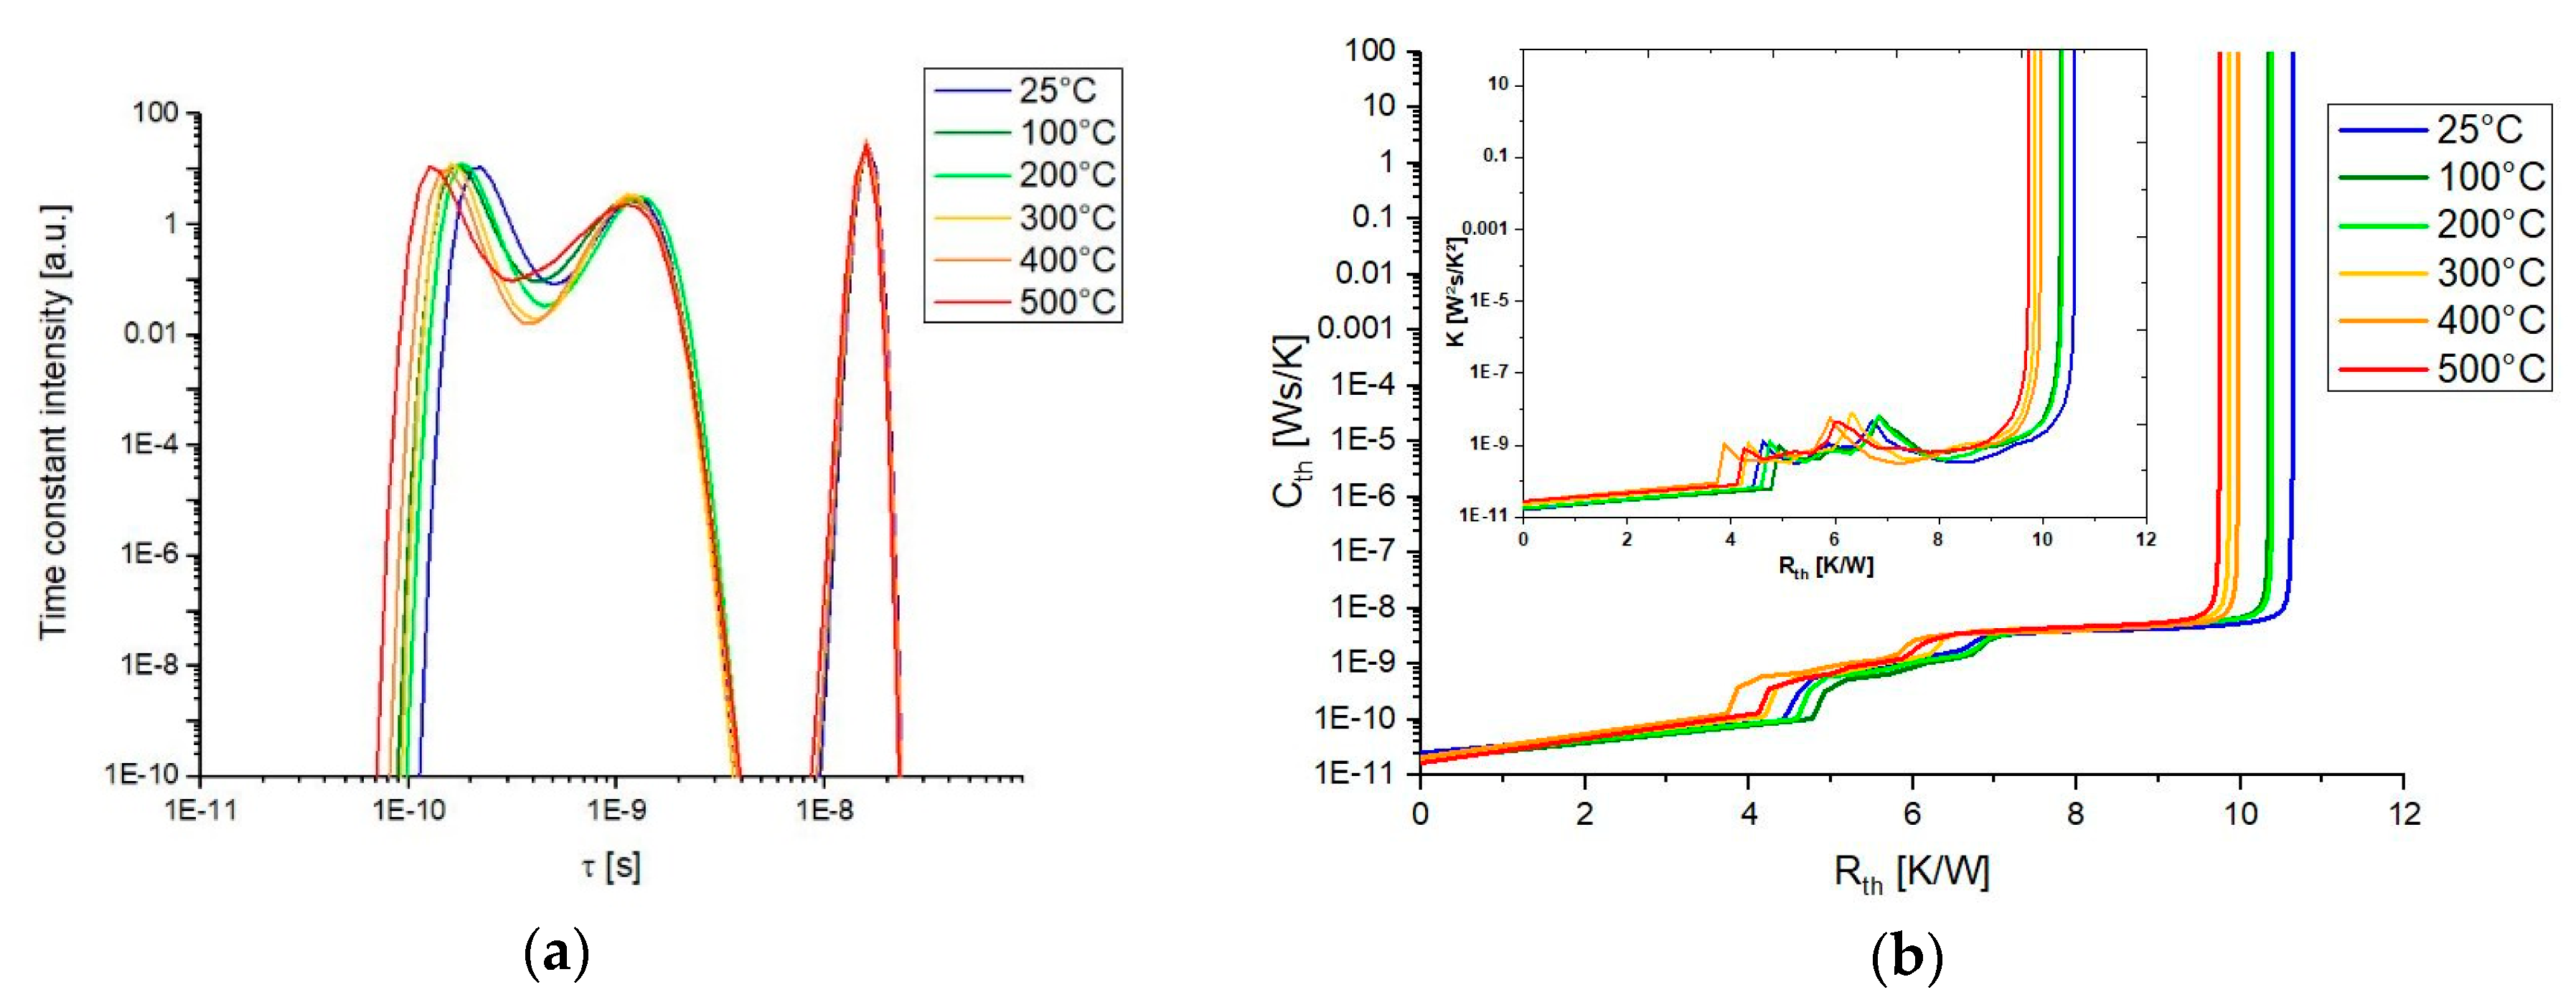
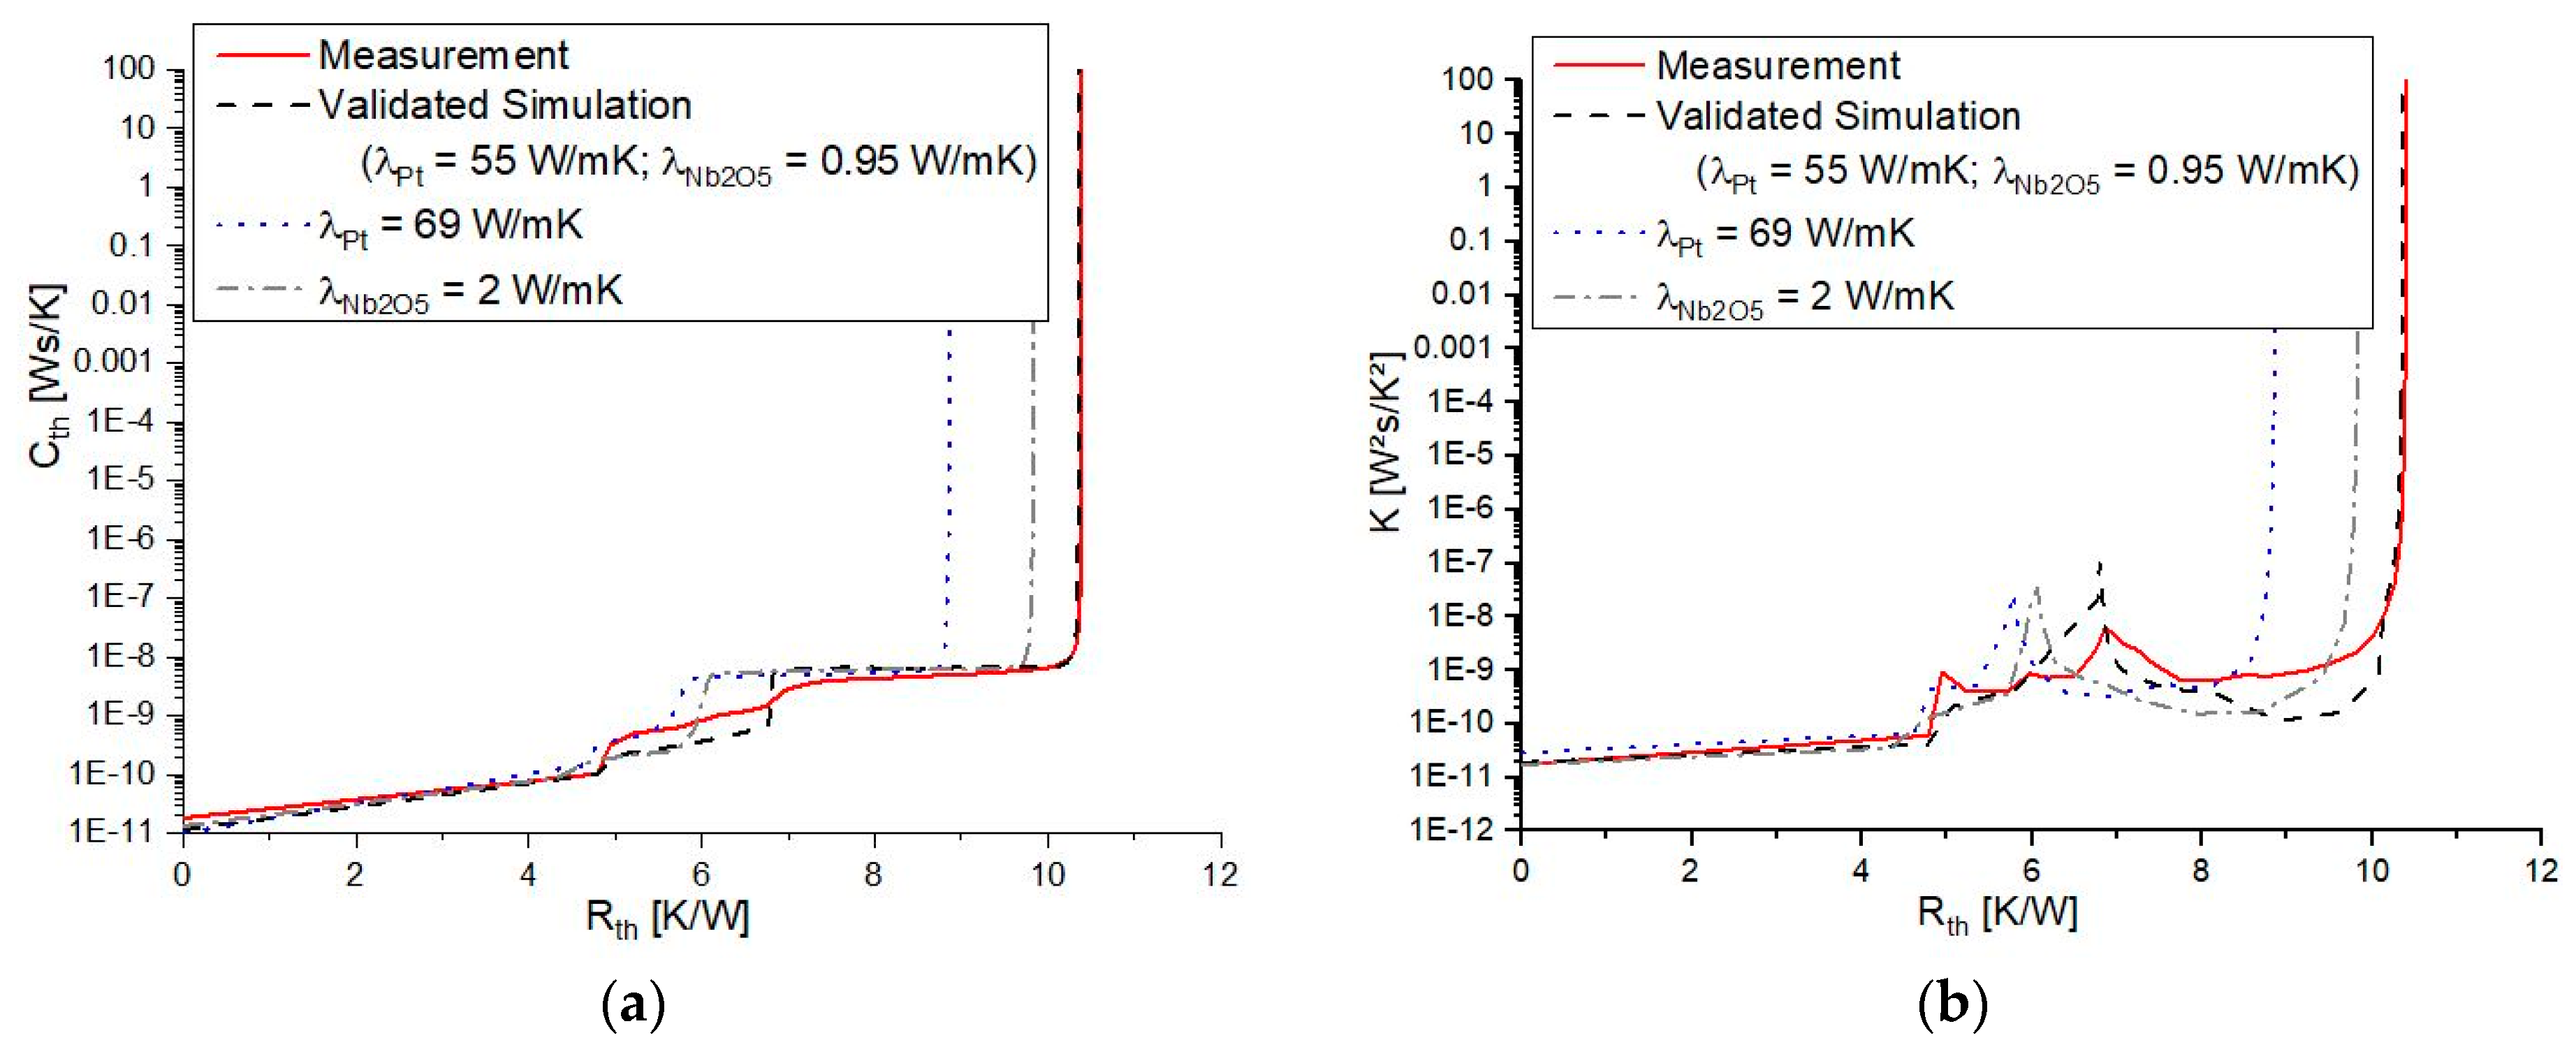
3.2.2. Structure Function for Pulsed Cycled Excitation of Picosecond Thermal Transients

The thermal transients of the PicoTR measurements showed a signal to noise ratio of 16 dB (Figure 3). Before calculating the structure functions with the thermal transients of the PicoTR, they had to be smoothed via a Savitzky-Golay filter [42]. Here, a moving window of 351 points and a polynomial degree of 4 was applied to get rid of the noise. The calculation of Section 2.3.1. was carried out for the PicoTR thermal transients, resulting in a structure function without any features. This did not represent reality, since the sample consisted of multiple layers, multiple peaks in the time constant spectrum, and features in the structure function were expected. Therefore, the calculation of the structure function was carried out accordingly to Section 2.3.2. There, the influence of the repetitive excitation is taken into account, due to the high pump laser repetition rate of 20MHz at the PicoTR [43,44]. This effect is visualized in Figure 7.
The resulting time constant spectrum of the PicoTR measurements (Figure 8) showed three peaks. The first at a τ of (100–200) ps is comparable to the characteristic diffusion time of the Pt-layer. The second and third peak can be found at 1 ns and 15 ns. The three peaks of time constant spectrum can be seen as three humps in the structure function at 5 K/W, 6 K/W, and 7 K/W (Figure 8 inlet). The x-axis of the structure function reflected the results from the analytical solution. The structure function of the 500 °C measurement showed the lowest and the one of 25 °C measurement the highest R t h (Figure 8).
To analyze the structure functions of the PicoTR measurements, thermal simulations had to be carried out too. The simulation thermal transient was recorded after 10 ps of excitation. In the simulation, the thermal transient was recorded in the Pt-layer below the optical penetration depth as recommended by Reference [45]. Then the structure function was calculated from both the normalized PicoTR measurement and simulation. The validated simulation parameters were: λ P t = 55 W/mK; T I R P t N b 2 O 5 = 10 Km2/GW; λ N b 2 O 5 = 0.95 W/mK; T I R P t N b 2 O 5 = 15 Km2/GW; λ S i = 150 W/mK. The validation of the measurement revealed that the first step-like feature is sensitive to the Pt (5 K/W), whose thermal conductivity determines its plateau lengths (Figure 9). Whereas the Nb2O5 is responsible for the second step-feature (7 K/W). Both TIR are formative for the slope of both step-features. The Si substrate of the sample had no influence on the structure function. This is in accordance with the Nb2O5 heat diffusion time of 78 ns. The determining parameter for the total R t h of these structure functions was the thermal conductivity of Nb2O5.
The validated non-normalized thermal transient of the simulation revealed the absolute temperature and hence, the R t h values. The scaling factor here was 0.016. The total R t h decreased from 10.6 K/W to 9.7 K/W with increasing temperature (Figure 8). The analytical solution of the measurement at 400 °C showed the highest thermal conductivity. However, the structure function analysis showed that the total R t h is lower than that of the 500 °C measurement. The structure function revealed that the TIR had a lower value, or a higher thermal conductivity of Pt or Nb2O5 at 400 °C than the rest. The first step appeared at lower R t h (<4 K/W).

4. Discussion

The temperature-dependent thermal conductivity of 166-nm-thin Nb2O5 was investigated via two TDTR systems. The combination of both PicoTR and NanoTR enabled us to investigate the complete heat path of Nb2O5 films, from ps to µs. The numerical analysis and structure function visualized the Nb2O5 temperature-dependent heat path [46]. The structure function of the PicoTR measurements showed the heat path of the Pt-layer in the ps time regime and the Nb2O5 film in the ns time regime. The NanoTR structure function displayed the heat path of the Nb2O5 and its substrate. The temperature dependency of the structure functions is in accordance with the analytical solutions of the thermal conductivity. The indirect proportionality between the thermal conductivity of the analytical solutions and R t h of the structure is a function of temperature and can be seen in Figure 10. In order to assess the Nb2O5 performance and its stability, further investigations have to be carried out upon thermal fatigue cycling.

5. Conclusions

The temperature-dependent thermal properties of a 166-nm-thin Nb2O5 film were investigated via an analytical approach and via structure function by using the signals of two different TDTR systems (ns and ps time resolution).
The analytical approach, based on the multi-layer heat equation, revealed that the thermal diffusivity and thermal conductivity increased with temperature from 0.43 mm2/s to 0.74 mm2/s and from 1.0 W/mK to 2.3 W/mK.
The TDTR measurement transformed into a structure function and reflected the difference in the heat path as R t h and C t h . The measurements at 25 °C to 500 °C showed a decrease of R t h s in the structure function. The PicoTR and NanoTR showed different length scales in the heat path, ranging from nm to µm. PicoTR showed the heat path of the transducer to the Nb2O5 and NanoTR of Nb2O5 to the Si substrate. The structure function offered an identification tool via heat path analysis to localize the material’s change within the thin film multilayer stack. This approach is also applicable for other material systems in the nanometer range.

Author Contributions

Conceptualization, S.D.; methodology, L.M.; simulations, L.M.; validation, L.M., formal analysis, L.M.; investigation, L.M.; experiments, L.M.; writing—original draft preparation, L.M.; writing—review and editing, E.K.; visualization, L.M.; supervision, E.K.; project administration, S.D.; funding acquisition, S.D.

Funding

The authors gratefully acknowledge the financial support under the scope of the COMET program within the K2 Center “Integrated Computational Material, Process and Product Engineering (IC-MPPE)” (Project No 859480) This program is supported by the Austrian Federal Ministries for Transport, Innovation and Technology (BMVIT) and for Digital and Economic Affairs (BMDW), represented by the Austrian research funding association (FFG), and the federal states of Styria, Upper Austria and Tyrol.

Acknowledgments

Juraj Todt (Erich Schmid Institute of Materials Science) is gratefully acknowledged for the XRR measurement. Vignaswaran K. Veerapandiyanis gratefully acknowledged for the Raman measurement. René Hammer and Prof. Heinz Krenn is gratefully acknowledged for the fruitful discussions.

Conflicts of Interest

The authors declare no conflict of interest.

Appendix A

Figure A1. Raman spectra of Nb2O5 film.
Energies 12 00610 g0a1
The Raman spectra showed broad band at 650 cm−1 and 900 cm−1, which indicates the amorphous nature of the Nb2O5 film.

References

  1. Jones, R.E.; Duda, J.C.; Zhou, X.W.; Kimmer, C.J.; Hopkins, P.E. Investigation of size and electronic effects on Kapitza conductance with non-equilibrium molecular dynamics. Appl. Phys. Lett. 2013, 102, 183119. [Google Scholar] [CrossRef]
  2. Coşkun, Ö.D.; Demirel, S.; Atak, G. The effects of heat treatment on optical, structural, electrochromic and bonding properties of Nb2O5 thin films. J. Alloys Compd. 2015, 648, 994–1004. [Google Scholar] [CrossRef]
  3. Lorenz, R.; O’Sullivan, M.; Fian, A.; Sprenger, D.; Lang, B.; Mitterer, C. A comparative study on NbOx films reactively sputtered from sintered and cold gas sprayed targets. Appl. Surf. Sci. 2018, 436, 1157–1162. [Google Scholar] [CrossRef]
  4. Magnien, J.; Mitterhuber, L.; Rosc, J.; Schrank, F.; Hörth, S.; Goullon, L.; Hutter, M.; Defregger, S.; Kraker, E. Reliability and failure analysis of solder joints in flip chip LEDs via thermal impedance characterisation. Microelectron. Reliab. 2017, 76–77, 601–605. [Google Scholar] [CrossRef]
  5. Taketoshi, N.; Baba, T.; Ono, A. Development of a thermal diffusivity measurement system for metal thin films using a picosecond thermoreflectance technique. Meas. Sci. Technol. 2001, 12, 2064–2073. [Google Scholar] [CrossRef]
  6. Székely, V.; Van Bien, T. Fine Structure of Heat Flow Path in Semiconductor Devices: A Measurement and Identification Method. Solid. State. Electron. 1988, 31, 1363–1368. [Google Scholar] [CrossRef]
  7. Rencz, M.; Poppe, A.; Ress, S. A Procedure to Correct the Error in the Structure Function Based Thermal Measuring Methods. In Proceedings of the Twentieth Annual IEEE Semiconductor Thermal Measurement and Management Symposium, San Jose, CA, USA, 11 March 2004. [Google Scholar]
  8. Rencz, M.; Székely, V.; Morelli, A.; Villa, C. Determining Partial Thermal Resistances with Transient Measurements, and Using the Method to Detect Die Attach Discontinuities. In Proceedings of the Eighteenth Annual IEEE Semiconductor Thermal Measurement and Management Symposium, San Jose, CA, USA, 12–14 March 2002; pp. 15–20. [Google Scholar]
  9. Mitterhuber, L.; Defregger, S.; Hammer, R.; Magnien, J.; Schrank, F.; Hörth, S.; Hutter, M.; Kraker, E. Validation methodology to analyze the temperature-dependent heat path of a 4-chip LED module using a finite volume simulation. Microelectron. Reliab. 2017, 79, 462–472. [Google Scholar] [CrossRef]
  10. Netzsch (Ed.) Thermoreflectance by Pulsed Light Heating Thermoreflectance—NanoTR/PicoTR. Available online: https://www.netzsch-thermal-analysis.com/media/thermal.../Thermoreflectance.pdf (accessed on 14 February 2019).
  11. Wilson, R.B.; Apgar, B.A.; Martin, L.W.; Cahill, D.G. Thermoreflectance of metal transducers for optical pump-probe studies of thermal properties. Opt. Express 2012, 20, 28829–28838. [Google Scholar] [CrossRef] [Green Version]
  12. Werner, W.S.M.; Glantschnig, K.; Ambrosch-Draxl, C. Optical constants and inelastic electron-scattering data for 17 elemental metals. J. Phys. Chem. Ref. Data 2009, 38, 1013–1092. [Google Scholar] [CrossRef]
  13. Hopkins, P.E.; Serrano, J.R.; Phinney, L.M.; Kearney, S.P.; Grasser, T.W.; Harris, C.T. Criteria for Cross-Plane Dominated Thermal Transport in Multilayer Thin Film Systems During Modulated Laser Heating. J. Heat Transf. 2010, 132, 081302. [Google Scholar] [CrossRef]
  14. Chen, H.; Lu, Y.; Gao, Y.; Zhang, H.; Chen, Z. The performance of compact thermal models for LED package. Thermochim. Acta 2009, 488, 33–38. [Google Scholar] [CrossRef]
  15. Székely, V.; Szalai, A. Measurement of the time-constant spectrum: Systematic errors, correction. Microelectron. J. 2012, 43, 904–907. [Google Scholar] [CrossRef]
  16. Székely, V.; Rencz, M.M. Increasing the Accuracy of Thermal Transient Measurements. IEEE Trans. Compon. Packag. Technol. 2002, 25, 539–546. [Google Scholar] [CrossRef]
  17. Ezzahri, Y.; Shakouri, A. Application of network identification by deconvolution method to the thermal analysis of the pump-probe transient thermoreflectance signal. Rev. Sci. Instrum. 2009, 80, 074903. [Google Scholar] [CrossRef] [PubMed]
  18. Russo, S. Measurement and Simulation of Electrothermal Effects in Solid-State Devices for RF Applications. Ph.D. Thesis, Universita Degli Studi di Napoli Ferderico II, Napoli, Italy, 2010. [Google Scholar]
  19. Glavanovics, M.; Zitta, H. Thermal Destruction Testing: An Indirect Approach to a Simple Dynamic Thermal Model of Smart Power Switches. In Proceedings of the 27th European Solid-State Circuits Conference, Villach, Austria, 18–20 September 2001; Volume 2. [Google Scholar]
  20. Székely, V. A new evaluation method of thermal transient measurement results. Microelectron. J. 1997, 28, 277–292. [Google Scholar] [CrossRef]
  21. Jakopovid, Z.; Bencic, Z.; Koncar, R.; Jakopovid, R.K.Z.; Bencic, Z. Identification of thermal equivalent-circuit parameters for semiconductors. In Proceedings of the 1990 IEEE Workshop on Computers in Power Electronics, Lewisburg, PA, USA, 5–7 August 1990; pp. 251–260. [Google Scholar]
  22. Masana, F.N. A straightforward analytical method for extraction of semiconductor device transient thermal parameters. Microelectron. Reliab. 2007, 47, 2122–2128. [Google Scholar] [CrossRef]
  23. Stout, R.P. How to Generate Square Wave, Constant Duty Cycle, Transient Response Curves; Semiconductor Component Industries, LLC: Phoenix, AZ, USA, 2006. [Google Scholar]
  24. Székely, V.; Rencz, M. Thermal Dynamics and the Time Constant Domain. IEEE Trans. Compon. Packag. Technol. 2000, 23, 587–594. [Google Scholar] [CrossRef]
  25. Norris, P.M.; Caffrey, A.P.; Stevens, R.J.; Klopf, J.M.; McLeskey, J.T.; Smith, A.N. Femtosecond pump-probe nondestructive examination of materials (invited). Rev. Sci. Instrum. 2003, 74, 400–406. [Google Scholar] [CrossRef]
  26. Douglass, D.L. The thermal expansion of niobium pentoxide and its effect on the spalling of niobium oxidation films. J. Less-Common Met. 1963, 5, 151–157. [Google Scholar] [CrossRef]
  27. Laubitz, M.J.; van der Meer, M.P. The thermal conductivity of platinum between 300 and 1000 K. Can. J. Phys. 1966, 44, 3173–3183. [Google Scholar] [CrossRef]
  28. Nakamura, F.; Taketoshi, N.; Yagi, T.; Baba, T. Observation of thermal transfer across a Pt thin film at a low temperature using a femtosecond light pulse thermoreflectance method. Meas. Sci. Technol. 2011, 22, 024013. [Google Scholar] [CrossRef]
  29. Engineering ToolBox. Coefficients of Linear Thermal Expansion. 2003. Available online: https://www.engineeringtoolbox.com/linear-expansion-coefficients-d_95.html (accessed on 21 November 2018).
  30. Ho, C.Y.; Powell, R.W.; Liley, P.E. Thermal conductivity of the Elements. J. Phys. Chem. Ref. Data 1972, 1, 279–421. [Google Scholar] [CrossRef]
  31. Endo, R.K.; Fujihara, Y.; Susa, M. Calculation of the density and heat capacity of silicon by molecular dynamics simulation. High Temp. High Press. 2003, 35–36, 505–511. [Google Scholar] [CrossRef]
  32. Chase, M.W. NIST-JANAF Thermochemical Tables 2 Volume-Set (Journal of Physical and Chemical Reference Data Monographs); American Institute of Physics: College Park, MD, USA, 1998. [Google Scholar]
  33. Cheng, Z.; Weidenbach, A.; Feng, T.; Tellekamp, M.B.; Howard, S.; Wahila, M.J.; Zivasatienraj, B.; Foley, B.; Pantelides, S.T.; Piper, L.F.; et al. Diffuson-driven Ultralow Thermal Conductivity in Amorphous Nb2O5 Thin Films. arXiv, 2018; arXiv:1807.05483. [Google Scholar]
  34. Björck, M.; Andersson, G. GenX: An extensible X-ray reflectivity refinement program utilizing differential evolution. J. Appl. Crystallogr. 2007, 40, 1174–1178. [Google Scholar] [CrossRef]
  35. Cahill, D.G.; Watson, S.K.; Pohl, R.O. Lower limit to the thermal conductivity of disordered crystals. Phys. Rev. B 1992, 46, 6131–6140. [Google Scholar] [CrossRef]
  36. Bai, S.; Tang, Z.; Huang, Z.; Yu, J. Thermal Characterization of Si3N4 Thin Films Using Transient Thermoreflectance Technique. IEEE Trans. Ind. Electron. 2009, 56, 3238–3243. [Google Scholar]
  37. Chien, H.C.; Yao, D.J.; Hsu, C.T. Measurement and evaluation of the interfacial thermal resistance between a metal and a dielectric. Appl. Phys. Lett. 2008, 93, 12–15. [Google Scholar] [CrossRef]
  38. Nath, P.; Chopra, K.L. Thermal conductivity of amorphous vs. crystalline Ge and GeTe films. Jpn. J. Appl. Phys. 1974, 13, 781–784. [Google Scholar] [CrossRef]
  39. Cahill, D.G. Thermal conductivity measurement from 30 to 750 K: The 3omega method. Rev. Sci. Instrum. 1990, 61, 802–808. [Google Scholar] [CrossRef]
  40. Gaillac, R.; Pullumbi, P.; Coudert, F.-X. ELATE: An open-source online application for analysis and visualization of elastic tensors. J. Phys. Condens. Matter 2016, 28, 275201. [Google Scholar] [CrossRef]
  41. Shcherbina, O.B.; Palatnikov, M.N.; Efremov, V.V. Mechanical properties of Nb2O5 and Ta2O5 prepared by different procedures. Inorg. Mater. 2012, 48, 433–438. [Google Scholar] [CrossRef]
  42. Savitzky, A.; Golay, M.J.E. Smoothing and Differentiation of Data by Simplified Least Squares Procedures. Anal. Chem. 1964, 36, 1627–1639. [Google Scholar] [CrossRef]
  43. Ezzahri, Y.; Pernot, G.; Joulain, K.; Shakouri, A. Capturing the Cumulative Effect in the Pump Probe Transient Thermoreflectance Technique using Network Identification by Deconvolution Method. Mater. Res. Soc. Symp. Proc. 2011, 1347, 26–33. [Google Scholar] [CrossRef]
  44. Dilhaire, S.; Rampnoux, J.-M.; Grauby, S.; Pernot, G.; Calbris, G. Nanoscale Thermal Transport Studied With Heterodyne Picosecond Thermoreflectance. In Proceedings of the ASME 2009 Second International Conference on Micro/Nanoscale Heat and Mass Transfer, Shanghai, China, 18–21 December 2009; pp. 451–456. [Google Scholar]
  45. Dilhaire, S.; Pernot, G.; Calbris, G.; Rampnoux, J.M.; Grauby, S. Heterodyne picosecond thermoreflectance applied to nanoscale thermal metrology. J. Appl. Phys. 2011, 110, 114314. [Google Scholar] [CrossRef]
  46. Yagi, T.; Tamano, K.; Sato, Y.; Taketoshi, N.; Baba, T.; Shigesato, Y. Analysis on thermal properties of tin doped indium oxide films by picosecond thermoreflectance measurement. J. Vac. Sci. Technol. A Vac. Surf. Film 2005, 23, 1180–1186. [Google Scholar] [CrossRef]
Figure 1. Schematic of the investigated sample and the representation of the TDTR measurement.
Energies 12 00610 g001
Figure 2. Schematic diagram of a pulsed cycled excitation.
Energies 12 00610 g002
Figure 3. Normalized thermal transients of the Pt-Nb2O5-Si sample at different ambient temperatures from PicoTR (25 °C–500 °C) and NanoTR (25 °C–300 °C).
Energies 12 00610 g003
Figure 4. The thermal properties of Nb2O5 presented as a function of temperature from PicoTR (a) and NanoTR (b). The y-axis stands for λ marked as squares and α as circles. The open marker in (a) is the measurement after the heating procedure. α and λ of the PicoTR and NanoTR measurements show the same trend. The solid line shows the minimal thermal conductivity model by Cahill et al. [35]—Equation (11).
Energies 12 00610 g004
Figure 5. (a) The logarithmic time constant spectrum of NanoTR measurements, showing two dominant time constant peaks. (b) The structure function and its differential representation (inlet), where K = dCth/dRth, shows the lowest Rth at 300 °C and the highest Rth at 25 °C.
Energies 12 00610 g005
Figure 6. Structure function (a) and its differential representation (b) of the NanoTR measurement at 25 °C with its validated simulation and variations of the simulation to see the influence of the input parameters.
Energies 12 00610 g006
Figure 7. The sample heats up during measurement according to the repetitive pulses of 20 MHz.
Energies 12 00610 g007
Figure 8. (a) The logarithmic time constant spectrum of NanoTR measurements, showing three dominant time constants. (b) The structure functions and its differential representation (inlet) of the PicoTR measurements resulted in different Rth.
Energies 12 00610 g008
Figure 9. Structure function (a) and differential structure function (b) of the PicoTR measurement of 100 °C with its validated simulation and variations of the simulation, to see the influence of the materials.
Energies 12 00610 g009
Figure 10. Comparison of the measured thermal conductivity (left-hand axis) and calculated thermal resistance (right-hand axis) as a function of temperature.
Energies 12 00610 g010
Table 1. Technical data of the time domain thermal reflectance (TDTR) measurement setups.
λPump (nm)λProbe (nm)PPump (mW)ØPump (µm)ØProbe (µm)tp (s)Tp (s)
PicoTR15507752545255 × 10−135 × 10−8
NanoTR155077525100501 × 10−92 × 10−5
λPump: wavelength of the pump laser; λProbe: wavelength of the probe laser; PPump: heating power of pump laser; ØPump: diameter of the pump beam; ØProbe: diameter of the probe beam; tp: pulse width of the pump beam; Tp: repetition time of pump laser (max. measurement time).

