Article

Development Processes of Surface Trucking and Partial Discharge of Pressboards Immersed in Mineral Oil: Effect of Tip Curvatures

School of Electrical Engineering, Southwest Jiaotong University, Chengdu 611756, China
*
Author to whom correspondence should be addressed.
Energies 2019, 12(3), 554; https://doi.org/10.3390/en12030554
Submission received: 7 January 2019 / Revised: 2 February 2019 / Accepted: 4 February 2019 / Published: 11 February 2019
(This article belongs to the Section F: Electrical Engineering)

Abstract

:
The pressboard surface is the electric weak link of the oil-paper insulation in transformers, and long-term partial discharge (PD) erosion is the dominant cause of degradation in pressboard. To explore the development processes of surface tracking under the effect of tip curvature, the typical needle-plate model was selected to initiate an electric field with a high tangential component on pressboard surface under needle tip curvature of 4~42 μm. With the help of a high-speed camera and a PD detecting system, the development processes of surface tracking and PD were recorded under a sustained AC voltage. A profound difference between surface tracking under different curvatures was discussed. Pressboard surfaces after tests were observed under a scanning electron microscope (SEM), and the damage degree of cellulose fibers was dependent on the tip curvature.

1. Introduction

Great care is taken when designing the insulation system in oil-filled transformers. One design principle of the insulation system is to avoid large oil gaps between windings to reduce the chances of PD [1]. Pressboards, which are made from cellulose material in the form of paper, are widely used to separate oil gaps [2]. However, pressboard surface is the weak point of the oil-paper insulation in power AC transformers [3]. Much research in recent years has focused on the properties of oil-paper insulating system, such as the dielectric response of moisture content [4], the image texture analysis of pressboard aging features [5], the frequency domain spectroscopy (FDS) response with paper aging condition [6], the breakdown characteristics of oil-paper insulation [7], and the space charge distribution under the effect of temperatures and electrical field [8]. The aim of this kind of research is to design the condition assessment model of oil-filled power transformers [9,10], to avoid possible failures of this expensive equipment.
Pressboards are the major components in oil-paper insulation because mineral oil inside transformers can be easily reprocessed to improve their quality, the improvement and condition assessment of mineral oil have been researched for decades [11,12], but the degradation of the solid material is irreversible, and might cause catastrophic results due to long-term erosion, especially in aged transformers. Consequently, it is important to study the properties of pressboards under different working conditions. Previous studies found that the moisture content and the high temperature inside transformers have significant influence to pressboard erosion. The moisture content renders the pressboard more brittle [13,14,15], and promotes the intensity of PD at a higher moisture level above 1% by weight [16], the bulk property of oil-paper insulation with a wet pressboard has a significant influence on the flashover voltage [17,18,19]. The high temperature, especially the hot-spot temperature inside a transformer, may accelerate the degradation of pressboard [20]. Once the pressboard surface is damaged due to the erosion caused by high temperature, moisture content or other working conditions, PD is likely to start on the pressboard surface [21], especially at the interphase pressboard barrier in transformers where electric stress is high. Several previous investigations have been conducted to understand the relationship between the PD and the degradation of oil-paper insulation. For example, Li et al. demonstrated the partition and recognition of PD development stages under the needle-plate model [22]. Deng et al. revealed the occurrence and development of PD in a typical oil-impregnated paper defects model [23]. To advance our understanding on the characteristics of PD, Xu et al. designed a PD measurement system based on dielectric response technique by excess current, and the technique to study PD activity by measuring the PD loss current [24,25]. Hence the information of PD might be used to analyze the condition of oil-paper insulation, and locate PD sources in power transformers [26]. Following prolonged PD erosion, the damage to pressboard may decrease the interface properties of oil-paper insulation, especially the high tangential electrical stress [27], which might damage the pressboard surface, leaving “white or carbonized marks”. As shown in Figure 1, the white mark area spreads widely on the pressboard surface, and the carbonized mark, which is transformed from the white mark, can be observed along the white mark pattern. The white or carbonized mark on pressboard surface can significantly reduce the dielectric strength of the oil-paper insulation, and might cause a destructive flashover if the instant electric stress on the pressboard surface is high enough.
However, it is almost impossible to see the white mark on pressboard surface during maintenance of transformers, because it disappears when in contact with air due to the gaseous nature of the white mark channel [28]. In addition, the white mark channel may progressively extend along the original path or even disappear [29], creating tree-shaped carbonized marks. This might result in a catastrophic flashover in transformers. To study the development process of surface tracking, a needle-plate model was selected to generate surface damage on pressboard, and the supply voltage should be sought carefully to create reliably intense PD at the high voltage needle electrode. Here, we aim to study the development processes of surface tracking and PD in mineral oil because mineral oil is widely used nowadays as a liquid insulating material in transformers. It should be noted that different forms of tips may influence the development process of surface tracking, and such tips may be generated under the effect of winding deformation, long-term PD erosion, metal particles, and so on. To explore the development processes of surface tracking and PD on pressboard immersed in mineral oil under different tip curvatures, a high-speed camera and a commercial PD detecting system were used.
The paper will present the experimental circuit and the preparation of test samples conformed to test standard. Then address characteristics of the surface tracking and the PD under different needle tip curvatures. Afterward, discuss the significant difference of surface tracking between different tip curvatures. Finally, the pressboard surface will be observed under a SEM to analyze the condition of cellulose fibers under the effect of different tip curvatures.

2. Experimental Arrangement

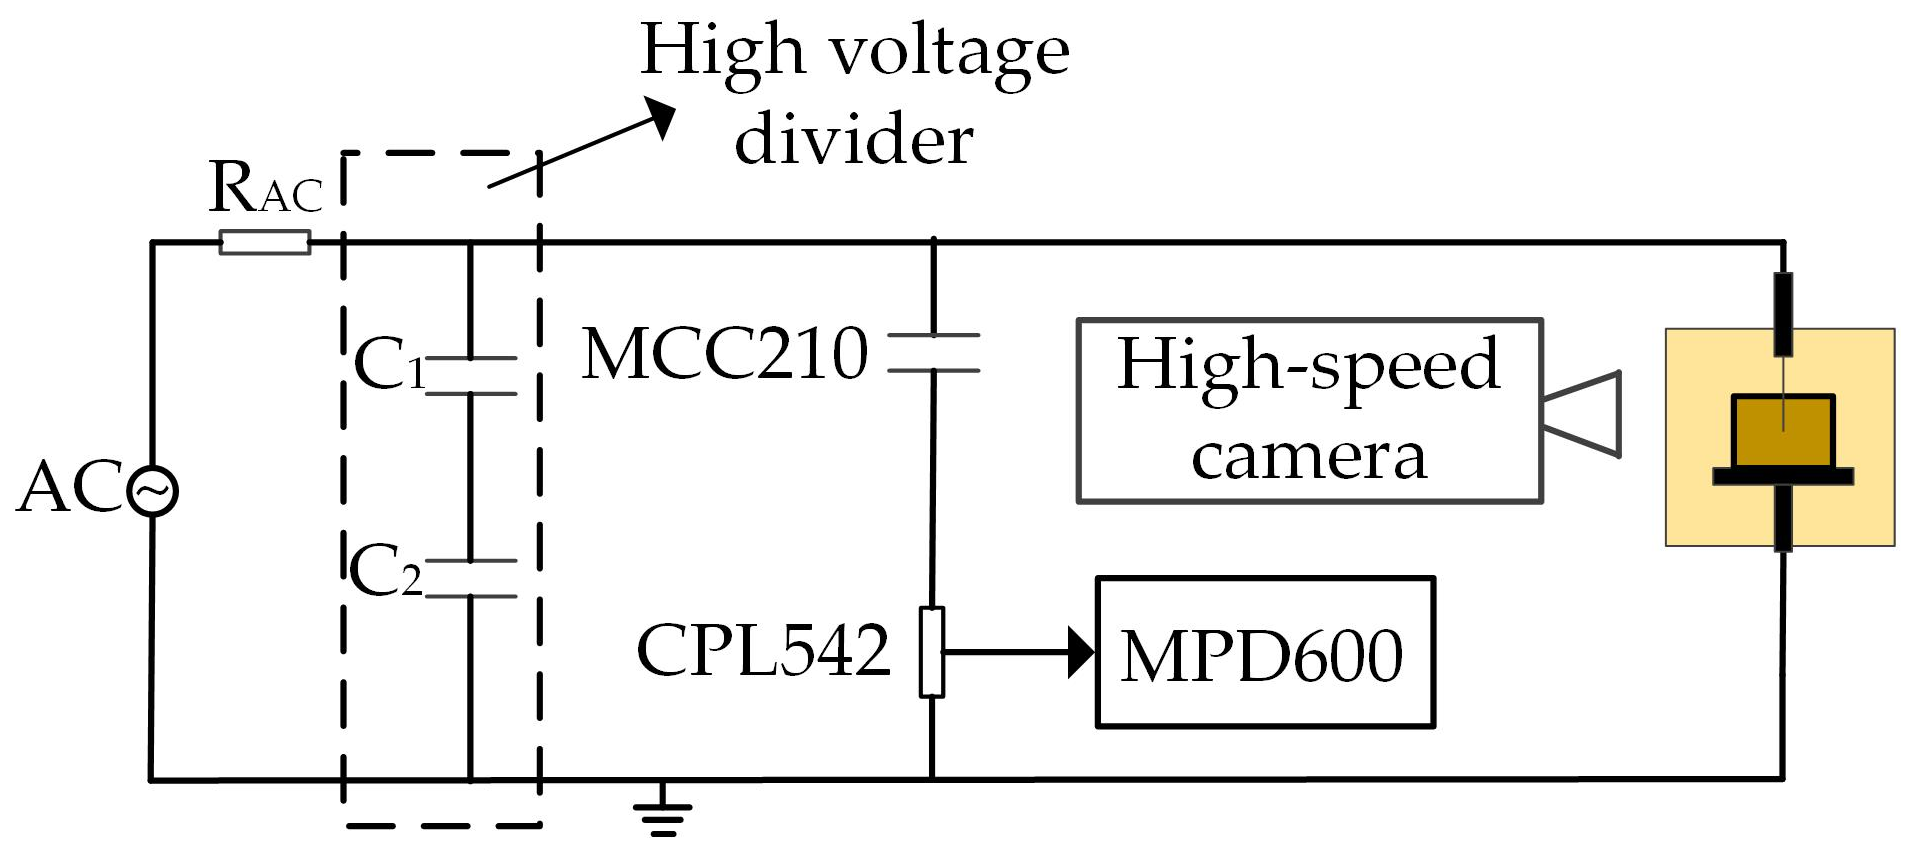
2.1. Experimental Setup
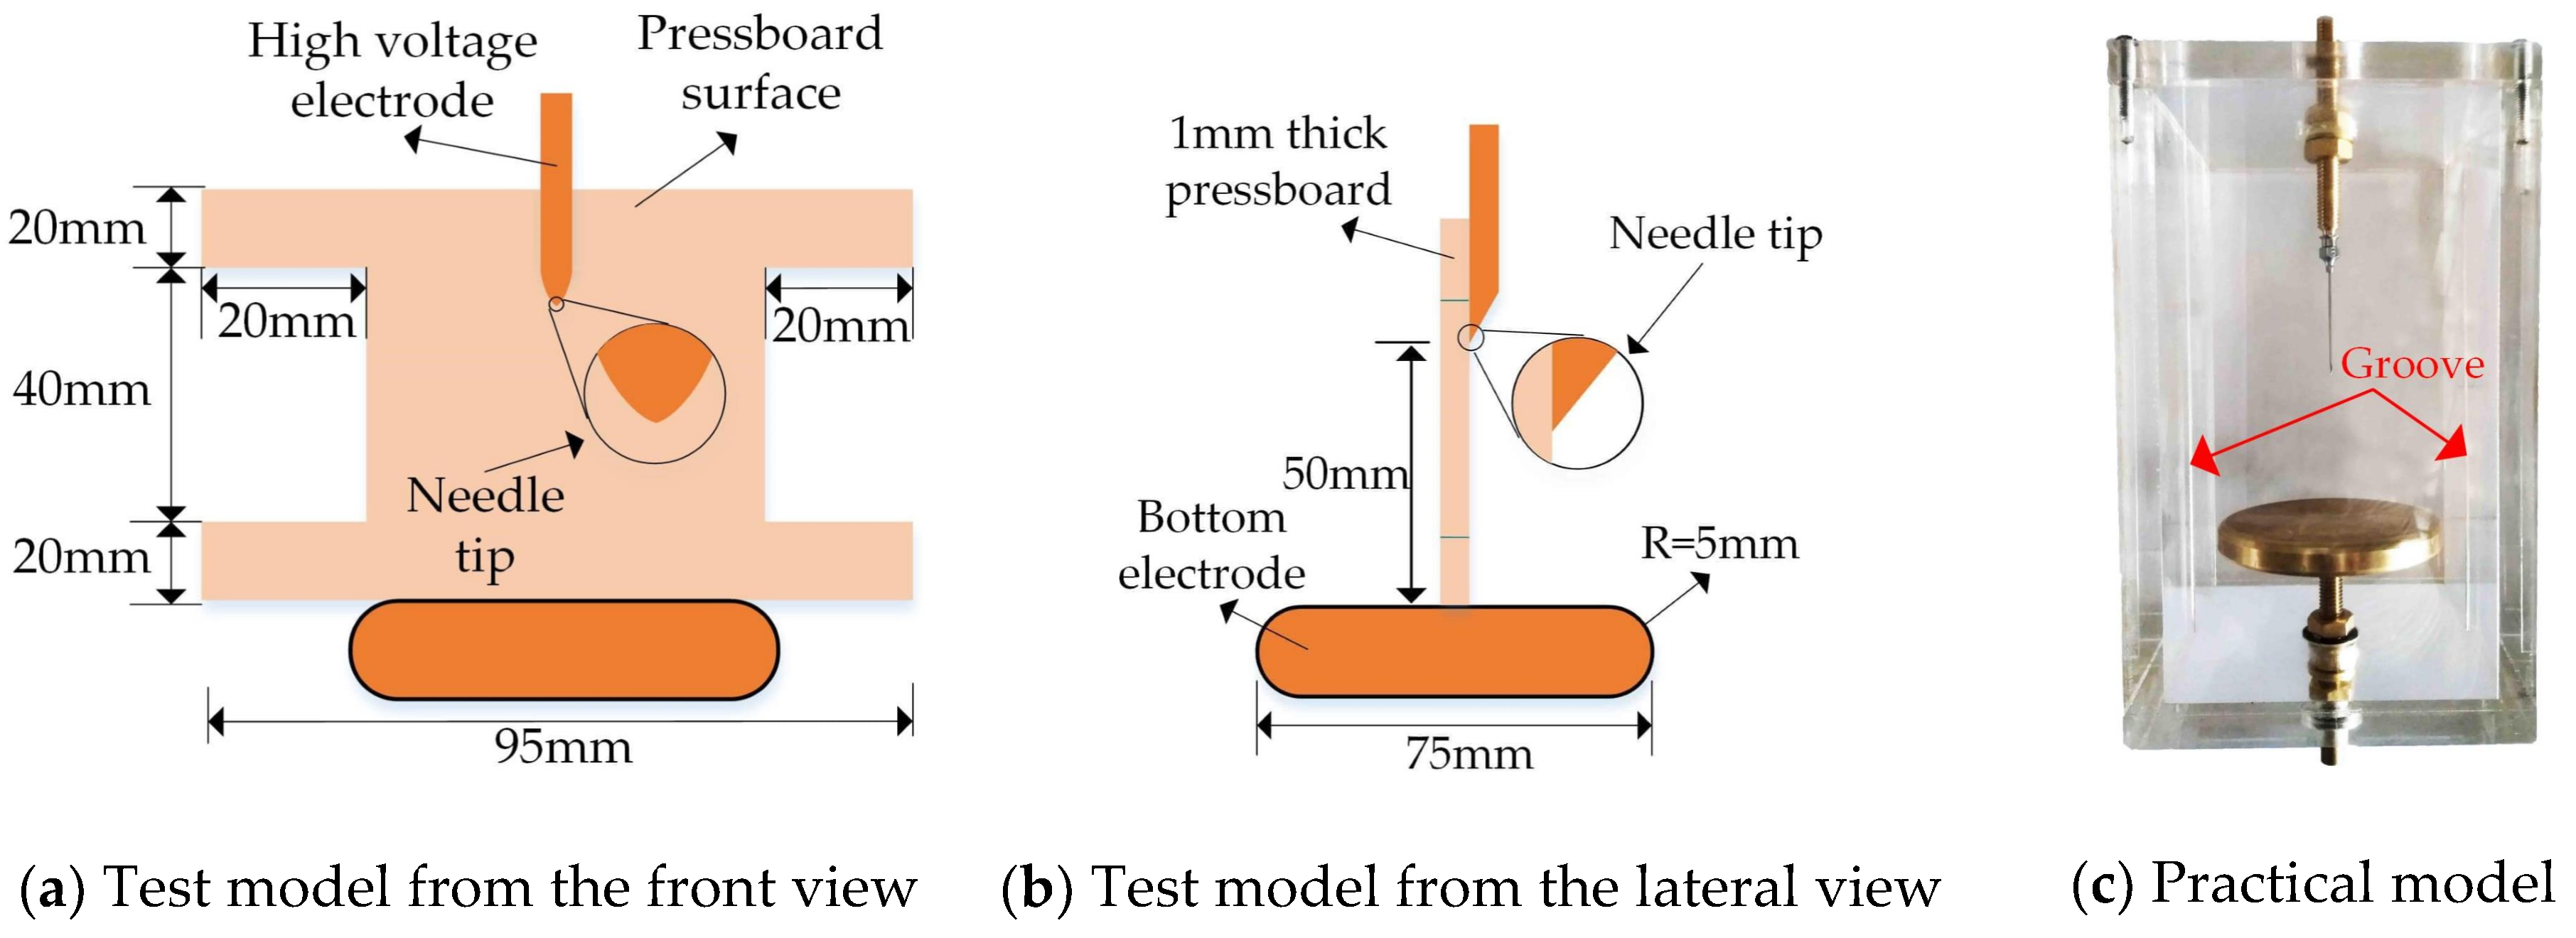
The experimental setup is depicted in Figure 2, illustrating the supply of voltage, and detecting system of the surface tracking and the PD information to the test model. The 220 V/120 kV PD-free transformer was utilized to supply voltage. A 2 MΩ water resistor connected the test cell and the supply transformer to reduce the destructive effect to the test circuit when a flashover occurred in the test model. The commercial MPD600 system was used for PD detecting, which is mainly made of three components: the coupling capacitor MCC210 with a capacity of 1 nF and the PD level less than 1 pC under 100 kV, the measurement impedance CPL542 with a low-arm capacitance of 120 μF and a detectable PD range of 20 kHz~6 MHz, and the PD analyser MPD600 module with a noise level less than 15 fC. The MPD600 system can reveal the characteristics of PD by displaying and recording PRPD patterns automatically during tests. The high-speed camera I SPEED TR with a shooting speed of 1 × 10⁴ fps was used to record surface tracking from the front view of pressboard samples. Before tests, the background noise was measured. With the help of the charge calibrator CAL542, the test circuit was calibrated at first. Subsequently, we applied step-up AC voltage to the test circuit without the needle-plate model. Finally, when the PD noise level was confirmed to a value below 5 pC for 10 min under 90 kV the experimental circuit was considered to be suitable for tests.

2.2. Test Model

Figure 3 shows the arrangement of the needle-plate model. Medical needles are selected to be the high voltage electrodes because the needle tip is in the half taper-shaped form, which can guarantee a strong connection between the needle tip and pressboard surface. Test needles were selected carefully to pick needle tips with similar curvature, and the needle tips are examined under an optical microscope from the front and lateral views as shown in Figure 3a,b, and the values of tip curvatures are shown in Table 1.
A copper plate which is 75 mm in diameter and 5 mm in edge radius is selected as the bottom electrode, as shown in Figure 3b. The distance between the needle tip and the bottom electrode was fixed carefully at 50 mm according to IEC61294 [30]. The structure of the test samples is shown in Figure 3, to make sure the free flow of mineral oil in the test model during tests. Intact pressboards were processed under strict procedures to design the test samples. The rectangle test model is made of Perspex with a capacity of 1.2l as shown in Figure 3c, there are two parallel 1.3 mm wide grooves to attach pressboard samples tightly to the test model.

2.3. Test Samples

Mineral oil and pressboards were processed through a series of procedures to satisfy the test standard. The liquid sample used for tests is the 25#KARAMAY transformer oil, which mainly consists of naphthenics, aromatics, and paraffinics. The insulating liquid was filtered at 65 °C for 2 h under a vacuum pressure below 100 Pa to eliminate impurities such as moisture content, dissolved gases, and other particles in mineral oil. The mineral oil was examined directly after filtering, and the main properties of the filtered oil are shown in Table 2.
The pressboards were obtained directly from the transformer factory, and a series of procedures were then adopted to design the test samples. First, 1 mm thick pressboards were cut into the structure shown in Figure 3a. Second, the pressboard samples were treated in an air circulating oven at 75 °C for 36 h to remove most of the moisture content from the test samples. Third, the dry samples were treated in the vacuum oven at 110 °C for 24 h under 500 Pa to remove the gaseous impurities existed between the fiber gaps in pressboard. Fourth, the pressboard samples were immersed in the filtered oil at 75 °C for 36 h under 500 Pa to fill the fiber gaps with mineral oil molecules. After these procedures, the pressboard samples had a moisture content of less than 0.3% based on their weight, suggesting that the test samples met the test standard according to IEC60641 [31].

3. Results and Discussion

The test arrangement above is carried out to understand the development process of surface tracking on pressboard under different tip curvatures. Before the formal tests of surface tracking, it is vital to seek the sustained voltage that can create surface damage under all tip curvatures. Consequently, we used a voltage supply method to research characteristics of the partial discharge inception voltage (PDIV) and the flashover voltage (FV) under each curvature. The voltage supply method involves increasing in 1 kV/s steps to find the PDIV; then increasing 1 kV every 5 min until a flashover occurs in the test model. Finally the test circuit is cut off after the flashover moment. The research found that there was no surface damage on pressboard could be observed by naked eyes after flashover, because the flashover occurred in the mineral oil above the pressboard surface.
The characteristics of PDIV and FV are first explored as shown in Figure 4. Ten tests were conducted at each tip curvature to offset the influence of the needle tip position at pressboard on test results because the distribution of pores has a certain degree of randomness on pressboard surfaces. The voltage is considered to be a PDIV when the PD value is equal to or exceeds 100 pC for the first time according to IEC61294. As shown in Figure 4, the error bars indicate the scatter range of maximum and minimum amplitudes. A linear relationship existed between the PDIV and tip curvature, and the dispersions of PDIV were almost the same under all curvatures, with values from 0.3~0.7 kV. Therefore, the PD occurred much easier under a smaller tip curvature. However, a parabola relationship is found between the FV and tip curvature as shown in Figure 4b, which means that, the FV was much higher under a smaller curvature. The minimum FV is above 62 kV as shown in Figure 4b. Consequently, to create surface tracking on pressboard under all tip curvatures, the test voltage was set at 62 kV for all test samples to analyze the influence of the tip curvature on the surface tracking and PD.
To study the influence of tip curvature on the development process of surface tracking and PD, a high-speed camera and a commercial MPD600 PD detecting system were used to record the surface tracking and the PD information respectively, and the PD information was displayed in the form of PRPD patterns in real time during tests. Parameters of PRPD patterns were calculated automatically by the MPD600 system, the parameters included:
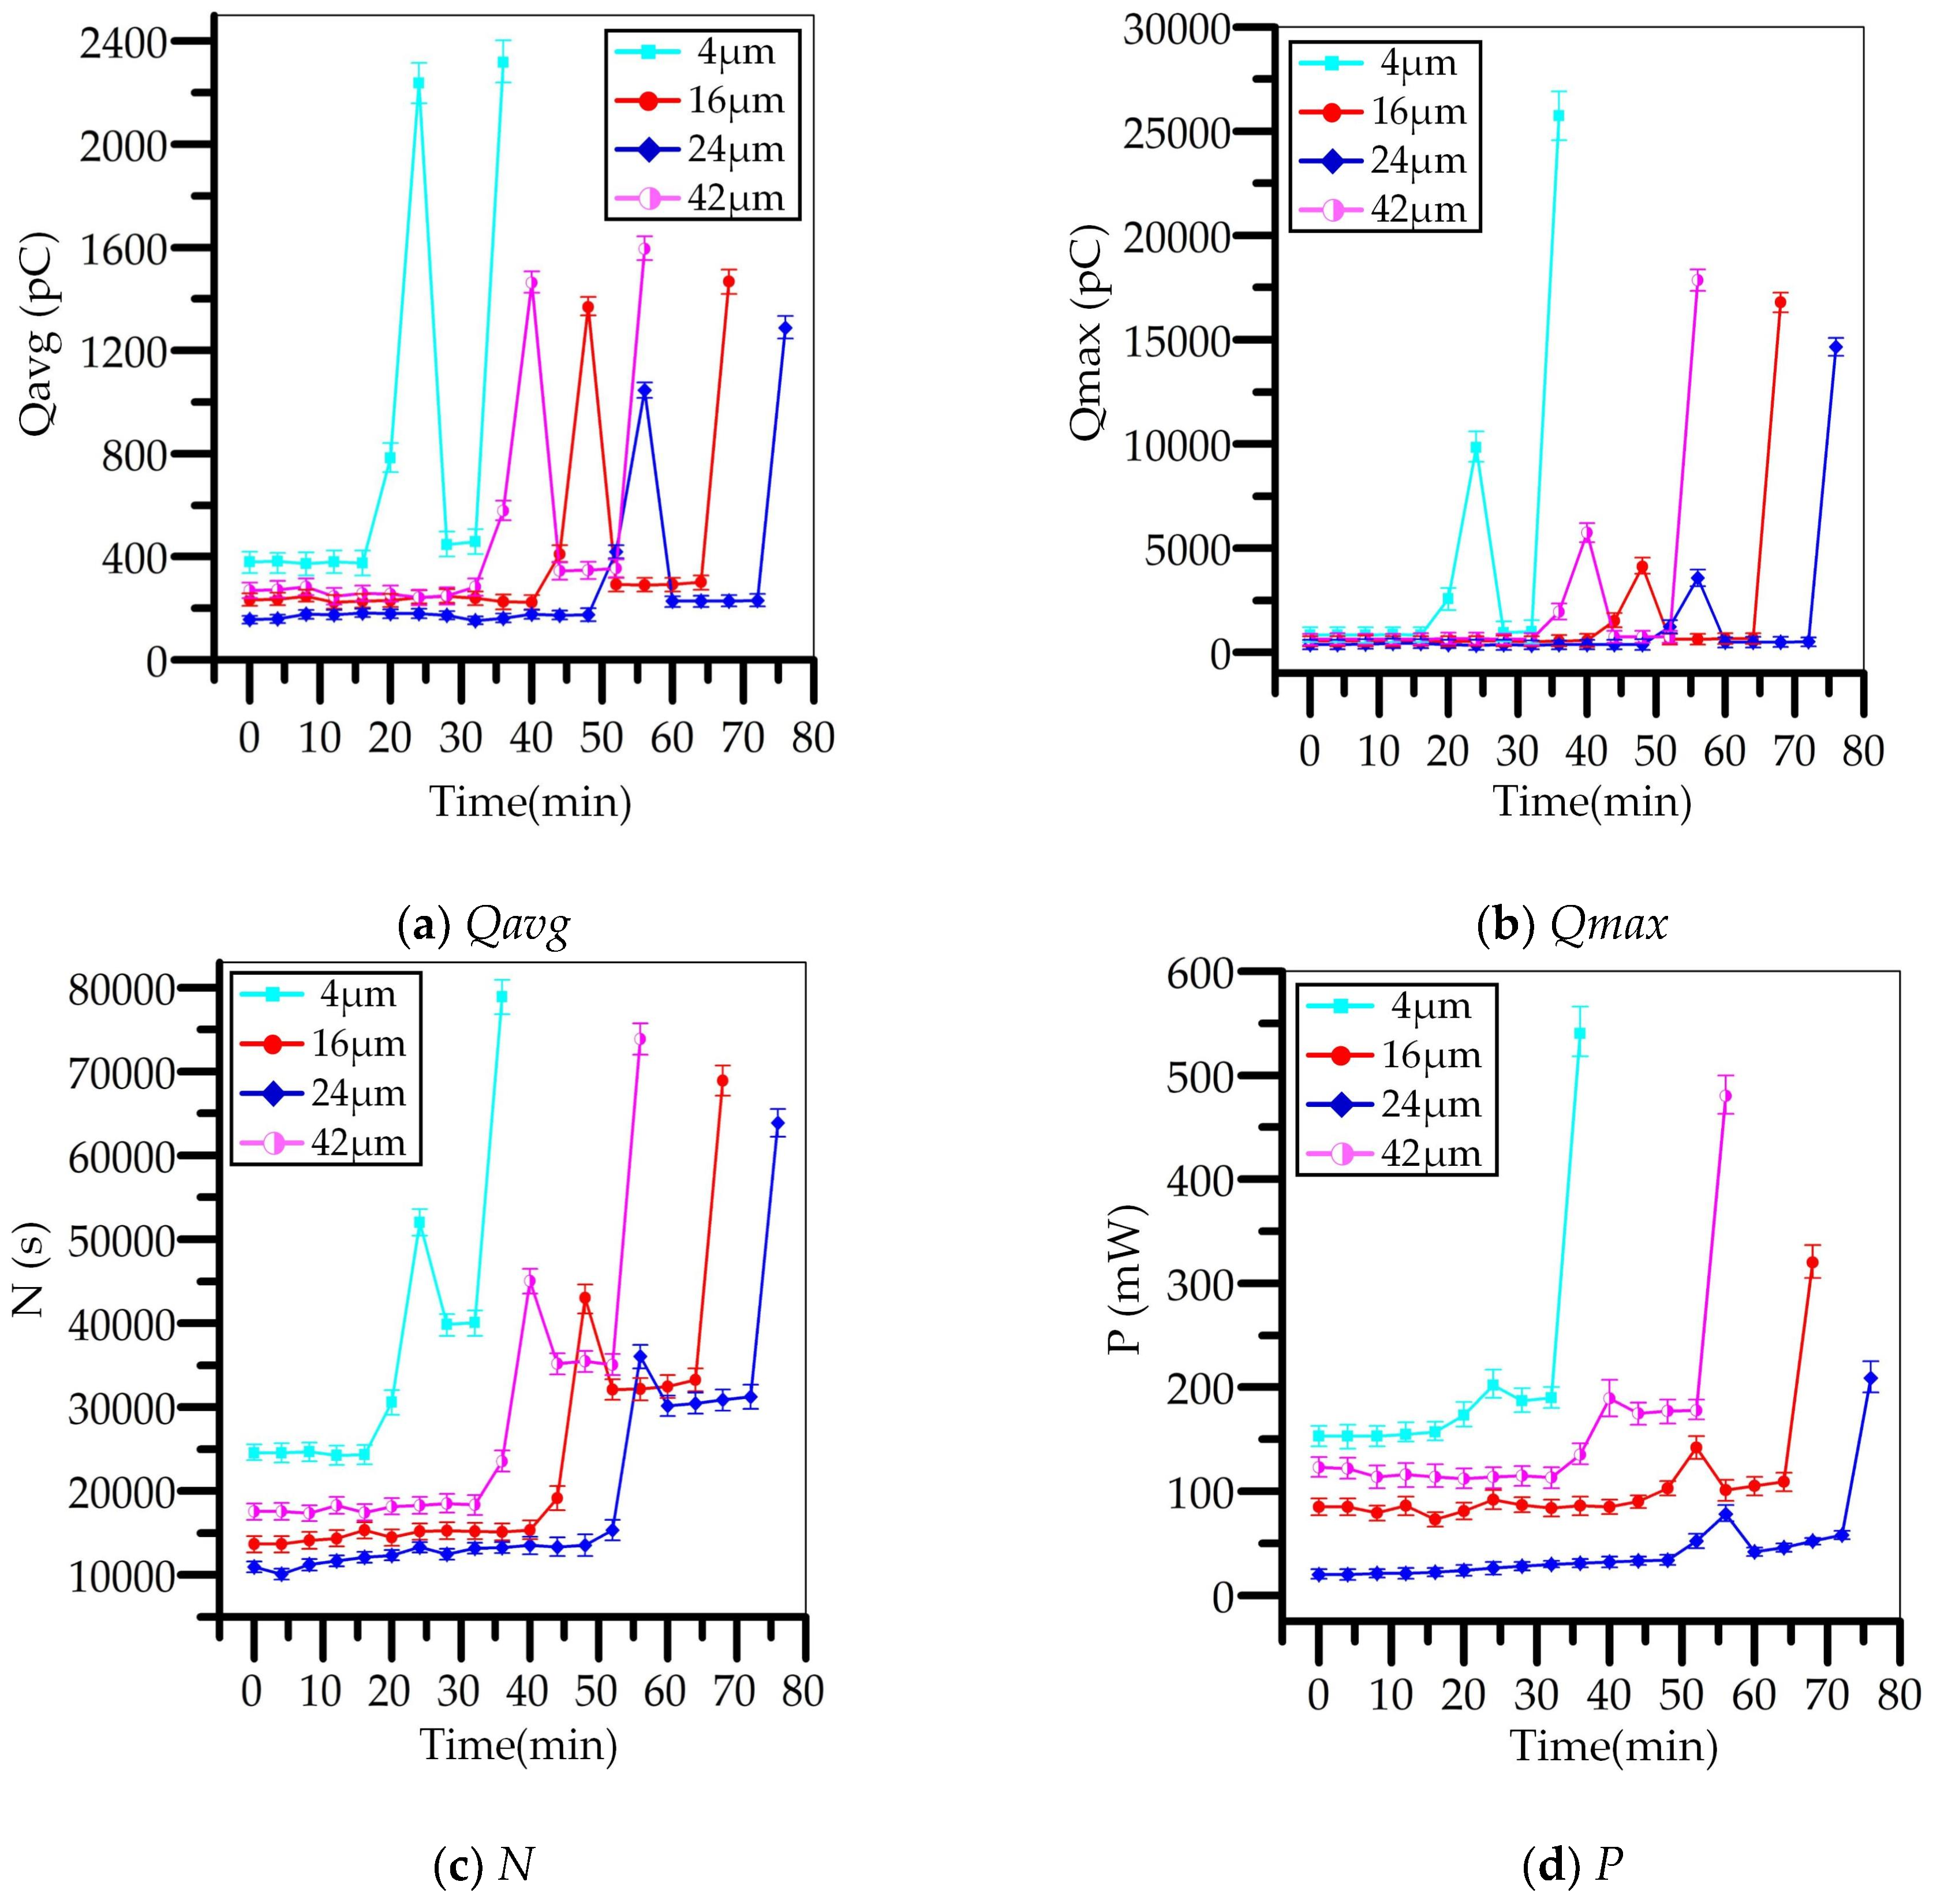
  • Qavg: The average amplitude of apparent charges value.
  • Qmax: The maximum amplitude of apparent charges value.
  • N: The frequency of PDs per second.
  • P: The power of apparent charges value.
Another ten tests were conducted to understand the development of surface tracking and PD under each tip curvature, and the characteristics of PD parameters were first explored. Figure 5 shows the relationship between the parameters of PD and the sustained time of the test voltage, the error bars represent the scatter range of the maximum and minimum amplitudes. The abscissa is the test time of each curvature, which is the time from the moment that the supply voltage reaches 62 kV to the moment that a flashover occurs on pressboard, the last point in the plots represents the flashover moment of the surface tracking.
A significant difference of PD existed between different curvatures. The first characteristic is the test time of different curvatures, which increased first and then decreased with the increase of tip curvature. The second characteristic is the intensity of PD, the maximum amplitude of the PD parameter decreased first and then increased with the increase of tip curvature.
There are some similarities existed between different curvatures. The first similarity is that the PD parameters changed rapidly before the end of the test, each parameter increased to the maximum amplitude at the flashover moment during tests. The second is that the intensity of PD changed rapidly with the increase of test time under each tip curvature.
The different intensity PD could cause different surface tracking under different curvatures. In the following section, the development process of surface tracking and PD under 4 μm curvature was given in detail.

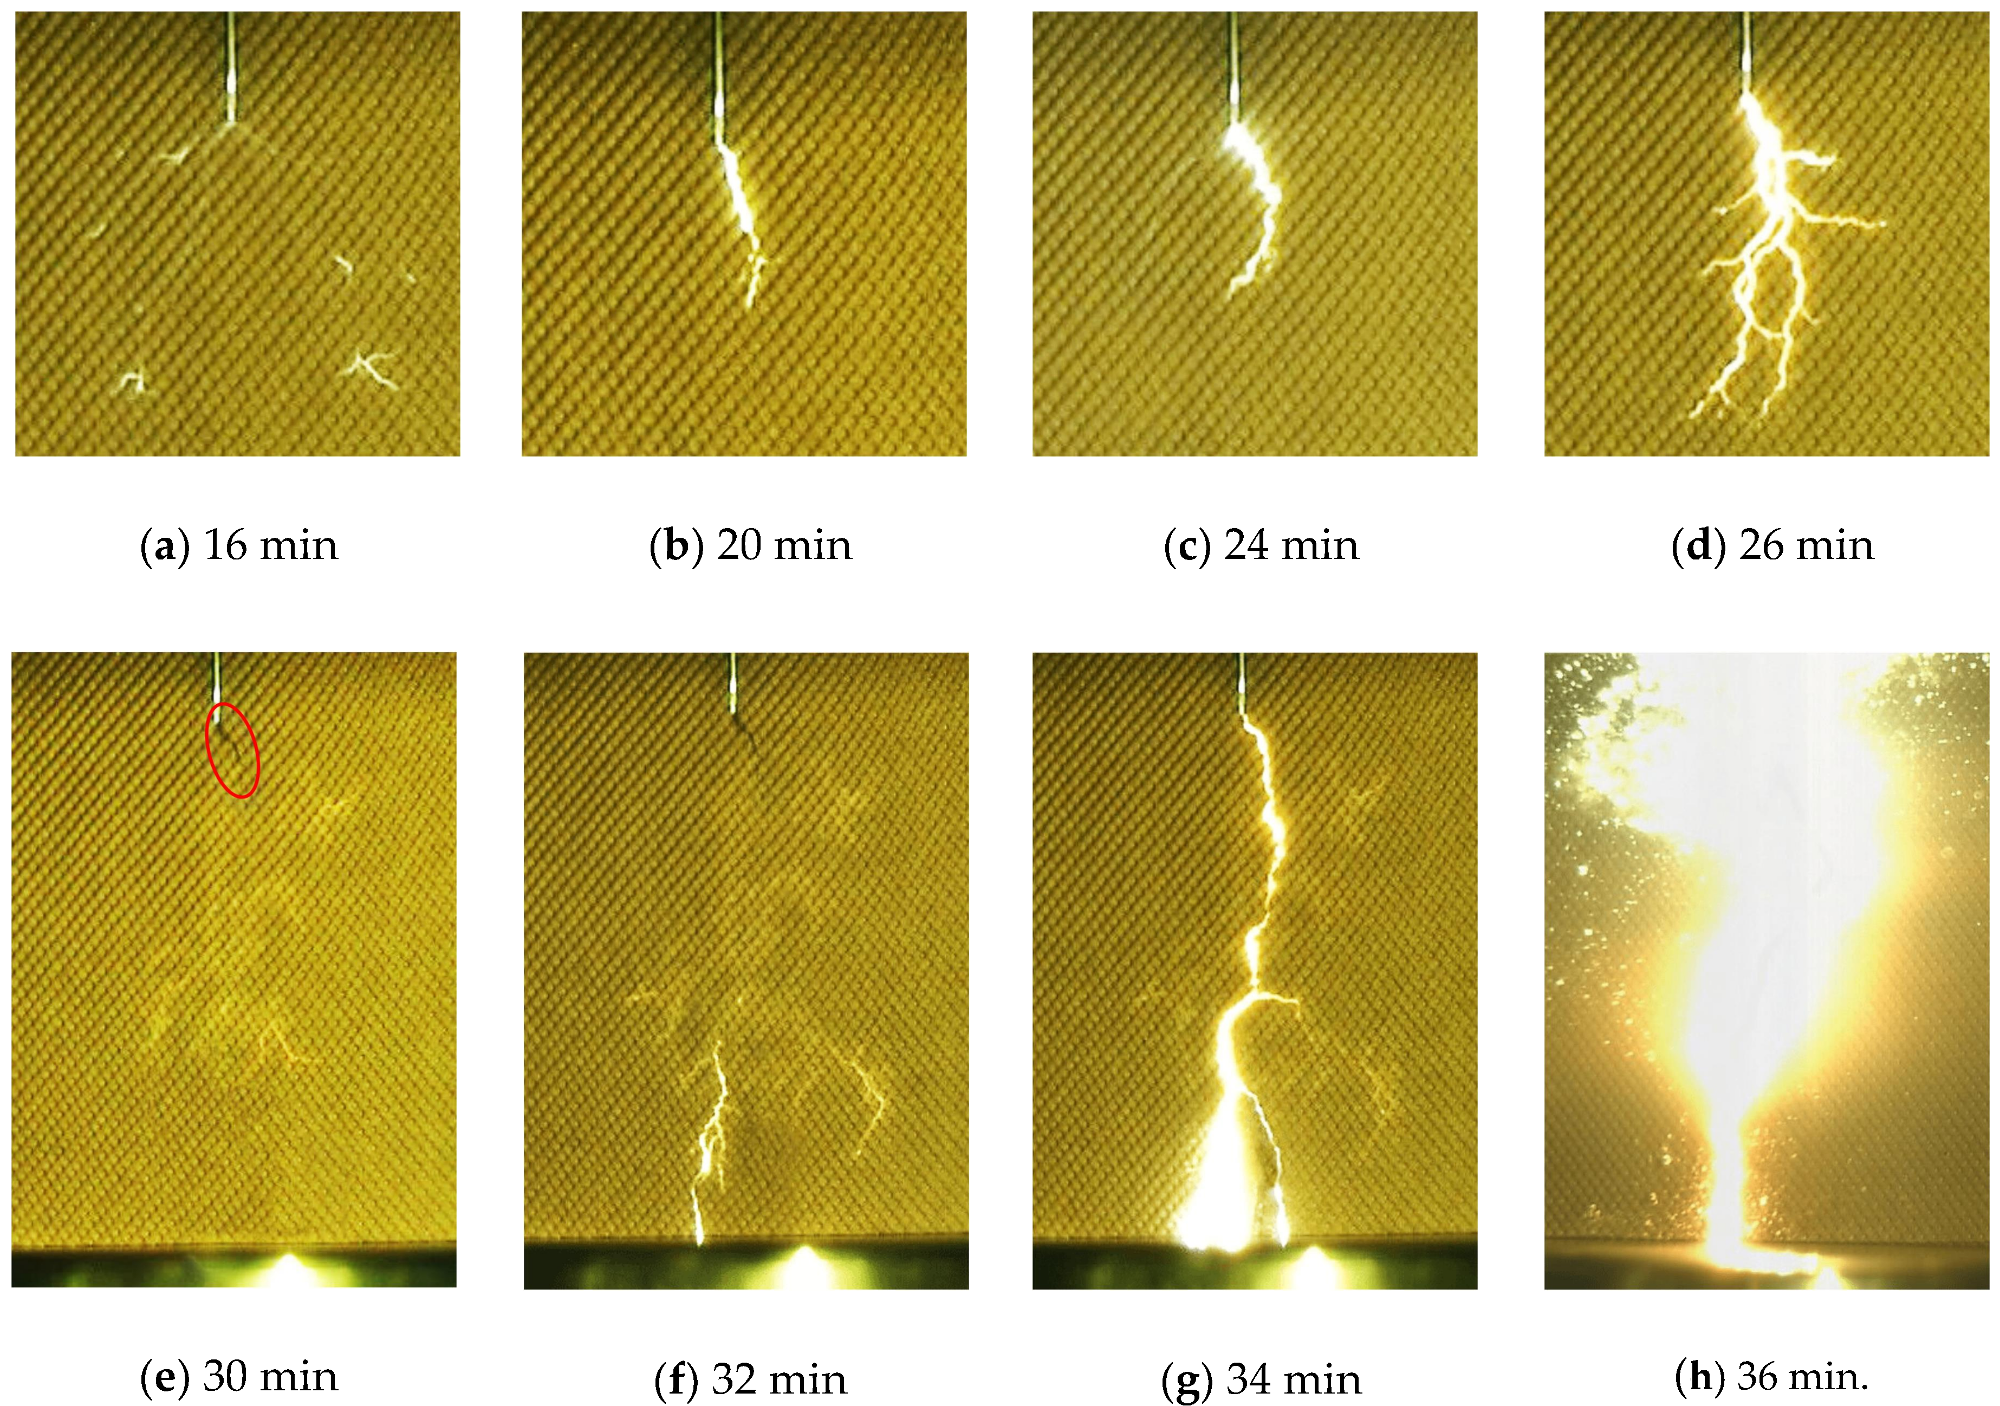
3.1. Development Process of the Surface Tracking under 4 μm Curvature

The figures illustrate different features in the surface tracking development process. First, as shown in Figure 6a, the number of spark discharge branches increases to 6 in 16 min. Additionally, the research found the frequency of spark discharge increased from 30 times per minute at the beginning to 80 times per minute at 16 min. Suggesting the spark discharge was much easier to occur with the degradation of pressboard surface caused by the intense discharge.
One feature occurred at the 20 min point of the sustained voltage. Due to the localized heating effect caused by the intense discharge, the white mark was initiated on pressboard surface around the needle tip area. The white mark was generated by the evaporation and decomposition of the mineral oil and moisture in pressboard surface layers [32].
Once the white mark was created on the pressboard surface, a persistent spark discharge connected the needle tip and pressboard surface. Indicating the intensity of discharge increased rapidly to sustain the persistent discharge on pressboard surface, because the white mark was formed by numerous gaseous pockets in pressboard surface layers, the discharges were much easier to occur in gases trapped between cellulose fibers. As shown in Figure 6c,d, the form of persistent spark discharge changes from single to multiple, the extension direction of spark discharge branch is different, but the extension speed of the branch towards the bottom electrode is the fastest amount all branches, indicating the electric stress was the highest at the branch tip which had the shortest distance to the bottom electrode.
Another feature occurred when the length of the white channel was larger than 30 mm. The persistent spark discharge gradually disappeared with the development of the white mark channel. The carbonized mark is found along the white channel, as shown in the red circled area in Figure 6e. The carbonized mark was generated by the carbonization of cellulose fibers and mineral oil, and the semi-conductive carbonized channels could easily hamper the discharges and dissipate the charge carriers [33]. Consequently, the discharge energy was not big enough to sustain the spark discharge at the tip of the white channel. The extension speed of the white mark channel decreased due to the energy consumption of the carbonized channel.
Another phenomenon occurred when the distance of white mark tip and the bottom electrode was about 5 mm. A spark discharge connected the white mark tip and bottom electrode from the mineral oil above the pressboard surface as shown in Figure 6f, after that the spark discharge occurred intermittently until the white channel connected the needle tip and bottom electrode. Since there were many gases inside of white mark channel, the flashover was much easier to occur when the white channel bridged the needle and bottom electrode.
The flash occurred three to four times before the final flashover, the development process of the flash was almost the same. At first, the spark discharge occurred at the bottom electrode, and then extended along the white mark channel to the needle tip, to bridge the high voltage and bottom electrode. Finally, a luminous flash occurred, with part of the flash channel beneath the surface layers as shown in Figure 6g. However, the discharge was not big enough to tip off the test circuit when the flash occurred.
The pressboard was damaged every time a flash occurred, the final flashover was observed as shown in Figure 6h. An intense luminous flashover occurred on pressboard surface, and generated a lot of bubbles in mineral oil. The test circuit was tripped off due to the high current arcing at the flashover moment.
The development process of surface tracking also could be found in previous research, especially the research of the high moisture content pressboards [34,35]. By comparing the test result in previous research, two reasons could explain the persistent spark discharge in this study. The first is that the dielectric strength of oil-paper insulation decreased fast under the severe degradation of pressboard surface, because the test samples were very dry in this study, the gaseous pockets between cellulose fiber were much hard to create. Consequently, the dielectric strength of oil-paper insulation was damaged severely under the long-term intense discharge erosion. The second is that the test voltage is high enough to generate persistent spark discharge. Once the gaseous pockets were generated in pressboard, the intensity of discharge could increase rapidly to sustain the persistent spark discharge and force the fast extension of the spark discharge.

3.2. Development Process of the PD under 4 μm Curvature

Figure 7 presents the development process of PD by presenting the 1 min sustained PRPD patterns. At first, the intensity of PD should be high enough to cause surface damage on pressboard. As shown in the red circled area in Figure 7a, the research finds that every time a spark discharge occurred on pressboard, there would be corresponding PDs with amplitudes above 1 nC occurred in the positive half cycle of the test voltage. Consequently, the Qmax of PD in the positive half cycle of the test voltage was bigger than that the negative half cycle.
The PRPD pattern changed when the white mark occurred, both of the amplitude and intensity of PD increased rapidly as shown in Figure 7b, the discharge could even occur at the zero-crossing area of the test voltage (387 pC maximum), suggesting there were residual charges distributed in the gases trapped between cellulose fibers. The discharge pattern was almost symmetrical in the negative and positive half cycles of the test voltage, which could be caused by gaseous discharges in pressboard surface layers.
The intensity of PD decreased rapidly and as shown in Figure 7c,d, this was mainly caused by two reasons. The first reason is the energy consumption caused by the carbonized mark around the needle tip area. The second reason is that the long distance between the white mark tip and the high voltage electrode (over 30 mm).
The PD intensity increased rapidly in 32 min to 36 min as shown in Figure 7e,f, especially when the needle and bottom electrodes were almost bridged by the white channel, the intensity of PD increased to the highest level at the flashover moment. More attention should be paid to the red circled area in Figure 7f, every time a flash occurred on pressboard surface, there would be some PDs distributed on the circled area in Figure 7f. Suggesting the flashes were much easily generated under a high instantaneous voltage in the positive half cycle.

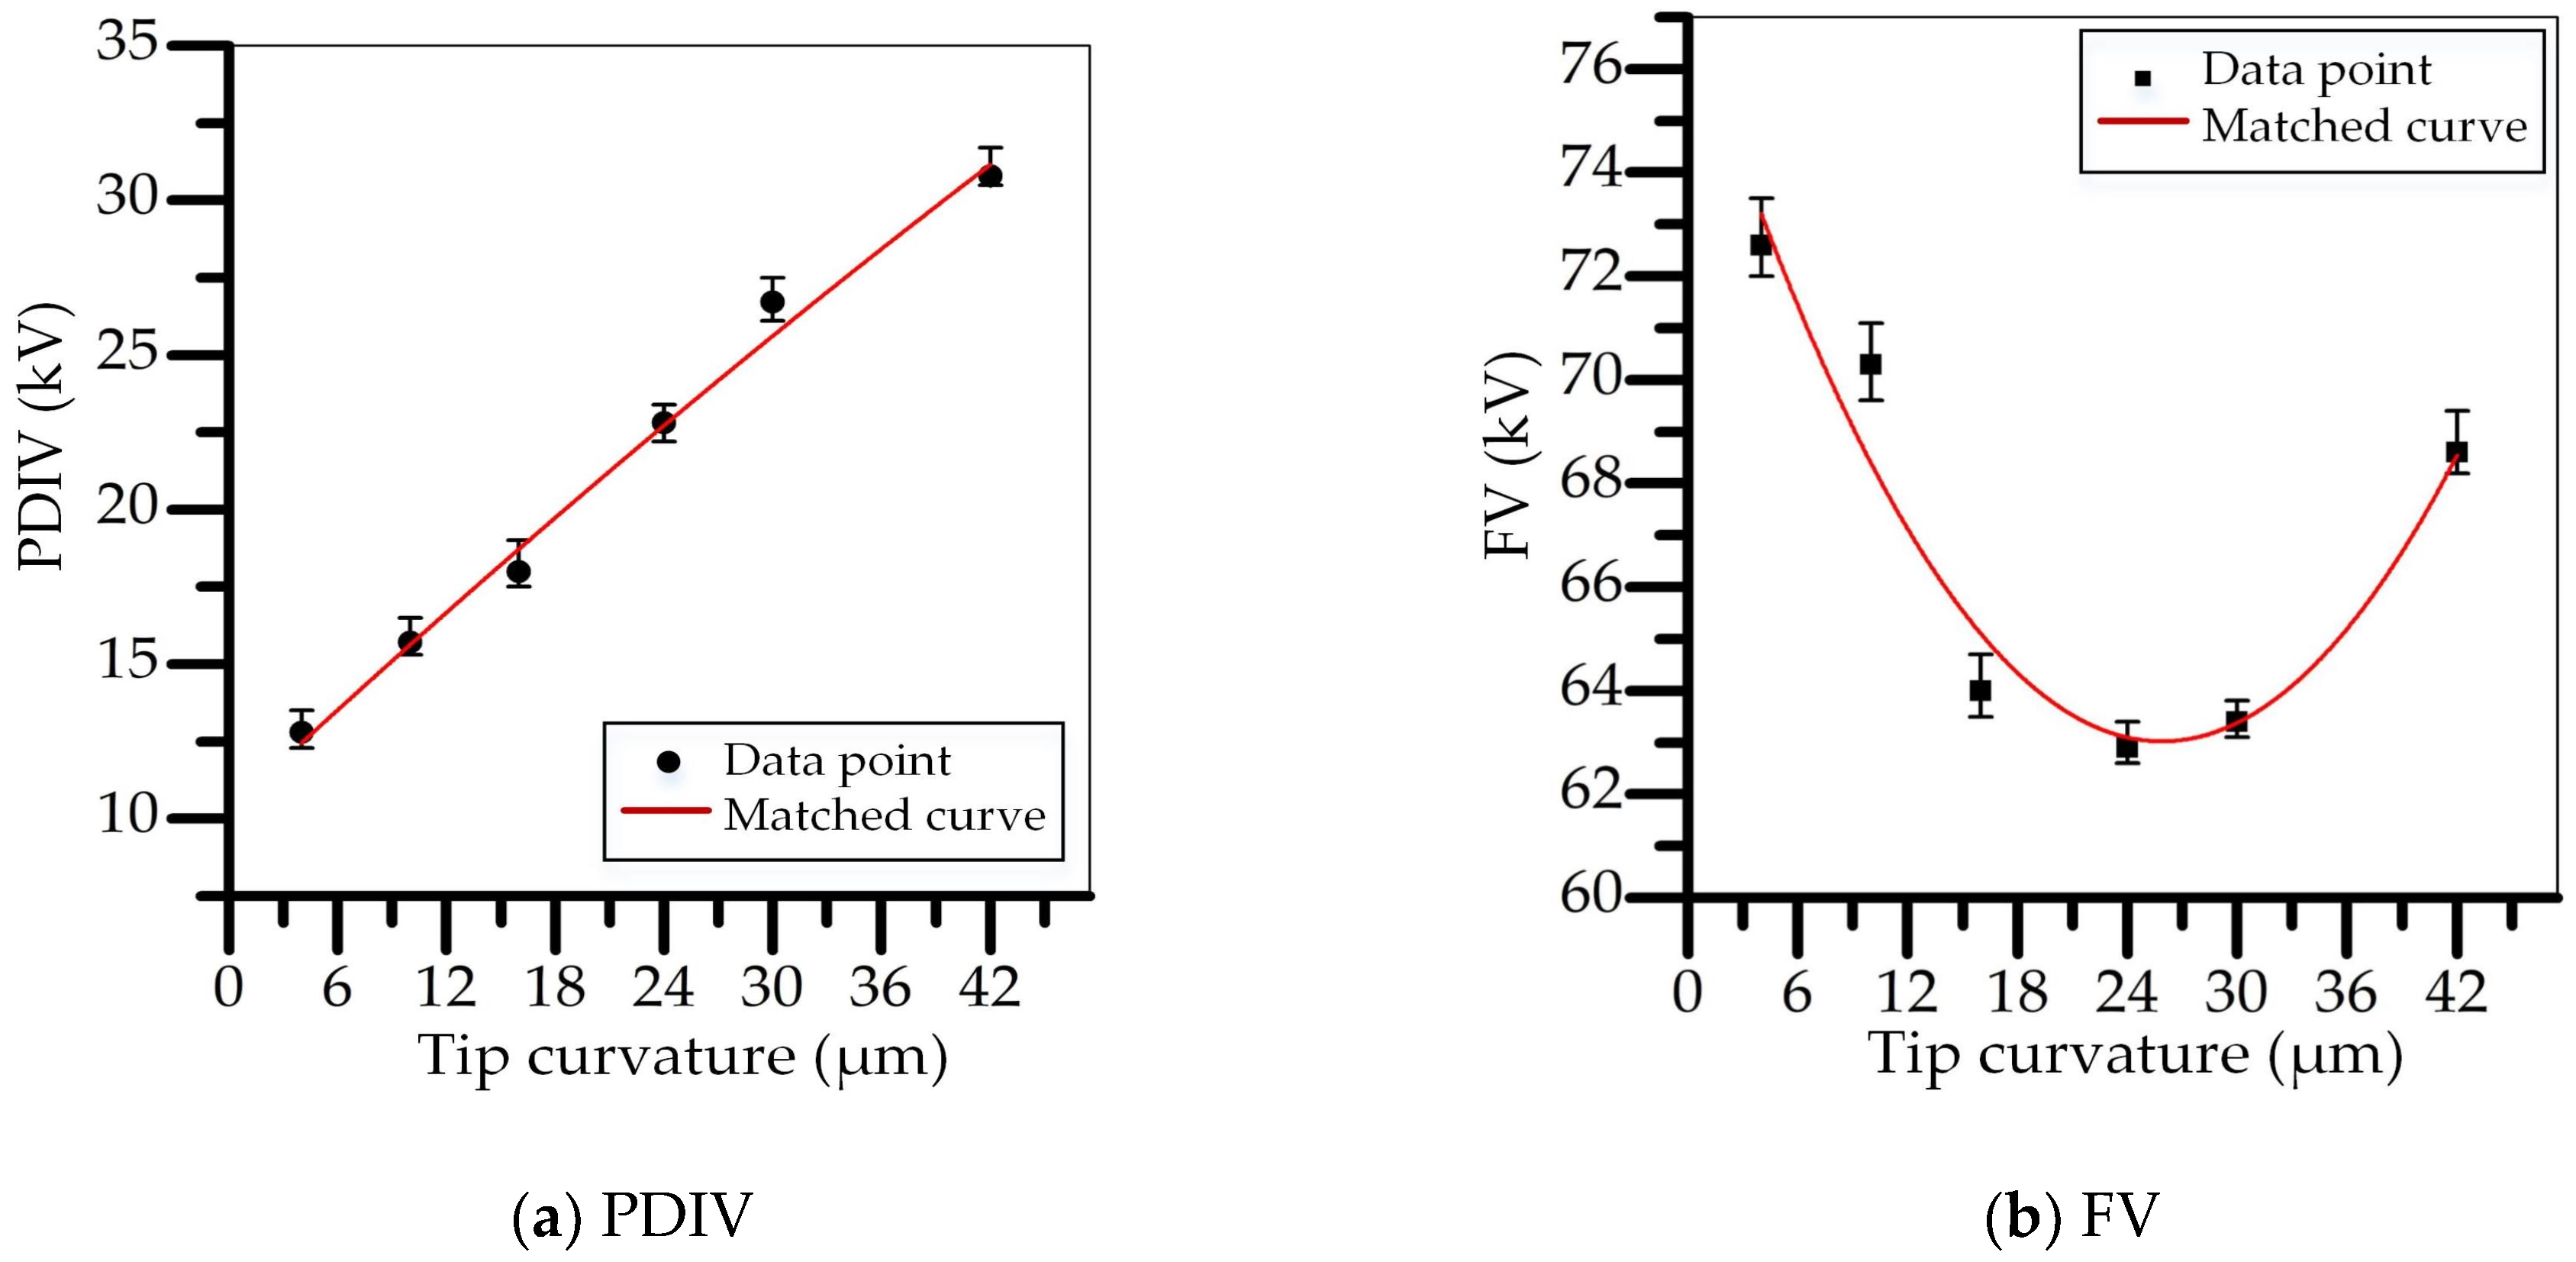
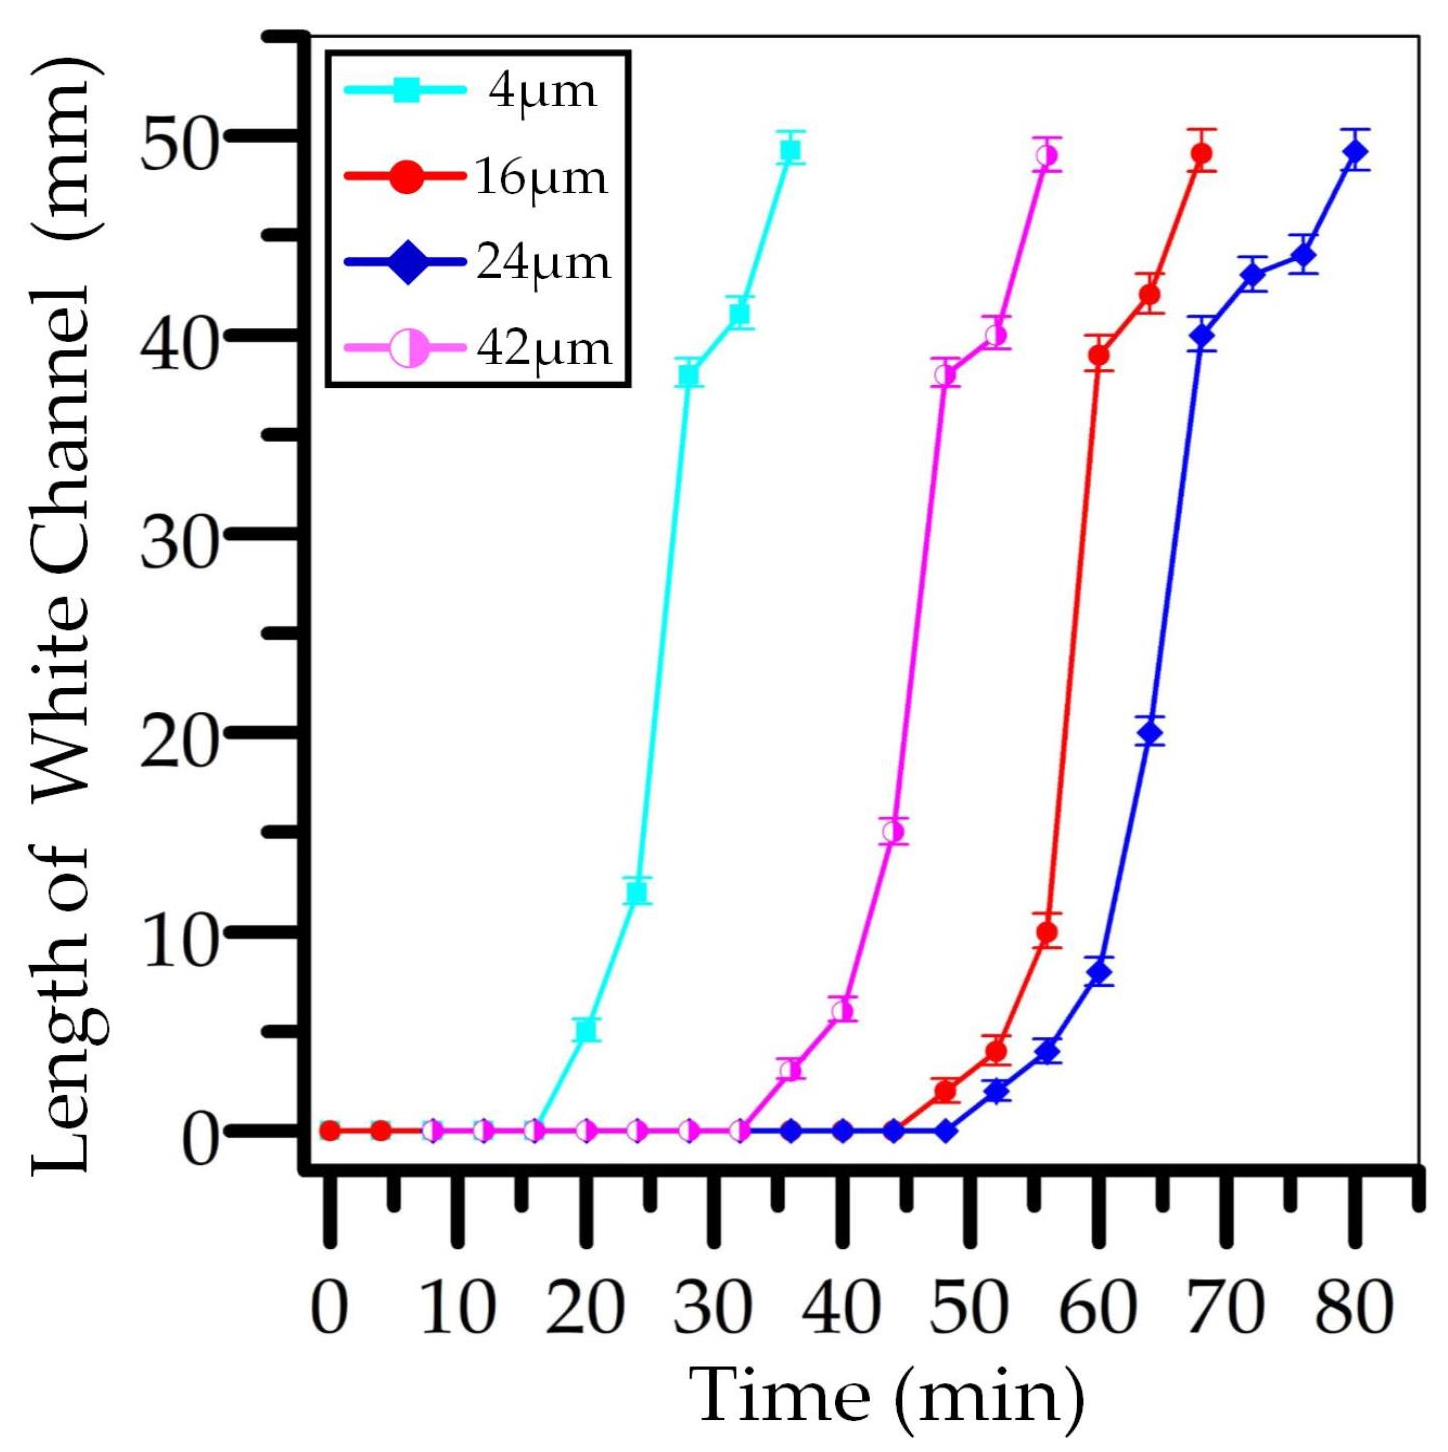
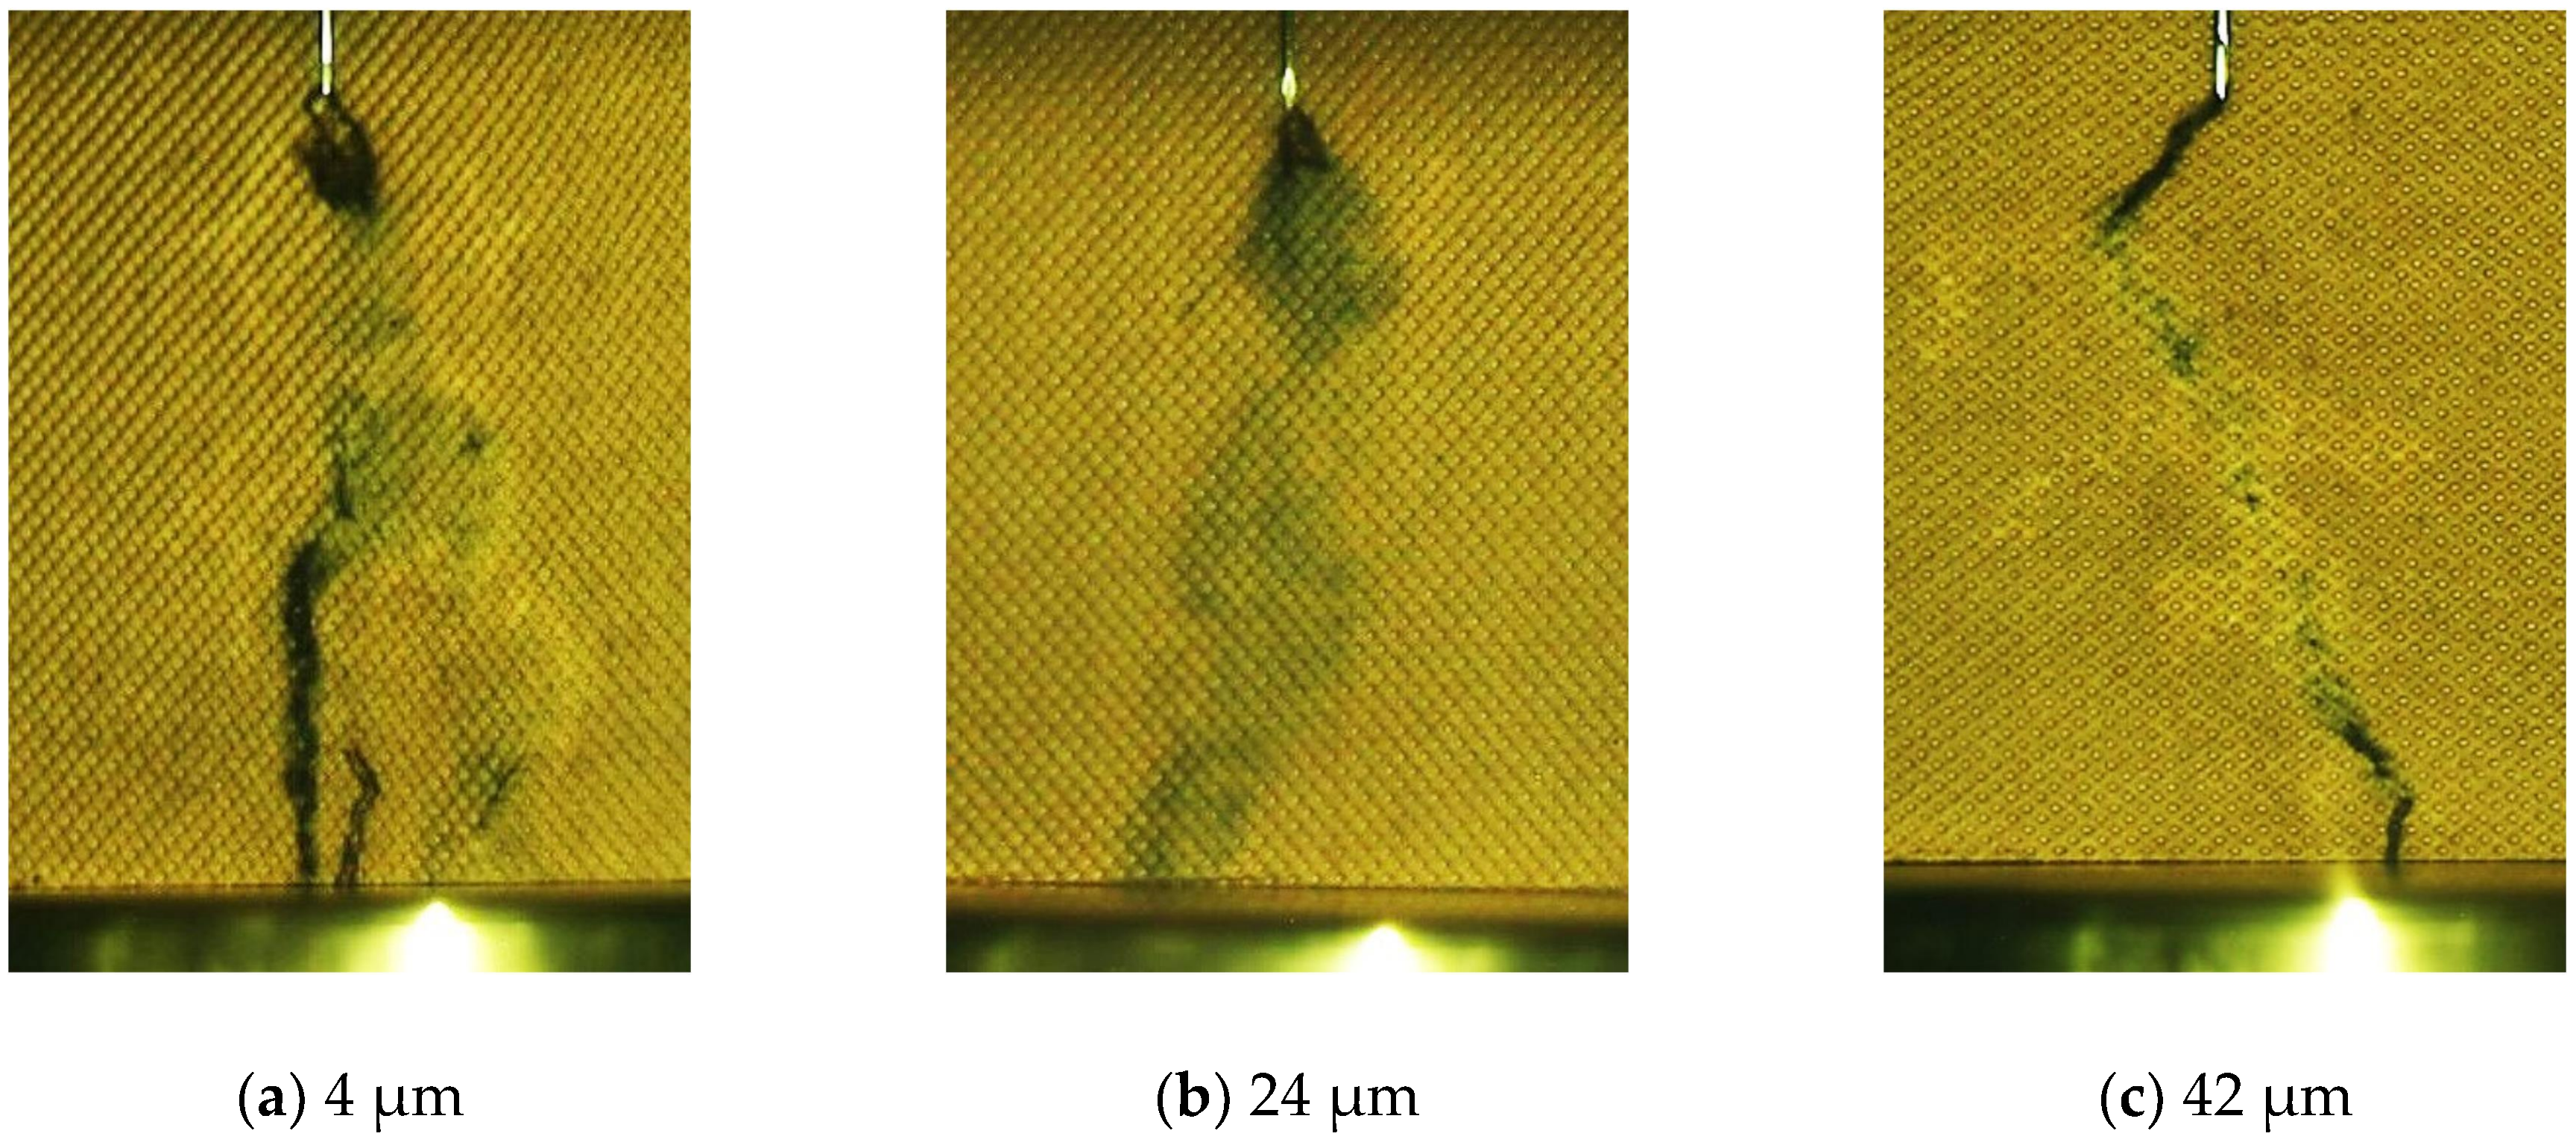
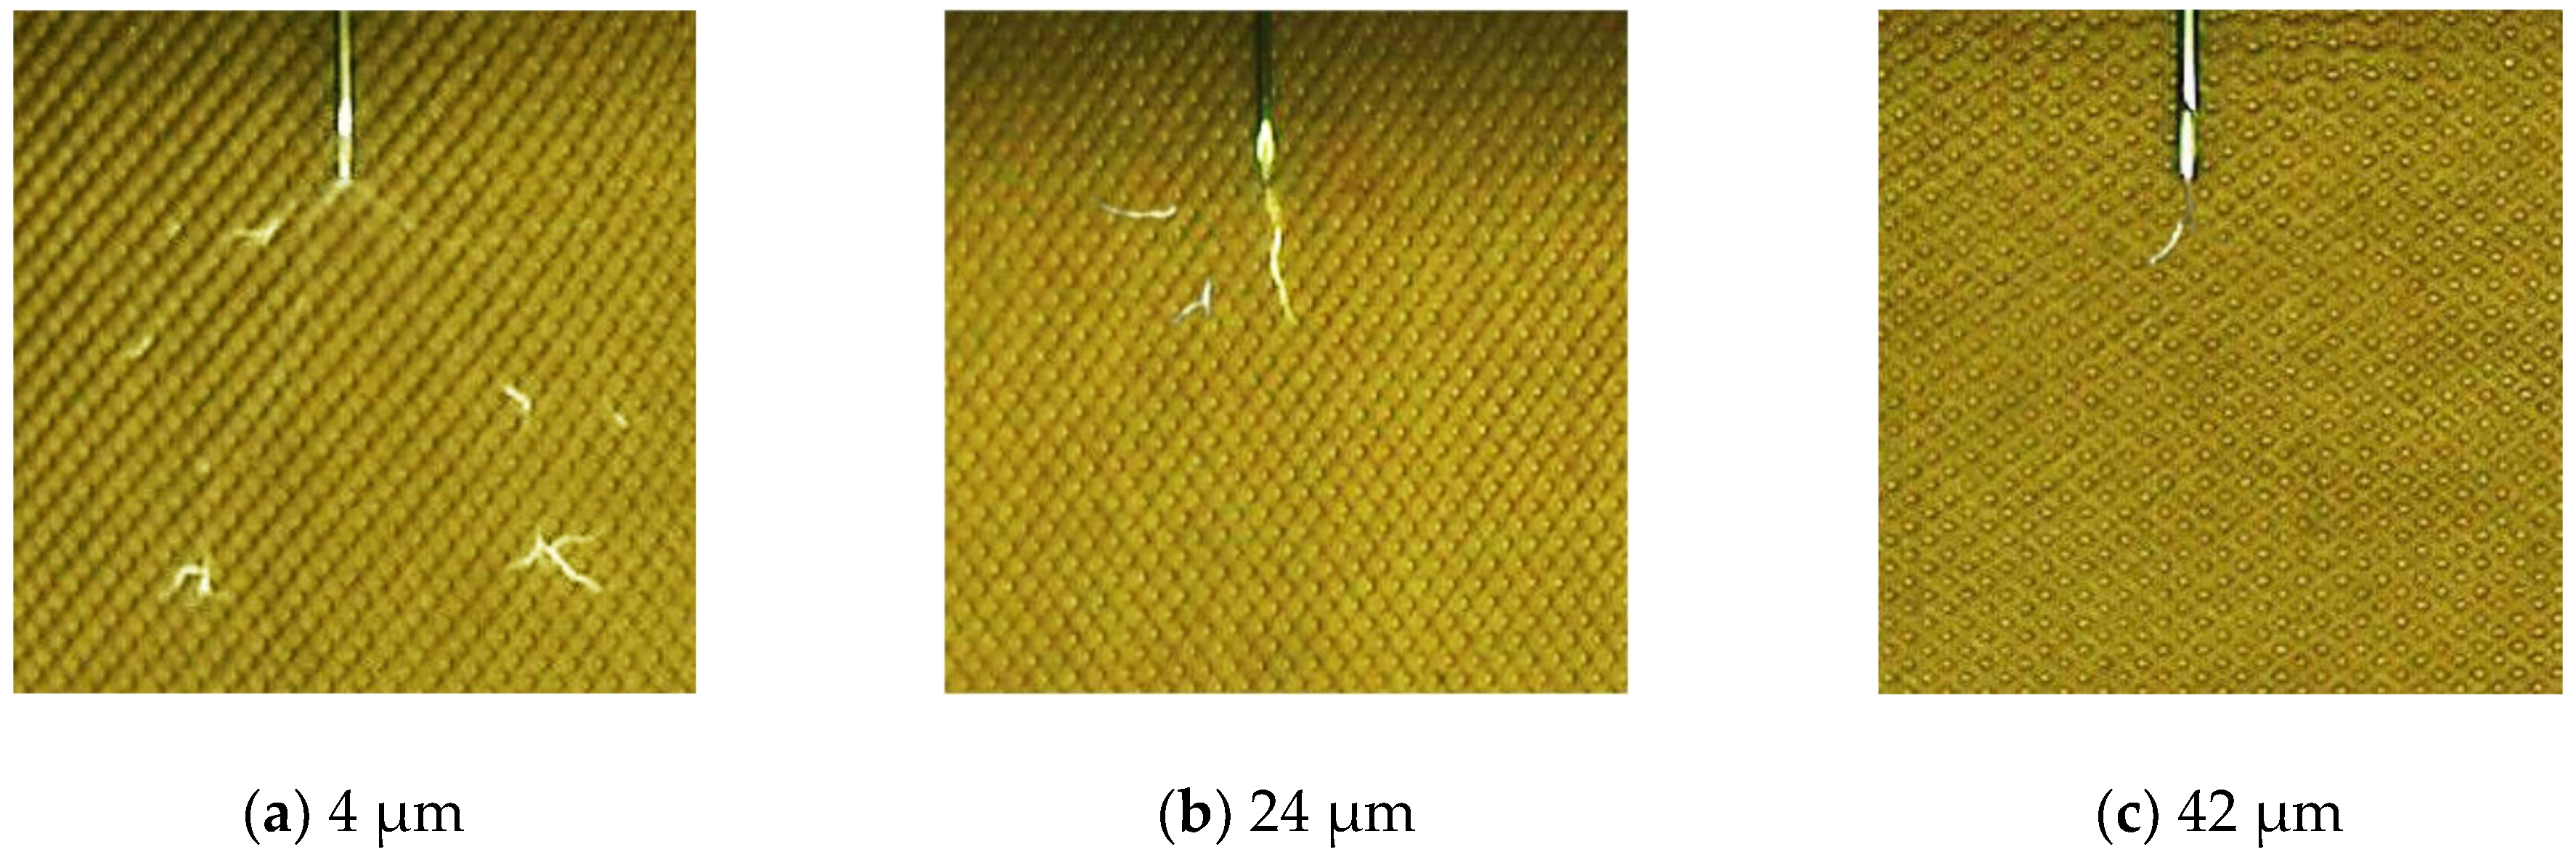
3.3. Characteristics of Surface Tracking under Different Curvatures

We recorded ten tests to analyze the surface tracking on pressboard under each curvature, the significant influence of the tip curvature on the surface tracking is shown in Figure 8. The first characteristic is that the average extension speed of the white channel decreased at first and then increased with the increase of tip curvature. The second is that the time to generate a white mark on pressboard increased first and then decreased with the increase of tip curvature. These characteristics could be attributed to the two reasons: the first is the different electric stress at the needle tip, the second is the different concentration degree of spark discharge under different curvatures. The two reasons might also explain the characteristics of PD parameters in Figure 5.
The electric stress of the needle tip ‘E’ is calculated by Equation (1), where ‘V’ is the supply voltage, which was 62 kV for all test samples, ‘r’ is the needle tip curvature, ‘d’ is the distance of needle tip to bottom electrode, which was 50 mm in this study [36]. The electric stress of needle tip could be as high as 28 MV/cm under 4 μm curvature. Consequently, the intensity of PD was much higher, and the extension speed of the white channel of 4 μm curvature was the fastest among all curvatures. The electric stress of 24 μm is 1.64 times that 42 μm curvature, the intensity of PD should be higher, and the gaseous pockets of 24 μm curvature should be easier to initiate than 42 μm curvature. However, the time to generate the white mark under 24 μm curvature was much longer than that 42 μm curvature as shown in Figure 8. This phenomenon might be caused by the different concentrations of spark discharge under different curvatures:
E = 2 V / r l n ( 1 + 4 d / r )
Various forms of the spark discharges are observed under different curvatures as shown in Figure 9. More attention should be paid to the branch number of spark discharge under different curvatures, suggesting the concentration degree of spark discharge increased with the increase of the tip curvature. The spark discharge concentrated on pressboard surface under 42 μm curvature, consequently, the white mark of 42 μm curvature could be generated easier than 24 μm curvature, hence, the PD intensity of 42 μm curvature changed earlier than that 24 μm curvature as shown in Figure 5.

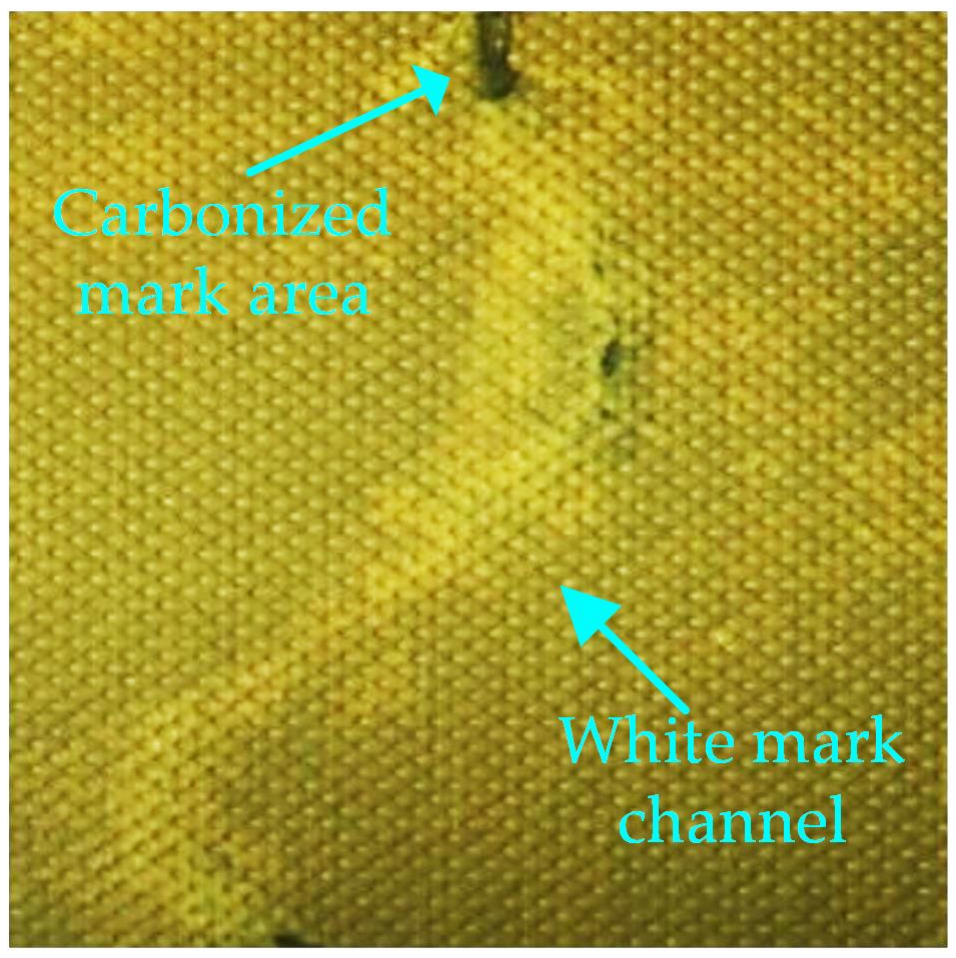
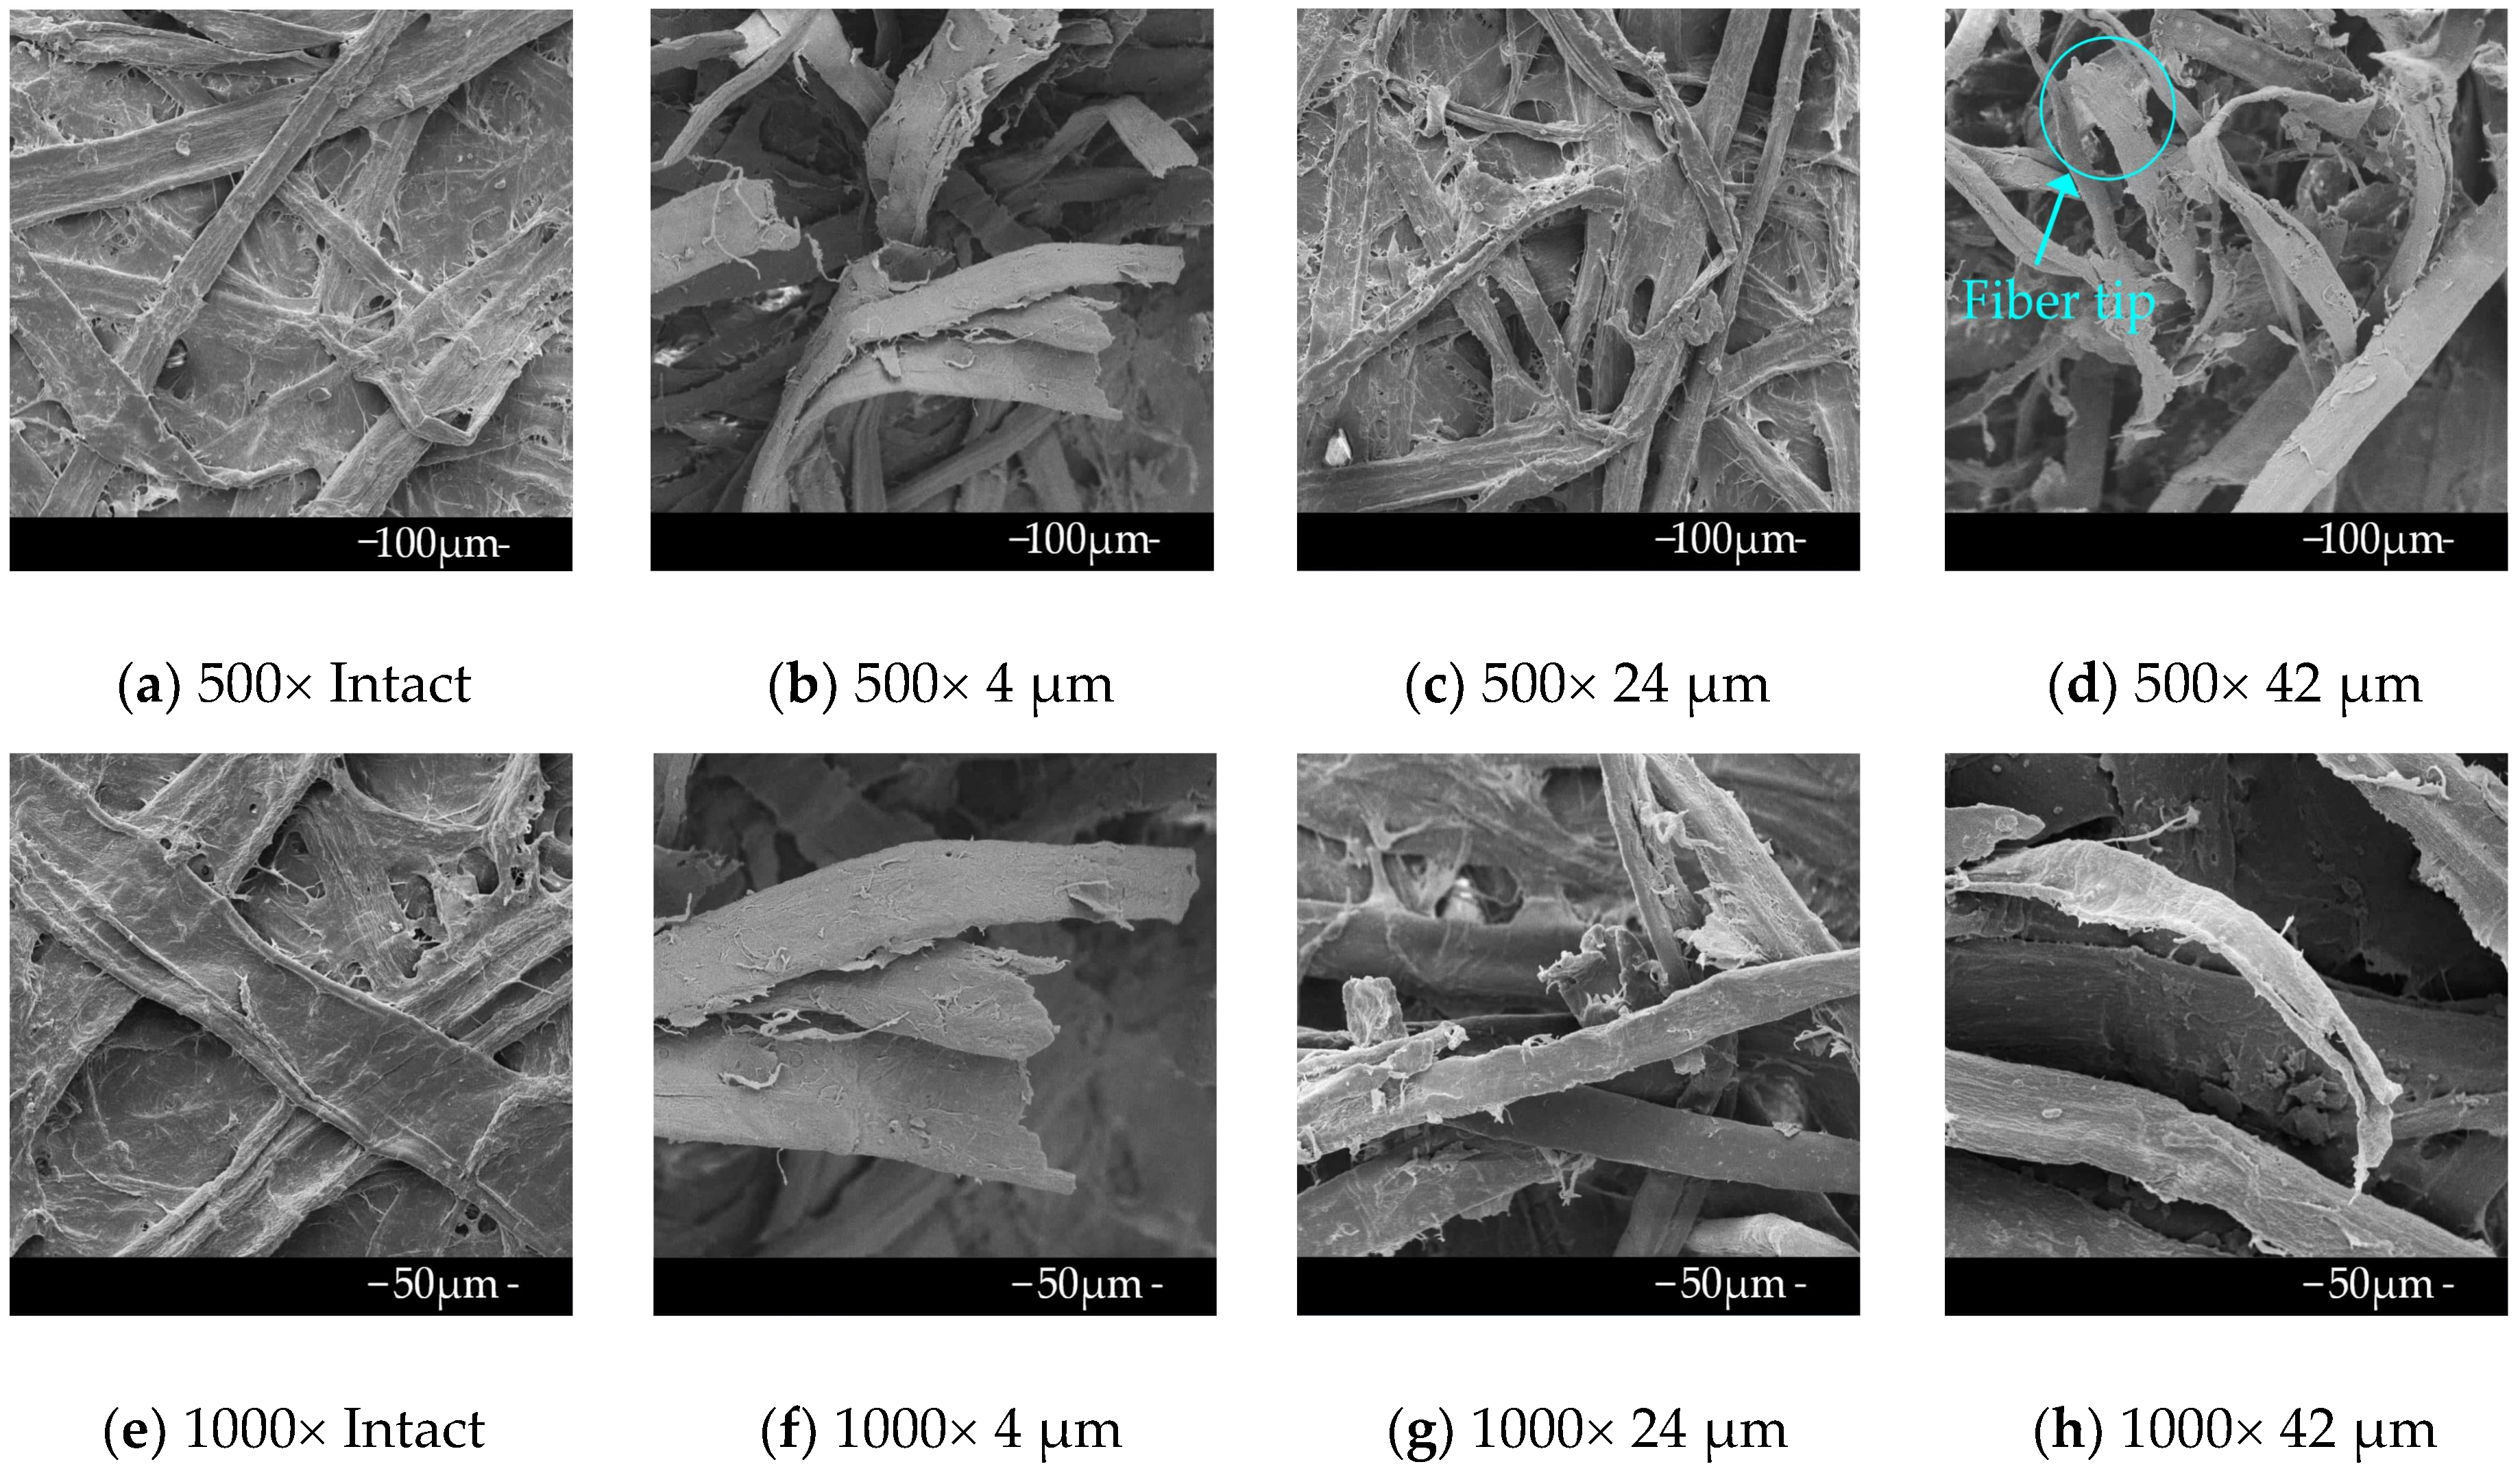
3.4. The Microstructure of Pressboard Surface

The white marks area on pressboard surface disappeared and after about one hour into the test, no visible white mark could be found on pressboard surface. Only a clearly carbonized mark could be observed; the carbonized mark is generated by the high current arcing during the flashover of the test sample as shown in Figure 10. The white mark areas on pressboards were observed under a SEM, to further understand the microstructure of the fibers on pressboard surfaces.
The results show that, the cellulose fibers on the white mark area after tests are severely broken as shown in Figure 11b–d. The fibers of the 4 μm curvature were damaged the most among the three curvatures, due to the long-term intense PD erosion during the tests. As shown in Figure 11a, the fibers on the intact pressboard are continuous and clear under 500× magnification, however, there are many burrs and flashes between the fibers, which are normal phenomena generated by the procedures used in making the pressboard samples before tests. The fibers of 24 μm curvature are mussy as shown in Figure 11c. There is even fiber tip on the white mark area under the 42 μm curvature, as shown in the circled area in Figure 11d. Whereas the most severe damage to the pressboard surface is observed on the fibers of 4 μm curvature, there are six fiber tips clearly observed on pressboard surface in Figure 11b, the burrs and flashes could not be observed on fiber surfaces because of the intense PD erosion during the test.
To establish the form of single fiber on white mark area, the microstructure of pressboard surface is further observed under 1000× magnification. Various forms of the single fiber for curvatures of 4, 24, and 42 μm are shown in Figure 11f–h. Three fibers are observed to be straight and neatly arranged in Figure 11e, and gaps between the fibers are pretty small. However, the fibers of 24 μm are disordered in Figure 11g, and gaps between the fibers become large. There is a fiber tip with a sharp edge for the curvature of 42 μm in Figure 11h. The most fiber tips are found at the white mark area for 4 μm curvature, three fibers are cut off directly with broken edges as shown in Figure 11f, and gaps between the fibers on the pressboard are also the largest among all the test samples.
The microstructure of fibers also could explain the reason for the different processes of surface tracking under different curvatures. The fibers of the 4 μm curvature have most fiber tips as shown in Figure 11b,f, indicating that the structure of pressboard was severely damaged by the intense PD. Consequently, the gaps between the fibers of 4 μm curvature were also the biggest under the severe damage, hence the gaseous pockets were much easier to propagate through the fiber gaps. Therefore, the extension speed of the white channel of the 4 μm curvature was the fastest among all tip curvatures.

3.5. Further Work

Much work is needed to further understand the characteristics of surface tracking and PD under different working conditions, although the significant influence of the tip curvature to the surface tracking and the PD is established in this article, because the surface tracking on pressboard could be influenced by many factors during the operation of power transformers. For example, high mineral oil temperature, aging of pressboard and mineral oil, the moisture content in pressboards, and presence of metal particles.

4. Conclusions

Based on the investigation of surface tracking and PD development processes under different tip curvatures, it could be concluded that the tip curvature has a significant influence on the development process of surface tracking and PD, and the damage degree of cellulose fibers depended on the tip curvature. These phenomena could be attributed to the different electric stress at the needle tip and the different concentration degree of spark discharge under different tip curvatures.
Four characteristic phenomena occurred in the development process of surface tracking under each curvature. First, the persistent spark discharge due to the intense discharges initiated in gases. Second, the carbonized mark channel because of the carbonization of mineral oil and pressboard fibers. Third, the slow extension of the white channel due to the energy consumption of the carbonized channel and long distance between white channel tip and the needle electrode. Fourth, the luminous flashover because of the intense discharge occurred in the white channel bridged the needle and the bottom electrode.

Author Contributions

R.Y. and G.H. contributed to all parts of this study under the guidance of B.G.: designing experimental model, analyzing the test data, and writing the paper; P.Z. and X.Z. revised the paper, C.L. advised the experimental setup as shown in Figure 2.

Funding

This research was funded by the National Key R&D Program of China, grant number 2017YFB0902704.

Conflicts of Interest

The authors declare no conflict of interest.

References

  1. Cui, L.; Chen, W.G.; Vaughan, A.S.; Xie, B.; Li, J.; Long, Z.Z. Comparative Analysis of Air-gap PD Characteristics: Vegetable Oil/pressboard and Mineral Oil/pressboard. IEEE Trns. Dielectr. Electr. Insul. 2017, 24, 137–146. [Google Scholar] [CrossRef]
  2. Chen, Q.G.; Sun, J.X.; Chi, M.H.; Zhang, J.F.; Tan, P. Experimental Study on Trap Characteristics of Nano-Montmorillonite Composite Pressboards. Energies 2018, 11, 9. [Google Scholar] [CrossRef]
  3. Chen, Q.G.; Lin, L.; Gao, Y.; Li, J.H. Flow Electrification Characteristics of Oil-pressboard Insulation under AC Superimposed on DC Electric Field. IEEE Trns. Dielectr. Electr. Insul. 2015, 22, 2915–2922. [Google Scholar] [CrossRef]
  4. Zhang, M.Z.; Liu, J.; Qi, P.S.; Chen, Q.G.; Liao, L.L.; Chen, X.; Yin, M.H. Measurement of dielectric response of transformer moisture content. IET Sci. Meas. Technol. 2018, 12, 594–602. [Google Scholar] [CrossRef]
  5. Li, S.B.; Gao, G.Q.; Hu, G.C.; Gao, B.; Gao, T.S.; Wei, W.F.; Wu, G.N. Aging Feature Extraction of Oil-impregnated Insulating Paper Using Image Texture Analysis. IEEE Trns. Dielectr. Electr. Insul. 2017, 24, 1636–1645. [Google Scholar] [CrossRef]
  6. Zhang, D.N.; Yun, H.; Zhan, J.Y.; Sun, X.; He, W.L.; Niu, C.B.; Mu, H.B.; Zhang, G.J. Insulation Condition Diagnosis of Oil-Immersed Paper Insulation Based on Non-linear Frequency-Domain Dielectric Response. IEEE Trns. Dielectr. Electr. Insul. 2018, 25, 1980–1988. [Google Scholar] [CrossRef]
  7. Chen, Q.G.; Zhang, J.F.; Chi, M.H.; Guo, C. Breakdown Characteristics of Oil-Pressboard Insulation under AC-DC Combined Voltage and Its Mathematical Model. Energies 2018, 11, 13. [Google Scholar] [CrossRef]
  8. Hao, J.; Zou, R.H.; Liao, R.J.; Yang, L.J.; Liao, Q. New Method for Shallow and Deep Trap Distribution Analysis in Oil Impregnated Insulation Paper Based on the Space Charge Detrapping. Energies 2018, 11, 16. [Google Scholar] [CrossRef]
  9. Li, S.B.; Ma, H.; Saha, T.; Wu, G.N. Bayesian information fusion for probabilistic health index of power transformer. IET Gener. Transm. Distrib. 2018, 12, 279–287. [Google Scholar] [CrossRef]
  10. Li, S.B.; Ma, H.; Saha, T.K.; Yang, Y.; Wu, G.N. On Particle Filtering for Power Transformer Remaining Useful Life Estimation. IEEE Trans. Power Deliv. 2018, 33, 2643–2653. [Google Scholar] [CrossRef]
  11. Ashkezari, A.D.; Ma, H.; Saha, T.K.; Cui, Y. Investigation of Feature Selection Techniques for Improving Efficiency of Power Transformer Condition Assessment. IEEE Trns. Dielectr. Electr. Insul. 2014, 21, 836–844. [Google Scholar] [CrossRef]
  12. Wang, X.B.; Tang, C.; Huang, B.; Hao, J.; Chen, G. Review of Research Progress on the Electrical Properties and Modification of Mineral Insulating Oils Used in Power Transformers. Energies 2018, 11, 31. [Google Scholar] [CrossRef]
  13. Dawei, F.; Lijun, Y.; Ruijin, L. Effect of Moisture Content on the Production and Partitioning of Furfural in Oil–Paper Insulation. IEEE Trns. Dielectr. Electr. Insul. 2018, 25, 2389–2397. [Google Scholar]
  14. Xia, G.Q.; Wu, G.N.; Gao, B.; Yin, H.J.; Yang, F.B. A New Method for Evaluating Moisture Content and Aging Degree of Transformer Oil-Paper Insulation Based on Frequency Domain Spectroscopy. Energies 2017, 10, 15. [Google Scholar] [CrossRef]
  15. Martin, D.; Saha, T. A Review of the Techniques Used by Utilities to Measure the Water Content of Transformer Insulation Paper. IEEE Electr. Insul. Mag. 2017, 33, 8–16. [Google Scholar] [CrossRef]
  16. Sikorski, W.; Walczak, K.; Przybylek, P. Moisture Migration in an Oil-Paper Insulation System in Relation to Online Partial Discharge Monitoring of Power Transformers. Energies 2016, 9, 16. [Google Scholar] [CrossRef]
  17. Mitchinson, P.M.; Lewin, P.L.; Chen, G.; Jarman, P.N. A new approach to the study of surface discharge on the oil-pressboard interface. In Proceedings of the 2008 IEEE International Conference on Dielectric Liquids, ICDL 2008, Chasseneuil, France, 30 June–3 July 2008; pp. 4–7. [Google Scholar]
  18. Mitchinson, P.M.; Lewin, P.L.; Strawbridge, B.D.; Jarman, P. Tracking and Surface Discharge at the Oil-Pressboard Interface. IEEE Electr. Insul. Mag. 2010, 26, 35–41. [Google Scholar] [CrossRef]
  19. Zainuddin, H.; Mitchinson, P.M.; Lewin, P.L. Investigation on the Surface Discharge Phenomenon at the Oil-pressboard Interface. In Proceedings of the 2011 IEEE International Conference on Dielectric Liquids, Trondheim, Norway, 26–30 June 2011; pp. 1–4. [Google Scholar]
  20. Cui, Y.; Ma, H.; Saha, T.; Ekanayake, C.; Martin, D. Moisture-Dependent Thermal Modelling of Power Transformer. IEEE Trans. Power Deliv. 2016, 31, 2140–2150. [Google Scholar] [CrossRef]
  21. Wei, Y.H.; Mu, H.B.; Zhang, G.J.; Chen, G. A Study of Oil-impregnated Paper Insulation Aged with Thermal-Electrical Stress: PD Characteristics and Trap Parameters. IEEE Trns. Dielectr. Electr. Insul. 2016, 23, 3411–3420. [Google Scholar] [CrossRef]
  22. Li, S.M.; Si, W.; Li, Q.Q. Partition and Recognition of Partial Discharge Development Stages in Oil-Pressboard Insulation with Needle-Plate Electrodes Under Combined AC-DC Voltage Stress. IEEE Trns. Dielectr. Electr. Insul. 2017, 24, 1781–1793. [Google Scholar] [CrossRef]
  23. Deng, J.G.; Wang, M.Y.; Zhou, Y.X.; Zhou, Z.L.; Zhang, Y.X.; Zhang, L.; Liu, X.Q. Partial Discharge Characteristics of Uniform Gap in Oil-impregnated Paper Insulation under Switching Impulse Voltage. IEEE Trns. Dielectr. Electr. Insul. 2016, 23, 3584–3592. [Google Scholar] [CrossRef]
  24. Xu, X.D.; Bengtsson, T.; Hammarstrom, T.; Blennow, J.; Gubanski, S.M. Loss Current Studies of Partial Discharge Activity. IEEE Trans. Dielectr. Electr. Insul. 2015, 22, 472–481. [Google Scholar] [CrossRef]
  25. Xu, X.D.; Bengtsson, T.; Hammarstrom, T.; Blennow, J.; Gubanski, S.M. Study of Partial Discharge Activity by Excess Current. IEEE Trns. Dielectr. Electr. Insul. 2015, 22, 3028–3036. [Google Scholar] [CrossRef]
  26. Sikorski, W.; Siodla, K.; Moranda, H.; Ziomek, W. Location of Partial Discharge Sources in Power Transformers Based on Advanced Auscultatory Technique. IEEE Trns. Dielectr. Electr. Insul. 2012, 19, 1948–1956. [Google Scholar] [CrossRef]
  27. Han, G.; Zhu, D.Y. Surface discharge characteristics of impregnated pressboard under AC voltages. In Proceedings of the 3rd International Conference on Properties and Applications of Dielectric Materials, Tokyo, Japan, 8–12 July 1991; pp. 313–316. [Google Scholar]
  28. Yi, X.; Wang, Z.D. Creepage discharge on pressboards in synthetic and natural ester transformer liquids under ac stress. IET Electr. Power Appl. 2013, 7, 191–198. [Google Scholar] [CrossRef]
  29. Yi, X.; Wang, Z.D. Surface Tracking on Pressboard in Natural and Synthetic Transformer Liquids under AC Stress. IEEE Trns. Dielectr. Electr. Insul. 2013, 20, 1625–1634. [Google Scholar] [CrossRef]
  30. International Electrotechnical Commission. IEC61294: Insulating Liquids-Determination of the Partial Discharge Inception Voltage (PDIV); IEC: Geneva, Switzerland, 1993. [Google Scholar]
  31. International Electrotechnical Commission. IEC60641: Specification for Pressboard and Presspaper for Electrical Purposes; IEC: Geneva, Switzerland, 2008. [Google Scholar]
  32. Sokolov, V.; Berler, Z.; Rashkes, V. Effective methods of assessment of insulation system conditions in power transformers: A view based on practical experience. In Proceedings of the Electrical Insulation Conference and Electrical Manufacturing and Coil Winding Conference, Cincinnati, OH, USA, 26–28 October 1999; pp. 659–667. [Google Scholar]
  33. Wu, K.; Suzuoki, Y.; Mizutani, T.; Xie, H.K. Model for partial discharges associated with treeing breakdown: II. tree growth affected by PDs. J. Phys. D-Appl. Phys. 200, 33, 1202–1208. [Google Scholar] [CrossRef]
  34. Zainuddin, H.; Lewin, P.L.; Mitchinson, P.M. Partial Discharge Characteristics of Surface Tracking on Oil-impregnated Pressboard under AC Voltages. In Proceedings of the 2013 IEEE International Conference on Solid Dielectrics, Bologna, Italy, 30 June–4 July 2013; pp. 1016–1019. [Google Scholar]
  35. Zainuddin, H.; Lewin, P.L.; Mitchinson, P.M. Characteristics of Leakage Current during Surface Disharge at the Oil-pressboard Interface. In Proceedings of the 2012 Annual Report Conference on Electrical Insulation and Dielectric Phenomena, Montreal, QC, Canada, 14–17 October 2012; pp. 483–486. [Google Scholar]
  36. Dai, J.; Wang, Z.D.; Jarman, P. Creepage Discharge on Insulation Barriers in Aged Power Transformers. IEEE Trns. Dielectr. Electr. Insul. 2010, 17, 1327–1335. [Google Scholar] [CrossRef]
Figure 1. The white mark and carbonized mark on pressboard surface.
Energies 12 00554 g001
Figure 2. Diagram of the experimental setup.
Energies 12 00554 g002
Figure 3. The needle-plate electrodes model for tests.
Energies 12 00554 g003
Figure 4. Characteristics of PDIVs and FVs before formal tests.
Energies 12 00554 g004
Figure 5. The time trend of PD parameters under different curvatures.
Energies 12 00554 g005
Figure 6. The development process of surface tracking under 4 μm curvature.
Energies 12 00554 g006
Figure 7. The development process of PD under 4 μm curvature.
Energies 12 00554 g007
Figure 8. The time variation trends of the white channel length under different curvatures.
Energies 12 00554 g008
Figure 9. Various forms of the spark discharge at 62 kV under different curvatures.
Energies 12 00554 g009
Figure 10. The trace of pressboard surfaces after tests under different curvatures.
Energies 12 00554 g010
Figure 11. The microstructure of white marks on pressboards under different curvatures.
Energies 12 00554 g011
Table 1. Values of needle tip curvatures from the front and lateral views.
Needle Type5#6#7#8#9#10#
Front view (μm)4~510~1116~1723~2527~2841~42
Lateral view (μm)2~35~67~812~1314~1520~21
Table 2. Main properties of the filtered mineral oil.
PropertyQuality IndexActual ValueTest Standard (China)
Moisture content (mg/kg)≤ 30/4020GB/T 7600-2014
Breakdown voltage/kV≥ 4272GB/T 507-2002
Dielectric dissipation factor (90 °C)≤ 0.0050.0009GB/T 5654-2007
Interfacial tension (mN/m)≥ 4045GB/T 6541-1986
Acid value (mg/g)≤ 0.010.0080836-2010 NB/SH/T

