1. Introduction
Climate change mitigation policy is the priority policy in the energy sector of EU member states. Fossil fuel combustion is the single largest human influence on climate, accounting for about 80% of anthropogenic greenhouse gas (GHG) emissions. In 2016, GHG emissions in the European Union 28 member states (EU-28) have declined more than 20% compared with 1990 levels, and putting the EU member states on the right way to achieve GHG emission reduction targets set for 2020 and 2030. Fuel combustion and fugitive emissions from fuels including transport and international aviation was responsible for 78% of EU-28 GHG emissions in 2016 [
1]. The share of GHG emissions from transport have increased significantly in total GHG emission since 1990. Among EU member states the biggest decreases of total GHG emissions in 2016 compared to 1990 were achieved by Baltic States and Romania. In Lithuania GHG emissions during the investigated period decreased by 58%, in Latvia by 56%, and in Estonia by 51%. In Romania GHG emissions have decreased by 54%. In 1990 all these countries had very high energy intensity and energy consumption levels, having an impact on high GHG emission profiles. Bulgaria is also a country from the soviet bloc, having the same features of energy consumption and GHG emission profile, however, results in GHG emission reduction in this country are far behind the Baltic States, especially Lithuania, as GHG emissions in Bulgaria have decreased by 42% during the same period [
1].
The EU is leading GHG emission reduction initiatives, and energy policies in the EU are tightly linked with GHG emission reduction targets. The main policies to reduce GHG emissions in fuel combustion are to increase energy supply and consumption efficiency, and use of renewable energy sources. There are many economic tools in the energy sector to promote energy efficiency improvements and the penetration of renewable energy sources [
2,
3]. Climate change mitigation policies in the energy sector mainly targeting supply sector however household sector is also important and climate change mitigation however there are important psychological barriers called the dragons of inaction having impact on climate change mitigation behavior in households [
4].
This analysis of long-term trends in CO
2 emissions from fuel combustion will prove useful for policy-makers and energy policy analysts alike [
5,
6]. Understanding the sources, drivers of greenhouse gas emissions and climate change mitigation policies impacts is essential for shaping future climate change mitigation policies [
7].
There is very limited number of new studies dealing with climate change mitigation policies in fuel combustion sector on country level [
8,
9,
10,
11,
12,
13]. Some of these studies provide comparative assessments of European Union member states in terms of sustainable growth, by applying such indicators as GHG emissions, final and renewable energy consumption as the main environmental factors [
8] but do not target comparative climate change mitigation policies assessment in EU member states. Other studies try to design the effective instrument mixes for fostering a sustainable energy transition in times of crises focusing mainly on promotion biofuel [
9,
10] however do not deal with all possible climate change mitigation options in the energy sector neither compare their effectiveness. In addition, the climate change mitigation in transport sector is among main priorities addressed in several recent studies [
11,
12,
13]. However, there are no recent comprehensive studies dealing with comparative assessments of climate change mitigation policies in fuel combustion sector of countries having similar environmental regulations in place however demonstrating quite different results in GHG emission reduction achievements. This gap is necessary to fill also because National communications to UNFCCC does not provide clear guidance how countries should be compared in terms of their achievements in GHG emission reduction and the effectiveness of implemented climate change mitigation policies in the energy sector. The achieved results in GHG emission reduction provided in the National communications to UNFCCC by countries do not provide clear links between GHG emission reduction results and drivers behind this. The paper tries to fill this gap by developing indicators framework to compare countries in terms of their achievements in climate change mitigation in the energy sector in order to learn from good practice and develop policy recommendations.
The input of this paper is linked to development of the framework for comparative assessment of GHG emission trends and climate change mitigation policies in fuel combustion sector of EU member states and application of this framework for selected EU member states having similar economic development level and historical past and implementing main EU energy and climate change mitigation policies however having achieved different success in GHG emission reduction.
The comparative assessment methodology [
14,
15,
16] applied in this paper consist of the following steps: GHG emission profiles of countries were defined; the trends of GHG emission profiles development are compared and discussed; in the next step the critical review of implemented climate change mitigation policies in selected countries was performed by identifying the similarities and differences and the main reasons for this; the impact of climate change mitigation policies on GHG emission reduction was assessed based on analysis of countries reports to UNFCCC by identifying the key areas of GHG emission reduction and their GHG emission reduction potential and the drivers. Therefore, the main criteria for comparative assessment are: GHG emission profiles, climate change mitigation priority areas and foreseen GHG emission reduction potential by these policies. The strength of applied approach is simplicity and application both qualitative analysis and quantitative data without aggregating assessment by MCDA tools or indexes [
8] as this allows to track not only results achieved by countries in GHG mitigation but also to analyse the main drivers of these achievements. The limits are mainly linked to subjectivity of applied approach.
The paper is structured in the following way: in the second section climate change mitigation policies are defined and categorized, in
Section 3 GHG emission profiles and trends in Lithuania and Bulgaria are analyzed; in the fourth section the review of climate change mitigation policies in the energy sector of Lithuania and Bulgaria are presented; in the fifth section the impact of climate change mitigation policies on GHG emission reduction in the energy sector are provided; in the sixth section the results of comparative assessment of countries were discussed following by conclusions and policy implications in
Section 7.
2. Climate Change Mitigation Policies
The Republics of Lithuania and Bulgaria participate in the global climate change mitigation process and are among the 195 countries in the world that have ratified the United Nations Framework Convention on Climate Change (UNFCCC). Addressing the challenge of climate change in countries with different levels of development must be different, depending on the country’s specifics, historical assumptions and future prospects however new EU member states are facing specific challenges in terms of GHG reduction commitments as have to deal with various EU directives and regulations linked to energy and climate change mitigation policies [
17,
18,
19,
20].
Climate change policy should be considered as a political phenomenon of the market [
21,
22]. The demand for this market consists of the interest of the interest groups in the environmental field. These groups include regulated industries and manufacturers of complementary products, environmental organizations, and labor and consumer organizations. Supply in this market is made up of legislators and administrators involved in the development and implementation of environmental policy measures [
23].
Climate is also a public good [
24]. Those who do not pay for it cannot be discounted from the benefits it brings, and the one-man benefits from the climate do not reduce the benefits of other people’s climate. The markets themselves are not able to provide the necessary quantity and quality of public goods, because in the absence of public policy, private investors do not get enough profit by investing in public goods. Thus, the markets for the relevant goods or services (energy, land, innovation) do not reflect the effects of different consumption or different investment choices on the climate, and therefore climate change is an example of market failures that include externalities and public goods. In formal economic theory, public goods are one of the positive alternatives of external influences. Therefore, climate change can be regarded as the world’s largest market failure [
23,
24,
25].
Key specific features of climate change can be identified based of literature review provided above:
Climate change has an external impact, which is global in terms of causes and consequences. The impact of one tone of greenhouse gases on climate warming does not depend on where it was emitted (as opposed to the adverse effects of other pollutants and the resulting health costs), since greenhouse gases are dispersed in the atmosphere and local climate change depends on the global climate system.
The effects of climate change are permanent and with time it develops. Once exposed to the atmosphere, greenhouse gases remain there for thousands of years. In addition, the climate system responds very slowly to atmospheric changes in greenhouse gas concentrations, and the environmental, economic, and social effects of climate change have a greater backlog in time. The effects of climate change are currently being felt and will be felt for a long time.
Uncertainties regarding the severity, type, and duration of climate change impacts and the cost of mitigating climate change are very high, and therefore the methods used should include an assessment of risks and high uncertainties.
The impact of climate change on the global economy will be high unless joint action is taken to mitigate climate change.
These features of climate change act together and thus create specific challenges for the theory of external costs.
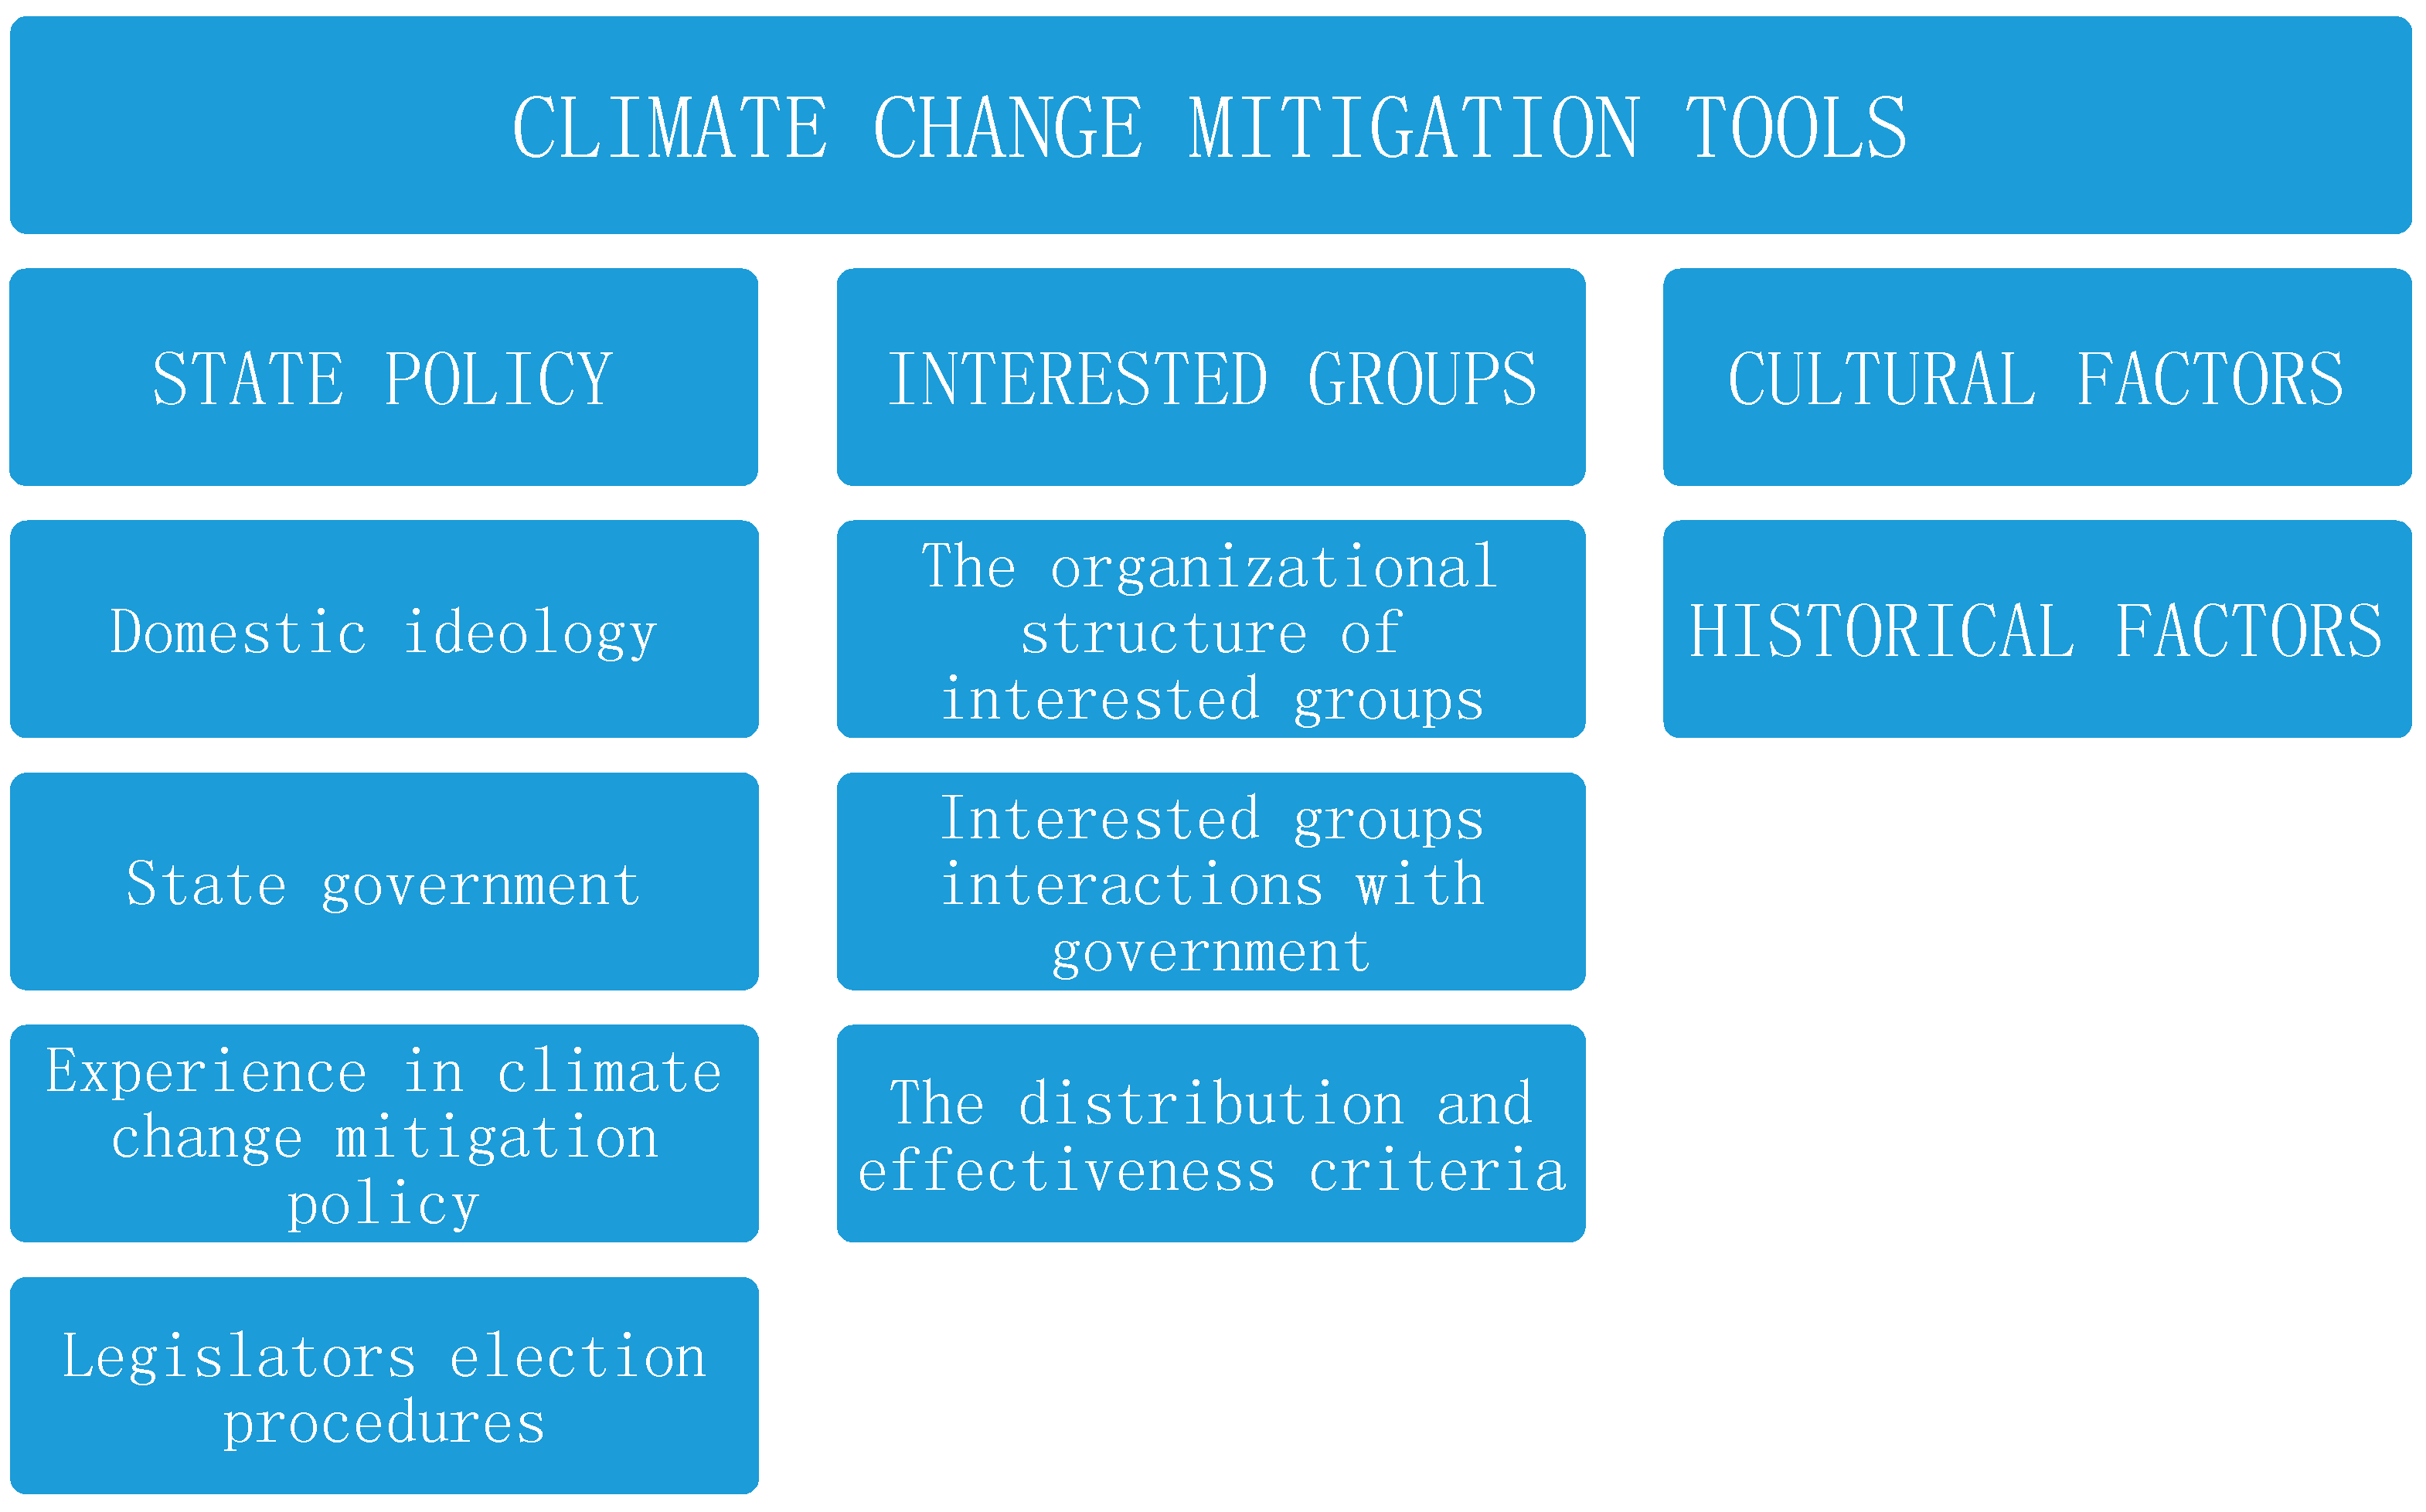
Different countries have different forms of state governance, which results in different political actions and different policies in the area of climate change mitigation. In order to implement specific policies, political will and relevant laws are being adopted by the ruling parties. The latter’s approach to climate change is different [
26,
27]. It is therefore obvious that the organizational structure of the existing stakeholders and their interaction are key factors in determining which policy instruments will be adopted. In
Figure 1, the classification of factors determining the selection of climate mitigation measures is presented.
As one can see from
Figure 1, state climate change mitigation policies are based on domestic ideology, government, available experience in climate change mitigation and election procedures of parliament members and decision makers. Interested groups can also have significant impact on implementation of climate change mitigation policies. Specific climate mitigation measures can be useful for certain industries. These measures can limit access to the industry or may lead to higher market entry costs. In the area of climate change mitigation, some of the most commonly used regulatory measures can bring companies rent due to regulatory decline in output and price growth [
28,
29]. History and cultural factors are also playing important role in developing climate change mitigation policies as well as guiding behavior of different interests groups.
An important point is that different companies behave differently and make different choices. In this way, there is a different effect on the sector. The introduction of any climate mitigation measure poses an additional burden for the entire industry, but these measures can be supported by those companies that benefit from them. In this way, companies that can ensure emission reductions at lower costs than competing firms, and can support market simulation policies such as the emissions trading scheme [
30,
31]. Under the Global Climate Change Policy, the ban on the use of ozone-depleting substances (CFCs) under the Montreal Protocol was supported by firms that had hoped to dominate the CFC substitute—the market for fluorinated hydrocarbons (HFCs).
Regulated firms are not the only ones who may be interested in using regulation because opposition groups are also defending their interests. Environmental groups are in favor of the implementation of the strictest environmental standards, although many of them are opposed to the introduction of market simulations by philosophical evidences, arguing that such measures give firms a license to pollute, or conflicts arise from the hostile attitude towards monetary valuation of environmental damage [
32].
The key point that has emerged over the last three decades is that market laws and market logic portray climate change, including the greenhouse effect, as a political heresy. In this way, global policy has successfully contributed to the most important and fundamental cause of global warming—the growing greenhouse effect that goes into the atmosphere of more and more gases. Therefore, the design of market instruments should be sufficiently flexible to assess ethical aspects without compromising the requirements of efficiency. Cultural and historical factors are also very important in choosing a climate change mitigation policy tool. In addition, there are clear limitations of political economy, with price, non-price, and regulatory policies, which often lead to a combined policy strategy, are often seen in practice.
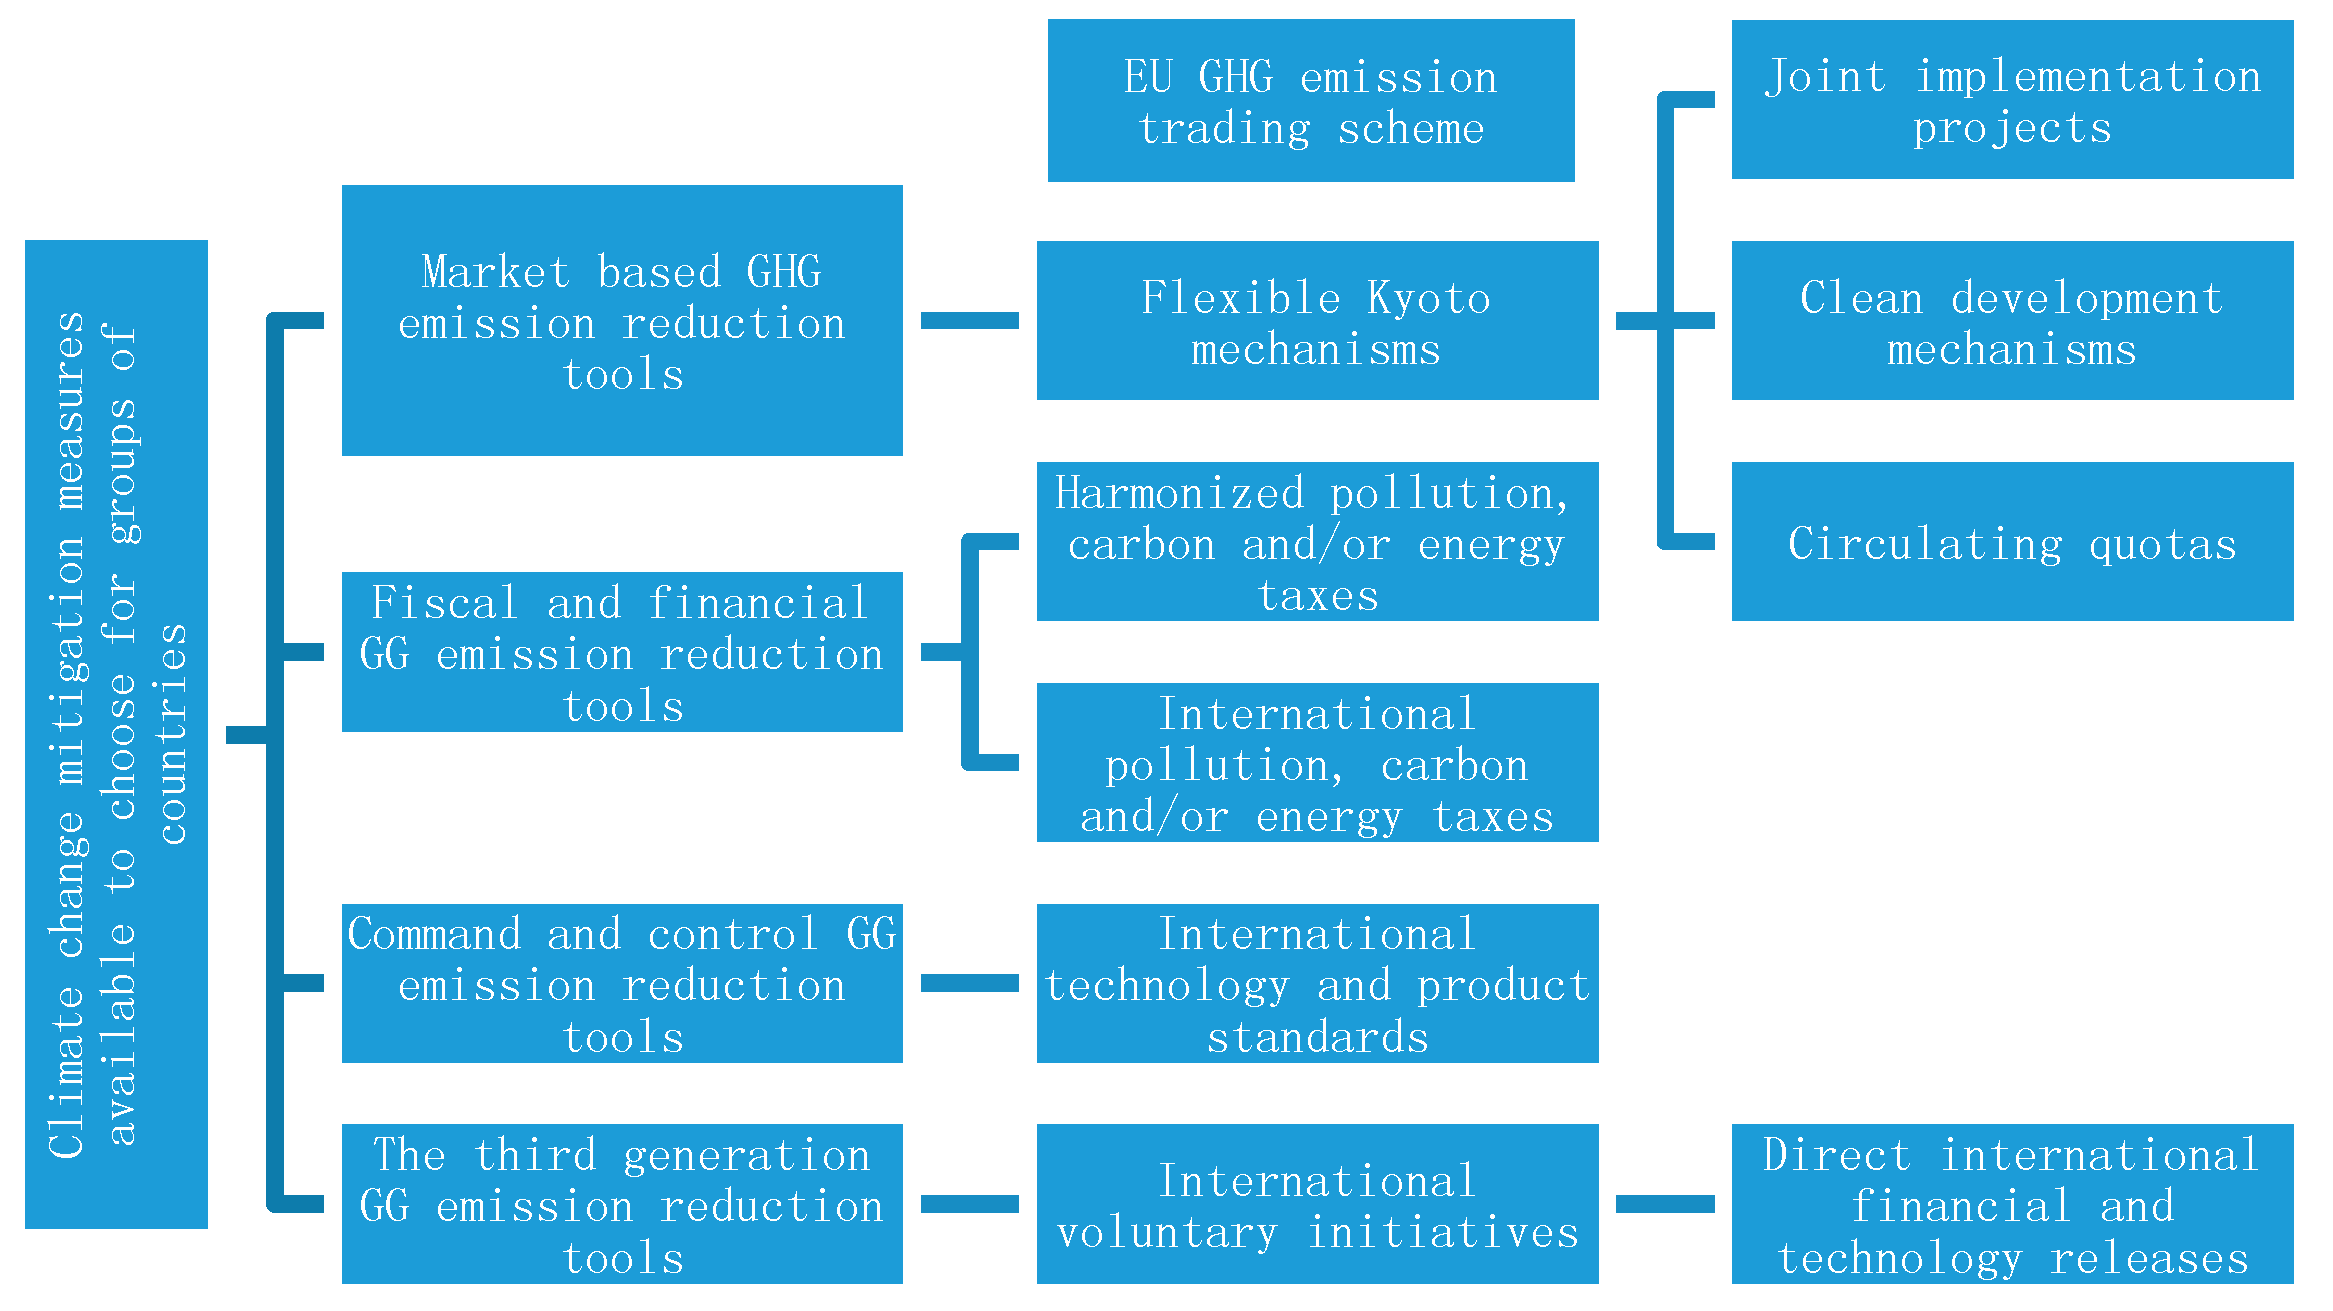
As shown in
Figure 2, group countries can reduce their emissions by taking joint action to reduce emissions and apply one or more climate mitigation measures.
As one can see from
Figure 2 the main climate change mitigation policies and measures in fuel combustions sector can be divided to market based instruments, fiscal and financial measures, command and control measures and third generation climate change mitigation tools such as voluntary initiatives or corporate social responsibility practices. Market based instruments such as flexible Kyoto mechanisms or an EU GHG emission trading scheme allow achievement of GHG emission-reduction targets by countries in a more efficient way [
31].
The main objective of environmental climate change policy is to strike a balance between pollution and pollution abatement costs. Ideally, the pollution must be reduced to a level where the benefits to the public from the further reduction of pollution are lower than the costs of pollution control devices or pollution abatement [
33]. Thus, from an economic point of view, pollution should be controlled to the extent that the marginal costs of further abatement measures outweigh the benefits of emission reductions. In this way, the company can align the marginal cost reduction function and the marginal cost of damage, and the state can achieve an optimal level of pollution control. In the broad sense, economic instruments are treated as "goods" in the political market [
34] and measures that transfer well-being.
3. Analysis of GHG Emission Profiles and GHG Emission Trends in Lithuania and Bulgaria
Lithuania (LT) and Bulgaria (BG) are new EU member states, having similar levels of economic development and similar historical pasts, however, the countries are distinguished with quite different GHG emission profiles and energy consumption patterns.
Lithuania and Bulgaria are Parties of the Convention and Kyoto Protocol—together with the other EU Member States—have committed to a quantified economy-wide emission reduction target of 20% by 2020, below 1990 level. Both parties (LT and BG) have previously (2008–2012) agreed upon reducing GHG levels below 8% of those that were in 1990. The current targets now (2013–2020) for both LT and BG, as part of the EU—20% below 1990 levels by 2020 and also 40% below 1990 levels by 2030 if comparable and adequate actions by other countries were taken [
35].
Given the current data on GHG emission trends, a comparison between the two countries LT and BG can be done. In
Table 1 the GHG emission reduction by sector during period 1990–2016 are given for Lithuania and Bulgaria.
As one can see from
Table 1 GHG emissions from the energy sector decreased significantly in both countries during period 1990–2016. GHG emissions from transport sector has increased in Bulgaria during investigated period and slightly decrease in Lithuania. In other GHG sectors (except LULUCF) one can notice a sharp decrease of GHG emissions, meaning that both countries go the right way to reduce GHG emissions in this sector, but have achieved quite different results. Especially big differences can be noticed in the LULUCF sector as GHG emissions have increased significantly in this sector in Lithuania during 1990–2016 but have decreased in Bulgaria. The European Commission is considering greater inclusion of LULUCF in its climate policy framework and this can be a great challenge for Lithuania.
However, one can notice that GHG emission reduction achieved by Lithuania and Bulgaria in energy industries during this period are especially distinctive. In Lithuania GHG emissions in energy industries have decreased almost 5 times though in Bulgaria just by 1.5 times during 1990–2016. Taking into account the final closure of Ignalina NPP in 2009, this reduction of GHG emission can be linked to sharp increase share of RES and energy efficiency in energy generation sector. However more deep analysis is necessary in order to grasp Lithuanian success in GHG emission reduction.
IAEA together with other international institutions has developed energy indicators for sustainable development (EISD) framework which is useful for analysis of GHG emission drivers and their interactions in the energy sector [
38].
In
Table 2 the main indicators representing countries GHG emission profiles and their drivers are selected from EISD list [
38].
Indicators framework presented in
Table 2 is useful for analysis of GHG emission profiles of selected countries as these allow to track the main drivers having impact on GHG emission development trends. Also some indicators are linked with targets established by EU energy and climate change policy documents. This is addressed in last column of
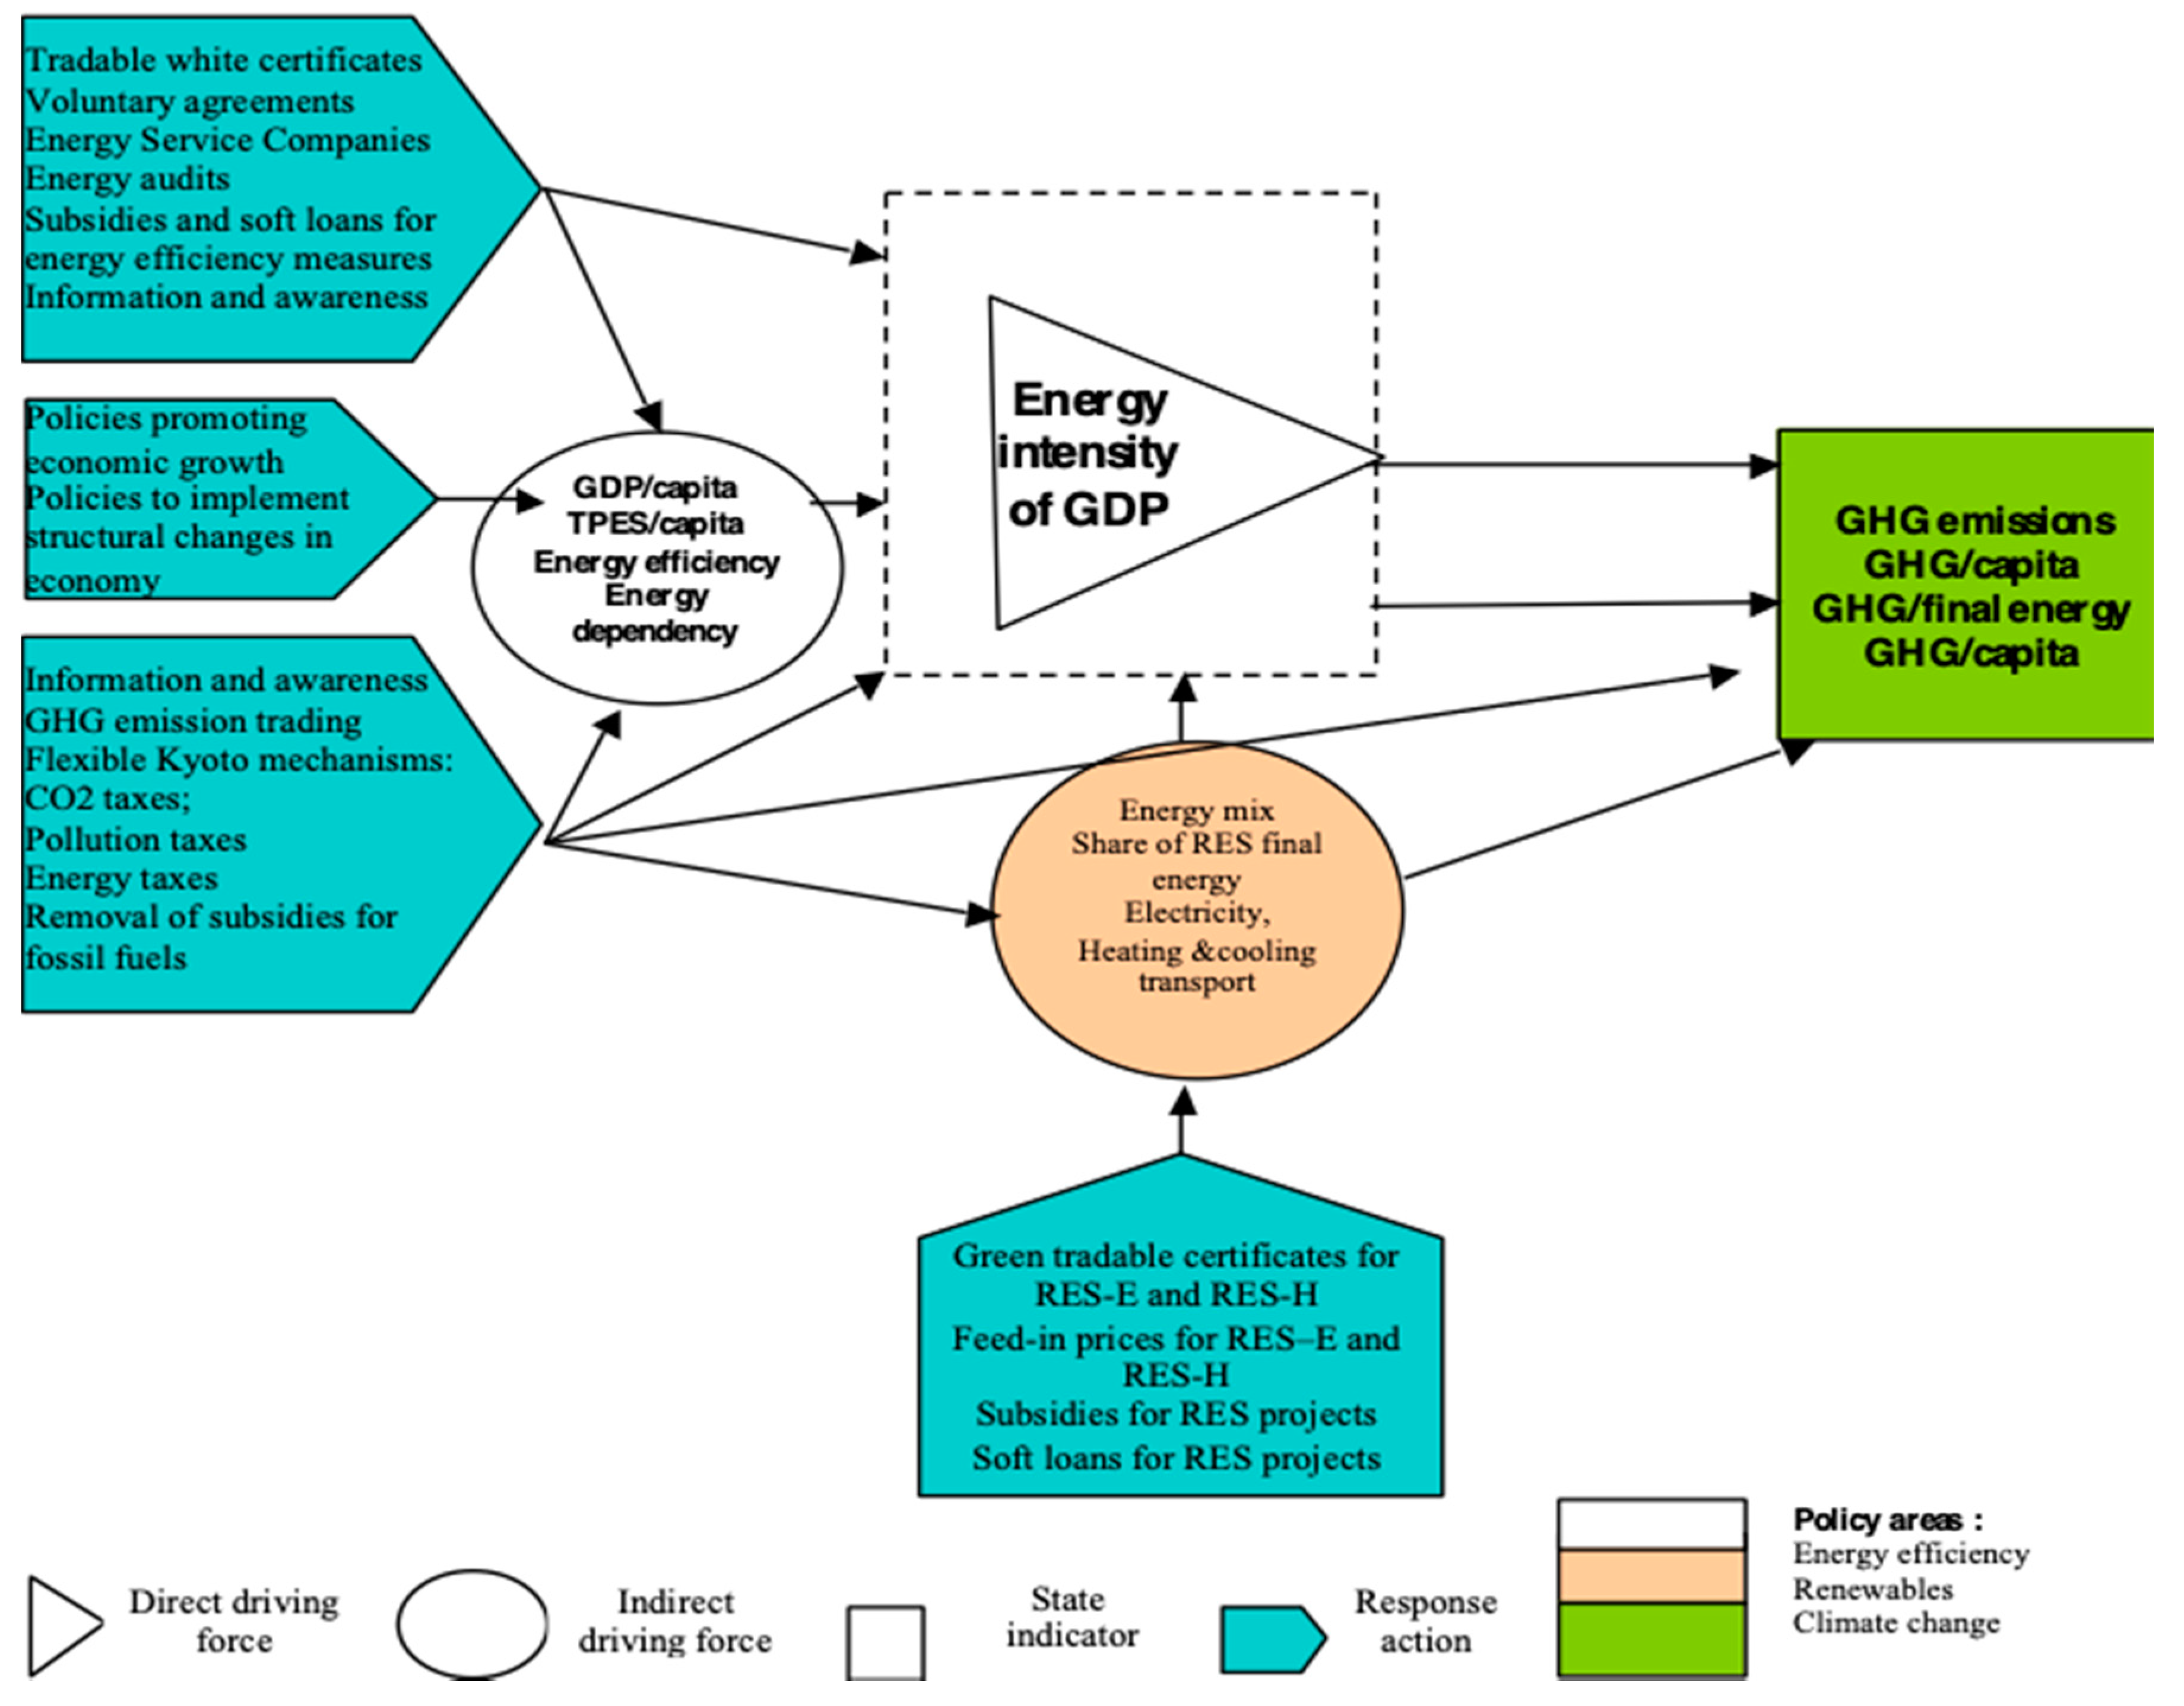
Table 2. In
Figure 3 the interrelations between indicators are provided.
As on can see from
Figure 3 there are state indicators, direct driving force, indirect driving force indicators and response actions having impact on indicators. Indicators representing economic and environmental area also are grouped based on policy areas: energy efficiency, renewables and GHG emissions. The GHG emissions from the energy sector, GHG/capita, GHG/GDP, GHG/final energy supply are final environmental state indicators in the chain of mutual impacts and are used to assess countries GHG profiles. The direct driving force of GHG emissions is energy intensity of GDP. Carbon intensity of final energy supply depend on gross inland energy supply mix, electricity generation mix, and the share of renewables in final energy consumption, in electricity generation, heating and cooling and transport fuels which are main indirect driving force indicators of GHG emissions. The GDP/capita, energy consumption per capita, energy efficiency of energy supply system and energy import dependency are indirect driving force indicators having impact on energy intensity and then on GHG emission profiles of the countries.
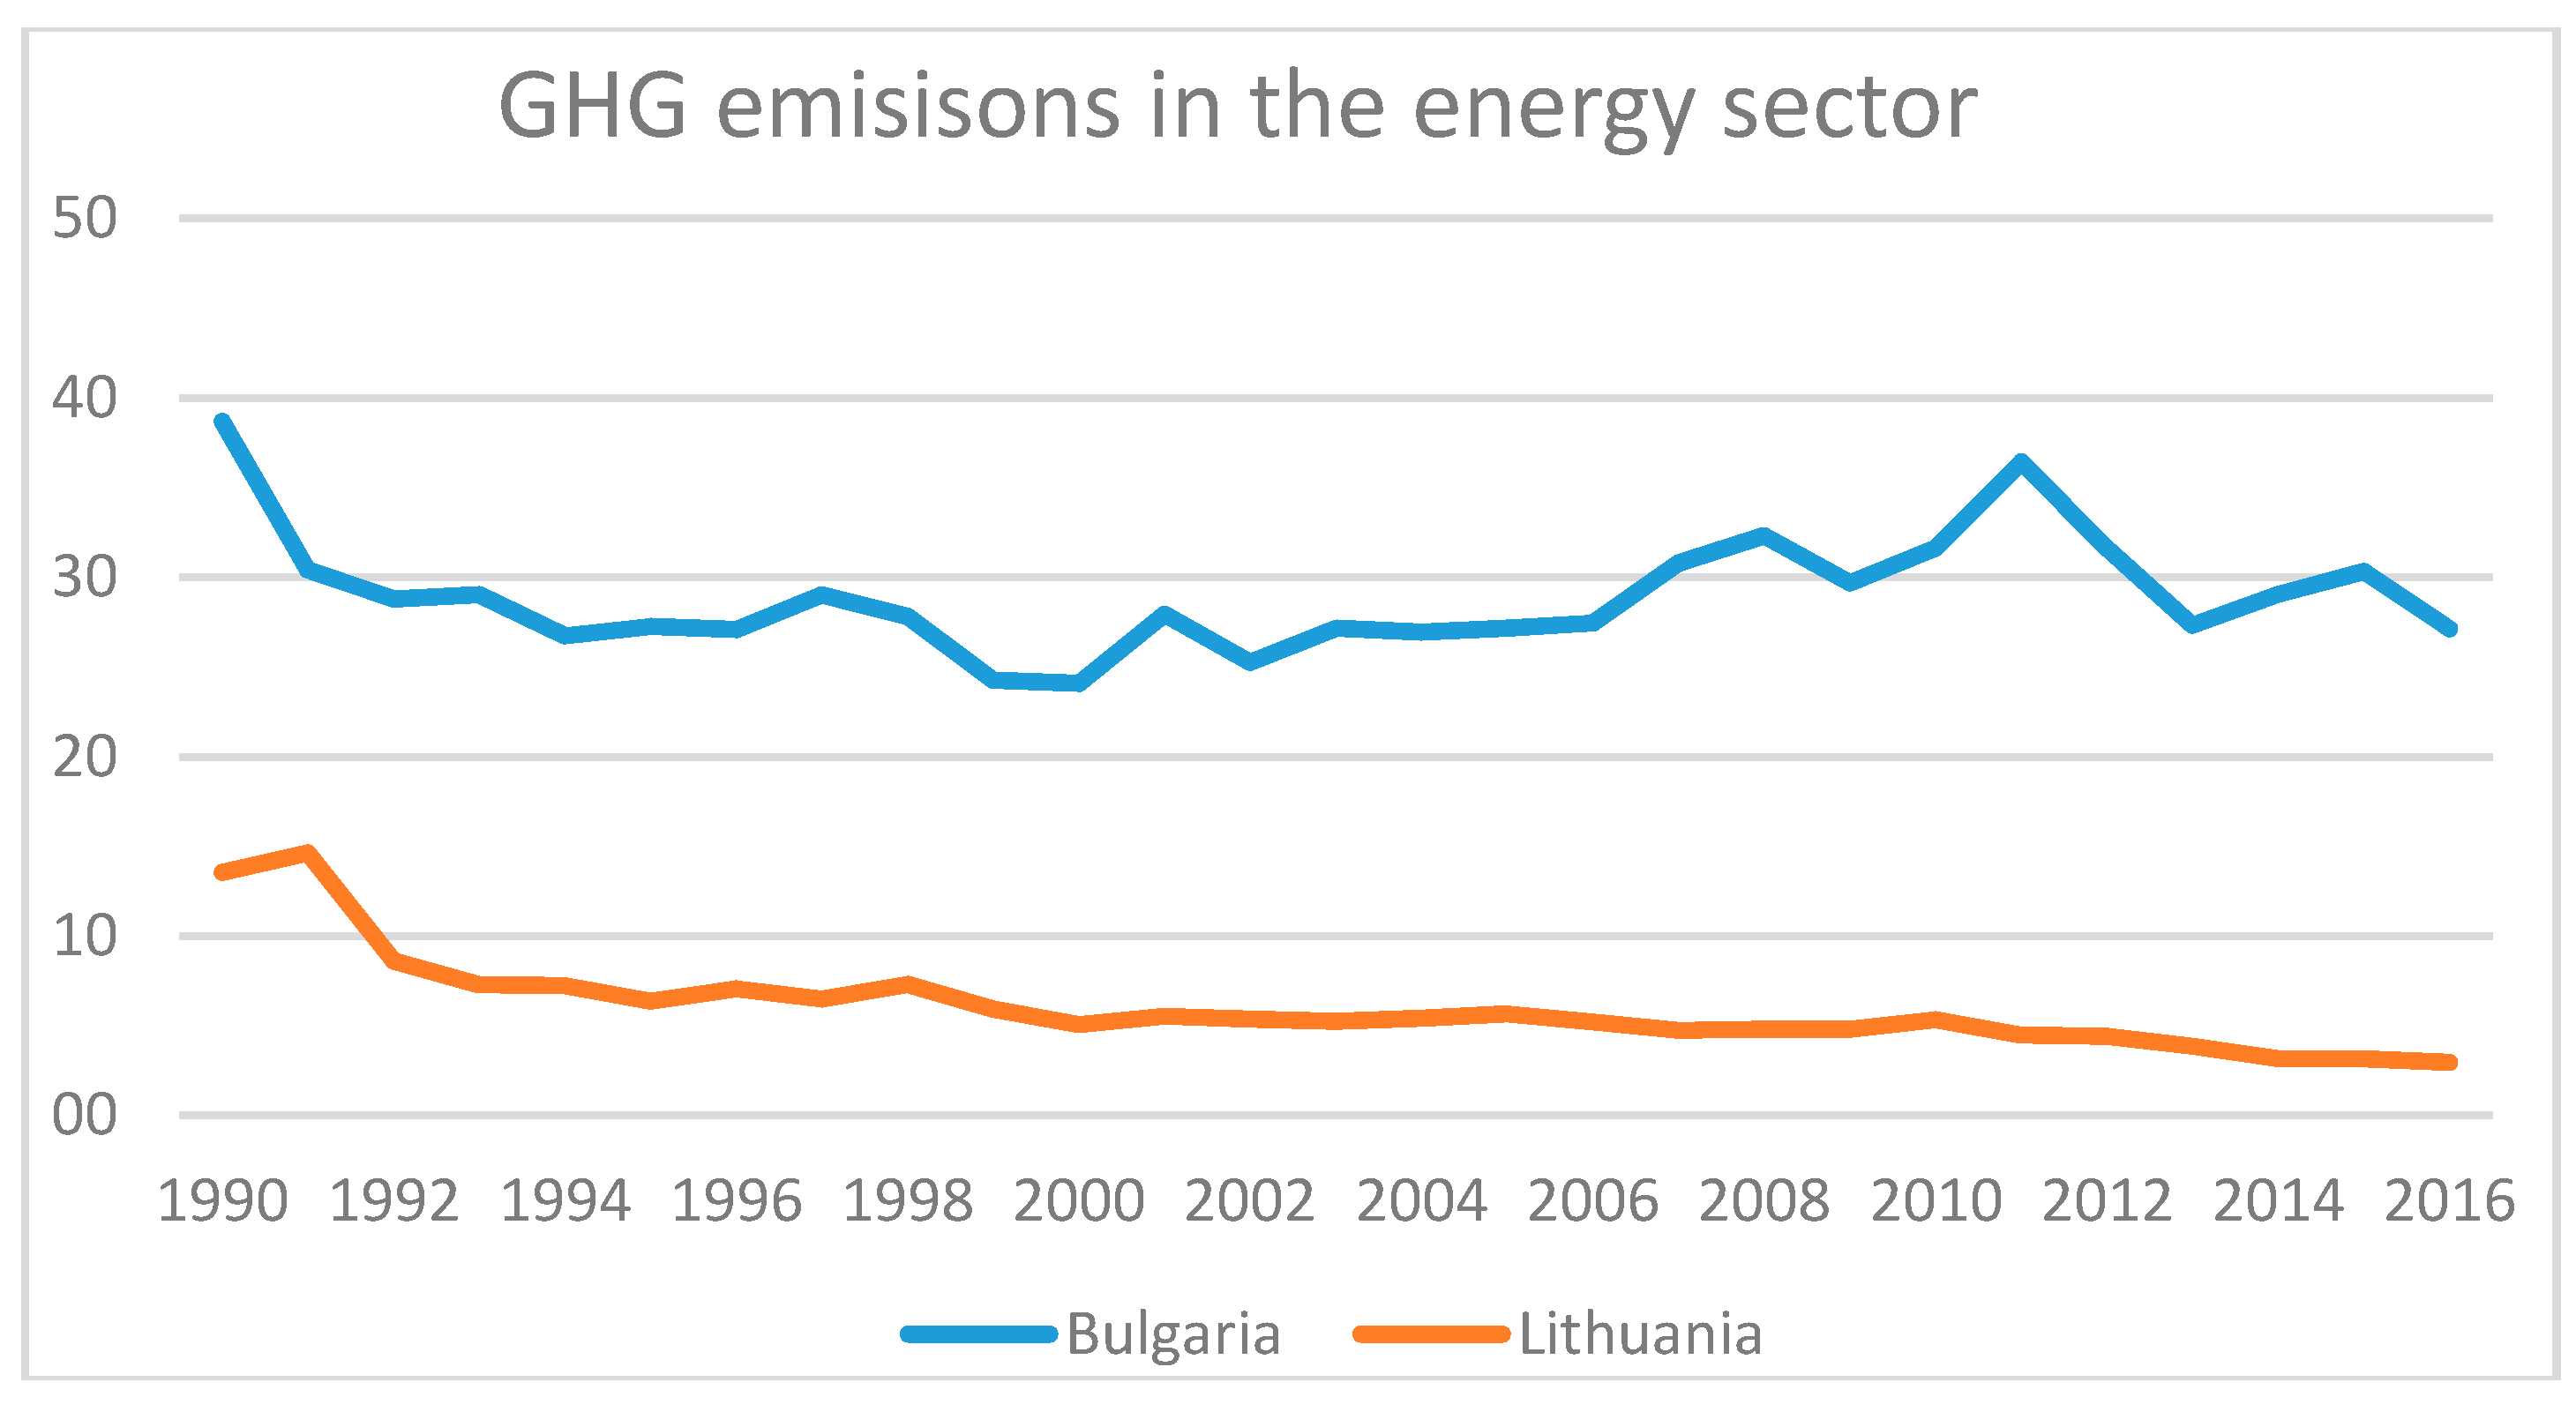
As one can see from
Figure 4 GHG emissions from the energy sector were decreasing in Lithuania during all investigated period just some increase can be noticed in 1999 linked with closure o Ignalina NPP. However in Bulgaria decrease of GHG emissions from the energy sector was not so significant and some increase trend since 2000 can be noticed however since 2011 the decline trend can be noticed.
Total GHG emissions in 2016 in Lithuania amounted to 42% of the base-year level and were significantly below the Kyoto target of −8% for the period 2008–2012. However, GHG emissions in Bulgaria in the same year amounted to 59.7% of the base-year level. This shows that Lithuania achieved better results in GHG mitigation up to now.
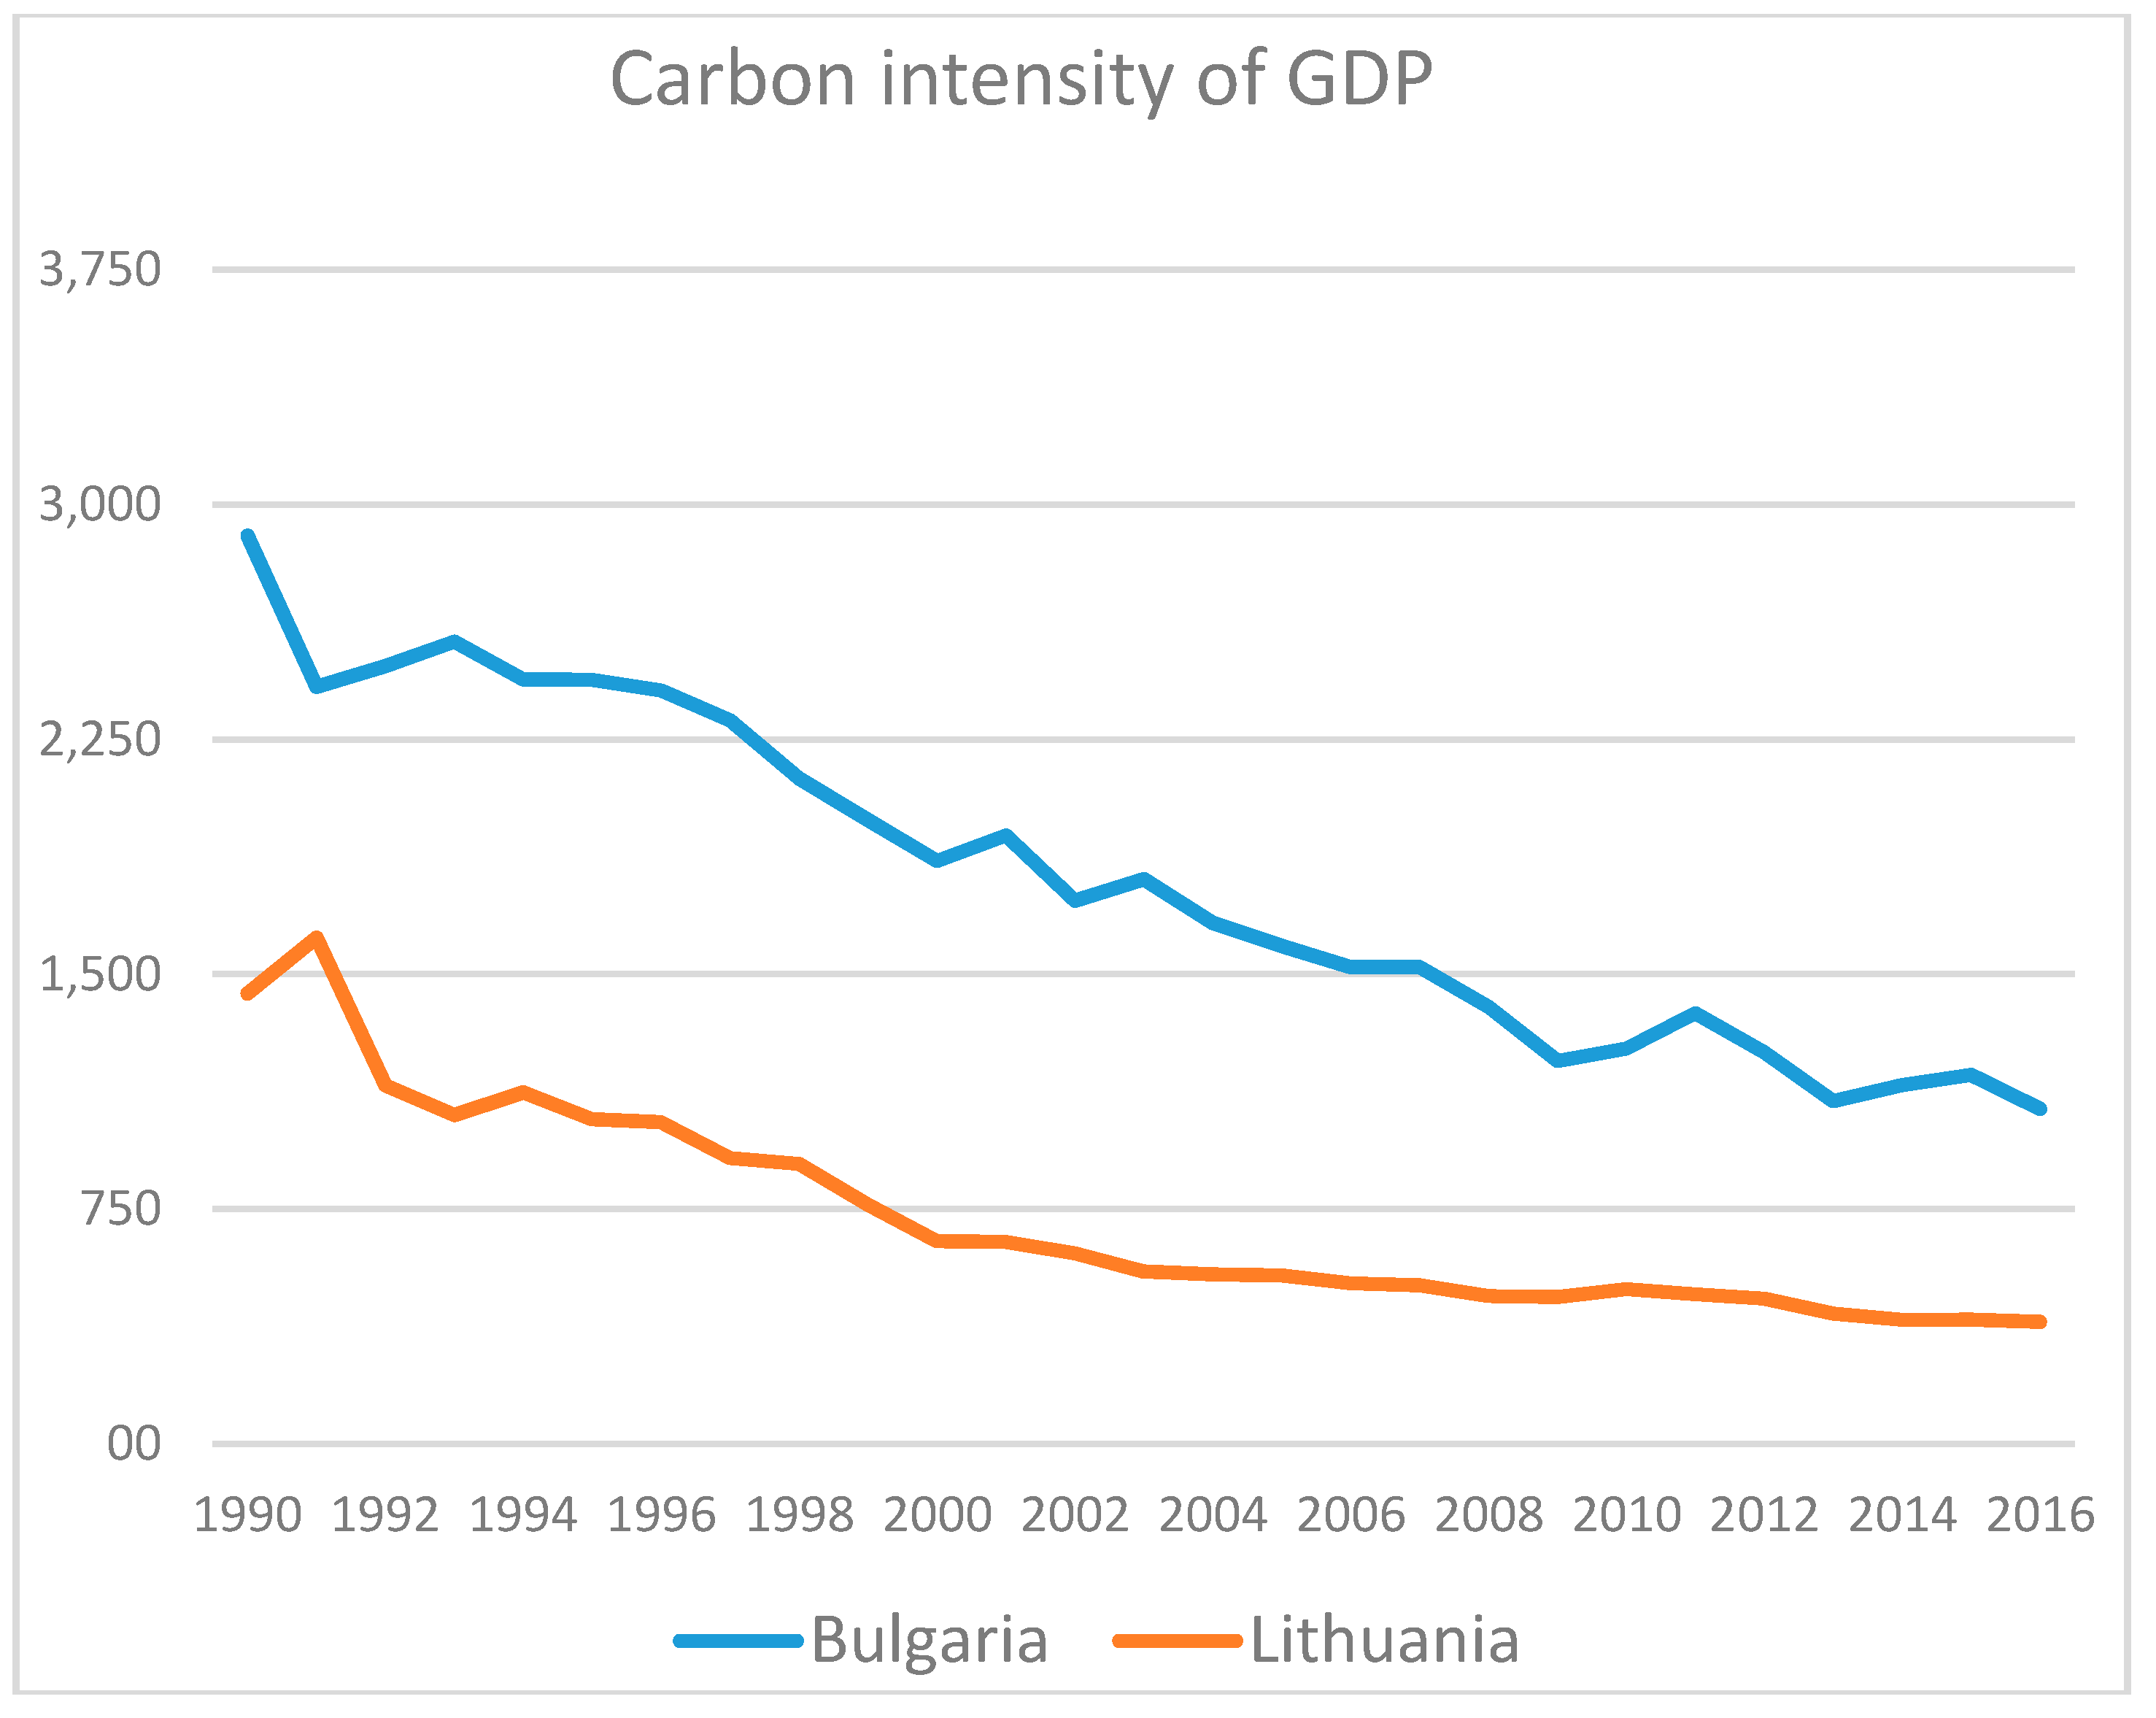
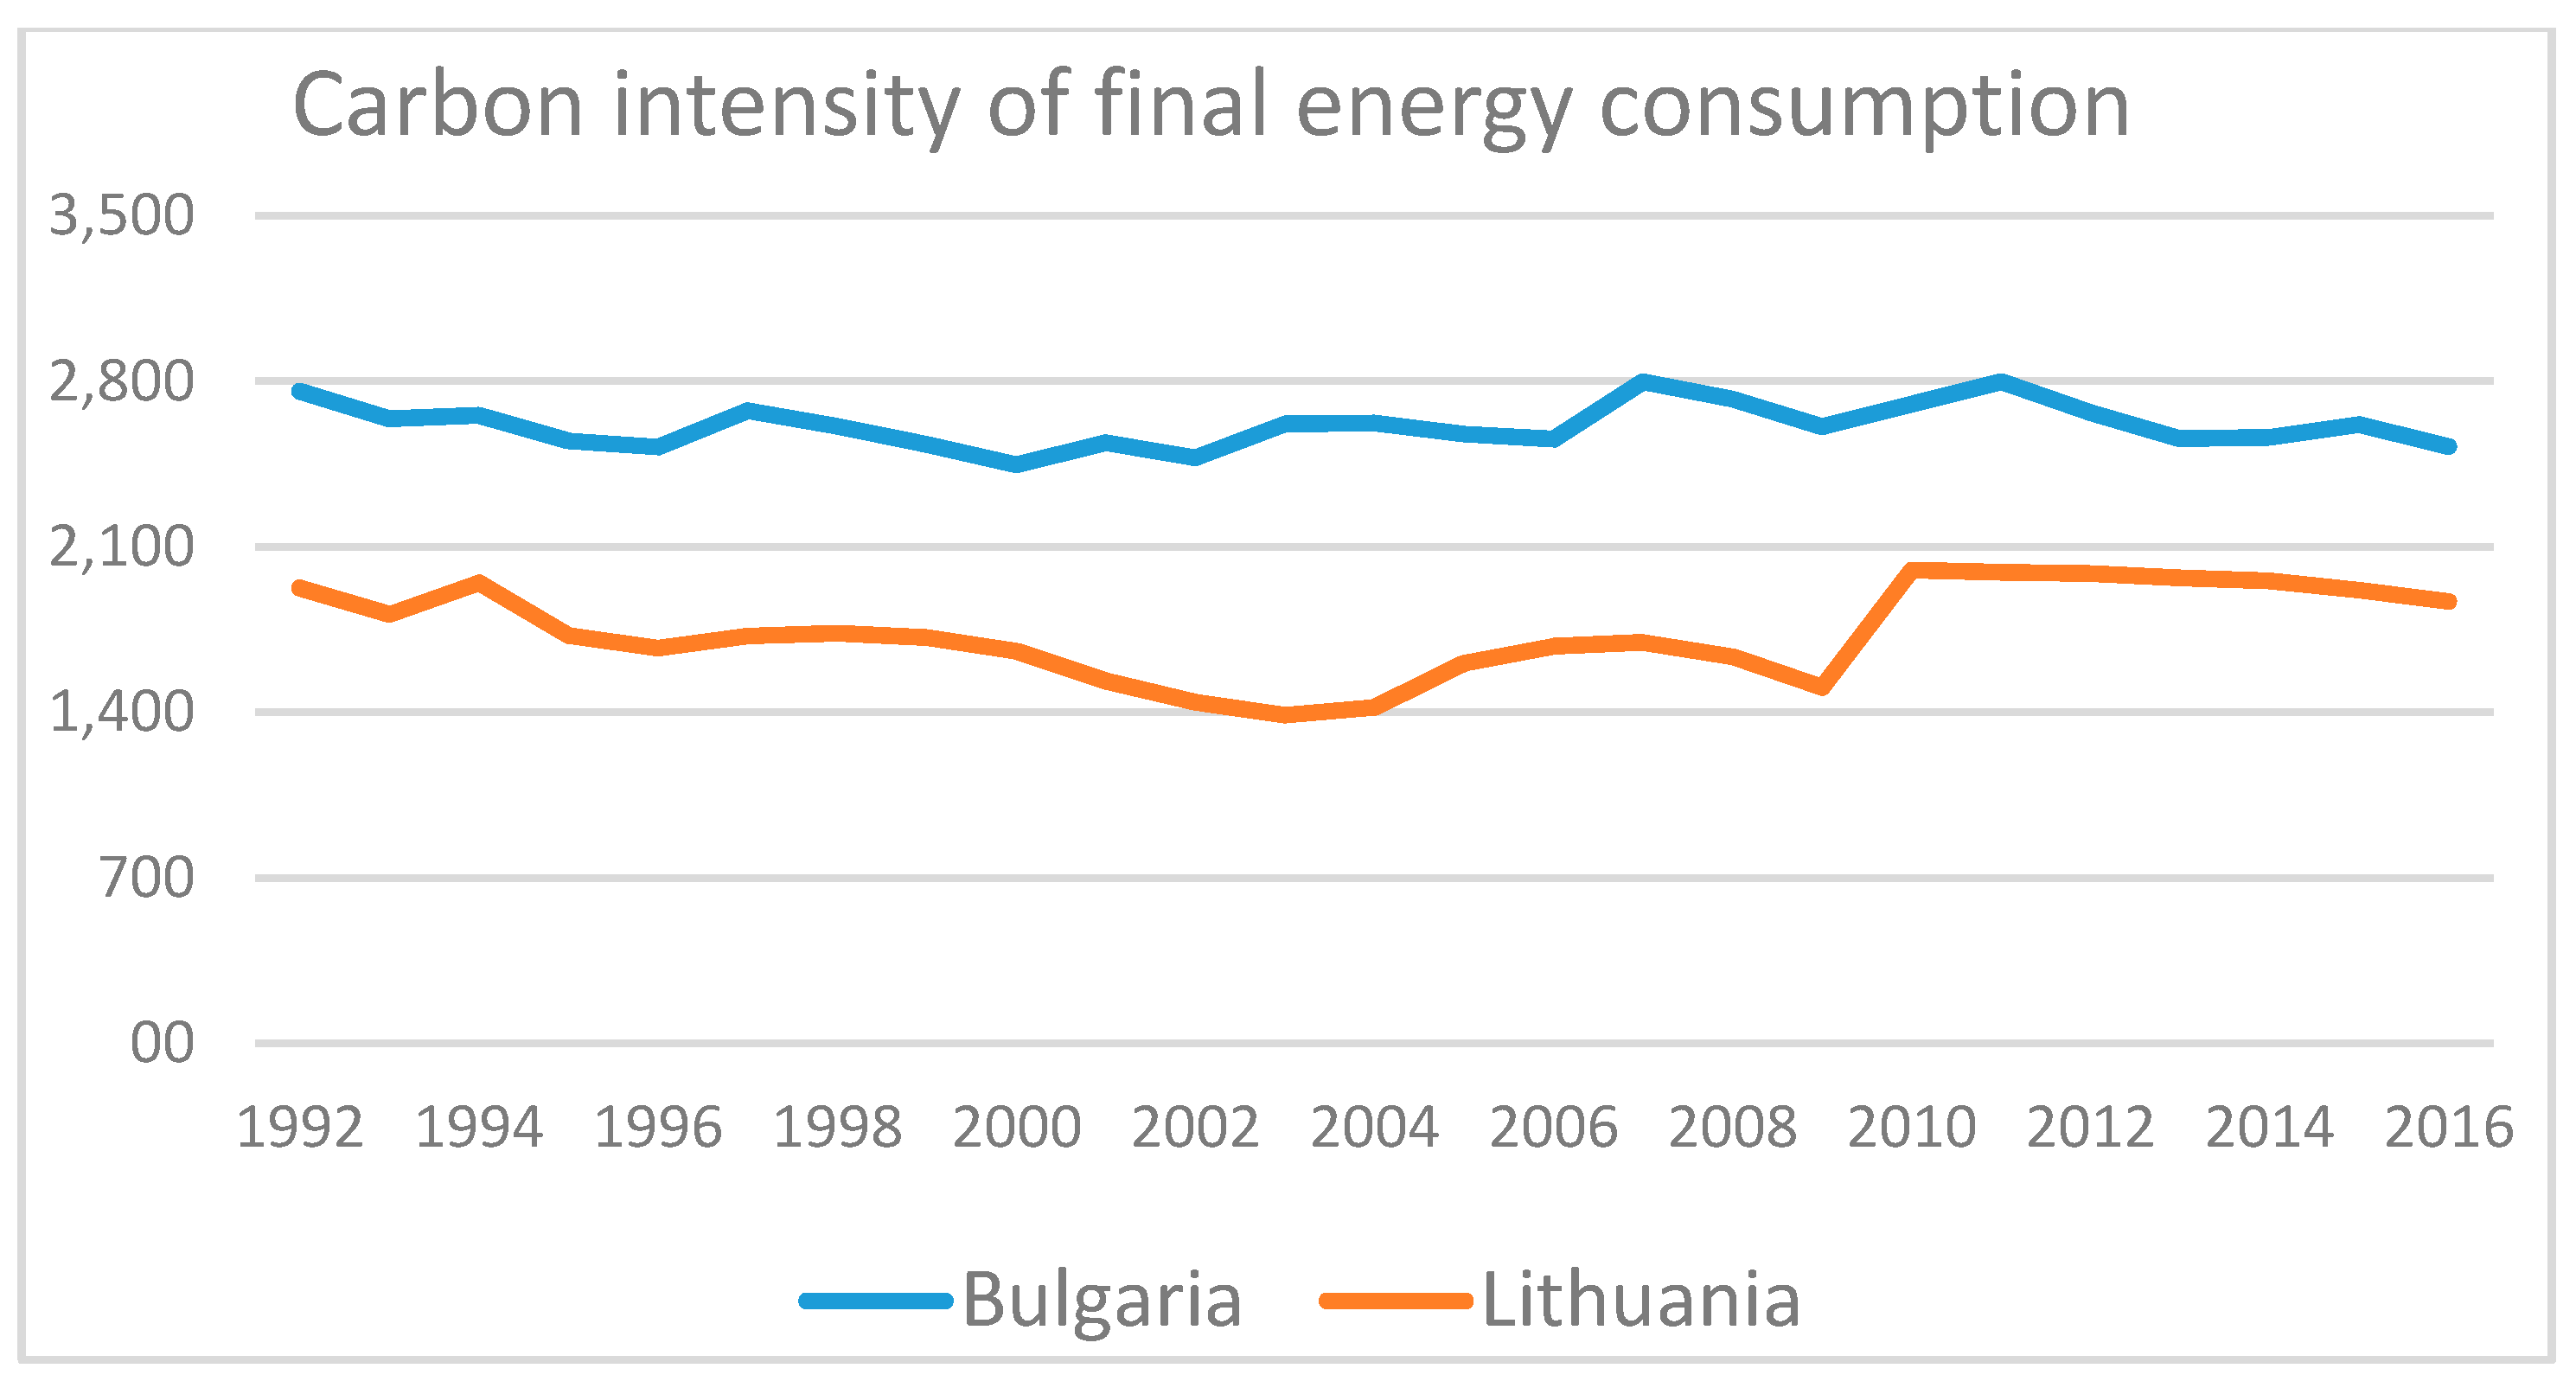
As one can see from
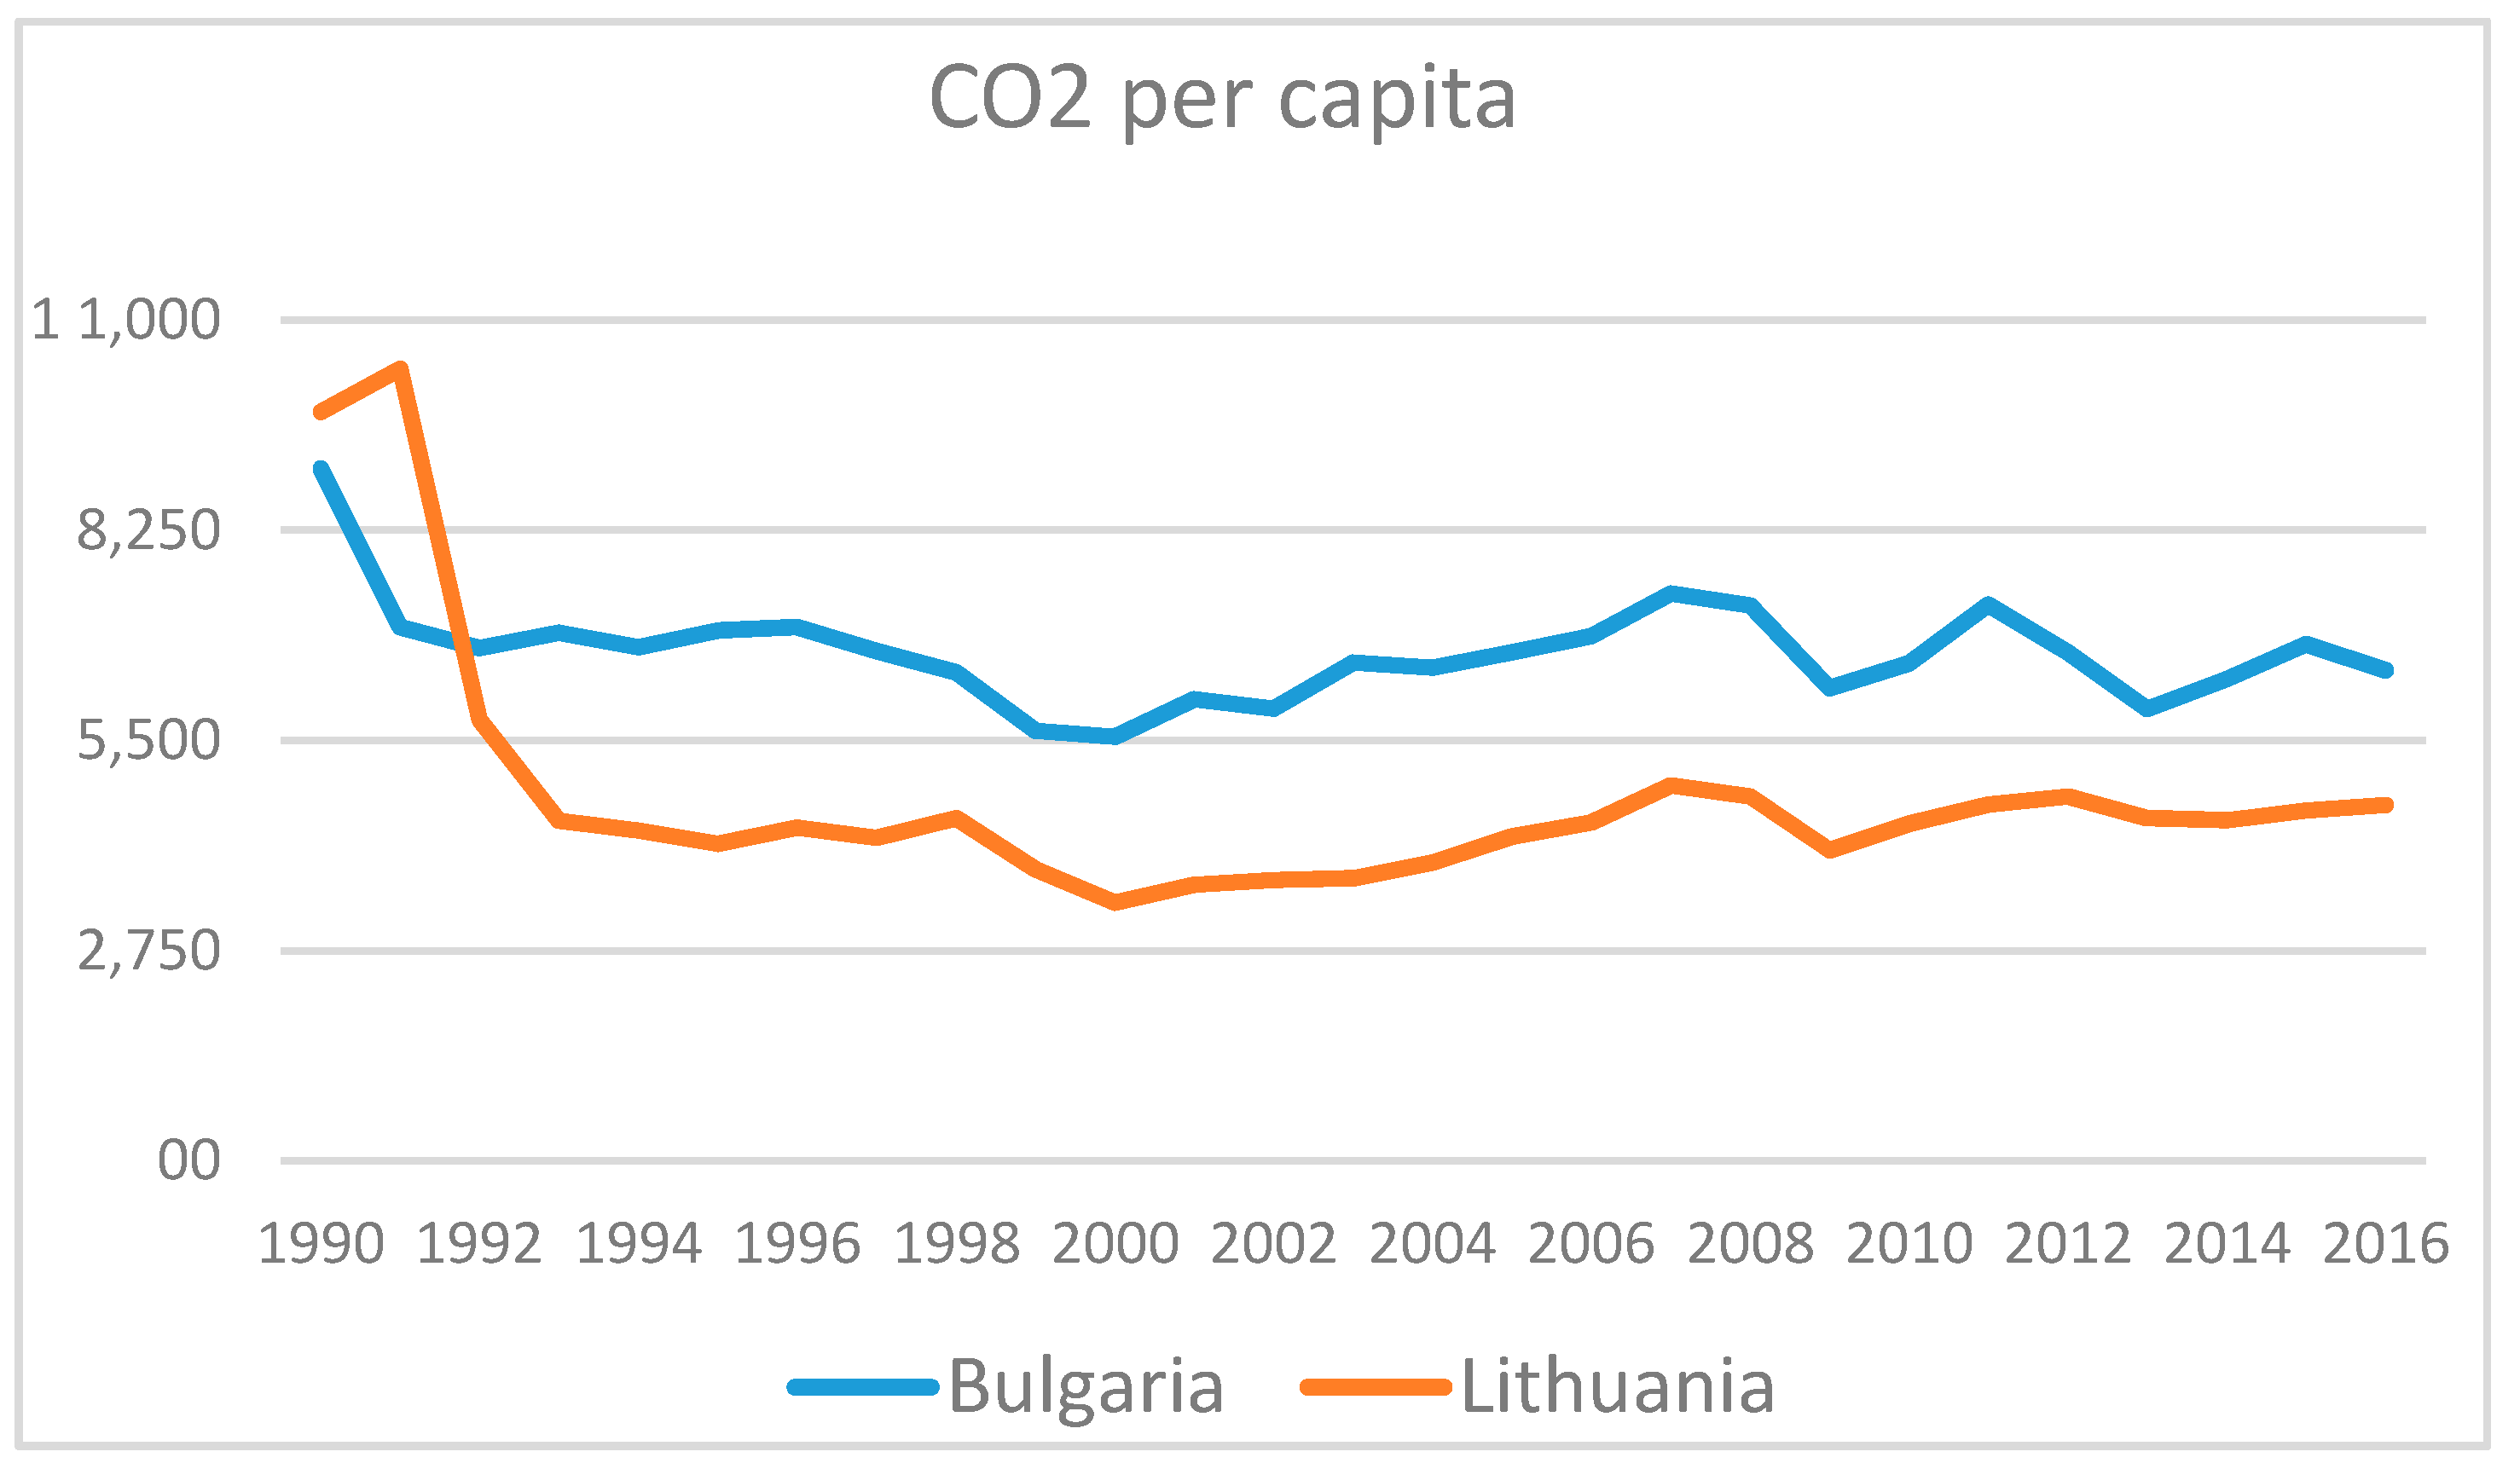
Figure 5,
Figure 6 and
Figure 7 the GHG emission profile of Lithuania and development trends are more favorable comparing with Bulgaria for achievement of GHG reduction commitments as Lithuania distinguishes with lower GHG/capita, lower GHG/final energy supply, and significantly lower GHG/GDP level comparing to Bulgaria.
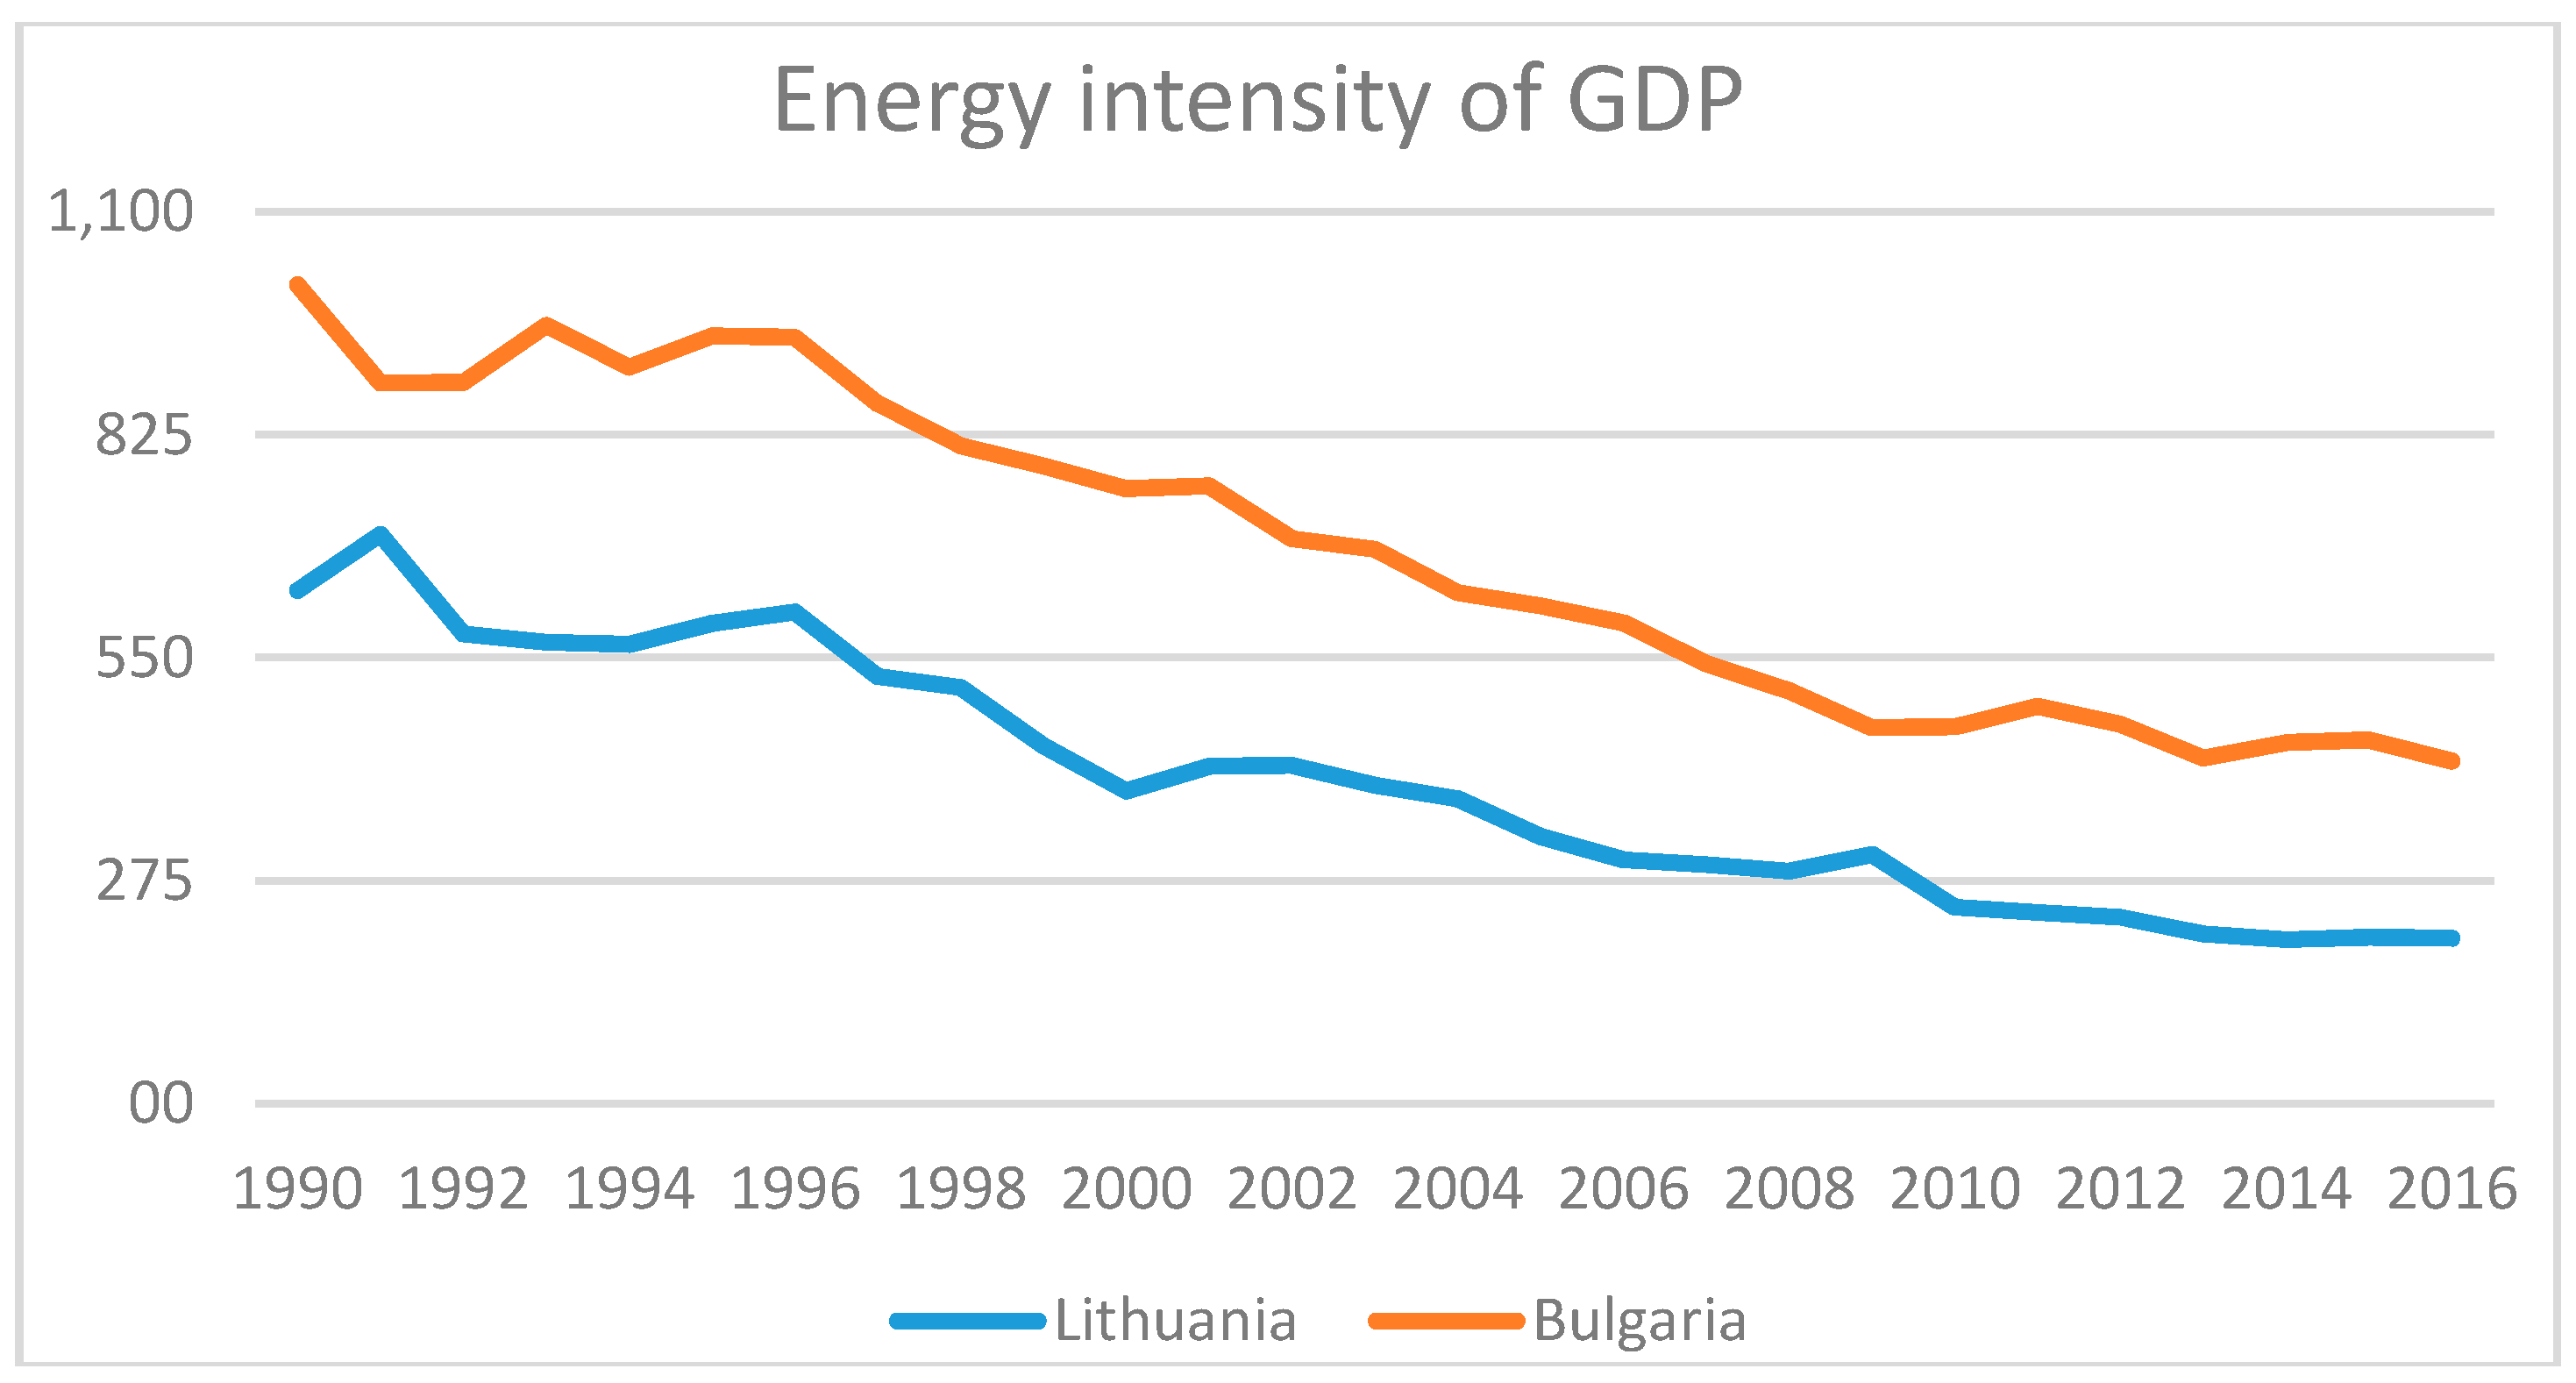
The energy intensity of GDP is a direct driving force of GHG emissions (
Figure 3), therefore trends of energy intensity of GDP of Lithuania and Bulgaria are presented in
Figure 8.
As one can see for
Figure 8 energy intensity of GDP even now is twice higher in Bulgaria though it has drastically declined (more than twice in Bulgaria) and almost three times in Lithuania since 1990. The decrease of energy intensity of GDP is main driving force for GHG emission reduction in both countries though its impact should be bigger in Lithuania.
Bulgaria has target 41% reduction of primary energy supply in 2020 as compared to 2005. Comparing primary energy intensity reduction with 2005 in 2016 one can noticed that in 2005 energy intensity was 614 toe/M€’10 and in 2016 it was more than 30% lower or 423 toe/M€’10. Lithuania also was on track in implementing energy saving target—740 toe of final energy savings (about 1.5% decrease of energy intensity) as final energy intensity in 2016 has decreased almost 40% comparing with year 2005 level.
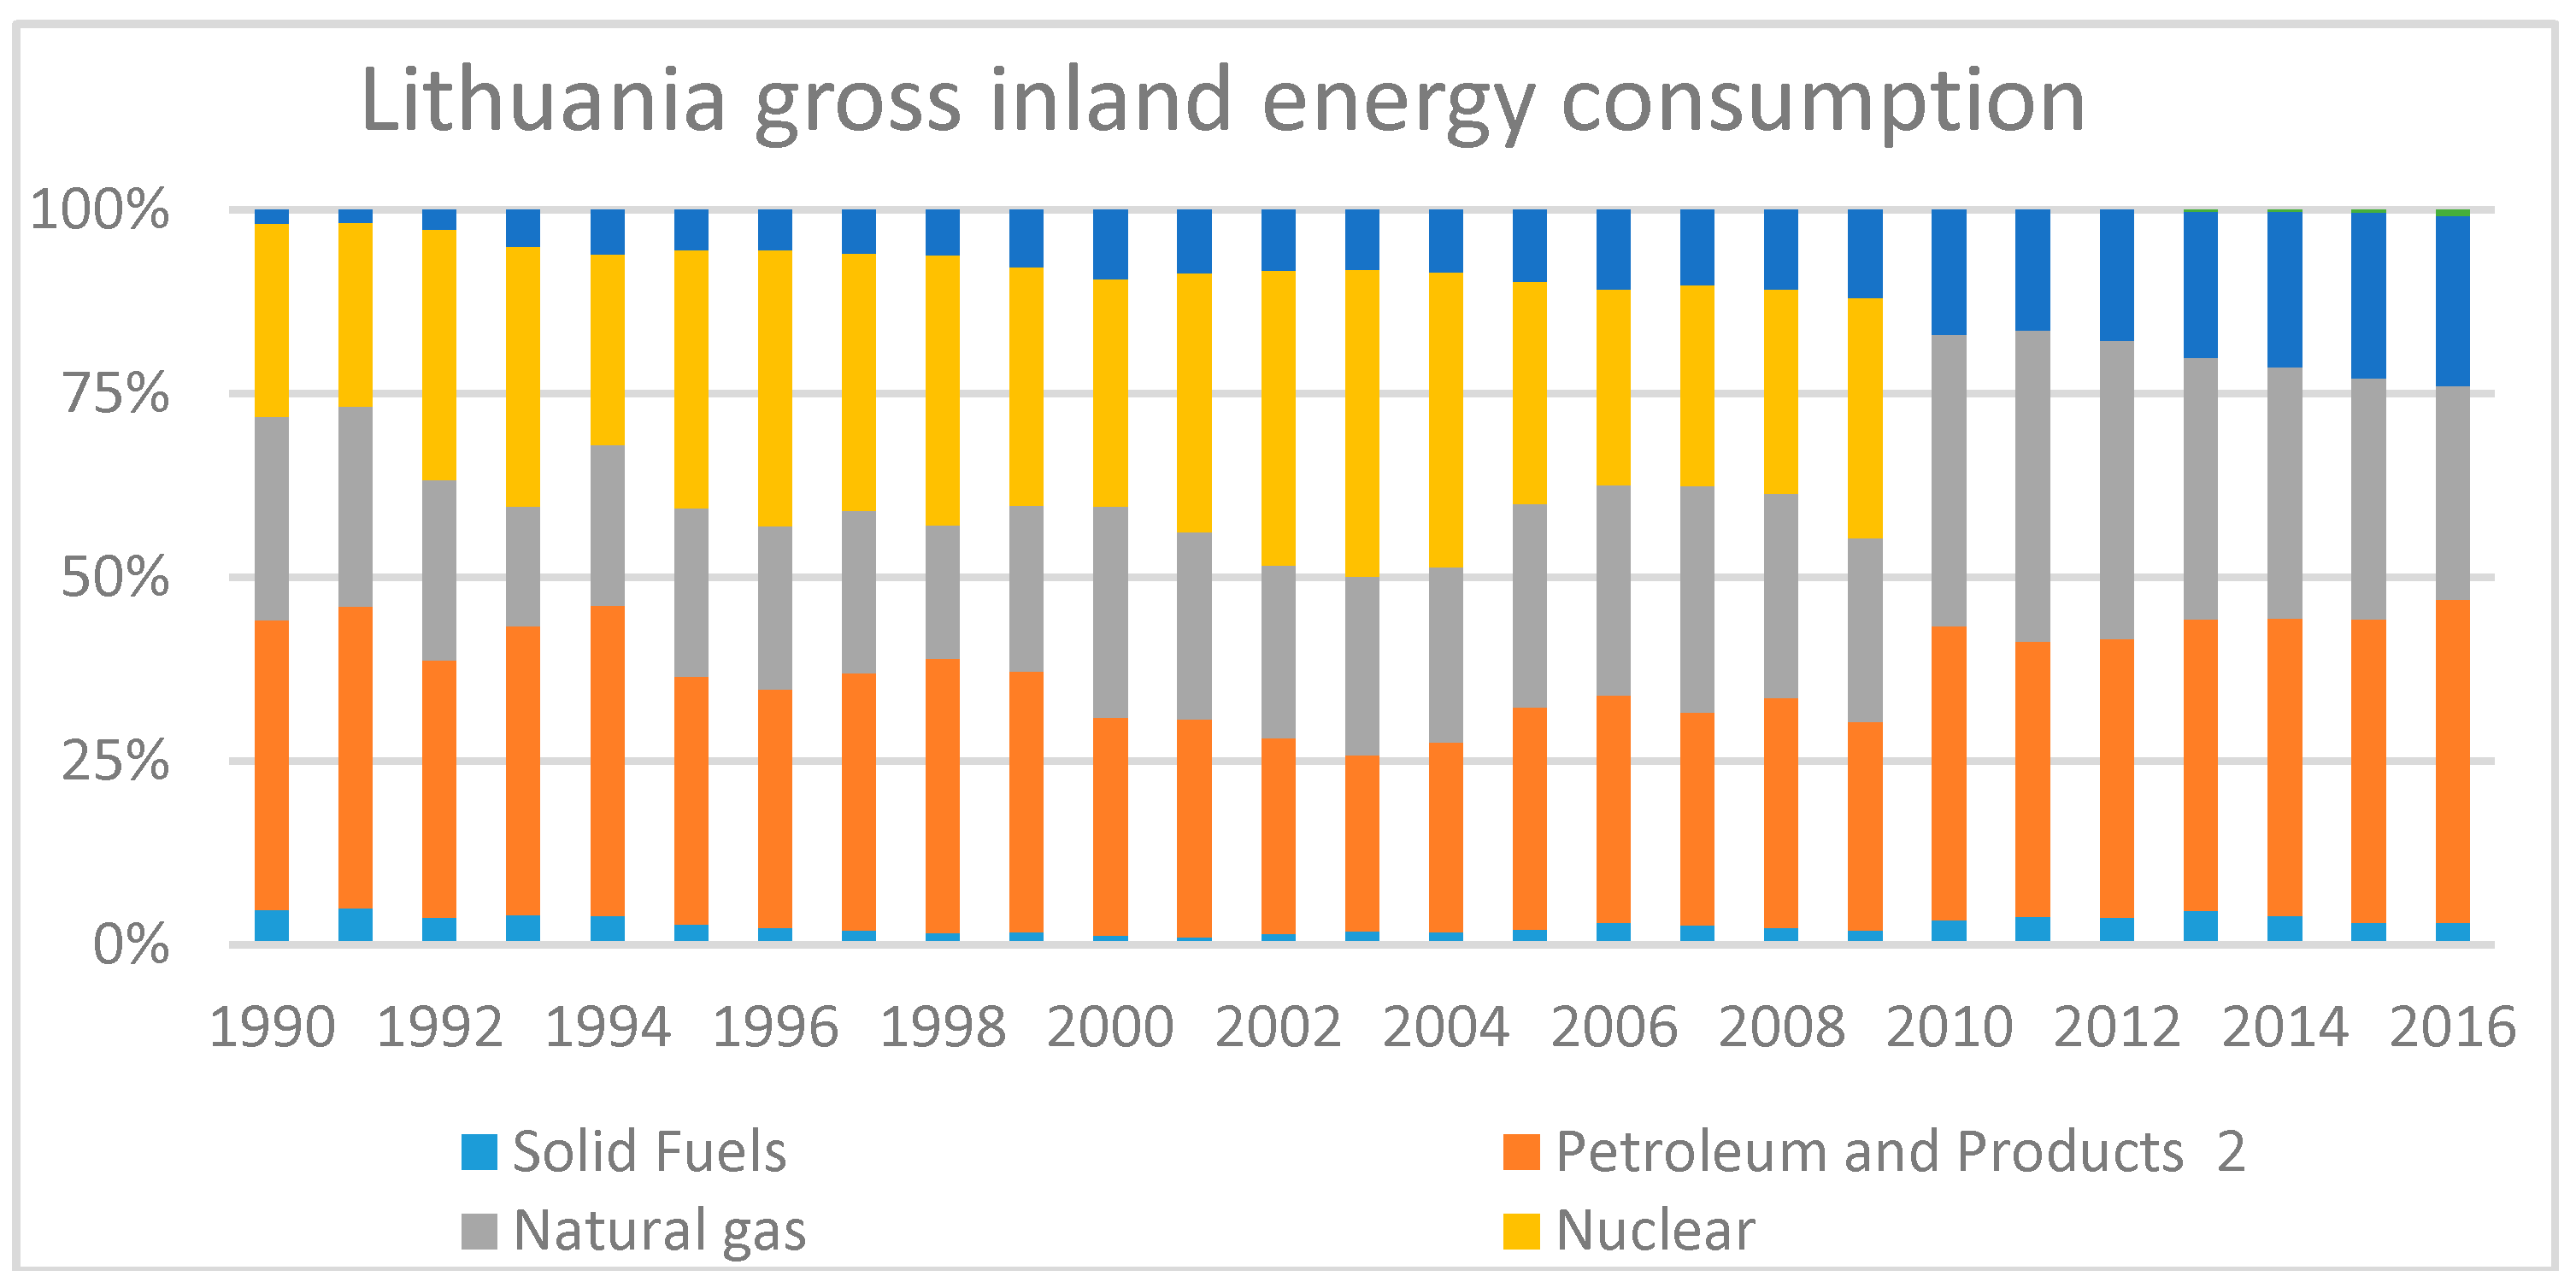
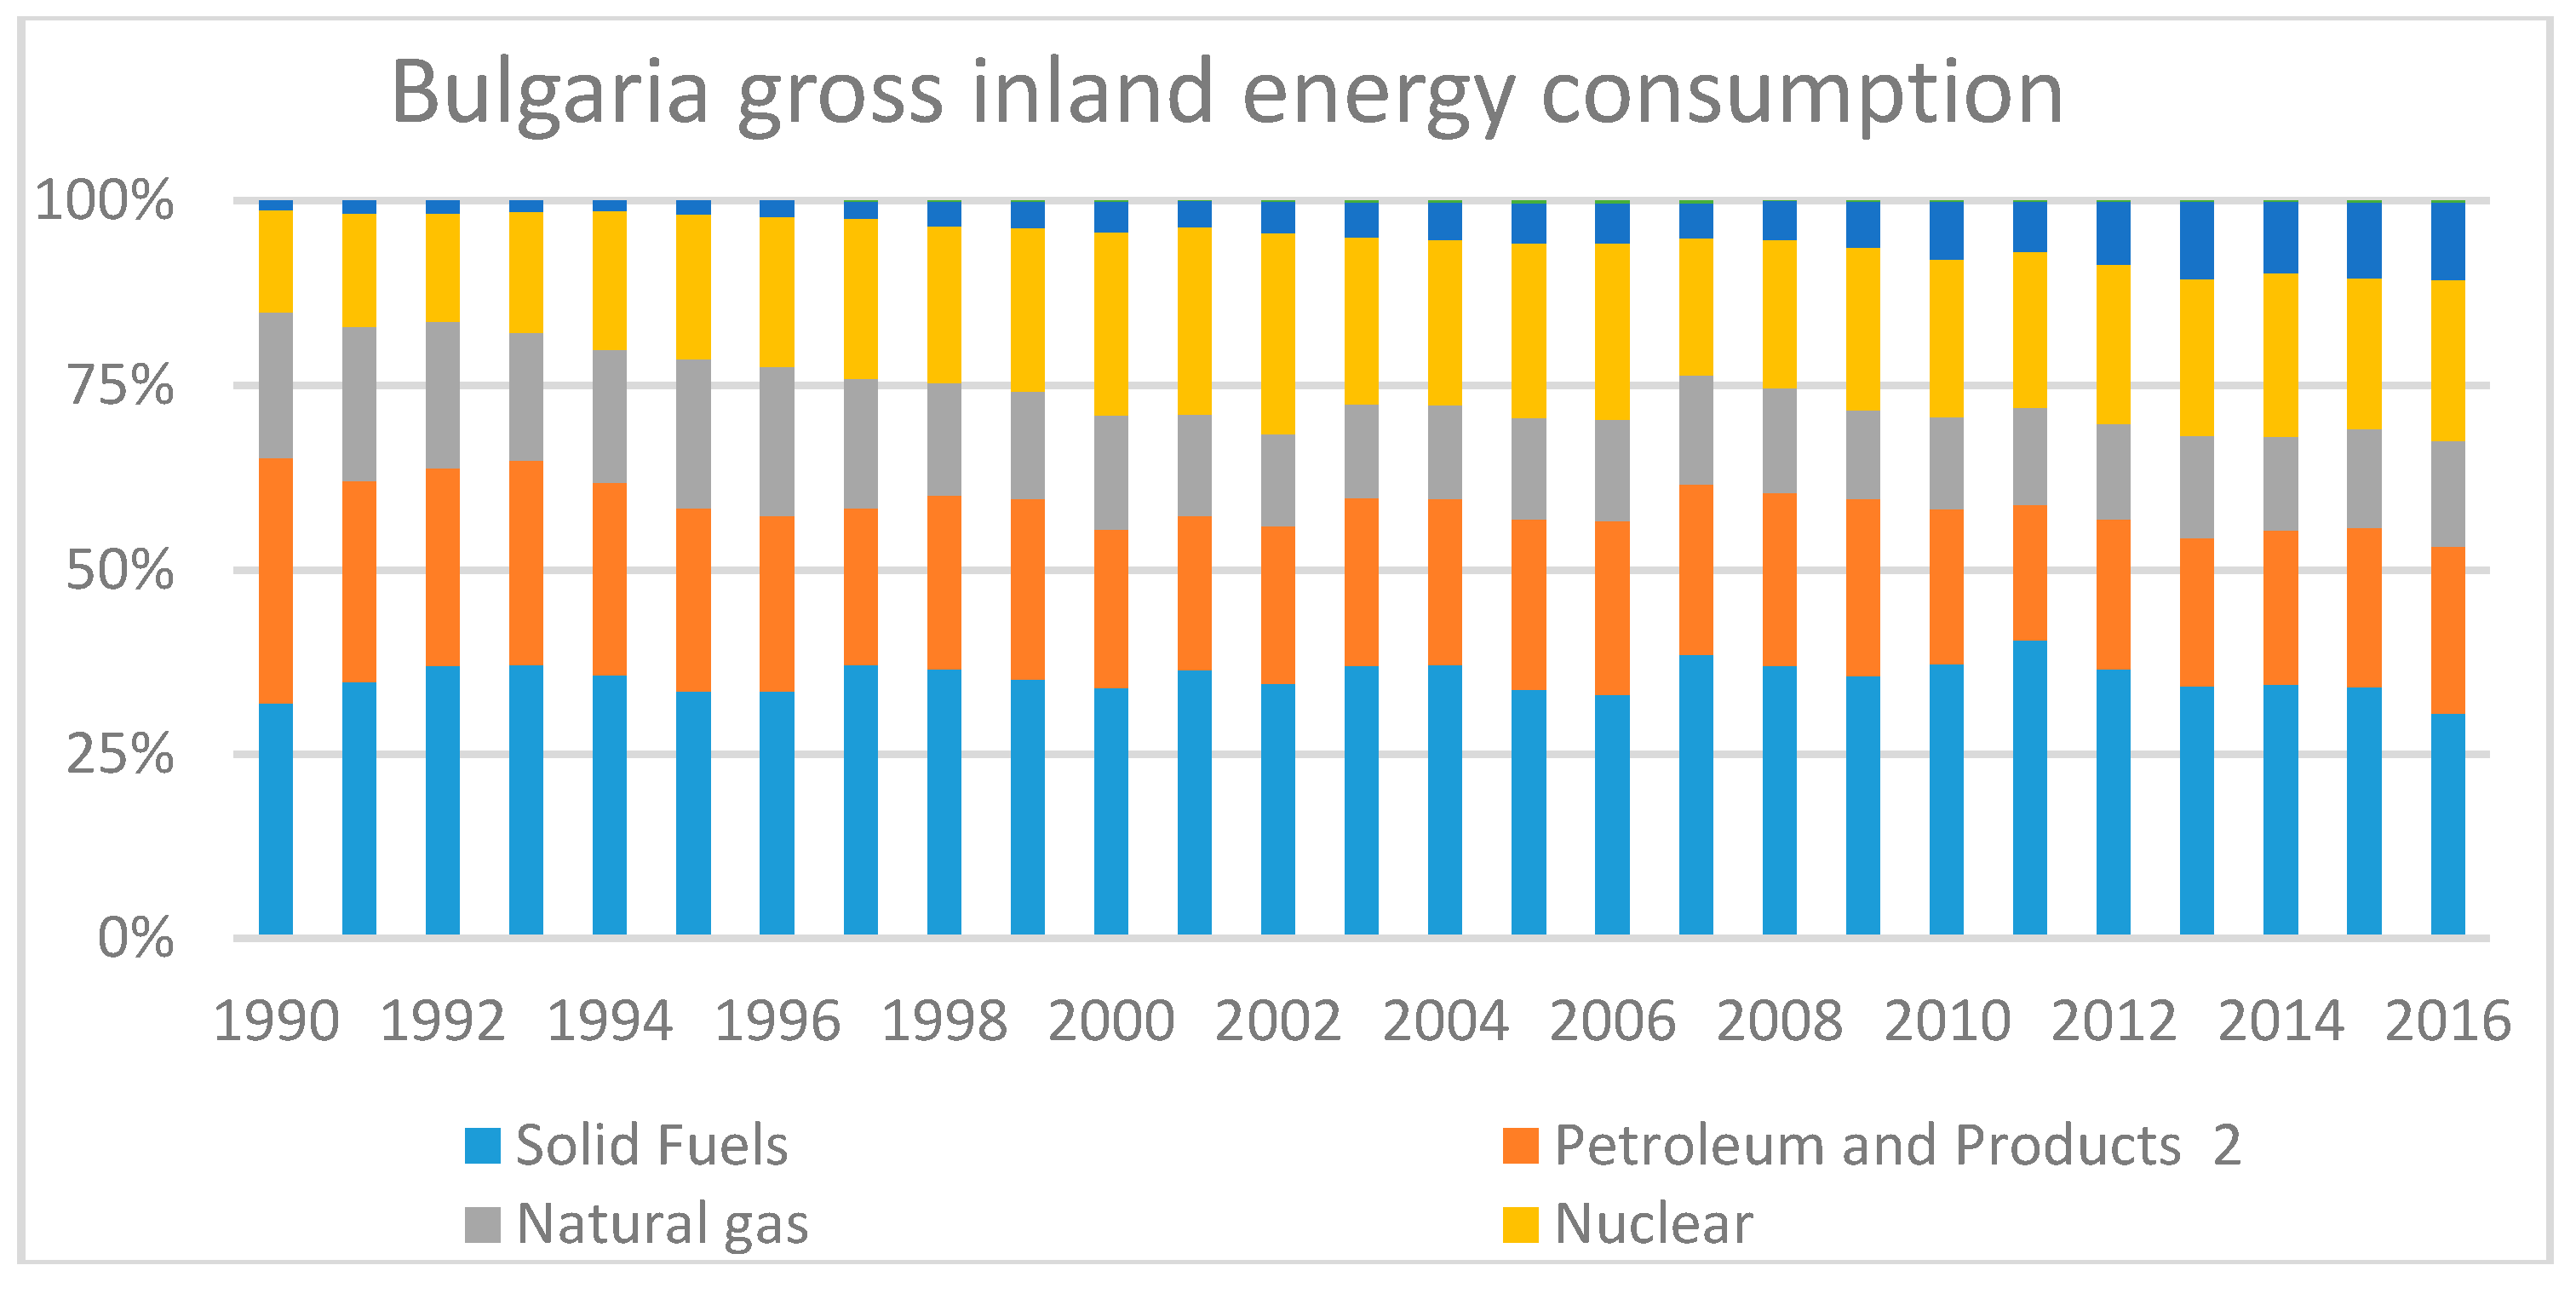
The gross inland energy supply and electricity generation mix and the shares of RES in final energy, electricity, heating and cooling, and transport are the most important indirect driving force indicators having impact on GHG per final energy supply and other GHG indicators. In
Figure 9 and
Figure 10 the gross inland energy consumption mix in Lithuania and Bulgaria is presented for 1990–2016 period.
As one can see from
Figure 9 and
Figure 10 Bulgaria distinguishes with high share of solid fuels, nuclear, and petroleum fuels for transport in gross inland energy consumption mix and Lithuania with high share of renewables and natural gas and petroleum fuels used in transport. The gross inland energy consumption structure more favorable for GHG emission profile is in Lithuania though there is positive trends in greening primary energy supply structure in Bulgaria as well as the increase in the share of renewables can be track during all investigated period.
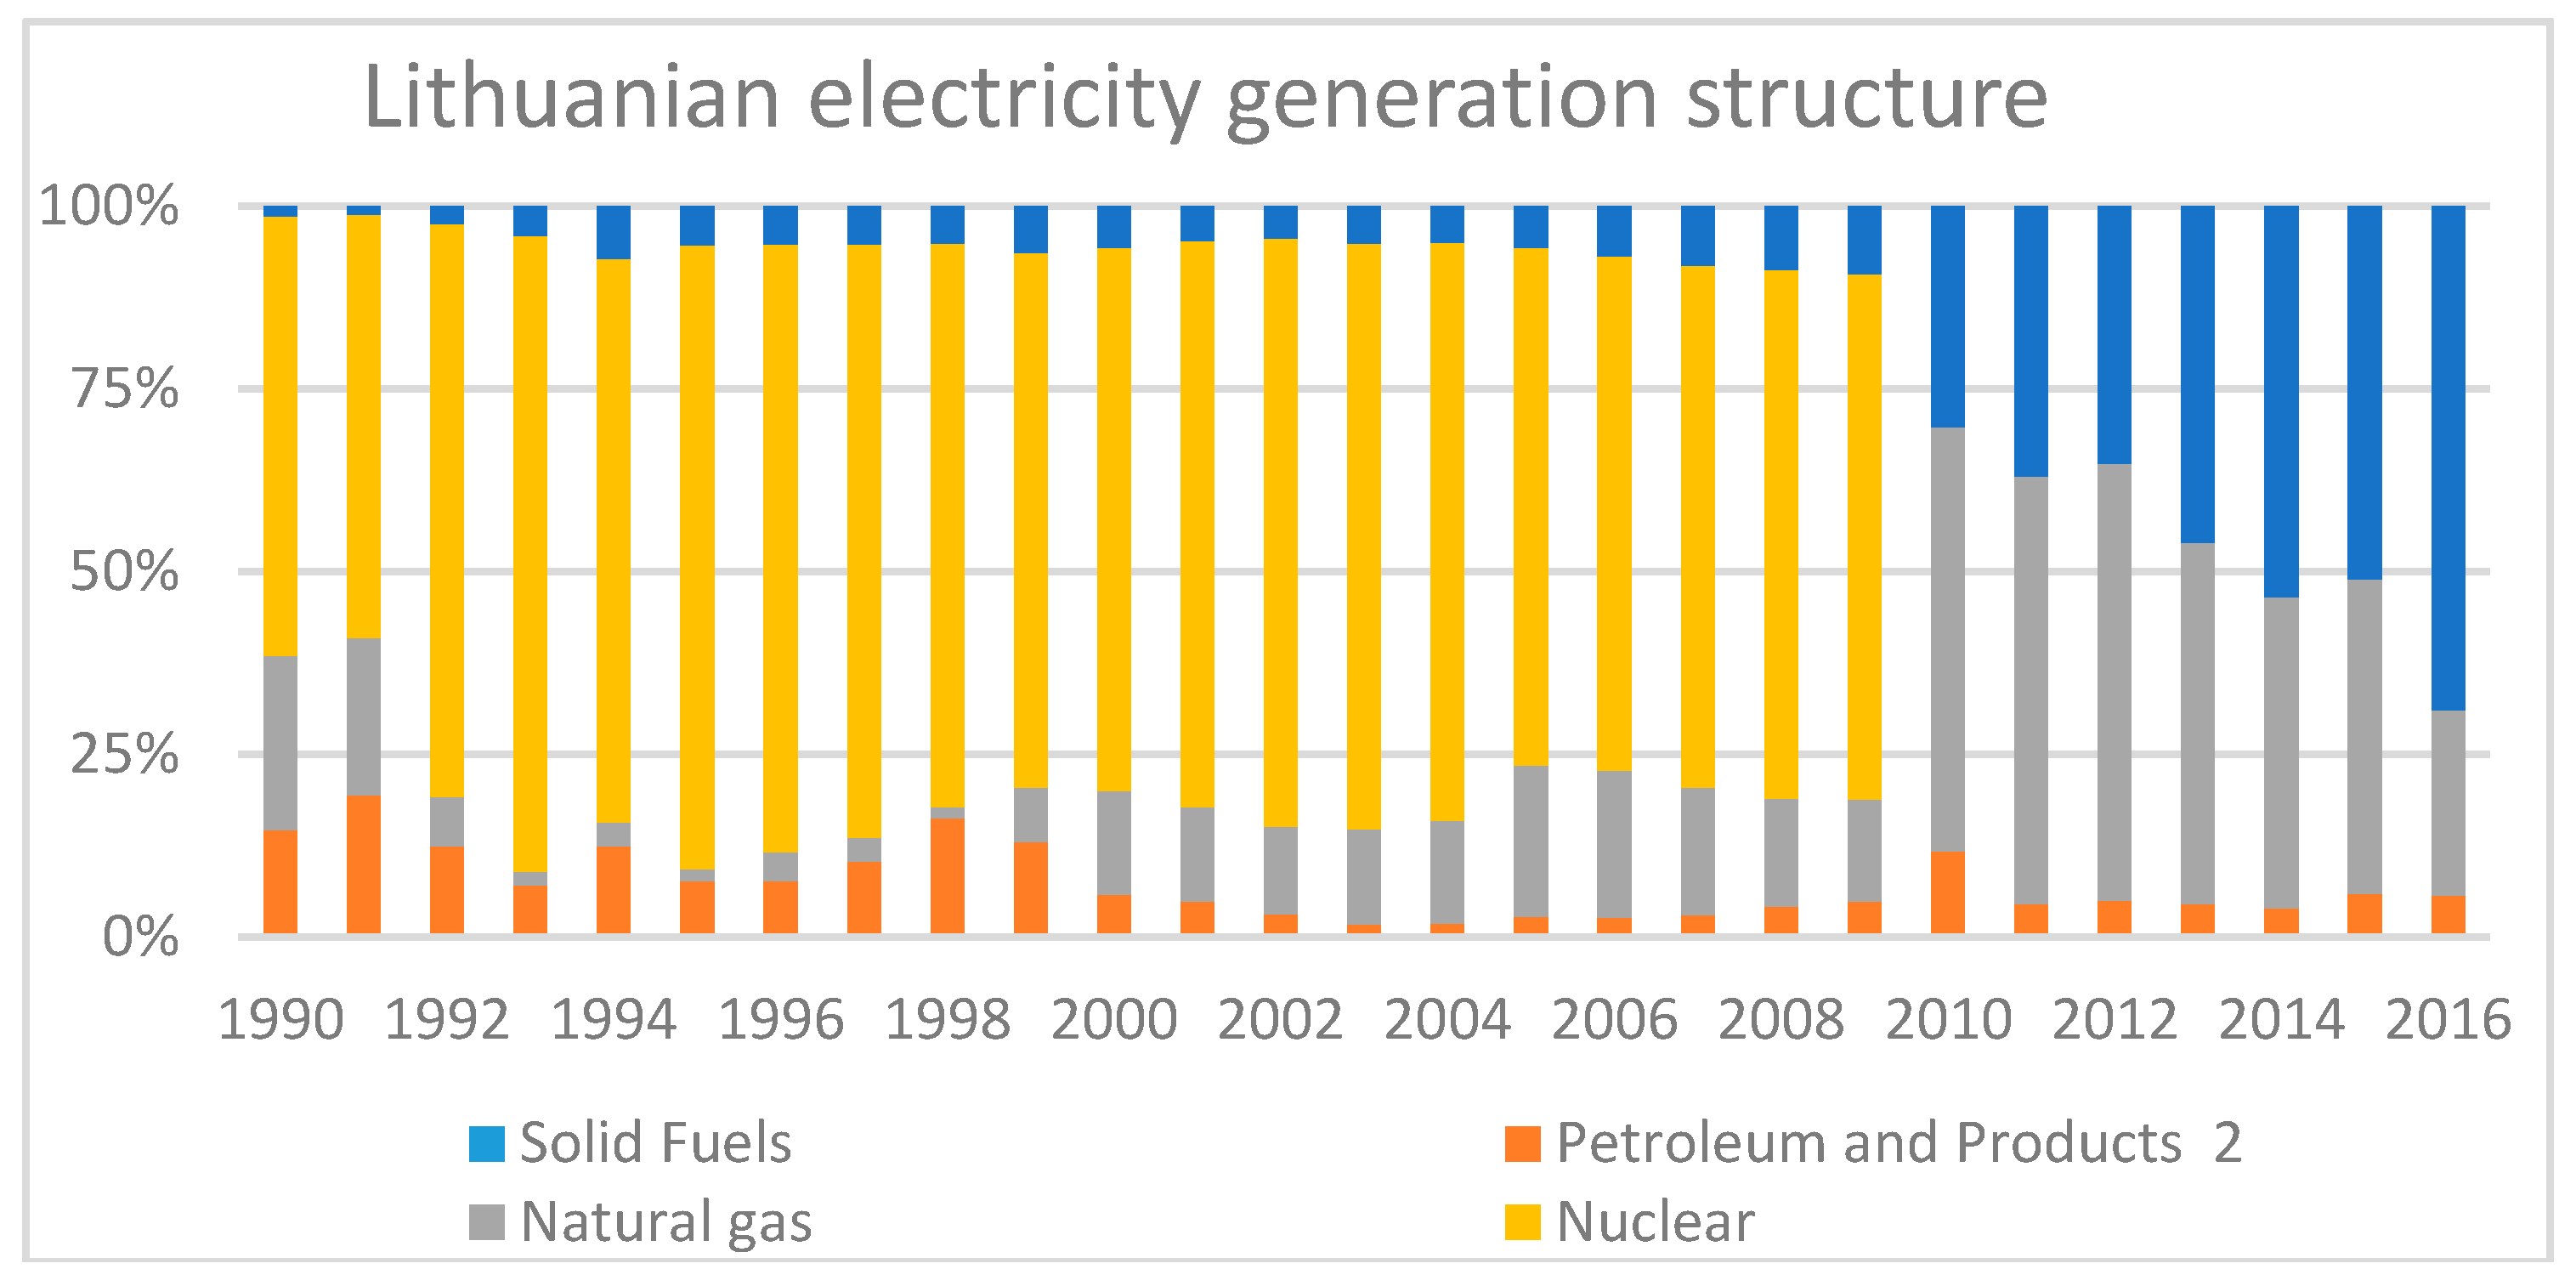
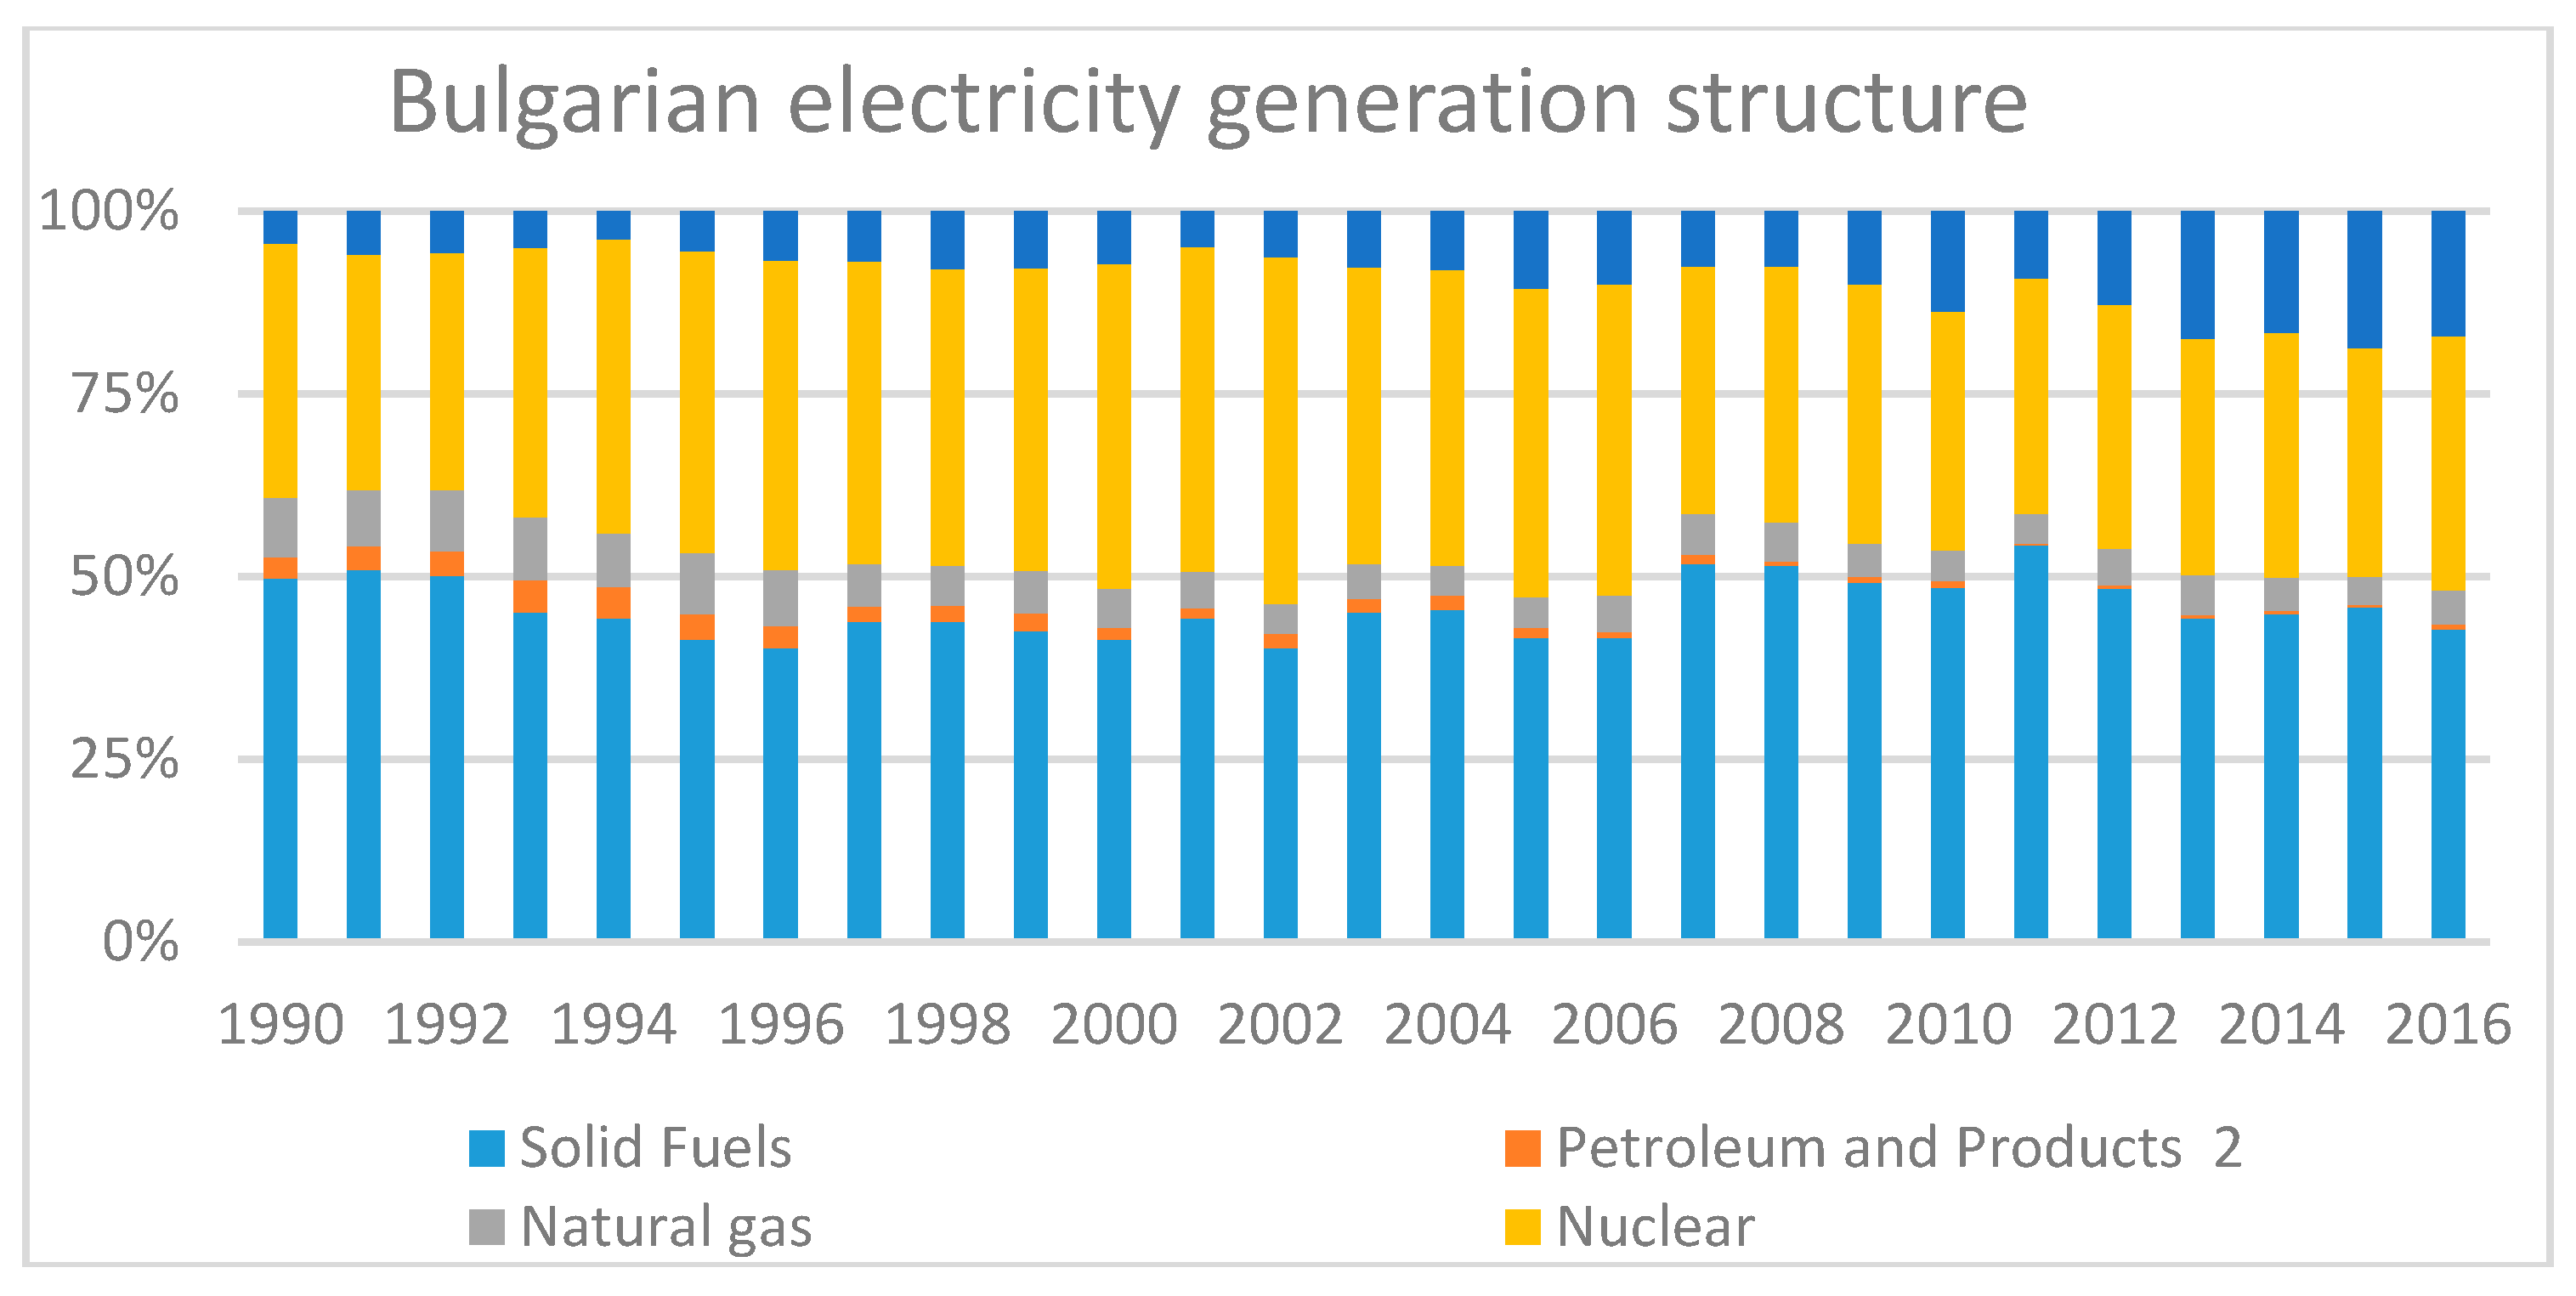
In
Figure 11 and
Figure 12 electricity generation mix dynamics in Lithuania and Bulgaria are presented.
As one can from
Figure 11 and
Figure 12 the electricity generation structure in Lithuania is dominating by renewables and natural gas and in Bulgaria by nuclear and solid fuels, i.e., coal. This difference in electricity generation structure has direct impact on GHG emission profiles putting Lithuania in more advanced position. As one can see from
Figure 11 during 1990–2009 period in Lithuania the electricity generation structure was dominated by nuclear but Ignalina NPP was closed in 2009 due to safety requirements by EU institutions.
In
Table 3 the dynamic of the share of renewables in final energy consumption, in electricity, in heating and cooling and transport is provided for Lithuania and Bulgaria.
As one can see from
Table 3 in both countries the share of RES was increasing since 2004. In 2004 the share of RES in final energy supply in Lithuania was already twice higher than in Bulgaria and though the share of RES has almost doubled in Bulgaria during investigated period the country still has lower share of RES in final energy consumption though all countries have implemented EU requirements for RES se by Energy and Climate package.
In Lithuania at 2016, the share of renewable sources in gross final energy consumption was 26% and was higher than the indicative target for 2020 (23%). The three main technologies contributing to renewable energy use in Lithuania in 2016 were solid biomass for heat (86%), hydropower (4%), and onshore wind (4%).
In Bulgaria in 2016, the share of renewable sources in gross final energy consumption was 19%, which is also higher than the indicative target for 2020 (16%). The three main technologies contributing to renewable energy use in 2016 were solid biomass for heat (66%), hydropower (25%), and onshore wind (5%).
As one can noticed from
Table 3 countries almost reached the same level of RES in electricity generation but Lithuania has higher share in cooling and heating however Bulgaria has higher in transport.
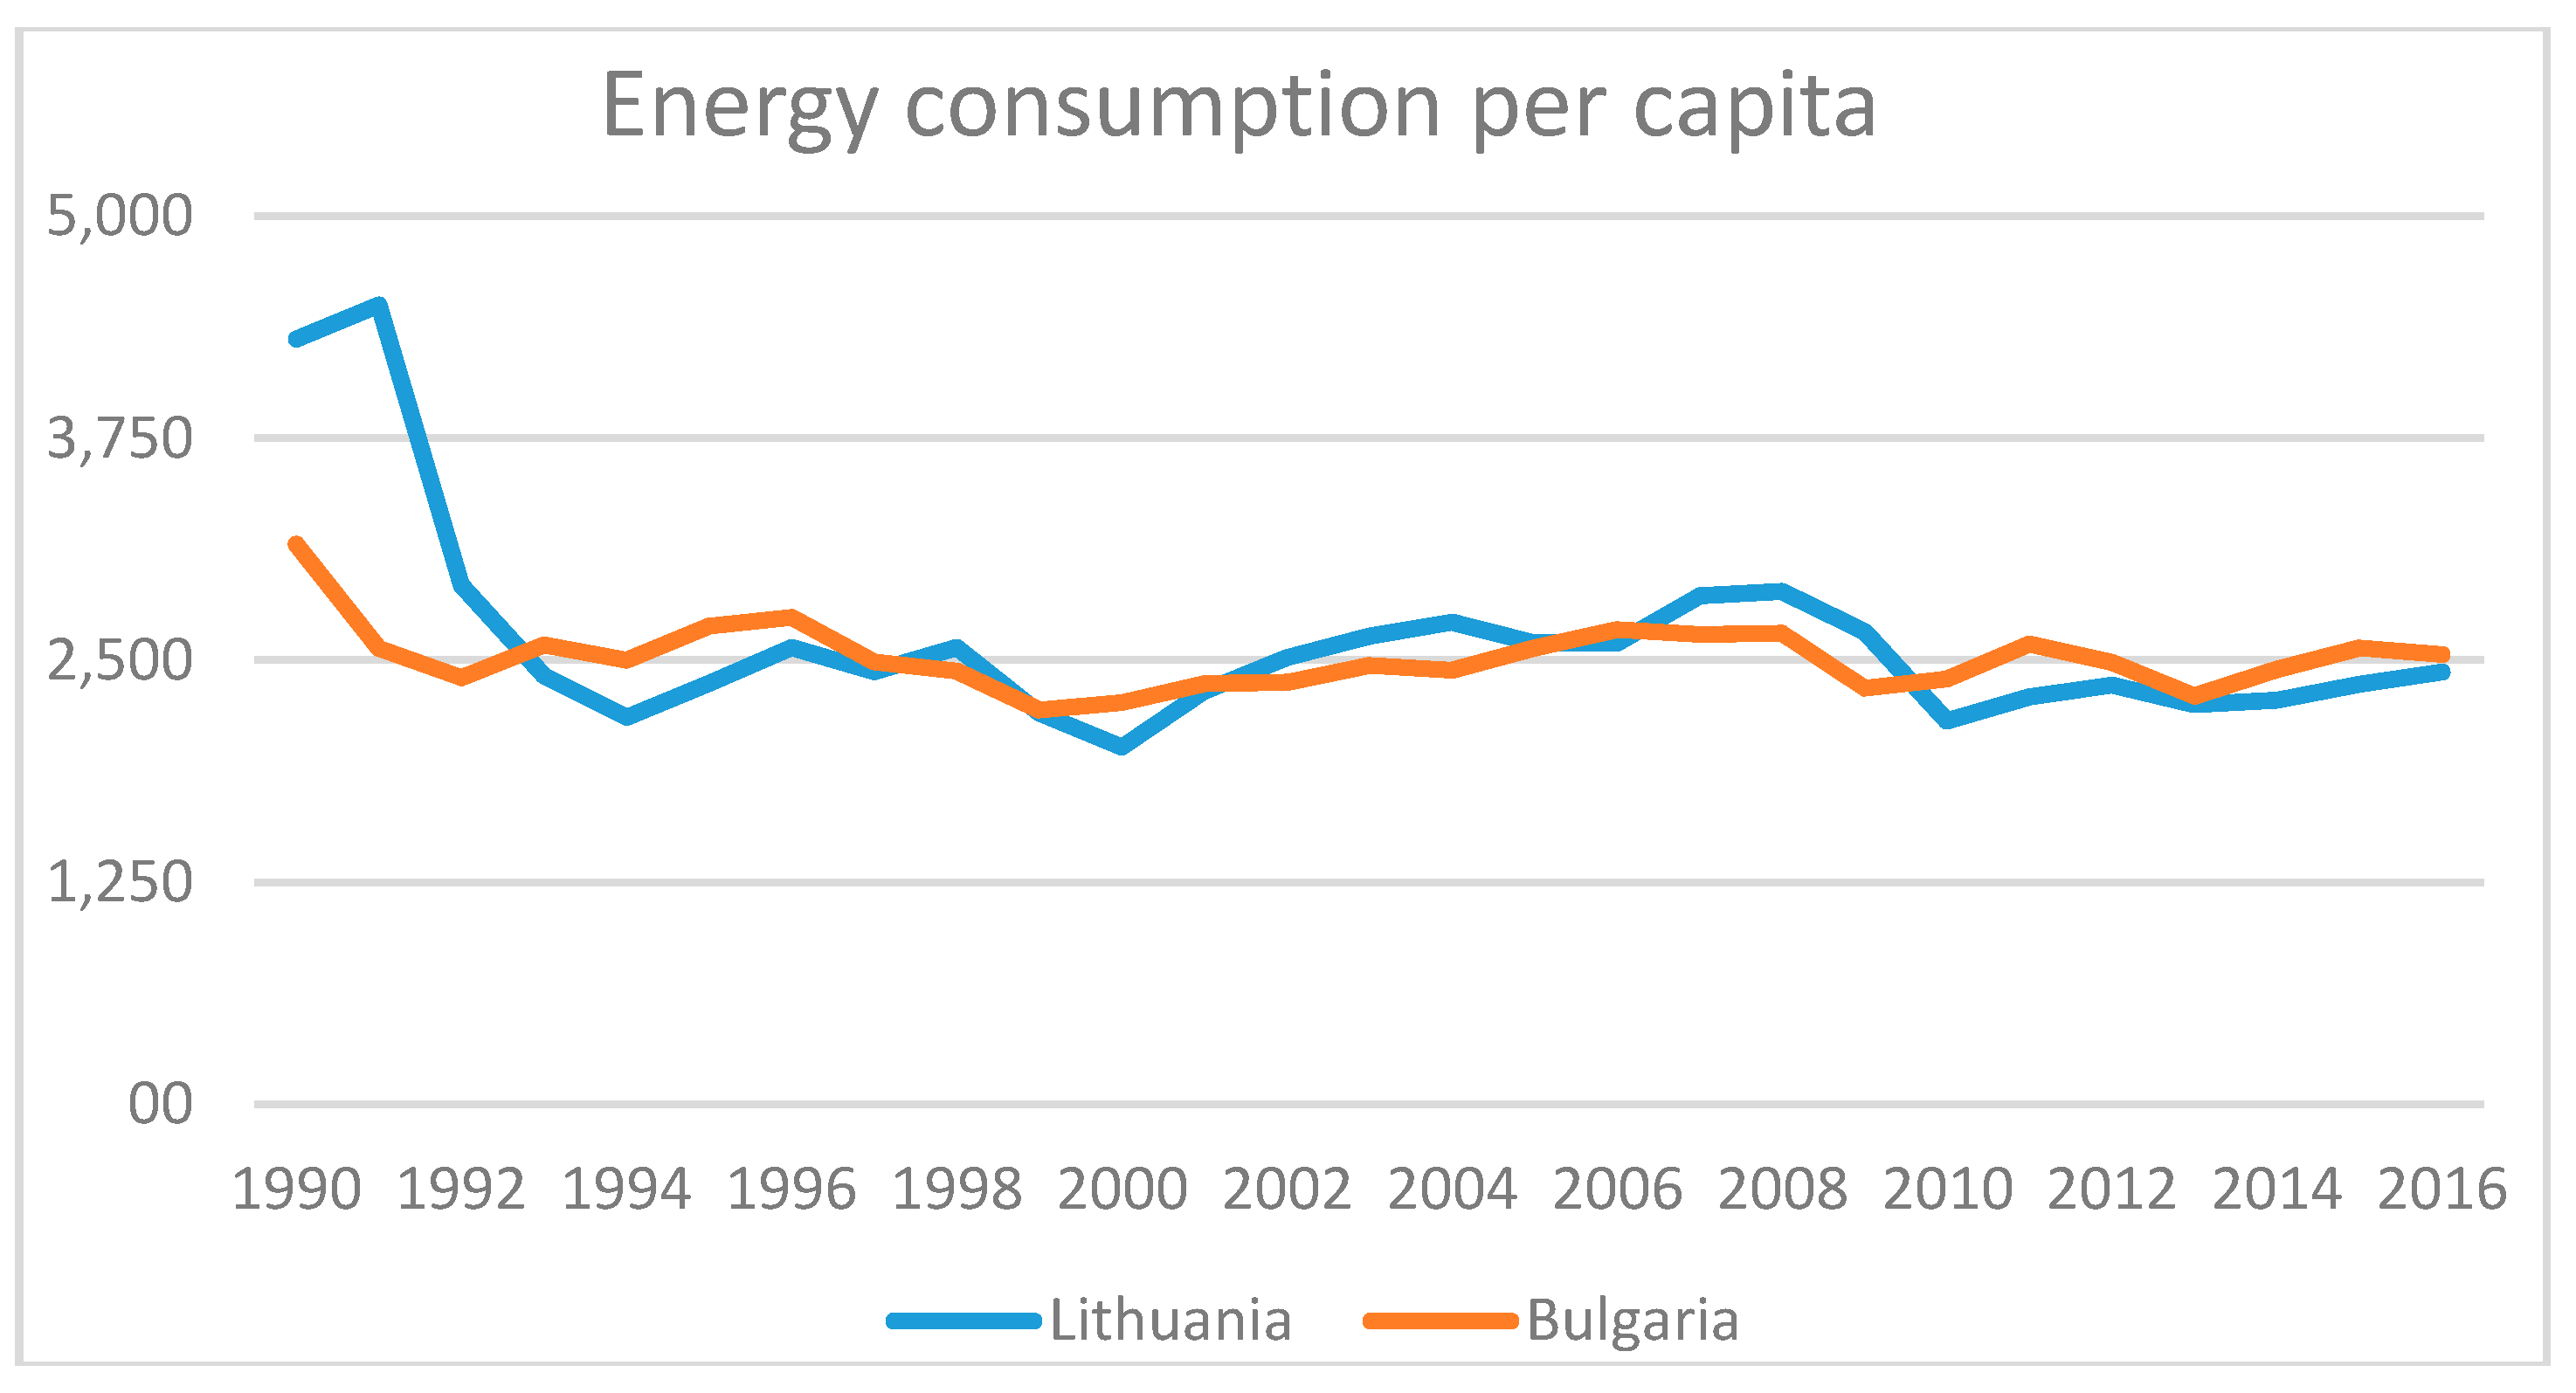
Energy consumption per capita and GDP per capita are indirect driving force indicators having impact on GHG emission trends. The trends of energy consumption per capita are given in
Figure 13 for Lithuania and Bulgaria.
As one can see from
Figure 13 energy consumption per capita level in 2016 in both countries was very similar though in 1990 energy consumption per capita was significantly higher in Lithuania.
Comparing countries based on GDP/capita Lithuania distinguishes with higher GDP/capita. In 2016 Bulgaria has 6011 EUR/capita and Lithuania 12115 EUR/capita level at 2010 exchange rate.
Review of GHG emission profiles and their driving forces indicated that Bulgaria has higher GHG emissions from the energy sector, achieved lower GHG emission reduction in this sector and in total GHG emissions during investigated period. Bulgaria has higher GHG per capita, GHG/GDP and GHG/primary energy supply indicators than Lithuania mainly due to higher energy intensity of GDP, lower share of RES in final energy consumption, and lower GDP/capita level.
The main policies or response actions on targeted indicators in the energy sector will be reviewed in the following section trying to reveal the effectiveness of implemented climate change mitigation policies in the energy sector.
4. Review of GHG Mitigation Policies in Lithuania and Bulgaria
The implementation of the climate change policy in the Republics of Lithuania and Bulgaria is based on the general provisions of the European Union’s climate change policy. Both countries have implemented required policies to promote energy efficiency and renewable and GHG emissions reduction imposed by EU Energy and Climate and were on track for reaching their 2020 targets as has been indicated by review of their GHG profiles and their driving forces.
The comparison of quantified economy-wide emission reduction targets for 2020 between Lithuania and Bulgaria is given in
Table 4.
Both sides of the Ministry of the Environment (LT and BG) are directly responsible for the implementation of climate change policy measures and for the further development of this policy. Since 2000, an integrated and sophisticated strategic and operational planning system has been developed, which is further developed in line with international commitments set by the Kyoto Protocol or EU policies and legislation.
Lithuania’s and Bulgaria’s climate policy is defined in government programs, legal acts, and national strategies for climate change management [
41].
After Bulgaria joined the European Union (EU) on 1 January 2007 the context of climate policy in the country changed considerably because apart from the international commitments under the UN Framework Convention on Climate Change (UNFCCC) and the Kyoto Protocol (KP) it is now aligned with the existing and newly adopted European legislation in this area. Over the period 2008–2012 the national climate change policy and legislation were harmonized with those of the EU and the National Action Plan on Climate Change (NAPCC) has not been updated during that process [
41].
In both countries, the Ministry of Environment, which draws up strategic documents and coordinates the implementation of programs, devotes the most attention to the solution of the problems of climate change and the envisaged goals [
42,
43]. Countries have quite similar policies for climate change mitigation in the energy sector however the coverage and scope of implemented policy instruments is varying among countries due to to differences identified in
Figure 1.
The main energy policy targets in the the energy sector of Lithuania in order to reduce carbon dioxide emissions are mainly linked to energy efficiency improvements and increase use of renewables [
42]:
Increase in energy efficiency during 2020–2030 by 1.3% per annum.
Increase the share of renewables in the final energy and ban of import of polluting fuels. In 2016 Lithuania 25.46% of its gross final energy was generated by renewables and country has already over reached its renewables targets set for 2020 in 2015;
Rehabilitation of the biggest power plants (Vilnius CHP and Kaunas CHP) by introducing biomass combustion;
Increasing the share of renewables to 20% in total electricity energy consumption until 2020. In 2015, the share for renewables was 25.8% and Lithuania has over reached its target;
Increasing the share of of renewables in district heat supply to 60% by 2020. In 2015 the share of renewables in district heat supply was above the target in Lithuania.
Promotion of the use of renewable energy sources and energy efficiency in industry through energy efficiency measures and reducing energy consumption in the industrial sector.
Increase the share of renewable energy sources used for heating in households by at least 80% in the thermal energy balance.
Implementation of voluntary agreements with energy companies to promote energy efficiency.
Promotion of modernization of multi-apartment buildings and reducing the heat consumption in multi-apartment and public buildings by 30–40% by 2020;
Promotion of modernization of public buildings (700,000 m2) by 2020 and saving 60 GWh of annual primary energy.
The main local climate change mitigation policy instruments applied in Lithuania in order to achieve the targets identified above are feed-in-prices for renewables and financing of renewable energy and energy efficiency measures from EU structural funds and several national funds, tax allowance for use of biofuels etc. There are specific policies to promote RES and energy efficiency improvements targeting just electricity, heating and cooling, buildings and transport sectors which are provided further in details. Lithuania is also participating in EU GHG emission trading scheme and this flexible climate change mitigation instrument has impact on penetration of renewables and energy efficiency improvements. As one can see from
Table 4 Lithuania has obligations to mitigate GHG emission growth from sectors covered by the ESD and and not covered.
In Lithuania all renewable technologies are eligible for feed-in-tariffs. Also solar, wind and biomass power installations operated by individuals (≤10 kW) and legal persons (≤100 kW) are eligible for net-metering. Electricity from RES is supported through a sliding feed-in premium. Tariff rates are set for power plants (PP) with generating capacity of up to 10 kW or equal to 10 kW. PP with higher than 10 kW installed capacity may acquire guaranteed tariffs (sliding feed-in premium) by taking part in tenders. Tariff levels for these PP plants for the subsequent tenders are set every 6 months. In
Table 5 the feed-in-tariffs for generating capacities of up and equal to 10 kW are provided.
The Climate Change Special Program supports projects aiming to reduce GHG emissions in Lithuania. No less than 40% of the funds for this program are used for the support of RES. All technologies used for renewable electricity generation are eligible for this scheme. This fund provides support in the form of loans and subsidies. The Lithuanian Environmental Investment Fund (LEIF) supports projects aiming to reduce negative environmental impacts. Renewable electricity projects are also eligible under this scheme except geothermal energy projects. Projects are supported in the form of interest subsidies and soft loans. In addition, in Lithuania, electricity from renewable sources is exempt from Excise Duty. In Lithuania measures to promote renewables and energy efficiency improvements are also financed from EU Structural Funds. During 2014–2020 about 330 million EUR will be allocated for investments in renewable energy in Lithuania from EU Structural Funds.
In Lithuania measures to promote RES in transport sector include compensations, quotas, excise tax and pollution tax exemptions. Part of the prices to produce biofuels are reimbursed. Fuel traders are obliged to sell petrol containing 5–10% biofuels and diesel containing at least 7% biofuels. The rate of excise tax is reduced in proportion to the percentage of biomass per tonne of biofuel. Natural and legal persons using biofuels in vehicles are exempt from the environmental pollution tax on their vehicle emissions in Lithuania.
Since December of 2014 all new buildings and existing buildings owned by the state or municipalities and their agencies are subjects to major renovation and have to meet the renewable energy requirements for buildings. Compliance with these requirements may also be achieved by using district heating and cooling energy which was largely generated from renewable energy sources. There are no national certification programs in Lithuania. Also, RES for heating and cooling purposes are exempt from environmental pollution tax and are eligible for loans and subsidies from the Lithuanian Environmental Investment Fund (LEIF) under the Climate Change Special Program. Moreover, heat suppliers are obliged to purchase all heat produced from renewable energy sources (priority purchase).
In Lithuania the main policies to increase energy efficiency are financial which are mainly linked to financing of energy efficiency improvement projects from EU structural funds. During 2014–2020, about 540 million EUR were allocated in energy efficiency improvements in public and residential buildings and in enterprises, as well as in high efficiency cogeneration and district heating in Lithuania. For the achievement of the indicative national energy efficiency target for 2030 Lithuania is implementing the following measures financed from EU Structural Funds during 2014–2020: “Renovation of public buildings belonged to central government”—~EUR 29 million; “Replacement of old depreciated boilers in households with more efficient technologies using RES for heat energy”—EUR 32 million; “Modernization and development of heat distribution network”—EUR 69.5 million; “Modernization and development of electricity distribution network”—EUR 20.3 million.
To achieve energy efficiency improvements in industry in Lithuania low carbon economy cooperation between public, private sector, and financial institutions is being promoted. As an example of greening finance for sustainable business is project implemented by Lietuvos Energija. This company in cooperation with the European Bank for Reconstruction and Development, has issued green bonds of the value of 300 million euros. Now the issue was oversubscribed 5 times, resulting in 1.4 billion euros offered from investors.
In Lithuania energy efficiency improvement in households is linked with renovation of multi-flat buildings. Several programs for renovation of multi-flat buildings were commissioned. Multi-apartment Building Renovation (Modernization) Program was approved in 2004, later amended in 2015, 2009, and 2012. The main aim of the Program is to reduce thermal energy use in multi-apartment buildings, built before 1993, at least by 20% by the end of 2020.
The main energy policy targets in Bulgaria, having significant impact on reduction of GHG emissions from the energy sector are [
43]:
Energy efficiency of production improvement in existing coal-fired power plants.
Substitution of coal by natural gas.
Development of carbon capture and storage (CCS) by setting target of 9.2 million tones of CO2 emissions from the energy sector to be stored geological formations by 2030.
Development and implementation of mandatory requirements for the efficiency in new built coal-fired power stations;
Increase penetration of highly efficient CHP;
Institutional support for development of nuclear energy;
Increase the share of renewables in electricity generation;
Increase the share of renewables in heating and cooling;
Rehabilitation of district heat supply network and development of low-carbon district heat supply system.
Increase of energy efficiency in the transportation and reduction of energy losses by installing “smart” networks and facilities.
The main local climate change mitigation policy instruments in order to achieve the most important energy policy targets linked to GHG emission reduction applied in Bulgaria are similar to Lithuania’s and are the following: feed-in-prices for renewables and financing of renewable energy and energy efficiency measures from EU Structural Funds and other funds, tax allowances and deductions etc.
In Bulgaria like in Lithuania, electricity from renewable sources is promoted through a feed-in tariff. Producers of electricity from RES are entitled by the grid operator to the purchase and payment of electricity at a guaranteed price. The Energy and Water Regulatory Commission (EWRC) regulates the electricity selling price at the wholesale market and the feed-in tariffs at which the RES producers sell electricity to suppliers in Bulgaria. The feed-in tariffs and the purchase obligation apply to power purchase agreements (PPAs) signed for projects implemented before the achievement by the Republic of Bulgaria of the RES consumption mandatory targets under the National Renewable Energy Action Plan. Only solar and indirect use of biomass are eligible for feed-in tariffs showing big difference between wide coverage of Lithuanian feed-in tariffs scheme. The feed-in tariffs applied in Bulgaria are presented in
Table 6.
As one can see from
Table 6, depending on the type of fuel, there are several feed-in prices, which are allocated for power plants burning biomass in biomass. In Bulgaria, the use of renewable energy for heating and cooling is promoted through a grant from the Bulgarian Energy Efficiency Fund and through an exemption for building owners from property tax. In transport sector for promotion of biofuels a quotas were introduced. Persons introducing liquid fuels of crude oil origin for transportation shall be obliged to offer market fuels for diesel and petrol engines blended with biofuels. In Bulgaria also a reduced rate of excise duty is applied to unleaded petrol or gas oil if a share of more than 4% of bioethanol or biodiesel has been added to these fuels.
In Bulgaria Operational Program "Innovation and Competitiveness" 2014–2020 (OPIC) co-funded by the European Union through the European Regional Development Fund. For the implementation of the energy efficiency projects EUR 227.8 million EUR was allocated. Within Operational Program “Regions in Growth” 2014–2020 there is specific objective "Development of ecological and sustainable urban transport". Transport is also target of one of the seven operational programs of the Republic of Bulgaria, financed by the Structural and Cohesion Funds of the European Union and the operational program with the largest budget in Bulgaria—2 billion Euros.
The measures of energy efficiency improvement in Bulgaria in households sector are mostly normative, mandatory certification of buildings, labeling of electrical appliances, energy efficiency standards for electrical appliances, procedures and rules for share distribution of heat energy in multi-family residential buildings, etc.
There are also financial measures implemented in households sector for renovation of multi-flat buildings. It is foreseen the administrative, functional and financial capacity of the EE and RES Fund for finance of projects for utilization of RES and by increasing the grant for energy efficiency measures in households.
Another new measure is the National Program for Energy Efficiency in Residential Buildings. The program aims to carry out renovation of multifamily residential buildings through the implementation of energy efficiency measures. Financial support provided for households is 100% grant. There are incentives for the creation of homeowners’ associations and financial resources of 2 billion BGN are foreseen in Bulgaria.
5. Impact Climate Change Mitigation Policies in the Energy Sector on GHG Emission Reduction in Lithuania and Bulgaria
In the energy sector of Lithuania, a lot of attention is devoted to the implementation of strategic projects, because the aspect of energy independence is especially relevant to Lithuania. It is planned to continuously increase the use of renewable energy sources not only for the production of electricity, but, more importantly, for the heating of buildings.
In Lithuania the all planned measures in the field of energy efficiency would allow to reduce GHG emissions by 2518 Mt CO
2 equivalent, and the use of renewable energy resources (from 1102 ktne in 2012 to 1860 ktne in 2030) would allow the use of natural gas in the energy sector to be reduced by 35%. It is assumed that increase of RES would allow to reduce GHGs by 1547 Mt CO
2 eq up to 2020 [
42].
The expected impact of selected policy measures in the Lithuanian the energy sector is presented in
Table 7.
Measures to reduce greenhouse gas emissions in the Bulgarian energy sector are fully in line with the energy strategy, which sets targets for 2020. Investments in the realization of these measures are derived from the Structural Funds, green investment schemes, and the state budget.
A large part of the investment is devoted to the development of technologies for switching from coal to gas combustion and the introduction of clean coal technologies. The use of technologies for combining different types of fuels and the use of energy from renewable sources play an important role.
To reduce greenhouse gas emissions by 2020, a significant reduction of energy consumption is planned. The improvement of production efficiency in existing coal-fired power plants will reduce emissions by 4.68 MtCO
2 eq. The fuel substitution—from coal to natural gas will allow reducing GHG emissions by 11.7 Million tCO
2 eq. In addition to the above-mentioned measures, another very important way of reducing pollution is foreseen to increase the efficiency of the cogeneration plants. This will reduce emissions by 1.6 million. tCO
2 eq. However, the 30% fewer losses in energy transportation are not translated in GHG emission reduction effect [
43].
Bulgaria has untapped potential for renewable energy. It envisages decentralizing energy production and encouraging households to use energy from renewable energy sources. A large part of energy in households is used for heating and ventilation of the premises. It is therefore necessary to increase the share of energy from renewable sources in this sector, which would reduce CO2 emissions by 488 Mt CO2eq [
43]. However, the impact of 15% share of electricity from renewable sources in the electricity generation mix and achievement of the national target for the share of electricity from RES in the gross energy end-use consumption are not translated to GHG emission reduction effects.
The expected impact of energy policy measures in the Bulgarian energy sector is presented in
Table 8.
As one can see from
Table 8, Bulgarian expected GHG emission reductions are mainly attributed to switching from coal to natural gas and for main energy policy and climate change mitigation measures, such as energy efficiency improvements and renewables just insignificant GHG emission reduction are foreseen. The targets on energy efficiency and renewables linked to EU policy documents are even not translated in GHG emission reduction effects showing not big trust to such type of policies. In Lithuania the main GHG emission reduction in the energy sector are mainly linked to increased use of renewables and energy efficiency improvements as the energy sector is already dominated by natural gas. The climate change mitigation policies that have been implemented so far in Bulgaria based on analysis of the most recent reports submitted to UNFCC [
42,
43] are less efficient than in Lithuania as the country places priorities not on advanced GHG mitigation measures such as energy efficiency improvement and penetration of renewable energy sources.
6. Discussion of Results
In Bulgaria calculated GHG emission reductions due to implemented climate change mitigation policies in the energy sector amounts to 18.468 Mt of CO
2 eq. The impact of increased share of RES in electricity generation and final energy has not been translated in GHG emission reduction this is due to the fact that Bulgaria already reached in 2015 RES and energy efficiency target set for 2020. The biggest reduction of GHG emissions in Bulgaria is envisaged from substitution of coal by natural gas followed by improved energy efficiency of production at existing coal-fired power plants. This assessment demonstrates priorities of GHG mitigation in the energy sector. An increased share of CHP in electricity and heat generation is also among the priorities and provides for huge GHG emission reductions. However, there is no assessment of the impacts of all policy instruments described in
Section 3, such as feed-in tariffs for electricity from RES, financial support for renewables, and for energy efficiency improvements in residential buildings or support of biofuels in transport. The main achievements of GHG emission reduction linked to replacement of coal by natural gas and increase of efficiency of coal fired power plants which are not covered by policy instruments described in
Section 3 therefore, showing their low effectiveness and low importance for climate change mitigation in fuel combustion sector of Bulgaria.
The coverage of GHG emission reduction schemes such as feed-in prices for RES in electricity generation in Bulgaria is very limited, covering just solar and biomass technologies. The tariffs being applied are similar to tariffs applied to Lithuania however in Lithuania all RES technologies are being covered by feed-in tariffs and other support measures. Even large RES generation have possibilities to benefit from sliding feed-in premium tariffs by participating in tenders.
In Lithuania, calculated GHG emission reductions from climate change mitigation policies implemented in the energy sector amount to 4.065 Mt CO
2 eq and is well distributed among measures to promote RES and energy efficiency improvements in the most important sectors of fuel combustion. All policy tools analyzed in
Section 3 are linked to assessment of GHG emission reduction efforts up to 2020.
The review of countries GHG emission profiles and climate change mitigation policies provided for higher ranking of Lithuania in terms of achieved results in GHG emission reduction in the energy sector by promoting renewables and increase of energy efficiency and these results are in line with other studies [
8,
12] dealing with sustainability assessment of the energy sectors and analysis of policies to promote renewables and energy efficiency improvements as these policies can allow countries to achieve their GHG emission reduction targets by gaining additional benefits such as economic growth and decrease of energy dependency.
However, as other studies [
8] provide sustainability assessment of the energy sector development by EU member states by aggregation of similar indicators as in performed study (GHG emissions, final and renewable energy consumption etc.) by MCDA tools the results of the study can serve as an explanation as to how sustainability of the energy sector is linked to GHG emission reduction achievements and to develop more robust policy recommendations for EU member states. The main conclusions and policy implications of the conducted study are summarized is conclusion section below.
7. Conclusions
The comparative assessment of climate change mitigation policies in Lithuania and Bulgaria was performed by applying indicators framework linking GHG emission profiles, climate change mitigation priority areas, and foreseen GHG emission reduction potential by these policies. The strength of an applied comparative assessment framework is simplicity in the application of both qualitative analysis and quantitative data without aggregating assessment by MCDA tools or indexes, as this allows the tracking of not only results achieved by countries in GHG mitigation, but also to analyze the main drivers of these achievements. The limits are mainly linked to the subjectivity of the applied approach as various assumptions can be applied by explaining impacts of policies on GHG emission reduction through the chain of various driving force energy indicators.
The review of GHG emission profiles and their driving forces indicated that Bulgaria has higher GHG emissions from the energy sector, achieved lower GHG emission reduction in this sector and in total GHG emission reduction during the investigated period. Bulgaria has higher GHG per capita, GHG/GDP, and GHG/primary energy supply indicators than Lithuania, mainly due to a higher energy intensity of GDP and a lower share of RES in final energy consumption, therefore policy actions targeting energy efficiency and renewables are very important to achieve significant GHG emission reductions in Bulgaria. However, a review of climate change mitigation policies and estimated impacts of in terms of GHG emission reduction indicated that policies aiming to promote renewables have lower coverage and scope. The policies to promote energy efficiency improvements and decrease energy intensity of GDP are also fragmented compared with policies implemented in Lithuania which allowed the country to achieve a significant reduction of energy intensity of GDP since 1990.
Bulgarian expected GHG emission reductions are mainly attributed to switching from coal to natural gas and increasing the share of nuclear energy, and for main energy policies and climate change mitigation measures, such as energy efficiency improvements and renewables, but only insignificant GHG emission reduction are foreseen. As in Lithuania, the main GHG emission reduction in the energy sector are mainly linked to an increase use of renewables and energy efficiency improvements as the energy sector is already dominated by natural gas. The climate change mitigation policies that have been implemented so far in Bulgaria are less efficient than in Lithuania as the last country places priorities not on energy efficiency improvement and penetration of renewable energy sources.
The highest GHG emission reduction potential is not covered by the main policy instruments analyzed in Bulgaria, showing their low effectiveness and low importance for climate change mitigation in the fuel combustion sector of Bulgaria. In addition, the coverage of GHG emission reduction schemes, such as feed-in prices for RES in electricity generation in Bulgaria, is very limited, covering just solar and biomass technologies. The tariffs being applied are similar to tariffs applied in Lithuania, however, in Lithuania, all RES technologies are being covered by feed-in tariffs and other support measures. Even large RES generation have possibilities to benefit from sliding feed-in premium tariffs by participating in tenders.
The analysis of climate change policies’ impacts indicated unrealized GHG emission reduction potential in increasing the use of renewables and energy efficiency improvements in Bulgaria, therefore the several policy implications for Bulgaria would include: more focus on the promotion of renewables and energy efficiency in the fuel combustion sector by taking advantage of new advanced and energy efficient technologies in energy field based on renewables and switching from nuclear and natural gas-based energy supplies to renewable energy in future, as more promising pathways and more in line with EU climate change mitigation policies priorities and commitments.
The extension of policy tools coverage for all RES technologies would be useful in Bulgaria, based on the example of Lithuanian feed-in tariffs covering all RES technologies. In addition, policy tools targeting energy efficiency improvements in specific sectors of fuel combustion in Bulgaria need to be more consolidated in order to avoid fragmentation and to achieve realization of full energy saving potential in all sectors.

 ,
, 


