1. Introduction
Fossil fuels (coal, oil, and natural gas) are still the major energy sources for power generation in the world but represent the main contributor to greenhouse gas emission [
1,
2,
3]. On the other hand, the use of most of the renewable energy sources (in particular solar and wind), being non-programmable, can involve several issues related to the grid stability [
4] and continuity of energy supply. This is one of the reasons why biomass can play a key role in the energy transition from fossil fuels to renewable sources [
5]. In particular, biomass gasification is one of the most promising approaches, which can be used for combined heat and power generation and for the production of various products such as fuels (for example hydrogen or methanol) and chemicals [
6,
7,
8,
9]. In this context, bubbling fluidized-bed (BFB) gasification is one of the most interesting technologies, mainly for the high quality of gas–solid contact and the very efficient mass and heat transfers, but also for its good process flexibility, which accommodates variation in fuel quality and allows to utilize different fluidizing agents, reactor temperatures and gas residence times, to add reagents along the reactor height and to operate with or without a specific catalyst [
10,
11,
12]. Differently from other gasification technologies, BFB gasification also allows an in situ reduction of tar formation, with several advantages in terms of plant operation and efficiency [
13]. As a matter of fact, the uniform and relatively high temperature in all the fuel bed limits tar formation, which typically occurs during the endothermic pyrolysis processes promoted by low reaction temperature [
14,
15]. In parallel, most of the inert materials used to assure the fluidization of the fuel bed (such as olivine) present catalytic properties that promote tar decomposition [
15].
Although several studies on biomass gasification were recently published, most of them are focused on process optimization based on theoretical analyses or laboratory-scale experimental tests [
16,
17,
18], with particular reference to advanced simulation models [
19,
20,
21]. Several works assess the economic performance for possible applications in large-scale coal- and biomass-fuelled power plants [
22,
23,
24]. There is however a lack of techno-economic analyses on the potential application of gasification technologies (in particular BFB) for small-scale combined heat and power (CHP) generation [
25]. Just few works consider the economic analysis for some specific applications [
26]. Moreover, the financial risk analysis is not considered in the previous studies, although this kind of investment typically presents a significant financial risk.
In the last few years Sotacarbo gained a wide experience in biomass- and coal-fuelled fixed-bed and fluidized-bed gasification technologies [
27,
28,
29] and recently installed a new pilot-scale 500 kW
th BFB gasification unit—named FABER (fluidized air-blown experimental gasification reactor) and commissioned in December 2017—for the experimental development of BFB technology. The unit operates at about atmospheric pressure with air as gasifying agent and, due to its experimental nature, is equipped with several instruments for a careful process analysis.
This paper reports a techno-economic analysis on the possible application of the BFB gasification technology for small-scale commercial applications. Differently from the previously mentioned papers available in the literature, the analysis here reported is based on the actual experimental performance of the pilot unit, fitted with the conventional costs and revenues for a potential application in Italy. In particular, the performance of the FABER experimental unit (obtained during the preliminary experimental tests) were used as input data in a detailed economic model to evaluate the feasibility of a commercial-scale project. Moreover, due to the uncertainties in the cost estimation, a sensitivity analysis and a statistical analysis on the financial risk—based on the Monte Carlo method—were included in the study, in order to evaluate in what conditions the investment can be profitable.
2. Materials and Methods
In order to assess the profitability of the technology and the impact of some process parameters, a comprehensive cost-estimating procedure was performed for the BFB technology, based on the experimental results of the FABER pilot-scale unit. A nominal size of 2 MWe was chosen for the techno-economic evaluation of the biomass-to-energy plant, so to adapt the unprofitable pilot-scale size of the FABER unit to a more suitable commercial size. The technical performance of the reactor analyzed was modeled on that of the FABER unit. All the system parameters (flow rates of air, biomass, water, etc.; power size of feeding system, pumps, heaters, chiller, etc.) were calculated accordingly.
The assessment is followed by an overall economic study able to evaluate in what conditions the technology can be competitive for small-scale commercial applications. Moreover, a sensitivity analysis was carried out using @RISK commercial software (Version 7.6, Palisade Corporation, Ithaca, NY, USA) [
30], which is based on Monte Carlo method.
2.1. The FABER Pilot Unit
The pilot-scale experimental development of the bubbling fluidized-bed gasification technology is carried out in the FABER plant, developed in close cooperation with the University of Campania “Luigi Vanvitelli” [
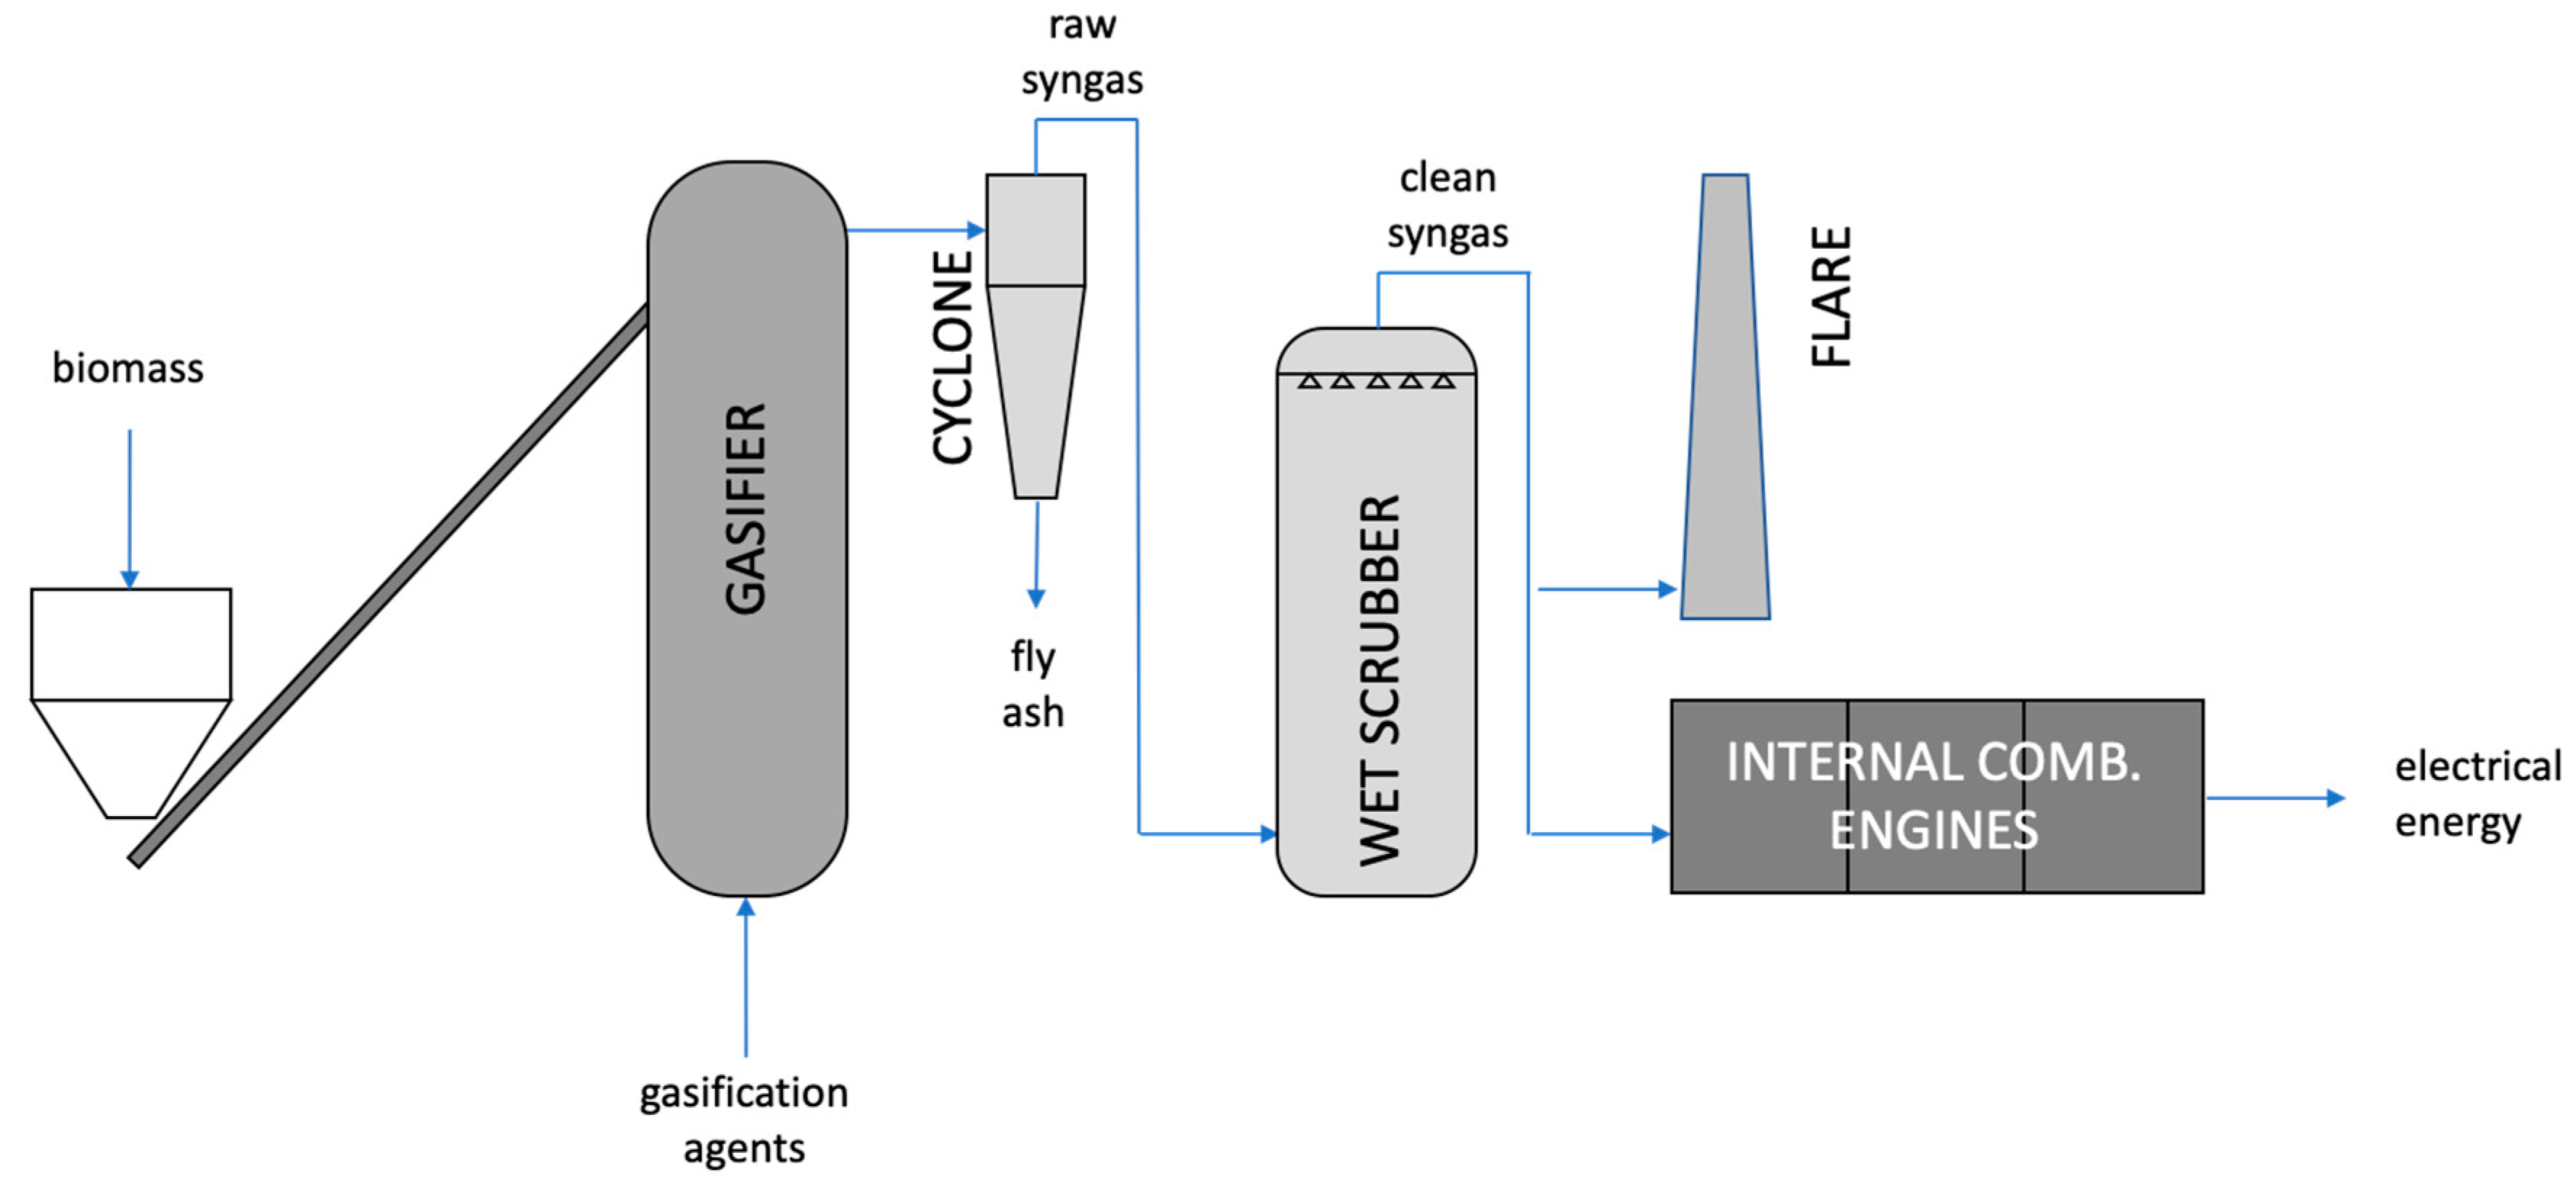
31]. A simplified scheme of the plant is reported in
Figure 1.
Up to 100 kg/h of biomass are sieved—since the particle size has a significant impact on the process—and injected through a hopper directly into or over the fuel bed. Gasification agents (air—if necessary enriched with oxygen—and steam) are pre-heated up to 600 °C and injected through the bottom of the gasifier, in order to assure the fluidization of the fuel bed. To this aim, a solid inert (olivine sand) is used as bed material to allow the optimal fluidization conditions; the sand also operates as a catalyst, improving the conversion efficiency [
31,
32]. A portion of air (secondary air) can also be injected in the middle of the reactor to promote oxidation reactions over the bed, thus increasing the temperature and, as a consequence, reducing tar formation (in particular if the reactor is fed with biomass mixed with plastics or other waste materials).
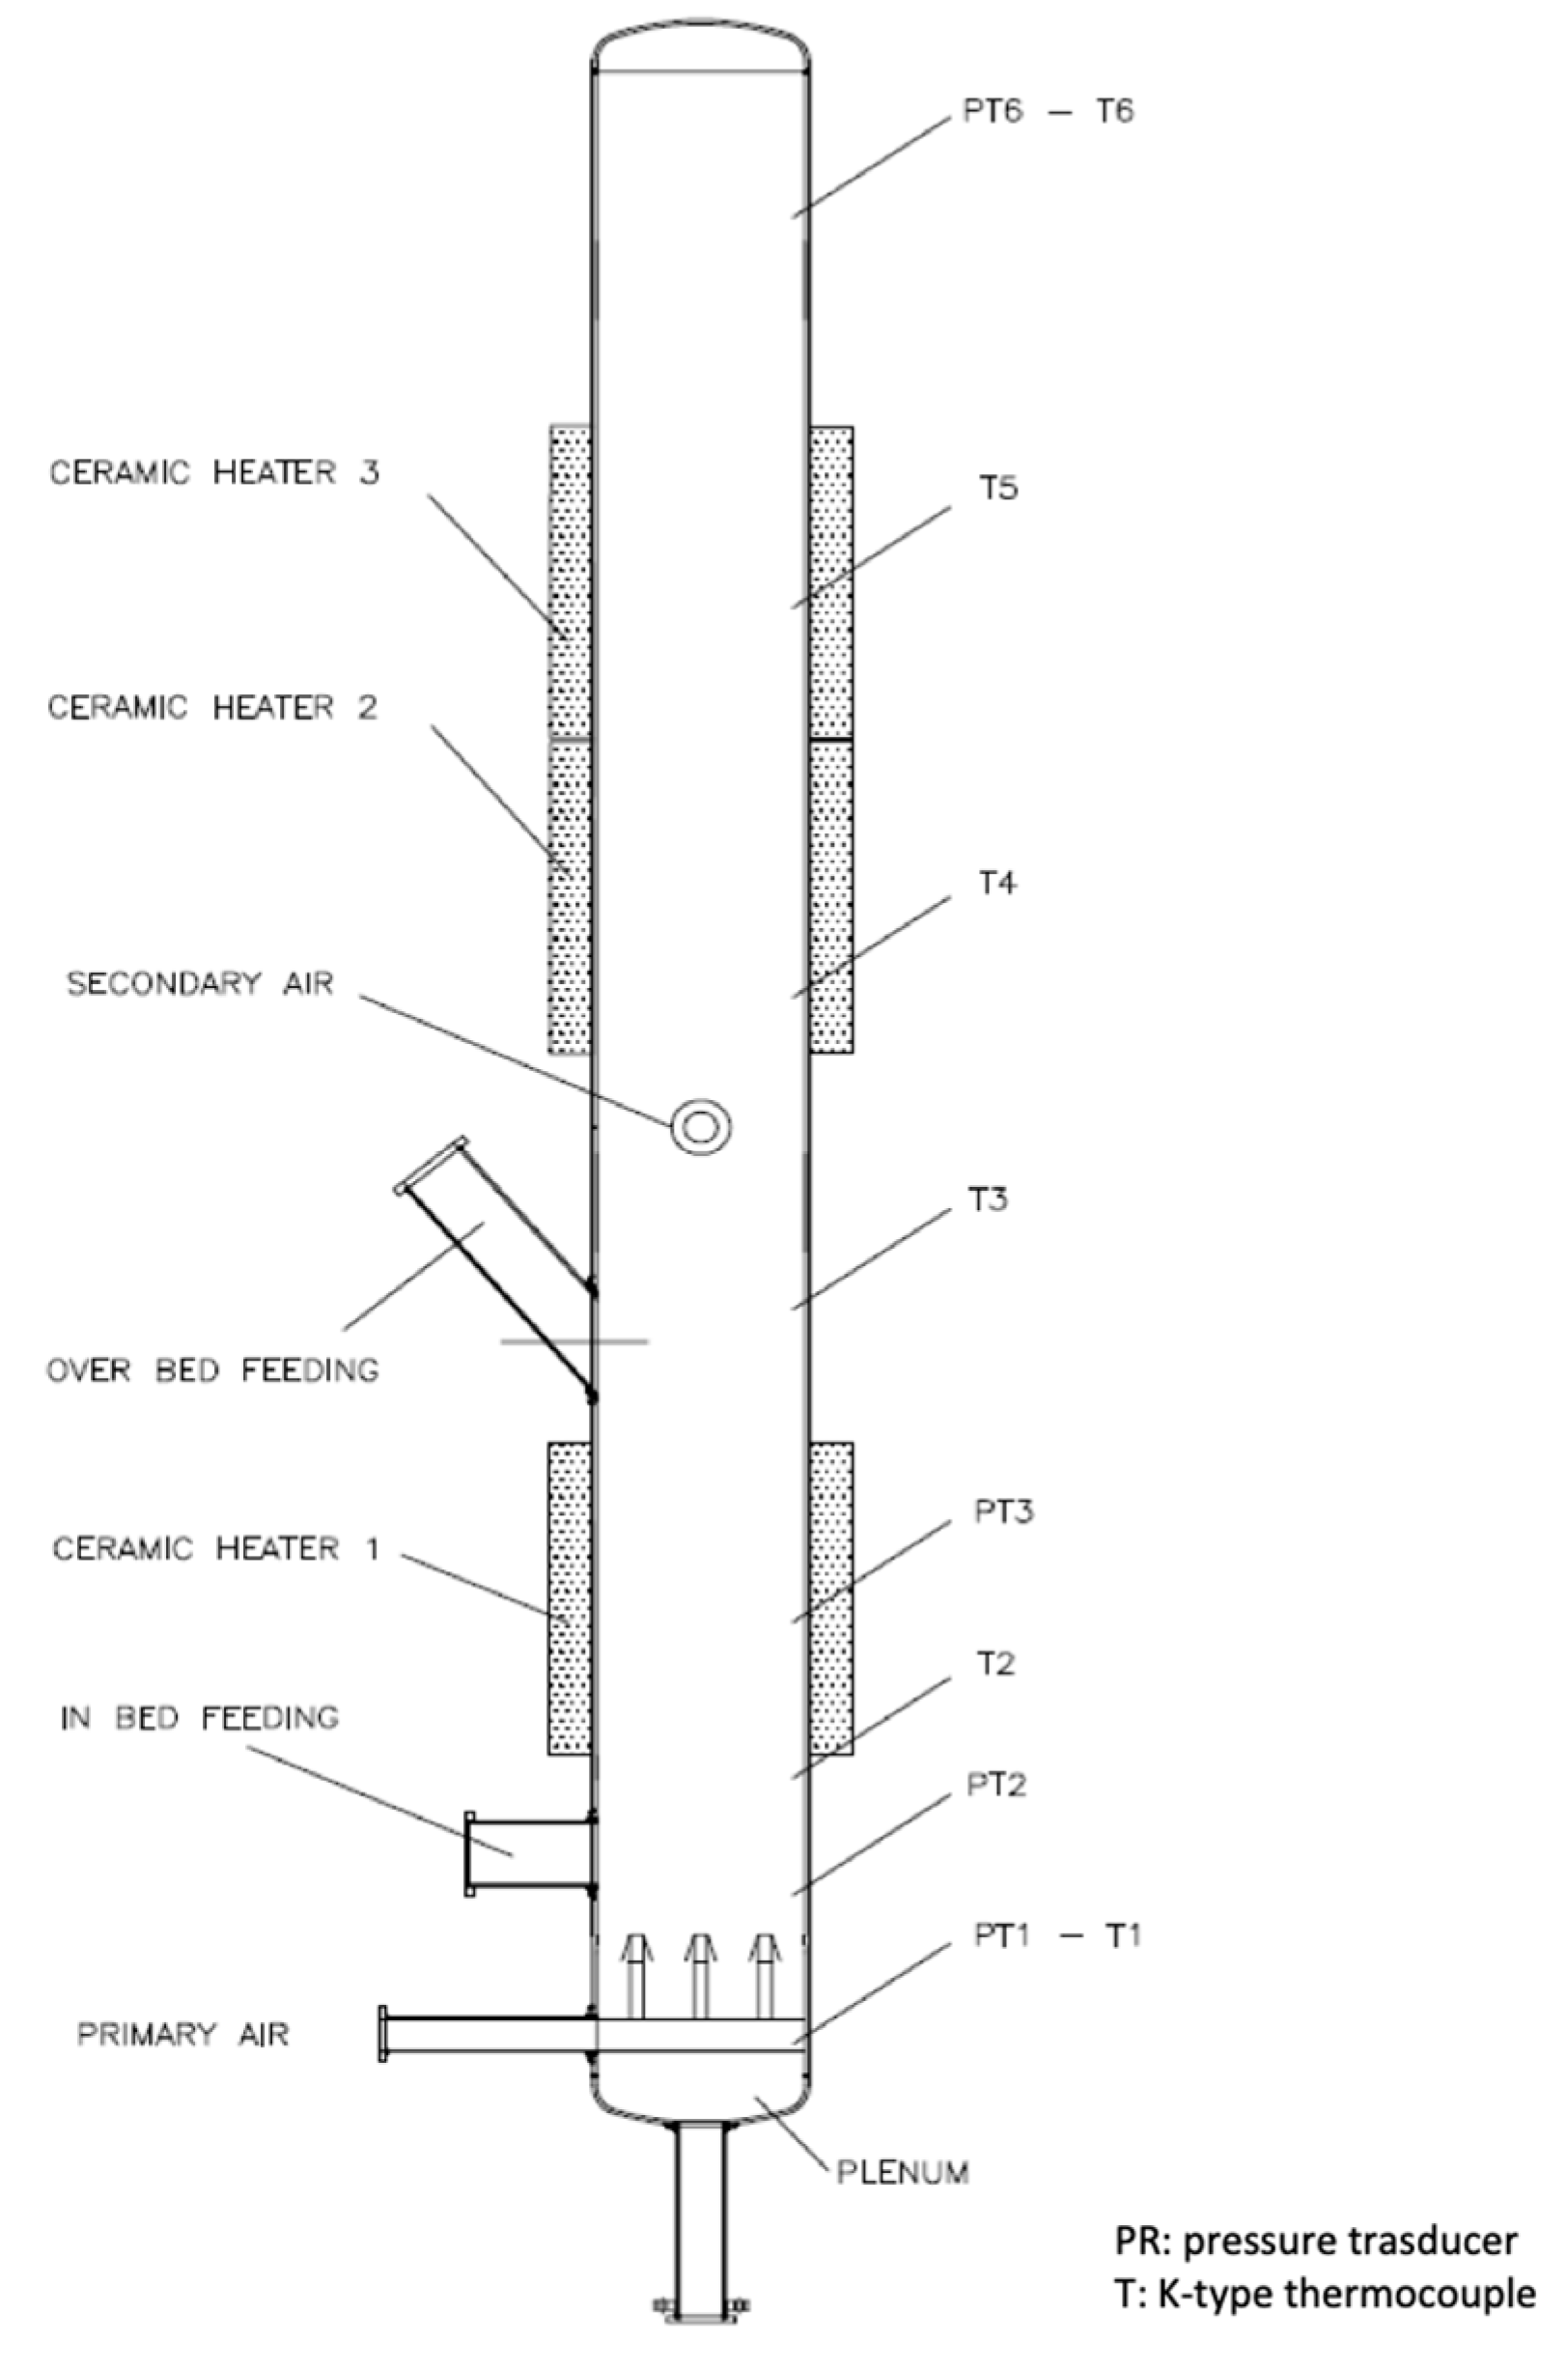
The gasification reactor is a stainless steel vertical cylinder with an inner diameter of 0.5 m and a height of 6 m (
Figure 2).
During the steady state autothermic operation, four different processes occur into the bubbling fluidized bed: fuel drying, pyrolysis, gasification and combustion [
33]. Due to the experimental nature of the plant, the fuel bed heating during the start-up phase is attained by means of six ceramic half-shell electric heaters located along the height of the reactor in the bubbling zone, in the low freeboard and in the middle freeboard. In this way, it is possible to contain tar production below 2.8 g/Nm
3.
The raw syngas leaving the reactor is mainly composed by CO, CO
2, H
2, CH
4 and N
2, but it also contains fly ash (char particles, due to a partial combustion of biomass and inert material) and a significant amount of tar, whose formation is promoted by low temperature [
34]. Therefore, the syngas must be properly treated prior to be sent to the engines for power generation. In particular, a cyclone is used to remove the fly ashes produced by biomass combustion and gasification, operating at about 600–800 °C. Tar is removed by a specific cold-gas cleanup system (operating at about 35 °C) composed by a Venturi scrubber (for the gross removal of heavy oils) and a wet packed column (with plastic packing) for fine tar removal. In order to measure the tar removal efficiency, tar is sampled outwards of the cyclone with a heated probe and line operating at 350 °C and downwards of the wet scrubber with a probe operating at about 30 °C, according to the international standards CEN/TS 15439:2006 and CEN/TS 15439:2008 [
35]. The analysis system is based on a set of six sample bottles in a bath of propanol, with an electronic system to control the temperature, in order to maximize tar collection from syngas.
Finally, the clean syngas is sent to three dual-fuel (diesel and syngas) engines for power generation (up to 120 kWe), with dedicated software to monitor their operation. If necessary (when the engines are not operating), the syngas can be sent to a flare for its combustion.
Syngas is sampled through sampling probes heated to 600 °C (two sampling points are located into the gasifier, one at the exit of the reactor and one downwards of the gas cleanup system) and analyzed by an online system (provided by Siemens) for CO, CO2, H2, O2, CH4 and H2S. It consists of three sensors for the analysis of different species: (i) Ultramat 23 for CO, CO2, CH4 and O2; (ii) Calomat 6 for H2 and N2; (iii) GMS810 for H2S (to allow the use of other kinds of fuels as feedstock, such as coal and waste). In addition, a SRA micro gas chromatograph (Agilent 490 Micro GC) allows a further process control.
A general overview of the unit is shown in
Figure 3.
2.2. Materials Characterization
The lignocellulosic biomass used for the preliminary gasification tests is cypress (Cupressus sempervirens) from Sardinian woods.
In order to characterize it, a sample (about 200 g) of biomass is crashed in a cross beater mill (Retsch SK100) and sieved in order to obtain a particle size lower than 125 μm. It is then dried in an oven with a constant temperature of 105 ± 2 °C for at least 24 h and stored in a desiccator to prevent moisture absorption from the atmosphere. The choice to operate the experimental characterization tests with dry samples comes from an experimental evaluation described elsewhere [
36].
Table 1 shows the proximate, ultimate and calorimetric analyses of the considered fuel; the analyses were carried out in the Sotacarbo laboratories according to the international standards. In particular, proximate analysis was performed by a LECO TGA-701 thermogravimetric analyzer; ultimate analysis was carried out on a LECO Truspec CHN/S analyzer; finally, the energy content of the sample was measured using an adiabatic oxygen bomb calorimeter by a LECO AC-500 calorimeter. All the measurements were replicated three times to decrease the error of the experimental results and to determine their reproducibility.
The sample has a high carbon value (51.5 wt.%), and a relatively high moisture content (10.7 wt.%). The fixed carbon and volatile matter contents make up almost 97 wt.% of the total composition, which makes this biomass a good candidate for oxidation and gasification processes. Furthermore, the amount of ashes is low enough and this could be useful to avoid different problems related to fouling, corrosion and slag formation. It is interesting to highlight the high volatile content of the cypress sample; this parameter has a strong impact on the gasification performance and influences biomass reactivity [
36].
A commercial olivine, characterized by a particle size of 0.5 to 1.5 mm, was used as bed material. It was selected during preliminary experimental tests [
31] for its catalytic activity in the biomass gasification process and for its low cost. The composition of the olivine, assessed by the provider, is reported in
Table 2.
3. Experimental Activity
The experimental activity performed on the BFB gasifying system at Sotacarbo uses air as gasifying agent. The air-flow is pre-heated at 550 °C by means of an electric heater before entering the reactor. The air and biomass flow rates are set so to attain an equivalence ratio (ER) of 0.38 (defined as the ratio between the oxygen content of air supply and the quantity stoichiometrically required for the complete combustion of the biomass). Due to its experimental nature, the reactor is heated by external heaters so to reach the shell temperature of 850 °C. The syngas generated in the reactor is sent to the cleanup section, composed by a cyclone for dust removal and two wet scrubbers for tar removal. Finally, the syngas is sent to three internal combustion engines for power generation or burnt by a flare.
Table 3 summarizes the main operating conditions and the performance parameters of the reactor.
Table 4 reports the syngas composition after the cleanup section.
As anticipated, the plant performance summarized in
Table 3 comes from the preliminary experimental runs (two different runs, carried out in early 2018), with a gasification process which still requires a careful optimization of the operating procedures and parameters. In any case, the preliminary results seem very promising and they are comparable with those reported in literature [
37]: for an ER of 0.35–0.40, the cold gas efficiency of air-blown BFB biomass gasification units are typically in the range of 0.45–0.65, whereas the carbon conversion efficiency is in the range of 0.6–0.9.
4. Economic Model
As mentioned, the core of this work is the economic assessment, which starts from the preliminary experimental results on the FABER pilot unit, adapted to a 2 MWe plant size. In other words, the same operation performance obtained in the preliminary experimental runs were used as input data for the economic analysis. The evaluation, based on a detailed techno-economic model, considers, year-by-year, capital and operating costs and the revenues for selling electrical energy.
4.1. General Assumptions
The economic and financial assessment of the whole plant configuration was carried out on the basis of the levelized cost of electricity (LCOE) and other economic indicators, defined below.
In the economic evaluation all the cogenerated heat is assumed to be used and it therefore represents a money-saving measure with respect to a separate production of heat in a boiler fed by LPG (with reference to the specific case of Sardinia island, Italy). The electricity produced is fed into the grid after the energy plant consumption is deducted.
4.2. Capital Costs
Capital costs of the 2 MW
e commercial-scale gasification section were evaluated on the basis of analysis performed by Mott MacDonald Group (2011) [
38], where, among the others, a system of the same size as that of this study was considered. For the CHP section, the study of NREL (2003) [
39] was taken as reference. All the costs were converted in euro currency of 2018, with a EUR/USD conversion rate of 1.131 (2003) and a EUR/GBP conversion rate of 1.152 (2011) [
40]. Moreover, the costs were inflated to year 2018 according to the well-known equation:
where
C is the current cost (reported, in this case, to year 2018),
C0 is its original value referred to its reference year and
P and
P0 are the producer price indices for the Euro zone (
P/P0 = 1.076 between 2011 and 2018 and
P/P0 = 1.272 between 2003 and 2018), calculated on the basis of the actual inflation rates [
41].
Capital costs are summarized in
Table 5. Cost items are grouped with the same criteria adopted by IRENA (2017) [
42].
The specific installation cost of the plant is 6196 €/kWe.
Except for the components characterized by the main technology innovations and the advanced analysis system (proper of an experimental unit), these costs match (with a deviation lower than 0.4%) the actual costs of the FABER experimental unit components, scaled with a power factor
f of 0.6 [
25] according to the following equation:
where
C is the scaled cost referred to the commercial scale
S and
C0 is the reference cost referred to the reference scale
S0.
4.3. Operating Costs
The whole yearly cost for plant operation can be determined by the sum of the costs for the primary fuel, plant operation and maintenance (O&M), plus taxes. O&M costs are, in turn, represented by personnel, power consumption, maintenance materials, consumables, waste disposal and by-products management.
Electricity costs are evaluated on the basis of the nominal power of the electricity consumers each considered with a utilization factor and with 7000 h/year of plant availability. The unitary cost of electrical energy for a supply contract of a firm with similar power consumption can reasonably be assumed equal to 170 €/MWh [
43].
Table 6 lists the electrical energy costs for the plant.
With regard to the biomass fuel price, wood chips are generally quite expensive in Italy, with a price of about 90 €/t [
44]. However, the experimental project aims to develop and optimize the technology for applications with biomass from short-range agricultural and forest crops, which normally represent a waste to be disposed. For this reason, a biomass fuel cost of 20 €/t [
25] was prudentially assumed for the evaluation of the base-case. However, a sensitivity analysis on biomass price was also performed.
Consumables include water, solvent and other materials for the water treatment. Waste disposal costs include ash and dry sludge; it was considered equal to 0.415 € per kilogram of sludge and ashes, which is the disposal cost sustained by Sotacarbo for its experimental tests. Prudentially, this cost also includes the disposal of unreacted carbon during the process, which is not re-circulated in the FABER pilot plant; the reduction of unreacted materials is one of the main goals of the next experimental campaigns.
Personnel cost includes annual operating labor, maintenance labor and administrative and support labor. A total of four employees were assumed for plant operation management (1 person/shift), with a yearly cost of 30,000 €/year per person [
45].
Finally, maintenance costs were assumed 5% of the capital costs, which is a typical assumption for this item.
A summary of the O&M costs is reported in
Table 7, while
Figure 4 shows the percentage share of the cost items.
The total hourly cost of the plant, including capital costs distributed in the lifetime, is 352 €/h. The cost to produce 1 kWh of electrical energy, calculated as the ratio between the total hourly cost and the power production, is therefore 173 €/MWh.
4.4. Revenues
At present, no forms of incentives exist in Italy for power production from biomass. A different type of incentive is active for high-efficiency CHP plants, normed by the Italian D.M. 05/09/2011 decree [
46]. This incentive is an environmental policy, which supports primary energy savings originated by CHP generation compared to an equivalent separate production of electricity and heat in standard systems with mean conventional efficiencies. Each ton of oil equivalent (toe) of primary energy savings so calculated grants a White Certificate, a title which can be sold in the environmental market regulated by the Italian energy market managing authority (GME). The incentive is granted for ten years.
Table 8 summarizes the power and energy production of the CHP section of the plant. The analysis considers a commercial engine characterized by a power generation efficiency of 39%, a thermal efficiency of 37.5% and, as a consequence, a first law efficiency of 76.5%.
Table 9 reports the revenues from the White Certificates. For the value of each White Certificate the weighted average of type “II-CAR” certificates sold in 2017 was assumed [
47].
The main income of the plant comes from the sale of the electrical energy produced by the CHP system. The power production is reduced by the power needs of the plant. Again, a purchase cost of 170 €/MWh was assumed, which is therefore considered in this analysis as an avoided cost. The sale cost was assumed of 61 €/MWh, evaluated as the weighted average Italian power exchange price in 2018 [
47].
Table 10 summarizes the income derived from power production.
Finally, a form of saving comes from the thermal power production. This avoided cost was evaluated in relation to an equivalent thermal power production from a conventional boiler burning LPG. It should be noted that LPG was considered because of the assumption to build the plant in Sardinia, where no natural gas is available. Savings from the thermal power production are reported in
Table 11.
4.5. Financial Assumptions
The key milestones and the main financial assumptions considered in this work are summarized in
Table 12. Except where specified, all the costs and prices are annually increased to take into account the inflation rate, assumed equal to 2% [
24,
45]. It was also assumed that 75% of the investment for the plant construction is supported by banks through the opening of a senior debt, repaid in 10 years with a constant annual interest rate of 6.14% [
24,
45]. An amortization rate of 10% was considered. To calculate the net present value of each cash flow, a discount rate of 8% was adopted. Taxation was based on the current national fiscal imposition in Italy.
5. Techno-Economic Assessment
The economic analysis referred to the 2 MWe commercial-scale plant is reported below. In addition, as mentioned, a sensitivity analysis was assessed to consider the effect of the biomass price and plant availability on the economic performance and a risk analysis is reported to investigate the financial sustainability of the investment.
5.1. Economic Results
In
Figure 5 the cumulated cash flow trend over the course of the plant lifetime is charted. The graph shows a payback time of 11 years. The key economic performance indicators were calculated as summarized in
Table 13. The net present value (NPV) of the investment, calculated as the sum of all the discounted yearly cash flows, is 3.27 M€. An internal rate of return (IRR) of 17.1% was obtained. IRR is the discount rate at which the NPV of the investment is equal to zero. IRR is therefore a measure of the financial risk and is used to evaluate the profitability of the investment.
Finally, the levelized cost of electricity (LCOE), defined as the ratio between all the discounted costs and the total amount of power production over the plant lifetime, is 124 €/MWh. LCOE represents the NPV of the cost of electricity and can be considered as the revenue that would cause the project to break even.
5.2. Sensitivity Study
Considering the uncertainties on the future estimation of biomass market price, sensitivity analyses were carried out in order to assess the effects of a potential variation of biomass cost and plant availability.
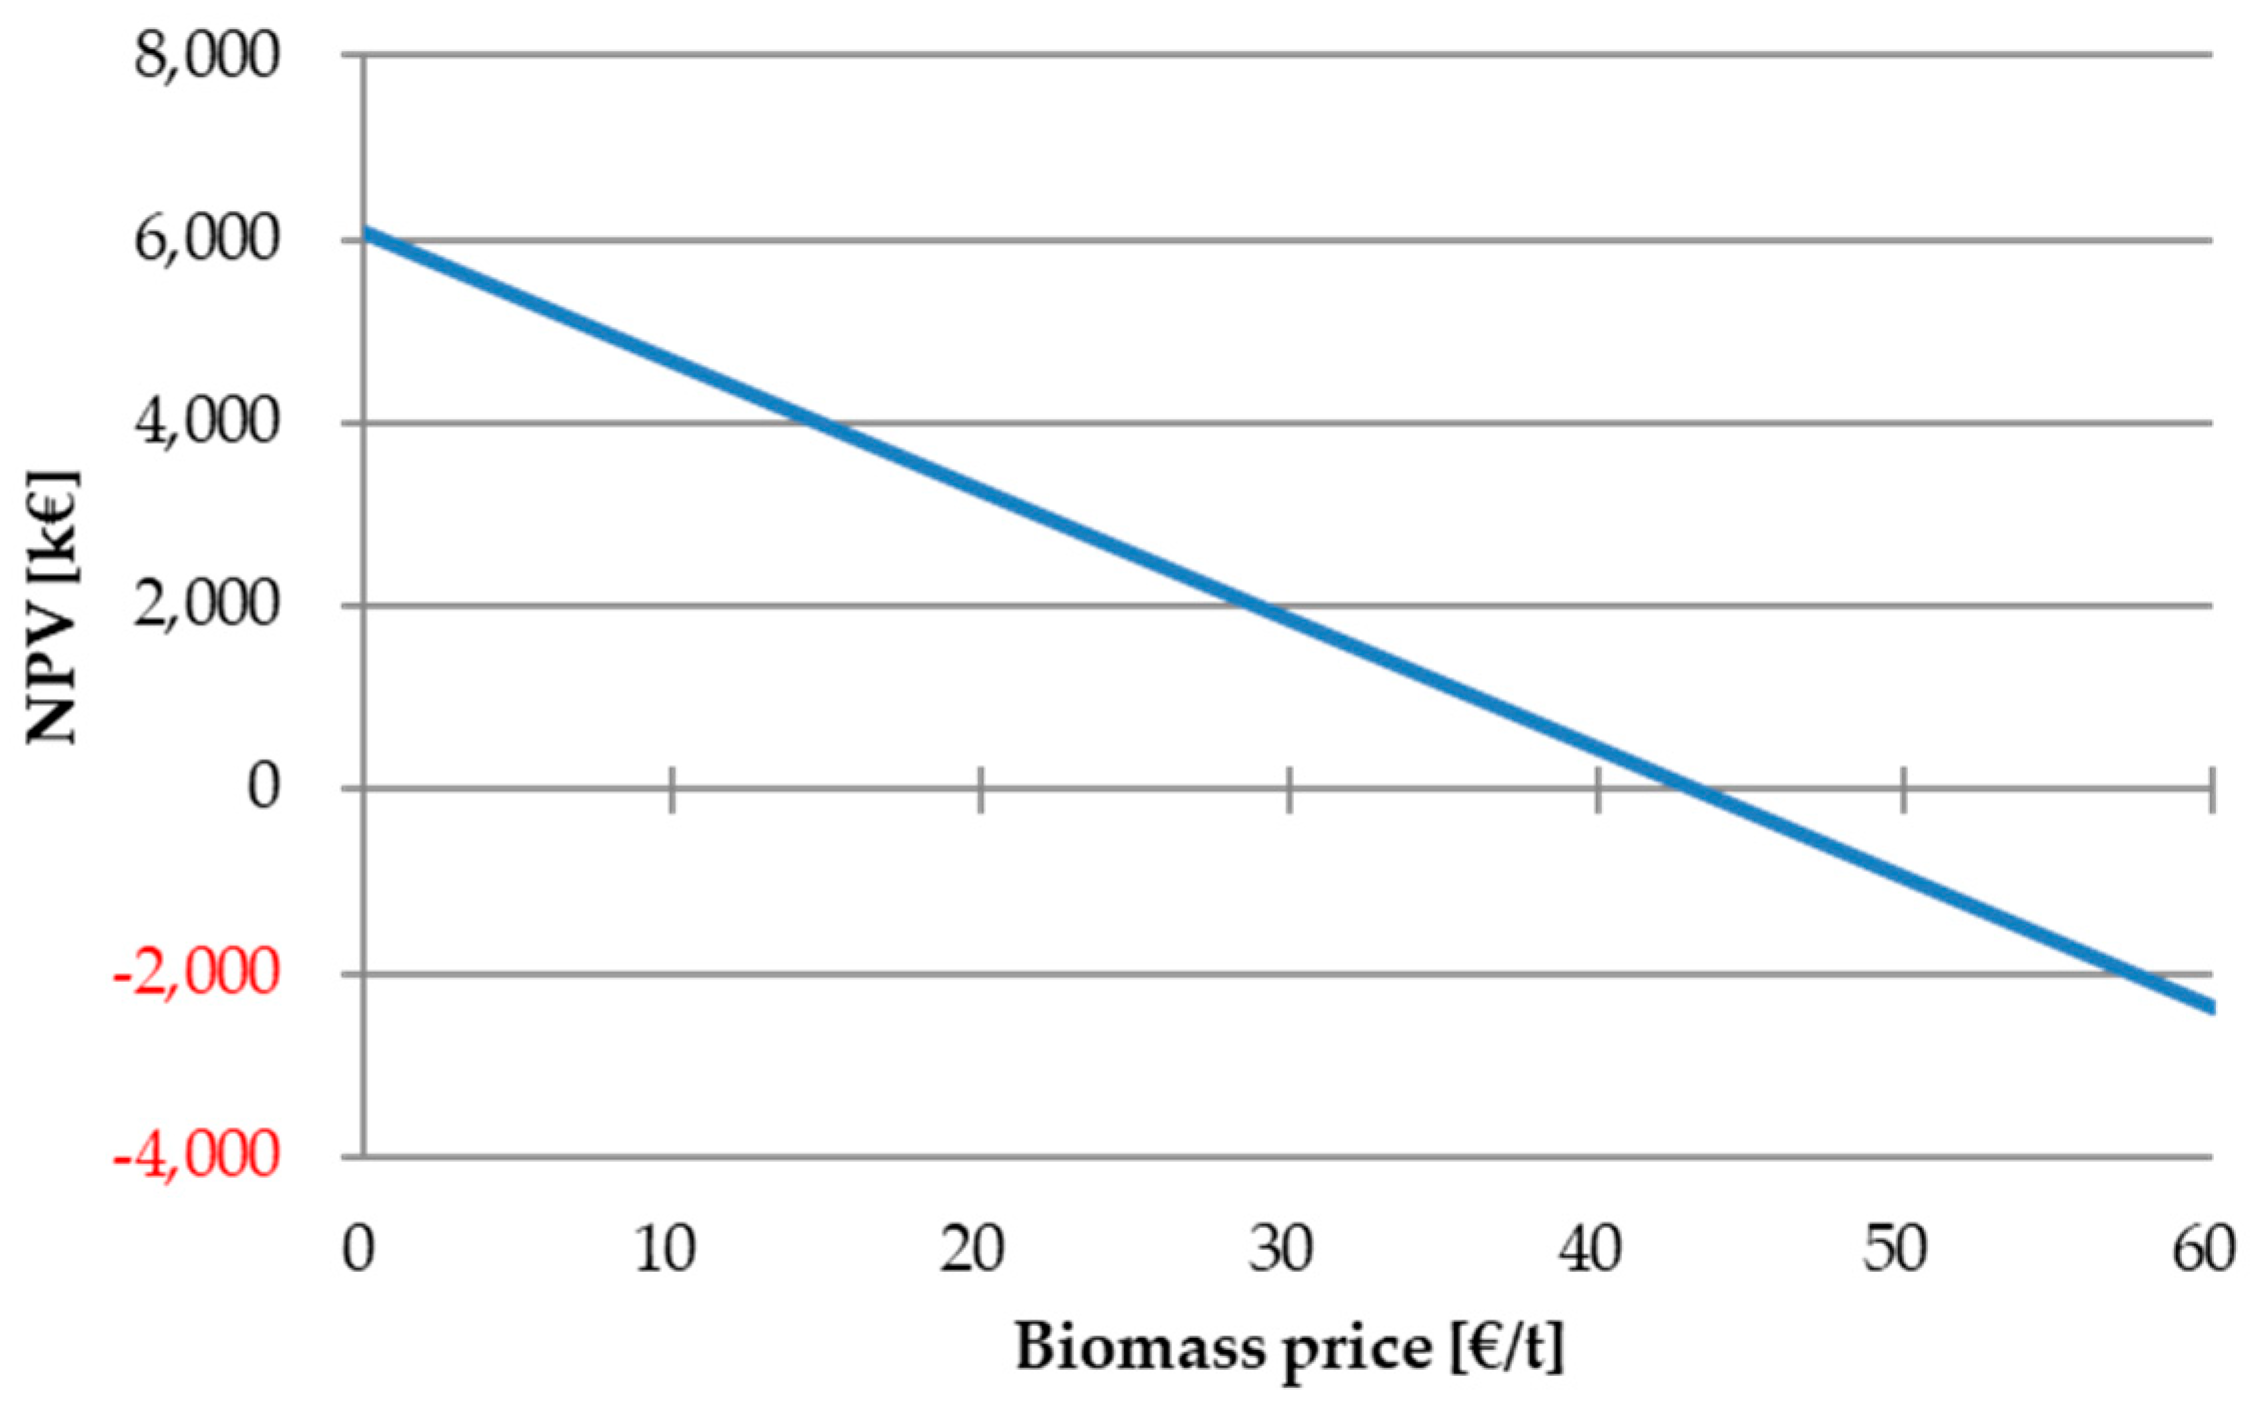
The first analysis (
Figure 6) considers a linear variation of biomass price from 0 €/t (waste fuel supply free of charge) to 60 €/t (the actual purchasing cost of the wood chips used in the Sotacarbo experimental facility).
The analysis shows that the technology is competitive only if biomass price is lower than about 43 €/t. Higher prices involve an increasing operating cost that makes the investment non-profitable.
In the second analysis the plant availability was varied from 5500 h/year to 7500 h/year. The investment proves to be profitable when the plant is operated for not less than 6000 h/year, as shown in
Figure 7.
5.3. Risk Assessment
The economic analysis here reported is subjected to a series of uncertainties due to the variability of several economic parameters, such as capital and operating costs. Therefore, the assessment of the financial risk can be a very useful approach to evaluate if and how these parameters affect the economic performance of the investment.
The risk assessment analysis here reported is based on the Monte Carlo method, which is an algorithm that relies on repeated random sampling to obtain numerical results [
48,
49,
50]. Ten groups of 100,000 iterations were performed for each case. As anticipated, the analysis was performed with the @RISK commercial software [
30], largely utilized for similar analyses on several fields, when it is impossible to predict the exact impact of several variables on the profitability of the investment.
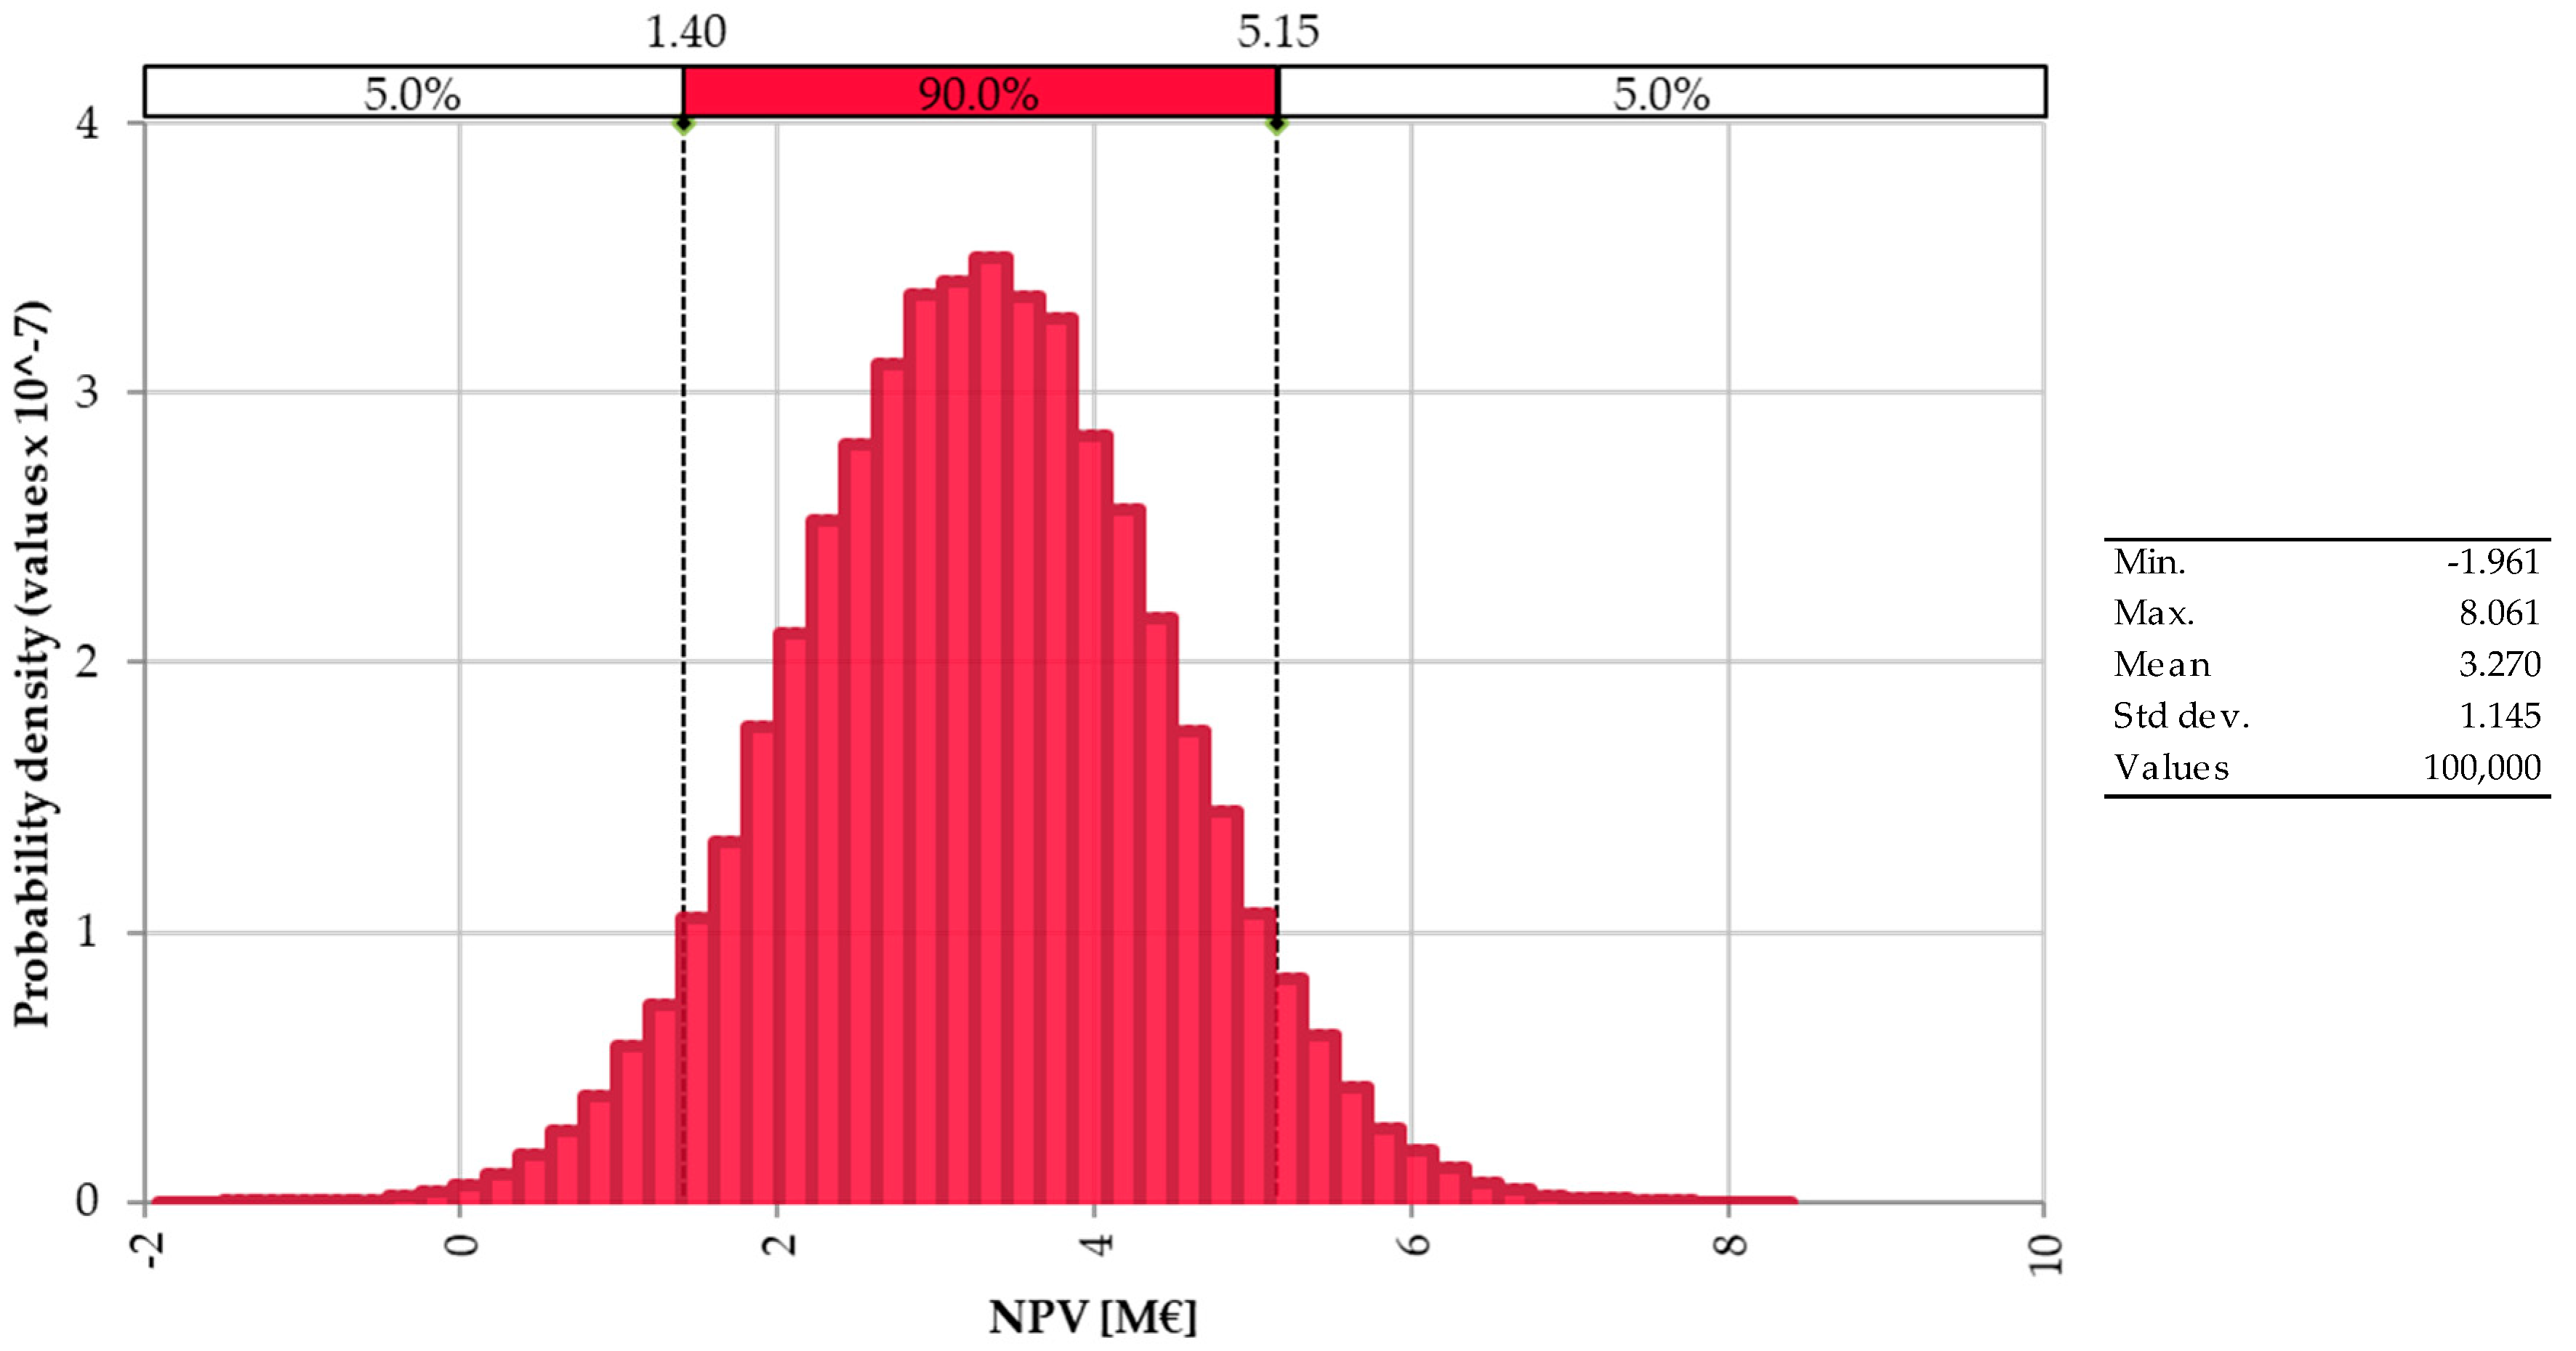
The statistical analysis was carried out looking for the impact of the capital and operating costs on the NPV. For both the parameters, a variation up to ±10% was considered with a probability of 90% (with a normal distribution).
Figure 8 and
Figure 9 show the probability density curve of the NPV for a variation of capital and operating costs, respectively.
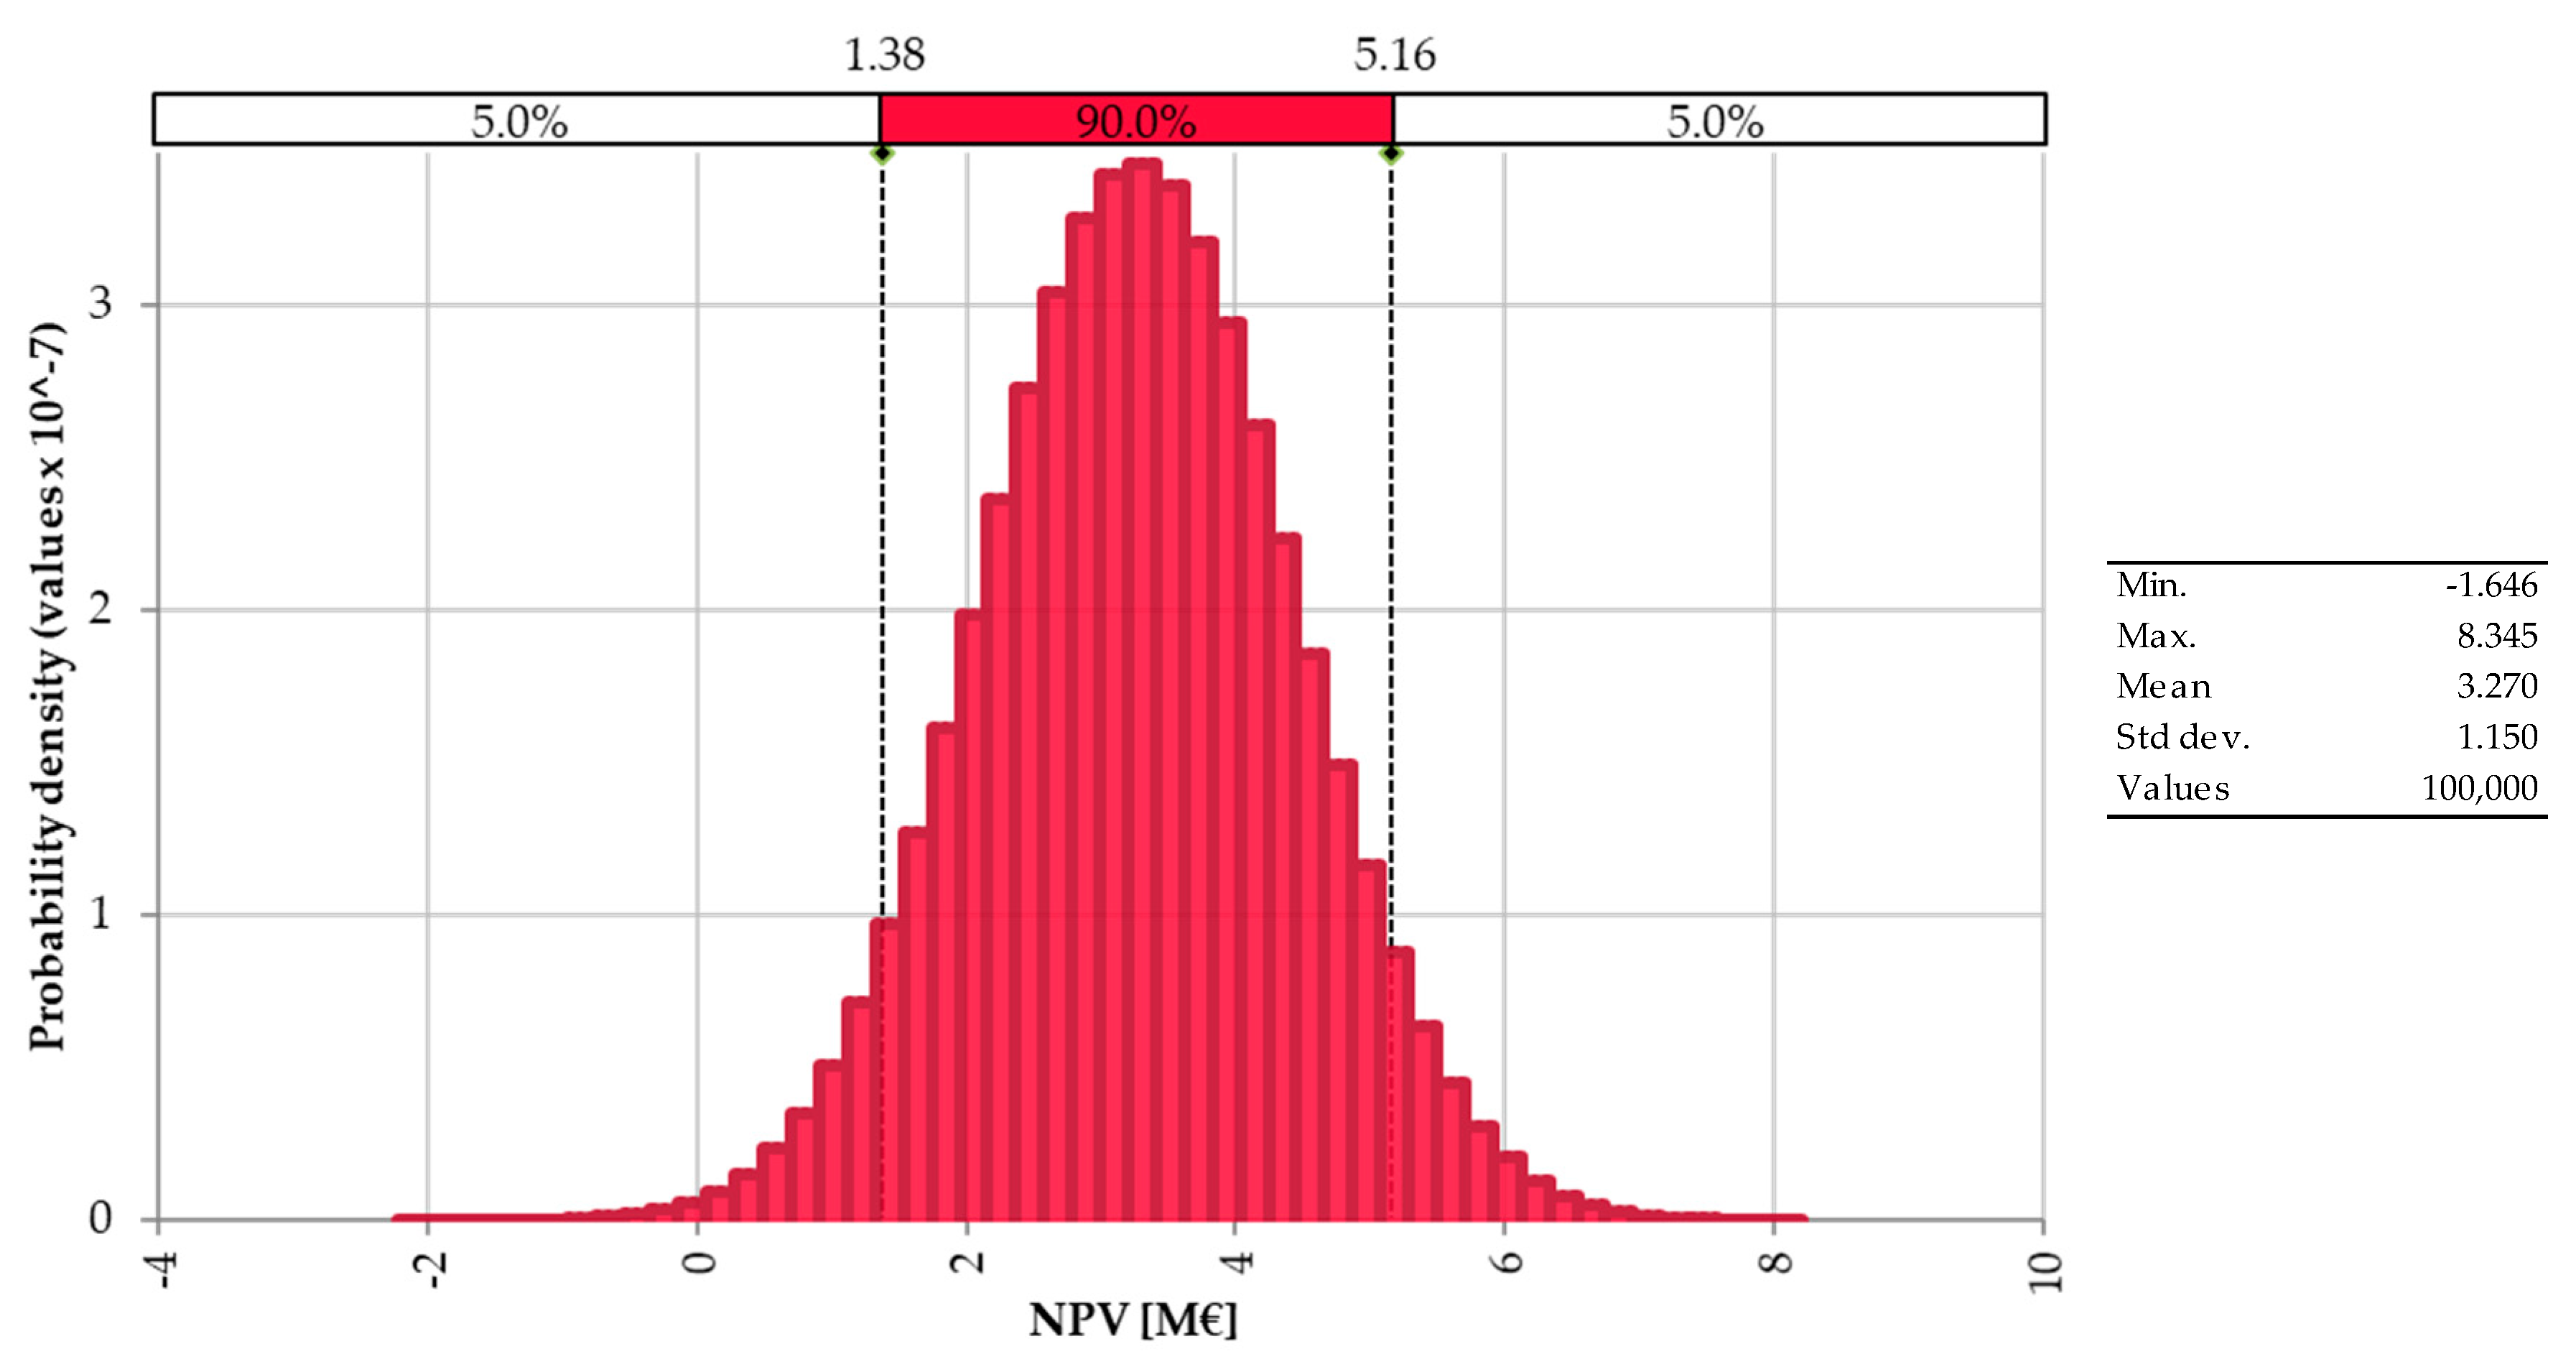
A combined effect of the variation of both the parameters is reported in
Figure 10.
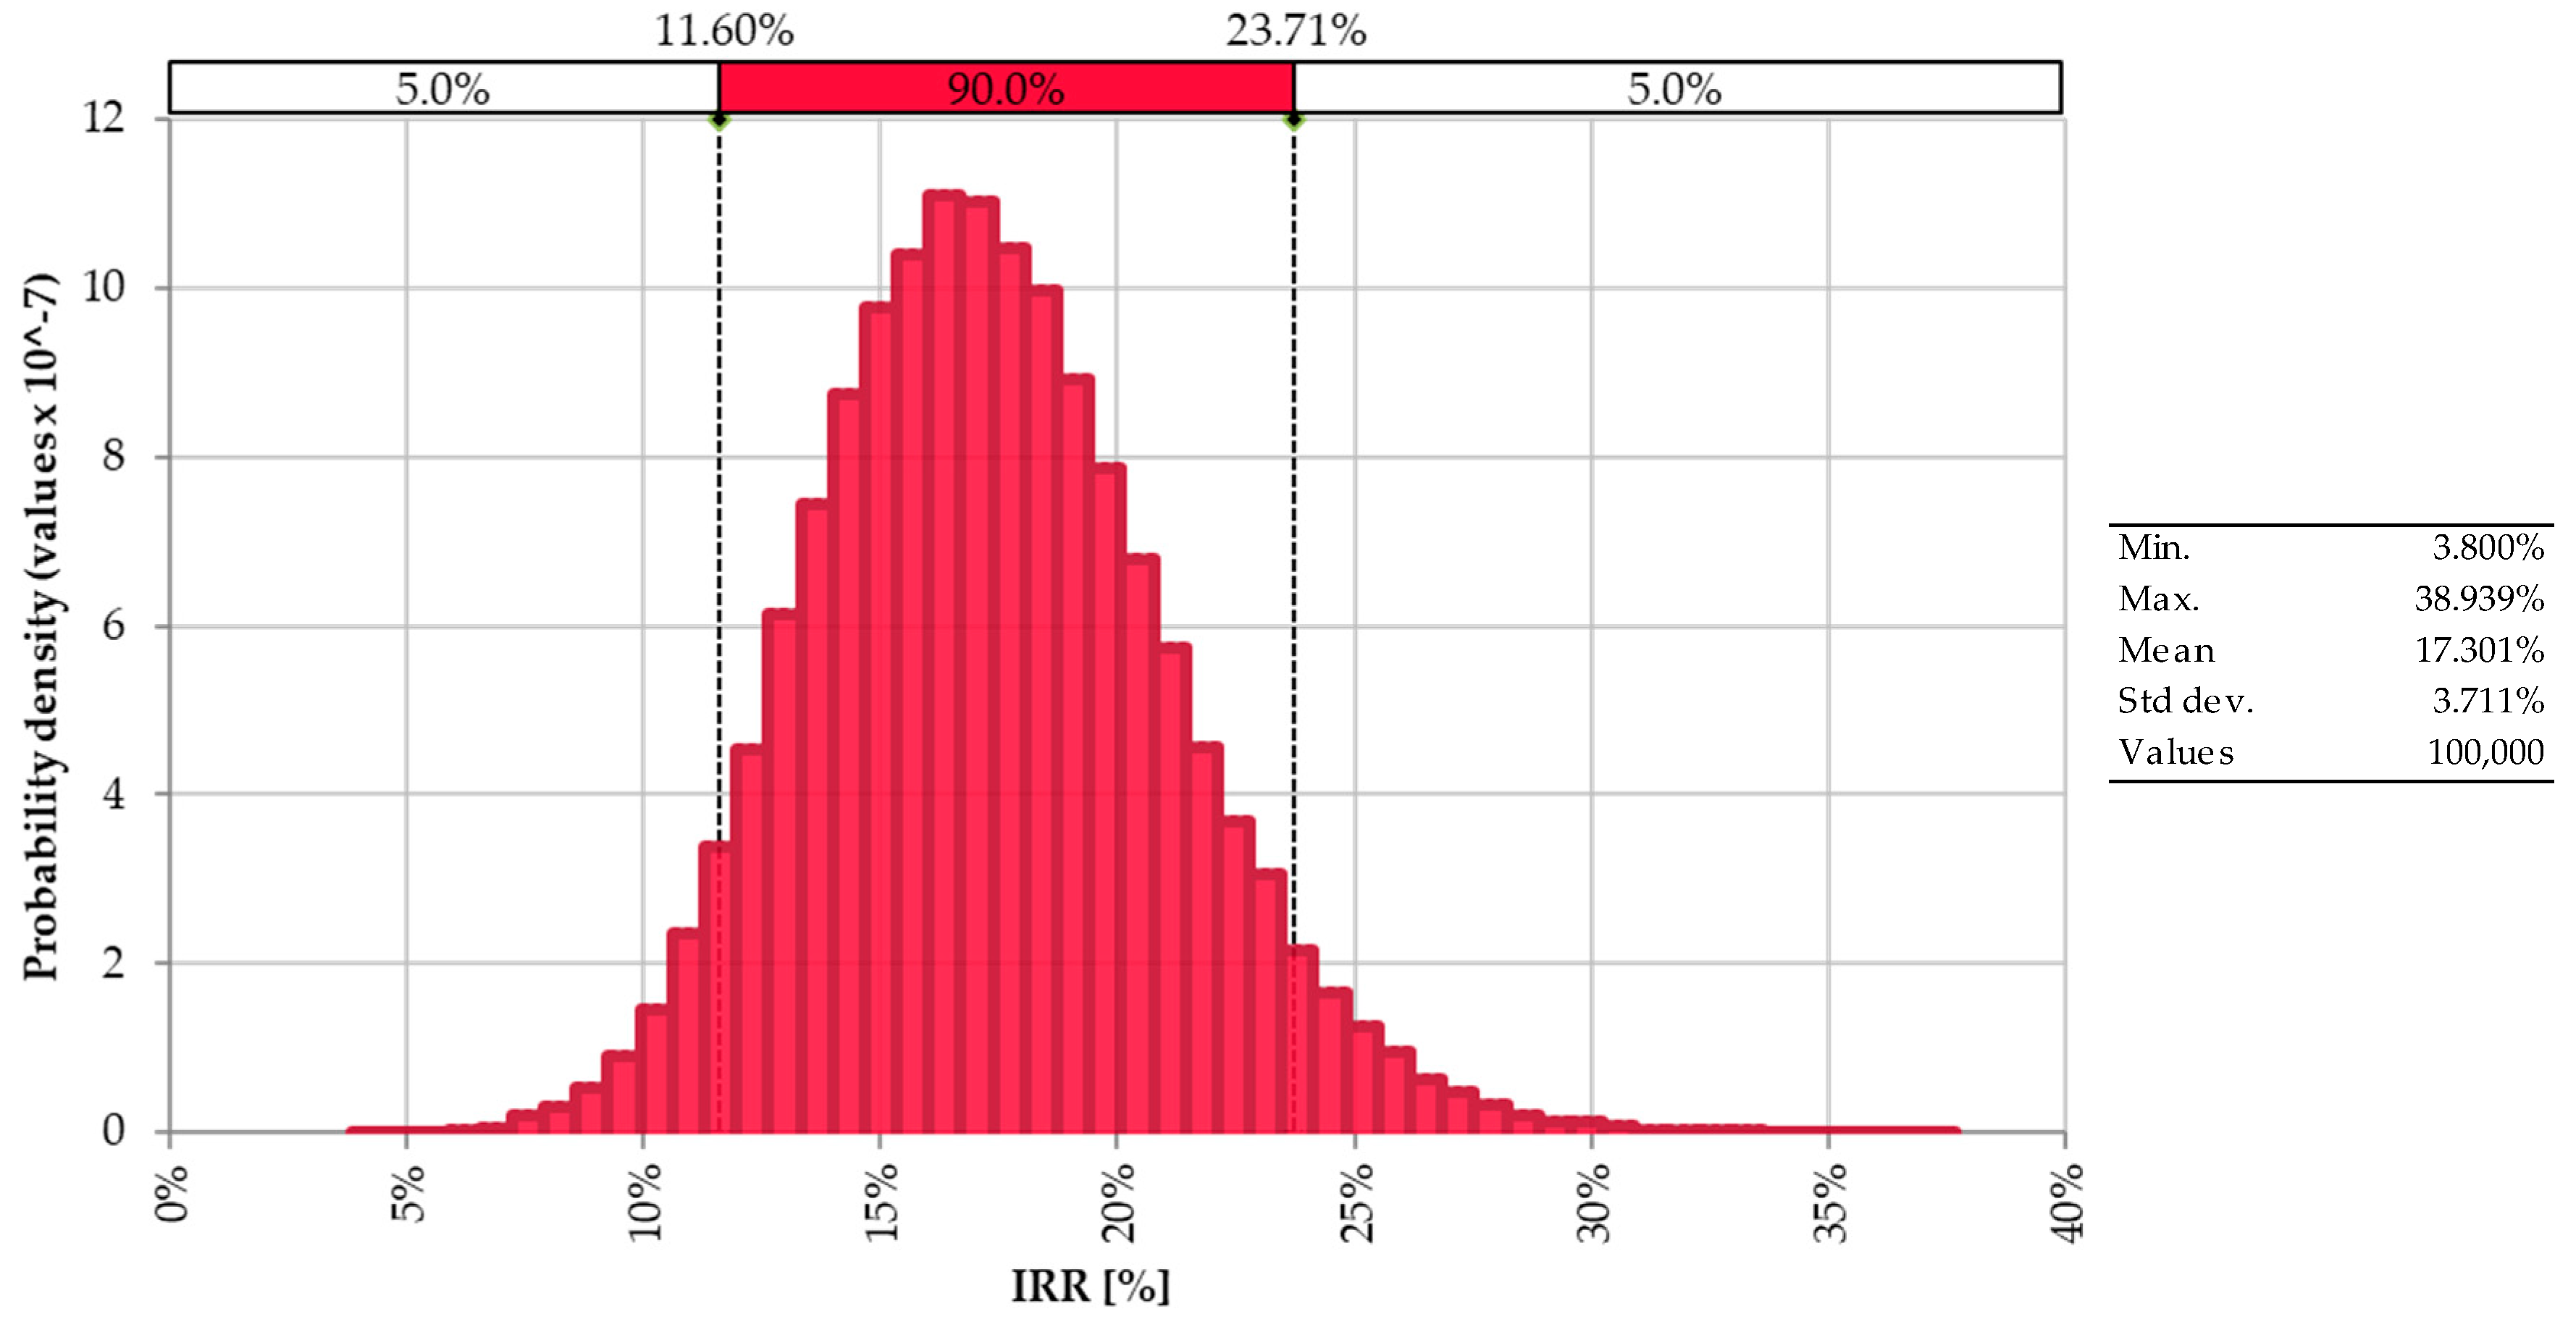
The statistical analysis of the combined variation of capital and operating costs shows a 90% of probability that the NPV at 15 years is between 1.4 and 5.1 M€, with a central value of 3.3 M€. As a consequence, also the IRR shows the trend reported in
Figure 11, with a 90% of probability to be between 11.6% and 23.7% and the maximum probability value for IRR of 17.3%.
6. Conclusions
Air-blown bubbling fluidized-bed biomass gasification technology, preliminarily tested in the FABER pilot-scale unit at the Sotacarbo Research Centre, represents a feasible option for power (or combined heat and power) generation from biomass in small-scale commercial plants. Although the gasification performance of the pilot unit was not optimized yet, their projection to the commercial scale (2 MWe) allows a net present value of about 3.3 M€, an internal rate of return of 17.11% and a payback time of 11 years, against a specific investment of about 6200 €/kWe.
Considering that the economic analysis is prudentially based on a biomass cost of 20 €/t, the sensitivity analysis shows that net present value can be increased up to about 6 M€ if the waste biomass is provided for free and higher economic performance can obviously be achieved in the case of a negative fuel cost (i.e., the owner is paid for biomass disposal). In addition, the sustainability of the investment can be assured only if the plant is operated for at least 6000 h/year.
A financial risk analysis confirms the competitiveness of the technology in case of an unpredictable variation of the key economic parameters, including capital and operating costs. In particular, the analysis shows a probability of 90% of a NPV at 15 years between 1.4 and 5.1 M€ and an IRR between 11.6% and 23.7%.
The technology, preliminary tested in 2018, will be developed during a first experimental campaign scheduled for 2019 and during further campaigns still to be planned. The aim is to verify the operating conditions of the gasification process with different fuels (biomass and coal/biomass blends) and different operating conditions.
Author Contributions
Conceptualization, A.P. (Alberto Pettinau), F.F., A.P. (Andrea Porcu), and M.M.; Methodology, A.P. (Alberto Pettinau), F.F. and A.P. (Andrea Porcu); Software, A.P. (Andrea Porcu) and S.S.; Formal Analysis, A.P. (Andrea Porcu), S.S. and M.M.; Investigation, D.M., A.P. (Andrea Porcu)., S.S. and M.M.; Writing-Original Draft Preparation, A.P. (Alberto Pettinau), F.F., A.P. (Andrea Porcu), S.S., D.M. and M.M.; Writing-Review & Editing, A.P. (Alberto Pettinau), A.P. (Andrea Porcu), S.S., D.M., M.M.; Supervision, A.P. (Alberto Pettinau), F.F. and M.M.; Project Administration, A.P. (Alberto Pettinau).
Funding
This work was carried out within the “Centre of Excellence on Clean Energy” project (CUP: D83C17000370002) funded by the Regional Government of Sardinia (FSC 2014–2020).
Acknowledgments
The authors are grateful to prof. Umberto Arena (University of Campania “Luigi Vanvitelli”) for his essential role in the design and operation of the FABER experimental unit and the whole Sotacarbo plant operation team.
Conflicts of Interest
The authors declare no conflict of interest. The founding sponsors had no role in the design of the study; in the collection, analyses, or interpretation of data; in the writing of the manuscript, and in the decision to publish the results.
References
- International Energy Agency. World Energy Outlook 2018; International Energy Agency: Paris, France, 2018.
- Graciano, J.E.A.; Chachuat, B.; Alves, R.M.B. Enviro-economic assessment of thermochemical polygeneration from microalgal biomass. J. Clean. Prod. 2018, 203, 1132–1142. [Google Scholar] [CrossRef]
- Ozonoh, M.; Anioketea, T.C.; Oboirien, B.O.; Daramola, M.O. Techno-economic analysis of electricity and heat production by co-gasification of coal, biomass and waste tyre in South Africa. J. Clean. Prod. 2018, 201, 192–206. [Google Scholar] [CrossRef]
- Noussan, M.; Roberto, R.; Nastasi, B. Performance Indicators of Electricity Generation at Country Level—The Case of Italy. Energies 2018, 11, 650. [Google Scholar] [CrossRef]
- Zhang, X.; Li, H.; Liu, L.; Bai, C.; Wang, S.; Zeng, J.; Liu, X.; Li, N.; Zhang, G. Thermodynamic and economic analysis of biomass partial gasification process. Appl. Therm. Eng. 2018, 129, 410–420. [Google Scholar] [CrossRef]
- Samiran, N.A.; Jaafar, M.N.M.; Ng, J.H.; Lam, S.S.; Chong, C.T. Progress in biomass gasification—With focus on Malaysian palm biomass for syngas production. Renew. Sustain. Energy Rev. 2018, 62, 1047–1062. [Google Scholar] [CrossRef]
- Yang, S.; Li, B.; Zheng, J.; Kankala, R.K. Biomass-to-Methanol by dual-stage entrained flow gasification: Design and techno-economic analysis based on system modeling. J. Clean. Prod. 2018, 205, 364–374. [Google Scholar] [CrossRef]
- Molino, A.; Larocca, V.; Chianese, S.; Musmarra, D. Biofuels Production by Biomass Gasification: A Review. Energies 2018, 11, 811. [Google Scholar] [CrossRef]
- Samavati, M.; Martin, A.; Santarelli, M.; Nemanova, V. Synthetic Diesel Production as a Form of Renewable Energy Storage. Energies 2018, 11, 1223. [Google Scholar] [CrossRef]
- Arena, U. Process and technological aspects of municipal solid waste gasification. A review. Waste Manag. 2012, 32, 625–639. [Google Scholar] [CrossRef]
- Arena, U.; Di Gregorio, F. Energy generation by air gasification of two industrial plastic wastes in a pilot scale fluidized bed reactor. Energy 2014, 68, 735–743. [Google Scholar] [CrossRef]
- Arena, U.; Di Gregorio, F. Gasification of a solid recovered fuel in a pilot scale fluidized bed reactor. Fuel 2014, 117, 528–536. [Google Scholar] [CrossRef]
- Chianese, S.; Fail, S.; Binder, B.; Rauch, R.; Hofbauer, H.; Molino, A.; Blasi, A.; Musmarra, D. Experimental investigations of hydrogen production from CO catalytic conversion of tar rich syngas by biomass gasification. Catal. Today 2016, 277, 182–191. [Google Scholar] [CrossRef]
- Valderrama Rios, M.L.; Martínez González, A.; Silva Lora, E.E.; Almazán del Olmo, O.A. Reduction of tar generated during biomass gasification: A review. Biomass Bioenergy 2018, 108, 345–370. [Google Scholar] [CrossRef]
- Soomro, A.; Chen, S.; Ma, S.; Xiang, W. Catalytic activities of nickel, dolomite, and olivine for tar removal and H2-enriched gas production in biomass gasification process. Energy Environ. 2018, 29. [Google Scholar] [CrossRef]
- Park, S.; Lee, S.; Jeong, Y.; Han, G.; Seo, Y. Effects of Oxygen Enrichment in Air Oxidants on Biomass Gasification Efficiency and the Reduction of Tar Emissions. Energies 2018, 11, 2664. [Google Scholar] [CrossRef]
- Karl, J.; Pröll, T. Steam gasification of biomass in dual fluidized bed gasifiers: A review. Renew. Sustain. Energy Rev. 2018, 98, 64–78. [Google Scholar] [CrossRef]
- Lopes Motta, I.; Toscano Miranda, N.; Maciel Filho, R.; Wolf Maciel, M.R. Biomass gasification in fluidized beds: A review of biomass moisture content and operating pressure effects. Renew. Sustain. Energy Rev. 2018, 94, 998–1023. [Google Scholar] [CrossRef]
- Mirmoshtaghi, G.; Li, H.; Thorin, E.; Dahlquist, E. Evaluation of different biomass gasification modeling approaches for fluidized bed gasifiers. Biomass Bioenergy 2016, 91, 69–82. [Google Scholar] [CrossRef]
- La Villetta, M.; Costa, M.; Massarotti, N. Modelling approaches to biomass gasification: A review with emphasis on the stoichiometric method. Renew. Sustain. Energy Rev. 2017, 74, 71–88. [Google Scholar] [CrossRef]
- Baruah, D.; Baruah, D.C. Modeling of biomass gasification: A review. Renew. Sustain. Energy Rev. 2014, 39, 806–815. [Google Scholar] [CrossRef]
- Miedema, J.H.; van der Windt, H.J.; Moll, H.C. Opportunities and Barriers for Biomass Gasification for Green Gas in the Dutch Residential Sector. Energies 2018, 11, 2969. [Google Scholar] [CrossRef]
- Cormos, C.C. Techno-Economic Evaluations of Copper-Based Chemical Looping Air Separation System for Oxy-Combustion and Gasification Power Plants with Carbon Capture. Energies 2018, 11, 3095. [Google Scholar] [CrossRef]
- Tola, V.; Pettinau, A. Power generation plants with carbon capture and storage: A techno-economic comparison between coal combustion and gasification technologies. Appl. Energy 2014, 113, 1461–1474. [Google Scholar] [CrossRef]
- Arena, U.; Di Gregorio, F.; Santonastasi, M. A techno-economic comparison between two design configurations for a small scale, biomass-to-energy gasification based system. Chem. Eng. J. 2010, 162, 580–590. [Google Scholar] [CrossRef]
- Chang, C.T.; Costa, M.; La Villetta, M.; Macaluso, A.; Piazzullo, D.; Vanoli, L. Thermo-economic analyses of a Taiwanese combined CHP system fuelled with syngas from rice husk gasification. Energy 2019, 167, 766–780. [Google Scholar] [CrossRef]
- Pettinau, A.; Dobó, Z.; Köntös, Z.; Zsemberi, A. Experimental characterization of a high sulfur Hungarian brown coal for its potential industrial applications. Fuel Process. Technol. 2014, 122, 1–11. [Google Scholar] [CrossRef]
- Pettinau, A.; Calì, G.; Loria, E.; Miraglia, P.; Ferrara, F. The Sotacarbo gasification pilot platform: Plant overview, recent experimental results and potential future integrations. Appl. Therm. Eng. 2015, 74, 2–9. [Google Scholar] [CrossRef]
- Cau, G.; Tola, V.; Pettinau, A. A steady state model for predicting performance of small-scale up-draft coal gasifiers. Fuel 2015, 152, 3–12. [Google Scholar] [CrossRef]
- Palisade Corporation. @RISK User’s Guide—Risk Analysis and Simulation Add-In for Microsoft® Excel; Palisade Corporation: Ithaca, NY, USA, 2015. [Google Scholar]
- Parrillo, F.; Calì, G.; Maggio, E.; Pettinau, A.; Annoscia, O.; Saponaro, A.; Arena, U. Fluidized bed gasification of biomass: Design and operating criteria from a pilot scale study. In Proceedings of the 6th International Symposium on Energy from Biomass and Waste-Venice 2016, Venice, Italy, 14–17 November 2016. [Google Scholar]
- Berdugo Vilches, T.; Marinkovic, J.; Seemann, M.; Thunman, H. Comparing Active Bed Materials in a Dual Fluidized Bed Biomass Gasifier: Olivine, Bauxite, Quartz-Sand, and Ilmenite. Energy Fuels 2016, 30, 4848–4857. [Google Scholar] [CrossRef]
- Molino, A.; Chianese, S.; Musmarra, D. Biomass gasification technology: The state of the art overview. J. Energy Chem. 2016, 25, 10–25. [Google Scholar] [CrossRef]
- Yu, H.; Zhang, Z.; Li, Z.; Chen, D. Characteristics of tar formation during cellulose, hemicellulose and lignin gasification. Fuel 2014, 118, 250–256. [Google Scholar] [CrossRef]
- Gredinger, A.; Spörl, R.; Scheffknecht, G. Comparison measurements of tar content in gasification systems between an online method and the tar protocol. Biomass Bioenergy 2018, 111, 301–307. [Google Scholar] [CrossRef]
- Mureddu, M.; Dessì, F.; Orsini, A.; Ferrara, F.; Pettinau, A. Air- and oxygen-blown characterization of coal and biomass by thermogravimetric analysis. Fuel 2018, 212, 626–637. [Google Scholar] [CrossRef]
- Pio, D.T.; Tarelho, L.A.C.; Matos, M.A.A. Characteristics of the gas produced during biomass direct gasification in an autothermal pilot-scale bubbling fluidized bed reactor. Energy 2017, 120, 915–928. [Google Scholar] [CrossRef]
- Mott MacDonald Group. Costs of Low-Carbon Generation Technologies; Committee on Climate Change: London, UK, 2011.
- Goldstein, L.; Hedman, B.; Knowles, D.; Freedman, S.I.; Woods, R.; Schweizer, T. Gas-Fired Distributed Energy Resource Technology Characterizations; Technical report NREL/TP-620-34783; U.S. Department of Energy, National Renewable Energy Laboratory: Golden, CO, USA, 2003.
- European Central Bank, Statistical Data Warehouse. Available online: http://sdw.ecb.europa.eu/browse.do?node=9691296 (accessed on 29 November 2018).
- Organisation for Economic Co-operation and Development (OECD). Producer Price Indices (PPI). Available online: https://data.oecd.org/price/producer-price-indices-ppi.htm (accessed on 29 November 2018).
- International Renewable Energy Agency (IRENA). Biomass for Power Generation; International Renewable Energy Agency (IRENA): Bonn, Germany, 2012.
- Ricerche e Consulenze per l’Economia e la Finanza (REF). Il Costo Della Fornitura di Energia Elettrica Pagato Dalle Imprese in Provincia di Viterbo; Camera di Commercio di Viterbo: Viterbo, Italy, 2011; (In Italian). Available online: http://www.vt.camcom.it/Pb/Filez/1319553161K356251.pdf (accessed on 4 January 2019).
- Sgroi, F.; Di Trapani, A.M.; Foderà, M.; Testa, R.; Tudisca, S. Economic assessment of Eucalyptus (spp.) for biomass production as alternative crop in Southern Italy. Renew. Sustain. Energy Rev. 2015, 44, 614–619. [Google Scholar] [CrossRef]
- Pettinau, A.; Ferrara, F.; Tola, V.; Cau, G. Techno-economic comparison between different technologies for CO2-free power generation from coal. Appl. Energy 2017, 193, 426–439. [Google Scholar] [CrossRef]
- Ministero dello Sviluppo Economico (Italian Ministry of Economic Development). Definizione del Nuovo Regime di Sostegno per la Cogenerazione ad Alto Rendimento (Decree 5 September 2011). Gazzetta Ufficiale della Repubblica Italiana 2011; (In Italian). Available online: http://www.gazzettaufficiale.it/eli/id/2011/09/19/11A12047/sg (accessed on 4 January 2019).
- Gestore dei Mercati Energetici (Italian Energy Market Managing Authority). Available online: http://www.mercatoelettrico.org (accessed on 29 November 2018).
- Zio, E. The future of risk assessment. Reliab. Eng. Syst. Saf. 2018, 177, 176–190. [Google Scholar] [CrossRef]
- Pérez-López, P.; Montazeri, M.; Feijoo, G.; Moreira, M.T.; Eckelman, M.J. Integrating uncertain-ties to the combined environmental and economic assessment of algal biorefineries: A Monte Carlo approach. Sci. Total Environ. 2018, 626, 762–775. [Google Scholar] [CrossRef]
- Liu, J.; Jin, F.; Xie, Q.; Skitmore, M. Improving risk assessment in financial feasibility of international engineering projects: A risk driver perspective. Int. J. Proj. Manag. 2017, 35, 204–211. [Google Scholar] [CrossRef]
Figure 1.
Simplified scheme of the FABER plant.
Figure 1.
Simplified scheme of the FABER plant.
Figure 2.
Simplified scheme of the FABER bubbling fluidized-bed gasifier.
Figure 2.
Simplified scheme of the FABER bubbling fluidized-bed gasifier.
Figure 3.
Overview of the FABER unit.
Figure 3.
Overview of the FABER unit.
Figure 4.
Percentage share of the operating costs.
Figure 4.
Percentage share of the operating costs.
Figure 5.
Cumulated cash flow of the investment.
Figure 5.
Cumulated cash flow of the investment.
Figure 6.
Net present value (NPV) after 15 years as a function of the biomass price.
Figure 6.
Net present value (NPV) after 15 years as a function of the biomass price.
Figure 7.
NPV after 15 years as a function of the annual plant availability.
Figure 7.
NPV after 15 years as a function of the annual plant availability.
Figure 8.
Probability density curves of the effects of capital costs on NPV.
Figure 8.
Probability density curves of the effects of capital costs on NPV.
Figure 9.
Probability density curves of the effects of operating costs on NPV.
Figure 9.
Probability density curves of the effects of operating costs on NPV.
Figure 10.
Probability density curve of the NPV varying both capital and operating costs.
Figure 10.
Probability density curve of the NPV varying both capital and operating costs.
Figure 11.
Probability density curve of the internal rate of return (IRR) varying both capital and operating costs.
Figure 11.
Probability density curve of the internal rate of return (IRR) varying both capital and operating costs.
Table 1.
Primary biomass characterization (wet and dry basis).
Table 1.
Primary biomass characterization (wet and dry basis).
| Parameters | (i)
Cypress
(Wet) | (ii)
Cypress
(Dry) | Relative Standard Deviation | Standard |
|---|
| Proximate analysis (% by weight) |
| Moisture | 10.74 | 0.00 | 0.02% | ASTM D 5142-04 |
| Fixed carbon | 20.91 | 23.43 | 0.02% | by difference |
| Volatiles | 65.35 | 73.23 | 0.02% | ASTM D 5142-04 |
| Ash | 2.98 | 3.34 | 0.02% | ASTM D 5142-04 |
| Ultimate analysis (% by weight) |
| Total carbon | - | 51.47 | 0.5% | ASTM D 5373-02 |
| Hydrogen | - | 5.81 | 1.0% | ASTM D 5373-02 |
| Nitrogen | - | 0.50 | 0.5% | ASTM D 5373-02 |
| Sulphur | - | 0.00 | 1.0% | ASTM D 4239-05 |
| Oxygen | - | 38.88 | - | by difference |
| Ash | | 3.34 | 0.02% | ASTM D 5142-04 |
| Calorimetric analysis (MJ/kg) |
| Higher heating value | - | 18.98 | 0.05% | ISO 1928:1995 |
Table 2.
Chemical composition and physical properties of the raw olivine.
Table 2.
Chemical composition and physical properties of the raw olivine.
| Parameter | Olivine |
|---|
| Chemical composition (% by weight) |
| SiO2 | 39–42 |
| MgO | 48–50 |
| FeO + Fe2O3 | 8–10.5 |
| CaO | <0.4 |
| Al2O3 | 0.8 |
| L.O.I. (Loss of Ignition) | 0.2 |
| Physical properties |
| Bulk density (kg/m3) | 1400–1550 |
Table 3.
Average operating conditions and general performance of the FABER unit.
Table 3.
Average operating conditions and general performance of the FABER unit.
| Parameter | Value |
|---|
| Equivalence ratio | 0.38 |
| Air/fuel mass ratio (1) | 1.64 |
| Biomass flow rate (kg/h) | 75.00 |
| Fluidization velocity (m/s) | 0.55 |
| Secondary air (kg/h) | 0.00 |
| Inlet air temperature (°C) | 377.55 |
| Steady-state bed temperature (°C) | 927.70 |
| Syngas outlet temperature (°C) | 717.55 |
| Specific syngas flow (1,2) (Nm3/kg) | 1.78 |
| Specific syngas flow (1,2) (kg/kg) | 2.13 |
| Syngas lower heating value (MJ/Nm3) | 4.50 |
| Specific syngas energy (2) (kWh/kg) | 2.22 |
| Carbon conversion efficiency | 0.61 |
| Cold gas efficiency | 0.46 |
Table 4.
Clean syngas composition (% by volume, dry basis).
Table 4.
Clean syngas composition (% by volume, dry basis).
| Component | Concentrations (% by Volume) | Standard Deviation (%) |
|---|
| N2 (by difference) | 55.81 | - |
| CO2 | 13.13 | 0.280 |
| CO | 16.59 | 0.065 |
| H2 | 11.04 | 0.250 |
| CH4 | 3.42 | 0.165 |
Table 5.
Capital costs (k€).
Table 5.
Capital costs (k€).
| Items | Cost |
|---|
| Consultancy/design | 650.4 |
| Civil works | 1409.3 |
| Fuel handling/preparation | 617.7 |
| Electrical/balance of plant | 433.6 |
| Converter system (gasifier) | 6753.8 |
| Total gasifier | 9864.8 |
| Prime mover (CHP IC) | 2732.7 |
| Total Capital cost | 12,597.5 |
Table 6.
Power consumption and costs.
Table 6.
Power consumption and costs.
| Items | Cost |
|---|
| Feeding system (MWh/year) | 9.4 |
| Gasifier section (MWh/year) | 401.4 |
| Cleanup section (MWh/year) | 85.4 |
| Water treatment section (MWh/year) | 41.8 |
| Auxiliaries (MWh/year) | 1.9 |
| Total yearly electric energy consumptions (MWh/year) | 539.9 |
| Cost of electrical energy (€/MWh) | 170 |
| Total yearly electric energy costs (k€/year) | 91.8 |
Table 7.
Annual operating costs (k€/year).
Table 7.
Annual operating costs (k€/year).
| Personnel | 120.0 |
| Power consumption | 91.8 |
| Biomass fuel | 367.5 |
| Inertization system | 26.5 |
| Water treatment | 182.0 |
| Waste disposal | 171.5 |
| Consumables | 35.0 |
| Maintenance | 629.9 |
| Total O&M cost | 1624.2 |
| Hourly cost (€/h) | 232.0 |
Table 8.
Combined heat power (CHP) generation of the plant.
Table 8.
Combined heat power (CHP) generation of the plant.
| Plant availability (h/year) | 7000 |
| Syngas thermal power (MWth) | 5.23 |
| Syngas thermal energy (MWhth/year) | 36,493 |
| CHP electric power (MWe) | 2.03 |
| CHP electric energy (MWhe/year) | 14,232 |
| CHP thermal power (MWth) | 1.96 |
| CHP thermal energy (MWhth/year) | 13,696 |
Table 9.
Revenues from White Certificates.
Table 9.
Revenues from White Certificates.
| CHP power (MWe) | 2.03 |
| Primary energy savings (MWh/year) | 9663 |
| Number of White Certificates (toe/year) | 1163 |
| Value of a White Certificate (€/toe) | 276.00 |
| Income from White Certificates (k€/year) | 321.0 |
Table 10.
Revenues from electrical power production.
Table 10.
Revenues from electrical power production.
| Yearly energy consumption (MWhe/year) | 540 |
| Yearly energy production (MWhe/year) | 14,232 |
| Energy purchase cost (€/MWhe) | 170 |
| Energy sale price (€/MWhe) | 61 |
| Savings from energy purchase avoided cost (k€/year) | 91.8 |
| Income from energy sale (k€/year) | 835.2 |
Table 11.
Savings from thermal power production.
Table 11.
Savings from thermal power production.
| Yearly thermal energy production (MWhth/year) | 13,695 |
| LPG consumption from separate generation (l/h) | 296 |
| LPG cost (€/l) | 0.95 |
| Savings from avoided fuel purchase (k€/year) | 2187.8 |
Table 12.
Main financial assumptions.
Table 12.
Main financial assumptions.
| Plant operating life (year) | 15 |
| Amortization period (year) | 10 |
| Bank loan (%) | 75% |
| Interest rate (%) | 6.14% |
| Senior debt refunding period (year) | 10 |
| Inflation rate (%) | 2.00% |
| Discount rate (%) | 8.00% |
| Income tax (%) | 24.00% |
| Regional tax on productive activities (%) | 2.93% |
Table 13.
Main financial results.
Table 13.
Main financial results.
| Payback time (year) | 11 |
| NPV (k€) | 3270.3 |
| IRR (%) | 17.1% |
| LCOE (€/MWh) | 124 |
© 2019 by the authors. Licensee MDPI, Basel, Switzerland. This article is an open access article distributed under the terms and conditions of the Creative Commons Attribution (CC BY) license (http://creativecommons.org/licenses/by/4.0/).

 ,
, 


