1. Introduction
The term “cogeneration” refers to the simultaneous production of process heat and electricity from a single energy input. All types of power plants can be employed (e.g., steam power plants, gas turbines, combined cycle power plants, internal combustion engines); the extracted heat largely varies in entity and temperature depending on technology, size, and operation parameters.
Such a system has valuable properties to enhance the efficiency of fuel use: the combined production of electricity and heat turns out to be more efficient than the separate production of these two forms of energy. These qualities are a fact, but difficulty in evaluating the efficiency of combined heat and power CHP has been observed since the breakout of this technology. Havelský [
1] pointed out the problem back in 1999; a strict regulation of such plants had thus to be created. In the European Union, a well-structured incentive scheme made a contribution to the growth of cogeneration. In 2004, the EC Directive 2004/8 [
2] introduced the concept of high-efficiency cogeneration (HEC); the Annexes II and III of the Directive provided it with a quantitative definition establishing that a cogeneration production characterized by primary energy savings (PES) of at least 10% compared to the reference values for separate production (or >0% for small scale cogeneration units, with installed capacity below 1 MWe, and for micro-cogeneration units) is highly efficient and has the right of access to incentives. After the publication of the Directive, the Commission Decision of 19 November 2008 [
3] stated that a cogeneration unit operates in full cogeneration mode when the maximum technically possible heat recovery is attained and all produced electricity is thus considered CHP electricity. When a plant does not operate in full cogeneration mode, it is required to distinguish the amount of electricity and heat not produced under cogeneration mode from CHP electricity and heat, which are the only quantities able to receive incentives. The Directive 2017/27/EU [
4] repealed Directive 2004/8, confirming all of its points in the Annexes I and II.
Italy implemented the Directive by enacting three decrees [
5,
6,
7], followed by the publication of ministerial guidelines [
8]. The authors studied the transposition of the Directive 2004/8 EC in the Italian context, referring to the methodology indicated in the abovementioned guidelines for dealing with cogeneration units in Reference [
9]. That paper was an opportunity to better clarify the methodology to evaluate plants in a high-efficiency cogeneration framework and do the groundwork for estimating their primary energy savings, in a similar fashion as the studies carried out by Kanoglu and Dincer [
10]. Starting from this, in Reference [
11], the authors assessed the performance of Italian cogeneration plants in terms of the effects of the power loss coefficient on CHP electricity and power-to-heat ratio. Plants with a non-zero power loss coefficient display a lower CHP electricity production, in an equivalent total electric output.
The calculation of the power loss coefficient and the definition of the reference efficiency are critical aspects of the implementation of the Directive, as verified by Gvozdenac et al. [
12]; they studied an actual 150 MW capacity CCGT plant of independent power producers (IPPs) in Thailand, and the investigation showed that the reference value of high-efficiency cogeneration has a large effect on the percentage of CHP electricity output. The impact of the power loss coefficient is not as large, but it influences CHP electricity and CHP fuel energy. These factors are crucial in determining a plant’s profitability, so Gvozdenac et al. [
12] proposed a modified procedure for the assessment of a CHP plant’s efficiency in line with the work of Urošević et al. [
13].
Coupling an industrial facility with a combined heat and power system in order to increase the overall efficiency of the plant is now very common practice. For instance, Wang et al. [
14] optimized the performance of different cogeneration plants to be implemented in the cement industry in order to recover the available waste heat. The authors reviewed several industry sectors, identifying the most appropriate CHP technology for each of them according to the facility size. The pulp and paper industry is characterized by large electric and heat consumptions, and this means that it lends itself to the implementation of cogeneration.
The Pulp and Paper Industry in Europe: Production and Energy Consumptions
Pulp is a cellulose-based material produced by separating lignin and cellulose fibers from wood and it is the basic constituent for the preparation of paper. The process of separation is chemical when pulp is obtained by cooking chipped wood in an autoclave, with the addition of sodium sulphate (Kraft or sulphate pulping process) or magnesium bisulphite (sulphite pulping process); the process is mechanical when fibers are separated from the trunk by means of an abrasive rotary grindstone. The Joint Research Centre (JRC) of the European Commission released the BAT Reference Document for the Production of Pulp, Paper, and Board [
15] to make each of the above processes more efficient and CHP systems, based on different thermal power plants, are one of the main available techniques in this respect.
According to the data illustrated in this document, Europe is one of the main actors in the pulp and paper industry. The annual production of pulp in Europe was about 41.0 million t/y, constituting 22% of world’s total wood pulp production; this made Europe the second largest pulp producer. Finland and Sweden together covered 57% of European total wood pulp production. Paper and board production totaled 390.9 million t/y worldwide; 25.3% of this amount was produced in Europe. Italy was one of the leading paper and paperboard producers (9.5 million t/y). The number of paper mills in Europe was 887, located mainly in Italy, Germany, France, Spain, and the UK [
15].
In order to clarify how much energy this industry sector consumes, it is possible to refer to the IEA’s “Energy Technology Perspectives” 2017 report [
16], which states that Organisation for Economic Co-operation and Development (OECD) Europe’s final energy use by pulp, paper, and printing, a quantity adding up all energy supplied to the final consumer, was 1.36 EJ in the year 2014, representing 1.7% of the world’s total industry energy consumption. The electric and thermal energy demand by the pulp and paper industry in Europe is bound to increase. Szabó et al. [
17] elaborated a world model to reproduce technology and market developments of the pulp and paper industry (PULPSIM) starting from current trends. According to their results, paper demand in Europe is expected to grow up to 120 million t/y by 2030. At the national level, the most recent data regarding the Italian pulp and paper industry come from Assocarta’s “Rapporto ambientale dell’industria cartaria” 2016 report [
18] and are dated for 2014. According to this document, 154 paper facilities are present on Italian territory; data concerning consumption and impact are reported in
Table 1.
The pulp and paper industry is obviously responsible for the emission of greenhouse gases in the atmosphere; CO2 emissions from energy production are considered direct, those coming from energy purchase are considered indirect.
The need for an environmental optimization of paper mills is a long-felt concern, since Thompson’s [
19] works on paper mills. Monte et al. [
20] analyzed different paper industry production processes, proposing, for each of them, beneficial waste management approaches. Furthermore, considering the issue of emissions from a paper industry facility, Bhander and Jozewicz [
21] developed a model to estimate changes in emission when switching fuel, installing air pollution equipment, and implementing energy efficiency measures. Combined heat and power systems make a contribution when it comes to complying with the Kyoto Protocol as well: as observed by Chen et al. [
22], the pulp and paper industry is characterized by high fossil energy consumption which is strictly linked to high emission of greenhouse gases. In the wake of this, Boharb et al. [
23] outlined a methodology to perform energy audits in the pulp and paper industry.
The perception of the need for improved efficiency is now well established in the management of production processes; so, the harsh international competition to which the pulp and paper industry is subjected made energy management a necessary practice for preserving competitiveness. Kong et al. [
24] reviewed different energy-efficient technologies to be implemented in the paper industry, creating a data collection useful to assess the most suited ones to each process: CHP systems are perfectly placed in this context, having the ability to improve the global efficiency of the plant. Cogeneration systems, with their improved overall efficiency, can also be a solution to the problems raised by Posch et al. [
25].
Returning to the European case, the Joint Research Centre estimates, in its BAT Reference Document for the paper industry, that CHP systems enable paper mills to save about 30% of the energy consumption of a separate production conventional technology and to reduce greenhouse gas emissions. Therefore, the present paper aims at proposing and comparing the most efficient CHP setups which can be employed in the pulp and paper industry, taking into consideration a particular industrial reality. Results can be compared to those achieved by Shabbir et al. [
26], taking into account the different production processes considered.
2. Methods
2.1. Quantitative Definition of the Analysed Process
Table 2 displays electric (
Cs,e) and thermal (
Cs,t) specific consumptions for a fully-integrated bark-fired pulp and paper mill, according to what is reported in the above-mentioned JRC BAT Document [
15].
While electricity is employed to operate machines, heat, in the form of steam, is deployed in both pulp production and drying. With this regard, this paper proposes a methodology to analyze different CHP technologies potentially suitable for paper mills and evaluated in an HEC framework.
According to Reference [
18], the paper industry accounts for 154 facilities in Italy with an overall paper production of 56,000 t/y. Supposing a total of 7200 operating hours (equivalent to 300 days a year), the average hourly production of a single Italian paper mill can be set around 8 t/h (
).
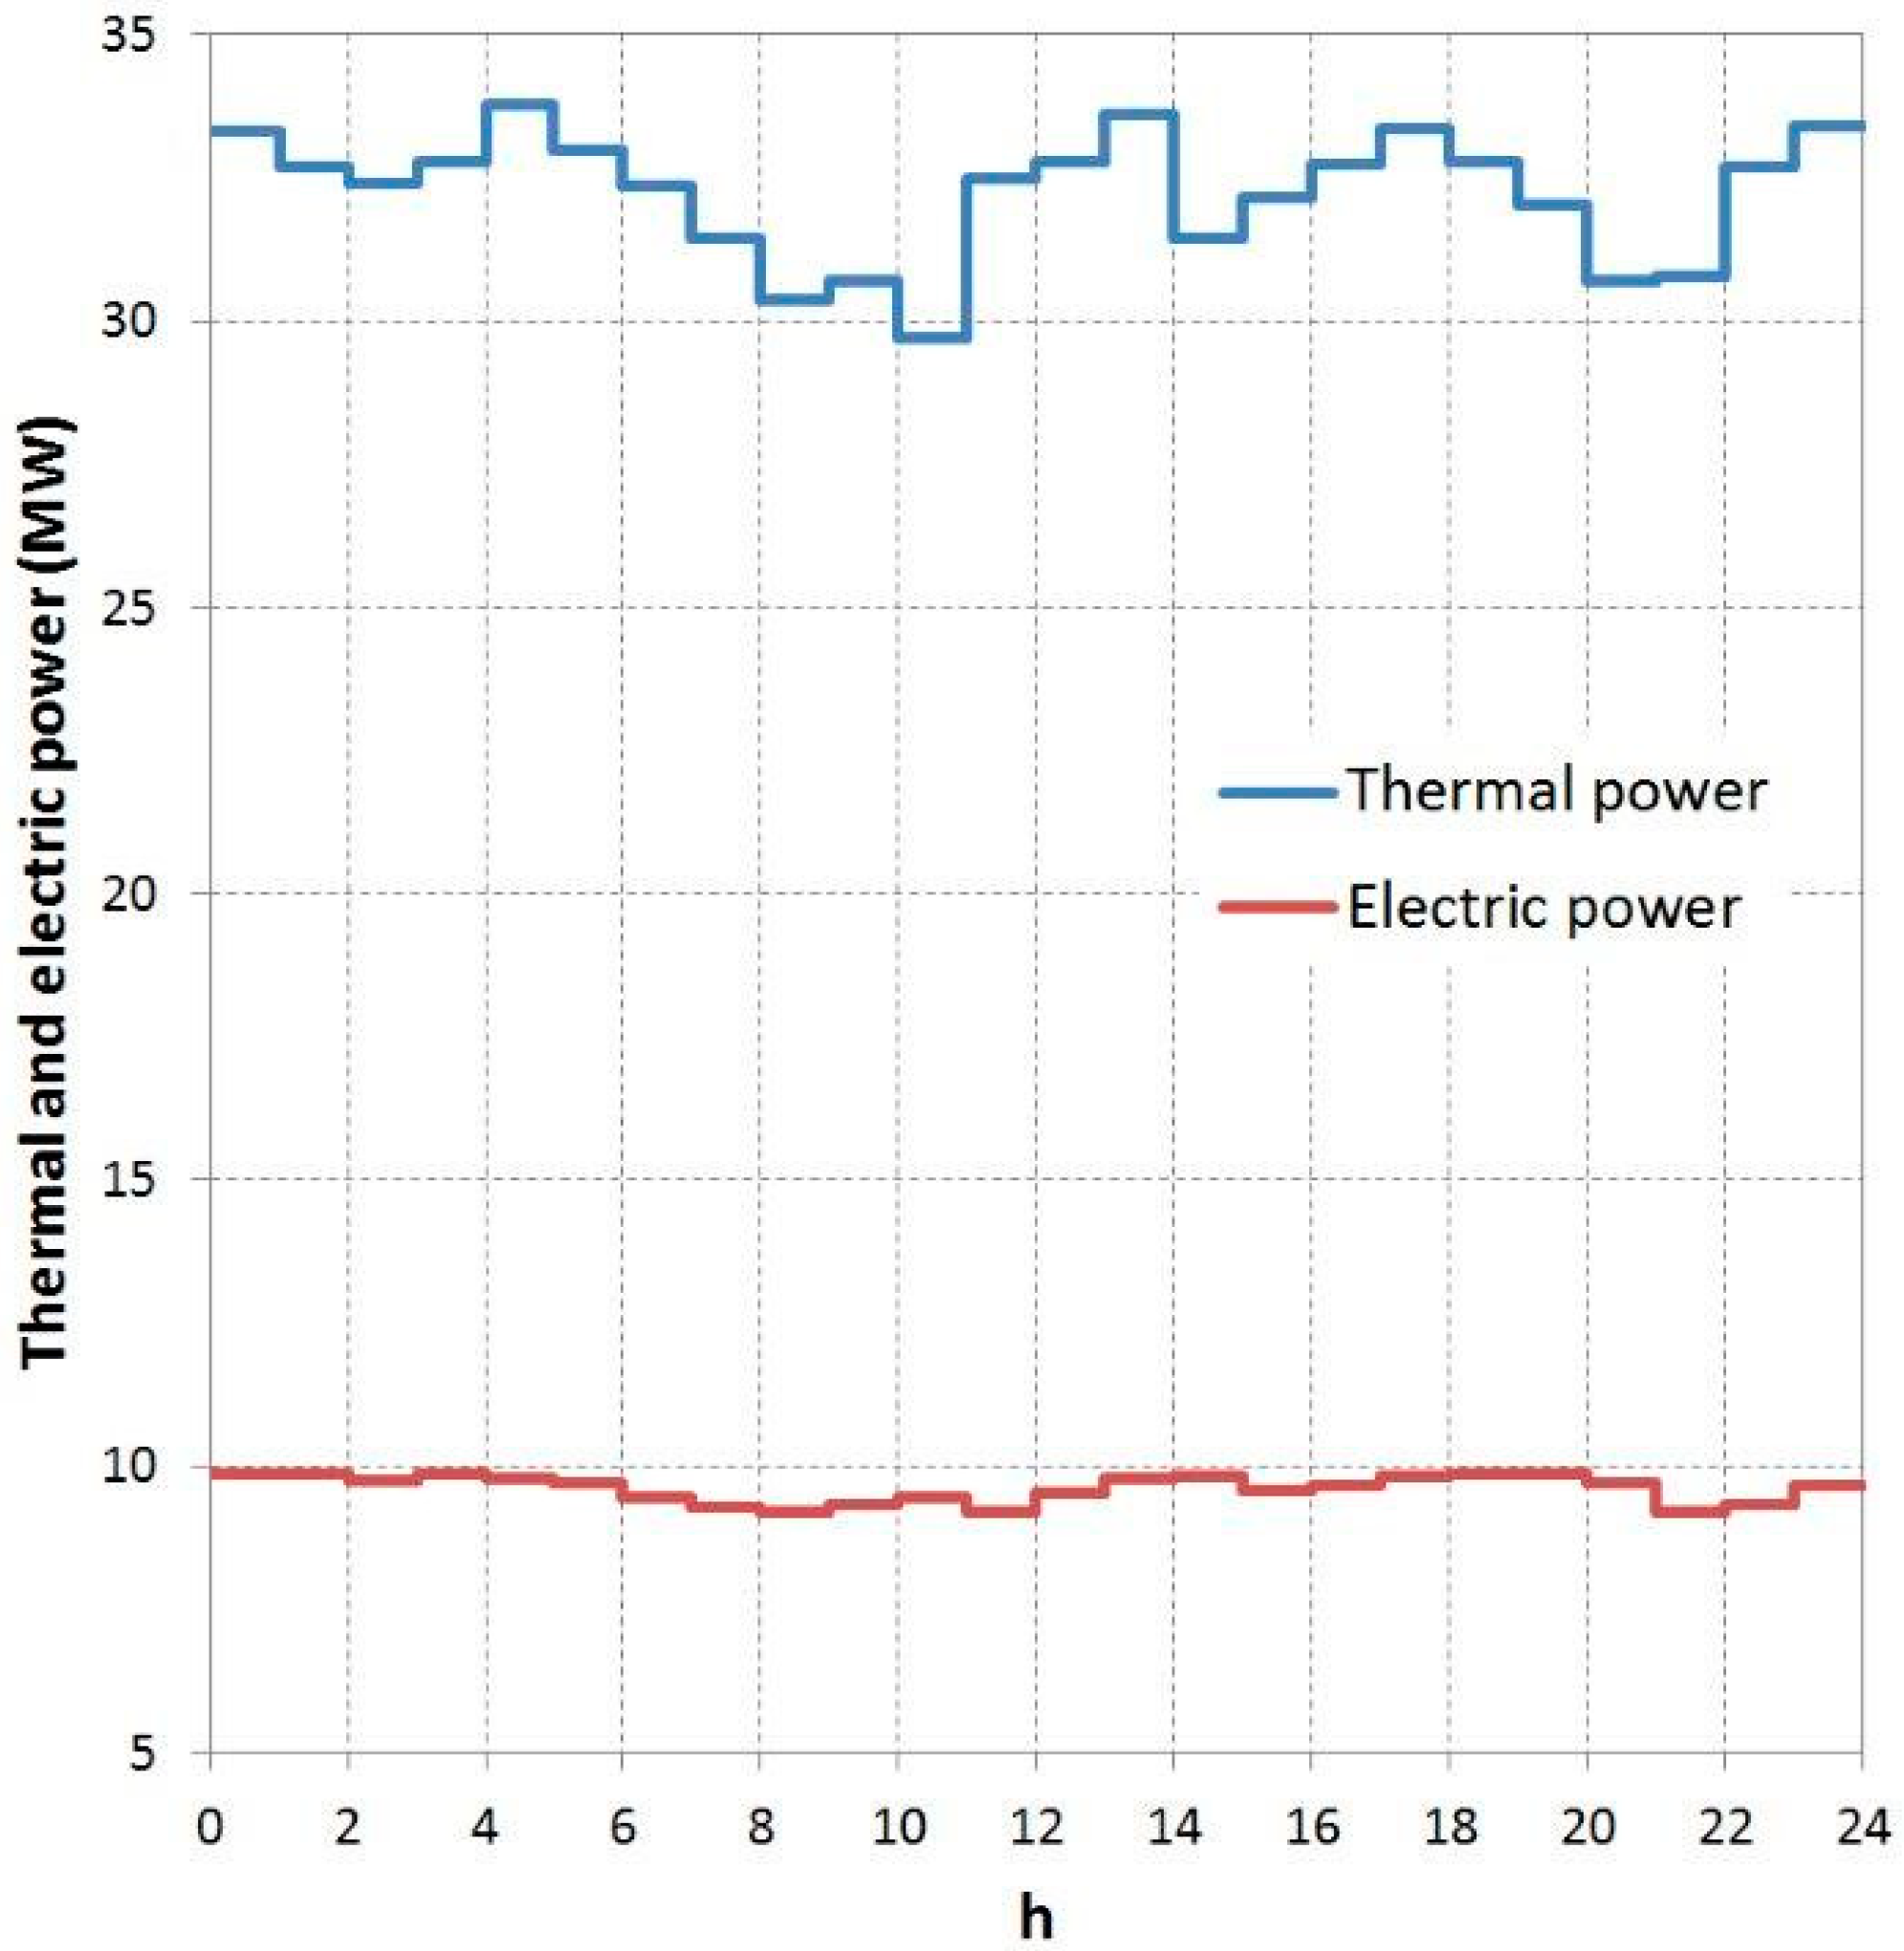
The related electric and thermal power requirements were derived from a year-long measurement campaign conducted for a particular Italian industrial reality. Thus, the whole facility operation refers to this particular year. This facility makes use of electricity provided by a power plant, steam from the power plant and natural gas to satisfy the heat demand; therefore, the days for which all three values were able to be measured were the only ones accounted for. About 33% of the thermal demand is satisfied by the thermal power plant steam; the remainder is fulfilled by natural gas burnt in a boiler. It is known that the conditions of the steam provided to the paper mill are a pressure of 8 bar and a temperature of 170 °C. The considered Italian mill consists only in a continuous papermaking machine, which has the purpose of forming sheets starting from pulp produced in batches; this machine requires steam at a specific temperature and pressure condition, which implies a single heat extraction. It is also known that the enthalpy of the returned condensate is 417.5 kJ/kg. The sum of these values allows for the calculation of the total amount of heat required by the paper production process. The daily electric load diagram was derived assuming that the electric demand is constant over a period of 1 h. Operating days were divided into “stationary” days (when the average hourly production was around the average value of produced paper in this facility) and “abnormal” days (when the average hourly production deviated from that value, for example because of failures or maintenance). The above measurements allowed for the construction of the typical day consumption diagram, reported in
Figure 1, where only stationary days were taken into consideration and a paper production of 8 t/h was assumed. The electric and thermal power demand (then used for power plant design) were calculated by averaging over the abovementioned load diagram:
Pe = 9.6 MWe and
Pt = 32 MWt. Starting from these values it is possible to estimate the specific electric and thermal power consumptions of the plant:
as power is the product of mass flow rate by the specific consumption of the paper mill.
Falling in the ranges reported in
Table 2, the obtained values can be considered validated.
Table 3 sums up the input data common to all plant types.
The following subsections illustrate the procedures to carry out a design, an HEC and economic analysis of the CHP technologies taken into consideration.
2.2. Operation Mode and Simulation of the CHP Units
When designing a CHP plant, it is essential to set a mode of operation: in fact, a CHP plant can be operated satisfying electric demands or thermal demands.
A plant satisfying electric demands can cover the user electric demand at full load. In this configuration, however, the heat demand might not be fully covered, and an auxiliary boiler is needed to fulfill the remaining load. This mode of operation is bound to make the plant self-sufficient in terms of electric loads, avoiding energy exchanges with the grid.
Depending on power values, the components of the system are selected from specialized catalogues; starting from the relevant operational parameters indicated, components are modelled and, as a consequence, plant operation is simulated by means of GateCycle software. GateCycle is a PC-based software consisting of a block diagram environment that performs detailed steady-state design and off-design analyses of thermal power systems. Simulations run by means of this software allow the calculation of all the different pressure, temperature, and enthalpy conditions with respect to the working fluid in the system, and as a consequence, a quantitative evaluation of the plant’s performance in terms of net power, overall efficiency, primary fuel flow rate, and supplementary fuel flow rate. The variation of the system performance parameters in off-design conditions is evaluated as well, by modelling it in different seasonal situations with GateCycle software.
2.3. Preliminary Design of CHP Technologies for the Analysed Process
First of all, the ratio Pt/Pe of the specific process was calculated: the result was Pt/Pe = 3.33.
Average values of the useful-heat-to-electricity ratio (
RH/E) for Italian plants, similar to the ones calculated by the authors in Reference [
27], are available from Reference [
28]. They represent the current national state of the art of CHP plants in Italy. Such ratios will be recalculated and employed in the following.
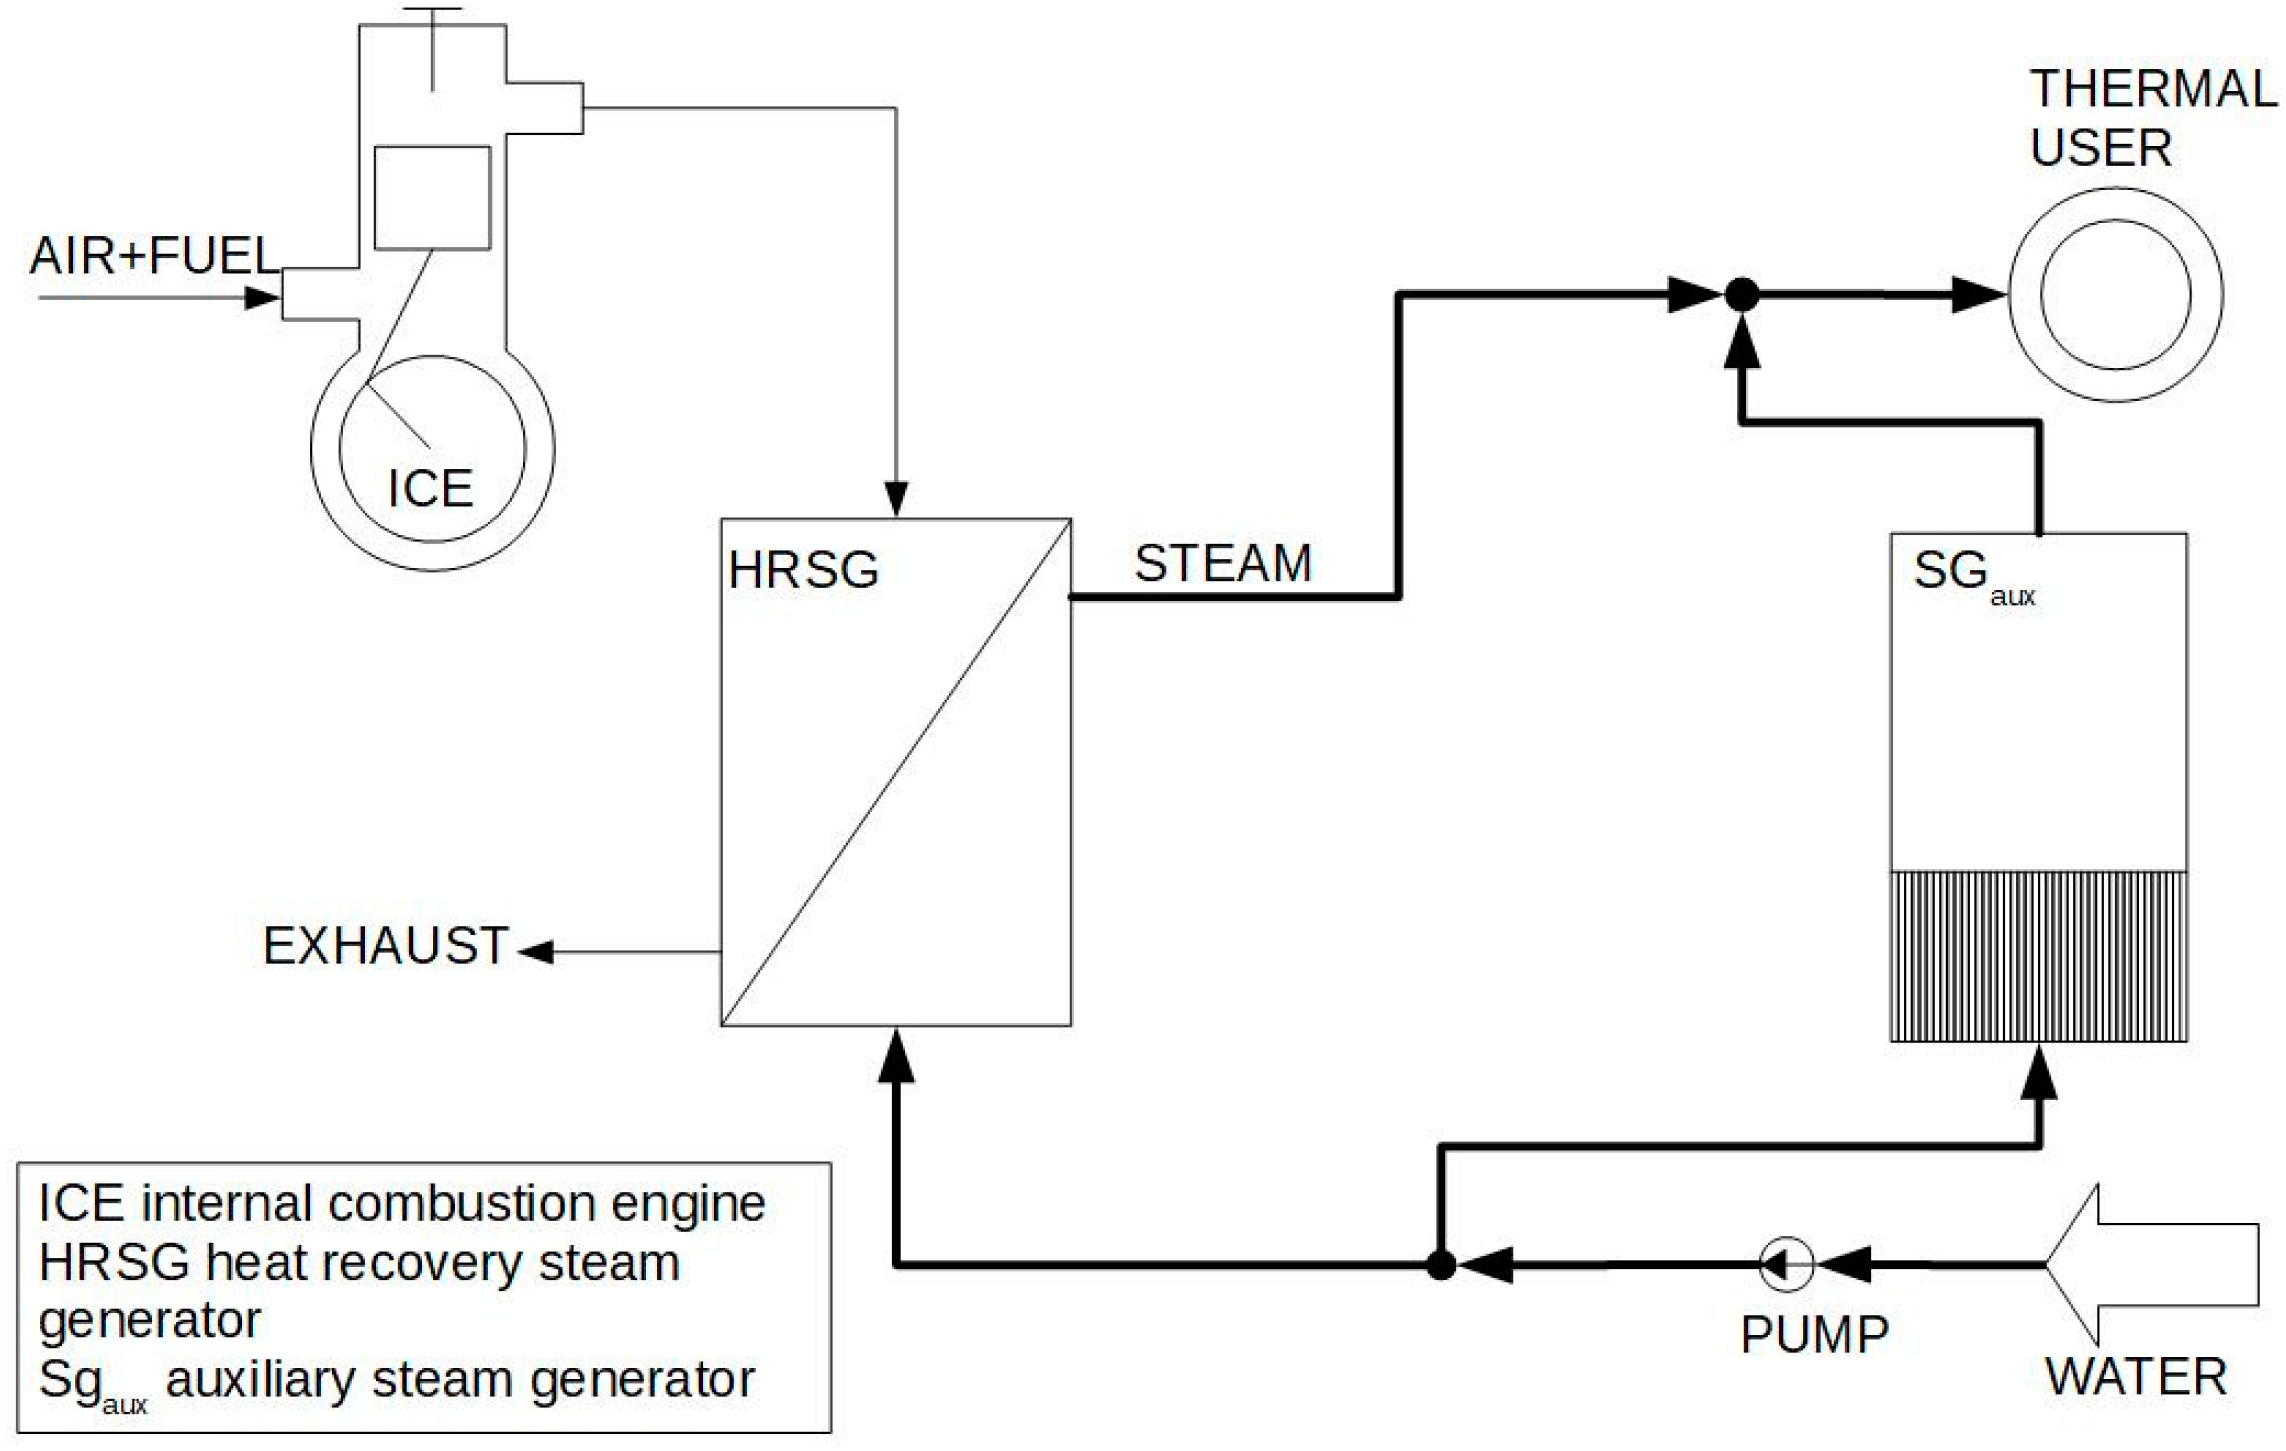
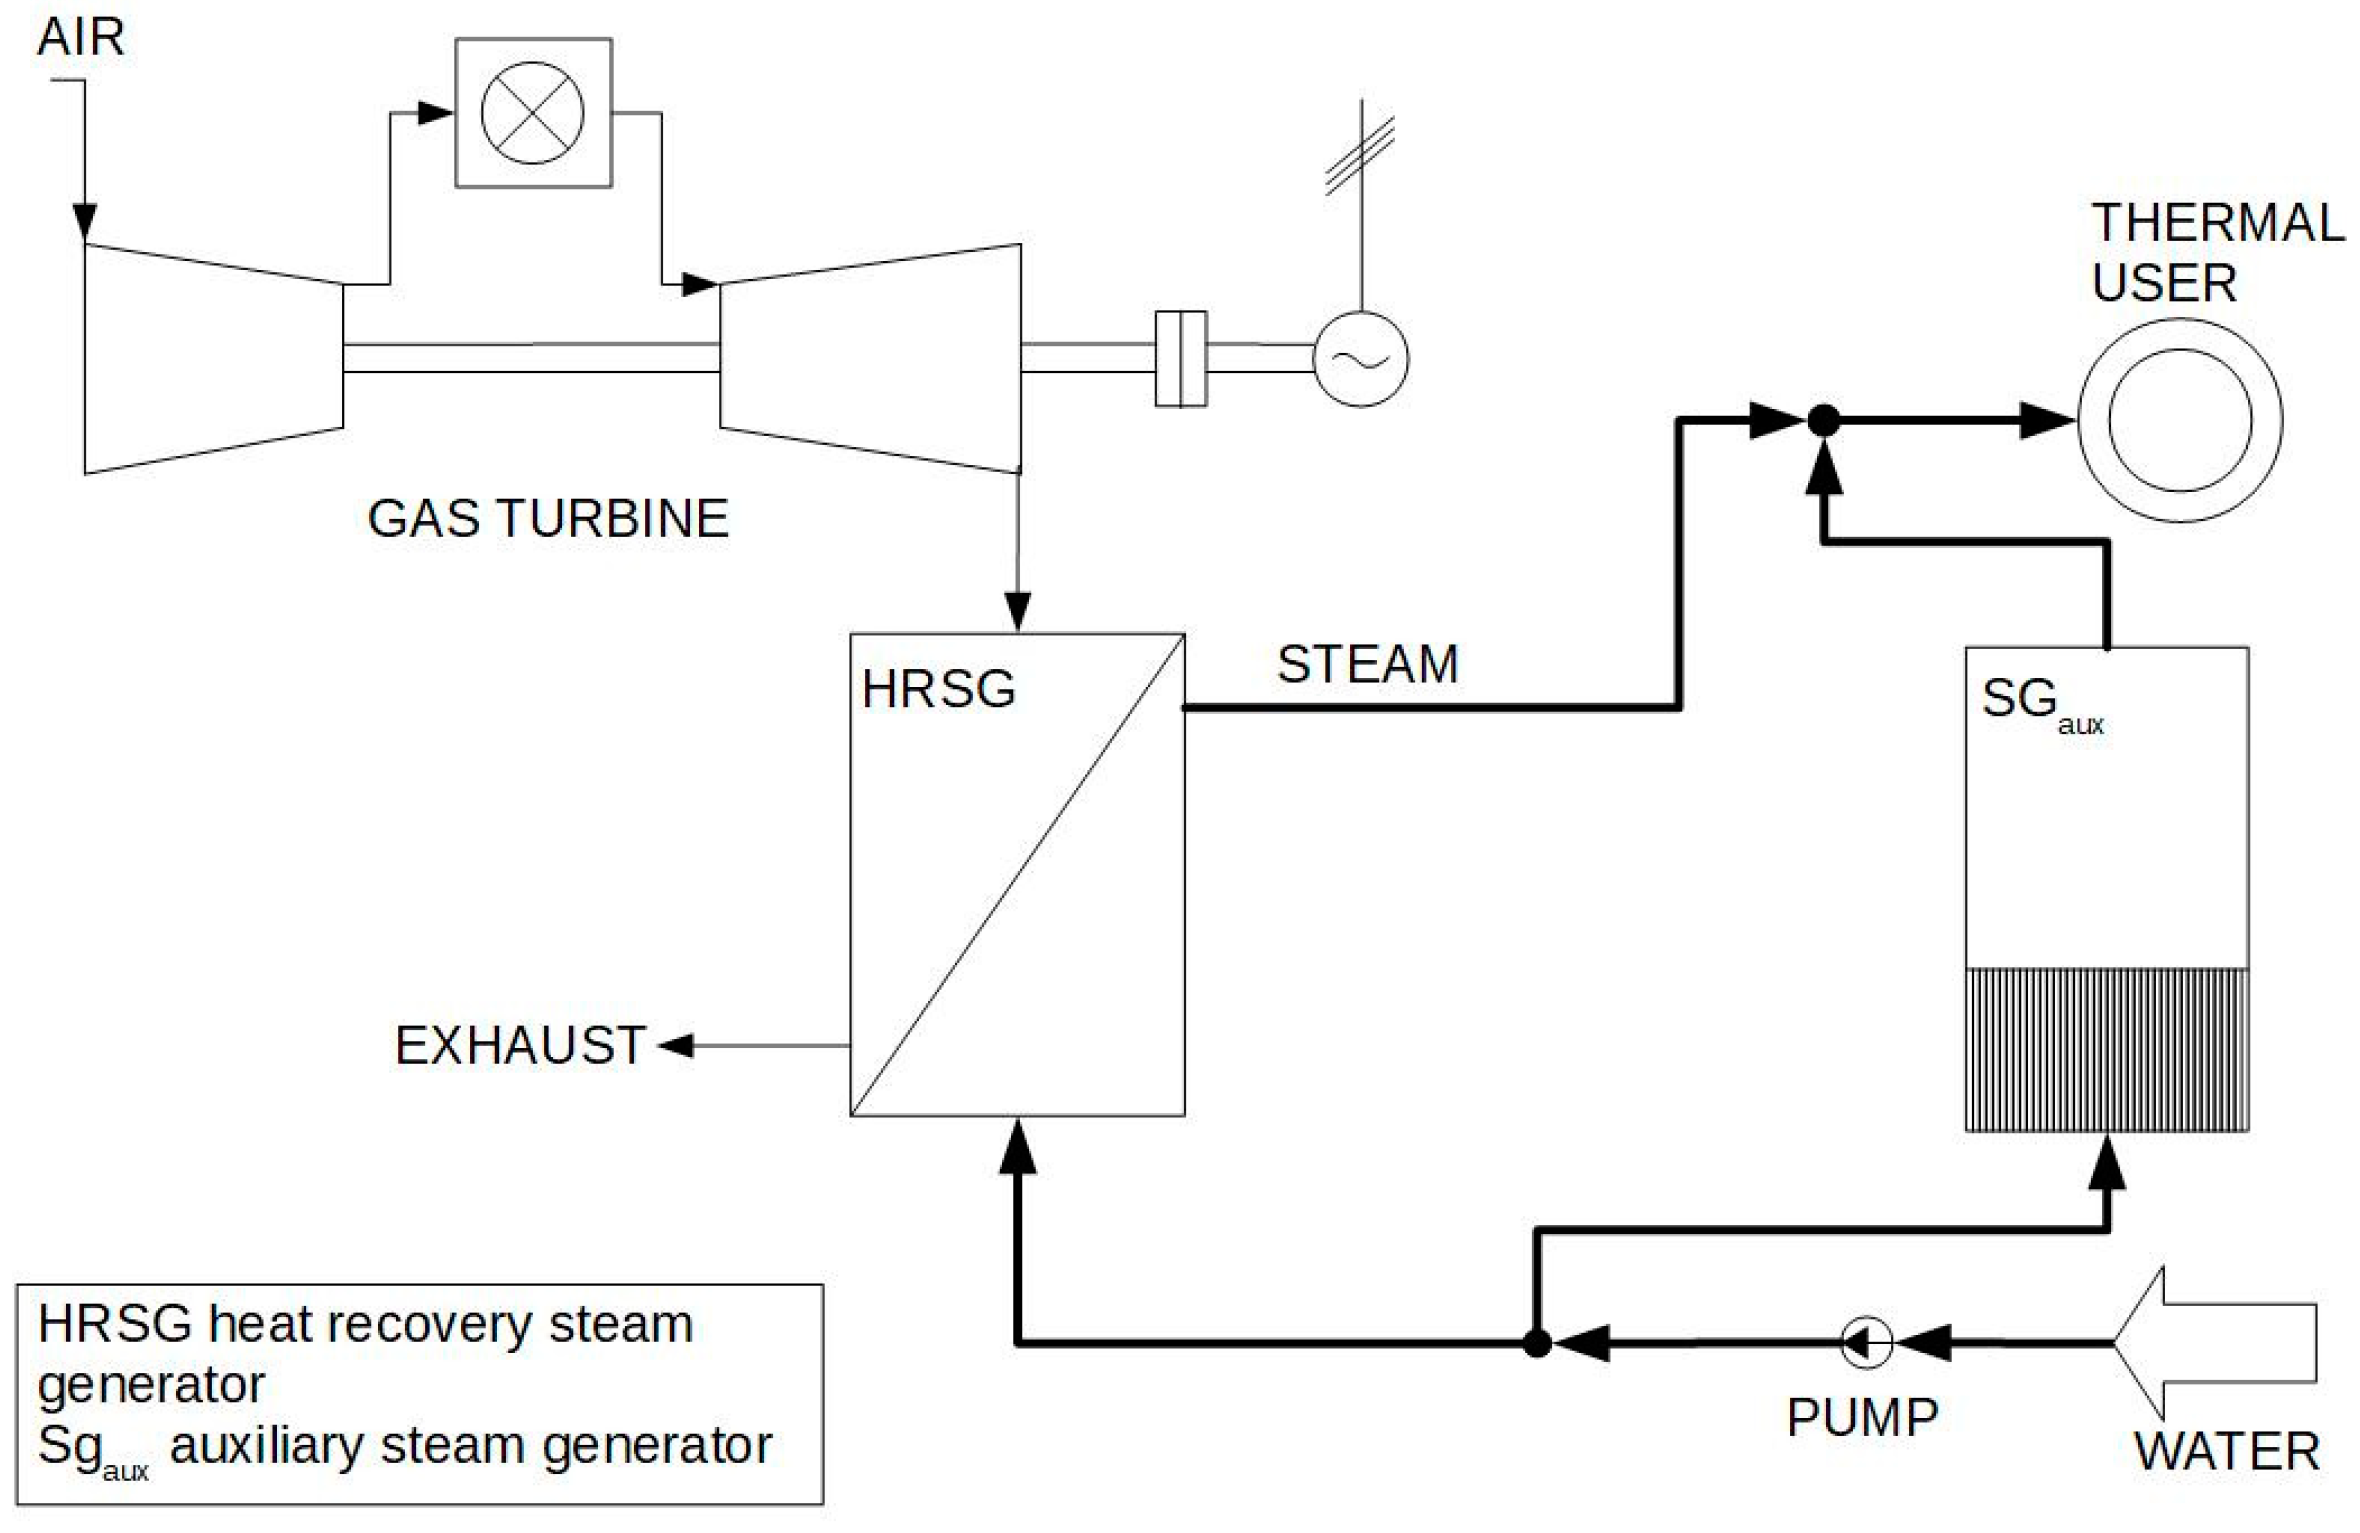
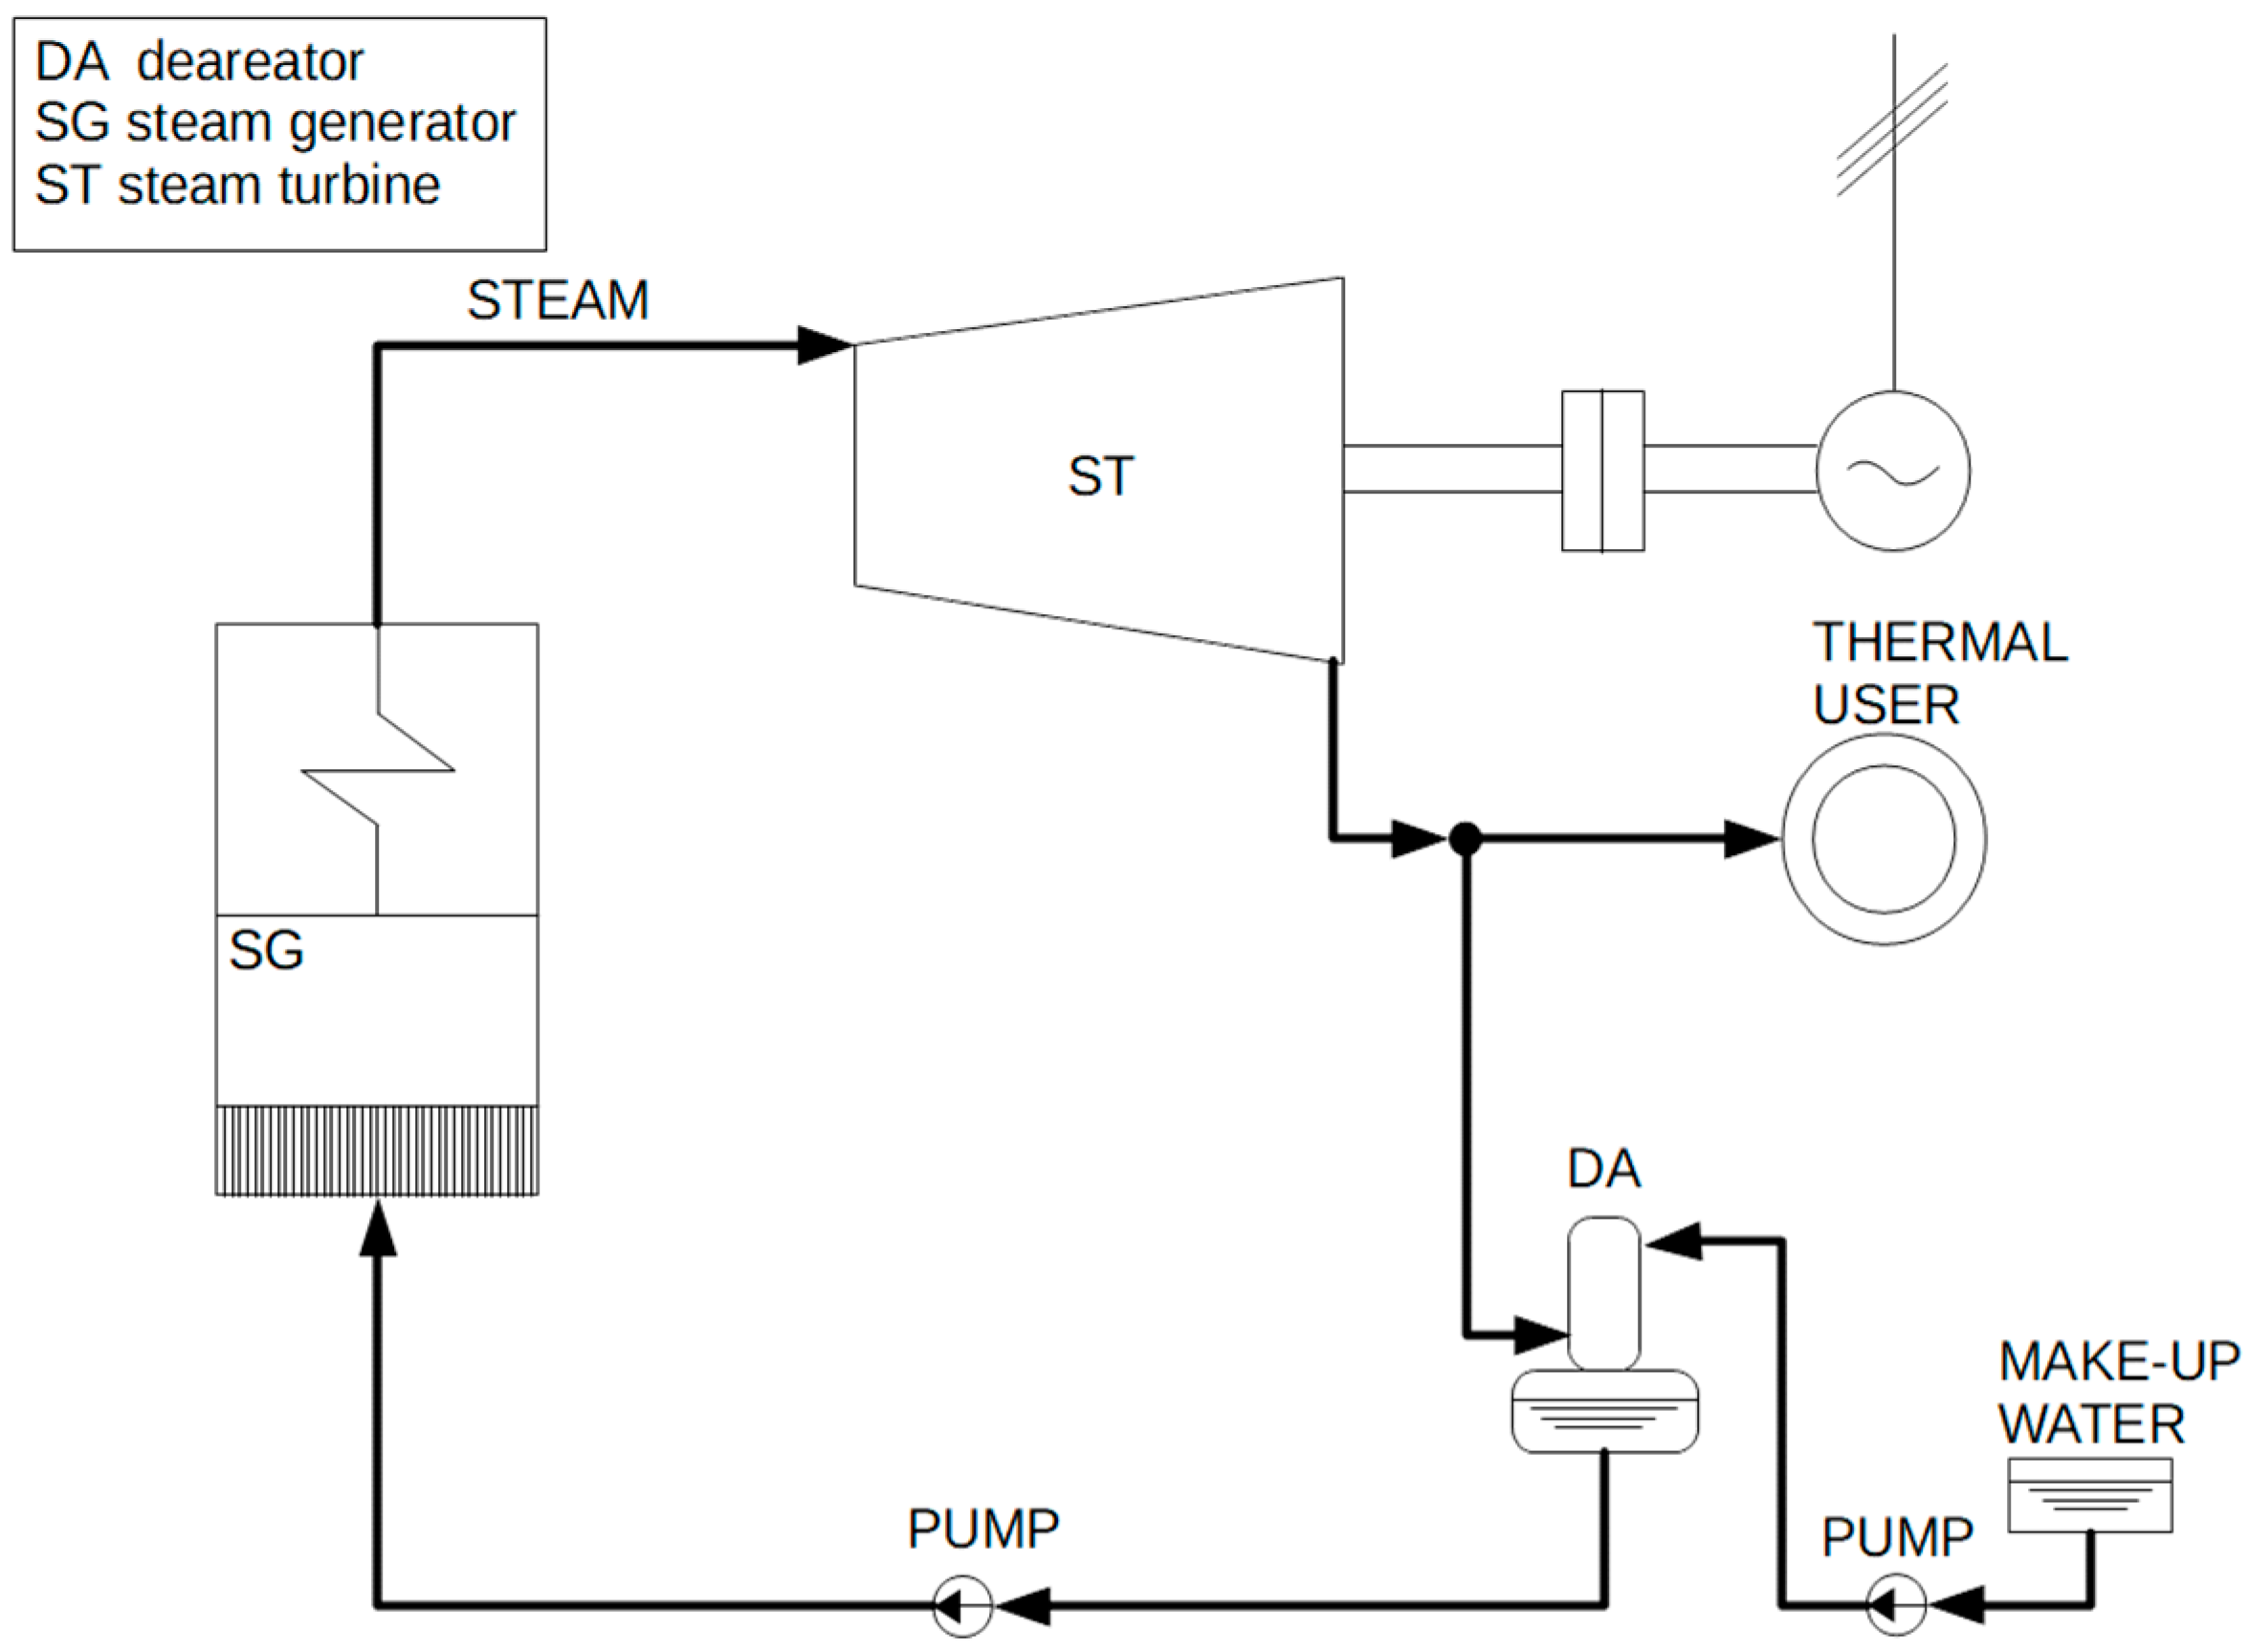
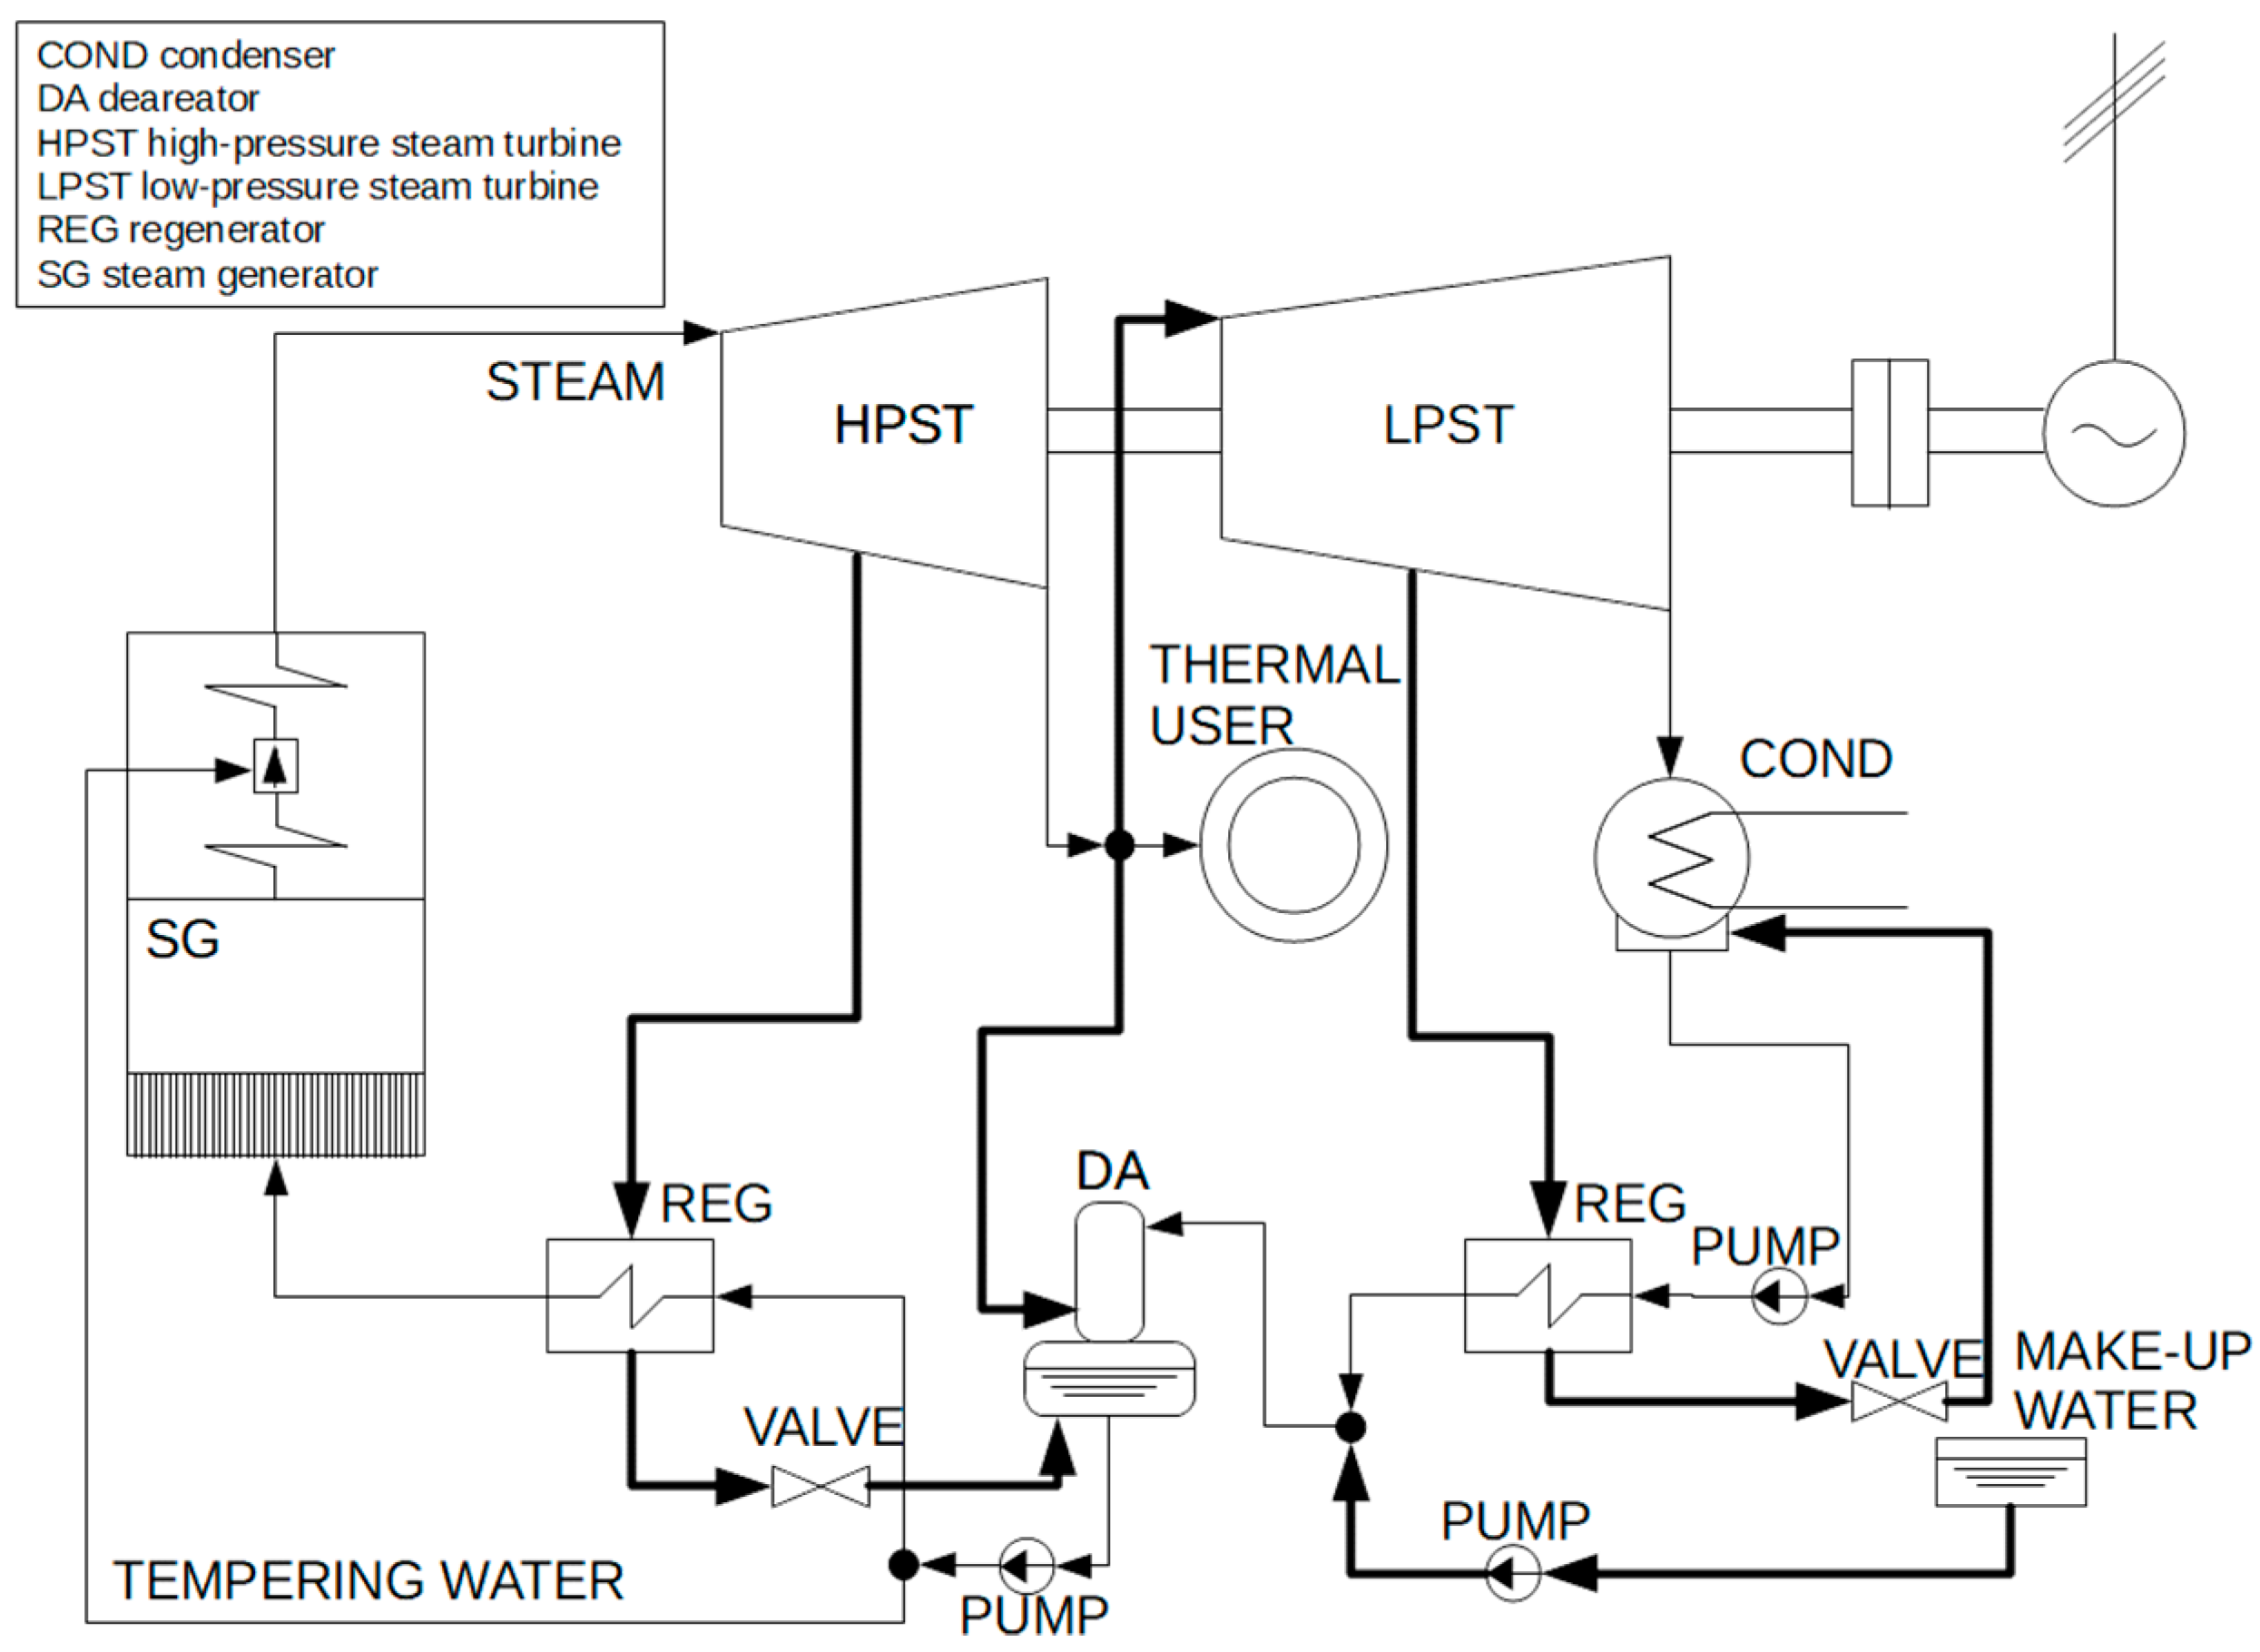
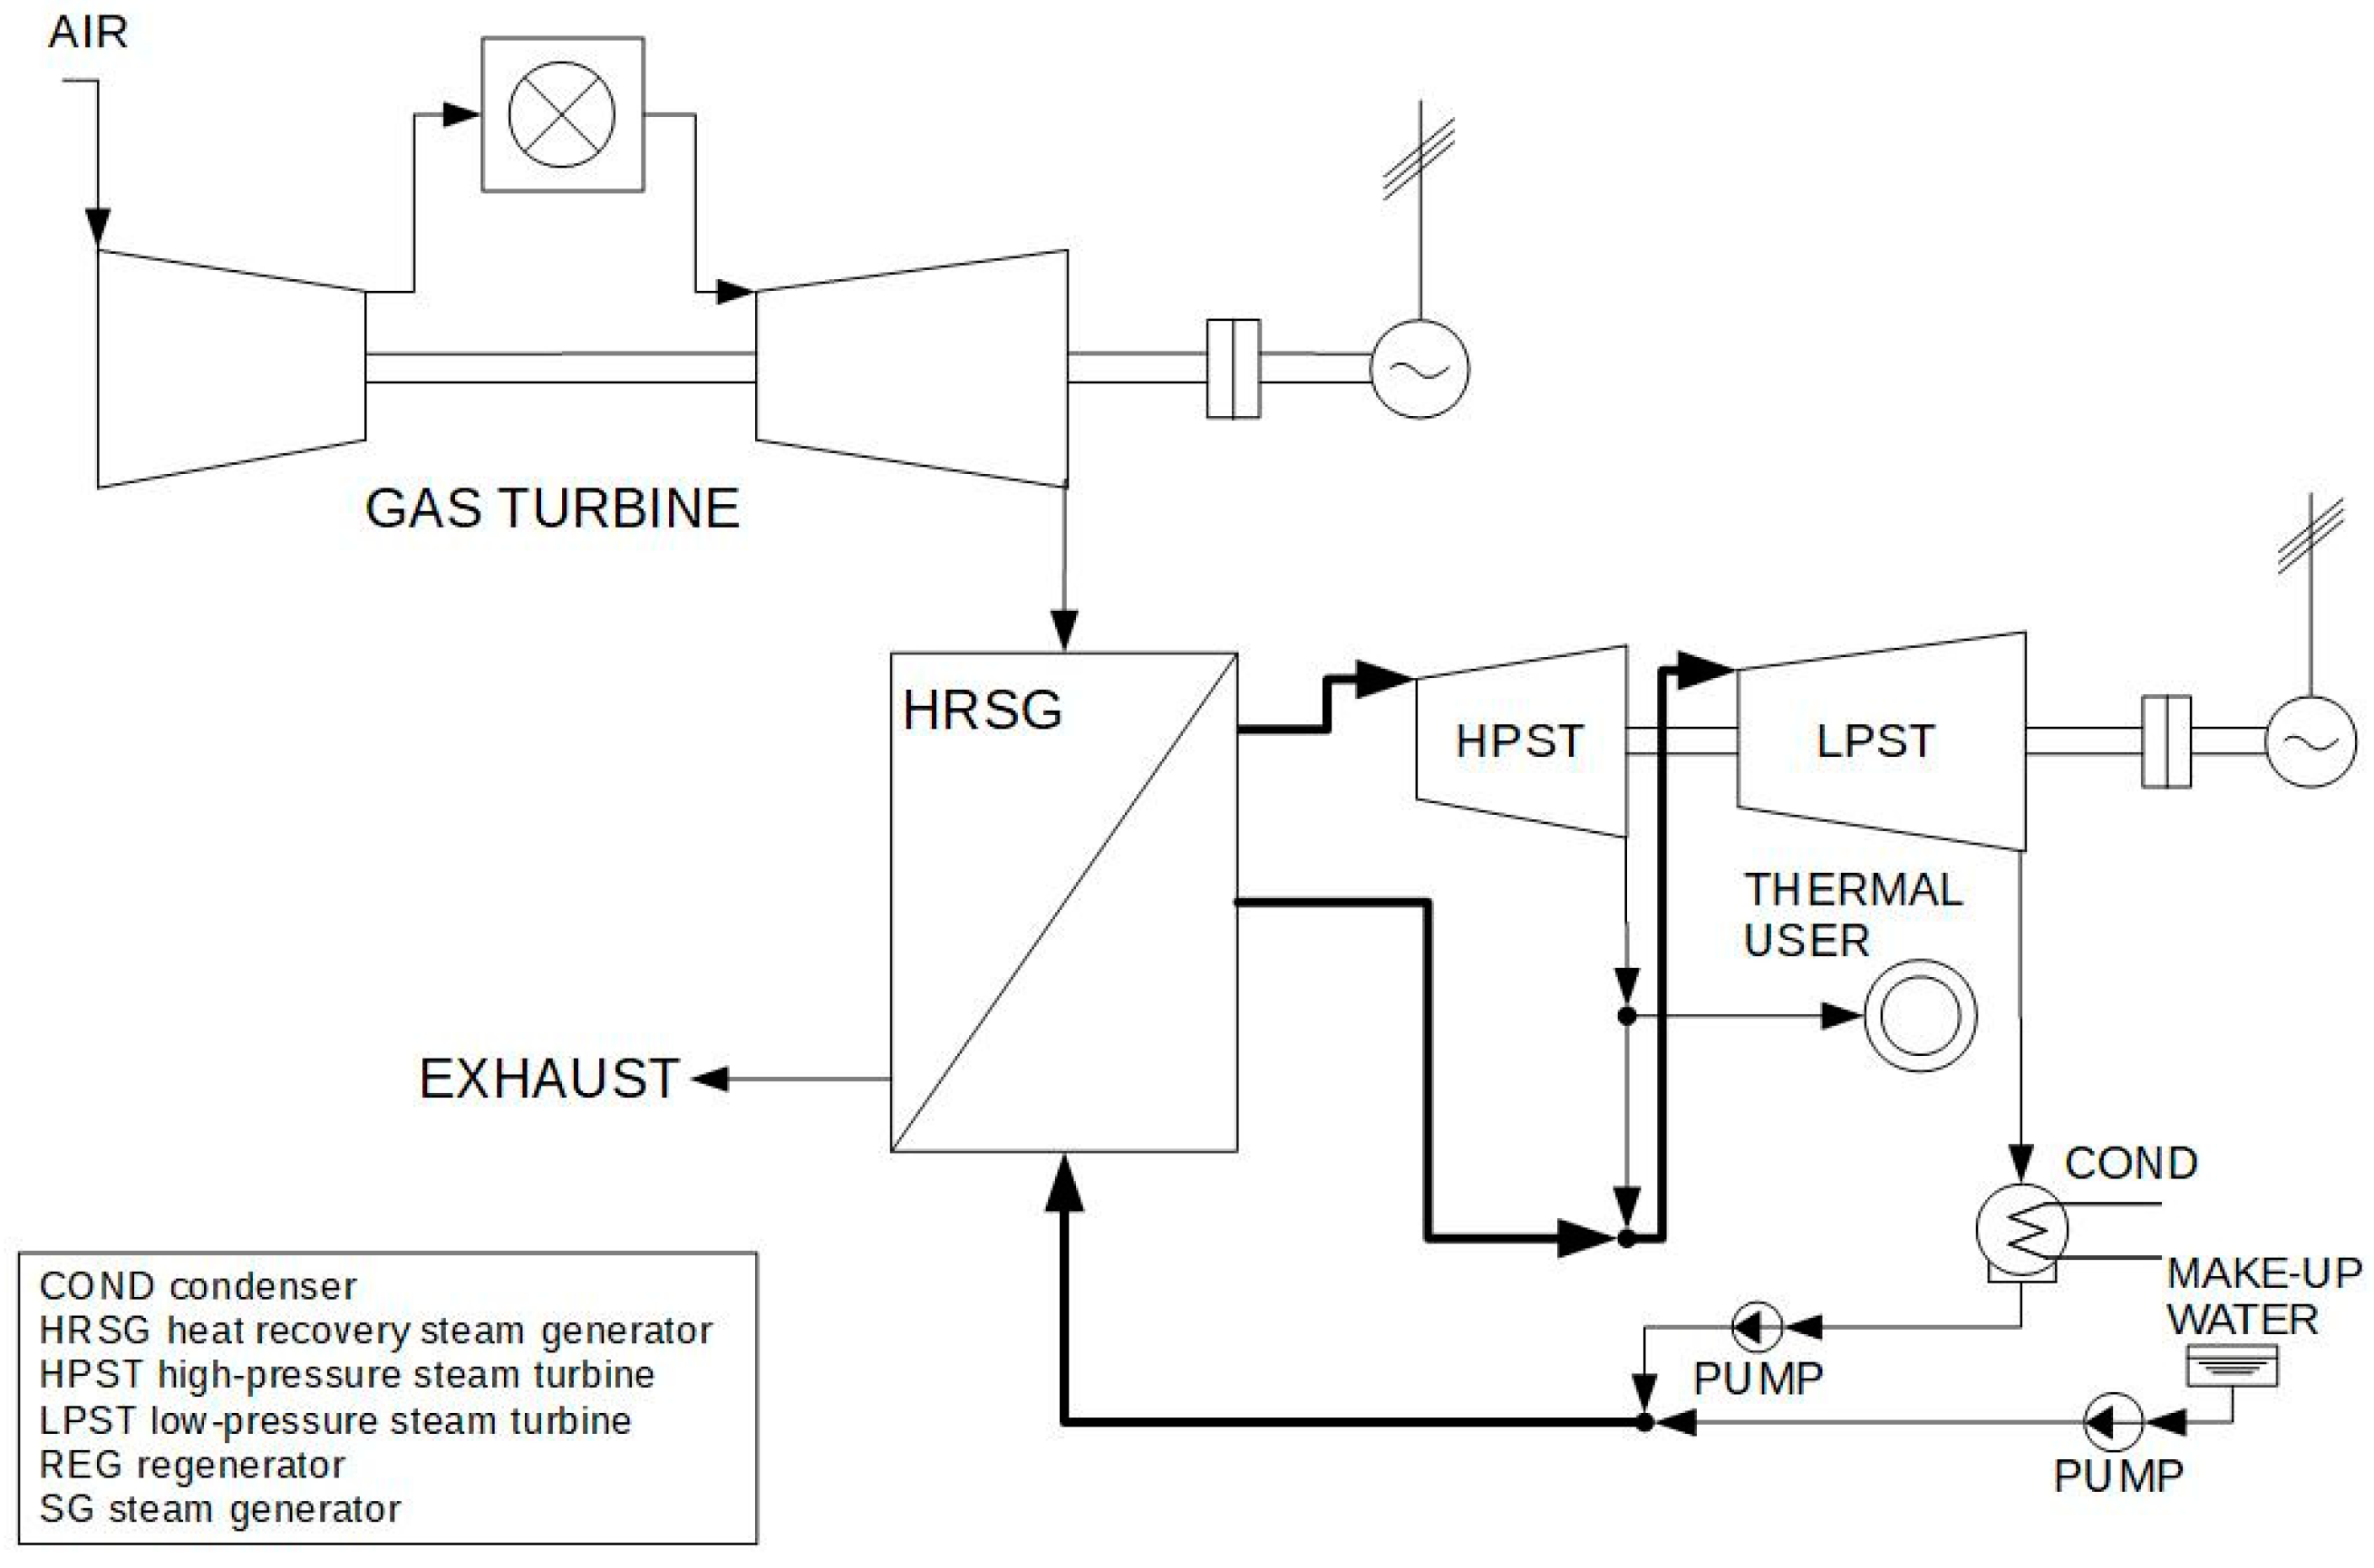
The CHP technologies selected for the present study are internal combustion engine (ICE), gas turbine (GT), steam power plant with back-pressure turbine (SPP-BPT), steam power plant with condensing turbine (SPP-CT), and combined cycle power plants (CCPP). Renewable energy sources were not taken into consideration. In fact, in Italy, renewable energy sources (RES) are not employed to satisfy the electric demand of industrial facilities, which require also heat. In the industry sector, systems capable of providing both process heat and electricity are installed; the size of such systems is determined with the aim of achieving the values for energy parameters imposed by current regulations to gain access to remuneration. Italian regulations provide for dispatching priority for both RES-based plants and cogeneration units: this means that, for these two plant types, electricity is fed into the grid before the amount of energy produced by fossil-fueled thermal power plants bound to the production of electricity only. However, the electricity produced by cogenerators is remunerated with a price which is not as competitive as that set for RES.
If the plant is operated satisfying the electric load, after setting the rated electric power equal to Pe, the rated thermal power is calculated through the value of RH/E corresponding to the chosen technology. If the calculated value is lower than Pt, a supplementary steam flow rate must be estimated.
If the plant is operated satisfying the thermal load, after setting the rated thermal power equal to Pt, the rated electric power is calculated through the value of RH/E corresponding to the chosen technology. If the calculated value is lower than Pe, the resulting electric power deficiency must be compensated for by purchasing electricity from the grid; if the calculated value is higher than Pe, the resulting electric power surplus must be released to the grid.
An optimal design of plants is carried out bearing in mind two hypotheses:
the useful heat produced by the CHP unit has to be exploited at its most, granting the cogenerator the achievement of the maximum HCHP/E ratio, with this condition being essential to access the best HEC performances;
electricity has not to be fed into the national grid; this means that the plant size cannot exceed an electric power equal to the electric demand of the process.
In light of this, the calculated value of the process ratio Pt/Pe must be compared to the ratio RH/E related to each CHP technology.
As a consequence of these two hypotheses, if:
the considered cogeneration technology is able to satisfy the electric demand of the production process, but not the thermal demand; this implies that the CHP unit has to be designed following the electric loads and auxiliary boilers shall be provided;
Otherwise, if:
the considered cogeneration technology is able to satisfy the thermal demand of the production process, but not the electric demand; this implies that the CHP unit has to be designed following the thermal loads and additional electricity shall be drawn from the national grid.
An alternative design of CHP technologies (that is, the plants sized according to the electric load will be sized according to the thermal load and vice versa) can be performed as well, in order to corroborate the validity of the design methodology subject of the present paper and to provide a more complete overview of cogeneration units.
2.4. HEC Energy Performance Parameters
The HEC analysis is conducted by following the guidelines reported in References [
7,
9,
29]. In short, the overall efficiency
ηg must be calculated as follows:
where
E is the total electrical/mechanical energy,
HCHP is the CHP useful heat energy (total useful heat energy
H reduced by the amount of non-combined useful heat energy
Hnon-CHP), and
F − Fnon-CHP,H is the amount of fuel energy used in cogeneration. If
ηg achieves or exceeds the values of 0.80 for combined cycle gas turbines with heat recovery and steam condensing extraction turbine-based plants or 0.75 for other types of cogeneration units, the plant does not produce any non-CHP electric energy
Enon-CHP.
For lower values of
ηg, the amount of
Enon-CHP and the related fuel energy (
Fnon-CHP,E) can be assessed through the evaluation of the power loss coefficient
β representing the electricity loss caused by steam extraction for heat production. This parameter allows for the calculation of both the efficiency of non-combined electric energy generation
ηnon-CHP,E and the power-to-heat ratio
Ceff (
Cactual in the European legislation).
Ceff is required to calculate CHP electric energy
ECHP starting from
HCHP. Being known
ηnon-CHP,E, fuel energy for non-CHP electric energy generation
Fnon-CHP,E can be evaluated; fuel energy for CHP electric energy generation
FCHP is then determined by residual. Primary energy saving (PES) can be calculated as follows:
where
CHP Eη is the electric efficiency of the CHP portion,
CHP Hη is the thermal efficiency of the CHP portion, and
Ref Hη and
Ref Eη are the reference efficiencies for heat and electric production, respectively, provided by the guidelines. This parameter represents electric and thermal energy savings in cogeneration arrangement with respect to the case in which electric and thermal energy are produced separately. It is fundamental to prove that a cogeneration unit is really profitable; in fact, Italian regulations establish that only plants for which
(
for small and micro-CHP units) are eligible to access incentives.
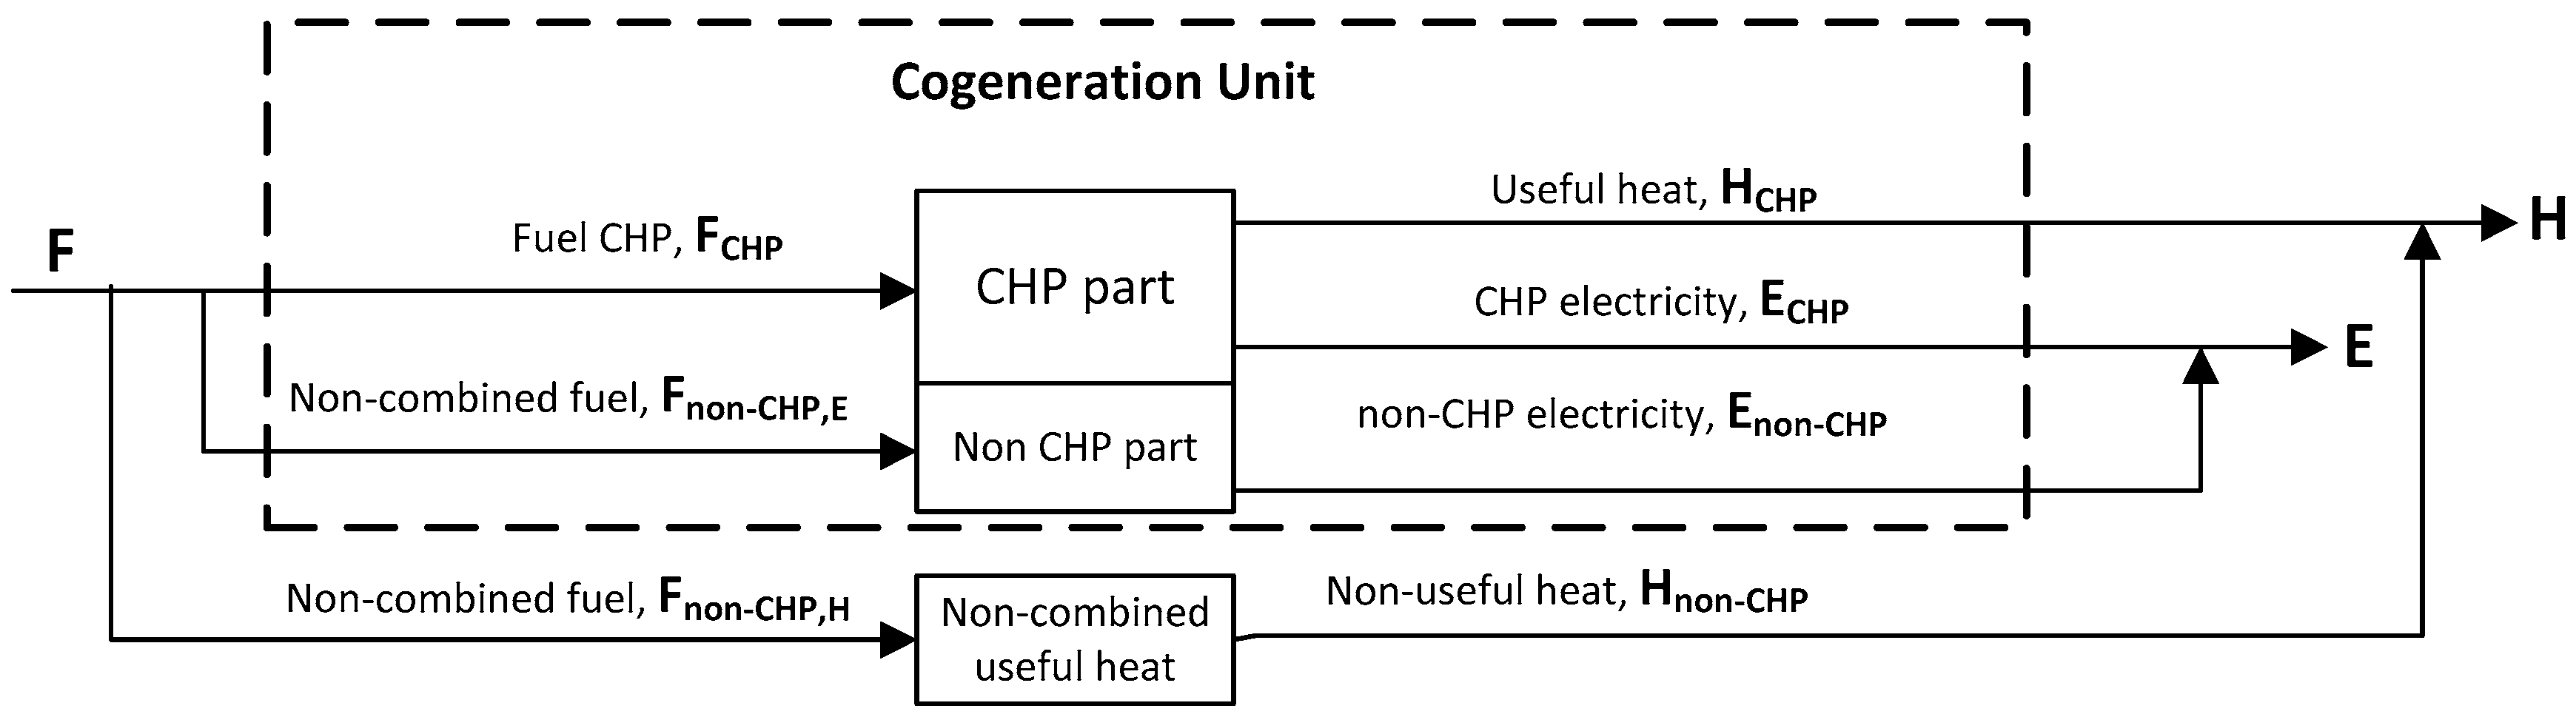
Figure 2 shows a schematized CHP unit with all energy flows named according to the Directive.
2.5. Economic Performance Parameters
A preliminary step in evaluating the economic yield of a CHP unit consists in the calculation of the RISP parameter, an expression of the savings fundamental to determine the number of white certificates (WCs) (the securities attesting the savings, in toe, subjected to the incentive scheme):
where
K is the harmonization factor, depending on the size of the plant, and
ηE,ref and
ηH,ref are the actual reference efficiencies.
The economic analysis is performed through the assessment of net present value (NPV) and pay-back period (PBP) for the considered plants, taking into account all positive and negative cash flows. However, when considering a comparison between different technologies, the ratio of the net present value to the total investment (NPV/I) may be better suited to assess the overall plant profitability: it is obvious that a plant for which the profit, after a set period of time, carries more weight than the initial outlay is a solution to be preferred.
2.6. Environmental Performance Parameters
The environmental performance of a CHP unit is evaluated in terms of the avoided amount of CO
2 emissions,
CO2,a. This parameter is calculated by subtracting CO
2 emissions related to a cogeneration plant from those produced by a plant satisfying the same loads in separate production arrangement. The current emission factor attributable to the mix of power plants regularly generating electricity is 330 g
CO2/kWh [
30] in Italy.
2.7. Total Key Performance Indicator
The most interesting contribution of Reference [
27] that has been reapplied in this paper is the definition of the total key performance indicator (TKPI) that may be conveniently used to select, among a variety of possible CHP options, the technology best suited to a specific application:
where
CO2,a represents the avoided CO
2 emissions. With reference to the
i-th CHP technology, TKPI adds together four key performance indicators referring to energy savings (
PESi/
PESmax), economic parameters (
PBPmin/
PBPi and (
NPV/
I)
i/(
NPV/
I)
max) and environmental impact (
CO2a,i/
CO2,a,max). Quantities with subscript
max (
min) refer to the maximum (minimum) value of the considered parameter that can be attained in the whole pool of CHP technologies. Each ratio (key performance parameter) can be equal to 1 at most; this means that total key performance parameter value cannot exceed four. It is a comparative measure of a plant’s performance and particularly useful to make comparisons as it combines all the relevant parameters that must be evaluated to select a technology when an investment has to be made.
4. Discussion
In this section, TKPI is evaluated for each of the examined technologies from the performance parameters assessed in the previous section. Results presented in this section are obtained assuming the following values for costs: 0.0243 €/kWh (fuel cost in separate production arrangement), 0.0193 €/kWh (fuel cost in CHP arrangement), 0.156 €/kWh (cost of purchased electricity), 0.042 €/kWh (cost of electricity fed into the grid). The maximum (minimum) reference values for the indicators appearing in TKPI formula are selected considering the two sizing methodologies (optimal and alternative) separately.
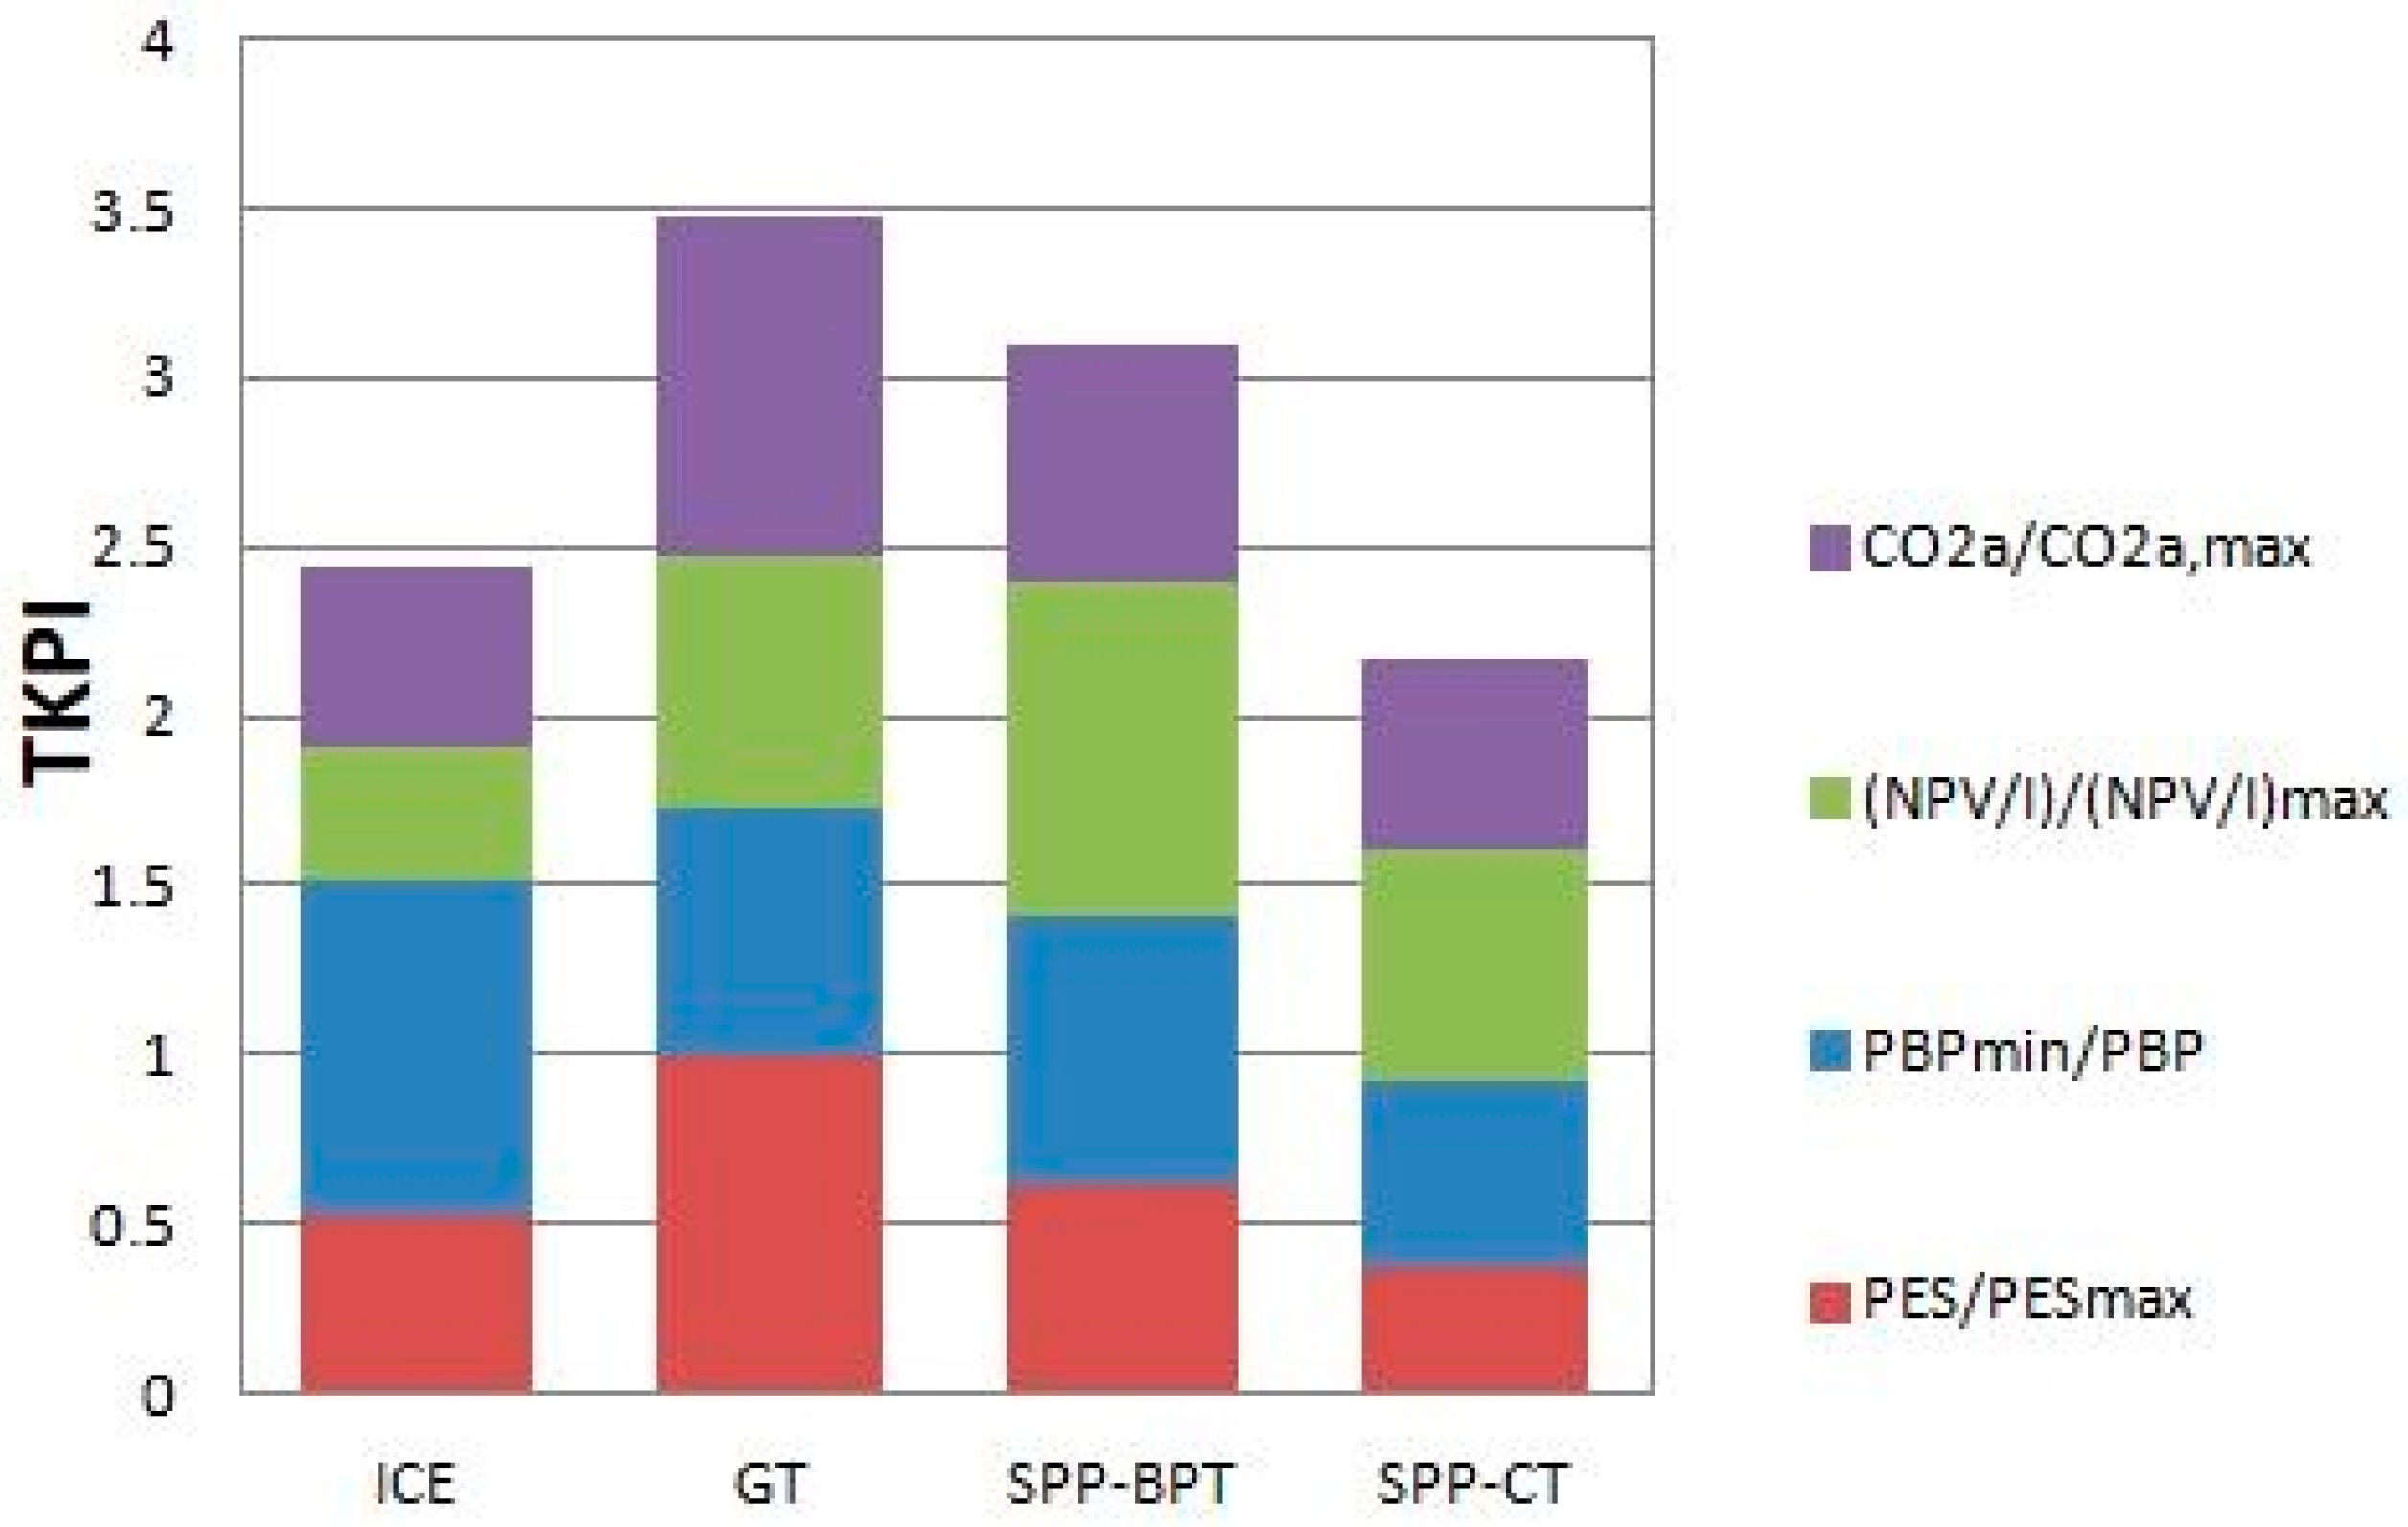
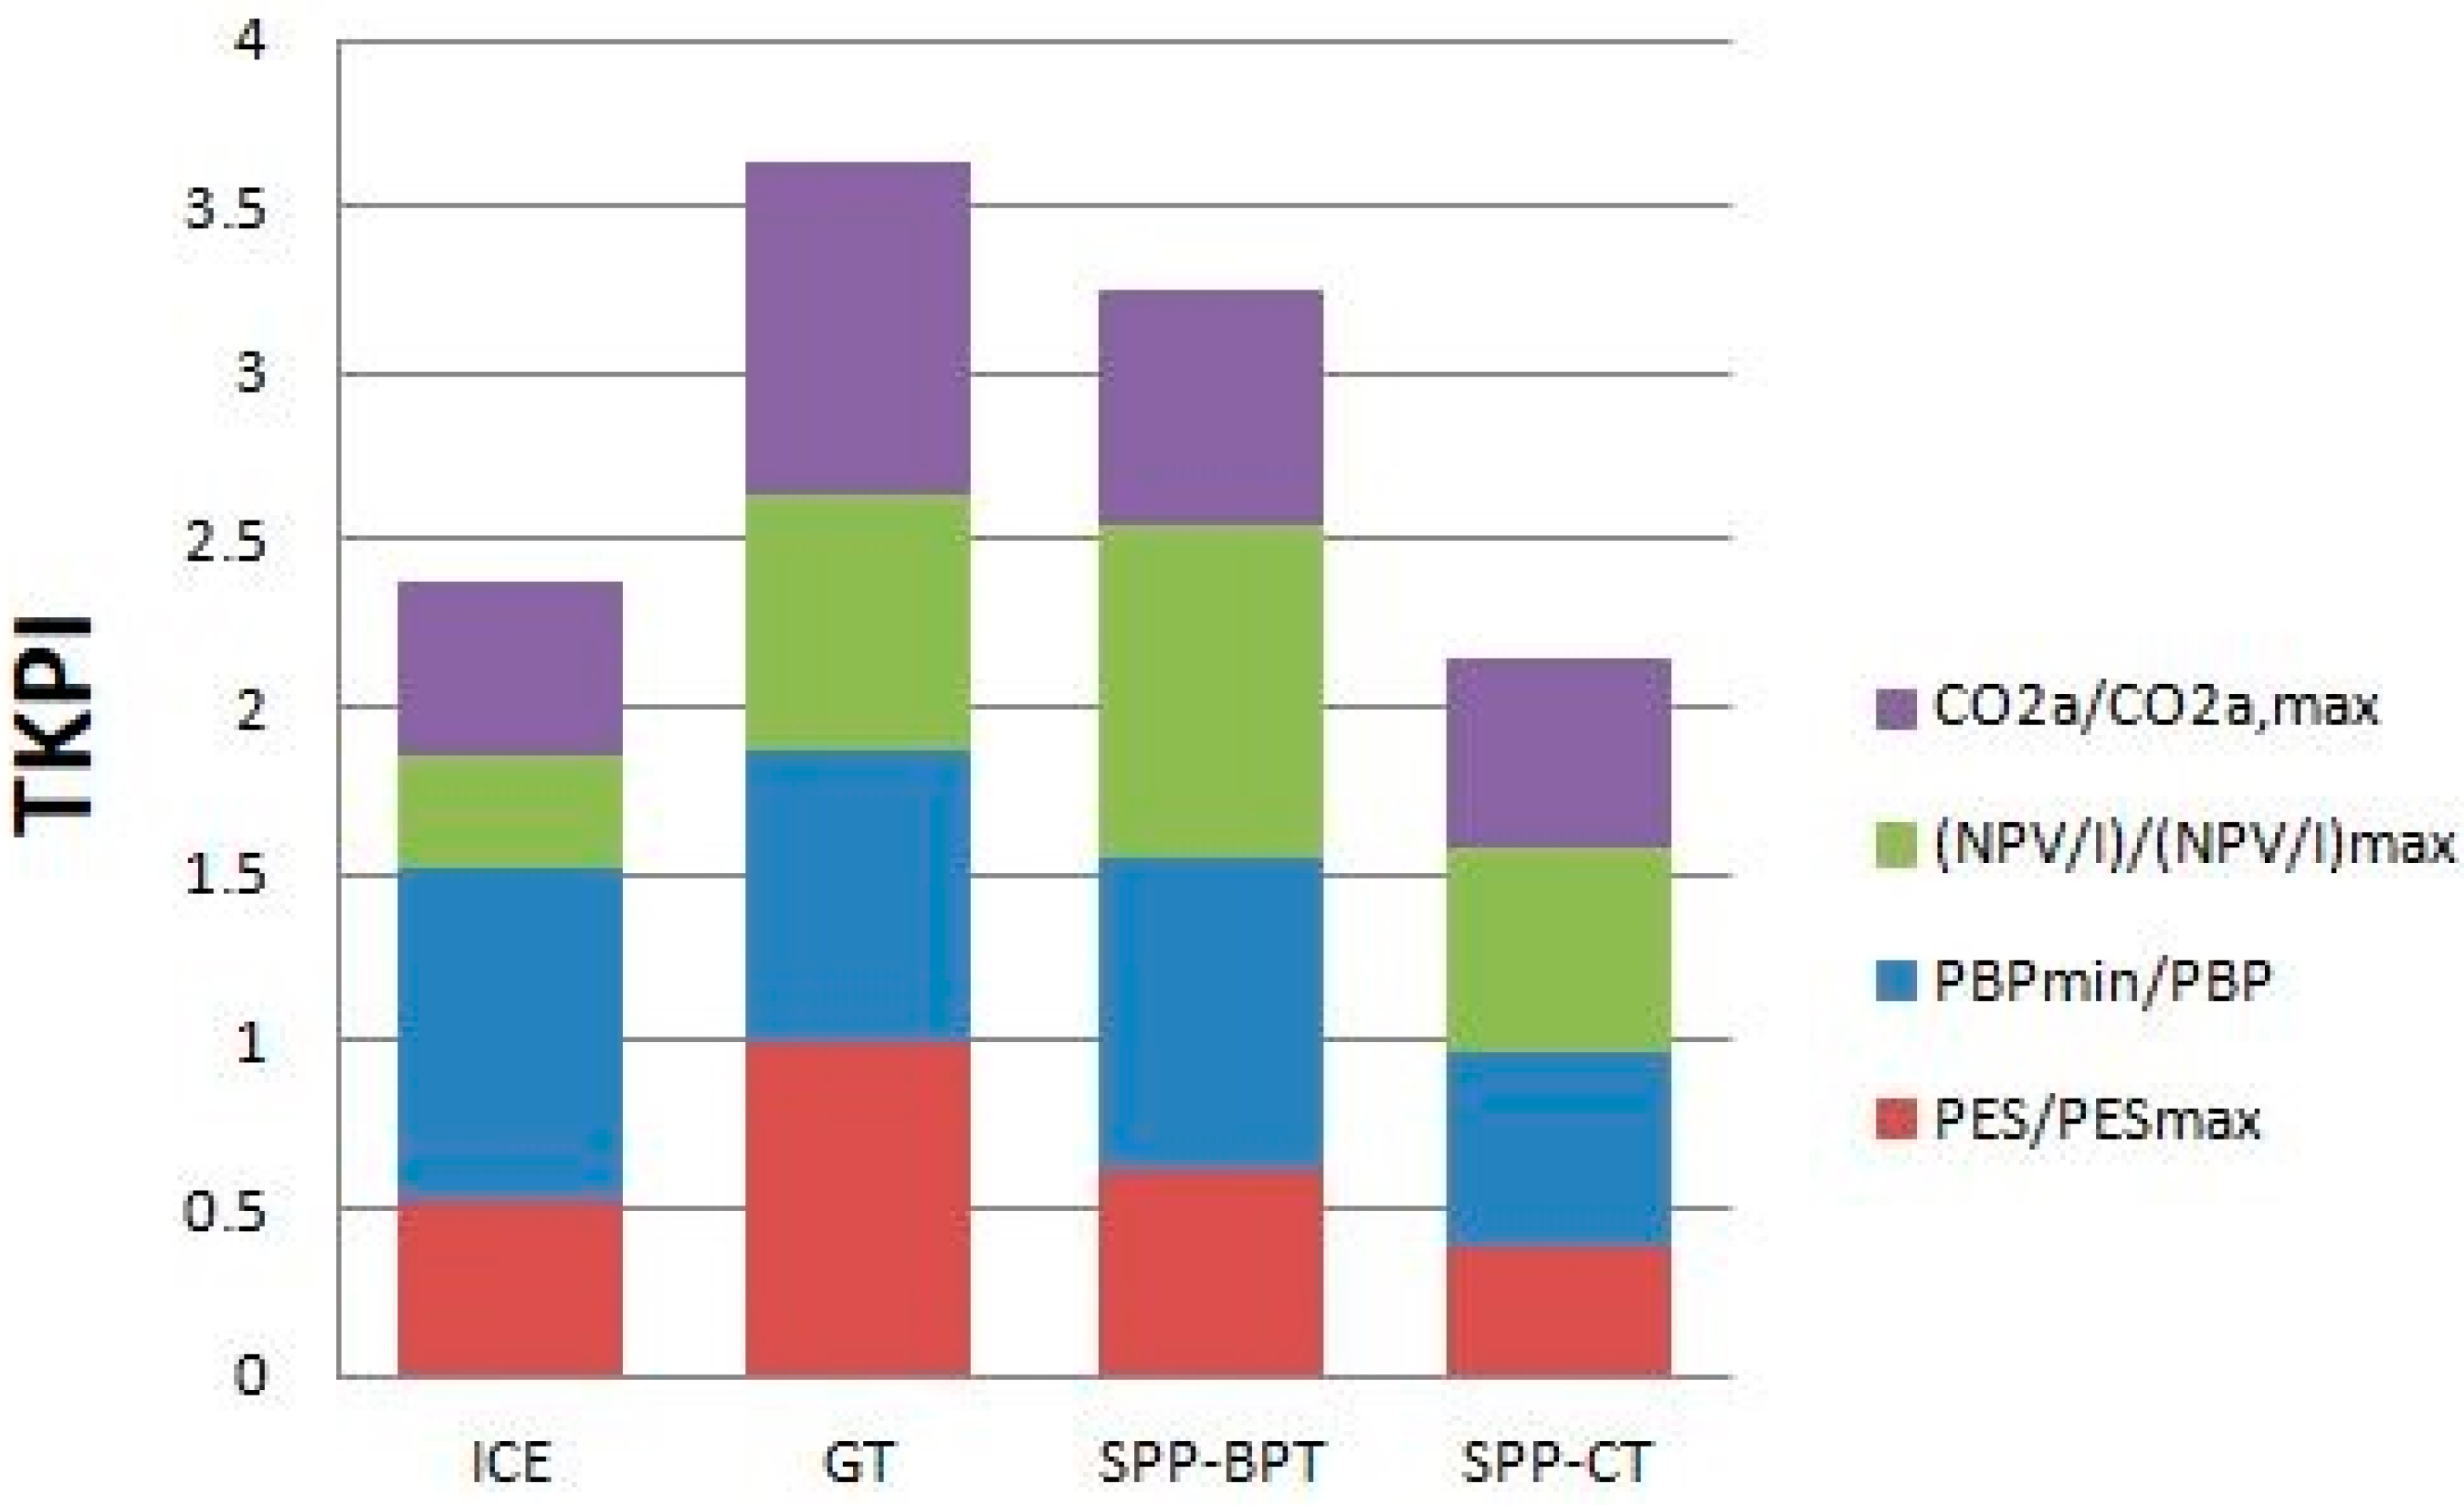
With respect to the optimal design option,
Figure 8 shows the resulting total key performance indicator values, broken down into their different contributions.
With a TKPI equal to 3.47, gas turbine turns out to be the most performing technology, followed by steam power plants with backpressure turbine (TKPI equal to 3.10). Internal combustion engines are disadvantaged by the impossibility of exploiting all heat produced; in fact, the amount of heat delivered by cooling water jacket and oil system cannot be harnessed being at much lower temperature levels than what is required by the paper mill’s processes. Steam power plants with condensing turbines are the least profitable units for the application here discussed, showing a TKPI of 2.16.
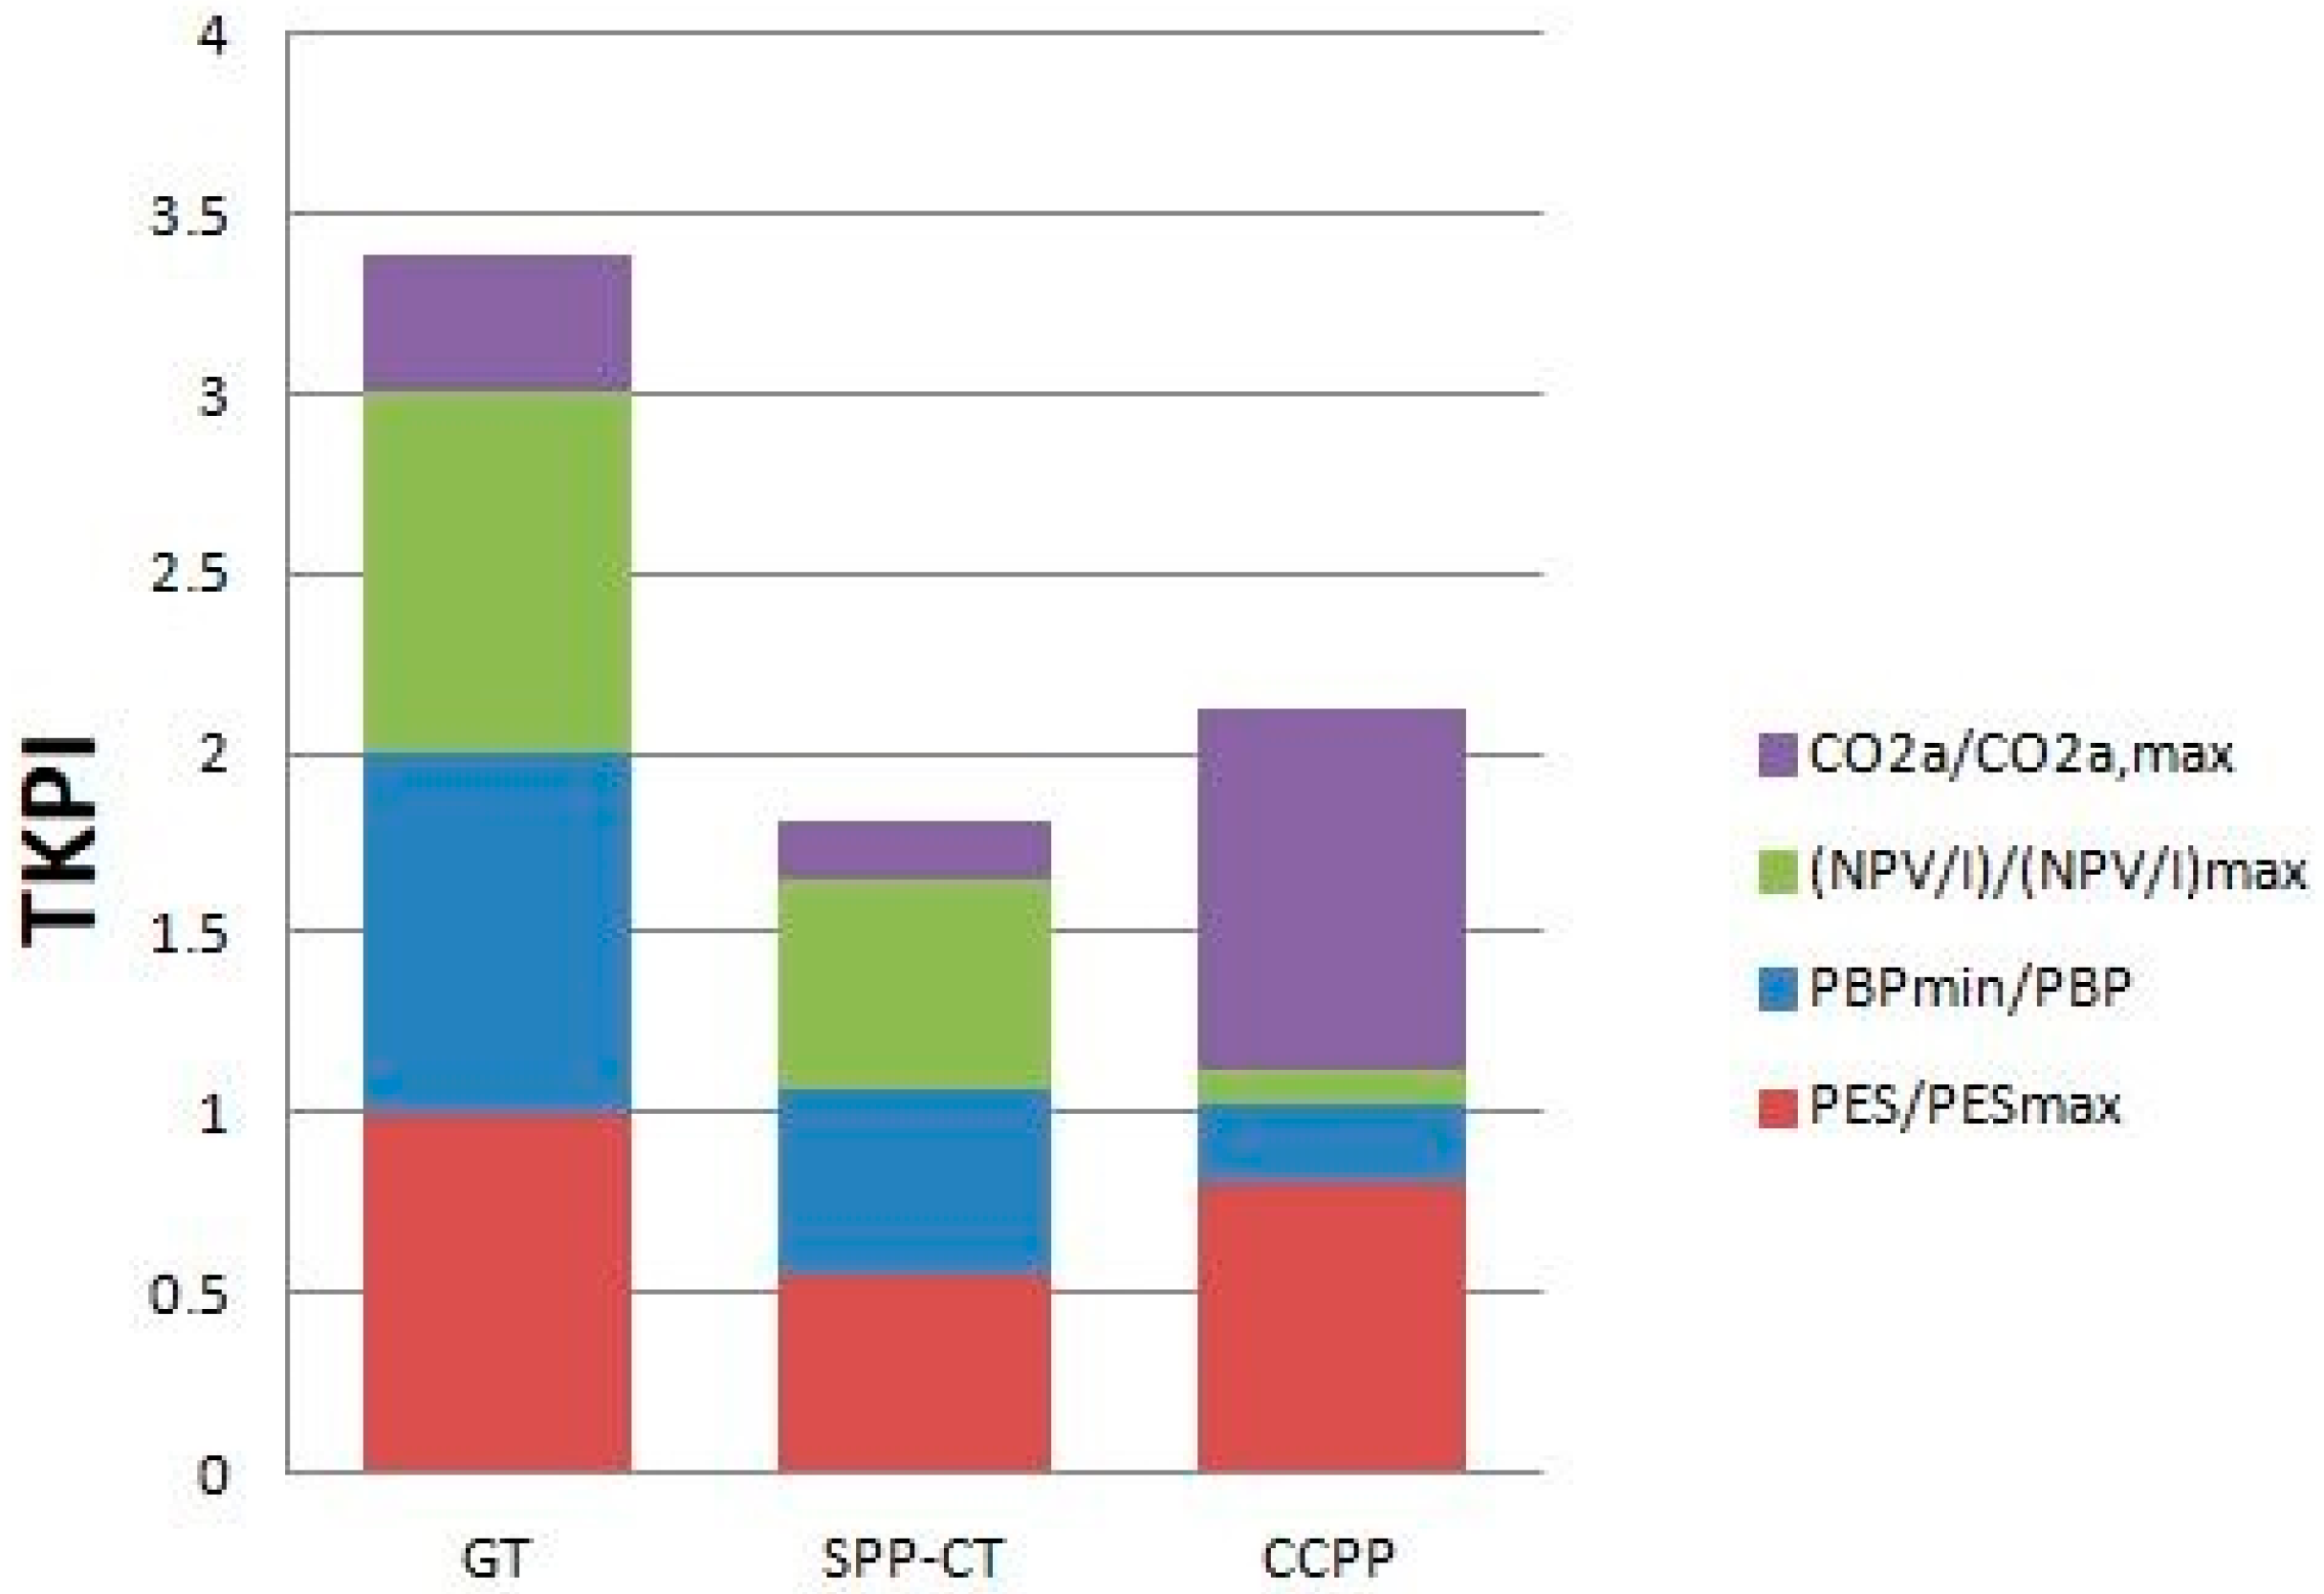
Regarding the alternative design, the breakdown of the resulting total key performance indicators is displayed in
Figure 9. As for optimal design methodology, gas turbines and steam power plants with condensing turbine rank respectively first and last among the proposed solutions. Combined cycles are extremely favored by their excellent environmental performance, improved by the huge quantity of electricity fed into the grid, which contributes to the reduction of CO
2 emissions in the model utilized in the present analysis; the environmental indicator plays a major role on the total key performance indicator for this technology that would be otherwise dramatically affected by its poor economic performance, consequence of the very high initial investment (CC size is 4–5 times larger than those of the other technologies). Considering also that the optimal design is not feasible for CC-based cogeneration (see
Section 3.1), it can be inferred that this kind of plant is not viable for being coupled with paper mills.
However, where the two design methodologies can be compared, it is clear that the optimal design must be preferred, for the same technology, to higher TKPI values (TKPIs in
Figure 9 would be smaller if calculated by using reference values of TKPIs in
Figure 8). This statement reaffirms the validity of the sizing methodology proposed by the authors.
The choice of considering two different design criteria responds to the intent to set two separate possible scenarios.
If the optimal methodology is deployed, the plant size is defined so as not to produce a surplus amount of electricity with respect to process requirements, possibly employing auxiliary boilers or purchasing electricity from the grid if cogeneration thermal or electric power are lower than the required ones.
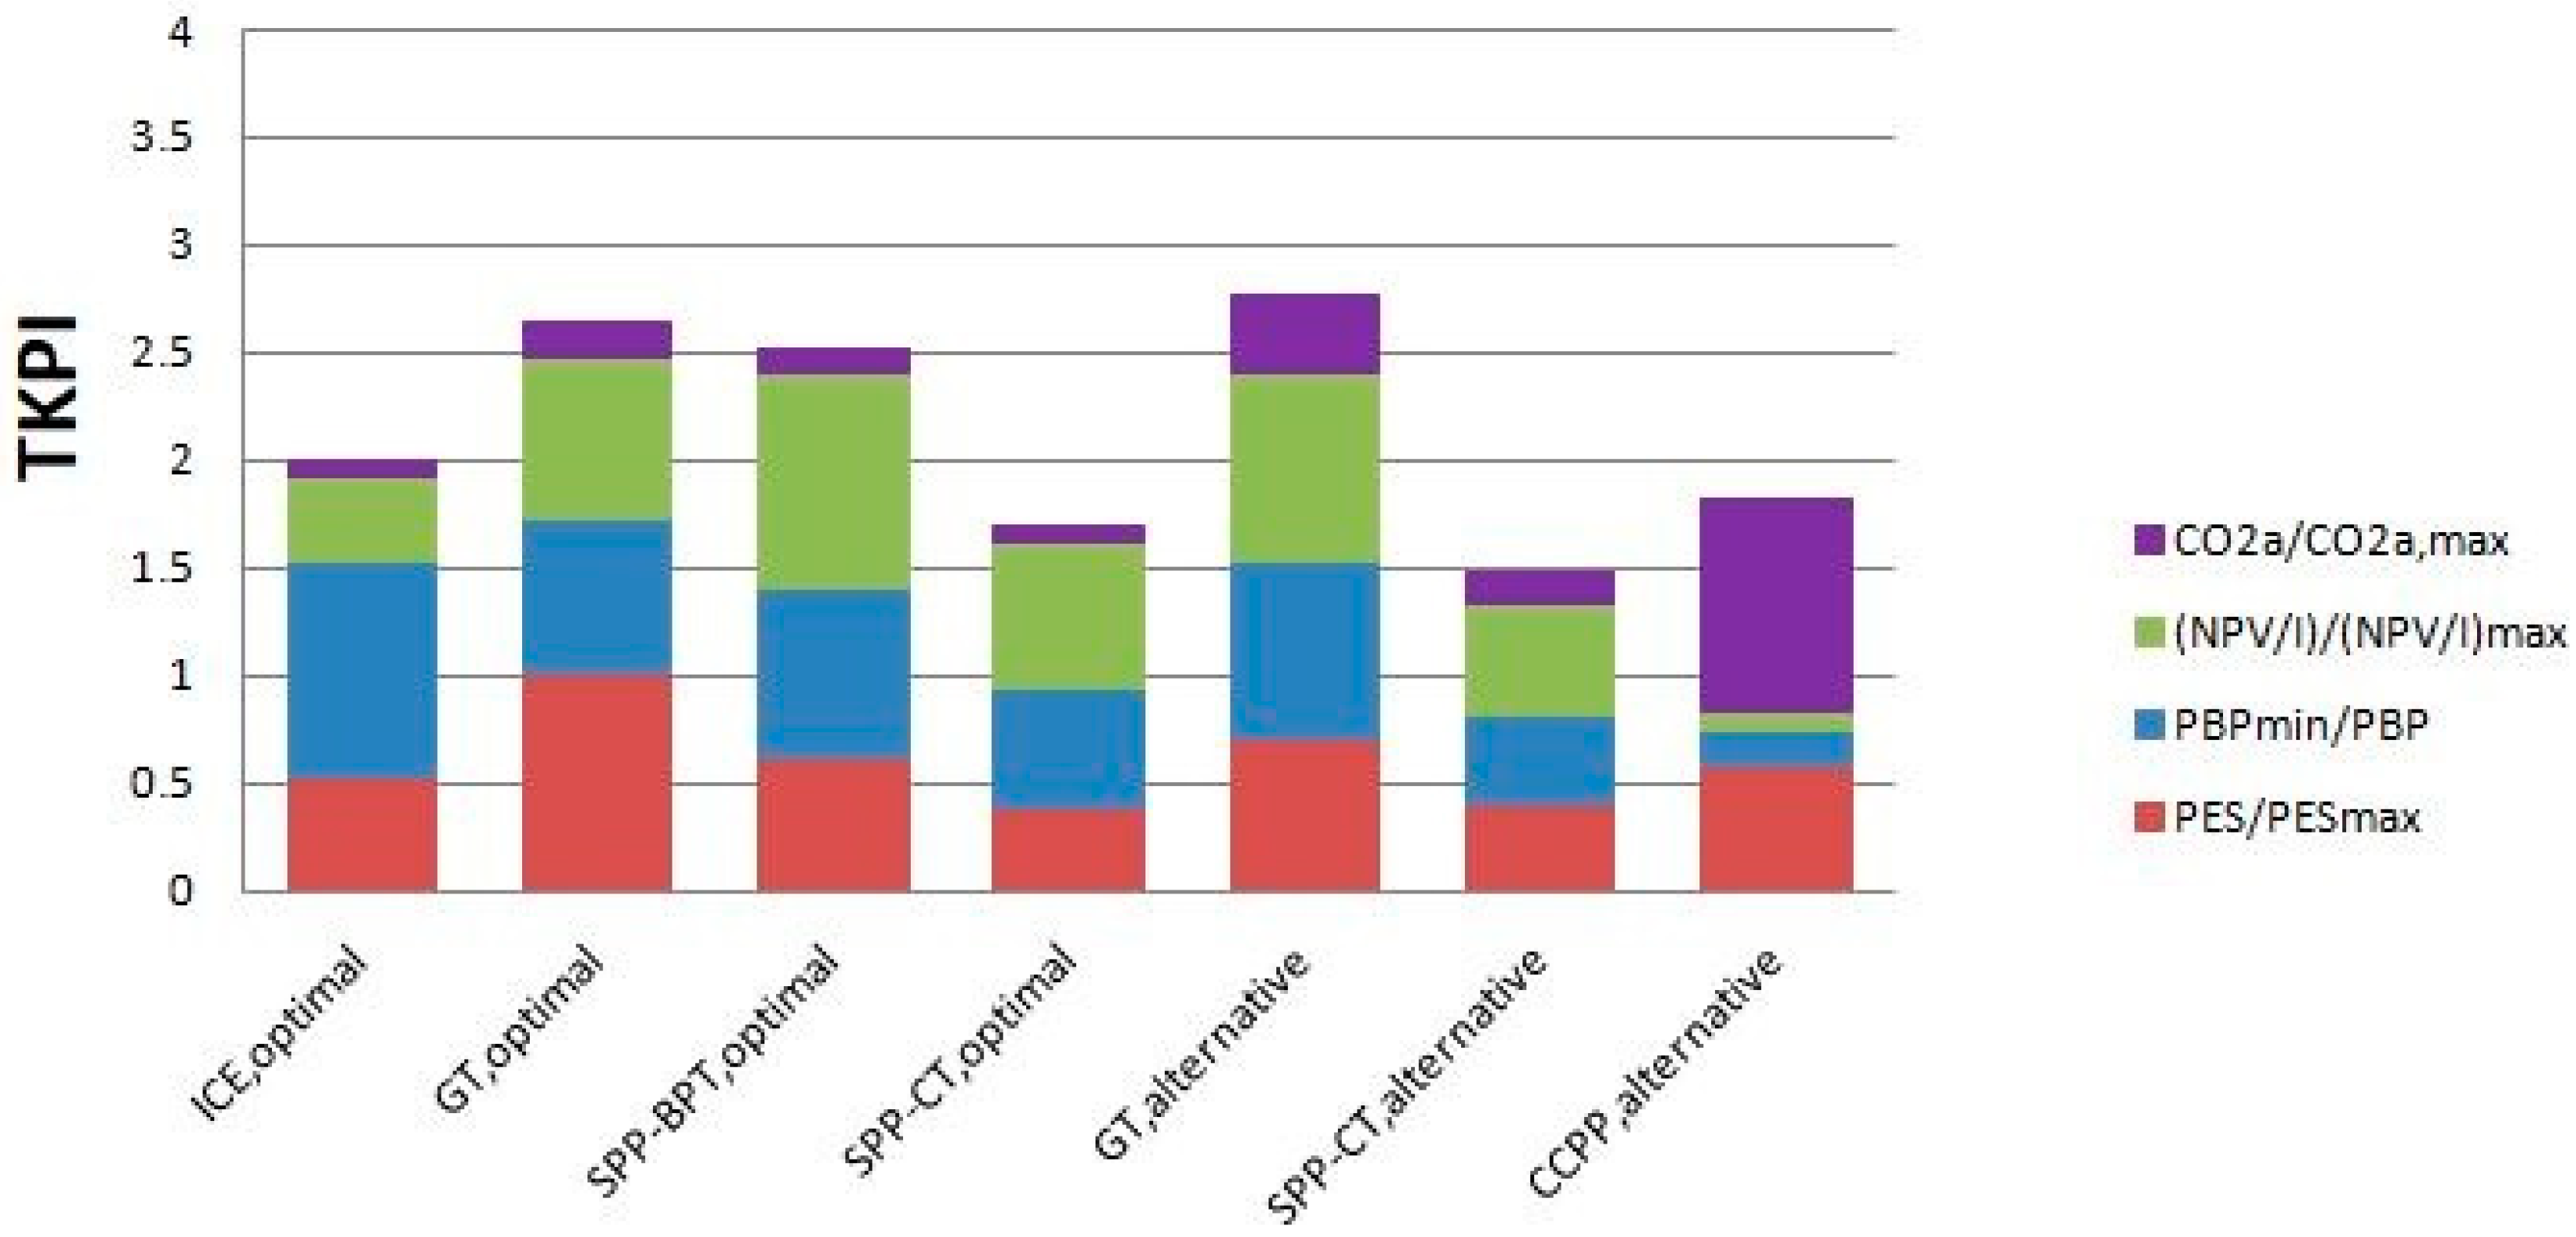
The alternative approach is based, instead, on the admissibility of feeding electricity into the grid. Previous studies developed by the authors, as well as the present one, reveal that cogeneration plants not releasing electricity are today more profitable (in contrast with the situation established by the previous Italian legislation). In fact, results of the present analysis confirm that plants shifted towards to production of heat (satisfaction of the thermal demand) make more sense in an HEC context—it is evident that the optimal design indeed respects the condition of avoided release of electric energy; it was also possible to analyze plants excluded from the optimal design case and to theoretically study contexts remunerating the release of electricity to the grid. The validity of the optimal design criterion is confirmed by the diagram in
Figure 10.
This diagram was realized by considering the maximum (minimum) values of PES, PBP, NPV/I, and CO2,a in a set composed of all seven designed units (four optimal and three alternative), thus not separating the optimally designed technologies from the alternatively designed ones. Gas turbines designed according to the alternative criterion show the highest TKPI; however, given the strong assumptions under which the environmental contribution was evaluated (plants releasing electricity to the grid much benefit from it), such a parameter can be reasonably disregarded and the optimally designed gas turbine is thus confirmed to be the winning technical solution (TKPI = 2.469 against TKPI = 2.390, excluding the environmental contribution).
In the analysis conducted thus far, white certificates are not taken into account in the economic analysis. White certificates are marketable securities which attest primary energy savings achieved in energy final uses through efficiency improvement measures (including cogeneration). Such securities are dispensed by Gestore dei Servizi Energetici (GSE, Energy Service Manager) and are a real income for plants. This means that they indirectly affect the results of the economic calculations here presented, representing a positive value to be added to cash flows. According to the GSE annual report on white certificates [
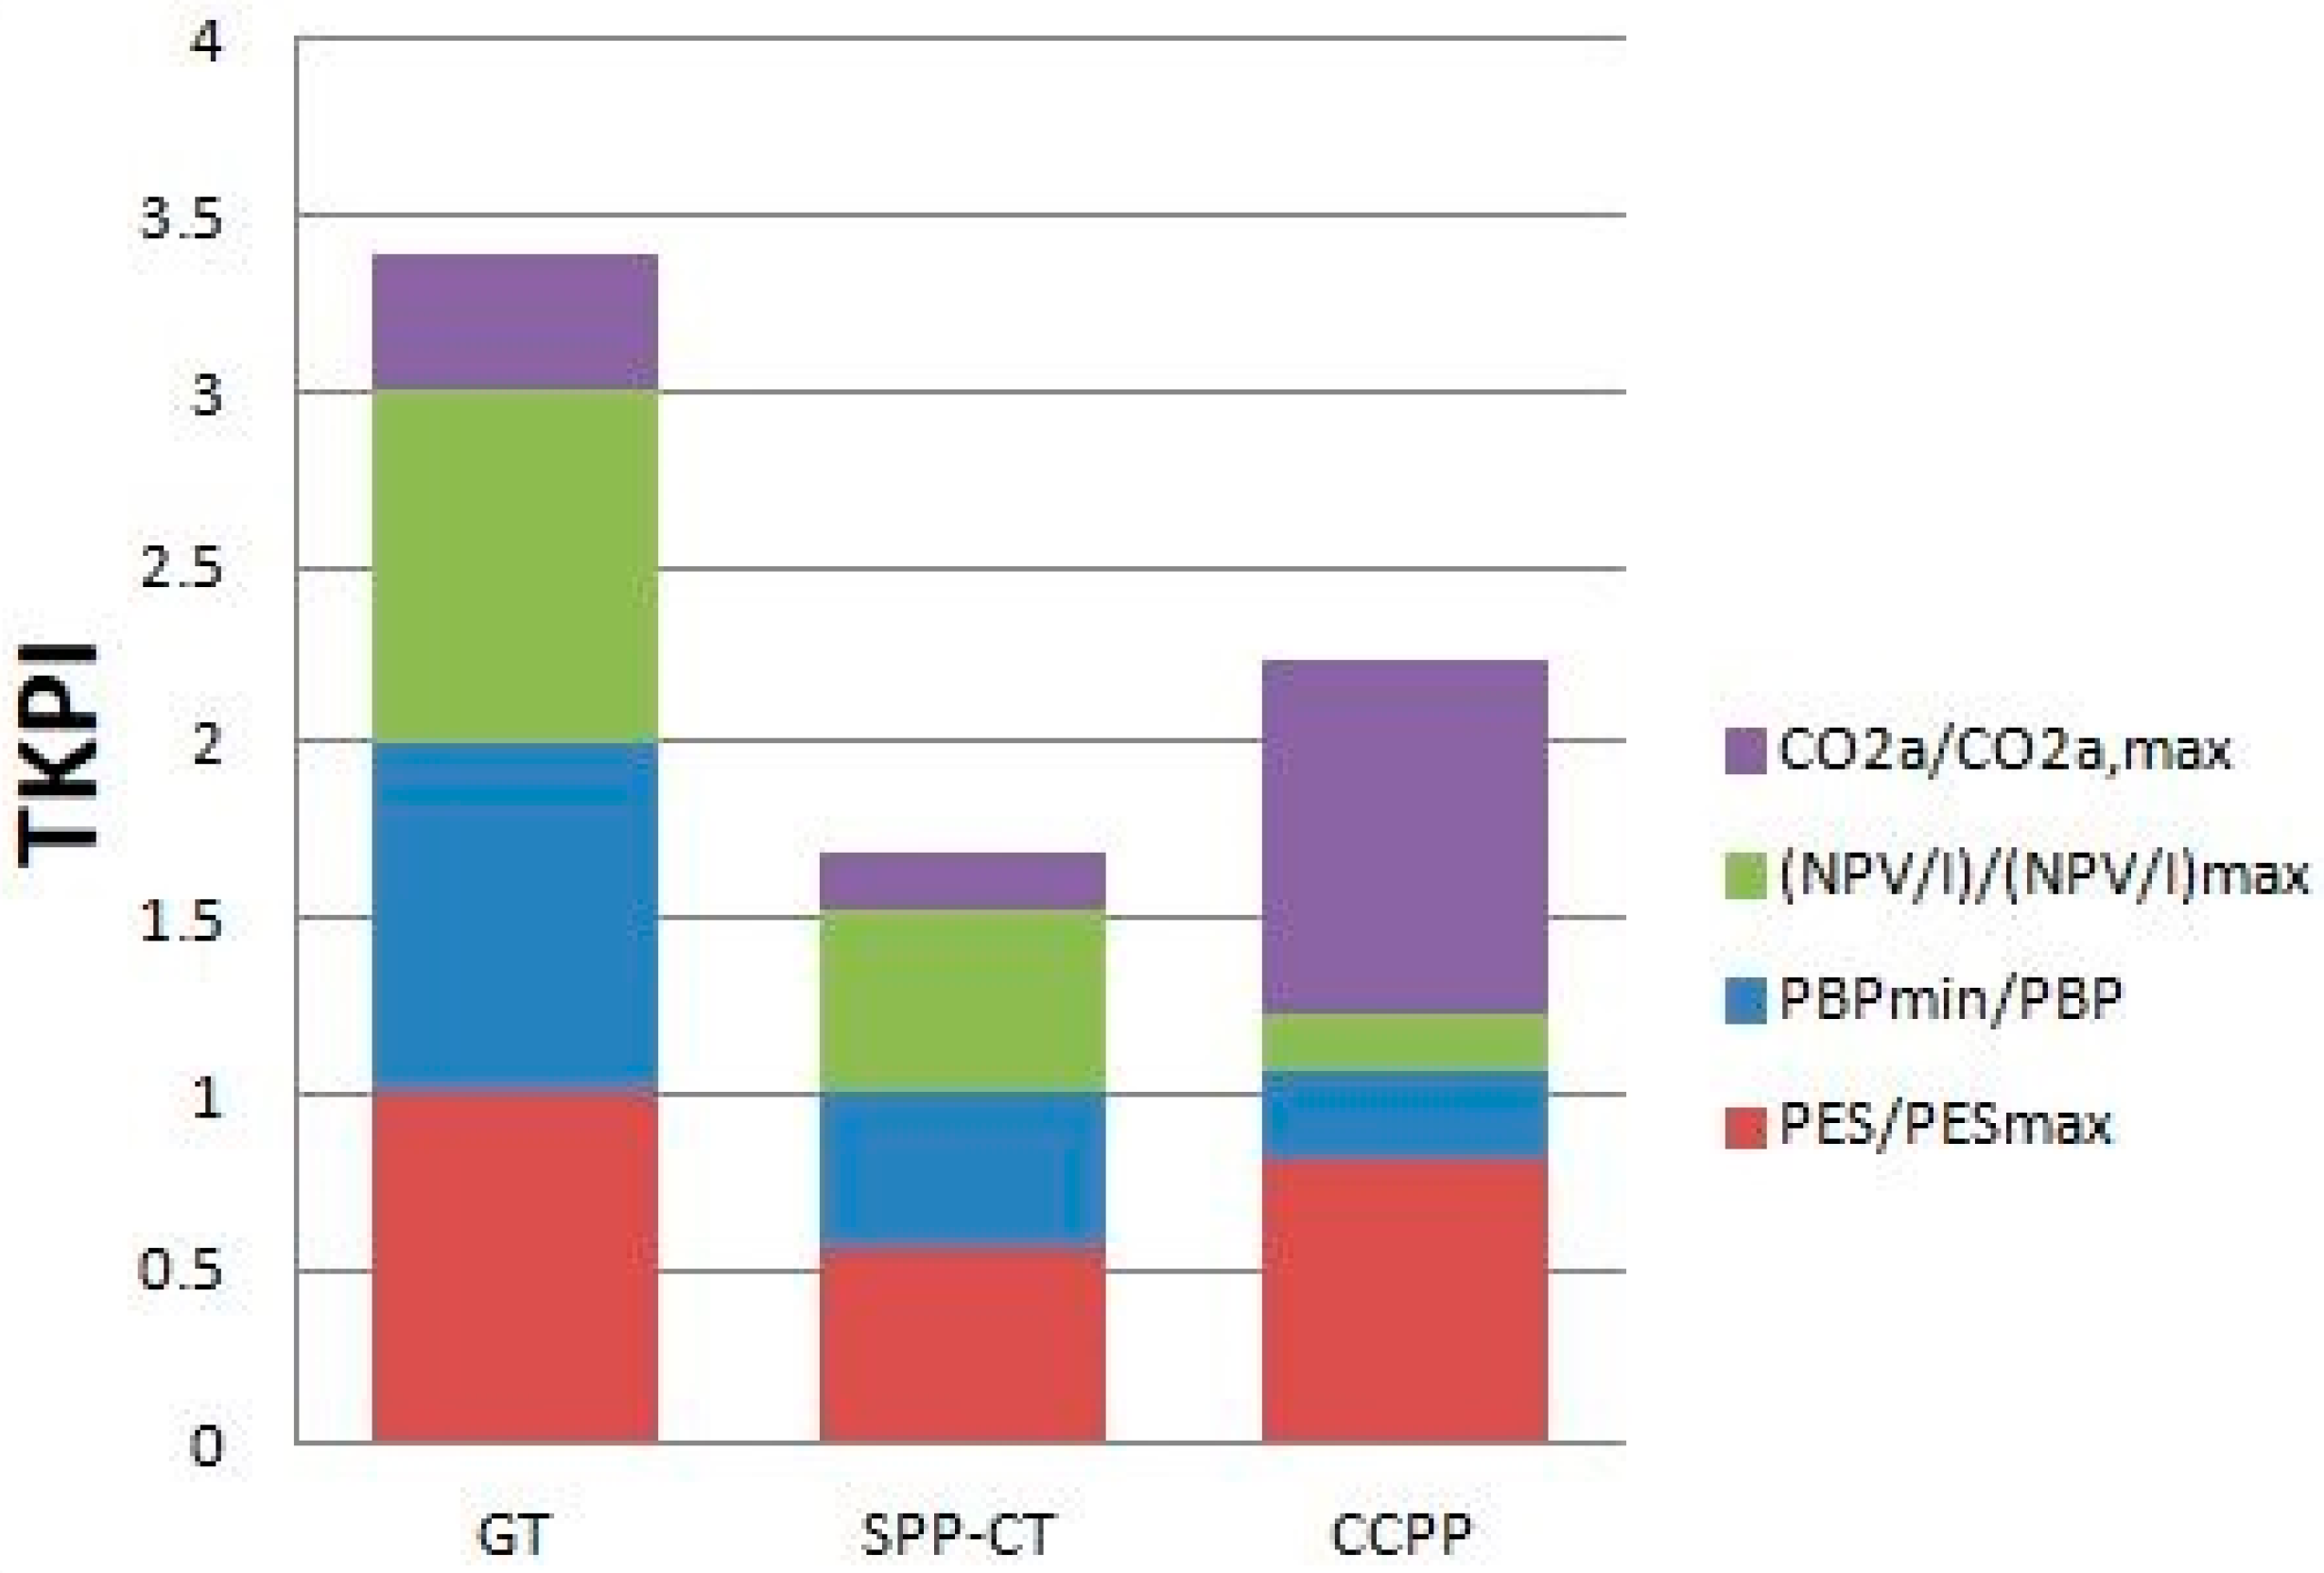
37], in Italy, the average value of incentive securities is equal to 267 €/toe for the year 2017; on the basis of this value, it is possible to price energy savings for each technology (RISP parameter), generating a further positive cash flow. The TKPI parameters can be therefore recalculated: the results are reported in
Figure 11 and
Figure 12.
The difference from the previous case is slight: since all technologies benefit from incentives, the rankings established in the previous case are maintained. Gas turbines, whose TKPI increases to 3.63, are confirmed to be the most suitable technology; combined cycle economic performance is enhanced but not enough to make it a winning solution.
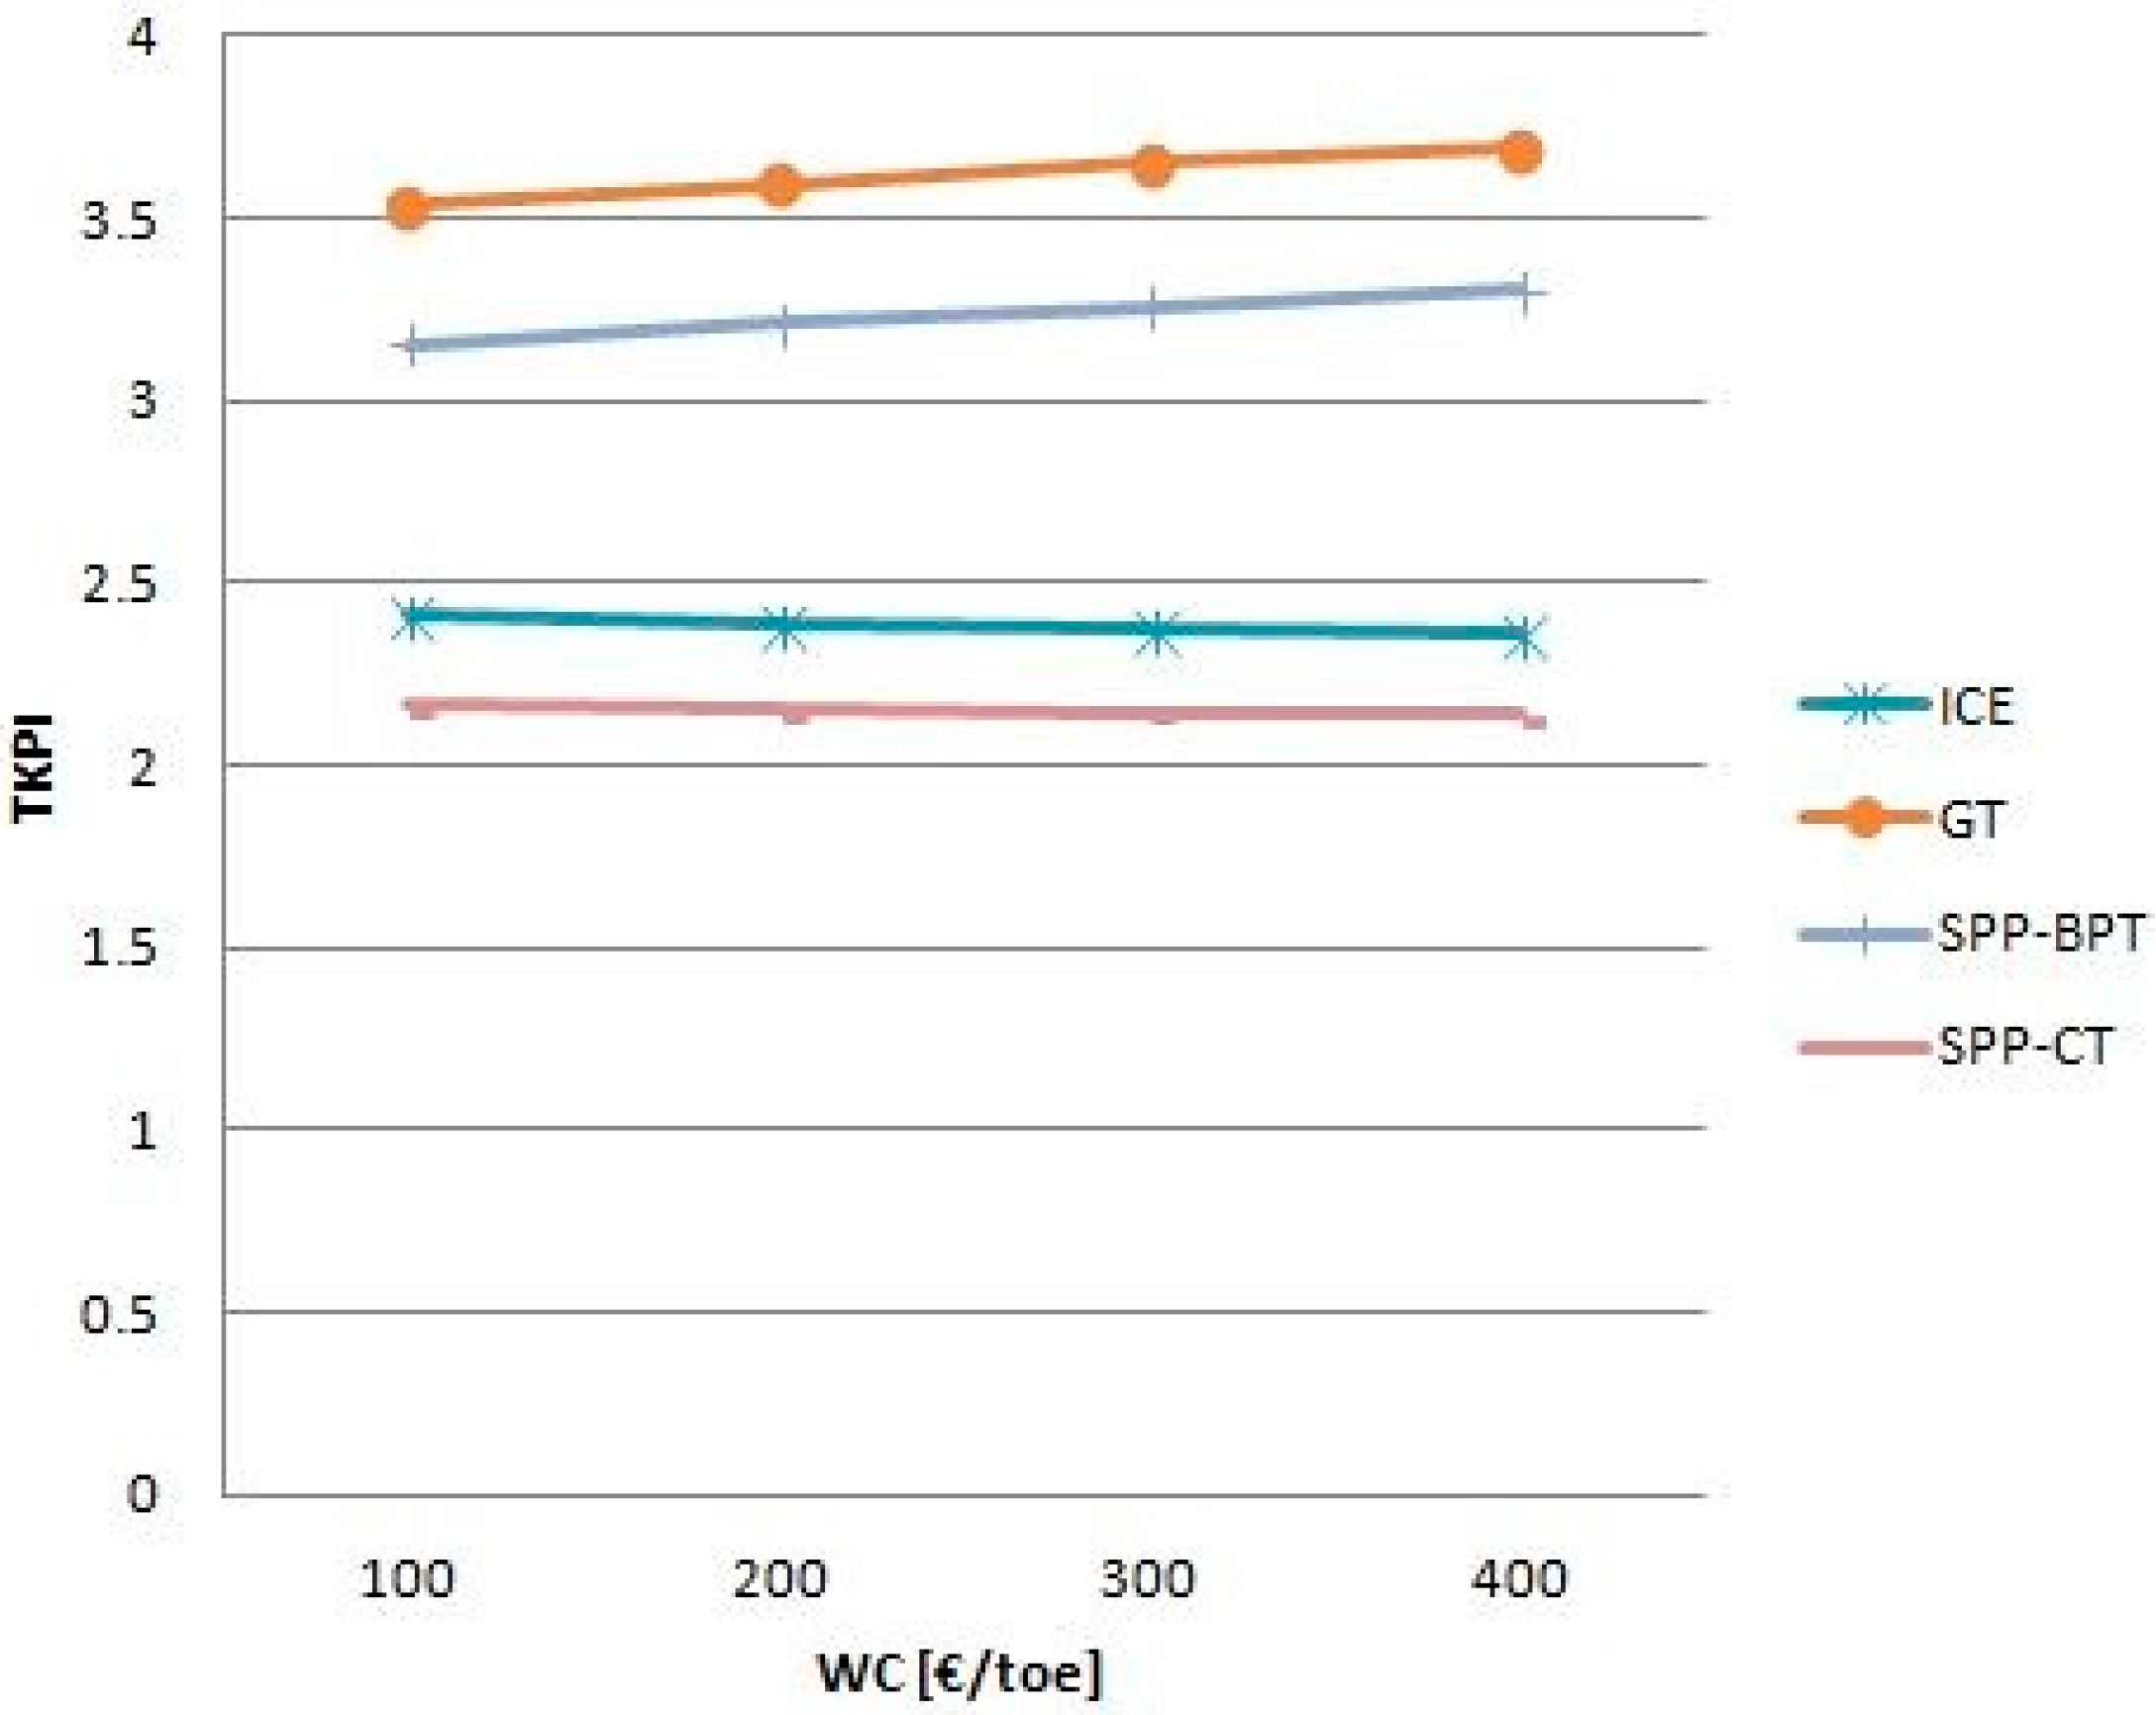
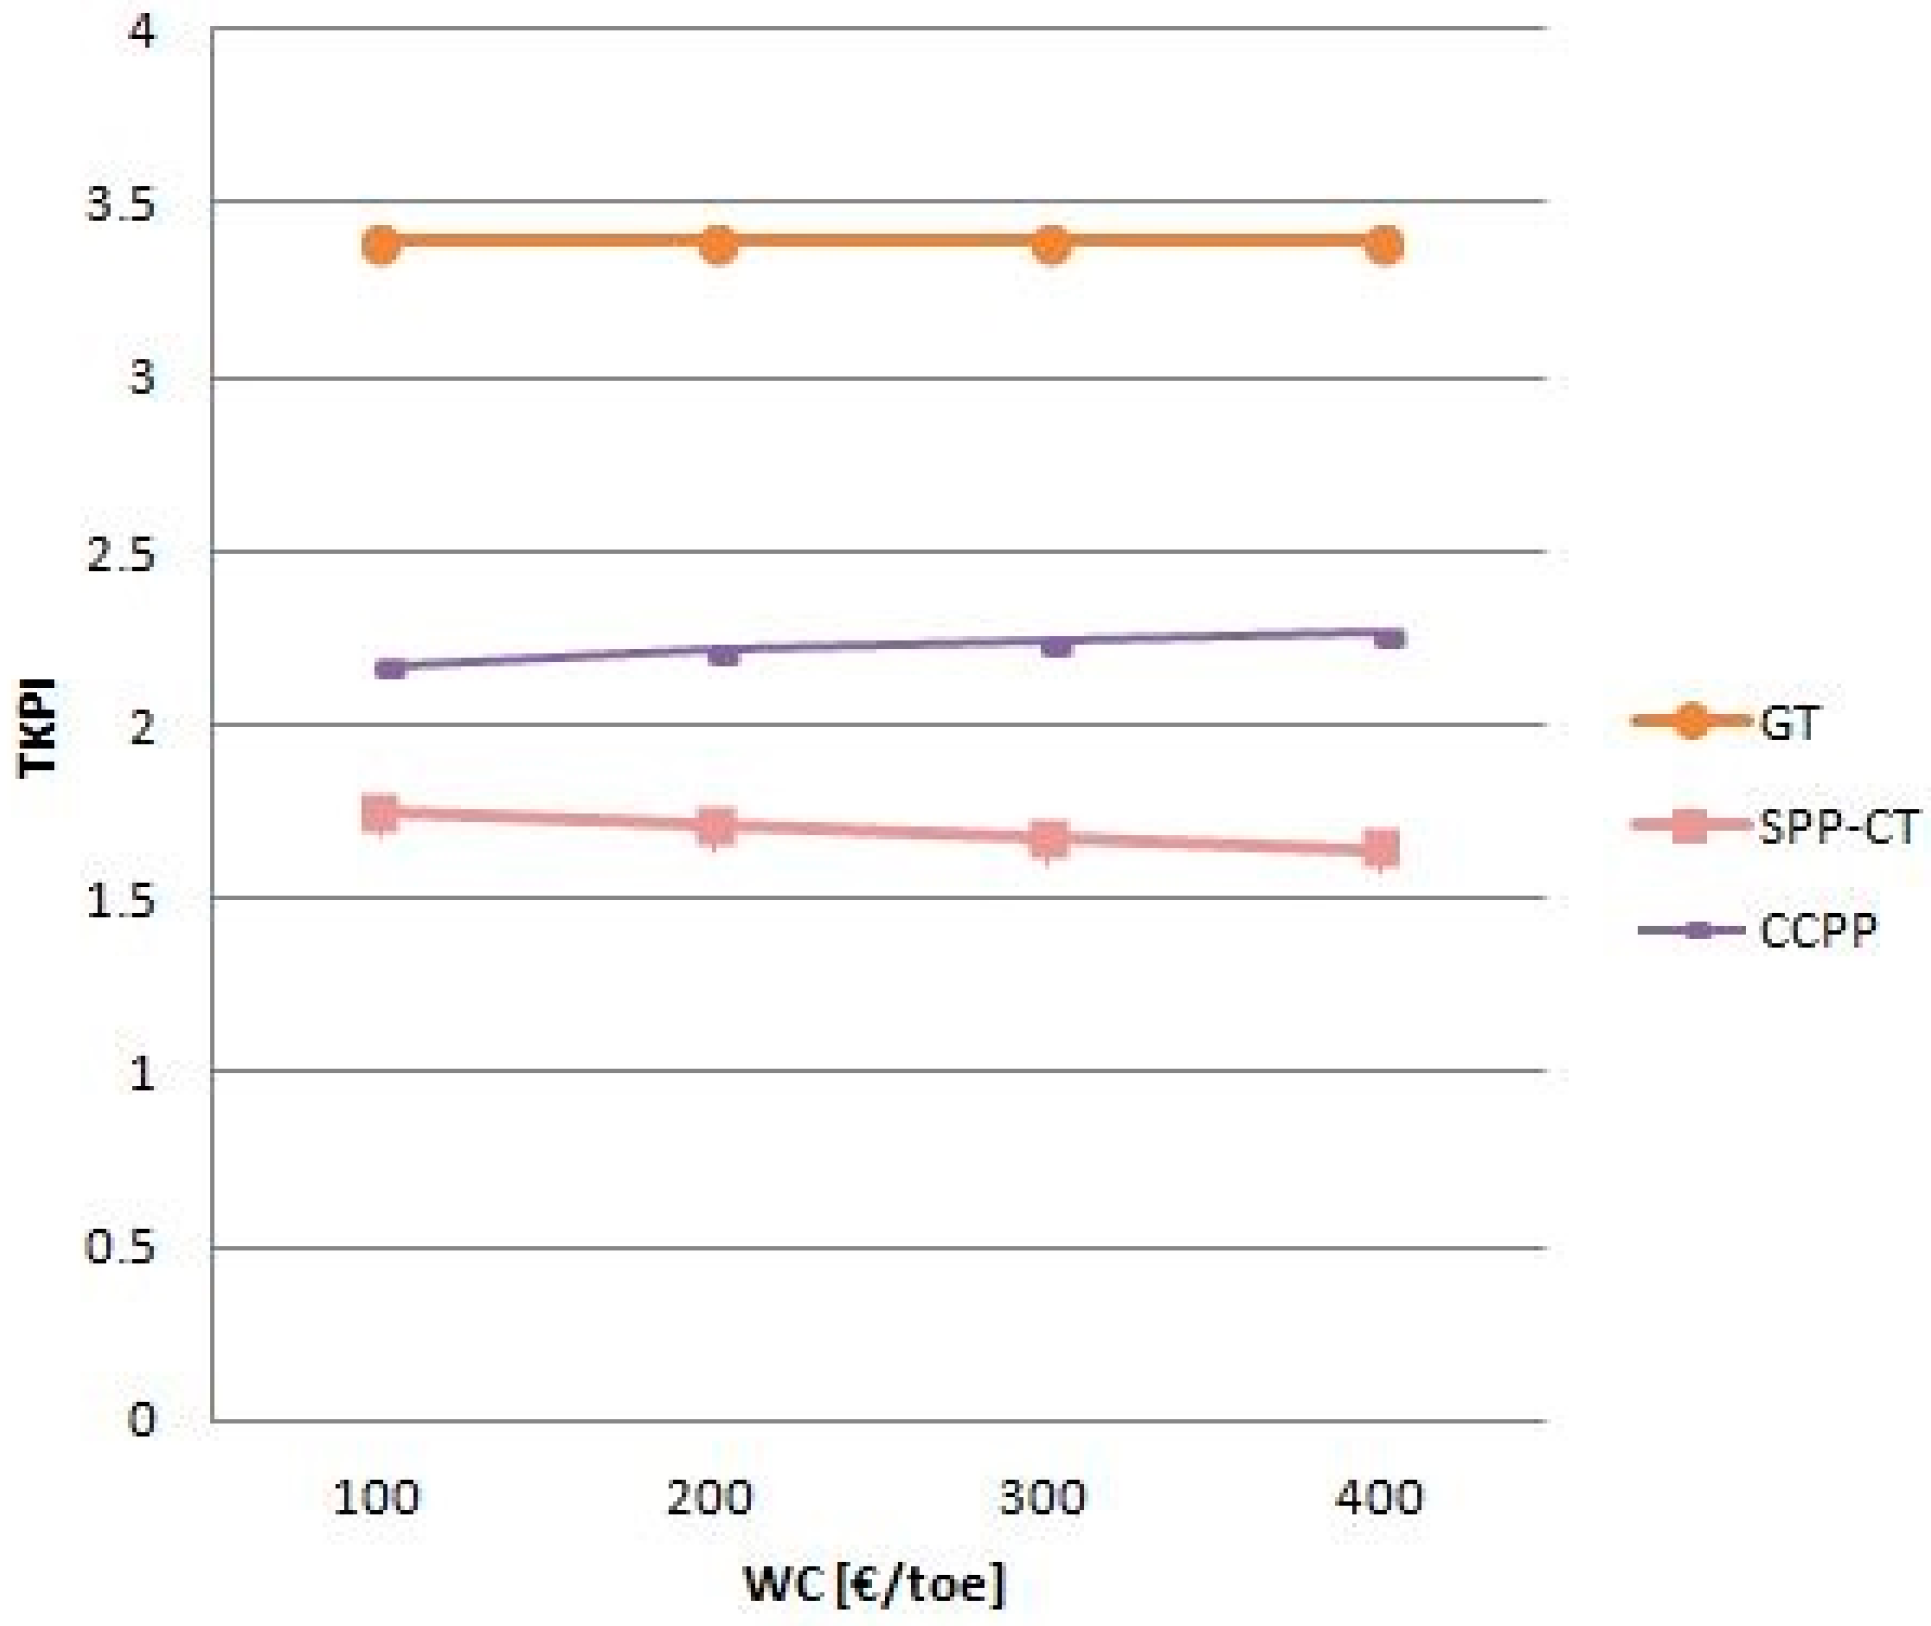
Besides, it must be noted that white certificates are subject to certain variability in the individual national context and that incentives vary in different legislative realities: this is an element that can be taken into consideration by carrying out a parametric analysis as shown in
Figure 13 and
Figure 14. It is clear that the change in terms of performance of the individual technology is overall negligible, precisely because performance slightly improves for GT and SPP-BPT, and stays constant for SPP-CT and even somewhat worsens for ICE: this is caused by the growth of the maximum NPV/I ratio, which is faster than that of the NPV/I ratio for the individual technology, with increasing incentives. In any case, gas turbines are hereby confirmed to be the winning technical solution for a CHP unit coupled with a pulp and paper mill and this statement is in line with the outcome of the research conducted by Shabbir et al. [
26].
Moreover, the entire range of variation for the costs of fuel (cogeneration and non-cogeneration arrangements) and electricity (purchased and sold to the grid), as indicated in
Table 5 and in
Section 3.2.2, has been explored leading to a variety of scenarios; in all of them gas turbine proved to be the best suited technology. In the different analyses conducted by the authors, technology hierarchy results were confirmed and so was the role of gas turbines as the preferable technology among the possible CHP options to be deployed in the pulp and paper industry.
5. Conclusions
The present paper examines a variety of possible cogeneration technologies to be coupled with the pulp and paper mill industry in the context of high-efficiency cogeneration. The analysis was based on the actual production amounts and load diagrams for a particular industrial reality in Italy and was carried out from a thermodynamic, economic, and environmental perspective, overviewing internal combustion engines, gas turbines, steam power plants with backpressure turbine, steam power plants with condensing turbine and combined cycle power as possible CHP solutions. The plant was sized and modelled according to the available data. Thermodynamic simulations were performed by means of GateCycle software and the energy balances of the considered CHP plants were derived accordingly. The economic analysis was conducted in accordance with the principles of high-efficiency cogeneration (HEC), thus following the guidelines issued by the European Commission and making use of the previously obtained energy balances. As a result, energy savings related to CHP plants were properly estimated and economically valued with respect to separate energy production. Results of the different analysis were quantified through energy, economic, and environmental parameters, added together in a total key performance indicator (TKPI) thus allowing an objective comparison among the different cogeneration technologies taken into account. The calculations indicate gas turbines as the winning technical solution, with a TKPI of 3.47, that can be increased up to 3.63 when white certificates are included in the analysis.
The main achievement of the present study is to provide a solid methodology for a simple and robust evaluation of CHP performances allowing different types of power plants to be compared. The approach illustrated in this paper applies specifically to paper mills; however, being based on general evaluation criteria, the research can be potentially extended and successfully applied to other industry sectors as well.


