Article

Environmental Performance of Effluent Conditioning Systems for Reuse in Oil Refining Plants: A Case Study in Brazil

Chemical Engineering Department, Polytechnic School of the University of São Paulo, Avenida Professor Lineu Prestes, 580, Bloco 18—Conjunto das Químicas, São Paulo 05508-000 SP, Brazil
*
Author to whom correspondence should be addressed.
Energies 2019, 12(2), 326; https://doi.org/10.3390/en12020326
Submission received: 12 December 2018 / Revised: 12 January 2019 / Accepted: 14 January 2019 / Published: 21 January 2019

Abstract

:
This study aims to evaluate the environmental and energy effects of the reuse of 1.0 m³ of water in a cooling tower obtained from an oil refinery effluent. An arrangement comprising reverse osmosis (RO), evaporation (EV), and crystallization (CR) was created for water desalination. Six process routes were evaluated; for this purpose, each of them was converted into an specific scenario of analysis: S1: pre-treatment with Ethylenediaminetetraacetic acid (EDTA) + RO + EV (multi-effect distillation) + CR; S2: S1 with pre-treatment by BaSO4; S3: with Ca(OH)2/CaCO3/HCl; S4: S3 with waste heat to supply the thermal demand of EV; S5: S3 with steam recompression in EV; and, S6: S3 with HNO3 in place of HCl. The analysis was carried out by attributional LCA for primary energy demand (PED) and global warming (GW) impacts. The comparison was carried out for a reference flow (RF) of: add 1.0 m3 of reused water to a cooling tower with quality to proper functioning of this equipment. S4 presented the best performance among the analyzed possibilities (PED: 11.9 MJ/RF; and GW: 720 gCO2,eq/RF). However, dependence on other refinery sectors makes it inadvisable as a regular treatment option. Thus, S5 appears as the lowest impact scenario in the series (PED: 17.2 MJ/RF; and GW: 1.24 kgCO2,eq/RF), given the pre-treatment technique of RO-fed effluent, and the exclusive use of steam recompression to meet total EV energy demands. Finally, an intrinsic correlation was identified between RO water recovery efficiency and the accumulated PED and GW impacts on the arrangements that operate with heat and electricity.

1. Introduction

The oil sector continues to be the main primary energy source, contributing with about 35% of global fuel consumption in 2017 [1]. Meeting the demand for oil products, mainly in the industry and fuel sectors, requires large amounts of water, mostly for thermal exchange. This scenario is mostly observed in the countries with the largest volume of oil manufactured goods production, such as Brazil, which occupies the 9th position in the world rank [1]. However, due to Brazil’s local reality—of irregular water density and, therefore, scarcity of this natural resource in large urban centers at certain times of the year, several regulatory agencies have increased their restrictions on water collection and effluent disposal, in order to mitigate the depletion of the national water network. This scenario has stimulated recent research aimed at increasing the efficiency of effluent treatments and, consequently, decrease damage to the extraction and disposal sites of this resource.
Water reuse is an approach that has been gaining ground in this area, consisting in treating part, or even, when possible, the whole effluent and subsequently destining it for the supply of industrial or domestic needs. This practice can equate water demand problems. Nevertheless, water reuse can also lead to environmental impacts as energy resource consumption (fluid heating and pumping), from the synthesis of process inputs and waste generation due to the water reconditioning.
Current literature reports varied contributions on water reuse practices. When the investigations addressed the environmental domain, approaches were once again diversified. Chang et al. [2] evaluated energy use and greenhouse gas (GHG) emissions for urban water reuse systems in Korea, while Hendrickson et al. [3] evaluated the same parameters for an operating Living Machine (LM) wetland treatment system, which recycles wastewater in an office building. The study also assessed the performance of the local utility’s centralized wastewater treatment plant, which was found to be significantly more efficient than the LM. The life-cycle approach was adopted for cases in which the specification of the environmental variable required a systemic scope [4,5,6,7,8,9,10,11]. Morera et al. [4] applied the Water Footprint to assess the consumption of water resources in wastewater treatment plants (WWTP). Their findings indicated that the choice for WWTP systems leads to a significant decrease in grey resources but, on the other hand, also generates a small blue water footprint in comparison to no-treatment scenarios. Cornejo et al. [5] carried out a comprehensive literature review of carbon footprint (CF) reports from water reuse and desalination systems. The study recognized general CF trends associated with the technologies and recommended improvements to this method based on limitations, challenges and knowledge gaps identified throughout the analysis.
The life cycle assessment (LCA) itself was applied to identify impacts resulting from control strategies in wastewater treatment plants [6], verify the environmental performance of large [7] and small scale [8] WWTP, and compare decentralized wastewater treatment alternatives for non-potable urban reuse [9]. LCA was also used to subsidize environmental and economic assessments performed to determine optimal water reuse in a residential complex [10] and develop an eco-efficiency analysis (EEA) framework for the evaluation of treatment systems proposed for greywater recycling in domestic buildings for non-potable uses [11].
Baresel et al. [12] quantified the environmental effects of using the energy grids from different countries (USA, Spain, and Sweden), as well as the option of applying sludge resulting from effluent treatments as fertilizer within water reuse systems for agriculture and industry. Their findings indicate that altering external treatment aspects can impact process performance, compared to seeking out improvements for a given technology.
O’Connor et al. [13] evaluated 14 different process arrangements for the treatment of a pulp and paper mill effluent by the commutative use of six operations: flotation, clarification, use of activated sludge, an upflow anaerobic sludge blanket (UASB) reactor, ultrafiltration, and reverse osmosis (RO). The study assessed climate change (CC), freshwater ecotoxicity (FEC), eutrophication (Eut) and water recovery impacts. The results demonstrate the significant influence of the solid waste originating from the treatment and the use of electricity in CC impacts, as well as the higher RO efficiency for the quality of the reuse water compared to the ultrafiltration technology.
On the other hand, no optimal scenario for all evaluated categories has been determined. Pintilie et al. [14] tested the feasibility of reuse practices in the industrial sector regarding effluents recovered by a treatment plant in Spain, concluding that electricity consumption displays the greatest weight concerning the environmental impacts and that water reuse can be an adequate alternative for non-potable uses, such as applications in the industrial sector.
To the best of our knowledge, however, no studies in the literature are available regarding LCA application in the evaluation of technologies applied for water reuse in the closed looping process itself. This study contributes to the theme, verifying the environmental performance of different scenarios conceived to conditioning the treated effluent from an oil refinery located in Brazil, so that it can be reused in processes within the facility itself. To pursue this aim, attributional LCA was applied according to a ‘cradle-to-gate’ approach.
Apart from identifying which reuse treatment bottlenecks should be analyzed in further detail in order to reduce environmental impacts, such an analysis can subsidize information to water resources managements in situations in which water collection is prohibited by legal regulations.
Environmental performance has the potential to become a management criterion under reuse practices. In addition to its close correlation with economic aspects, the adoption of this approach can support optimization actions in procedural arrangements, and for technology selection.

2. Materials and Methods

The method applied in this study encompasses six steps: (i) specification of the effluent quality upstream from the industrial wastewater treatment plants (IWTP) in the refinery, and the choice of a process use for which recovered water is intended for; (ii) definition of water recovery strategies and setting the analysis scenarios; (iii) description of the recovery systems in terms of their technological approach and operational conditions, as well as resource consumption and emissions; (iv) designing of mathematical models to represent each system, from the data and information obtained in the previous step; (v) application of the LCA technique to establish an environmental diagnosis for each scenario concerning primary energy demand and global warming; and (vi) perform a critical review of the obtained results.

2.1. Effluent Specification and Destination of Recovered Water

The refinery effluent is submitted to a conventional treatment at the IWTP. The primary step consisting of an API oil–water separator and a floating filter removes suspended solids, oils, and greases. The API separator is an equipment used to separate gross amounts of oil and/or suspended solids from the effluents of oil refineries. Its design is based on the specific gravity difference between the oil and the wastewater, which is smaller than that one between suspended solids and water. Thus, the suspended solids will settle to the bottom of the separator, the oil will rise to top, and the wastewater will occupy the middle layer, being recovered separately from the other components [15]. Dissolved solids that assign organic load to the effluent are treated during the secondary step, comprising aeration ponds (complete and facultative) and biodisks.
Finally, in the tertiary step, contaminants that result in color and conductivity, as well as nutrients, metals, non-biodegradable compounds, and volatile suspended solids, are removed from the liquid stream by passing through a clarifier and an activated carbon filter. Table 1 shows the characteristics of a typical effluent from an IWTP. The IWTP output effluent characteristics can vary significantly depending on the type of oil processed, the refinery configuration, and the operating procedures used in the treatment [16]. On the other hand, such information is not easily accessible. Because of this, Table 1 shows concentration ranges of contaminants present in that stream. The limits of each interval were established from data of Gripp [17], Moreira [18], and Pantoja [19] for refineries of the same technological concept but at different periods.
The effluent presents salt characteristics due to the earlier IWTP treatment, where suspended solid, greases, oils and organic loads have been removed. As the scope of this study begins precisely at this point, the environmental IWTP performance was disregarded.
The process adopted to determine the purpose of the reclaimed water took into account two criteria: (i) volume consumed by productive sector or activity; and (ii) water quality restrictions for each type of use. The worldwide reference for specific water consumption in refining processes ranges from 0.7–1.2 m³ water/ m³ processed crude oil [20,21]. Regarding Brazilian plants, this demand is distributed as follows: 46% replace losses occurring in cooling towers; 26% serve the steam production in boilers; 9.0% are allocated to fire-fighting systems; and the remaining (~19%) is absorbed in chemical preparation (dilution), cleaning, and for human consumption [22].
The boiler feedwater requires the most restrictive quality standards in terms of salt, organic matter, and dissolved gas concentrations. The cooling water makeup predisposes intermediate quality levels; in such cases limits are established in order to regulate (or prevent) scale development, corrosion, and slime and algae formation. In general, water used for firefighting does not require any treatment [23]. Considering these arguments, in addition to water recovery system performance regarding the quality of the final product and the effectiveness with which such thresholds can be met, the feed from one of the refinery’s cooling towers was established for the final use of the desalinated water.

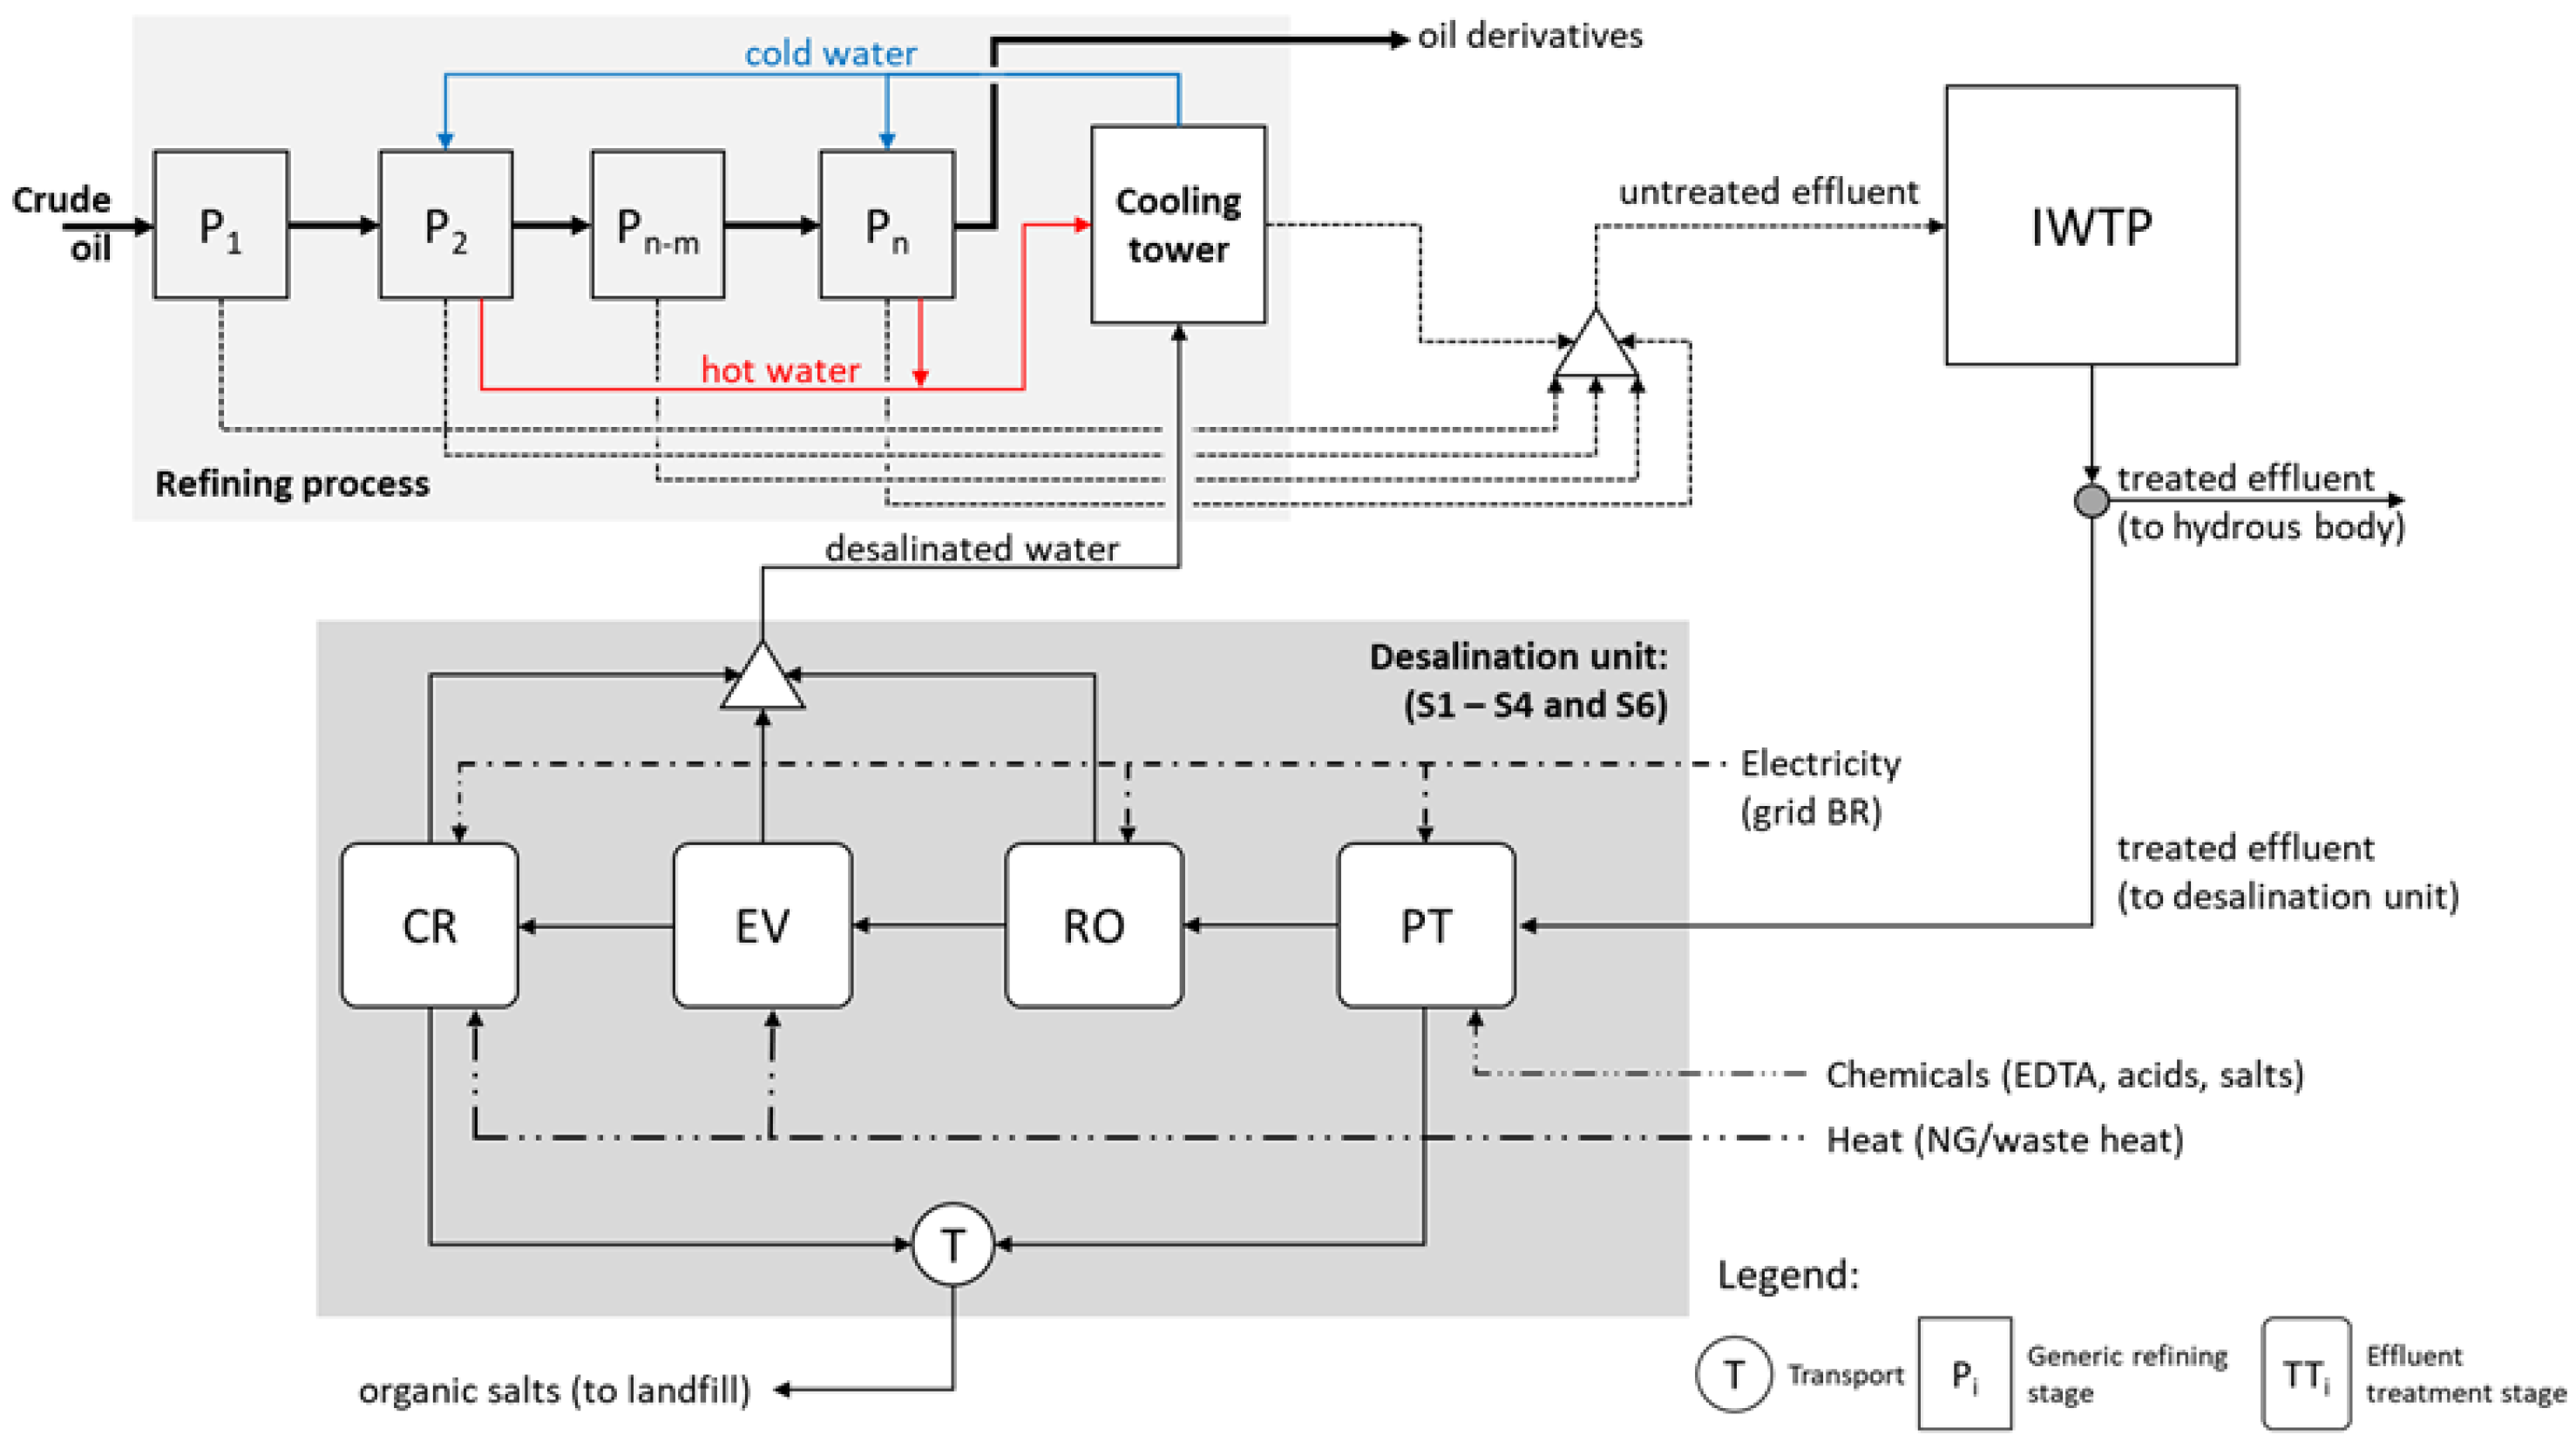
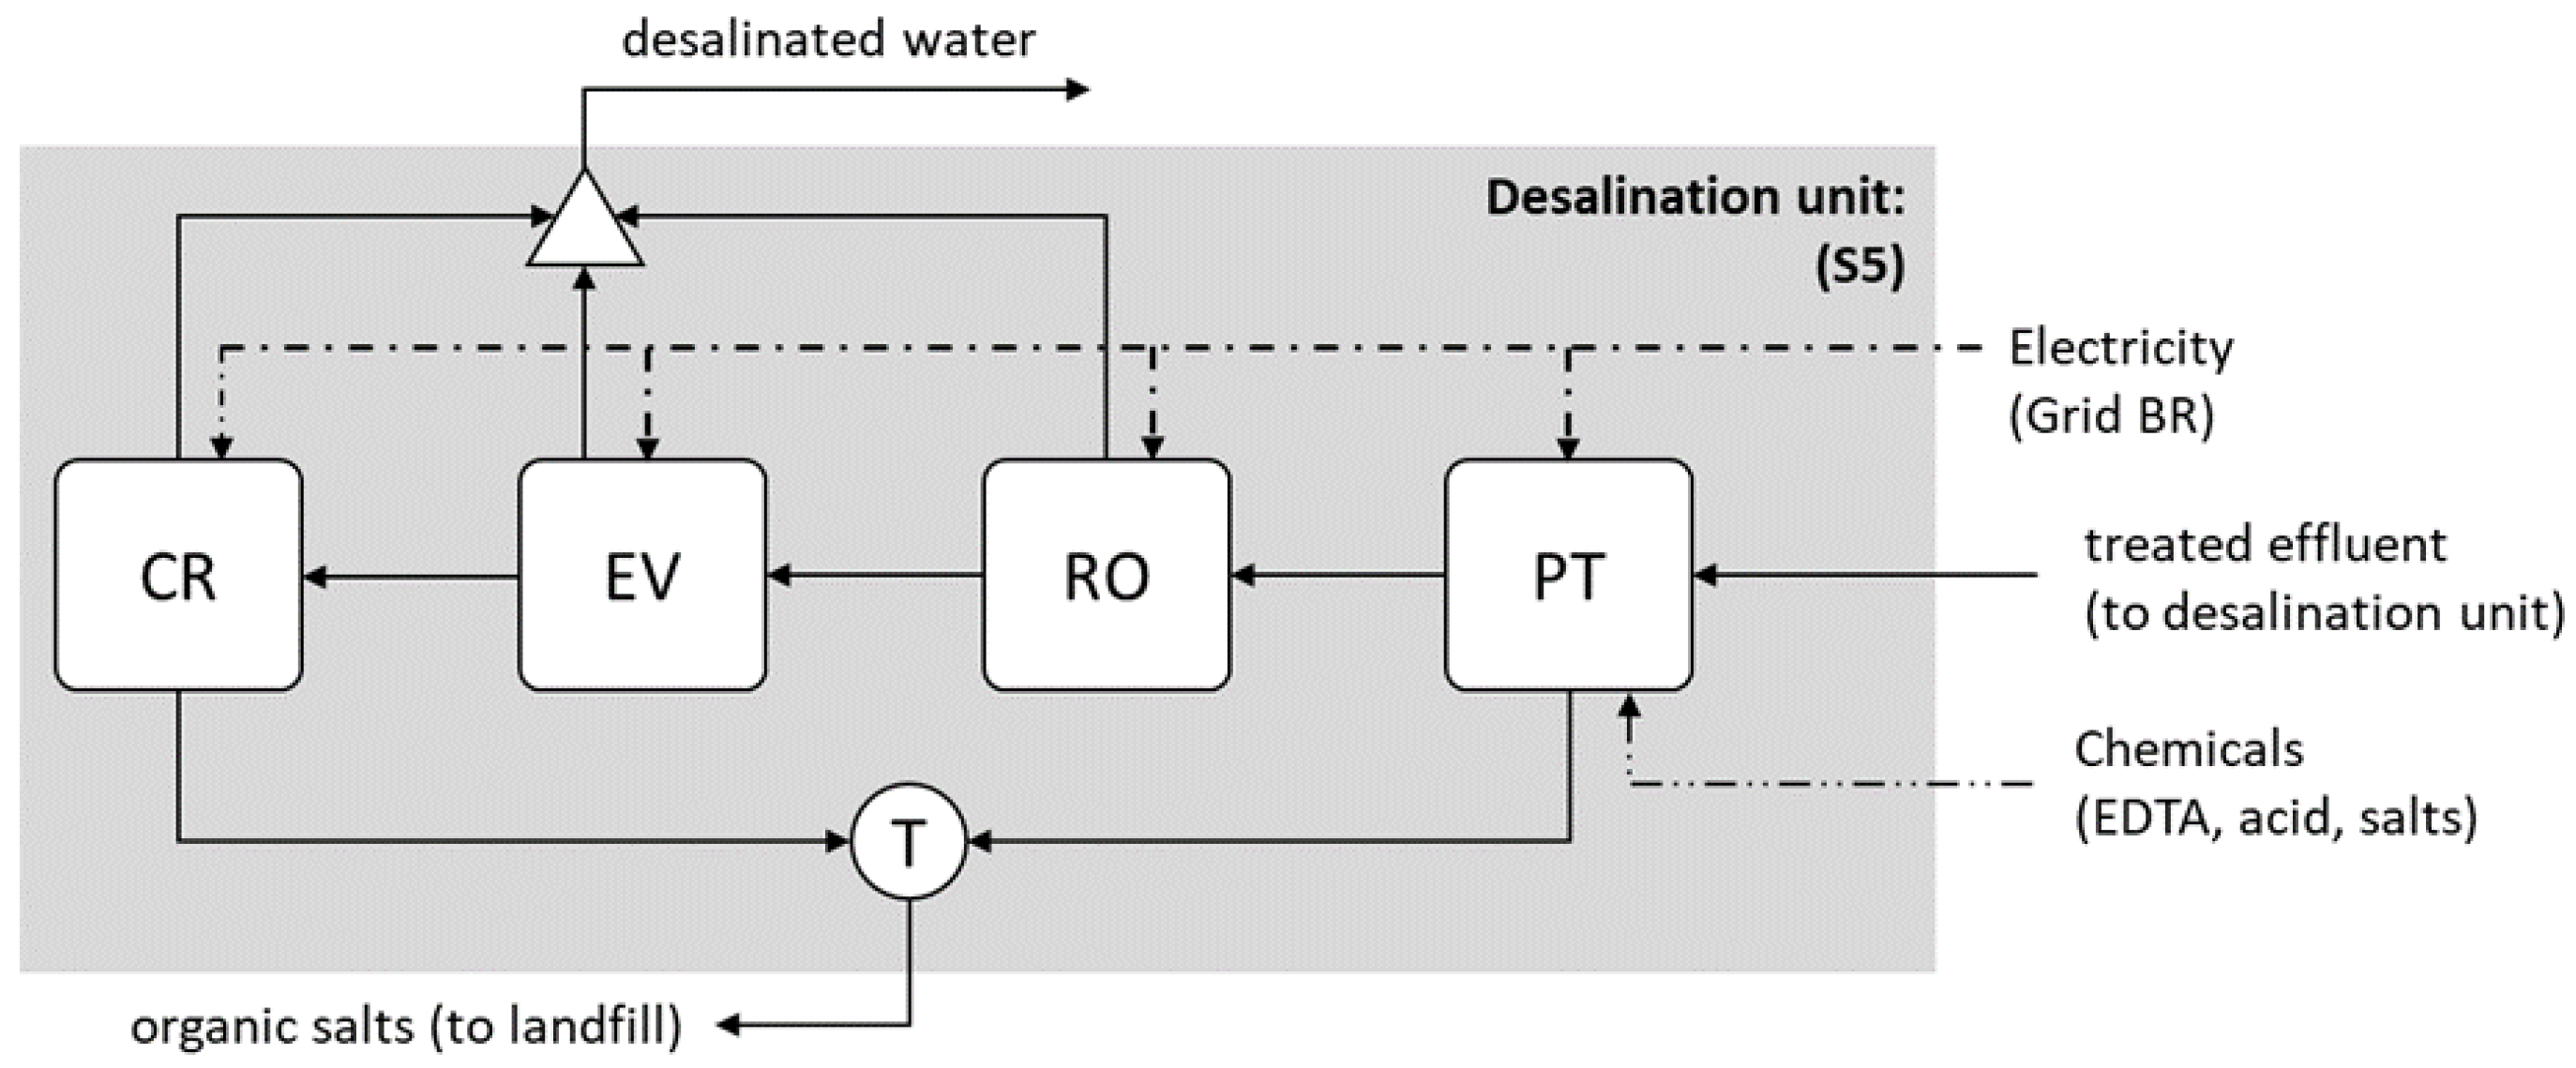
2.2. Setting the Analysis Scenarios and Description of the Recovery Systems

The effluent quality at the outlet of the tertiary IWTP step (Table 1) obligates a complementary removal of metals (Ca2+, Ba2+, and Na+), chlorides (Cl), and carbonates (CO32−) to reconditioning this flow as makeup water in the cooling tower. In this regard, six water recovery arrangements were defined. RO, evaporation (EV) and crystallization (CR) operations are common to all strategies. In contrast, these vary in how the effluent is pre-treated before entering the RO and due to the technology adopted in the EV process.
Based on precipitation principles, pre-treatment aims to remove ions that may reduce, or even compromise, RO performance. The definition of the chemical agents applied in this stage took into account their removal potential, through mechanisms that affect ion solubility in aqueous solutions. Regarding the EV technology, two alternatives were investigated: (i) multi-effect distillation, and (ii) steam recompression. Each recovery strategy resulted in an analysis scenario, coded as S1 to S6. Table 2 presents some specificities for each scenario regarding technological conditions and the origin of the energy supply.
S1 was defined as the baseline scenario and, therefore, no pretreatment technique was charged for this situation. Due to the high ion concentrations in the effluent, a risk for encrustations in the osmosis membrane is noted, making it necessary to add anti-fouling reagents to the liquid effluent at the entrance of the RO module. In S1, this situation was addressed by dosing EDTA, often applied in such cases. However, EDTA excesses can cause side effects, i.e., biofouling, harmful in extreme circuit closure situations, such as the Zero Liquid Discharge regime [24].
In S2, pre-treatment occurred by desupersaturation through the addition of BaSO4 seeds (BaDs). This strategy aims to remove barium sulphate itself through its accumulation in the presence of the crystals formed by this salt [25]. BaSO4 is commonly found at supersaturation concentrations in industrial effluents (particularly in oil refineries), and is one of the main fouling agents in RO plants [26].
The coprecipitation method (CPT) by alkalization to pH = 11 applying Ca(OH)2 and CaCO3 seed addition [24] was adopted in S3 for pre-treatment. This allows for the precipitation of not only a large part of the calcium carbonate in solution, but SiO2 as well, which is also a limiting component in RO, due to its decreasing solubility with increasing acidity levels (pH). CPT may also lead to the removal of metal ions—Ba2+, Sr2+, Fe2+, Mn2+, and Cd2+—by incorporation into the precipitating CaCO3 via isomorphic adsorption, absorption or substitution [27]. The supernatant arising from the CPT stage should be acidified to pH = 8.0 to prevent scales mainly in the RO system. In S3 and S5, this occurs via the addition of HCl (1.0 M) and in S6, with HNO3 (1.0 M).
S4 assessed the situation in which the thermal energy consumed by EV and CR results from waste heat. In this case, part of the heat released to the atmosphere from the boiler chimneys, or even by the cooling tower, is reused by the desalination unit. This option is economically attractive as it reduces heat generation costs and waives the use of RO—and, therefore, of also any pre-treatment method—by the system [28].
S5 examined a substitutive arrangement of S3, in which the energy demand of EV is supplied exclusively by electricity. This scenario assumes a technological change in the evaporation stage, from which the multi-effect distillation, adopted regularly by scenarios S1–S4 and S6, is replaced by steam recompression [29]. This technology applies steam produced in the evaporator itself in order to lead the evaporation phenomenon at that equipment. For this purpose, a compressor driven by an electric engine is used to raise the functions of state (temperature and pressure) of the steam. In addition to evaporating some of the water existing in the saline solution, the vapor stream is also used to increase the temperature of effluent fed in the evaporator [30].
Since electrolysis, a technology conventionally adopted to obtain HCl, requires high electricity consumption [31], a variant of S3—coded S6—was also investigated, in which the acidification of the supernatant leaving CPT was carried out by the addition of HNO3, as described previously. The use of nitric acid becomes viable because the ion NO3 is, with a few exceptions, quite soluble in water. Therefore, its presence in the effluent does not revert to the risk of fouling in the subsequent treatment stages.
Finally, it should be noted that effluent pretreatment by BaDs increases the water recovery rate by 2.8% at the RO stage ( η S 2 ) in comparison to that observed in the baseline scenario. In cases where the action occurs via CPT (S3, S5 and S6) the efficiency gain is even more expressive, surpassing η S 1 in about 13%.

2.3. Mathematical Model Design

The Hydranautics® ‘IMS Design’ computational tool was used to model the RO unit. The design of this stage considered an average limit flow of Q ¯ = 20 Lmh, maximum limiting polarization concentration (βmax = 1.18), and a standard high saline rejection membrane CPA7 MAX. It was also assumed that RO pumps achieved average yields η ¯ = 87%. Except for S5, all the assessed scenarios adopted the multi-effect distillation technology for the EV stage. In such cases, a heat consumption of 230 MJ/m3 of effluent to be treated was required to place the steam under process conditions, and 9.00 MJ/m3 of electricity were employed in pumping operations [31]. In S5, evaporation occurs by steam recompression, therefore expending only electricity. A unit that operates with this technology achieves a consumption of 115 MJ/m3 [28]. Regarding the CR stage, the effluent flow fed to the desalination system (250 m3/h) also justifies the use of steam recompression [32]. The energy demand related to the crystallization technology is of 238 MJ/m3 [29]; this performance was evenly considered for modeling all scenarios.
The waste heat that meets the thermal demand of S4 was modeled as an elementary flow. In methodological terms, this decision represents the elimination of all the environmental burdens associated with this flow (and the impacts arising from it) generated by anthropic interventions prior to its use by the desalination system. This is supported by the hypothesis that heat, one of the crude oil refining residues, is revalued in S4, when it becomes a process fluid. For EV, the energy decrease assumed in other scenarios (9.00 MJ/m3) was also adopted for S4. In contrast, the modeling of CR stage admitted that fluid pumping would consume about 576 MJ/t of obtained salt. This value was estimated by Jongema [33] from a thermodynamic approach based on an exergy analysis.
The precipitation estimations were performed using an OLI Systems Inc. simulator®, which provides the approximate compositions of the formed salts. For S1, this calculation included an additional rate of 4.0 ppm EDTA. In S2, it was assumed that the exchange of BaSO4 seed is performed once a year (C ~ 10 g/L). Moreover, a consumption of 79.2 kJ/m3 for agitation in the precipitation stage and a monthly cleaning of the equipment with HCl solution (pH = 3.0) were also considered.
S3 includes an electricity consumption of 317 kJ/m3 from shaking in the coprecipitator, the insertion of 12.5 g/L CaCO3 seeds (annual renewal) and the acidification of the supernatant obtained from the precipitation stage (addition of HCl, 1.0 M) to achieve pH = 8.0, in order to prevent alkaline incrustations.
The transports considered in the models were the piping that leads the recovered water from the desalination plant to the cooling tower (L ~ 200 m) and the salt from the precipitation and crystallization stages to a landfill located 20 km from the refinery. Finally, the Brazilian energy matrix (BR grid) was the exclusive source of electricity supply from the desalination system in all analyzed scenarios.

2.4. Life-Cycle Modeling

2.4.1. Scope Definition

The environmental diagnoses were performed by attributional LCA, under a ‘cradle-to-gate’ approach and in line with the guidelines provided by ISO 14044 standard [34]. A reference flow (RF) of ‘add 1.0 m3 of reused water to a cooling tower within quality requirements that allow the proper functioning of this equipment’ was defined to carry out the analyses.
Figure 1 displays an overview of the set of elements, highlighting all the interconnections among the refining process, the IWTP, and the water recovery system. The product system that represents scenarios S1–S4 and S6 is contained in the dark gray rectangle. Figure 2 details the same arrangement for S5. Modeling of the Product System was based on primary and secondary data, that express local conditions. No multifunctionality was found.
The life cycle impact assessment was carried out in two levels. First, the energy consumption of the process in terms of primary energy demand (PED) was quantified by the cumulative energy demand (CED) method—v1.10 [35], which addresses the contributions of the different energy sources, both renewable (biomass: RB; wind: RWD; water: RWA) and non-renewable (fossil: NRF; nuclear: NRN; biomass: NRB). In the second level, the environmental effect of global warming (GW) was calculated by the ReCiPe 2016 Midpoint (H) method—v1.13 [36].

2.4.2. Life Cycle Inventory (LCI)

The effluent concentrations at the input of the process train (Table 1) are primary data obtained from a refinery. In contrast, electric energy and natural gas (NG) supplies were modeled from secondary data. The electricity generation (BR grid) was edited for Brazilian 2015 conditions [37]. Hydropower still remains the most expressive source of energy supply (64% of the BR grid) and biomass (8.0%) was expressed by sugarcane bagasse. For coal (4.0%), a mixed supply model (national and Colombian) was created considering mining operation and the distances of the Brazilian mines to the main thermoelectric plants [38]. For the natural gas from the BR grid (13%) and for heat supply, a model obtained from the Ecoinvent database was tailored to Brazilian conditions considering local offshore extraction, activities involved in refining raw natural gas and transport of final product.
In Brazil, inland transport occurs, mainly, by road. The diesel consumed in these actions was customized from the LCI ‘Crude oil, in refinery/US’ available at the USLCI database, [39] once again considering the procedural and technological requirements practiced in the country. The inputs and auxiliary materials, such as EDTA, barite and calcium hydroxide were edited from the Ecoinvent datasets entitled ‘EDTA, ethylenediaminetetraacetic acid, at plant/RER U’ [40], ‘barite, at plant/RER’ [41] and ‘lime, hydrate, loose weight at plant/RER’ [42] to more closely reproduce the national reality.
The same approach was applied to HCl production (adjusted from the Ecoinvent: ‘Hydrochloric acid, 30% in H2O, at plant/RER U’) [31], HNO3 (whose LCI ‘nitric acid, 50% in H2O, at plant/RER U’ existing in Ecoinvent was adapted) [31], and water (converted from Ecoinvent: ‘Tap water, at user/U’) [31] used for dilution of concentrated acids to 1.0 M. As in the case of diesel, the original energy inputs—electricity, NG, the diesel itself and other petroleum derivatives—were replaced by inventories created specifically for this study.

3. Results and Discussion

Table 3 describes the environmental PED and GW impacts of the systems included in the S1–S6 scenarios, generated for the supply of 1.0 m3 of recovered water for a cooling tower at the refinery. S4 displayed the lowest impacts of the entire series for both categories, mainly due to the use of waste heat as a thermal energy source for the system. On the other hand, S1 (baseline scenario) displayed the worst performance indices in the same analyzed dimensions, due to the absence of effluent pretreatment admitted for RO. This condition overloads the osmosis system, which then presents reduced water recovery rates (Table 1), and causes all the elements of the arrangement to require greater heat and electricity amounts in order to generate water within the quality standards required by the cooling tower. The adoption of pre-treatment methods improved the PED performance of all scenarios. The use of BaDs (S2) led to a 13% reduction in impact with respect to S1, whereas the gains were even more expressive with CPT, reaching 55%, 66%, and 54% attenuation, respectively for S3, S5 and S6.
The technological change applied to EV also brought benefits to the category, since the accumulated PED for S5 was 24% lower than for S3. On the other hand, the use of HNO3 (S6) instead of HCl (S3) did not generate significant energy behavior variations.
This exchange in positions is justified because S1–S3 and S6 present finite demands for thermal energy in EV (Table 4), which are supplied by natural gas, while S4 uses more heat during the EV process than the other scenarios (230 MJ/RF). However, due to waste heat, this utility does not contribute to PED impacts. S5 does not make use of thermal flows during this stage of the process. On the other hand, S4 and S5 present the highest electric consumption rates among the evaluated scenarios (13.1 and 10.4 MJ/RF). The BR grid, predominantly hydroelectric energy, meets these demands [37], with RW as the impact agent.
As depicted in Table 4, natural gas consumption for heat generation in S1/EV constitutes the main NRF contribution source, and thus, PED for this scenario. The effluent pretreatment raises electrical S2/RO consumption in 19% in relation to S1. In contrast, the use of BaDs makes η S 2 > η S 1 (Table 2), leading to a 16% decrease in thermal (heating) and electric (pumping) EV demands, relative to evaporation in S1. The combination of these effects is favorable for S2, since, as it uses lower amounts of natural gas, displays NRF contributions about 15% lower than those observed for S1. Since the contributions to the other subcategories are equivalent for both scenarios (Table 3), P E D S 2 overcame P E D S 1 in a little over 13%.
S3 follows similar trends as those observed for S2. In this case, however, the fact that η S 3 is higher than η S 1 due to CPT, leads to higher electric consumption in RO compared to that expended by S1, while also reducing EV energy demands even more intensely. Thus, natural gas consumption was dampened to sufficient levels so that the total N R F S 3 was lower than N R F S 1 in 64%, which immediately resulted in a 55% decrease in P E D S 3 compared to the baseline scenario. However, a closer examination of S2 and S3 RW results or indicates an 11% increase in this source of impact due to the replacement of BaDs by CPT. This disparity can be explained by the environmental loads associated with the HCl manufacture.
Electrolysis is an energy intensive technology and the most widely used methods for synthesis of Cl2. The manufacture of Cl2 from sea water consumes from 414 to 500 kJ/kg Cl2 of electricity [31]. Therefore, the manufacture cycle of HCl displays a contribution of 757 kJ/RF, corresponding to 14% of the entire RW value for S3.
The waste heat option reduced P E D S 4 concerning impacts generated on the account of the electrical demand of the system by the BR grid. Therefore, it was already expected that RW impacts would represent the largest share (54%) of the total. Regarding the process, the individual electricity expenditure to pump the effluent to EV (6.23 MJ/RF) is highlighted.
The change in evaporation technology implemented in S5—from multiple-effect to steam recompression—dismissed the use of natural gas at this stage of the system, but increased electricity consumption. Although 22% of the BR grid is composed of non-renewable sources [37], the effect of the discontinuation of the use of natural gas in EV on N R F S 5 performance prevailed over the inputs that the subcategory received due to the increased electricity use. Moreover, steam recompression caused RW to become the dominant P E D S 5 precursor, with 49% contribution.
Substitution of HCl by HNO3 introduced in S6 had a positive effect. By inserting electrolysis in the HCl production process, the system’s accumulated electricity consumption was reduced R W S 6 < R W S 3 . On the other hand, HNO3 synthesis has as its essential raw material ammonia obtained through natural gas steam reforming (0.63 m3 NG/kg NH3). In addition, as both the NH3 and HNO3 processes are endothermic, another portion of natural gas will be added to the system to meet those needs. The reconciliation between these elements explains the fact that N R F S 6 supplanted N R F S 3 at 1.08 MJ/RF, in spite of the decreased global electric consumption observed in S6.
Finally, a collective analysis of the findings described above indicates an intrinsic correlation between actions carried out for the process and its performance in terms of PED. With respect to scenarios S1–S3 and S6, which differ only in the applied pretreatment technology, the increased η S i (Table 2) is reverted to mitigation of the overall PED impacts (Table 3). EDTA (S1) substitution by BaDs (S2), and of BaDs (S2) by CPT (S3 and S6), led to an accentuated water recovery efficiency in RO. This trend is based on the (high) efficacy achieved by CPT in the effluent-dissolved salt removal compared to other possibilities.
The increased η S i led to improve power consumption in RO (Table 4), due to the additional resistance that the solute formed by the pre-treatment imposes to the solvent flow (water in use by the cooling tower) through the membrane. However, the concentrate flows transferred to EV were reduced. This effect led to higher PED benefits than the deleterious effects caused by increases in the boiling temperature of the solutions, resulting in decreased heat consumption of the multi-effect distillation (Table 4). A similar phenomenon was noted for the concentrate streams routed to CR, which, due to the low flows, provided decreased electrical demands for this stage.
The heat production by natural gas burning resulted in more significant PED contributions than the electricity generation from the BR grid. Therefore, the gain in η S i , provided from the greater effectiveness of the pretreatment is reverted to contribution retention for the category in all the arrangements that depend on such utilities to operate. S5’s success can be explained by the same reasoning. Although it displays higher electrical consumption compared to the other scenarios (4.90 MJ/RF), the synergy established between S5 water recovery rate ( η S 5 = 98.5%), and the exemption of the use of heat in EV, compensates this disadvantage.
The situation described by S4 is quite specific. Due to waste heat, the desalination process is limited to the EV-CR set, and even so, this scenario achieved the best PED result among the other options. It should be noted, however, that, in addition to relying on other refinery sectors, the operation of this arrangement requires special care to serve the purposes for which it is intended. This condition makes it not recommended for regular use. S4 can, therefore, be characterized as the lowest PED impact level to be achieved by the system concerning its base technologies.
S4 also presented the lowest GW performance index among the assessed options, again due to the use of waste heat. Under these circumstances, electricity generation from the BR grid becomes the main source of impact for the category, accounting for 98% of the contributions for this scenario.
S3 prevails over the other scenarios that make use of natural gas for heat generation, followed by S6 and S2, with S1 being the most impactful alternative of the set. In addition, none of these options surpassed S5 performance, which applied electricity only during the steam recompression operation. This finding corroborates Pintilie et al. [14], who state that GW impacts are more sensitive to the intensity oscillation of thermal demands than to the electrical requirements of the treatment systems.
In scenarios with lower water recovery rates in RO (S1 and S2), CO2 emissions of fossil origin (CO2,f) derived from the combustion of natural gas for heat production in EV were the main source of impact. According to Cornejo et al. [5], this is not only due to the use of fossil sources for the thermal energy supply of the stage, but also due to the fact that EV is naturally more energy intensive than RO. In S1 and S2, the CO2,f losses to air represented 78% and 75% of their total impacts as GW. The disparity between the results for these scenarios is due to the thermal demand fluctuations caused by the use of BaDs, which decreased from 1.03 m3/RF in S1 to 0.87 m3/RF in S2.
The reduction of natural gas consumption caused by the CPT led to significant benefits for S3 concerning GW. However, even if dampened in comparison to S1 and S2 performances, CO2,f emissions originating from the heat generation still accounted for 41% of the G W S 3 . Another relevant focus of this scenario’s impact is on GHG emissions from electricity generation. Responsible for 38% of the G W S 3 , these contributions originate (once again) from CO2,f, summed to CH4 losses, which occur in the life cycle of the natural gas that feeds thermoelectric plants. Impact precursors comprise the releases of dinitrogen oxide (N2O) and CO2 from land transformation (CO2,LT) from bioelectricity generation, a source that represents 8.0% of the BR grid [37]. In addition to intervening in S3 to meet RO, EV, and CR energy requirements, the BR grid acts indirectly on the system by participating in the manufacturing stages of the osmosis membrane (147 kJ/m2) and Ca(OH)2 (22.9 kJ/kg), as well as, mainly, in the HCl production chain. As mentioned previously, this action focuses on the electrolysis of sodium chloride, which, due to its energy intensive character contributes to about 11% of the total impact of the category. Finally, the use of Ca(OH)2 in CPT also brought a significant contribution to G W S 3 , because of the regular technology applied to obtain quicklime (CaO)—thermal decomposition of limestone, a material that contains calcium carbonate (CaCO3)—in a lime kiln. The calcination of CaCO3 releases 909 gCO2/kg CaO [42], corresponding to an impact of 146 gCO2eq/RF.
The option of the use of steam compression for water evaporation was promising for GW as effects of increases in electric EV demands, also in this category, were compensated by the suppression of natural gas burning and, therefore, of the GHG emissions that this operation would entail. Thus, the impact observed by S5 was about 18% lower than that achieved by S3. In any case, the increased electricity consumption during the evaporation stage transformed the BR grid into the main source of G W S 5 , accumulating 74% of the total impact.
Unlike observed for PED, the exchange of HCl for HNO3 led to worse GW performance in S6 compared to S3. This is due to the N2O emissions generated during acid synthesis (the Ostwald process), in which anhydrous NH3 is oxidized to HNO3 by metal catalysts and stringent temperature and pressure conditions. The dinitrogen oxide ends up being formed because a small portion of the NH3 is partially oxidized [31]. The high impact factor of N2O for GW (298 kgCO2,eq/kg, [43]), led to these losses (8.40 g/kg HNO3) representing 22% of the G W S 6 impact.
Due to the similarities between the primary energy demand and global warming precursors, the correspondence diagnosed for PED between type of pretreatment, η S i , and the cumulative performance of each system also remains valid concerning GW impacts.

4. Conclusions

This study evaluated the reuse of a saline effluent from an oil refinery to supply a cooling tower inside the chemical plant, in a closing loop movement. An arrangement consisting of reverse osmosis (RO), evaporation (EV), and crystallization (CR) was defined for water recovery. Six scenarios were assessed, mainly observing pre-treatment options (desupersaturation or coprecipitation), and different approaches for energy supplying during EV. These are: (i) the use of waste heat to replace the natural gas burning fumes to meet the thermal demand of the system, and (ii) the application of steam recompression in substitution of multi-effect distillation.
The estimation of the environmental effects of the treatments was carried out by attributional LCA, according to a scope from ‘cradle-to-gate’, for the primary energy demand (PED) and global warming (GW) impact categories.
The scenario that makes use of waste heat as a source of thermal energy for EV (S4) presented the lowest impacts indices among the analyzed possibilities (PED: 11.9 MJ/RF; and GW: 720 gCO2,eq/RF). However, the vulnerability of this arrangement, because its operation is subordinate to the operation of other refinery sectors, makes the alternative not recommended. Thus, S5, that applies coprecipitation as a pretreatment technique for RO-fed effluent and adopts steam recompression to meet EV energy demands appears as the lowest impact scenario of the series (PED: 17.2 MJ/RF; and GW: 1.24 kgCO2,eq/RF). This occurs because the BR grid provides lower contributions in terms of PED and GW than the natural gas life cycle for heat-generating purposes.
A comprehensive analysis of the research findings identified an intrinsic correlation between water recovery rates in RO and overall PED and GW impacts in the arrangements that use heat and electricity for their operation.
Despite the performance variability observed among the scenarios, the benefits identified by the analysis indicate that water desalination is an environmentally efficient alternative in the reduction of water consumption and effluent discharge. These results can still be improved by the application of less aggressive compounds in the environment to remove salts during the pre-treatment phase and the reuse of residual energy sources.

Author Contributions

F.M.R. designed the evaporator and crystallizer models; M.M.S. provided technical information for crystallizer modeling; H.S. designed the RO simulations and the LCA assessment; L.K. and H.S. analyzed results, carried out the discussion, wrote the paper and reviewed the text.

Funding

This study was financed in part by the Coordenação de Aperfeiçoamento de Pessoal de Nível Superior—Brazil (CAPES) Finance Code 001.

Conflicts of Interest

The authors declare no conflict of interest.

References

  1. International Energy Agency (IEA). Key World Energy Statistics 2018; IEA: Paris, France, 2018; 51p. [Google Scholar]
  2. Chang, J.; Lee, W.; Yoon, S. Energy consumptions and associated greenhouse gas emissions in operation phases of urban water reuse systems in Korea. J. Clean. Prod. 2017, 141, 728–736. [Google Scholar] [CrossRef]
  3. Hendrickson, T.P.; Nguyen, M.T.; Sukardi, M.; Miot, A.; Horvath, A.; Nelson, K.L. Life-Cycle Energy Use and Greenhouse Gas Emissions of a Building-Scale Wastewater Treatment and Nonportable Reuse System. Environ. Sci. Technol. 2015, 49, 10303–10311. [Google Scholar] [CrossRef] [PubMed]
  4. Morera, S.; Corominas, L.; Poch, M.; Aldaya, M.M.; Comas, J. Water footprint assessment in wastewater treatment plants. J. Clean. Prod. 2016, 112, 4741–4748. [Google Scholar] [CrossRef] [Green Version]
  5. Cornejo, P.K.; Santana, M.V.E.; Hokanson, D.R.; Mihelcic, J.R.; Zhang, Q. Carbon footprint of water reuse and desalination: A review of greenhouse gas emissions and estimation tools. J. Water Reuse Desal. 2014, 4, 238–252. [Google Scholar] [CrossRef]
  6. Meneses, M.; Concepción, H.; Vrecko, D.; Vilanova, R. Life Cycle Assessment as an environmental evaluation tool for control strategies in wastewater treatment plants. J. Clean. Prod. 2015, 107, 653–661. [Google Scholar] [CrossRef]
  7. McNamara, G.; Horrigan, M.; Phelan, T.; Fitzsimons, L.; Delaure, Y.; Corcoran, B.; Doherty, E.; Clifford, E. Life Cycle Assessment of Wastewater Treatment Plants in Ireland. J. Sustain. Dev. Energy Water Environ. Syst. 2016, 4, 216–233. [Google Scholar] [CrossRef]
  8. Garfí, M.; Flores, L.; Ferrer, I. Life Cycle Assessment of wastewater treatment systems for small communities: Activated sludge, constructed wetlands and high rate algal ponds. J. Clean. Prod. 2017, 161, 211–219. [Google Scholar] [CrossRef]
  9. Opher, T.; Friedler, E. Comparative LCA of decentralized wastewater treatment alternatives for non-potable urban reuse. J. Environ. Manag. 2016, 182, 464–476. [Google Scholar] [CrossRef]
  10. García-Montoya, M.; Sengupta, D.; Nápoles-Rivera, F.; Ponce-Ortega, J.M.; El-Halwagi, M.M. Environmental and economic analysis for the optimal reuse of water in a residential complex. J. Clean. Prod. 2016, 130, 82–91. [Google Scholar] [CrossRef]
  11. Lam, C.-M.; Leng, L.; Chen, P.-C.; Lee, P.-H.; Hsu, S.-C. Eco-efficiency analysis of non-potable water systems in domestic buildings. Appl. Energy 2017, 202, 293–307. [Google Scholar] [CrossRef]
  12. Baresel, C.; Dalgren, L.; Almemark, M.; Lazic, A. Environmental performance of wastewater reuse systems: Impact of system boundaries and external conditions. Water Sci. Technol. 2016, 73, 1387–1394. [Google Scholar] [CrossRef] [PubMed]
  13. O’Connor, M.; Garnier, G.; Batchelor, W. Life cycle assessment comparison of industrial effluent management strategies. J. Clean. Prod. 2014, 79, 168–181. [Google Scholar] [CrossRef]
  14. Pintilie, L.; Torres, C.M.; Teodosiu, C.; Castells, F. Urban wastewater reclamation for industrial reuse: An LCA case study. J. Clean. Prod. 2016, 139, 1–14. [Google Scholar] [CrossRef]
  15. American Petroleum Institute (API). Design and Operation of Oil-Water Separators; Monographs on Refinery Environmental Control—Management of Water Discharges: Washington, DC, USA, 1990; 54p. [Google Scholar]
  16. Diya’uddeen, B.H.; Daud, W.M.A.W.; Aziz, A.R.A. Treatment technologies for petroleum refinery effluents: A review. Process Saf. Environ. Prot. 2011, 89, 95–105. [Google Scholar] [CrossRef]
  17. Gripp, V.S. Environmental, Energetic and Economic Analysis of a Process Design for Water Reuse in Petroleum Refinery. Master’s Thesis, University of São Paulo, São Paulo, Brazil, 2013; 166p. (In Portuguese). [Google Scholar]
  18. Moreira, R.H. Desenvolvimento de um Processo de Reúso do Efluente de Refinaria Baseado em um Sistema de Osmose Reversa Combinado com Precipitação. Master’s Thesis, University of São Paulo, São Paulo, Brazil, 2017; 112p. (In Portuguese). [Google Scholar]
  19. Pantoja, C.E. Cristalização Assistida por Destilação por Membranas Aplicada ao Reuso de água: Comparação com Outros Métodos de Reuso, Análise do Processo e Projeto Hierárquico de Processo. Ph.D. Thesis, University of São Paulo, São Paulo, Brazil, 2015; 162p. (In Portuguese). [Google Scholar]
  20. Diepolder, P. Is zero discharge realistic? Hydrocarb. Process. 1992, 71, 129–160. [Google Scholar]
  21. Anze, M.; Alves, R.M.B.; Nascimento, C.A.O. Optimization of Water Use in Oil Refinery. In Proceedings of the 2010 Annual AIChE Meeting, Salt Lake City, UT, USA, 7–12 November 2010. [Google Scholar]
  22. Pombo, F.R. Management of Water Demand in the Oil Refining Industry: Challenges and Opportunities for Rationalization. Ph.D. Thesis, Federal University of Rio de Janeiro, Rio de Janeiro, Brazil, 2011; 169p. (In Portuguese). [Google Scholar]
  23. International Petroleum Industry Environmental Conservation Association (IPIECA). Petroleum Refining Water/Wastewater Use and Management; IPIECA Operations Best Practice Series: London, UK, 2010; 60p. [Google Scholar]
  24. Rahardianto, A.; Gao, J.; Gabelich, C.J.; Williams, M.D.; Cohen, Y. High recovery membrane desalting of low-salinity brackish water: Integration of accelerated precipitation softening with membrane RO. J. Memb. Sci. 2007, 289, 123–137. [Google Scholar] [CrossRef]
  25. Bremere, I.; Kennedy, M.D.; Johnson, A.; van Emmerick, R.; Witkamp, G.-J.; Schippers, J.C. Increasing conversion in membrane filtration systems using a desupersaturation unit to prevent scaling. Desalination 1998, 119, 199–204. [Google Scholar] [CrossRef]
  26. Bremere, I.; Kennedy, M.; Michel, P.; van Emmerick, R.; Witkamp, G.J.; Schippers, J. Controlling scaling in membrane filtration systems using a desupersaturation unit. Desalination 1999, 124, 51–62. [Google Scholar] [CrossRef]
  27. Astilleros, J.M.; Pina, C.M.; Fernández-Díaz, L.; Prieto, M.; Putnis, A. Nanoscale phenomena during the growth of solid solutions on calcite {1014} surfaces. Chem. Geol. 2006, 225, 322–335. [Google Scholar] [CrossRef]
  28. Heins, W.; Schooley, K. Achieving Zero Liquid Discharge in SAGD heavy oil recovery. J. Can. Petrol. Technol. 2004, 43, 37–42. [Google Scholar] [CrossRef]
  29. Mickley, M. Survey of High-Recovery and Zero Liquid Discharge Technologies for Water Utilities; WateReuse Foundation: Alexandria, VA, USA, 2008; 180p. [Google Scholar]
  30. Al-Karaghouli, A.; Kazmerski, L. Energy consumption and water production cost of conventional and renewable-energy-powered desalination processes. Renew. Sustain. Energy Rev. 2013, 24, 343–356. [Google Scholar] [CrossRef]
  31. Althaus, H.-J.; Chudacoff, M.; Hischier, R.; Jungbluth, N.; Osses, M.; Primas, A. Life Cycle Inventories of Chemicals; Ecoinvent Report No. 8, v2.0; EMPA Dübendorf, Swiss Centre for Life Cycle Inventories: Dübendorf, Switzerland, 2007; 957p. [Google Scholar]
  32. Veza, J.M. Mechanical vapour compression desalination plants—A case study. Desalination 1995, 101, 1–10. [Google Scholar] [CrossRef]
  33. Jongema, P. Optimization of the Fuel Consumption of an Evaporation Salt Plat with the Aid of the Exergy Concept. In Proceedings of the Sixth International Symposium on Salt, Toronto, ON, Canada, 24–28 May 1983; Salt Institute: Alexandria, VA, USA, 1983; pp. 463–469. [Google Scholar]
  34. International Organization for Standardization. ISO 14044, Environmental Management—Life Cycle Assessment—Requirements and Guidelines, 1st ed.; International Organization for Standardization: Genève, Switzerland, 2006; 46p. [Google Scholar]
  35. Hischier, R.; Weidema, B.; Althaus, H.-J.; Bauer, C.; Doka, G.; Dones, R.; Frischknecht, R.; Hellweg, S.; Humbert, S.; Jungbluth, N.; et al. Implementation of Life Cycle Assessment Methods; Ecoinvent report No. 3, v. 2.2; Swiss Centre for Life Cycle Inventories: Dübendorf, Switzerland, 2010; 176p. [Google Scholar]
  36. Huijbregts, M.A.J.; Steinmann, Z.J.N.; Elshout, P.M.F.; Stam, G.; Verones, F.; Vieira, M.D.M.; Hollander, A.; Zijp, M.; van Zelm, R. ReCiPe 2016: A Harmonized Life Cycle Impact Assessment Method at Midpoint and Endpoint Level Report I: Characterization; Department of Environmental Science, Radbound University: Nijmegen, The Netherlands, 2016; 194p. [Google Scholar]
  37. Empresa de Pesquisa Energética. Brazilian Energy Balance 2016—Year 2015; Empresa de Pesquisa Energética: Rio de Janeiro, Brazil, 2016; 294p. (In Portuguese)
  38. Empresa de Pesquisa Energética. Energia Termelétrica: Gás Natural, Biomassa, Carvão, Nuclear; Empresa de Pesquisa Energética: Rio de Janeiro, Brazil, 2016; 417p. (In Portuguese)
  39. Franklin Associates. Data Details for Petroleum Refining; Franklin Associates; Eastern Research Group, Inc.: Prairie Village, Kansas, 2003. [Google Scholar]
  40. Hischier, R. Life Cycle Inventories of Packaging and Graphical Papers; Ecoinvent report No. 11, v2.0; Swiss Centre for Life Cycle Inventories: Dübendorf, Switzerland, 2007; 17p. [Google Scholar]
  41. Jungbluth, N. Erdöl. In Sachbilanzen von Energiesystemen: Grundlagen fùr den ergleich von Energiesystemen und den Einbezug von Energiesystemen in Ökobilanzen für die Schweiz; Ecoinvent Report No. 6-IV, v 2.0; Dones, R., Ed.; Swiss Centre for Life Cycle Inventories: Dübendorf, Switzerland, 2007; 327p. (In German) [Google Scholar]
  42. Kellenberger, D.; Althaus, H.-J.; Jungbluth, N.; Künniger, T.; Lehmann, M.; Thalmann, P. Life Cycle Inventories of Building Products; Final Report Ecoinvent No. 7, v2.0; EMPA Dübendorf, Swiss Centre for Life Cycle Inventories: Dübendorf, Switzerland, 2007; 914p. [Google Scholar]
  43. Stocker, T.F.; Qin, D.; Plattner, G.-K.; Tignor, M.; Allen, S.K.; Boschung, J.; Nauels, A.; Xia, Y.; Bex, V.; Midgley, P.M. (Eds.) Intergovernmental Panel on Climate Change. Climate Change 2013: The Physical Science Basis. Contribution of Working Group I to the Fifth Assessment Report of the Intergovernmental Panel on Climate Change; Cambridge University Press: Cambridge, UK; New York, NY, USA, 2013; 1535p. [Google Scholar]
Figure 1. General view of effluent recovery systems (S1–S4 and S6) for reuse in a cooling tower.
Energies 12 00326 g001
Figure 2. Detail of the desalination system for scenario S5.
Energies 12 00326 g002
Table 1. Characteristic values of indicators in effluent. IWTP: industrial wastewater treatment plants.
AnalytesIWTP Effluent [17,18,19]IWTP Effluent (Defined Value)
(Ranges of Concentration, ppm)(ppm)
Ba2+0.20–0.500.30
Ca2+38.0–63.053.1
Al3+0.00–0.01<0.01
Sr2+1.10–1.831.32
SiO20.80–19.47.33
Fe (total)0.00–0.01<0.01
Mg2+4.00–7.526.56
Na+179–283255
Cl311–425385
HCO355.9–308216
K+6.00–11.57.76
NH4+0.50–7.604.56
PO43−0.00–3.742.12
NO322.4–207101
SO42−85.6–163110
F0.10–0.690.20
TDS (as, NaCl) 1359–1103762
pH6.74–8.816.74
1 TDS: total dissolved solids.
Table 2. Technical characteristics and energy sources for each scenario.
ParameterTechnological ConditionsS1S2S3S4S5S6
Technological approachReverse osmosis (RO)+++++
Evaporative crystallization (EV + CR)++++++
Pre-treatment methodBarium desupersaturation (BaDs)+
Coprecipitation (CPT)+++
Energy source ElectricityBR grid 1BR gridBR gridBR grid + WHBR gridBR grid
HeatNG 2NGNGWH 3NG
Yield ( η S i )Water recovery at RO (%)84.687.095.895.895.8
1 BR grid: Brazilian electricity matrix; 2 NG: natural gas; 3 WH: waste heat.
Table 3. Impacts related to primary energy demand (PED) (by subcategory and total impact) and global warming (GW) for scenarios S1–S6.
Impact CategoryS1S2S3S4S5S6
PED (MJ/RF)Non-renewable, fossil44.437.615.73.495.9716.8
Non-renewable, nuclear0.510.510.570.570.880.57
Renewable, biomass0.780.780.780.991.320.69
Renewable, wind0.320.320.320.420.500.32
Renewable, water4.794.795.336.438.534.62
Total50.844.022.711.917.223.0
GW (kgCO2,eq)2.932.561.520.721.241.93
Table 4. Total energy consumption per stage of the system for each scenario (in MJ/RF). RO: reverse osmosis; EV: evaporation; CR: crystallization.
StageEnergy SourceS1S2S3S4S5S6
ROElectricity1.121.332.12-2.122.12
EVHeat35.930.39.74--9.76
Electricity1.401.190.409.004.860.40
Waste Heat---230--
CRElectricity4.074.073.380.113.383.53
Waste Heat---3.96--

