1. Introduction
Fluid flow modeling plays an important role in the petroleum industry. Determination of rocks’ ability to store the hydrocarbons, like the porosity parameter, is not sufficient. The most important question is: how many hydrocarbons can be produced from the reservoir rock? The answer is hidden in the permeability parameter.
Permeability is a dynamic parameter, which describes the rock’s ability to transport fluids. Two parameters are highlighted: absolute permeability (100% saturation of a single fluid) and effective permeability (saturation of two or more fluids). Absolute permeability reflects the property of the rock, while effective permeability also considers the interactions between the fluids and rock. Darcy equation is historically the first approved mathematical expression to evaluate absolute permeability and is used till nowadays.
Reservoir rocks in conventional versions are mainly characterized by absolute permeability above 0.01 mD, while unconventional—below 0.01 mD [
1]. Computational fluid dynamic (CFD) gives the opportunity to assess the absolute permeability of the rock, supporting the standard procedure: laboratory measurements of absolute permeability, as gas permeameters [
2]. However, it is still challenging to estimate the absolute permeability in tight rocks (unconventional) [
3,
4].
Computed X-ray tomography (CT) is an efficient imaging technique to retrieve information about the 3D pore space of the rock [
5]. That is why it is still an appreciated and developed technique. Computed X-ray tomography, together with computational fluid dynamics, have almost no limitations—almost, because only the CT resolution limits this research potential. CT and CFD is a key method in absolute permeability calculations for many types of rocks, different pore space objects (pores, fractures, etc.) and fluids [
6,
7,
8,
9,
10,
11,
12,
13,
14].
Computer simulations nowadays are a powerful technique of analyzing fluid flow phenomena in complex systems. A geometrical model with a high accuracy of coordinate details is needed to appropriate reproduction of fluid flow characteristics in complex materials. An accurate projection of the porous rock sample geometrical model gives the opportunity to analyze the behavior of gas flow in the porous channels. One of the developed computational approaches is a CFD technique based on the Navier–Stokes equations. In fluid flow modeling in porous samples using the CFD and continuum fluid flow approach, the slip flow at the walls has to be applied if it occurs [
15]. One of the approaches is to use the Tangential Momentum Accommodation Coefficient (TMAC), which describes the gas behavior in collisions with a wall surface. To simulate fluid flow in porous structure, the Lattice Boltzmann Method (LBM) can also be used [
16,
17,
18,
19,
20]. The LBM method gives the possibilities to study the effects of gas molecules flow on a small size scale, which can occur in gas flow through low porous materials. The slip phenomenon, when the LBM method is used, can be calculated and the characteristics of velocity distribution at the walls.
The detailed parametrization of the tight sandstone pore space is presented in the paper, using a 3D geometrical model from computed X-ray tomography. Next, the fluid flow simulation is conducted using a slip and no-slip model in different variants of the simulations. Moreover, all results were combined together and compared with the laboratory measurements using a gas permeameter on the core rock sample. The advantage of the research is the comparison of the fluid flow simulation results with the results of laboratory measurements.
The primary objective of this paper is to estimate the absolute permeability using joint analysis of computed X-ray tomography data and fluid flow simulation results, with the emphasis on the correctness of the selected parameters and comparison to the core test analysis.
2. Materials and Methods
Tight gas is a type of natural gas, which is accumulated in the low porous (effective porosity) and low permeable rock. It can be closed in the different type of rocks, as sandstones, limestones, dolostones, shales (shale gas), or coals [
21,
22,
23,
24]. Tight gas or oil reservoirs are still challenging in finding the proper approach for detailed analysis [
25,
26]. The key problem in tight gas exploration is reflected in the low effective porosity and permeability, which requires the application of special treatment, such as fracturing. The analyzed core sample represents the tight, gas-bearing sandstone, build 99% from quartz. The Cambrian sample was probed from the well located Peri-Baltic Syneclise (N Poland) at a depth of about 3500 m.
2.1. Computed X-ray Tomography (CT)
Computed X-ray tomography allows extracting the geometrical model of the pore space in detail [
27,
28]. The physical basis of the measurements is connected with Beer’s Law. In the beginning, a CT measurement was carried out on the rock sample. The length of the sample was about 3 mm, with a width of about 3 mm. The sample size allowed for achieving the expected voxel size (the smaller the investigated sample, the better CT resolution). The Nanotom S (General Electric, Boston, MA, USA) is equipped with a 57 W X-ray tube with a maximum operating voltage of 180 kV, Hamamatsu detector (HAM C 7942CA-02) with a 12-bit resolution and 2300 × 2300 pixel matrix. The voxel size in this study was 0.8 × 0.8 × 0.8 µm
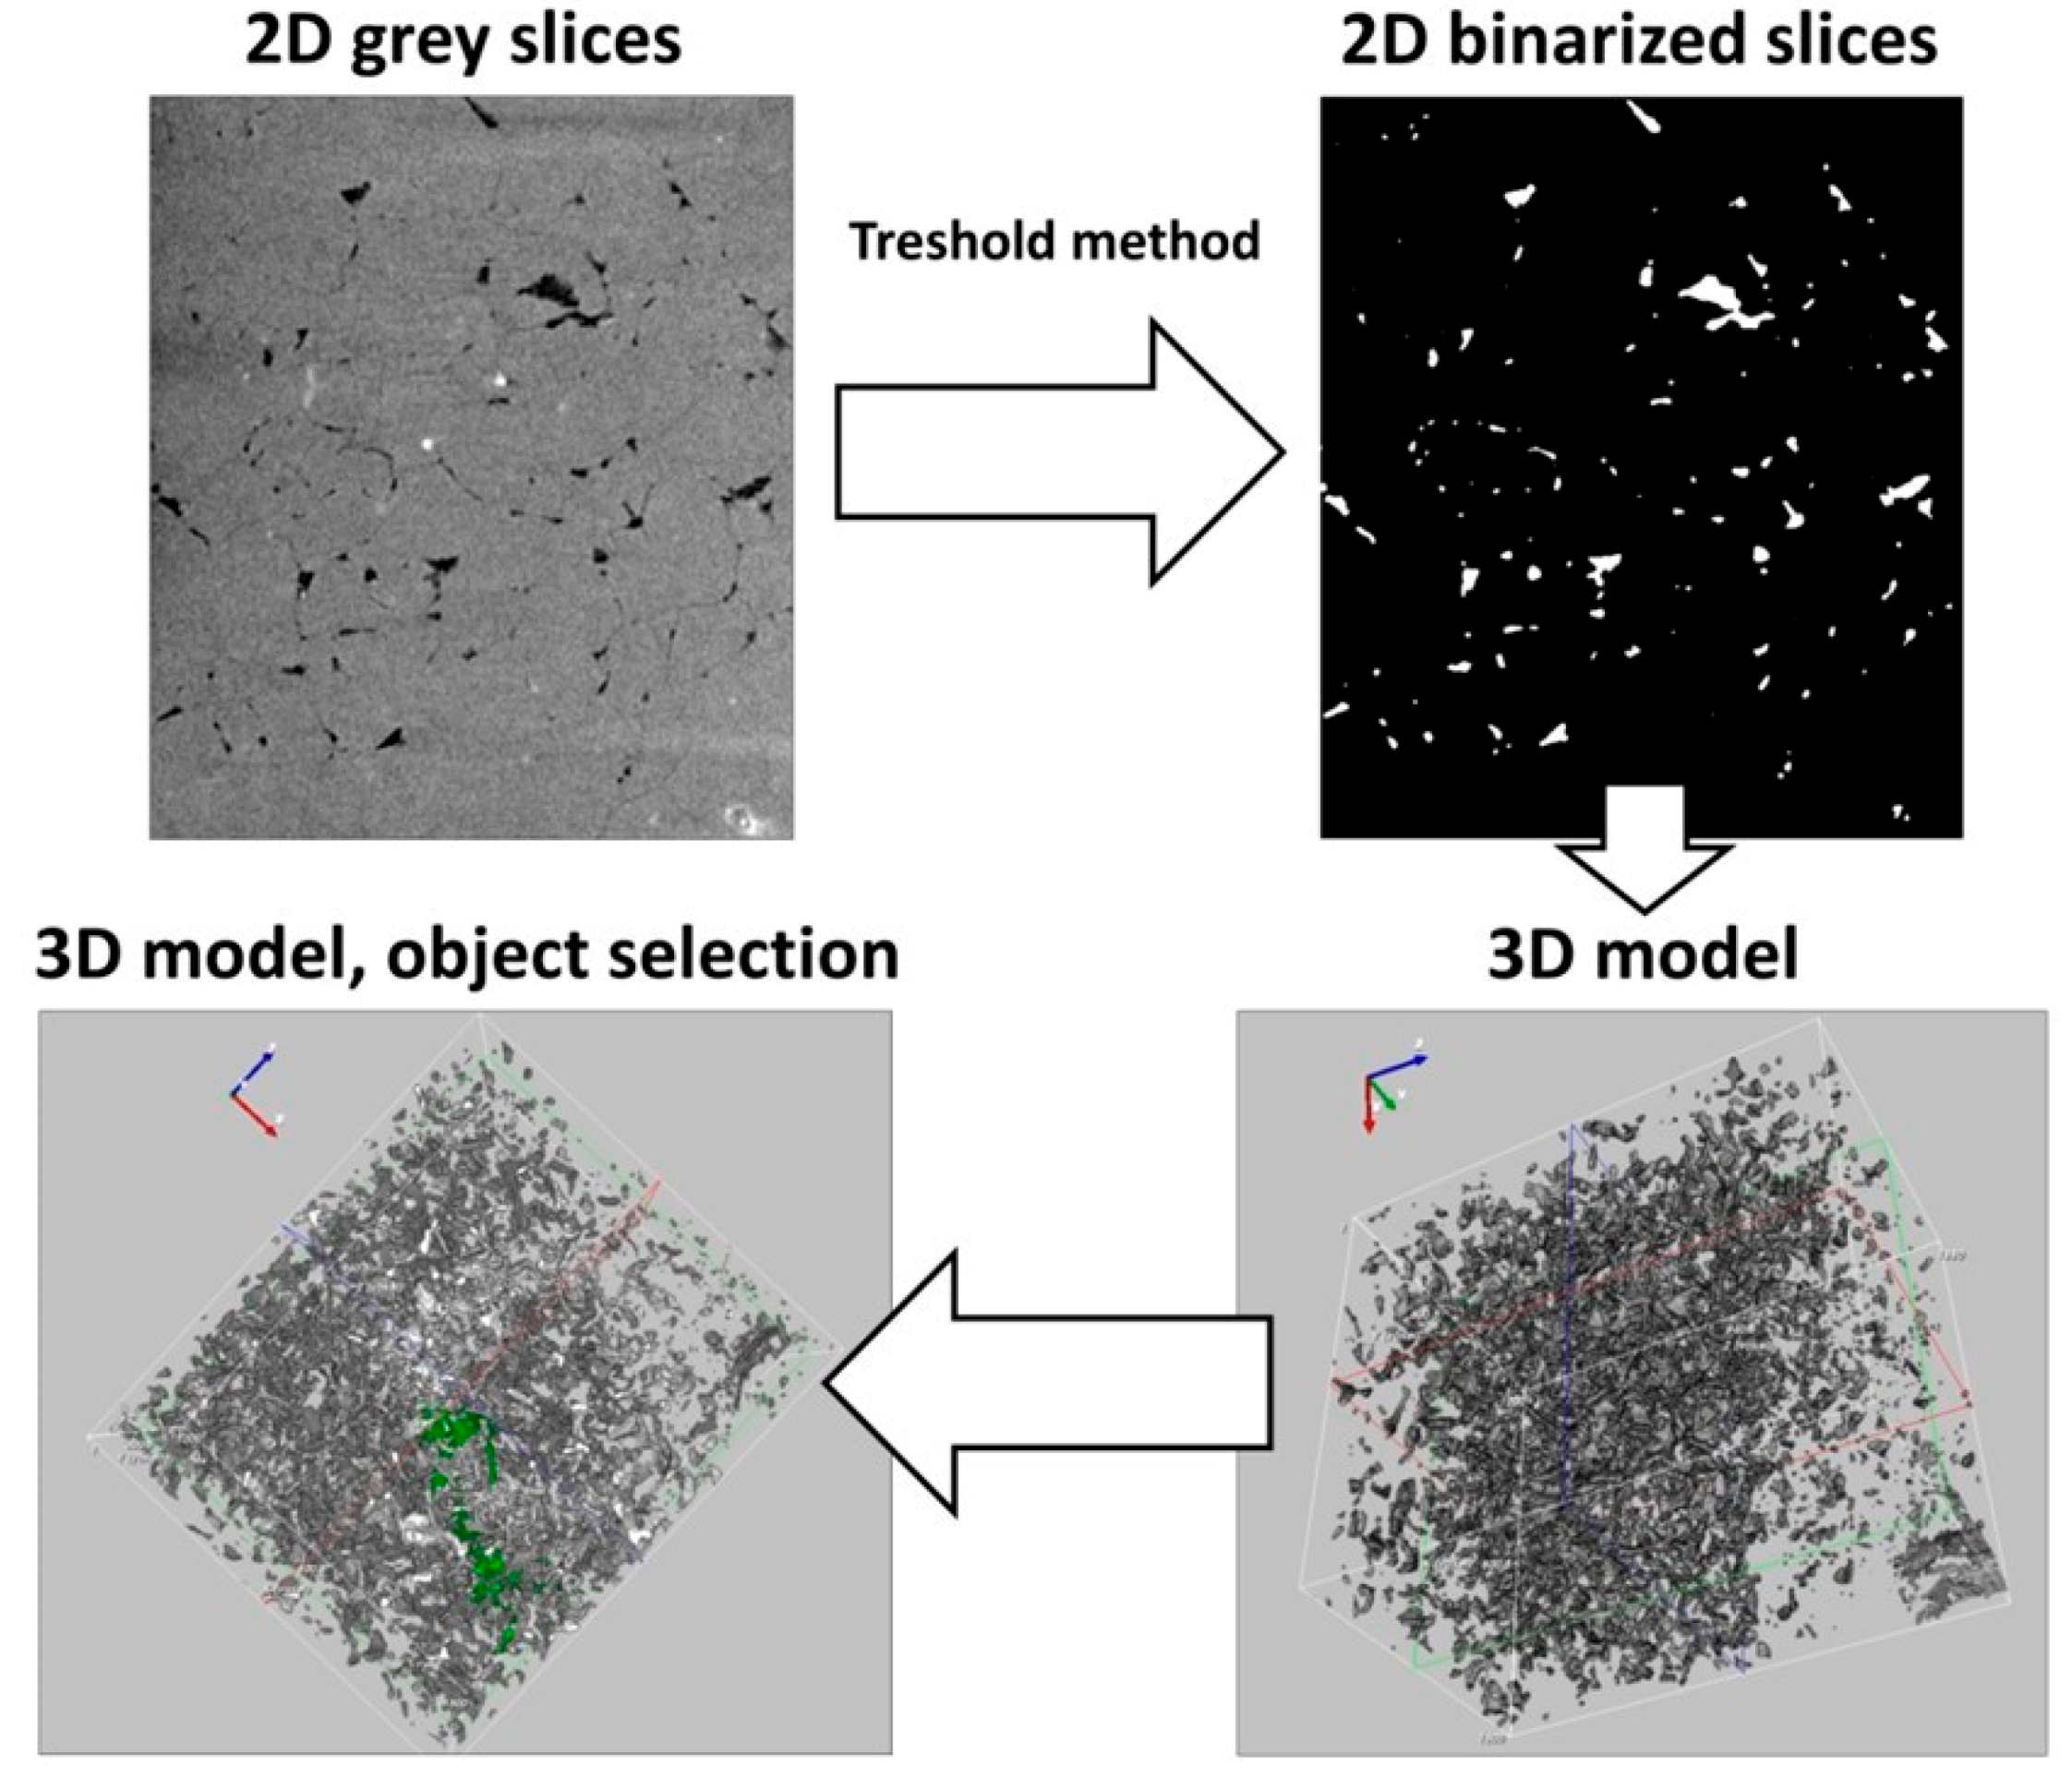
3. Next, CT data was processed to give the final output in the form of the 3D grey level image of the rock. Using binarization (threshold method), the pore space was extracted from the image and filtrated against the noise. The second stage was connected with the qualitative and quantitative interpretation of the pore space using poROSE software (poROus materials examination SoftwarE, AGH University of Science and Technology, Kraków, Poland) [
29,
30]. The scheme of the CT analysis is presented in
Figure 1.
2.2. Permeability Measurement on a Core Sample
Absolute permeability was measured in the laboratory using gas permeameter in TerraTek-Schlumberger Reservoir Laboratory in Salt Lake City (UT, USA). AP608 CoreTest machine (Terra Tek, Salt Lake City, UT, USA) works using nitrogen as a working fluid at 500 psi, confining stress on the unsteady state. The sample was investigated in the form of a cylinder plug [
31]. Core analysis is described in the API RP40 method of the Recommended Practices for Core Analysis.
2.3. Fluid Flow Modeling
In the presented study, the calculations using the CFD approach and solving the Navier-Stokes equations were carried out for steady-state and laminar flow [
32,
33]. The fluid flow simulation was conducted using the CFD technique and Star-CCM+ software (Siemens Industry Software Computational Dynamics Ltd., London, UK) [
34].
2.3.1. Geometrical Model and Numerical Mesh of the Pore Space
The geometrical model of the analyzed sample was prepared to conduct simulations of fluid flow.
Figure 2 presents the geometrical model of the largest object. To create a numerical mesh, the object was divided into 1,574,954 finite volumes with a polyhedral shape. The base size of the finite volume was set to 10
−6 m, where the total height of the analyzed sample is equal to 96 × 10
−5 m.
2.3.2. Slip Flow Modeling
The modeling of the partial slip phenomenon was taken into account in the model, in case of molecule slips at the pore walls. Boundary conditions described the by partial slip (Maxwell) model, and tangential momentum accommodation coefficient (
TMAC,
σv) gave the opportunity to calculate slip velocity at the walls:
where:
uslip-tangential slip velocity, m/s;
σv-tangential momentum accommodation coefficient,
TMAC;
L-mean free path of the gas, m;
u-gas velocity, m/s;
n-normal, m.
The simulation was carried out using nitrogen, and the basic input data for nitrogen in the simulations are presented in
Table 1. The mean free path of the nitrogen was calculated using the gas kinetic theory and the following equation:
where
κ-Boltzmann constant (κ = 1.38066 × e
−23), J/K;
T-temperature, K;
P-pressure, Pa;
σ-Lennard Jones characteristic length or collision diameter (
σ = 3.621), m.
Table 2 shows different values of the mean free path and Knudsen number depending on gas pressure. Knudsen number criterion defines the allowable approach of fluid flow modeling. If the Knudsen number is below 0.01, then the continuum flow approach is proper. Otherwise, the slip flow (0.01 < Knudsen number < 0.1) should be considered [
35]. Simulations for the 14.5 psi of pressure were examined using TMAC considerations, due to the Knudsen number for the analyzed case.
The different gas models were adopted and compared in the simulation. The series of simulations were performed using the same boundary conditions at gas pressure equal to 3.447 MPa (row 5, in
Table 2) with the use of Van der Waals, Peng-Robinson, Redlich-Kwong, Soave-Redlich-Kwong and modified Soave-Redlich-Kwong equation of state. The results comparison shows that there is no difference in the final value of permeability obtained using ideal gas law and real gas laws.
The developed model was used to carry out the simulations, where the boundary conditions were defined in the form of the pressure difference between the inlet and outlet.
2.3.3. Permeability Determination
Permeability determination of analyzed rock samples can be done using a modified Darcy equation [
36] and the results of CFD simulation in the form of mass flow rate or volumetric flow rate and density. To calculate absolute permeability in the linear flow of incompressible fluid at steady-state, the following equation can be used:
where the volumetric flow rate
can be calculated at the sample outlet using the following equation:
To calculate the permeability of a sample, where a gas is used as a working fluid, together with partial slip effect at the sample walls, the following equation is used:
In the case, where the analyzed fluid is considered as a compressible medium, the compressibility factor and equation of state need to be adopted in the following form:
where
psc,
Tsc,
are values calculated at standard conditions (sc).
Equation (5) can be modified to the final form used to calculate absolute permeability at different pressure of the gas, taking into account compressibility of analyzed fluid:
The scheme of the research is presented in
Figure 3 and covers the CT measurements, CT data analysis, creation of the 3D geometrical model, core test using gas permeameter, fluid flow simulations in different variants, as well as the comparison of absolute permeabilities obtained from the laboratory measurements on core samples and calculated from CFD simulations results, for example, volumetric flow rate.
3. Results
Firstly, the analysis of the CT data is presented to investigate the pore space geometry and identify the size and shape of the pores. Secondly, the fluid flow simulation using a 3D geometrical model of the tight sandstone pore space and different input parameters were analyzed, together with results compared with the laboratory measurements on the core sample using a gas permeameter.
3.1. Results of Computed X-ray Tomography Data Analysis
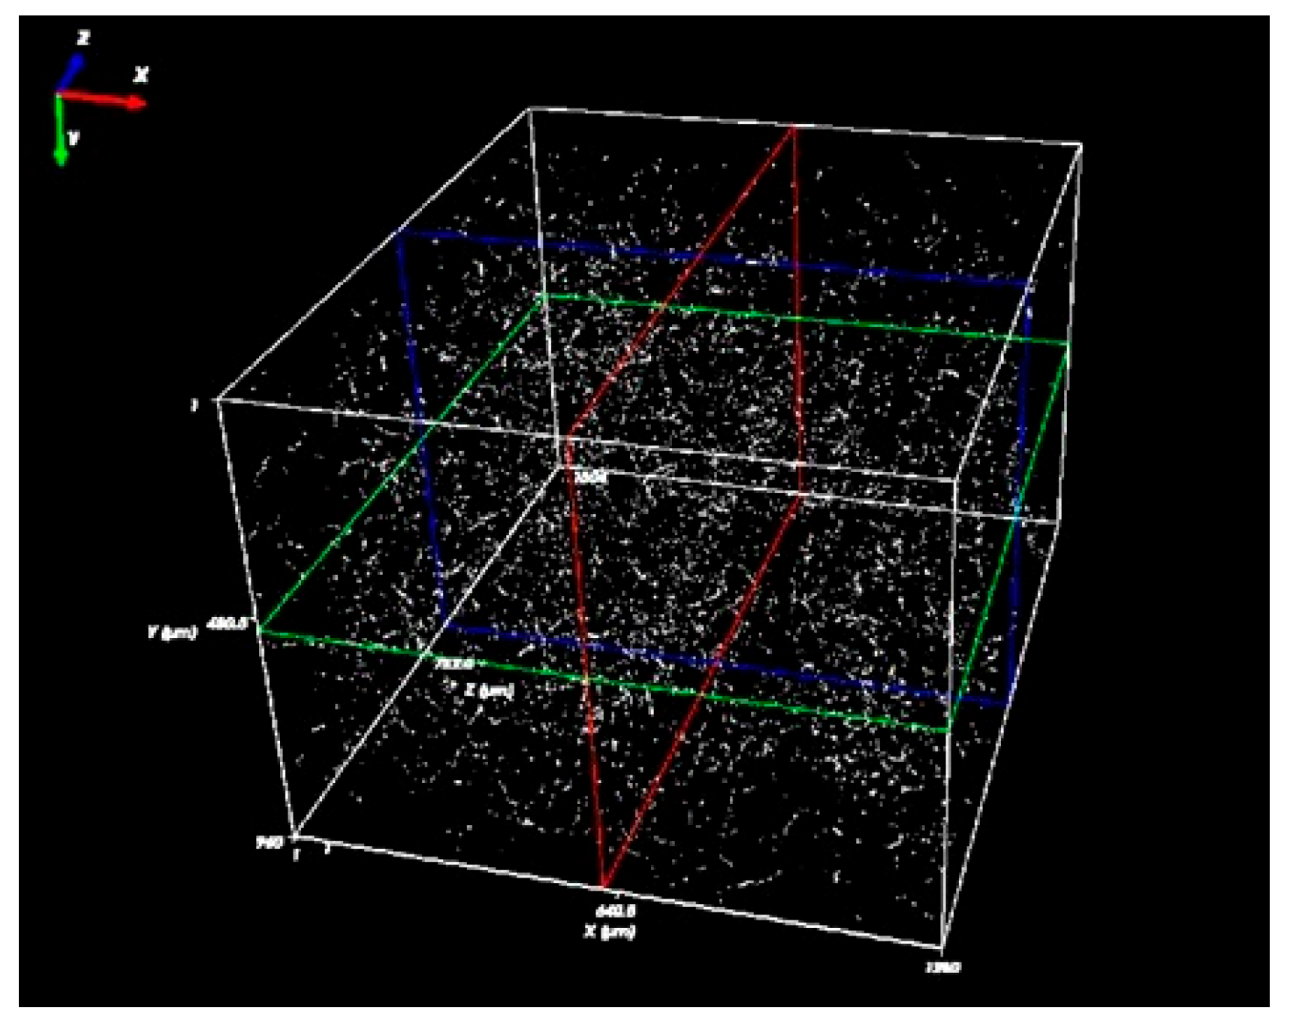
Figure 4 presents the results of the pore size classification regarding the pore volume.
Colors refer to the volume range of the pores. Exemplary pores, in which volumes are within the range of 1 to 99 voxels, are marked in red. Only six pore bodies are characterized by the volume above 5.12E5 µm
3 and are highlighted in magenta in
Figure 4.
Three different diameters were considered in the pore space analysis: Feret diameter, thickness mean, and major diameter. Feret diameter reflects the length of the object measured in a given direction, while the thickness mean is an average thickness of the object in the form of the average diameter of the spheres inscribed into the object. The major diameter represents the major diameter of the ellipsoid inscribed into the object.
Table 3 shows the geometrical parameters of detected pores and microfractures. The most variable parameter is the Feret diameter, while the least is the thickness mean.
Moreover, mean intercept length was calculated and defined as the sum of the length of all traced lines in the object to the number of intersections between two different phases (poROSE software documentation). The mean intercept length was calculated for the XY plane at 45° and the interspace between the traced lines 5 px to cover the largest objects position in the sample.
Table 4 presents the results. The mean intercept length has similar results to the thickness mean for the objects in the analyzed tight sandstone.
Tortuosity is a parameter that informs how the object is tortuous, in other words, how the path is complicated for the fluid to flow. Calculations of these parameters were carried out on the central axis of the object in 3D (
Figure 5). Pore space is poorly developed, which can be seen in
Figure 5, as a central axis for each object.
Table 4 shows the basic statistics for the tortuosity for all objects in the sample. Pores and microfractures are not very tortuous. The average and median value is slightly above 1.
The largest object has 2.18 × 106 µm3 in volume, a thickness mean equal to 18 µm, while the Feret diameter is 449 µm. The advance analysis gave the information about the mean intercept length and tortuosity of the largest object in the sample, which are 17.18 µm and 2.50, respectively.
Skeleton analysis provided information about the pore space complexity (
Table 5). The average coordination number informs about the number of branches connecting at the node as an average from the objects for the sample. It appeared that the pore space is not too complicated, which reflected quite a low number of junctions in the sample and average coordination number.
After 3D qualitative and quantitative analysis, the pore space was extracted to build the geometrical model for the fluid flow simulations. Moreover, poROSE software (AGH University of Science and Technology, Kraków, Poland) was implemented to obtain a 3D geometric model in the form of an STL file (stereolithography file type).
Absolute permeability from the gas permeameter is 0.023 mD for the tested sample. Total porosity from CT is equal to 2.30%, while effective porosity from the mercury porosimetry is 0.28%.
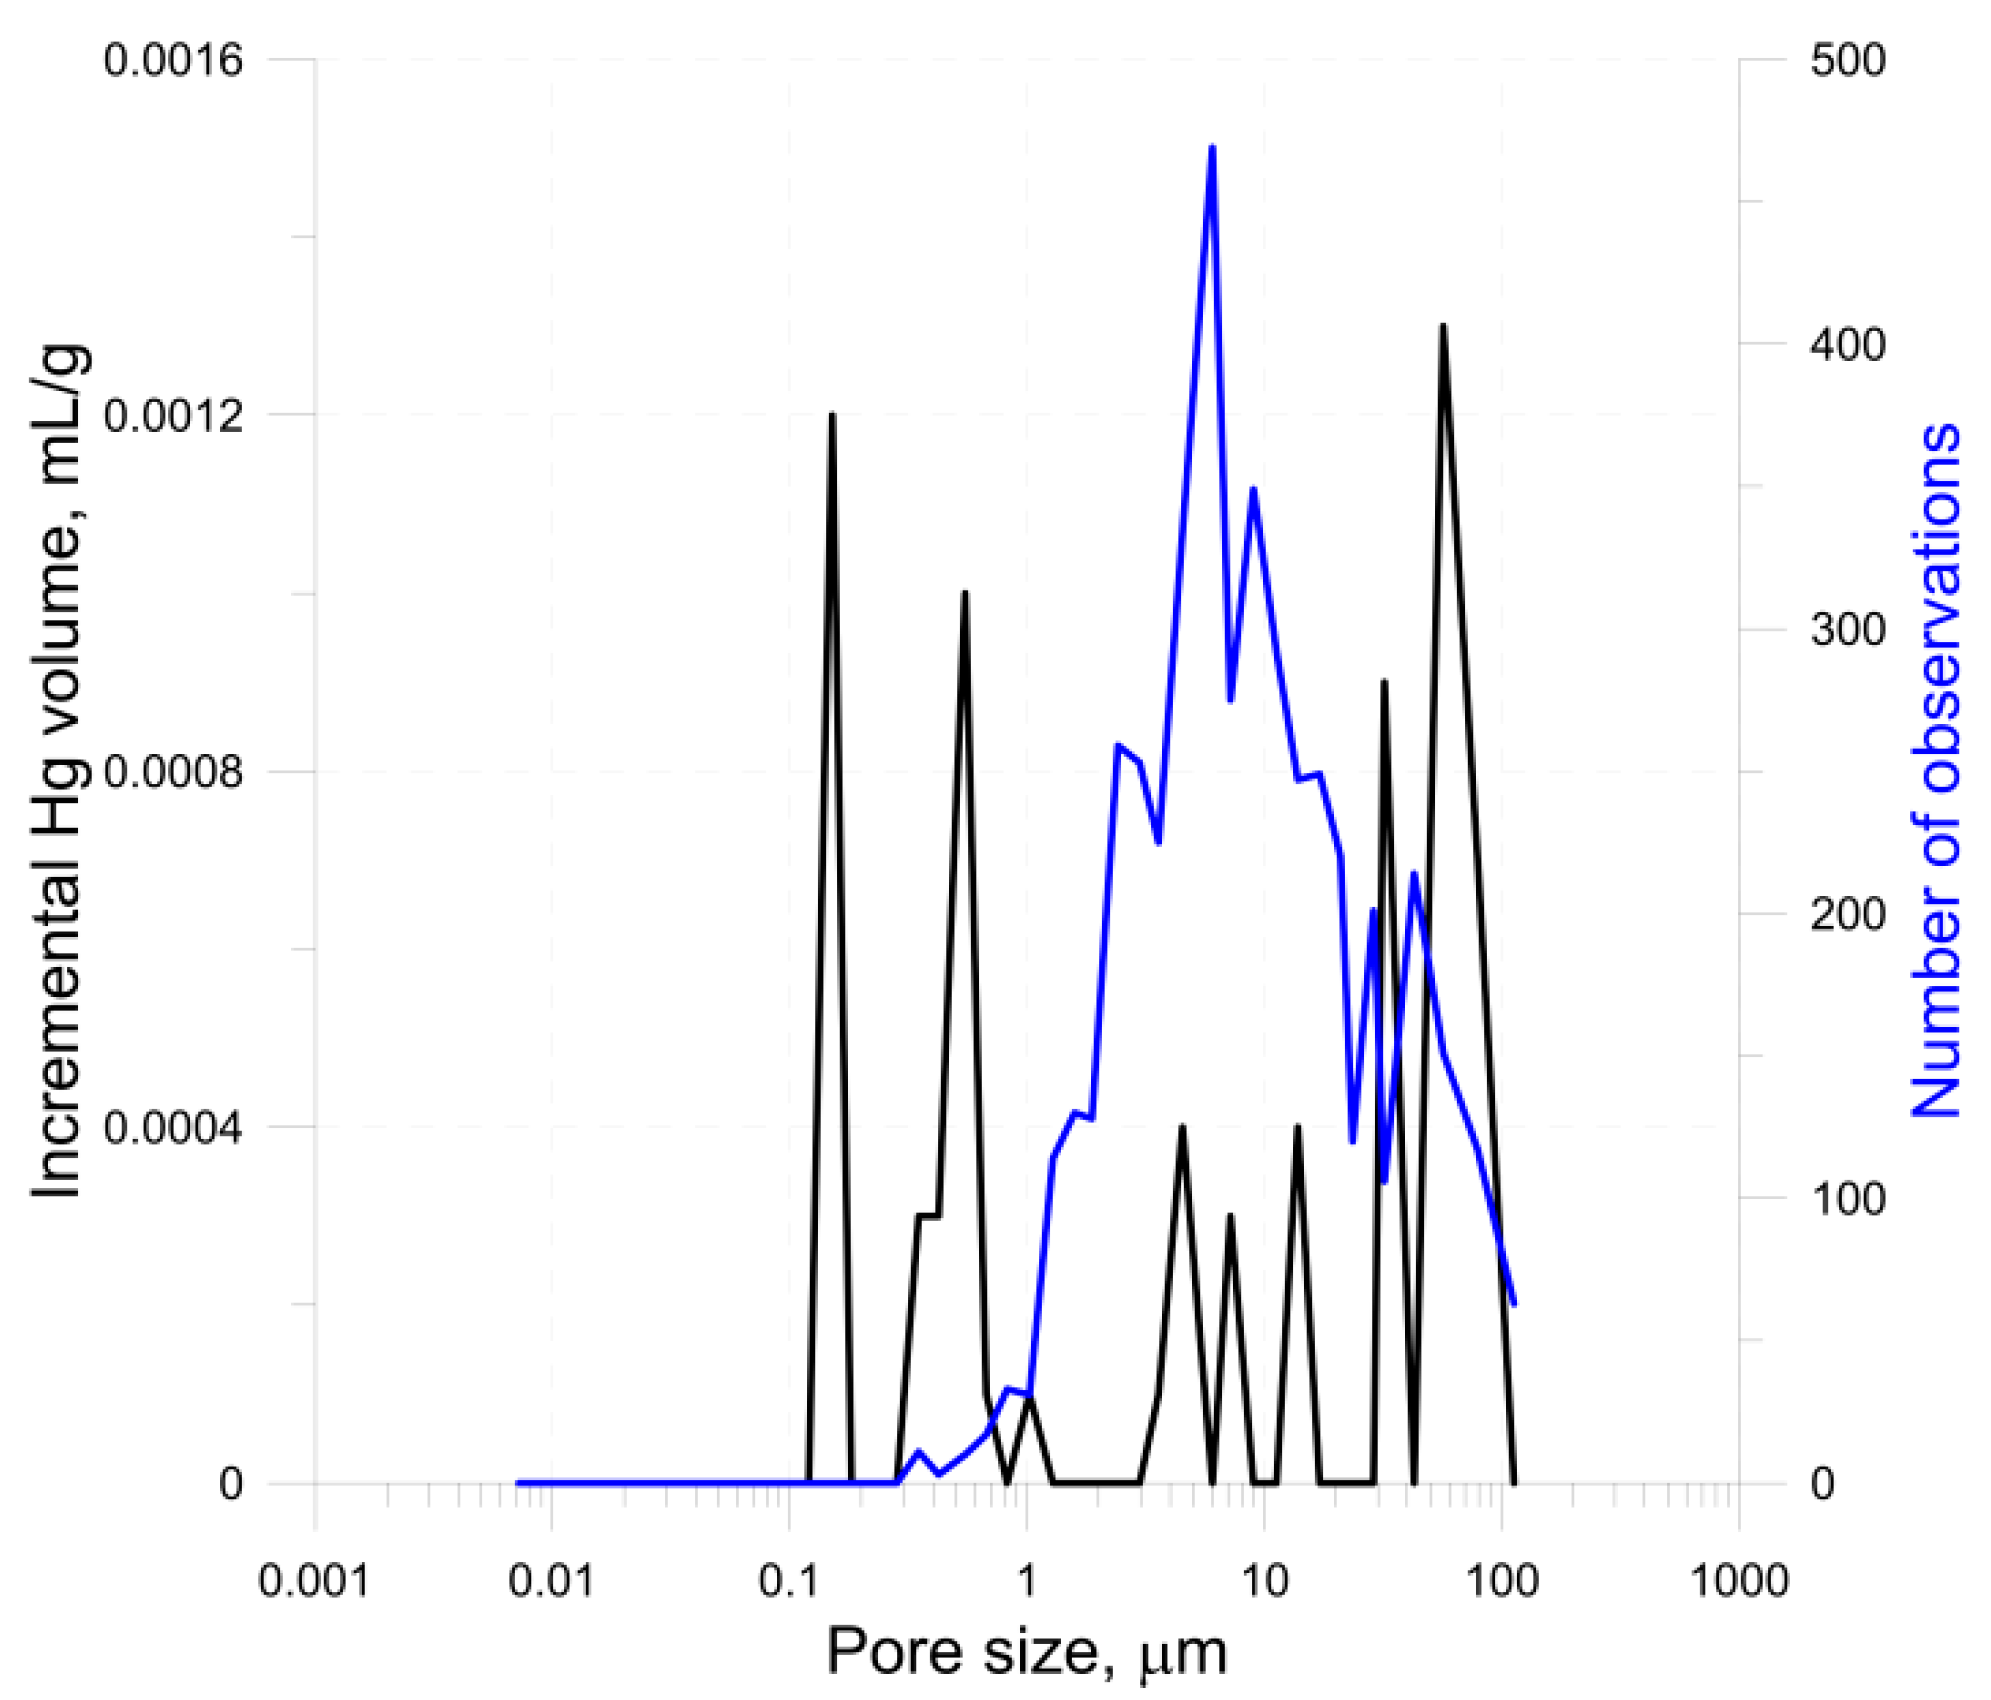
Figure 6 presents the pore size distribution based on mercury porosimetry and computed X-ray tomography data. Mercury porosimetry was carried out using AutoPore IV 9500 (Micromeritics, Norcross, GA, USA) with the maximum working pressure as 60,000 psi. The pore-fracture system predominates in the sample. CT data provided a broad range of information regarding all pores, connected and isolated ones (effective and total porosity), while mercury porosimetry only provided information regarding the connected ones.
3.2. Results of Fluid Flow Simulation
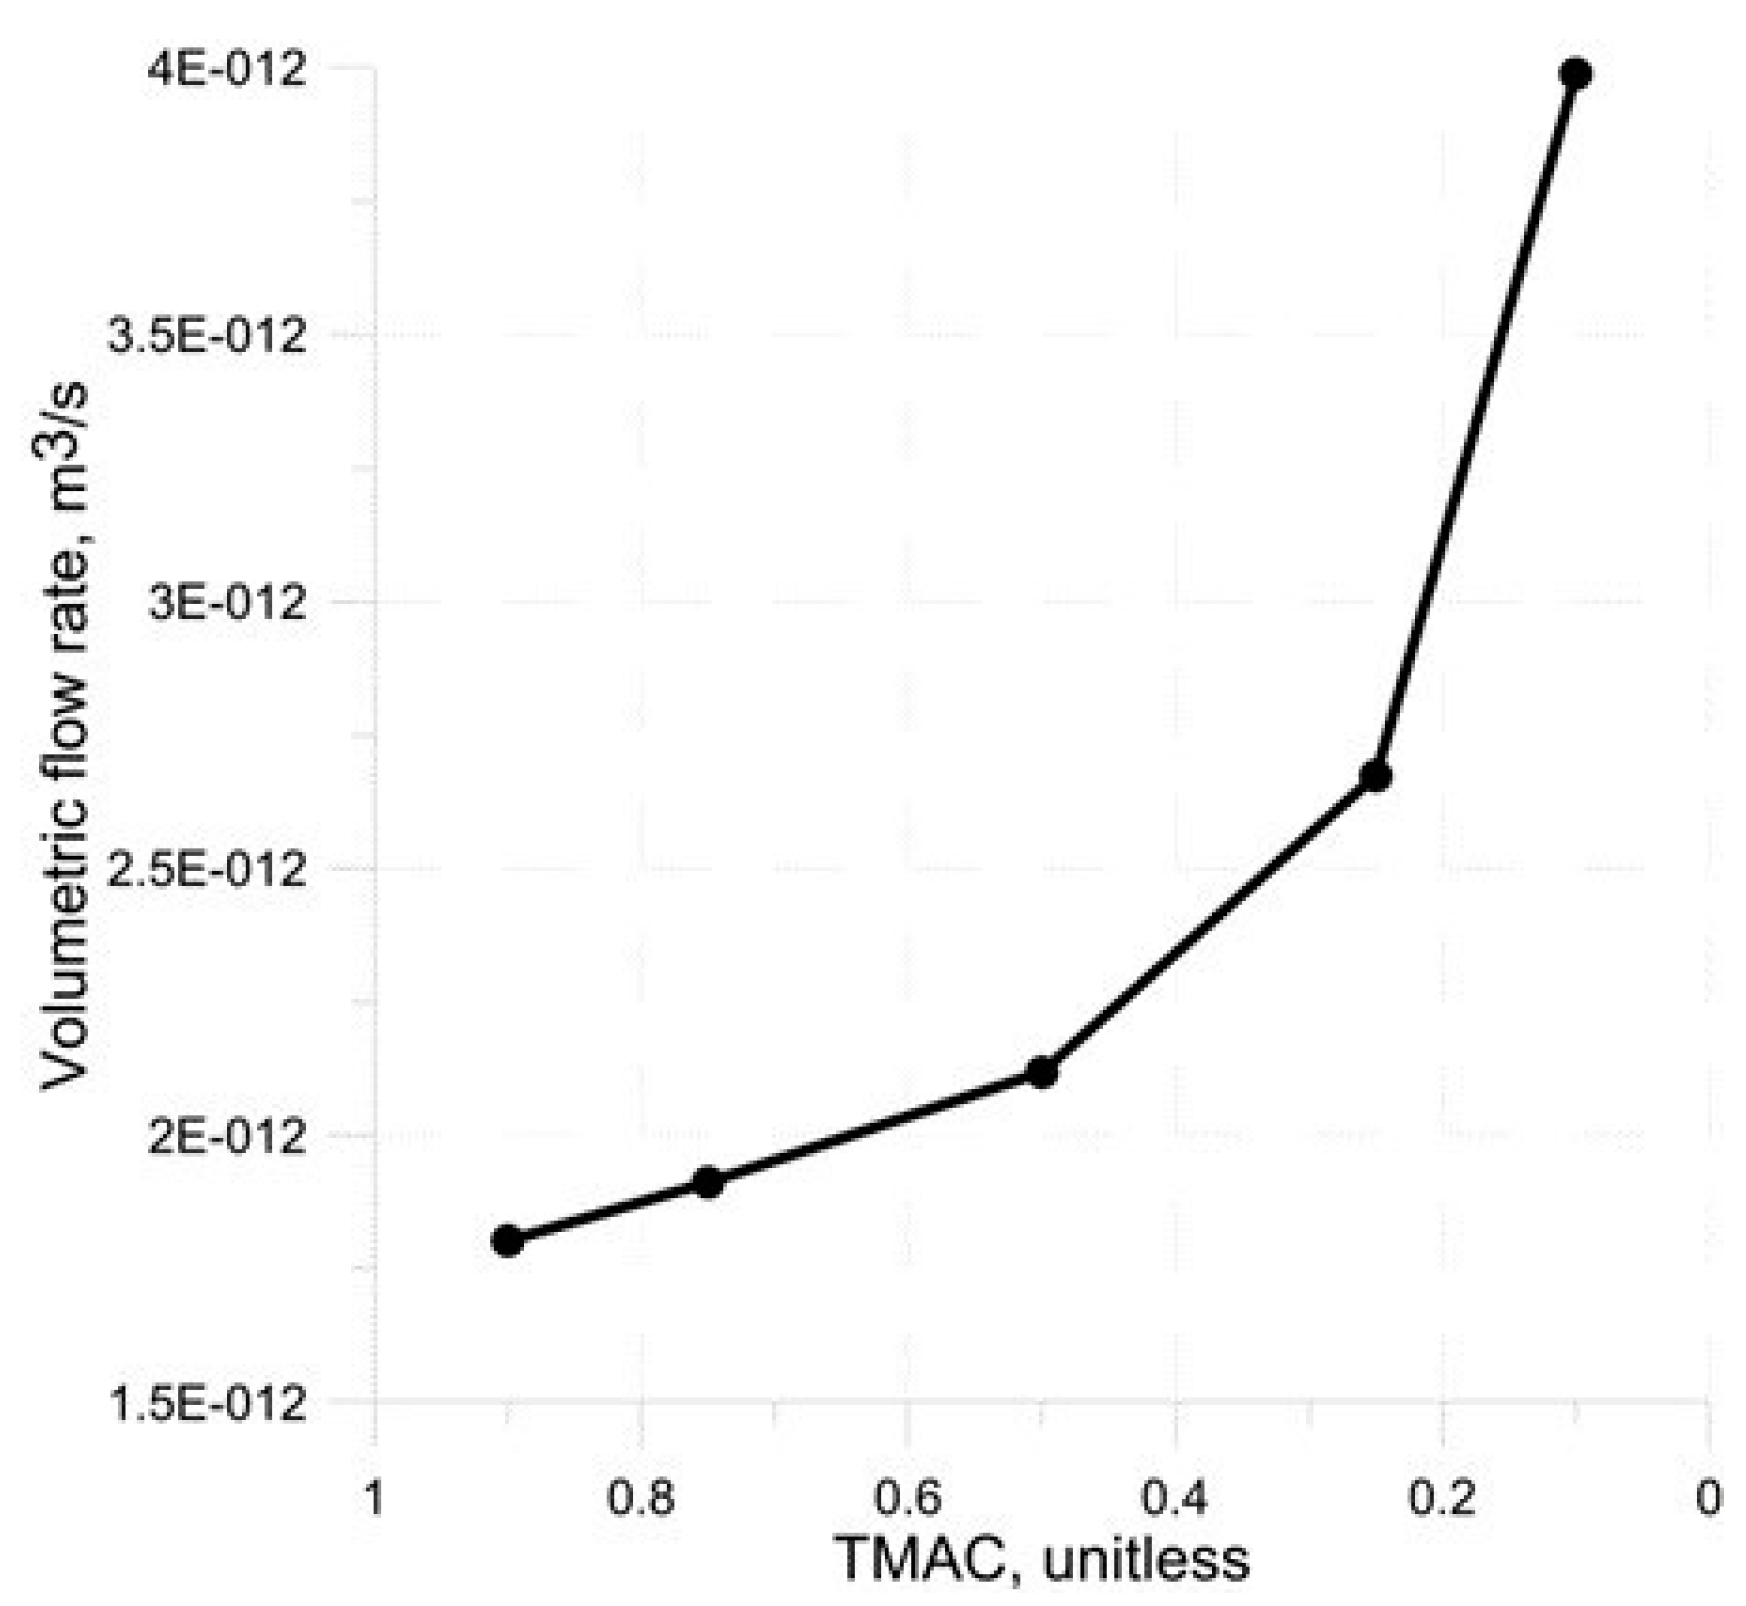
Numerical simulations were performed for different boundary conditions, which represented the conditions occurring during fluid flow through the porous material. The impact of the Tangential Momentum Accommodation Coefficient on the total gas flow rate was also investigated. In the partial slip model, the TMAC value was adopted in the whole range from 0.1 to 0.9. The differences in velocity distribution in pore space forced by slip velocity are presented in
Figure 7. The values of velocity inside the pore channel increased with a lower TMAC coefficient and higher slip velocity, calculated using Equation (1).
The changes in the nitrogen volumetric flow rate in the same pore space sample, for different TMAC values, are presented in
Figure 8. Additionally, the calculated volumetric flow rate of nitrogen without slip velocity is presented.
All calculations were performed for nitrogen properties and pressure of 101,325 Pa (
Table 1 and
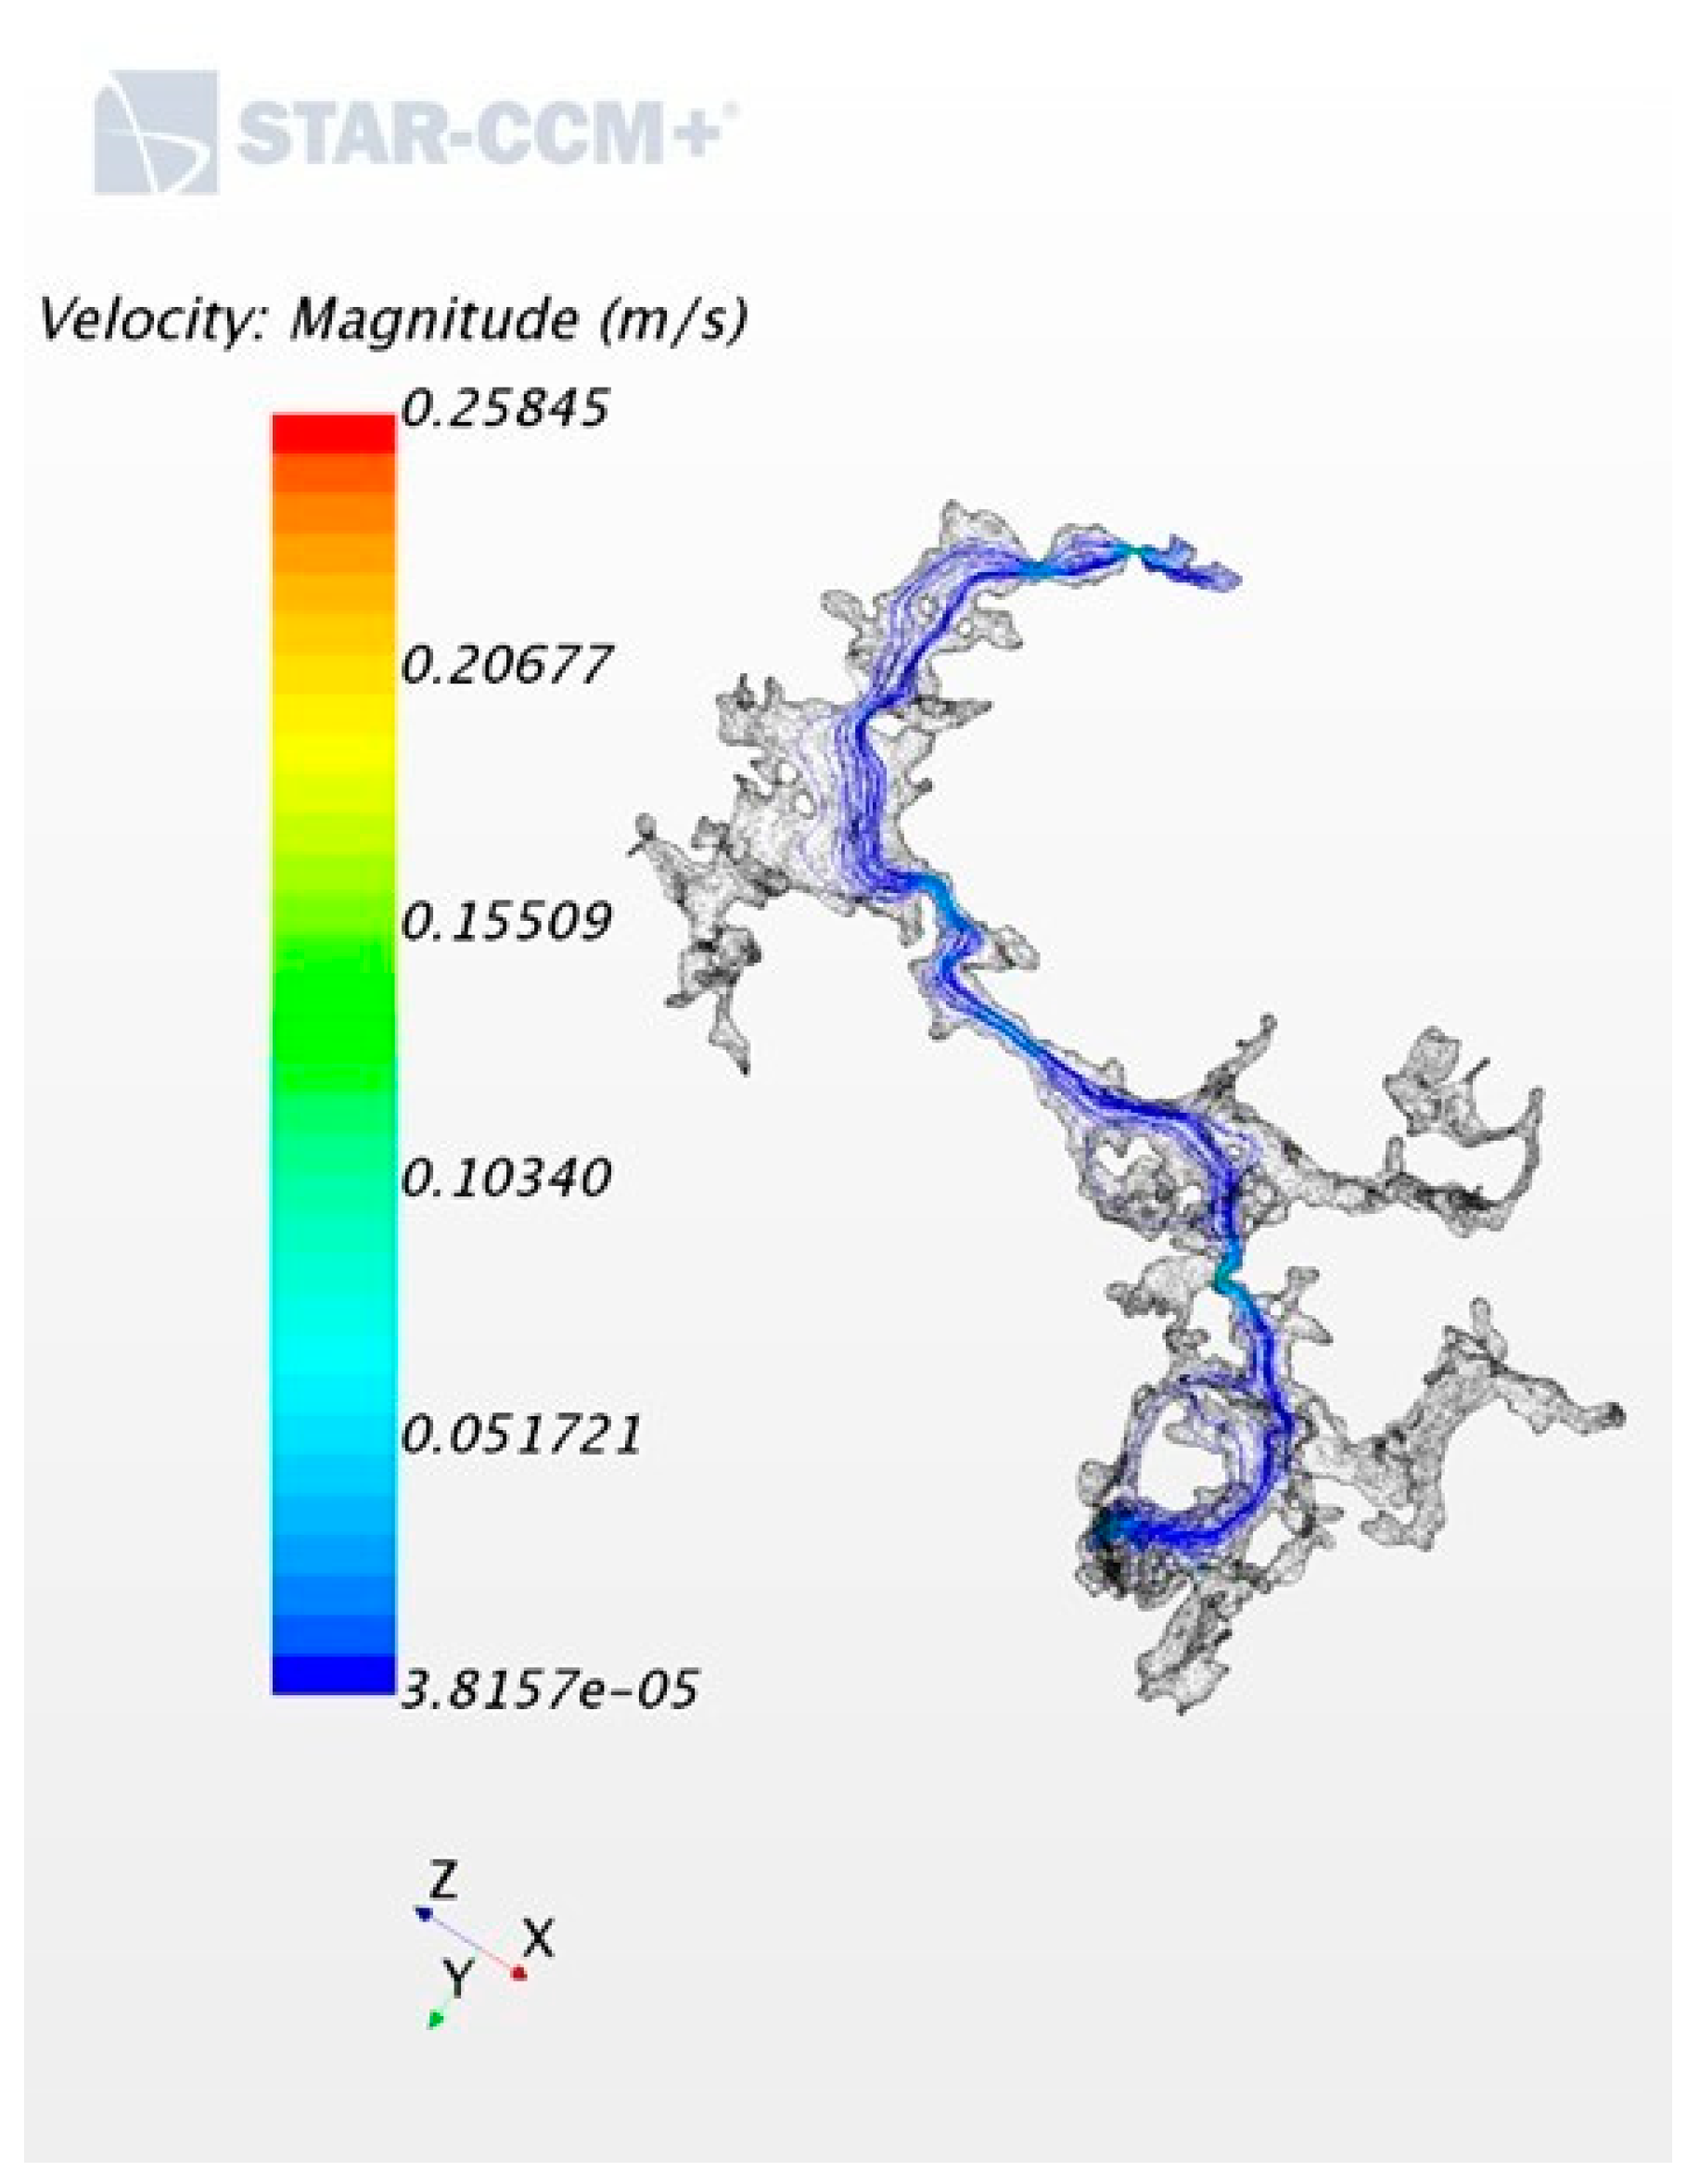
Table 2). Streamlines for fluid flow distribution colored by pressure and velocity are presented in
Figure 9 and
Figure 10, respectively. The difference of pressure between inlet and outlet can vary in a defined range. In all simulations, the same value 100 Pa was adopted to keep similar conditions during results comparison.
4. Discussion
Values of absolute permeability were determined using the mentioned equations and the results of numerical simulations using the CFD technique. Firstly, the series of simulations were conducted using water and nitrogen with properties at ambient conditions (101,325 Pa), presented in
Table 1 and
Table 2.
Figure 11 shows the results of the absolute permeability estimation using Equations (3) and (5) for water and nitrogen, respectively. The input data to determine these values was the volumetric flow rate from the CFD simulations. The permeability calculated for the case with liquid (water) is close to the values obtained for gas (nitrogen) and non-slip boundary conditions, as well as the partial slip model with
TMAC = 0.9.
The second series of simulations were performed using incompressible gas (nitrogen) with properties determined at different average pressures, keeping the same pressure difference between the inlet and outlet of the sample (
p1 −
p2 = 100 Pa). Calculated results for the range of pressures analyzed (14.5 to 500 psi) have the same level of value, close to 1.5 mD (
Figure 12). All these values are slightly different and smaller than a value obtained for the case with water.
Figure 13 presents the results of the permeability calculated using Equation (7) for compressible gas. This equation is used to calculate the volumetric flow rate, where the permeability value is known, for example, using dedicated measuring techniques. In cases for low porous rocks, not all standard measuring methods can be used for absolute permeability estimation. Permeability calculated for compressible gas can be a dozen times smaller than the value obtained at standard conditions. In the analyzed case, the calculated absolute permeability of the low porous rock sample is equal to 0.04 mD and comparable to the measured value of 0.023 mD from the gas permeameter in laboratory conditions and at the confining pressure of 500 psi. The calculated value is higher than from the core test, which can be caused by several factors. Firstly, the core test is carried out the core plug (about 1 inch in diameter, about 2 inches in height), while the CT measurement was conducted on the small fragment of the rock. Secondly, the sample in the core test was under pressure, while the reconstruction of the geometrical CT model was prepared at the ambient condition (pressure and temperature).
5. Conclusions
The paper presents results of permeability determination using compressible and incompressible gas (nitrogen), water, and results of numerical simulations. Absolute permeability is a very important parameter and can give answers about the potential of gas exploitation from a technical, environmental, and economic point of view. The presented approach combining computed X-ray tomography, numerical simulations, equation of state, and compressible gas properties allowed determining absolute permeability. Computational fluid dynamics (CFD) also gave the possibility to investigate and analyze slip velocity occurring at the wall of pore channels with a really small diameter. The basic input data was the 3D model of the pore space, extracted using highly specialized software poROSE (poROus materials examination SoftwarE, AGH University of Science and Technology, Kraków, Poland).
The presented methodology, based on the CT input data, combined the CFD approach, taking into account the partial-slip model, and the relation for absolute permeability at different gas pressures. Moreover, when the slip phenomenon occurs (characterized by the Knudsen number, Kn > 0.01), a developed methodology using TMAC should be applied to increase the accuracy of the results.
The results of fluid flow simulations were combined with laboratory measurement data using a gas permeameter and confirmed the high impact of gas compressibility on the obtained absolute permeability values.
The main highlights are as follows:
Absolute permeability can be estimated using a combined approach: a 3D geometrical model of the pore space from computed X-ray tomography data and results of CFD simulations;
The selection of the simulation parameters are the key to mapping the reservoir conditions;
Partial slip flow and the proper selection of the TMAC parameter can deliver reliable results of the simulation and, thanks to it, the approximate value of absolute permeability;
It is necessary to control the simulation results with the laboratory core test, such as the gas permeameter, because a small change in the simulation parameters can deliver different values of absolute permeability;
CFD modeling carried out only on the real projection of the pore space provides comparable and correct results for absolute permeability estimation;
The absolute permeability of the low porous rock sample was calculated based on the CFD simulation results, such as for compressible gas, and the average pressure 500 psi was comparable to the measured value from the gas permeameter in laboratory conditions.
Author Contributions
P.K.: conception, data analysis, fluid flow simulations, results analysis, laboratory measurement calculations, paper preparation; P.M.: conception, numerical model development, fluid flow simulations, results analysis, paper preparation.
Funding
National Centre for Research and Development in Poland, program LIDER VI, project no. LIDER/319/L–6/14/NCBR/2015: Innovative method of unconventional oil and gas reservoirs interpretation using computed X-ray tomography. Dean of Faculty of Geology, Geophysics and Environmental Protection (the research subsidy no. 16.16.140.315) and Dean of Faculty of Mechanical Engineering and Robotics (grant. no. 16.16.130.942), AGH University of Science and Technology in Kraków, Poland.
Acknowledgments
Computed X-ray tomography, laboratory measurements of permeability, and poROSE software were financed by the National Centre for Research and Development in Poland, program LIDER VI, project no. LIDER/319/L–6/14/NCBR/2015: Innovative method of unconventional oil and gas reservoirs interpretation using computed X-ray tomography. The authors thank the co-authors of poROSE software: Habrat M., Puskarczyk E., Jędrychowski M. The results were also partially supported and financed by Dean of Faculty of Geology, Geophysics and Environmental Protection (the research subsidy no. 16.16.140.315) and Dean of Faculty of Mechanical Engineering and Robotics (grant. no. 16.16.130.942), AGH University of Science and Technology.
Conflicts of Interest
The authors declare no conflict of interest.
Nomenclature
| CFD | Computational Fluid Dynamics |
| uslip | tangential slip velocity, m/s |
| u | gas velocity, m/s |
| σv | tangential momentum accommodation coefficient |
| L | mean free path of the gas |
| κ | Boltzmann constant |
| T | temperature, K |
| t | temperature, °C |
| P | pressure, Pa |
| σ | Lennard Jones characteristic length or collision diameter, m−10 |
| K | absolute permeability, mD |
| Φ | porosity of rock sample |
| As | cross-section area of sample space, m2 |
| Ap | cross-section area of pore object space, m2 |
| p1, p2 | pressure at the inlet and outlet of the sample, Pa |
| Ls | sample length, m |
| µ | dynamic viscosity, Pa∙s |
| volumetric flow rate, m3/s |
| mass flow rate, kg/s |
| Z | compressibility factor |
References
- Krakowska, P.; Puskarczyk, E.; Jędrychowski, M.; Habrat, M.; Madejski, P.; Dohnalik, M. Innovative characterization of tight sandstones from Paleozoic basins in Poland using X-ray computed tomography supported by nuclear magnetic resonance and mercury porosimetry. J. Pet. Sci. Eng. 2018, 166, 389–405. [Google Scholar] [CrossRef]
- Han, G.; Chen, Y.; Liu, X. Investigation of Analysis Methods for Pulse Decay Tests Considering Gas Adsorption. Energies 2019, 12, 2562. [Google Scholar] [CrossRef]
- Cao, N.; Lei, G.; Dong, P.; Li, H.; Wu, Z.; Li, Y. Stress-Dependent Permeability of Fractures in Tight Reservoirs. Energies 2019, 12, 117. [Google Scholar] [CrossRef]
- Ma, X.; Li, X.; Zhang, S.; Zhang, Y.; Hao, X.; Liu, J. Impact of Local Effects on the Evolution of Unconventional Rock Permeability. Energies 2019, 12, 478. [Google Scholar] [CrossRef]
- Golparvar, A.; Zhou, Y.; Wu, K.; Ma, J.; Yu, Z. A comprehensive review of pore scale modeling methodology for multiphase flow in porous media. Adv. Geo-Energy Res. 2018, 2, 418–440. [Google Scholar] [CrossRef]
- Yang, Y.; Wang, K.; Zhang, L.; Sun, H.; Zhang, K.; Ma, J. Pore-scale simulation of shale oil flow based on pore network model. Fuel 2019, 251, 683–692. [Google Scholar] [CrossRef]
- Islam, A.; Chevalier, S.; Sassi, M. Structural characterization and numerical simulations of flow properties of standard and reservoir carbonate rocks using micro-tomography. Comput. Geosci. 2018, 113, 14–22. [Google Scholar] [CrossRef]
- Islam, A.; Faisal, T.F.; Chevalier, S.; Jouini, M.S.; Sassi, M. Multi-scale experimental and numerical simulation workflow of absolute permeability in heterogeneous carbonates. J. Pet. Sci. Eng. 2019, 173, 326–338. [Google Scholar] [CrossRef]
- Li, X.; Jiang, Z.; Min, C. Quantitative Study of the Geometrical and Hydraulic Characteristics of a Single Rock Fracture. Energies 2019, 12, 2796. [Google Scholar] [CrossRef]
- Saxena, N.; Hows, A.; Hofmann, R.; Faruk, O.A.; Freeman, J.; Hunter, S.; Appel, M. Imaging and computational considerations for image computed permeability: Operating envelope of Digital Rock Physics. Adv. Water Resour. 2018, 116, 127–144. [Google Scholar] [CrossRef]
- Wu, Y.; Tahmasebi, P.; Lin, C.; Muhammad Munawar, M.J.; Cnudde, V. Effects of micropores on geometric, topological and transport properties of pore systems for low-permeability porous media. J. Hydrol. 2019, 575, 327–342. [Google Scholar] [CrossRef]
- Wu, H.; Yao, Y.; Zhou, Y.; Qiu, F. Analyses of representative elementary volume for coal using X-ray µ-CT and FIB-SEM and its application in permeability predication model. Fuel 2019, 254, 115563. [Google Scholar] [CrossRef]
- Zakirov, T.; Galeev, A. Absolute permeability calculations in micro-computed tomography models of sandstones by Navier-Stokes and lattice Boltzmann equations. Int. J. Heat Mass Transf. 2019, 129, 415–426. [Google Scholar] [CrossRef]
- Zambrano, M.; Tondi, E.; Mancini, L.; Lanzafame, G.; Trias, F.X.; Arzilli, F.; Materazzi, M.; Torrieri, S. Fluid flow simulation and permeability computation in deformed porous carbonate grainstones. Adv. Water Resour. 2018, 115, 95–111. [Google Scholar] [CrossRef]
- Madejski, P.; Krakowska, P.; Habrat, M.; Puskarczyk, E.; Jędrychowski, M. Permeability determination in tight rock sample using novel method based on partial slip modelling and X-ray tomography data. Int. J. Numer. Methods Heat Fluid Flow 2019. ahead-of-print. [Google Scholar] [CrossRef]
- Liu, M.; Shabaninejad, M.; Mostaghimi, P. Impact of mineralogical heterogeneity on reactive transport modelling. Comput. Geosci. 2017, 104, 12–19. [Google Scholar] [CrossRef]
- Mostaghimi, P.; Blunt, M.J.; Bijeljic, B. Computations of Absolute Permeability on Micro-CT Images. Math. Geosci. 2013, 45, 103–125. [Google Scholar] [CrossRef]
- Krause, M.; Heuveline, V. Parallel fluid flow control and optimization with lattice Boltzmann methods and automatic differentiation. Comput. Fluids 2013, 80, 28–36. [Google Scholar] [CrossRef]
- Kakouei, A.; Vatani, A.; Rasaei, M.; Sola, B.; Moqtaderi, H. Cessation of Darcy regime in gas flow through porous media using LBM: Comparison of pressure gradient approaches. J. Nat. Gas Sci. Eng. 2017, 45, 693–705. [Google Scholar] [CrossRef]
- Wang, J.; Ju, Y.; Huang, Y.; Zheng, J.; Zheng, Z. Study of the influence of porous structure on the permeability of rock using Lattice Boltzmann method. Procedia Eng. 2015, 102, 1835–1841. [Google Scholar] [CrossRef][Green Version]
- Botor, D.; Golonka, J.; Zając, J.; Papiernik, B.; Guzy, P. Petroleum generation and expulsion in the lower Palaeozoic petroleum source rocks at the SW margin of the East European Craton (Poland). Ann. Soc. Geol. Pol. 2019, 89. [Google Scholar] [CrossRef]
- Poprawa, P.; Kosakowski, P.; Wróbel, M. Burial and thermal history of the Polish part of the Baltic region. Geol. Q. 2010, 54, 131–142. [Google Scholar]
- Kosakowski, P.; Kotarba, M.J.; Piestrzyński, A.; Shogenova, A.; Więcław, D. Petroleum source rock evaluation of the Alum and Dictyonema Shales (Upper Cambrian–Lower Ordovician) in the Baltic Basin and Podlasie Depression (eastern Poland). Int. J. Earth Sci. 2016, 106, 743–761. [Google Scholar] [CrossRef]
- Botor, D.; Golonka, J.; Anczkiewicz, A.A.; Dunkl, I.; Papiernik, B.; Zając, J.; Guzy, P. Burial and thermal history of the lower Palaeozoic petroleum source rocks at the SW margin of the East European Craton (Poland). Ann. Soc. Geol. Pol. 2019, 89. [Google Scholar] [CrossRef]
- Pan, S.; Zou, C.; Li, J.; Yang, Z.; Li, E.; Han, Y. Unconventional shale systems: A comparative study of the “in-source sweet spot” developed in the lacustrine Chang 7 Shale and the marine Barnett Shale. Mar. Pet. Geol. 2019, 100, 540–550. [Google Scholar] [CrossRef]
- Hu, S.; Zhu, R.; Wu, S.; Bai, B.; Yang, Z.; Cui, J. Exploration and development of continental tight oil in China. Pet. Explor. Dev. 2018, 45, 790–802. [Google Scholar] [CrossRef]
- Krakowska, P. Detailed parametrization of the pore space in tight clastic rocks from Poland based on laboratory measurement results. Acta Geophys. 2019, 67, 1765–1776. [Google Scholar] [CrossRef]
- Puskarczyk, E.; Krakowska, P.; Jędrychowski, M.; Habrat, M.; Madejski, P. A novel approach to the quantitative interpretation of petrophysical parameters using nano-CT: Example of Paleozoic carbonates. Acta Geophys. 2018, 66, 1453–1461. [Google Scholar] [CrossRef]
- Madejski, P.; Krakowska, P.; Habrat, M.; Puskarczyk, E.; Jędrychowski, M. Comprehensive Approach for Porous Materials Analysis Using a Dedicated Preprocessing Tool for Mass and Heat Transfer Modeling. J. Therm. Sci. 2018, 27, 479–486. [Google Scholar] [CrossRef]
- Habrat, M.; Krakowska, P.; Puskarczyk, E.; Jędrychowski, M.; Madejski, P. The concept of a computer system for interpretation of tight rocks using X-ray computed tomography results. Studia Geotech. Et Mech. 2017, 39, 101–107. [Google Scholar] [CrossRef]
- Ghanbarian, B.; Torres-Verdín, C.; Lake, L.W.; Marder, M. Gas permeability in unconventional tight sandstones: Scaling up from pore to core. J. Pet. Sci. Eng. 2019, 173, 1163–1172. [Google Scholar] [CrossRef]
- Civan, F. Porous Media Transport Phenomena; John Wiley & Sons Inc.: Hoboken, NJ, USA, 2011. [Google Scholar]
- Dullien, F. Porous Media Fluid Transport and Pore Structure, 2nd ed.; Academic Press, Elsevier: Cambridge, MA, USA, 2012. [Google Scholar]
- Simcenter STAR-CCM+® Version 13.06; Siemens PLM Software: Plano, TX, USA, 2018.
- Moghaddam, R.N.; Jamiolahmady, M. Slip flow in porous media. Fuel 2016, 173, 298–310. [Google Scholar] [CrossRef]
- Craft, B.C.; Hawkins, M. Applied Petroleum Reservoir Engineering, 3rd ed.; Pearson Education, Inc.: Hoboken, NJ, USA, 2015. [Google Scholar]
Figure 1.
Scheme of the CT analysis for the Cambrian sandstone sample; 2D grey image size: 1.2 × 1.5 mm, 3D sample size: 1.28 × 1.54 × 0.96 mm.
Figure 1.
Scheme of the CT analysis for the Cambrian sandstone sample; 2D grey image size: 1.2 × 1.5 mm, 3D sample size: 1.28 × 1.54 × 0.96 mm.
Figure 2.
Geometrical representation of the largest pore object inside the analyzed region of the sample. Sample height: 0.96 mm.
Figure 2.
Geometrical representation of the largest pore object inside the analyzed region of the sample. Sample height: 0.96 mm.
Figure 3.
Scheme of the research.
Figure 3.
Scheme of the research.
Figure 4.
Classification of the pore volume, colors: red—1–99 vx; orange—100–999 vx; yellow—1000–9999 vx; green—10,000–99,999 vx; dark blue—100,000–999,999 vx; magenta—above 1,000,000 vx; poROSE software.
Figure 4.
Classification of the pore volume, colors: red—1–99 vx; orange—100–999 vx; yellow—1000–9999 vx; green—10,000–99,999 vx; dark blue—100,000–999,999 vx; magenta—above 1,000,000 vx; poROSE software.
Figure 5.
Result of skeleton analysis in the form of the central axis of each object, tight sandstone sample, poROSE software.
Figure 5.
Result of skeleton analysis in the form of the central axis of each object, tight sandstone sample, poROSE software.
Figure 6.
Pore size distribution based on mercury porosimetry (black) and computed X-ray tomography data (blue).
Figure 6.
Pore size distribution based on mercury porosimetry (black) and computed X-ray tomography data (blue).
Figure 7.
Velocity distribution in the pore space of tight sandstone calculated using the model without molecules slip at the pore walls (a) and partial slip model with different Tangential Momentum Accommodation Coefficient (TMAC) values equal to 0.9 (b), 0.5 (c), and 0.1 (d).
Figure 7.
Velocity distribution in the pore space of tight sandstone calculated using the model without molecules slip at the pore walls (a) and partial slip model with different Tangential Momentum Accommodation Coefficient (TMAC) values equal to 0.9 (b), 0.5 (c), and 0.1 (d).
Figure 8.
Volumetric flow rate at the pore space outlet calculated using a partial slip model and different values of TMAC.
Figure 8.
Volumetric flow rate at the pore space outlet calculated using a partial slip model and different values of TMAC.
Figure 9.
Streamlines inside the pore space colored by pressure for the case without slip velocity.
Figure 9.
Streamlines inside the pore space colored by pressure for the case without slip velocity.
Figure 10.
Streamlines inside the pore space colored by velocity for the case without slip velocity.
Figure 10.
Streamlines inside the pore space colored by velocity for the case without slip velocity.
Figure 11.
Calculated permeability K for incompressible gas (light blue) using Equation (5) based on the computational fluid dynamics (CFD) simulation results and different TMAC values (non-slip, 0.1 to 0.9), and for water (dark blue) using Equation (3).
Figure 11.
Calculated permeability K for incompressible gas (light blue) using Equation (5) based on the computational fluid dynamics (CFD) simulation results and different TMAC values (non-slip, 0.1 to 0.9), and for water (dark blue) using Equation (3).
Figure 12.
Calculated permeability K for incompressible gas (light blue) using Equation (5) based on the CFD simulation results and different average pressure values (14.5 to 500 psi), and for water (dark blue) using Equation (3) and one pressure value of 14.5 psi.
Figure 12.
Calculated permeability K for incompressible gas (light blue) using Equation (5) based on the CFD simulation results and different average pressure values (14.5 to 500 psi), and for water (dark blue) using Equation (3) and one pressure value of 14.5 psi.
Figure 13.
Calculated permeability K for compressible gas using Equation (7) based on the CFD simulation results and different average pressure values (14.5 to 500 psi).
Figure 13.
Calculated permeability K for compressible gas using Equation (7) based on the CFD simulation results and different average pressure values (14.5 to 500 psi).
Table 1.
Properties of nitrogen used in the simulations, as a function of pressure at t = 20 °C.
Table 1.
Properties of nitrogen used in the simulations, as a function of pressure at t = 20 °C.
| No. | Pressure | Pressure | Density | Dynamic Viscosity |
|---|
| p, MPa | p, PSI | ρ, kg/m3 | η, Pa·s |
|---|
| 1. | 0.1 | 14.5 | 1.15 | 0.00001757 |
| 2. | 0.689 | 100 | 7.93 | 0.00001765 |
| 3. | 1.723 | 250 | 19.87 | 0.00001781 |
| 4. | 3.0 | 435 | 34.66 | 0.00001803 |
| 5. | 3.447 | 500 | 39.84 | 0.00001812 |
Table 2.
Nitrogen mean free path used in the simulations, as a function of pressure at t = 20 °C, and Knudsen number at and minimum pore channel diameter d = 5 × 10⁻⁶ m.
Table 2.
Nitrogen mean free path used in the simulations, as a function of pressure at t = 20 °C, and Knudsen number at and minimum pore channel diameter d = 5 × 10⁻⁶ m.
| No. | Pressure | Pressure | Mean Free Path | Knudsen Number |
|---|
| p, MPa | p, PSI | L, m | Kn |
|---|
| 1. | 0.1 | 14.5 | 6.9479−8 | 0.01389 |
| 2. | 0.689 | 100 | 1.0084−8 | 0.00202 |
| 3. | 1.723 | 250 | 4.0324−9 | 0.00081 |
| 4. | 3.0 | 435 | 2.316−9 | 0.00046 |
| 5. | 3.447 | 500 | 2.015−9 | 0.00040 |
Table 3.
Parameters of the tight sandstone pore space.
Table 3.
Parameters of the tight sandstone pore space.
| Parameter | Feret Diameter | Thickness Mean | Major Diameter |
|---|
| Unit | µm | µm | µm |
|---|
| Average | 1142 | 7 | 92 |
| Standard deviation | 6455 | 4 | 773 |
| Median | 57 | 6 | 24 |
| Maximum | 270,851 | 23 | 29,946 |
Table 4.
Mean intercept length and tortuosity in the tight sandstone sample.
Table 4.
Mean intercept length and tortuosity in the tight sandstone sample.
| Parameter | Average | Standard Deviation | Median | Maximum |
|---|
| Mean intercept length, µm | 5.68 | 3.69 | 4.67 | 25.44 |
| Tortuosity, unitless | 1.37 | 0.55 | 1.23 | 17.67 |
Table 5.
Skeleton analysis of the pore space.
Table 5.
Skeleton analysis of the pore space.
| Junctions Pxs Count | Isolated Pxs Count | End Pxs Count | Branches Count | Average Coordination Number |
|---|
| 15,070 | 846 | 14,858 | 16,347 | 1.18 |
© 2019 by the authors. Licensee MDPI, Basel, Switzerland. This article is an open access article distributed under the terms and conditions of the Creative Commons Attribution (CC BY) license (http://creativecommons.org/licenses/by/4.0/).


