Abstract
The distributed energy system (DES) has increasingly attracted considerable attention from researchers due to its environmental friendliness and high efficiency. In the hot summer and cold winter areas, DES is an efficient alternative for district cooling and heating. A case study located in Changsha, China, which is a typical hot summer and cold winter area, is analyzed. Four control strategies are proposed in this study. The four cases under different control strategies are compared in terms of energy, economy, environment, solar fraction, and soil annual heat imbalance rate. Results show that the DES can be an energy saving and environmentally friendly alternative. The primary energy saving (PES) is more than 36.70% and can reach up to 48.04%, whereas DES can realize economical operation and reduce the emission of carbon dioxide, sulphur dioxide, and dust. In addition, DES consumes more electricity and less natural gas than the conventional energy system. These features are beneficial to the optimization of China’s energy consumption structure. Moreover, the operation of seasonal thermal storage for the ground soil is effective in maintaining the balance of soil annual heat. The control strategy combining geothermal and solar energies is recommended due to its good performance and high flexibility. This study may provide guidance in the development of DESs in hot summer and cold winter climate zones.
Highlights
- ▪
- A distributed energy system with district cooling and heating is simulated.
- ▪
- Four control strategies are proposed and investigated.
- ▪
- Energy, environmental, and economic performance of the proposed control strategies are compared.
- ▪
- Parameter analysis is conducted.
- ▪
- The combination of solar and geothermal energies can strengthen flexibility.
1. Introduction
With increasing environmental pressures and the development of renewable energy technology, many countries are attempting to adjust their energy structures and reduce their dependence on traditional fossil energy [1]. The distributed energy system (DES) is an efficient, clean, and reliable energy supply alternative [2] that has increasingly attracted considerable attention from researchers in recent decades [3,4]. DES can efficiently integrate with renewable and primary energies and is a feasible and environmentally friendly alternative [5,6]. DESs using clean and renewable energy can be a promising alternative to meet the increasing energy consumption demands and improve the atmospheric environment by reducing pollution emissions [7,8]. In China, DES with renewable energy is encouraged in the country’s long-term planning and additional renewable energy projects will be built. The utilization of renewable energy in buildings is an effective step towards increasing energy efficient buildings in China [9]. In this context, DES using geothermal and solar energies for an indoor swimming pool is proposed and investigated.
Heat pump technology of geothermal energy sources is important in renewable energy applications in DESs. Using shallow geothermal energy resources for district heating and cooling has better energy saving and environmental protection advantages than conventional energy systems [10]. In recent years, geothermal energy has been widely developed and utilized around the world. However, soil temperature recovery is a serious challenge in using the technology of geothermal-source heat pumps. With the long-term operation of the heat pump systems, the underground temperature of the soil will fluctuate and reduce the coefficient of the performance and increase the energy consumption of the system [11]. Solar energy is a clean energy and an unlimited source of energy. However, solar collectors need a large instalment area. In addition, the utilization of solar energy is frequently affected by weather. The combined use of solar and geothermal energies may make up for their respective deficiencies and improve resource utilization, which is an energy saving, environmentally friendly, and sustainable technology [12,13]. This type of DES meets the development needs in current energy situations and has broad development prospects and considerable research value.
Performance analysis is an essential step in the development of DES applications. Operational strategy influences the performance of DES significantly. Performance of DES under different control strategies has to be employed to guarantee the lowest operation cost, reduction of the primary energy consumption (PEC) and pollution emissions. Kang et al. [14] reported the performance of a combined cooling heating and power (CCHP) system under different operation strategies by the building energy simulation software DeST. Cho et al. [15] presented an analysis of a cogeneration system and examined the performance indicators, including operation cost, PEC, and carbon dioxide emission reduction using an optimal energy dispatch algorithm. Their results showed that the operation cost increases, as long as reduction of energy consumption and emissions are guaranteed. Hanafizadeh et al. [16] investigated and analyzed a CCHP system, including economic performance and pollutant emissions based on the software EnergyPlus. Mago et al. [17,18] proposed three operation strategies for a cogeneration system and investigated the performance. Wang et al. [19] investigated the performance analysis of a CCHP system based on primary energy saving (PES), exergy efficiency, and CO2 emission reduction. Jung et al. [20] observed the performance of a DES system with renewable energy. Wei et al. [21] analyzed the performance of primary component capacities in DES and optimized the unit size using multiobjective interval optimization and evidential reasoning approaches. Mehleri et al. [22] presented an optimal design and operation of DESs, which were applied to a Greek residential sector. In general, their results showed that DES has the potential to reduce the emission of greenhouse gases. As a result of the worldwide concern about ecological environment, soil thermal imbalance has been considered in the analysis of energy systems. Gao et al. [23] introduced the geothermal energy utilization for a district heating and cooling system in Shanghai, soil temperatures for the practical pile group were performed, and results showed that five-year soil thermal imbalance ratio reaches 10%. Wang et al. [24] explored the optimal operation on the basis of a real community-integrated energy system in China. Bellos et al. [25] designed four solar-assisted heating systems of heat pumps, and the energetical and financial evaluations were performed by the Transient System Simulation (TRNSYS). Gao et al. [26] investigated the energy performance of DES and district cooling systems under different control strategies in subtropical and high-density urban areas by TRNSYS. Ren et al. [27] evaluated the DES performance under the different climate zones of China. Their results suggested that DESs have a good performance in the hot summer and cold winter areas. Buonomano et al. [28] presented the thermoeconomic analysis of a swimming pool photovoltaic/thermal collector plant system. Tagliafico et al. [29] conducted an energy saving assessment of solar-assisted heat pumps for the water heating of swimming pools. Their results showed that the performance of water solar-assisted heat pump is substantially dependent on the atmospheric conditions.
The previous research on the advantages of DES, problems in utilization technology of geothermal and solar energy, and performance analysis of DES was summarized. Authors found that the performance analysis of DES applied to swimming pools in hot summer and cold winter climate zone needs to be improved, the operation strategies for DESs considering the complementary coordination characteristics between different types of energy were rarely investigated, and the environmental performance such as SO2 emission, dust emission, and soil heat imbalance rate was involved in fewer publications, which also needs to be concerned. The present investigation aimed to analyze the performance of DES and provide guidance for a better operation strategy.
2. Methodology
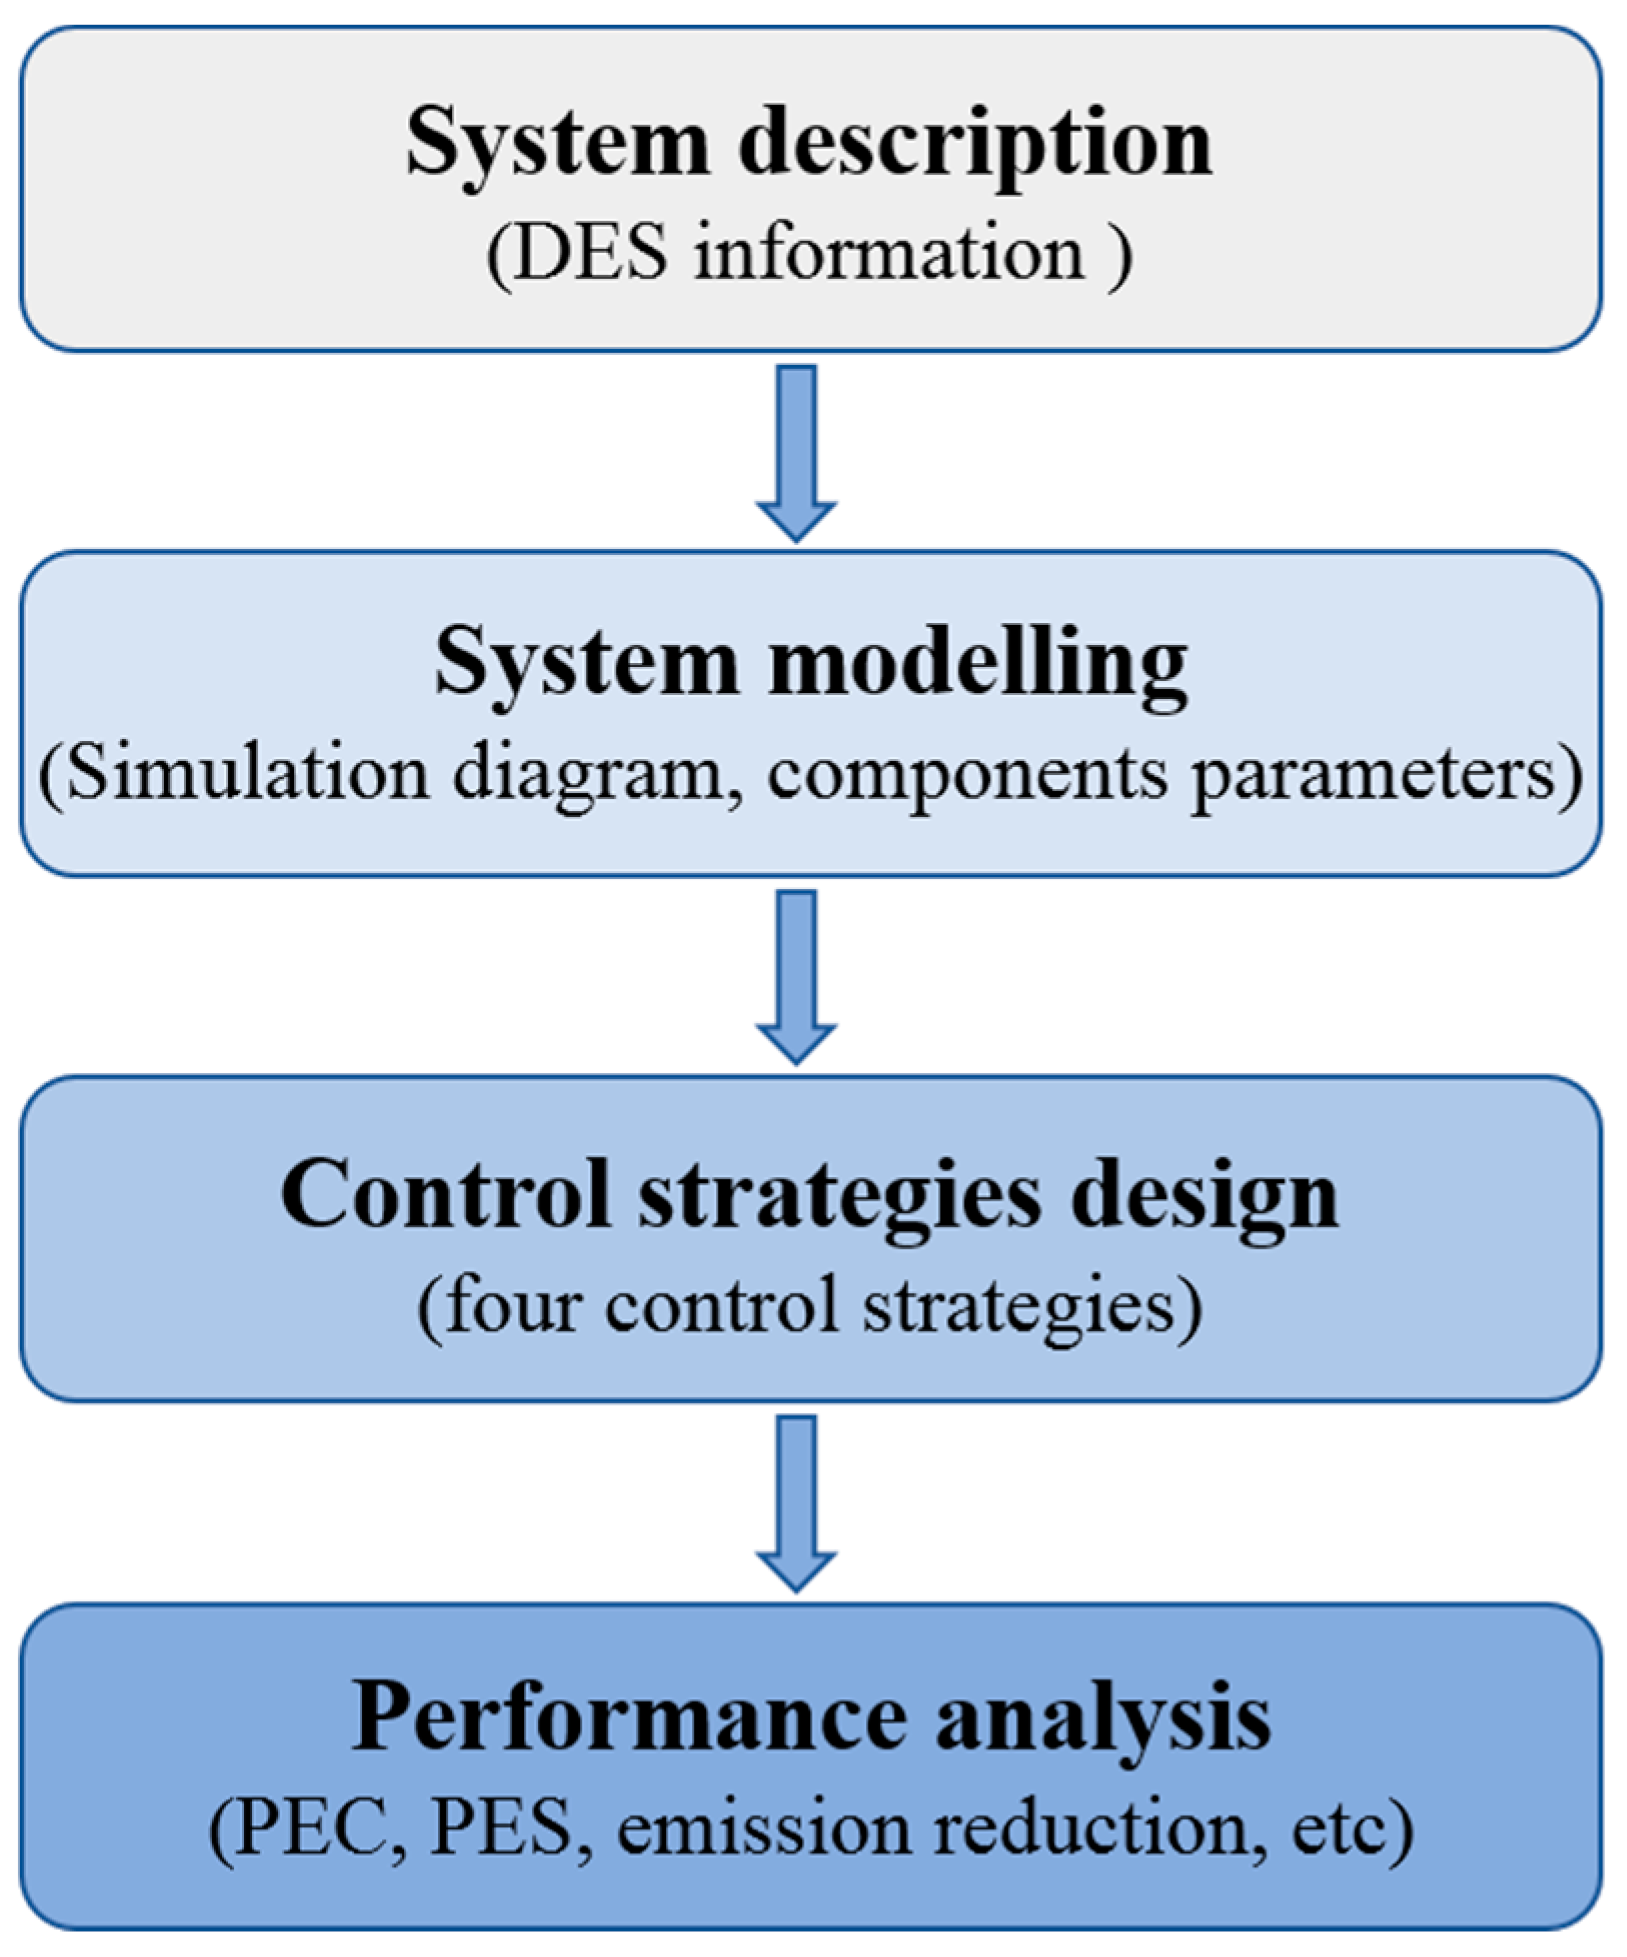
The method to assess the performance of DES is shown in Figure 1. Firstly, DES is introduced. Then, models of DES are established, and four control strategies are proposed. Finally, performance analysis is conducted considering energy, economy, and environment based on several evaluation indicators such as energy consumption, PES, operation cost, and emission reduction, and the results of which are compared with respect to a conventional energy system. Parameters are studied in terms of solar fraction and the soil annual heat imbalance rate.
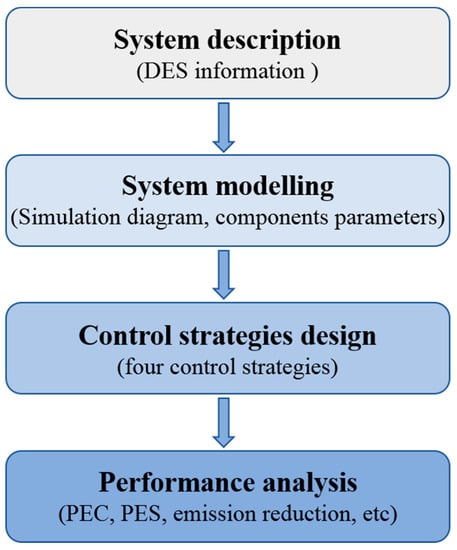
Figure 1.
Method to evaluate the performance of DES.
2.1. System Description
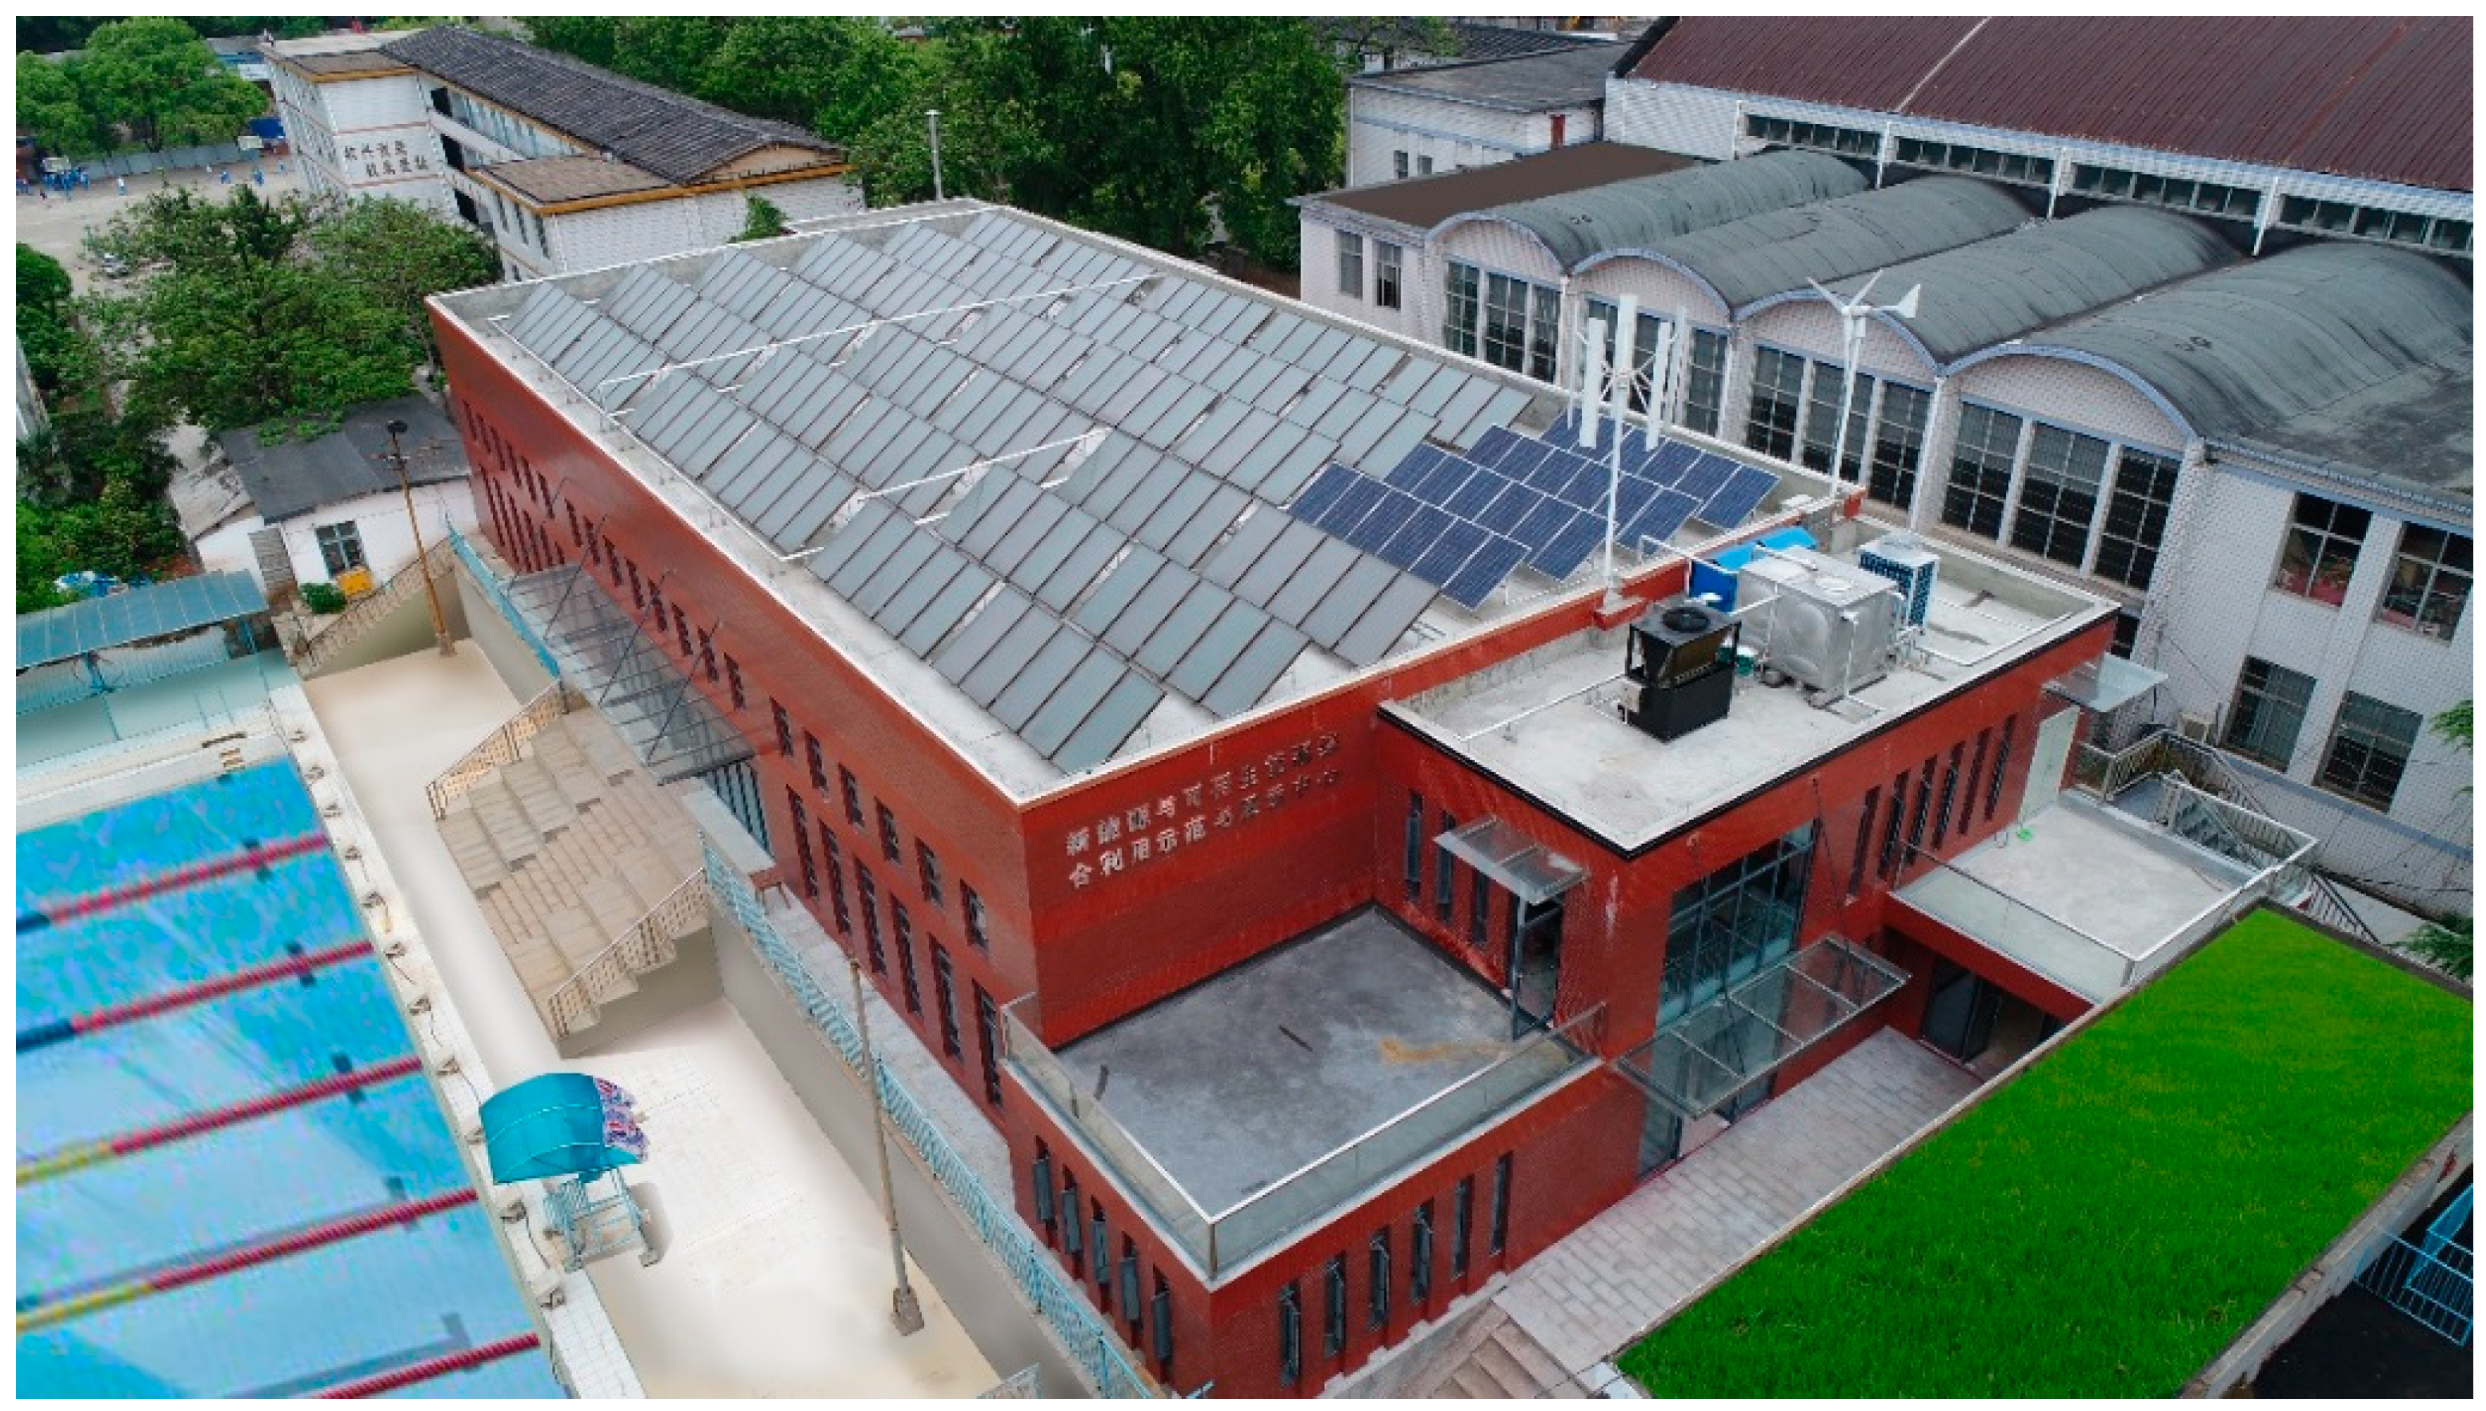
This study explores a DES at the Renewable Energy Demonstration Centre in Changsha as the case study. The DES is located in a hot summer and cold winter climate zone in southeast China. The Renewable Energy Demonstration Centre is shown in Figure 2. This project is a public indoor swimming pool built in a one-floor building. The building includes a flat roof with a height and area of 6.61 m and 1143 m2, respectively. The indoor swimming pool has a total surface area and volume of 450 m2 and 540 m3, respectively. The running time is from 10:00 to 22:00. According to the provisions of the Chinese standard [30], the temperature of public indoor swimming pool should be in the range of 26–28 °C. The space temperature should be set 2 °C higher than the pool temperature, and the relative humidity should be maintained between 55% and 65%. The pool temperature and the indoor relative humidity under investigation are fixed at 27 °C and 60%, respectively.

Figure 2.
The Renewable Energy Demonstration Center.
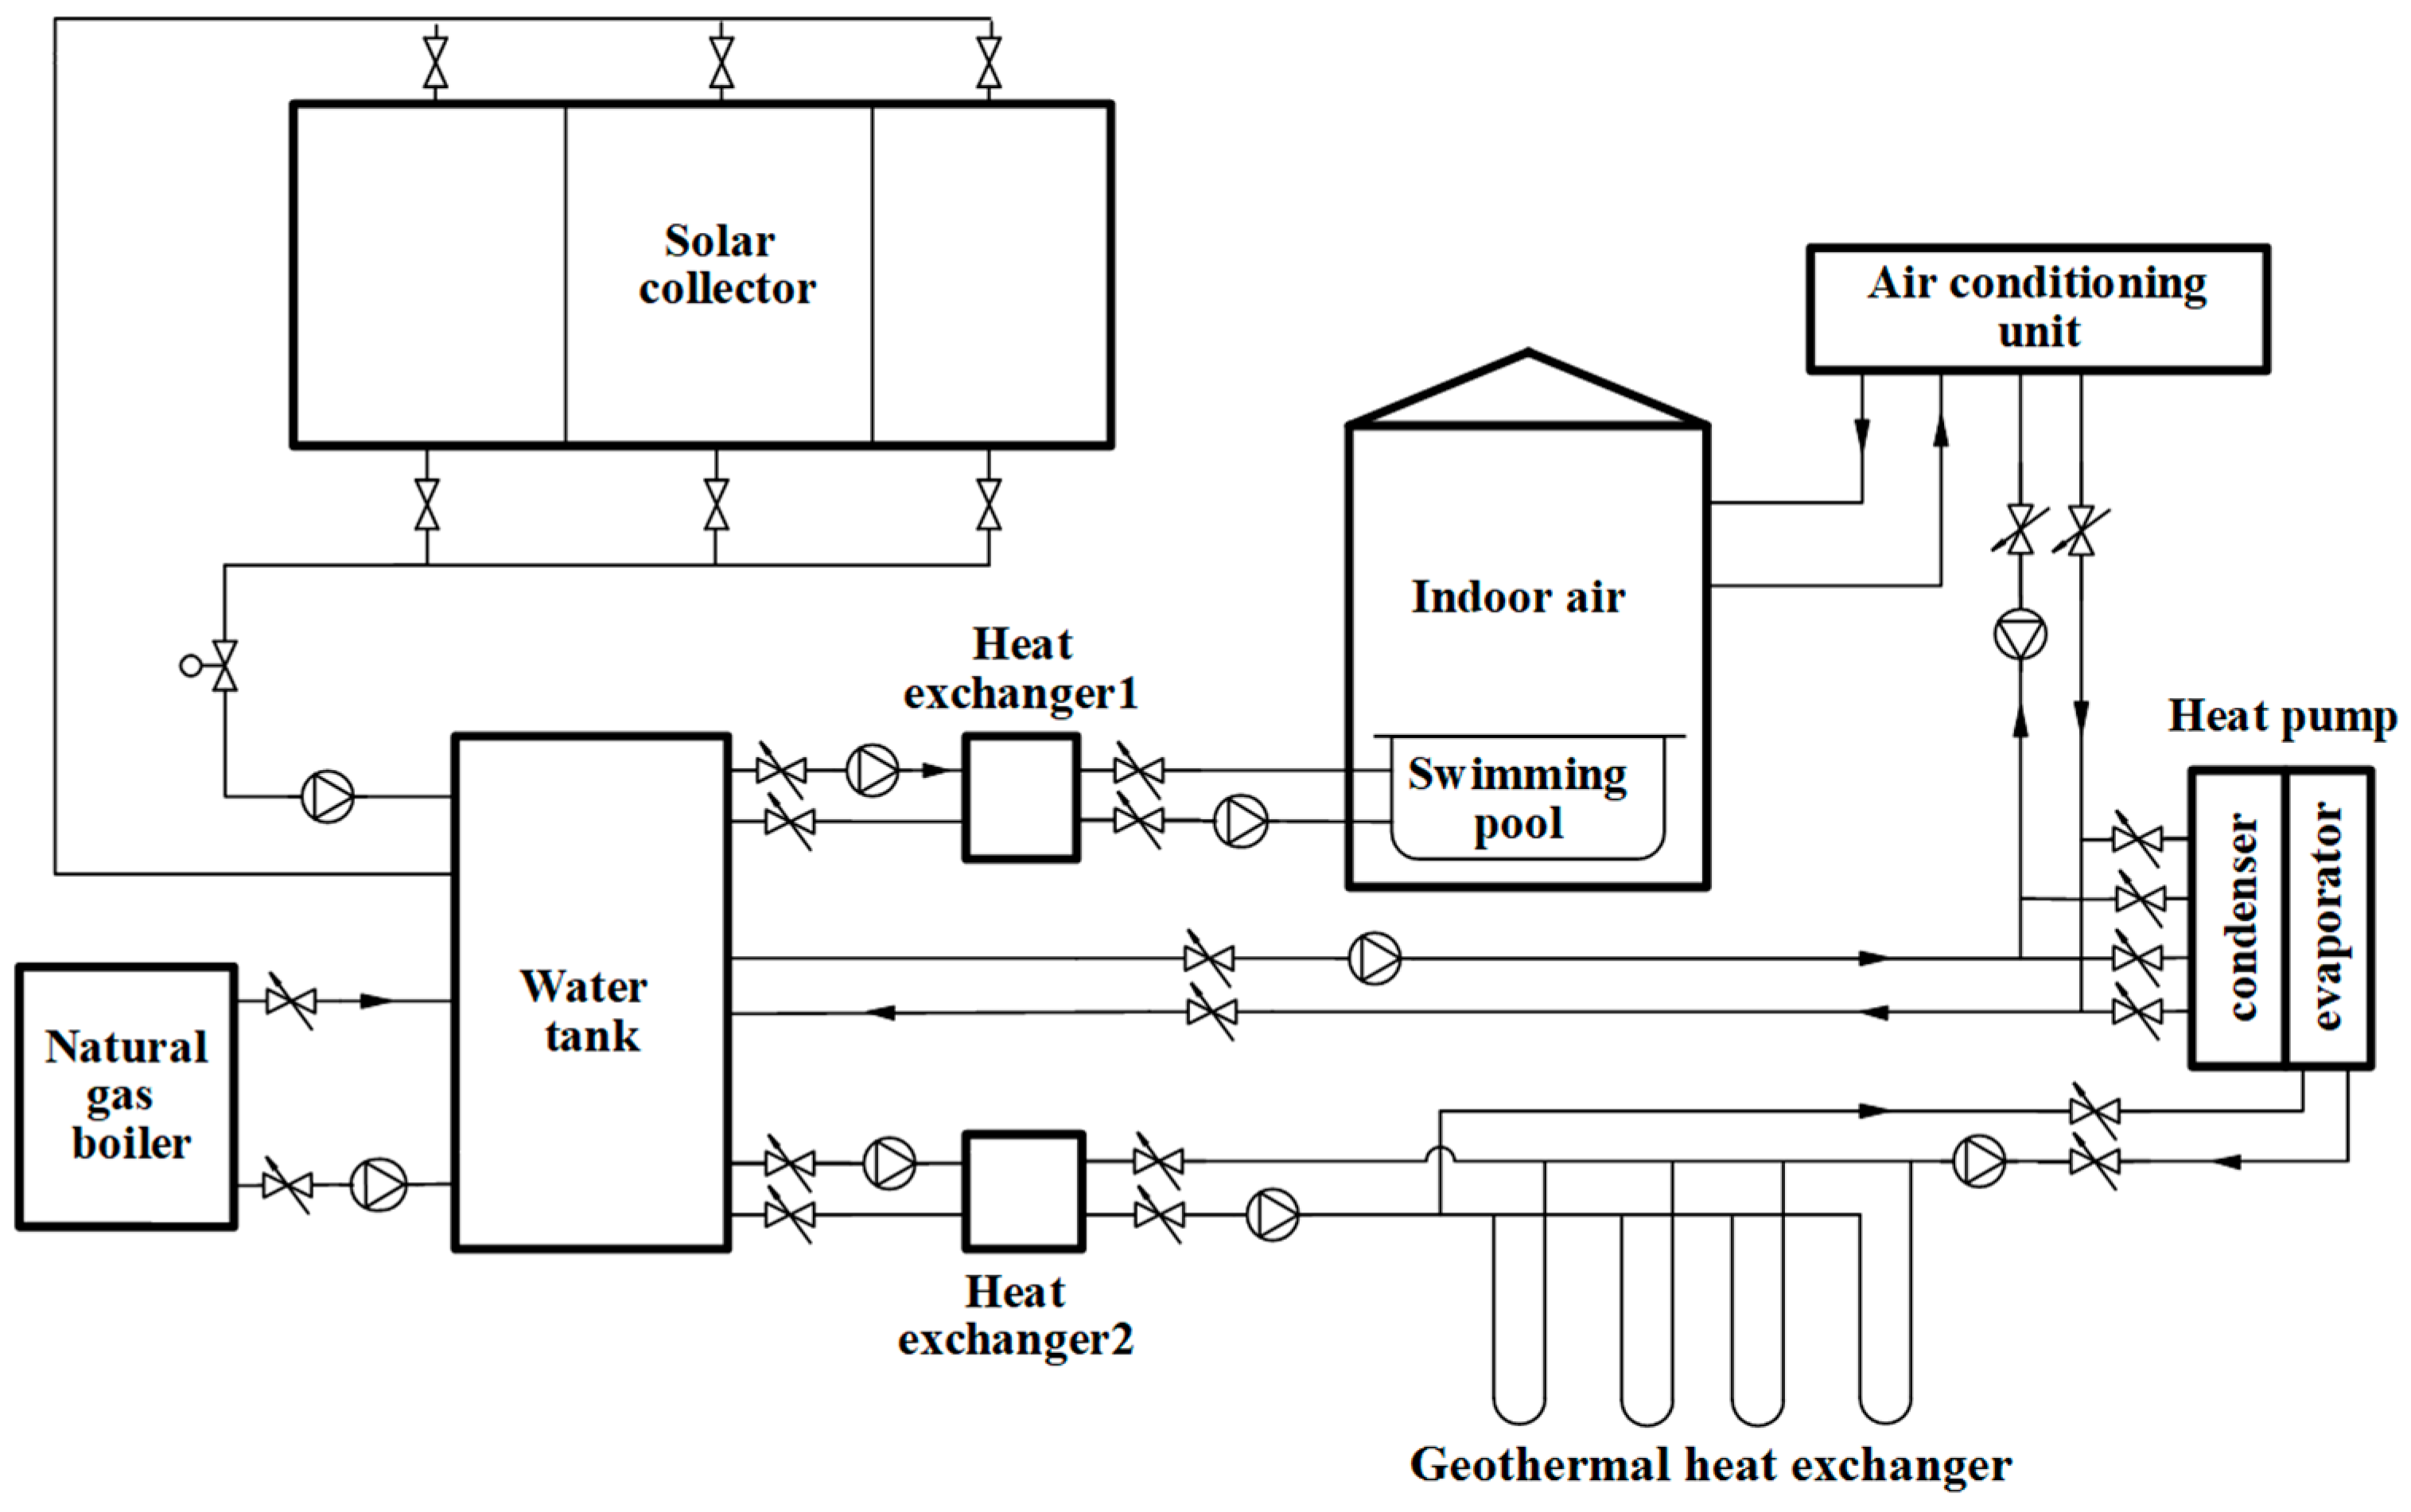
A simplified layout of the system is shown in Figure 3. The DES in this study mainly consists of a solar collecting system, geothermal heat pump system, heat storage water tank, heat exchangers, swimming pool, air conditioning unit, and water circulation system.
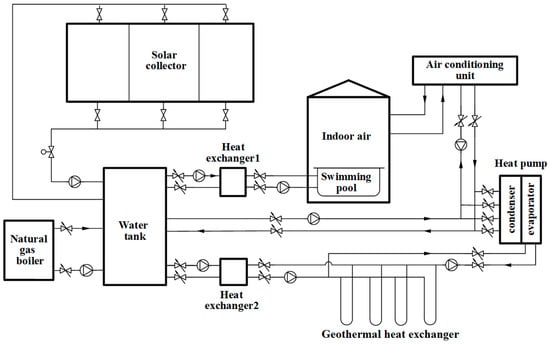
Figure 3.
Simplified layout of the distributed energy system.
The solar energy is the preferred energy source of the system because it uses only a small amount of electricity to power the circulation pump. The solar collector covers a total area of 264 m2. A reversible heat pump was utilized for district heating and cooling and a single stage heat pump was used. The water tank has a capacity of 22 m3 and can supply hot water to the swimming pool and air conditioning unit. Two plate heat exchangers were used in the proposed system. Heat exchanger 1 was installed between the water tank and the swimming pool, whereas heat exchanger 2 was placed between the water tank and the geothermal heat exchanger. In this system, the geothermal heat exchanger was designed to exchange heat with the ground soil. A total of 22 boreholes with a depth of 100 m were placed evenly around the swimming pool.
The proposed system generates cooling during the summer and provides heating energy during the winter. During the entire year, this system produces hot water for the swimming pool. The renewable energy is lacking for the building consumption, and natural gas is the auxiliary source. The hot water in the water tank will heat the ground soil to balance the soil temperature when solar energy heating is in surplus.
2.2. System Modelling and Simulation
The DES was simulated in TRNSYS. For each component, TRNSYS can calculate energy and mass balance, which are the bases for the analysis of the energetic, economic, and environmental performance of the system [31]. TRNSYS is applied to the modelling and analysis of DES and the building [25,28,32,33,34].
Figure 4 shows the simulation diagram of DES. Its main components are solar collector, heat pump, heat storage water tank, heat exchanger, and geothermal heat exchanger. The natural gas boiler is assumed to be a built-in water tank of electric heating. Additional components, such as pipes, sensors, controllers and schedulers, are also applied to the simulation model. Other mandatory components, such as weather database and printers, are complemented. The components are taken from the TRNSYS libraries, as reported in Table 1. In the current investigation, as the performance evaluation of DESs is based on particular application of DES related to swimming pool heating and cooling demand, operation parameters of DES should be collected. The heating and cooling load of DES is simulated in TRNSYS. The solar collector is designed according to the handbook of the civil building solar water heating system engineering in Chinese [35]. Based on the heat transfer theory, the heat balance equation and the heat transfer equation are employed to design the parameters of heat exchangers and heat pump [36]. The parameters of the major components are listed in Appendix A.
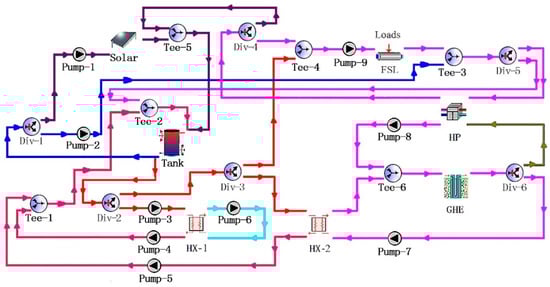
Figure 4.
Simulation diagram of the DES.

Table 1.
Standard TRNSYS component names and types.
2.3. Control Strategy
Four control strategies were proposed, namely, cases 1, 2, 3, and 4. The control strategies are explored to optimize the operation of DES. On the basis of the indoor heating and cooling load and solar radiation intensity, the running time of DES was divided into three periods (summer, winter, and transition seasons) during a year. Winter (heating season) was divided into three stages, namely, early, middle, and end heating season. The running stages are listed in Table 2.
Table 2.
Running stages.
Four control strategies were proposed, and the performance results were compared and analyzed.
- Case 1
- Heating load of the water tank is mainly supplied by the solar energy. The inadequate part is replenished by the gas boiler. The district heating and cooling demand is entirely supplied by the geothermal heat pump.
- Case 2
- On the basis of case 1, the geothermal heat pump supplies heat to the water tank in the transition season. The hot water in the water tank heats the ground soil in the summer and transition seasons.
- Case 3
- Heating load of the water tank is mainly supplied by the solar energy, and the inadequate part is replenished by the gas boiler. District heating is directly supplied by the solar energy in the early and end heating seasons. The geothermal heat pump supplies heat in the middle heating season. District cooling is supplied by the heat pump. The hot water in the water tank heats the ground soil in the summer and transition seasons.
- Case 4
- Heating load of the water tank is mainly supplied by the combination of solar energy and geothermal heat pump. The inadequate part is replenished by the gas boiler. In the transition season, the geothermal heat pump supplies heat to the water tank. District heating is supported by the solar energy in the heating season and supplemented by the geothermal energy in the middle heating season. District cooling is supplied by the heat pump. The hot water in the water tank heats the ground soil in the summer and transition seasons.
2.4. Evaluation Indicator
Energy, environmental, and economic indicators were investigated to assess the performance of DES. The conventional energy system assumes that the thermal energy is supplied by the natural gas boiler and cooling is supported by an electric refrigeration unit. According to the calculation of the substitution in conventional energy introduced in the Chinese evaluation standard for the application of renewable energy in buildings, the energy efficiency ratio of the electric refrigeration unit is 3.0 and the boiler system efficiency is 0.9 [37].
The electricity consumption and natural gas consumption are the energy consumption indicators. To quantify the benefits of energy saving achieved by DES, PES is widely used. PES is defined as the energy saving achieved by DES in comparison to the PEC of conventional energy system, which can be written as [17]:
where is the PEC of DES; is the PEC of a conventional energy system.
The environmental indicators include carbon dioxide (CO2), sulphur dioxide (SO2), and dust emission reduction. The amount of emission i () can be determined based on the emission conversion factor of fuel as follows [17]:
where and are the emission conversion factors of natural gas and electricity from grid of emission i, respectively.
Referring to the definition of PES, the amount of emission reduction i () presents the environment benefits achieved by DES over a conventional energy system. can be calculated as follows [17]:
where is the emission i of DES; is the emission i of a conventional energy system.
The economic evaluation is focused on the operation cost of the system. On the basis of the market price of the project location, the price of electricity and natural gas is assumed to be 0.888 CNY/kWh and 2.7 CNY/Nm3, respectively. The operation cost can be calculated as follows [17]:
where (CNY/y) and denote the consumption and price of energy j, respectively.
The assessment indicators on solar energy utilization include the solar fraction and solar collection efficiency. According to Evaluation Standard’s definition [37], solar fraction ratio is the percentage of solar heat that accounts for total energy consumption in the system. Solar fraction is obtained as follows [37,38]:
where f is the solar fraction and is the load of the solar collector system.
The thermal effectiveness performance of the solar collector is commonly described in terms of the Hottel–Whillier–Bliss equation. Owing to the difficulty in determining the plate temperature of the solar collector, the thermal effectiveness performance of the solar collector is denoted by the average temperature at the inlet and outlet temperatures of the water as follows [39]:
where is the solar collecting efficiency, (kW) is the useful energy provided by the solar collector, (kW) is the amount of heat incident on the solar collector, (kW) is the heat lost to the surroundings from the solar collector, (m2) is the collector area, (W/m2) is the global radiation incident on the solar collector, is the effective transmittance–absorptance product, is the thermal loss coefficient, (°C) is the solar collector plate temperature, (°C) is the ambient temperature, (°C) denote the inlet temperature of the water and FR is the heat removal factor.
In addition, the soil temperature significantly affects the operation of the geothermal heat pump. Soil annual thermal imbalance is used to describe the changes in the soil temperature. The rate of soil annual thermal imbalance is defined as the heat difference between the extracted and rejected into the soil and the ratio of the heat extracted from the soil as follows:
where Φ is the soil annual thermal imbalance ratio, is the heat extracted from the soil and Qin is the heat rejected into the soil.
3. Results and Discussion
This study aimed to propose control strategies in operating DESs efficiently. Energy, economic, and environmental indicators, including electricity consumption, natural gas consumption, PES, energy costs, and emission reduction, were utilized to assess the performance. In addition, a technical analysis was conducted. The solar fraction and soil annual heat imbalance rate were considered.
3.1. Energy Comparison
3.1.1. Electricity Consumption Comparison
The electricity consumption of different cases is reported in Figure 5. The annual electricity consumption of cases 1, 2, 3, and 4 and the conventional energy system are 1.74, 19.0, 13.8, 16.9, and 7.0 × 10⁴ kWh, respectively. The annual electricity consumption of DES is higher than that of the conventional energy system due to the added components for renewable energy utilization.
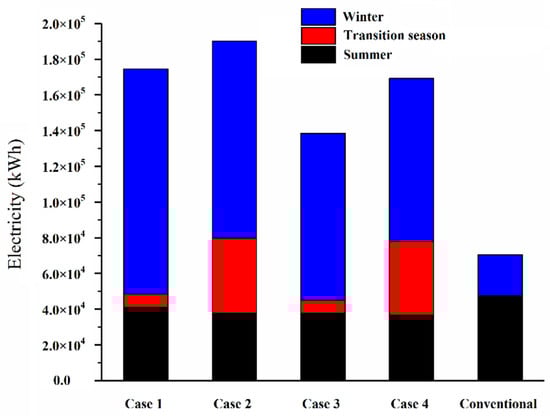
Figure 5.
Electricity consumption comparison under various cases.
In the conventional energy system, the highest electricity consumption occurs in summer as a result of the electric refrigeration that reaches up to 2.29 × 10⁴ kWh. Given that the heating demand is supplied by the gas boiler during winter, the electricity consumption decreases in this season. In DES, the major electricity consumption of different cases occurs during winter. The electricity consumption of cases 1 and 3 in winter is 1.26 × 10⁵ kWh and 9.34 × 10⁴ kWh, which accounts for 72.26% and 67.45% of the annual electricity consumption, respectively. During summer, the electricity consumption of different cases remains a steady value. However, during the transition season, the electricity consumption in cases 2 and 4 is higher than that in cases 1 and 3 due to the water tank being heated by the heat pump in cases 2 and 4.
3.1.2. Comparison of Natural Gas Consumption
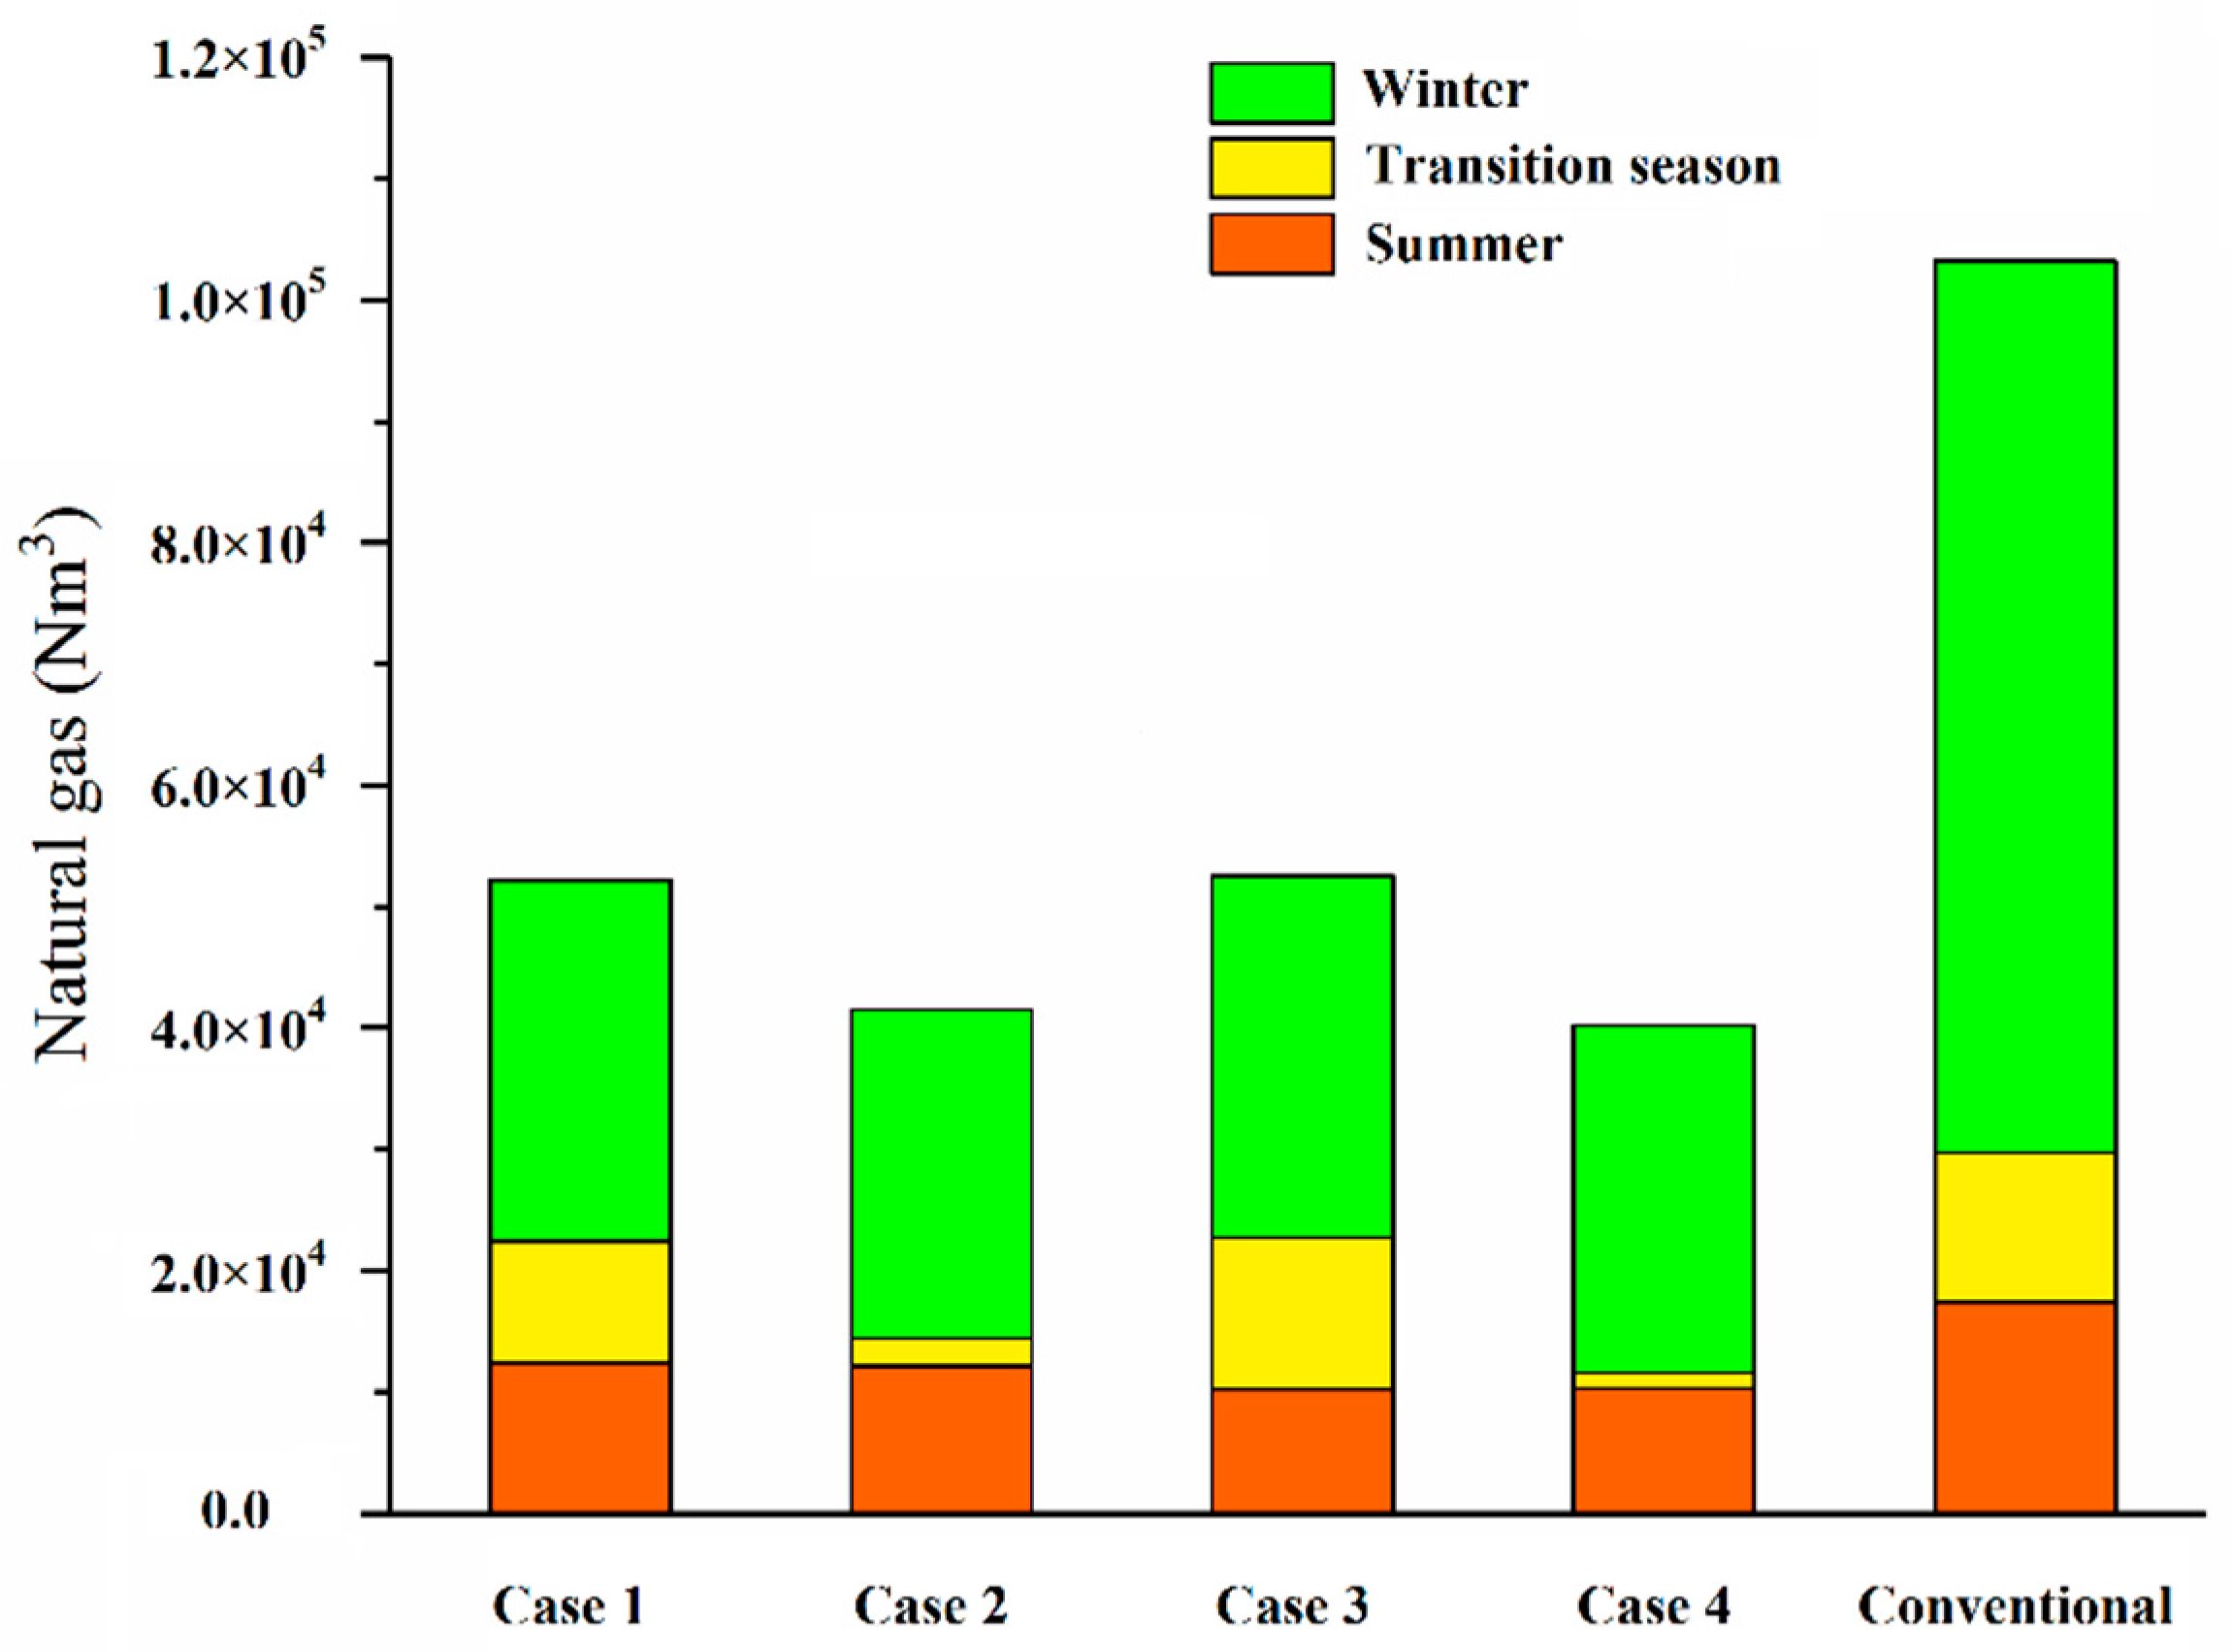
Figure 6 shows the natural gas consumption. The highest and lowest values of natural gas consumption are obtained by the conventional energy system (1.03 × 10⁵ Nm3) and case 4 (4.02 × 10⁴ Nm3), respectively. The annual consumption of natural gas in DES is evidently lower than that of the conventional energy system because the heating load is supplied only by the gas boiler and the renewable energy in the conventional energy system, whereas the heating load is mainly supplied by the renewable energy in the DES. The results of the energy consumption comparisons show that the annual electricity consumption of DES is higher than that of the conventional energy system, while the natural gas consumption of DES is lower than that of the conventional energy system.

Figure 6.
Comparison of natural gas consumption under various cases.
In the conventional energy system, the highest natural gas consumption occurs during winter (7.35 × 10⁴ Nm3) and accounts for 71.20% of the annual consumption of natural gas. In DES, the major seasonal consumption of natural gas under different cases occurs in winter. The natural gas consumption of different cases tends to be in the steady state during summer. In the transition season, the natural gas consumption of cases 1 and 3 is close to that of the conventional energy system. The natural gas consumption of cases 2 and 4 is lower than that of other cases. The heat pump is the applied thermal energy to the water tank in cases 2 and 4. The natural gas consumption decreases as the electricity consumption increases due to the heat applied to the water tank provided by the heat pump in the transition season.
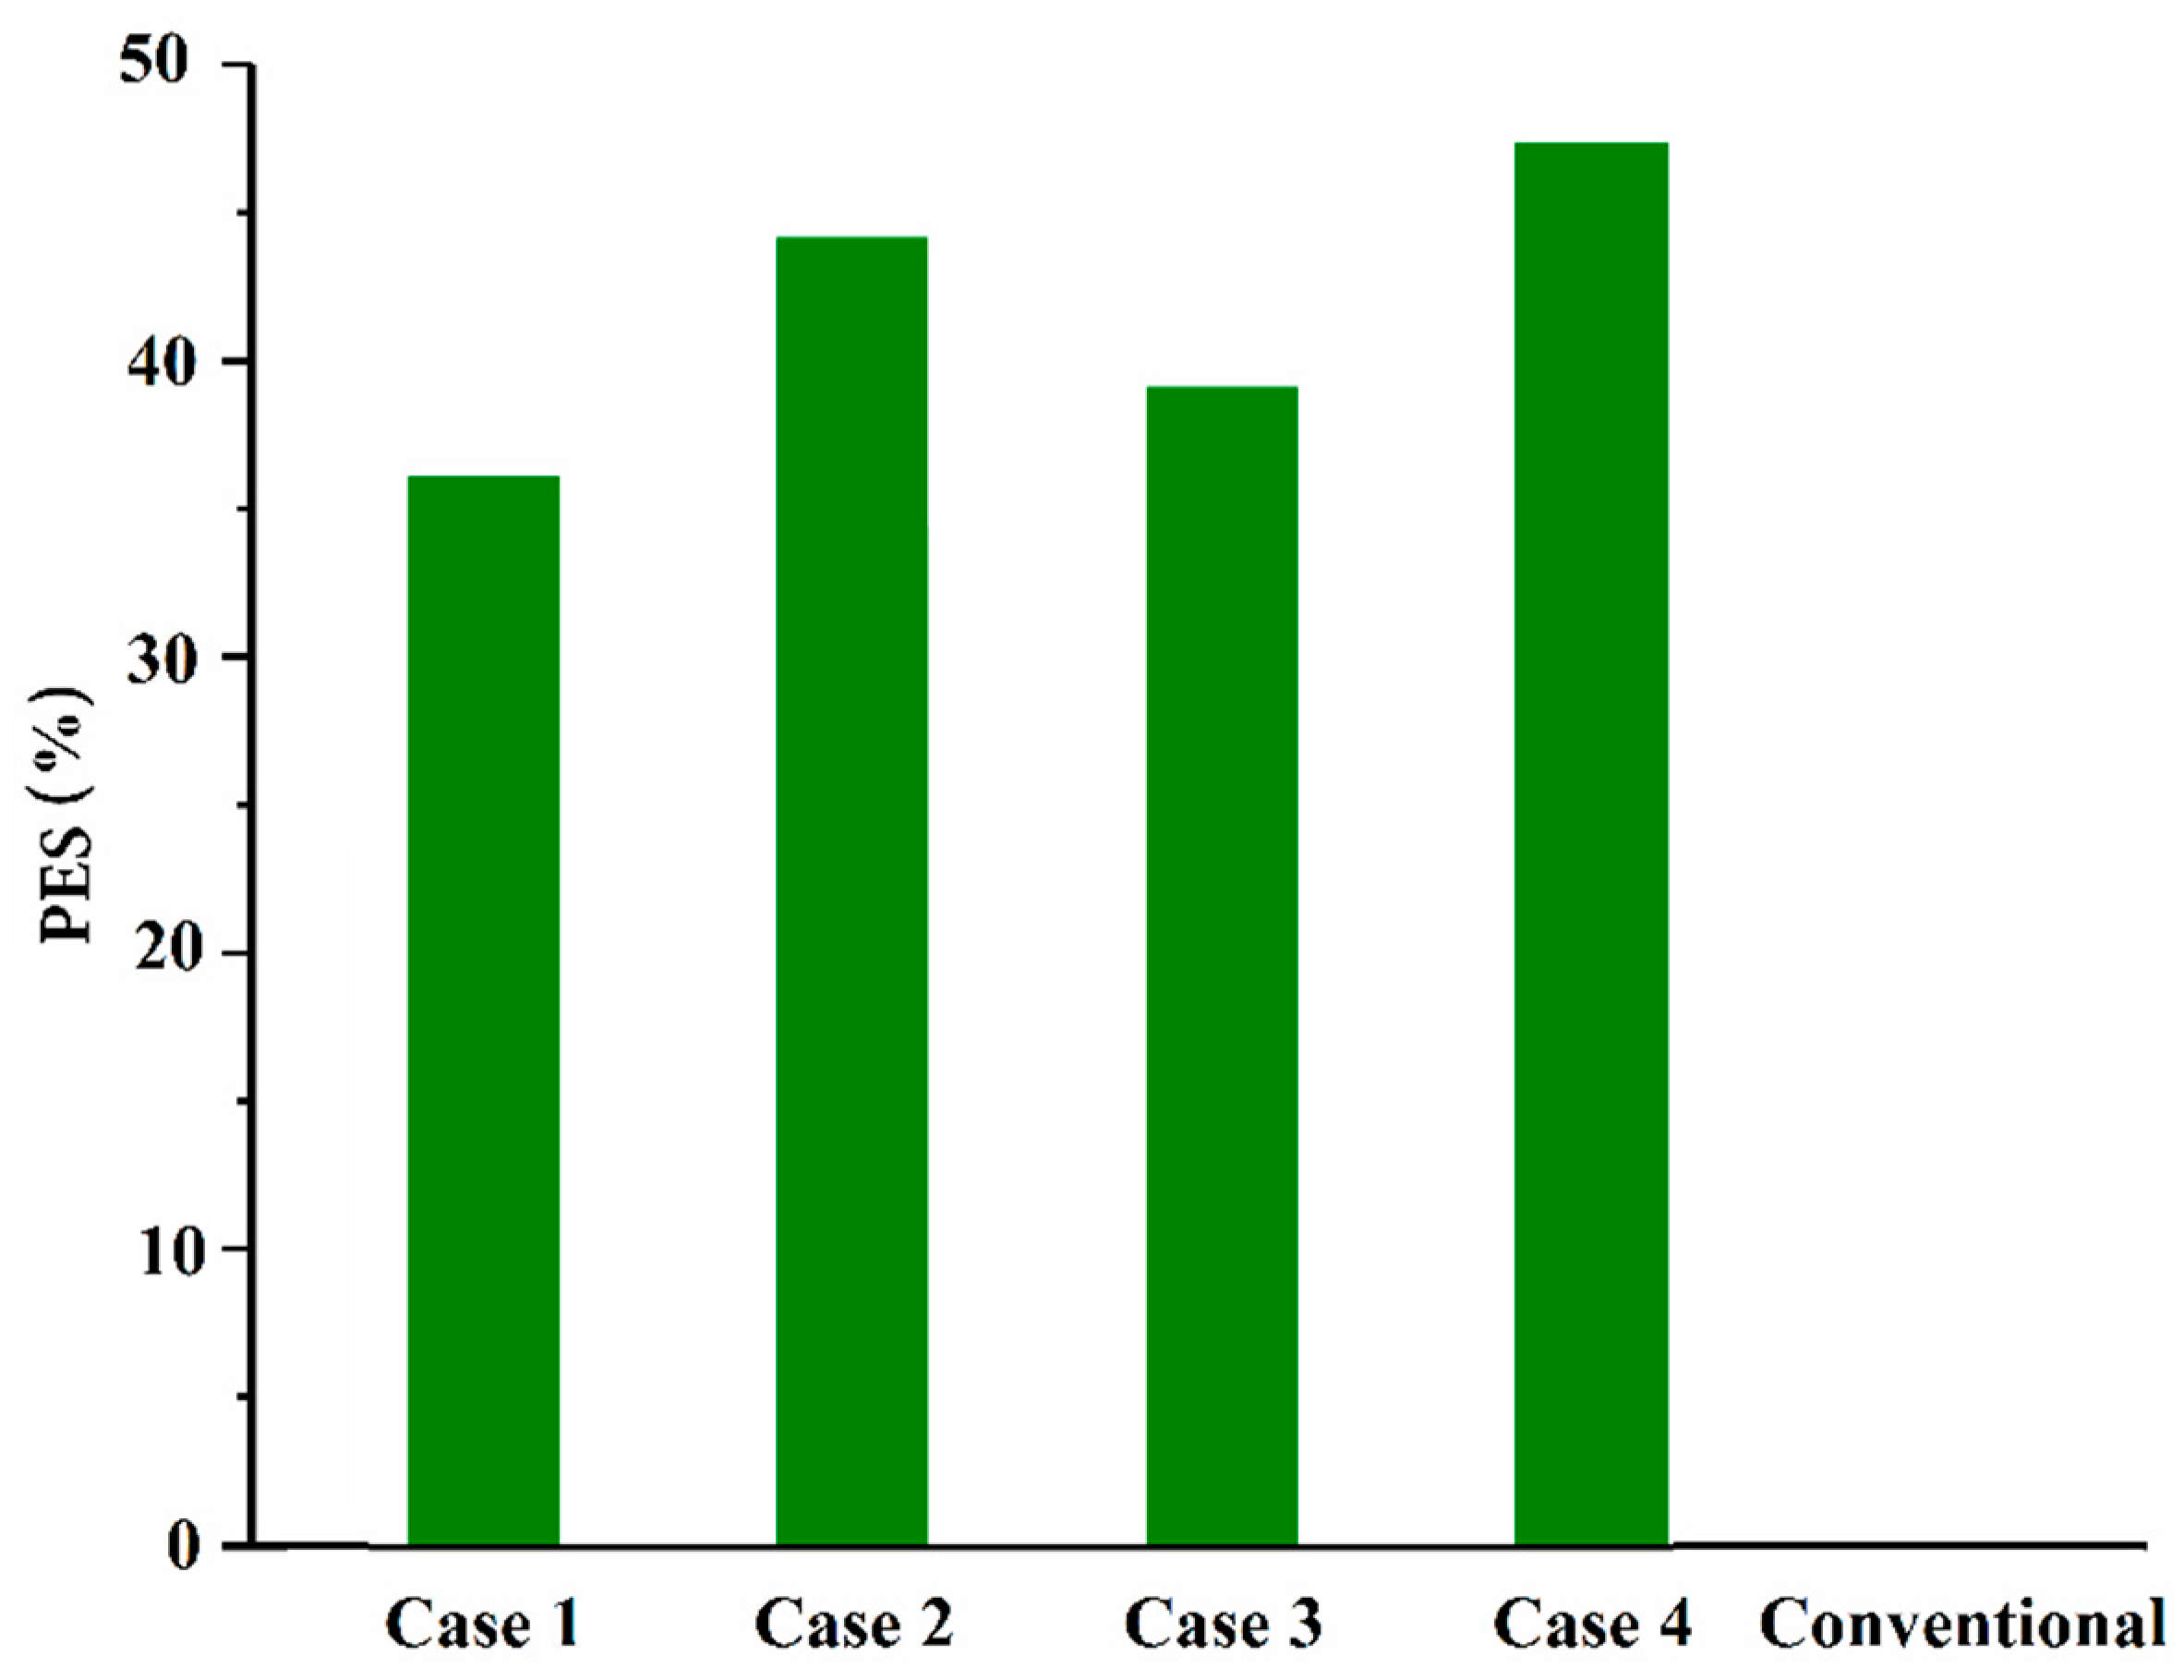
3.1.3. Comparison of Primary Energy Saving (PES)
PES is shown in Figure 7. Compared with the conventional energy system PES values of cases 1 to 4 are 36.70%, 44.92%, 39.72%, and 48.04%. The result reveals that DES obtains better energetic performance than the conventional energy system due to the use of the renewable energy. PES is sensitive to the control strategy. The highest and lowest PES values are obtained by cases 4 (48.04%) and 1 (36.70%), respectively. Therefore, the control strategy of case 4 is the best amongst the cases. The aforementioned findings suggest that the use of renewable energy and control strategies is crucial in the energy performance of DES.
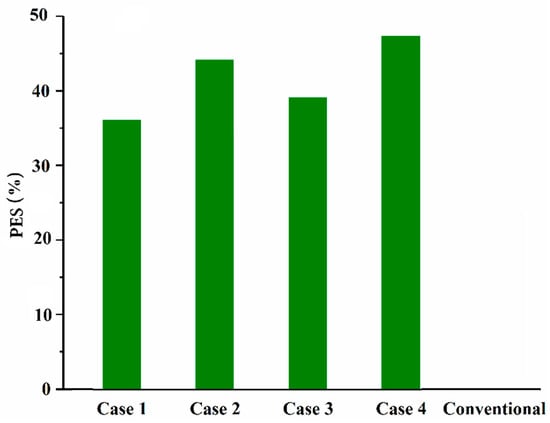
Figure 7.
Comparison of PES under various cases.
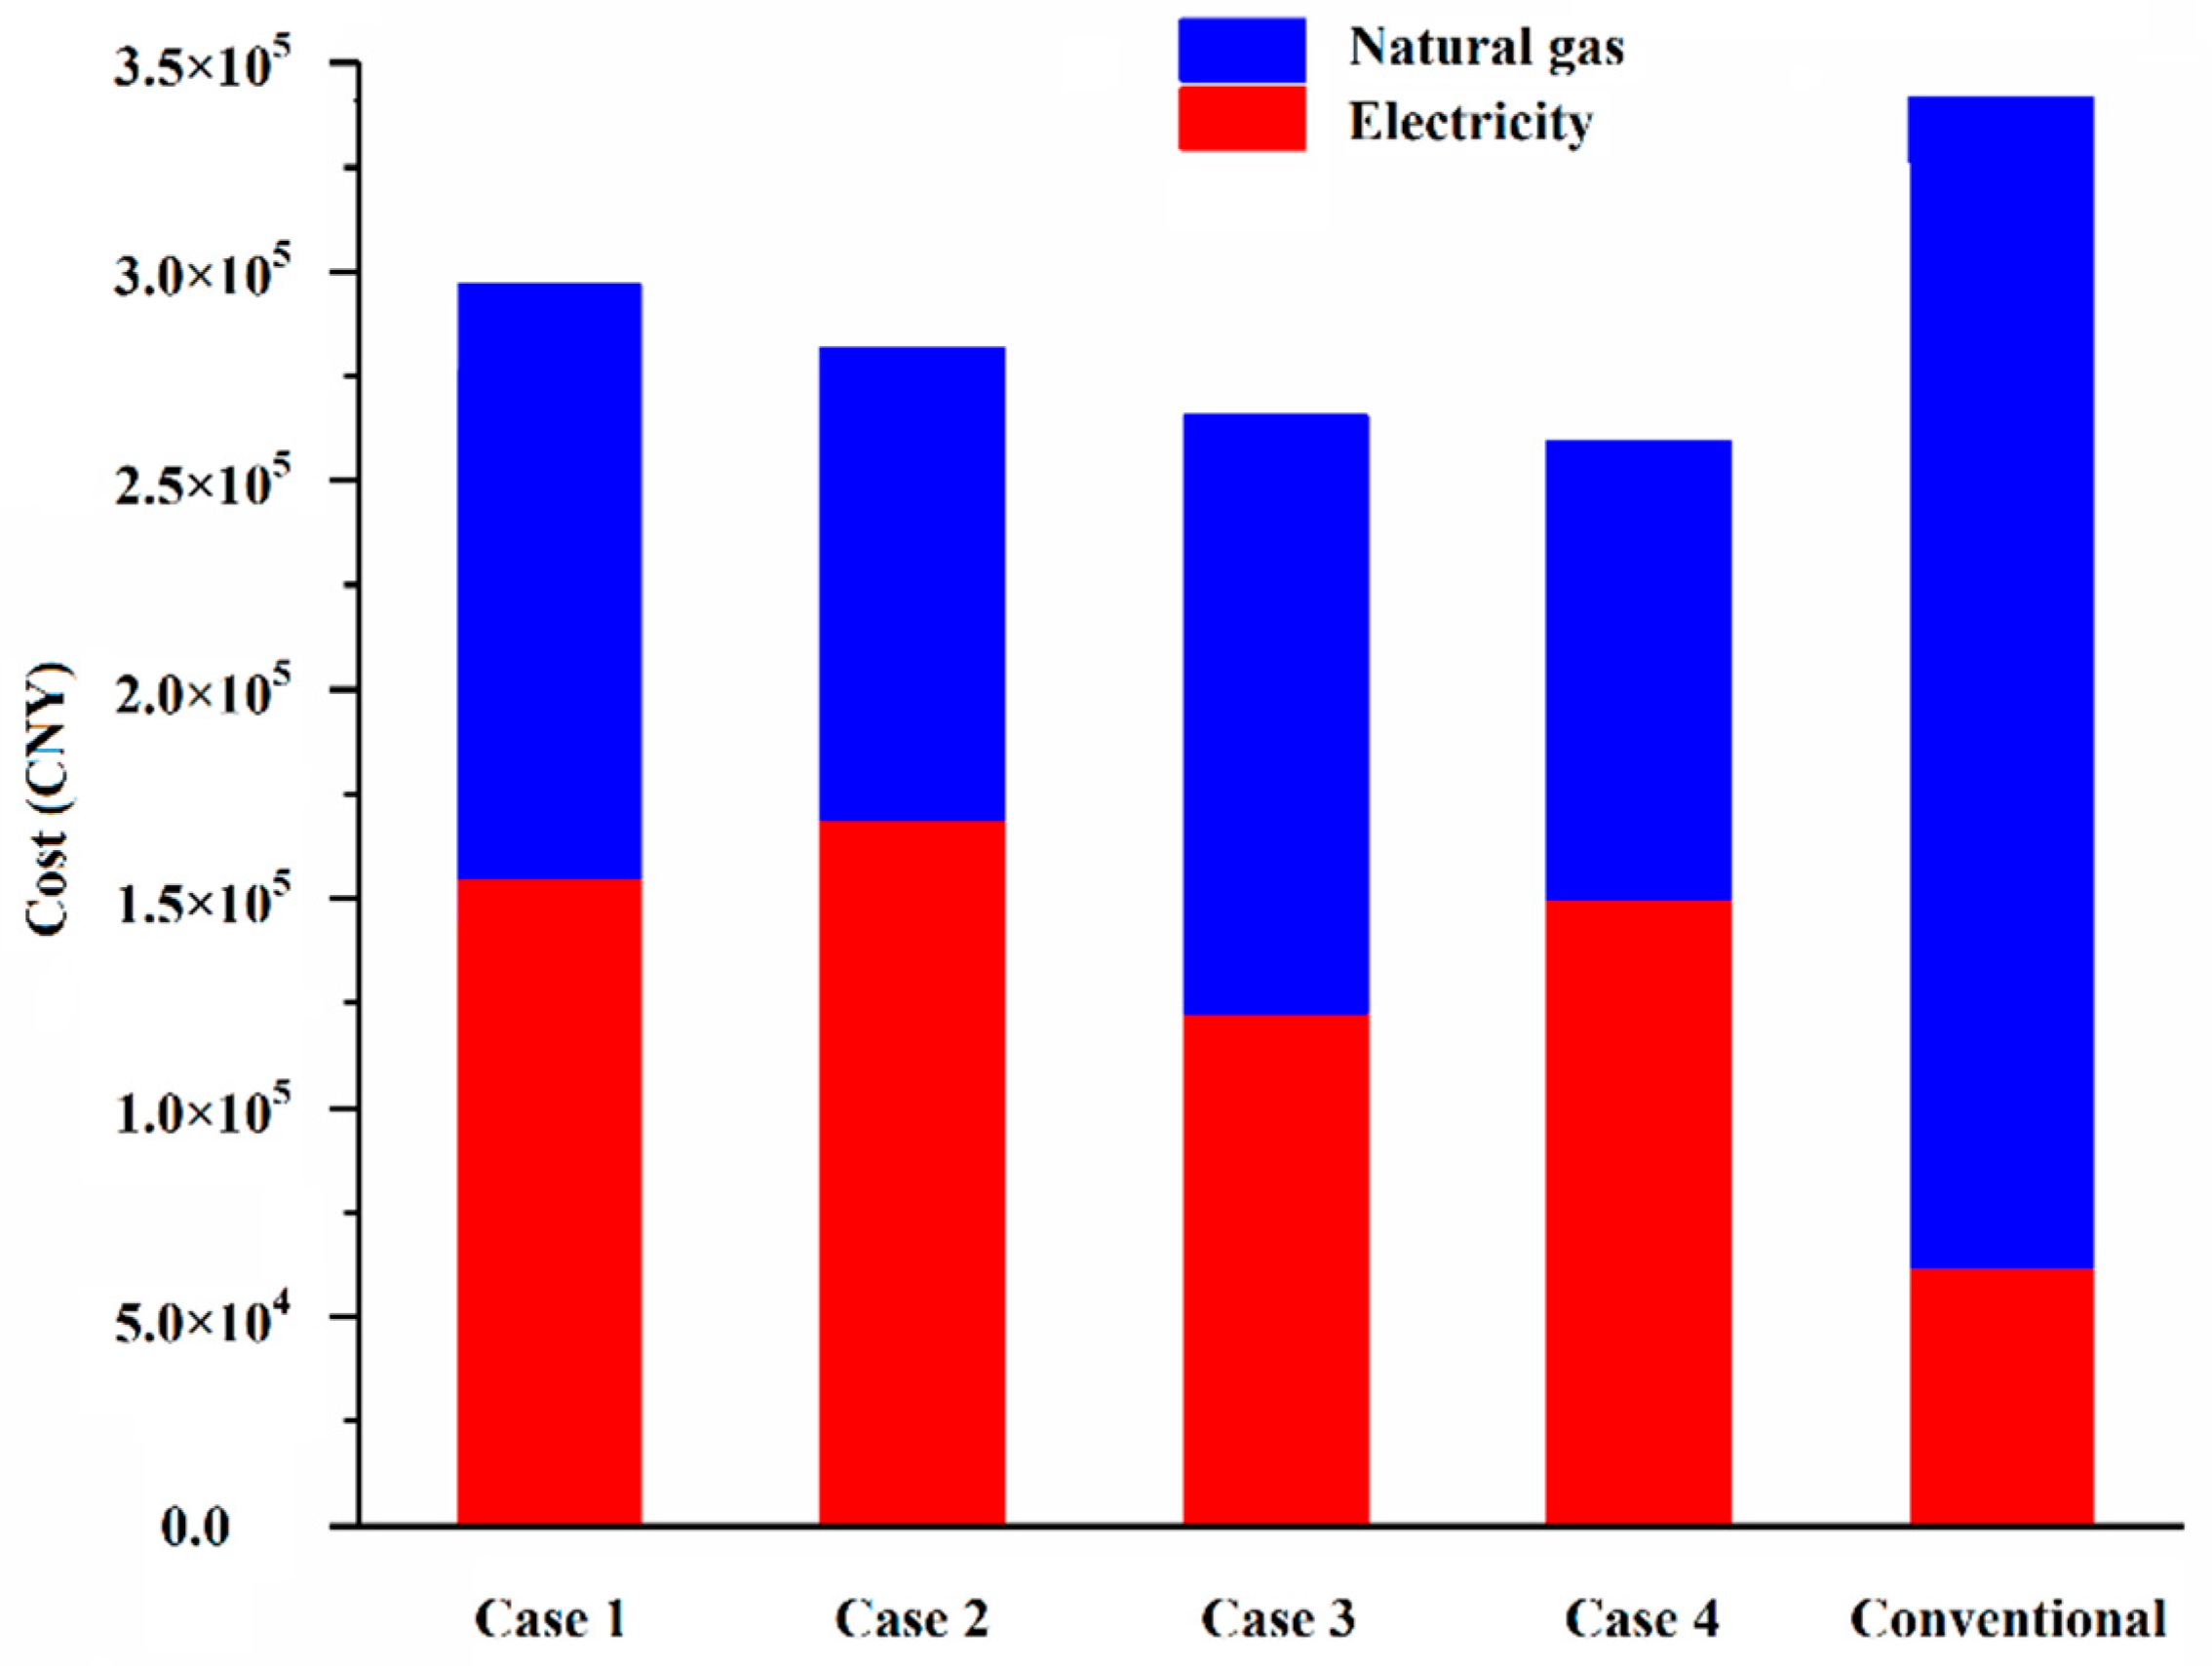
3.2. Operation Cost Comparison
Operation cost performance is an important indicator in a system. The costs (i.e., natural gas and electricity costs) of the four cases are compared in this section and shown in Figure 8.

Figure 8.
Comparison of operation cost under various cases.
The operation cost of cases 1 to 4 are 2.96, 2.81, 2.65, and 2.59 × 10⁵ CNY. The portions of electricity cost of cases 1, 2, 3, and 4 are 52.4%, 60.1%, 46.4%, and 58.0%, respectively. The conventional energy system acquires the highest cost at 3.41 × 10⁵ CNY, of which the natural gas costs accounting for 81.7%. This result shows that the use of renewable energy dominates to decrease the cost. Therefore, the control strategies affect the cost. The cost decreases from cases 1 to 4 in DES, and the cost of case 4 is reduced to nearly a quarter compared with that of case 1. The electricity cost in the conventional energy system is the lowest amongst the cases. However, the natural gas cost shows an opposite trend.
3.3. Comparison of Emission Reduction
Emission reduction values of the four cases are discussed in this section, including reduction of CO2, SO2, and dust. The emission reduction values of the four control strategies are calculated on the basis of Equation (3). Figure 9 shows the emission reduction.
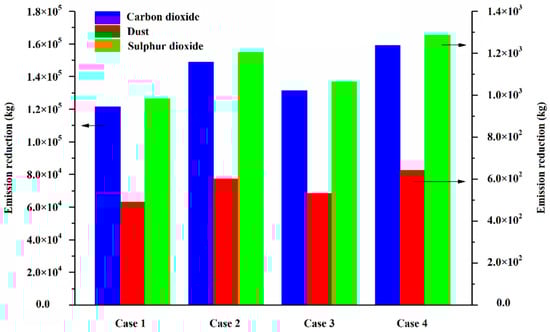
Figure 9.
Comparison of emission reduction under various cases.
The CO2 reduction values of cases 1 to 4 are 1.21, 1.49, 1.31, and 1.59 × 10⁵ kg. The SO2 reduction values of cases 1 to 4 are 0.98, 1.20, 1.06, and 1.297 × 10³ kg. The dust reduction values of cases 1 to 4 are 4.91, 6.01, 5.32, and 6.43 × 10³ kg. The findings show that case 4 obtains the highest emission reduction value and results in the best environmental benefits, whereas case 1 acquires the lowest and worst results. The CO2 reduction of case 4 is approximately 1.3 times as that of case 1. The combination of solar and geothermal energies supplying heat to the water tank positively affects emission reduction.
3.4. Solar Fraction Comparison
Figure 10 displays the solar collection efficiency and solar fraction. The total annual solar collection efficiency values of cases 1 to 4 are 0.34, 0.40, 0.41, and 0.44. The total annual solar fraction of cases 1, 2, 3, and 4 are 0.17, 0.24, 0.23, and 0.27, respectively. A large capacity of the water tank and a low mean temperature of the fluid entering the collector can be achieved due to the operation of seasonal thermal storage for the ground soil. The solar collection efficiency is improved.
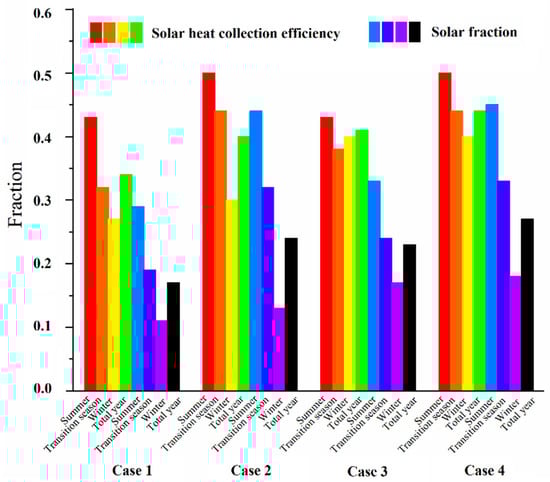
Figure 10.
Comparison of solar heat collection efficiency and solar fraction under various cases.
The solar collection efficiency and the solar fraction vary with the changing of seasons. During summer, the solar collection efficiency values of cases 1, 2, 3, and 4 are 0.43, 0.50, 0.43, and 0.50, respectively. During winter, the solar collection efficiency values of cases 1 to 4 are 0.27, 0.30, 0.40, and 0.40. The solar collection efficiency during summer is significantly higher than that during winter and transition seasons. Therefore, sufficient solar irradiation increases the solar utilization factor.
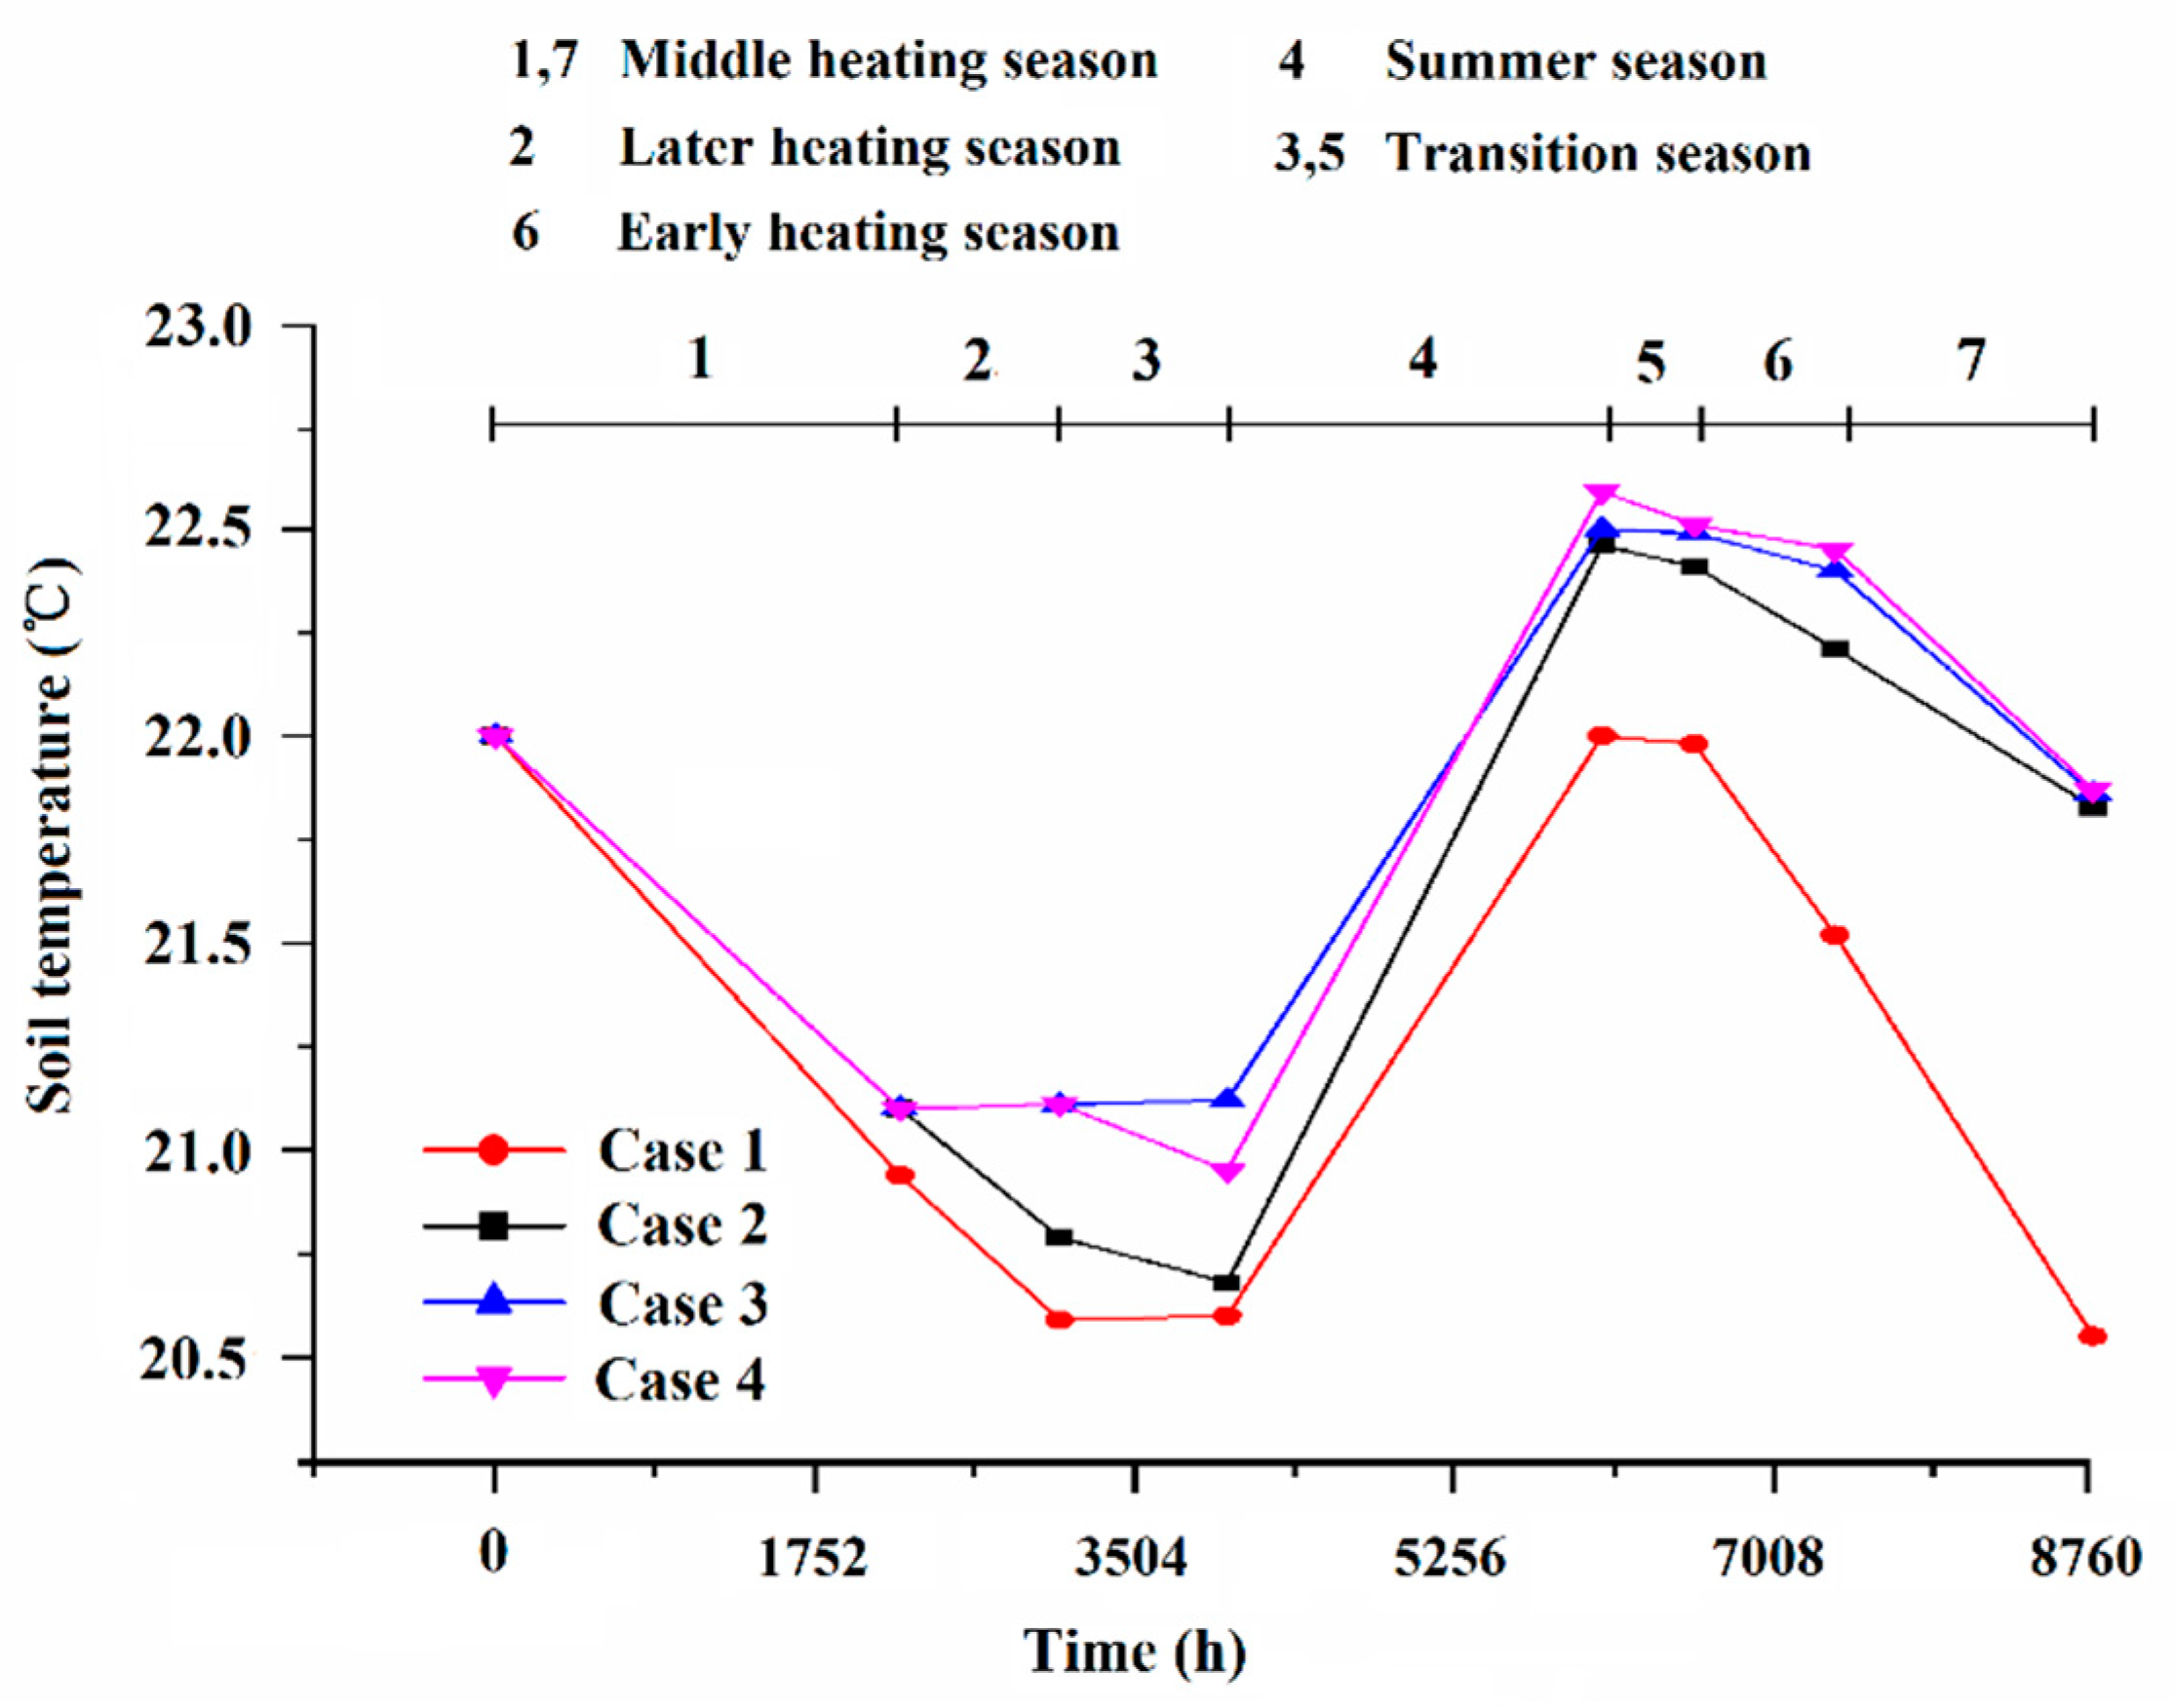
3.5. Soil Annual Heat Imbalance Rate Comparison
Figure 11 shows the soil temperature changes in 1 and 20 years. This figure presents that the highest average soil temperature occurs at the end of summer. The temperature tends to increase gradually from summer to winter under all cases. The imbalance rates of soil annual heat of cases 1, 2, 3, and 4 are 45.7%, 18.8%, 17.2%, and 17.0%, respectively. After DES runs for 1 year, the soil temperatures decrease by 1.45, 0.17, 0.14, and 0.13 °C under the four cases.
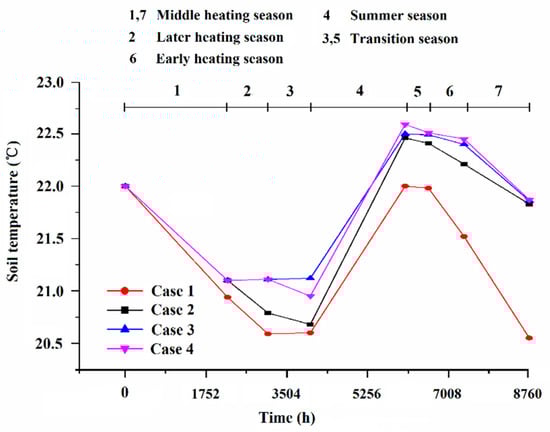
Figure 11.
Comparison of soil annual heat imbalance under various cases in a year.
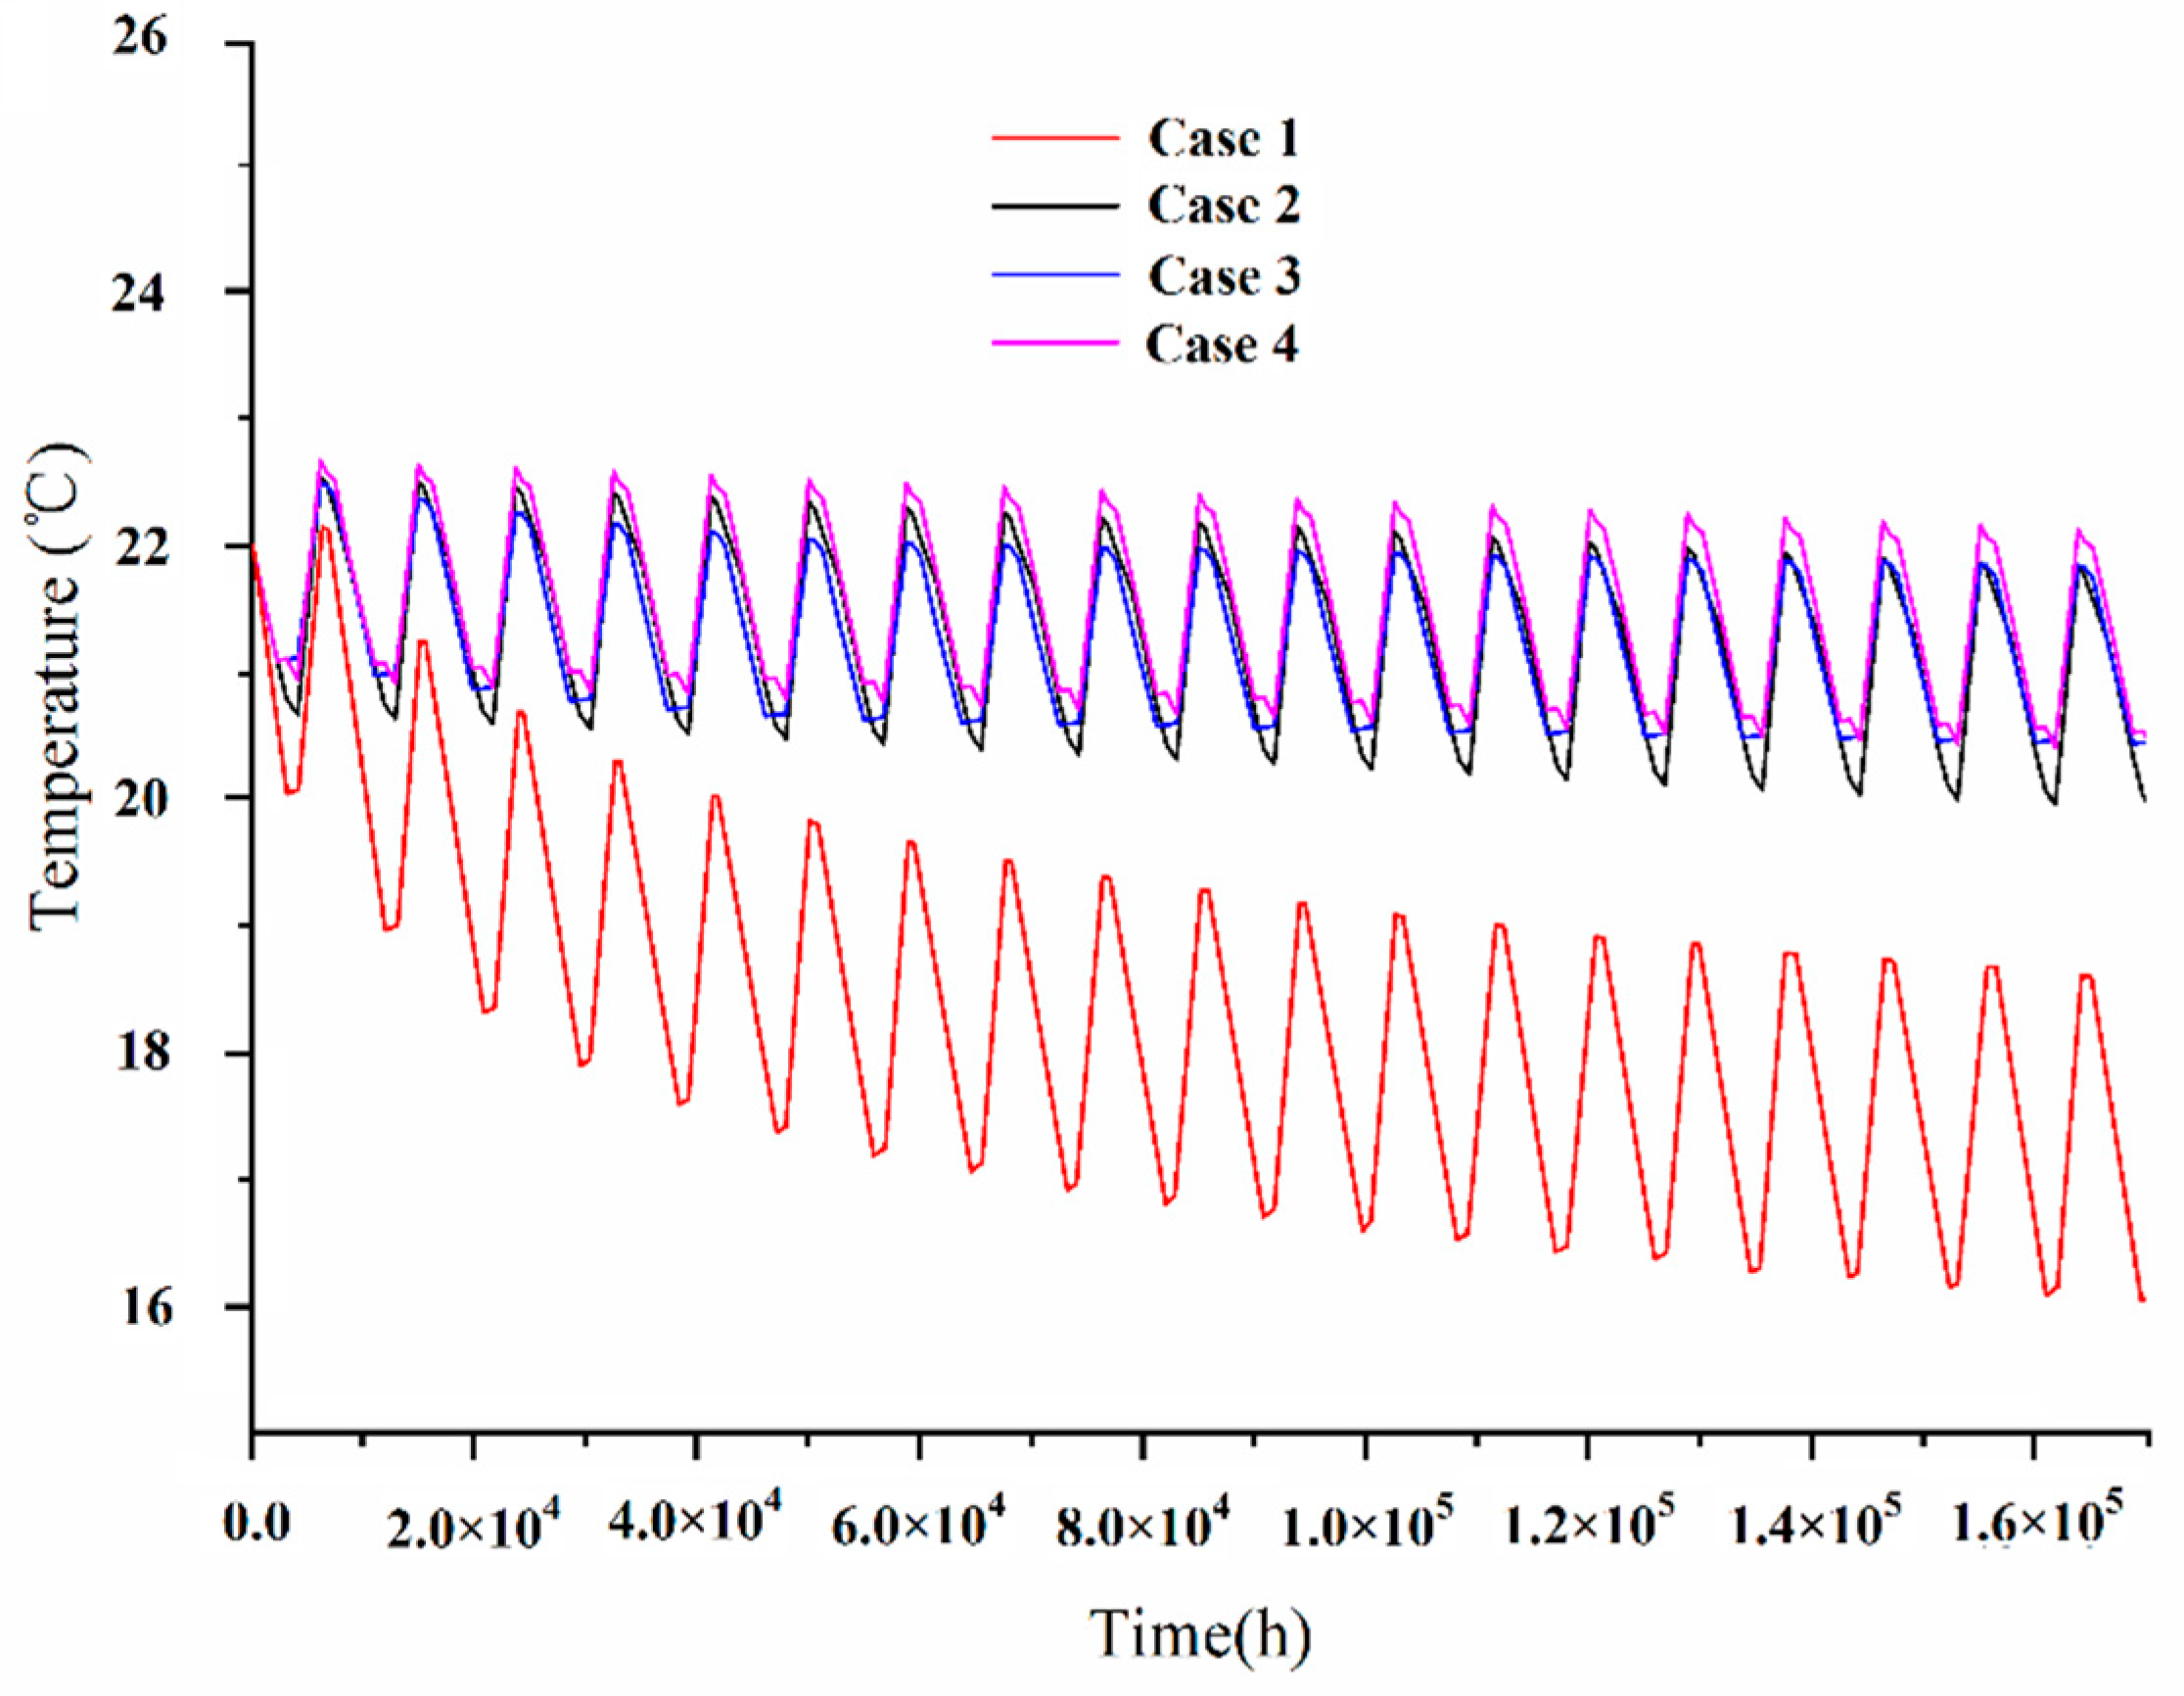
Figure 12 shows that the soil temperature varies periodically in 20 years. After the DES runs for 20 years, the soil temperatures of cases 1 to 4 decrease by 4.75, 0.80, 0.69, and 0.60 °C. The soil temperature decreases the most over time under case 1 compared with those of other cases. Given that cases 2, 3, and 4 have the operation of seasonal thermal storage for the ground soil, the trends of these cases are similar. Case 4 exhibits the best performance amongst all the cases.

Figure 12.
Comparison of soil annual heat imbalance under various cases in 20 years.
4. Conclusions and Further Research
4.1. Conclusions
In this paper, the performance of DES with a solar collecting system coupled with a geothermal heat pump system applied to an existing indoor swimming pool located in Changsha, Southeast China, was presented. System simulation models in order to calculate the performance of DES was developed. The performance of DES was evaluated through the dynamic simulation TRNSYS software. Even if the particular application of DES is related to swimming pool heating and cooling demand, the developed system simulation models is applicable to any building and location.
In order to analyze the performance of DES and provide guidance for better operation strategies, the current investigation considered real conditions of DES applied to a swimming pool in a hot summer and cold winter climate zone. This research provides guidance for the development of DES in hot summer and cold winter climate zones. Simulations results show that:
- (1)
- In DES, the major energy consumption of different cases occurs during winter. DES consumes more electricity and less natural gas than the conventional energy system. The PES of cases 1, 2, 3, and 4 are 36.70%, 44.92%, 39.72%, and 48.04%, respectively. Thus, the construction of DES is beneficial for the optimization of China’s energy consumption structure due to the reduction of PEC.
- (2)
- The operation costs of DES of cases 1 to 4 are 2.96, 2.81, 2.65, and 2.59 × 10⁵ CNY, which are lower than those of the conventional energy system.
- (3)
- DES can reduce CO2, SO2, and dust emissions. In the meantime, the reductions are significantly influenced by the control strategy. The CO2 reductions of cases 1 to 4 are 1.21, 1.49, 1.31, and 1.59 × 10⁵ kg. The SO2 reductions of cases 1 to 4 are 983, 1203, 1064, and 1287 kg. The dust reductions of cases 1 to 4 are 491, 601, 532, and 643 kg, respectively.
- (4)
- The total annual solar collection efficiency values of cases 1 to 4 are 0.34, 0.40, 0.41, and 0.44. The total annual solar fraction of cases 1, 2, 3, and 4 are 0.17, 0.24, 0.23, and 0.27, respectively. The solar collection efficiency is improved due to the operation of seasonal thermal storage for the ground soil.
- (5)
- The soil annual heat imbalance rates of cases 1 to 4 are 45.7%, 18.8%, 17.2%, and 17.0%. The operation of seasonal thermal storage for the ground soil can effectively maintain the soil annual heat balance.
- (6)
- Results reveal that the performance of DES is better than that of the conventional energy system, and case 4 is the best control strategy for DES due to its higher PES and larger emissions reduction, lower operation cost and soil annual heat imbalance rate. The control strategy that heating load is mainly supplied by the combination of solar energy and geothermal heat pump is recommended due to its satisfactory performance and high flexibility.
The novelty of the current investigation can be summarized as follows:
- A simulation model was proposed considering the energetic, economic, and environmental aspects.
- Four operation strategies were put forward based on the complementary coordination characteristics between different types of energy.
- Results provide guidance for a better operation strategy for DES in hot summer and cold winter climate zones.
4.2. Further Research
The current investigation provides guidance in the development of DES. Changsha and other similar hot summer and cold winter climate zones have remarkable potential in the district cooling and heating of DES. The developed system simulation models is applicable to quantify the potential and performance of DES. Moreover, further studies will be performed for the validation of the developed simulation models and evaluation of underground heat usage. The economic performance considering the capital expenditures and operational expenditures should be conducted. The performance change in the geothermal heat pump, soil temperature, and the climate effects should also be considered from the perspective of consumers. Furthermore, the demand management (i.e., cooling and heating) of DES from the perspective of consumers will be considered in future studies as guidance in the operation of DESs.
Author Contributions
Conceptualization, Z.L.; Methodology, L.L. and Y.T.; Software, L.L; Validation, L.L. and Y.T.; Formal Analysis, L.L. and Y.T.; Investigation, L.L. and Y.T.; Resources, L.L. and Y.T.; Data Curation, Y.T.; Writing—Original Draft Preparation, Y.T.; Writing—Review & Editing, Y.T.; Visualization, Y.T.; Supervision, Z.L.; Project Administration, Z.L.; Funding Acquisition, Z.L.
Funding
The authors would like to thank the financial support from the China NSF project (NO. 51676209).
Conflicts of Interest
The authors declare no conflict of interest.
Appendix A
Table A1.
Parameters/inputs for solar thermal collector (Type 1b).
Table A1.
Parameters/inputs for solar thermal collector (Type 1b).
| Parameter/Input | Value | Units |
|---|---|---|
| Collector gross area | 264 | m2 |
| Fluid heat capacity | 4.190 | kJ/kg K |
| Efficiency mode | 1 | |
| Tested flow rate | 40 | kg/h m2 |
| Intercept efficiency | 0.748 | |
| Efficiency slope | 4.58 | kJ/h m2 K |
| Efficiency curvature | 0 | kJ/h m2 K2 |
| Optical mode | 2 | |
| 1st order IAM | 0.200000 | |
| 2nd order IAM | 0 | |
| Collector slope | 0 | degrees |
| Inlet temperature | 20 | °C |
| Inlet flow rate | 20,000 | kg/h |
| Ground reflectance | 0.2 |
Table A2.
Parameters/inputs for heat exchanger (Type 5a).
Table A2.
Parameters/inputs for heat exchanger (Type 5a).
| Parameter/Input | Value | Units |
|---|---|---|
| Parallel flow mode | 1 | |
| Heat capacity of hot side fluid | 4.19 | kJ/kg K |
| Heat capacity of cold side fluid | 4.19 | kJ/kg K |
| Overall heat transfer coefficient of exchanger | 14,209 | W/K |
Table A3.
Parameters/inputs for heat pump (Type 668).
Table A3.
Parameters/inputs for heat pump (Type 668).
| Parameter/Input | Value | Units |
|---|---|---|
| Inlet source temperature | 7 | °C |
| Source flow rate | 22,000 | kg/h |
| Inlet load temperature | 45 | °C |
| Load flow rate | 32,500 | kg/h |
Table A4.
Parameters/inputs for tank (Type 4e).
Table A4.
Parameters/inputs for tank (Type 4e).
| Parameter/Input | Value | Units |
|---|---|---|
| Variable inlet positions | 2 | |
| Tank volume | 22 | m3 |
| Fluid heat capacity | 4.190 | kJ/kg K |
| Fluid density | 1000 | kg/ m3 |
| Tank loss coefficient | 2.5 | kJ/h m2K |
| Height of node | 0.3 | m |
| Auxiliary heater mode | 1 | |
| Node containing heating element-1/2 | 1 | |
| Node containing thermostat | 1 | |
| Set point temperature for element-1/2 | 55 | °C |
| Dead band for heating element-1/2 | 5 | Delta C |
| Maximum heating rate of element-1/2 | 348 | kW |
| Hot-side temperature | 60 | °C |
| Hot-side flow rate | 20,000 | kg/h |
| Cold-side temperature | 50 | °C |
| Cold-side flow rate | 36,000 | kg/h |
| Environment temperature | 27 | °C |
| Control signal for element | 1 | |
| Control signal for element | 0 |
Table A5.
Parameters/inputs for U-Tubes (Type 775a).
Table A5.
Parameters/inputs for U-Tubes (Type 775a).
| Parameter/Input | Value | Units |
|---|---|---|
| Storage volume | 51,927 | m3 |
| Borehole depth | 100 | m |
| Header depth | 1.5 | m |
| Number of boreholes | 22 | |
| Storage thermal conductivity | 2 | W/m K |
| Storage heat capacity | 5500 | kJ/m3 K |
| Reference temperature [A1] | 22 | °C |
| Fluid heat capacity | 4.19 | kJ/kg K |
| Inlet fluid temperature | 20 | °C |
| Inlet flowrate (total) | 32,500 | kg/h |
| Air temperature | 20 | °C |
| Circulation switch | 1 |
[A1] Jonas, D.; Lämmle, M.; Theis, D.; Schneider, S.; Frey, G. Performance modeling of PVT collectors: Implementation, validation and parameter identification approach using TRNSYS. Solar Energy 2019, 193, 51–64.
References
- Plans on Prevention and Control of Atmospheric Pollution. Available online: http://www.gov.cn/zwgk/2013-09/12/content_2486773.htm (accessed on 2 September 2019).
- Somma, M.D.; Yan, B.; Bianco, N.; Graditi, G.; Luh, P.B.; Mongibello, L.; Naso, V. Multi objective design optimization of distributed energy systems through cost and exergy assessments. Appl. Energy 2017, 204, 1299–1316. [Google Scholar] [CrossRef]
- Alanne, K.; Saari, A. Distributed energy generation and sustainable development. Renew. Sustain. Energy Rev. 2006, 10, 539–558. [Google Scholar] [CrossRef]
- Zeng, M.; Ouyang, S.J.; Shi, H.; Ge, Y.J.; Qian, Q.Q. Overall review of distributed energy development in China: Status quo, barriers and solutions. Renew. Sustain. Energy Rev. 2015, 50, 1226–1238. [Google Scholar]
- Akorede, M.F.; Hizam, H.; Pouresmaeil, E. Distributed energy resources and benefits to the environment. Renew. Sustain. Energy Rev. 2010, 14, 724–734. [Google Scholar] [CrossRef]
- Han, J.; Ouyang, L.X.; Xu, Y.Z.; Zeng, R.; Kang, S.S.; Zhang, G.Q. Current status of distributed energy system in China. Renew. Sustain. Energy Rev. 2016, 55, 288–297. [Google Scholar] [CrossRef]
- Pan, Y.; Liu, L.C.; Zhu, T.; Zhang, T.; Zhang, J.Y. Feasibility analysis on distributed energy system of Chongming County based on RETScreen software. Energy 2017, 130, 298–306. [Google Scholar] [CrossRef]
- Du, Q.Z.; Cui, C.L.; Zhang, Y.; Zhang, C.; Gang, W.J.; Wang, S.W. Promotion of distributed energy systems integrated with district cooling systems considering uncertainties in energy market and policy in China. Energy Procedia 2018, 149, 256–265. [Google Scholar] [CrossRef]
- Chang, Y.; Gu, Y.; Zhang, L.; Wu, C.; Liang, L. Energy and environmental implications of using geothermal heat pumps in buildings: An example from north China. J. Clean. Prod. 2017, 204, 484–492. [Google Scholar] [CrossRef]
- Huang, B.; Mauerhofer, V. Life cycle sustainability assessment of ground source heat pump in Shanghai, China. J. Clean. Prod. 2016, 119, 207–214. [Google Scholar] [CrossRef]
- Ozgener, O.; Hepbasli, A. Experimental performance analysis of a solar assisted ground-source heat pump greenhouse heating system. Energy Build. 2005, 37, 101–110. [Google Scholar] [CrossRef]
- Rad, F.M.; Fung, A.S.; Leong, W.H. Feasibility of combined solar thermal and ground source heat pump systems in cold climate, Canada. Energy Build. 2013, 61, 224–232. [Google Scholar] [CrossRef]
- Wang, E.Y.; Fung, A.S.; Qi, C.Y.; Leong, W.H. Performance prediction a hybrid solar ground-source heat pump system. Energy Build. 2012, 47, 600–611. [Google Scholar] [CrossRef]
- Kang, L.G.; Yang, J.H.; An, Q.S.; Deng, S.; Zhao, J.; Wang, H.; Li, Z.L. Effects of load following operational strategy on CCHP system with an auxiliary ground source heat pump considering carbon tax and electricity feed in tariff. Appl. Energy 2017, 194, 454–466. [Google Scholar] [CrossRef]
- Cho, H.; Mago, P.J.; Luck, R.; Chamra, L.M. Evaluation of CCHP systems performance based on operational cost, primary energy consumption, and carbon dioxide emission by utilizing an optimal operation scheme. Appl. Energy 2009, 86, 2540–2549. [Google Scholar] [CrossRef]
- Hanafizadeh, P.; Eshraghi, J.; Ahmadi, P.; Sattari, A. Evaluation and sizing of a CCHP system for a commercial and office buildings. J. Build. Eng. 2016, 5, 67–78. [Google Scholar] [CrossRef]
- Mago, P.J.; Hueffed, A.K. Evaluation of a turbine driven CCHP system for large office buildings under different operating strategies. Energ. Build. 2010, 42, 1628–1636. [Google Scholar] [CrossRef]
- Mago, P.J.; Chamra, L.M. Analysis and optimization of CCHP systems based on energy, economical, and environmental considerations. Energ. Build. 2009, 41, 1099–1106. [Google Scholar] [CrossRef]
- Wang, J.J.; Jing, Y.Y.; Zhang, C.F.; Zhai, Z.J. Performance comparison of combined cooling heating and power system in different operation modes. Appl. Energy 2011, 88, 4621–4631. [Google Scholar] [CrossRef]
- Jung, J.; Villaran, M. Optimal planning and design of hybrid renewable energy systems for microgrids. Renew. Sustain. Energy Rev. 2017, 75, 180–191. [Google Scholar] [CrossRef]
- Wei, F.; Wu, Q.H.; Jing, Z.X.; Chen, J.J.; Zhou, X.X. Optimal unit sizing for small-scale integrated energy systems using multi-objective interval optimization and evidential reasoning approach. Energy 2016, 111, 933–946. [Google Scholar] [CrossRef]
- Mehleri, E.D.; Sarimveis, H.; Markatos, N.C.; Papageorgiou, L.G. Optimal design and operation of distributed energy systems: Applied to Greek residential sector. Renew. Energy 2013, 51, 331–342. [Google Scholar] [CrossRef]
- Gao, J.; Zhang, X.; Liu, J.; Li, K.S.; Yang, J. Thermal performance and ground temperature of vertical pile-foundation heat exchangers: A case study. Appl. Energy 2008, 28, 2295–2304. [Google Scholar] [CrossRef]
- Wang, C.S.; Lv, C.X.; Li, P.; Song, G.Y.; Li, S.Q.; Xu, X.D.; Wu, J.Z. Modeling and optimal operation of community integrated energy systems: A case study from China. Appl. Energy 2018, 230, 1242–1254. [Google Scholar] [CrossRef]
- Bellos, E.; Tzivanidis, C.; Moschos, K.; Antonopoulos, K.A. Energetic and financial evaluation of solar assisted heat pump space heating systems. Energy Convers Manag. 2016, 120, 306–319. [Google Scholar] [CrossRef]
- Gao, J.; Kang, J.; Zhang, C.; Gang, W. Energy performance and operation characteristics of distributed energy systems with district cooling systems in subtropical areas under different control strategies. Energy 2018, 153, 849–860. [Google Scholar] [CrossRef]
- Ren, H.B.; Zhou, W.S.; Gao, W.J. Optimal option of distributed energy systems for building complexes in different climate zones in China. Appl. Energy 2012, 91, 156–165. [Google Scholar] [CrossRef]
- Buonomano, A.; Luca, G.D.; Figaj, R.D.; Vanoli, L. Dynamic simulation and thermo-economic analysis of a PhotoVoltaic/Thermal collector heating system for an indoor-outdoor swimming pool. Energy Convers Manag. 2015, 99, 176–192. [Google Scholar] [CrossRef]
- Tagliafico, L.A.; Scarpa, F.; Tagliafico, G.; Valsuani, F. An approach to energy saving assessment of solar assisted heat pumps for swimming pool water heating. Energy Build. 2012, 55, 833–840. [Google Scholar] [CrossRef]
- Ministry of Housing and Urban-Rural Development of the People’s Republic of China. Technical Specification for Water Supply and Drainage Engineering of Swimming Pool (CJJ 122-2017), Ministry of Housing and Urban-Rural Development of the People’s Republic of China; China Architecture & Building Press: Beijing, China, 2017. (In Chinese)
- Klein, S.A.; Beckman, W.A.; Mitchell, J.W.; Duffie, J.A.; Duffie, N.A.; Freeman, T.L.; Mitchell, J.C.; Braun, J.E.; Evans, B.L.; Kummer, J.P.; et al. A transient system simulation program. In Solar Energy Laboratory, TRNSYS; University of Wisconsin Madison: Madison, WI, USA, 2006. [Google Scholar]
- Calise, F.; d’Accadia, M.D.; Figaj, R.D.; Vanoli, L. A novel solar-assisted heat pump driven by photovoltaic/thermal collectors: Dynamic simulation and thermoeconomic optimization. Energy 2016, 95, 346–366. [Google Scholar] [CrossRef]
- Liu, G.; Li, M.; Zhou, B.; Chen, Y.; Liao, S. General indicator for techno-economic assessment of renewable energy resources. Energy Convers. Manag. 2018, 156, 416–426. [Google Scholar] [CrossRef]
- Mauri, L.; Vallati, A.; Ocłon, P. Low impact energy saving strategies for individual heating systems in a modern residential building: A case study in Rome. J. Clean Prod. 2019, 214, 791–802. [Google Scholar] [CrossRef]
- Zheng, R.C. Handbook on Civil Building Solar Water Heating System Engineering; Chemical industry Press: Beijing, China, 2006. (In Chinese) [Google Scholar]
- Rohsenow, W.M.; Hartnett, J.P.; Cho, Y.I. Handbook of Heat Transfer; McGraw-Hill: New York, NY, USA, 1998. [Google Scholar]
- Ministry of Housing and Urban-Rural Development of the People’s Republic of China. Evaluation standard for application of renewable energy in buildings (GB/T 50801-2013). In Ministry of Housing and Urban-Rural Development of the People’s Republic of China; China Architecture & Building Press: Beijing, China, 2013. (In Chinese) [Google Scholar]
- Acuna, A.; Lara, F.; Rosales, P. Impact of a vertical geothermal heat exchanger on the solar fraction of a solar cooling system. Int. J. Refrig. 2017, 76, 63–72. [Google Scholar] [CrossRef]
- Sundar, L.S.; Kirubeil, A.; Punnaiah, V.; Singh, M.K.; Sousa, A.C.M. Effectiveness analysis of solar flat plate collector with Al2O3 water nanofluids and with longitudinal strip inserts. Int. J. Heat Mass Transf. 2018, 127, 422–435. [Google Scholar] [CrossRef]


© 2019 by the authors. Licensee MDPI, Basel, Switzerland. This article is an open access article distributed under the terms and conditions of the Creative Commons Attribution (CC BY) license (http://creativecommons.org/licenses/by/4.0/).