Radiation in the Optical and UHF Range Emitted by Partial Discharges


Abstract
:1. Introduction
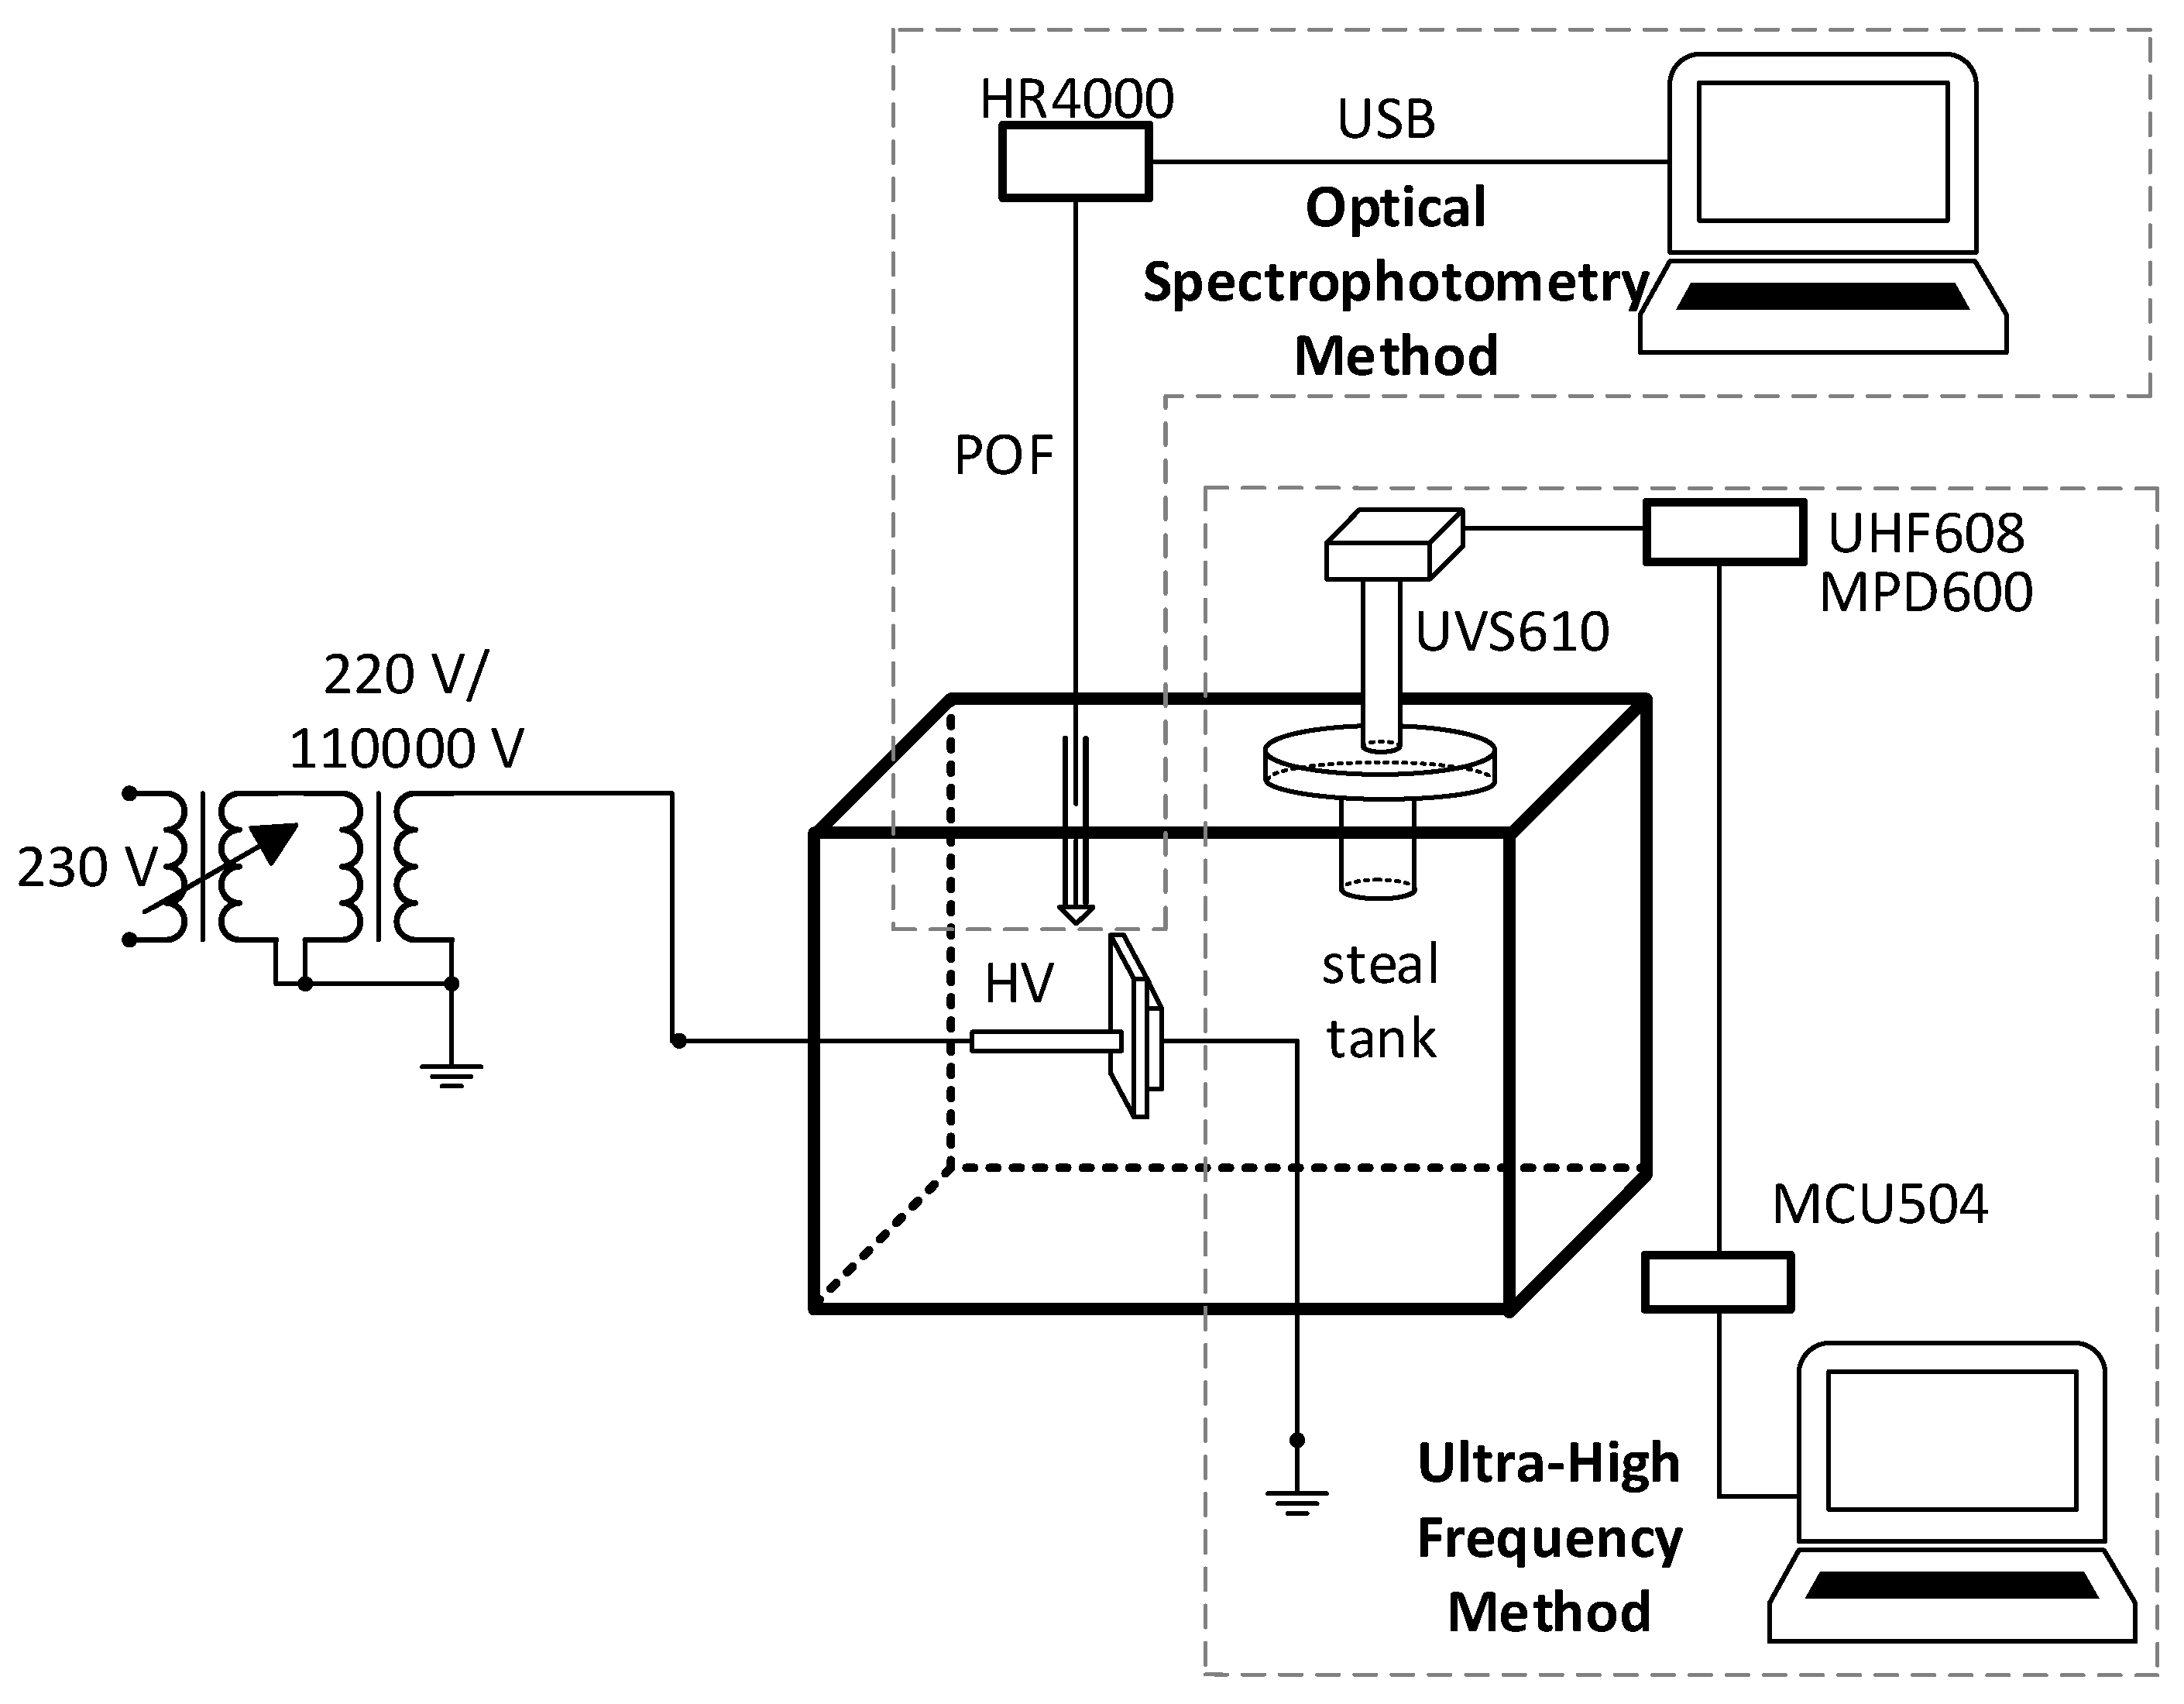
2. Measuring system
3. Measurements, Results, and Discussion
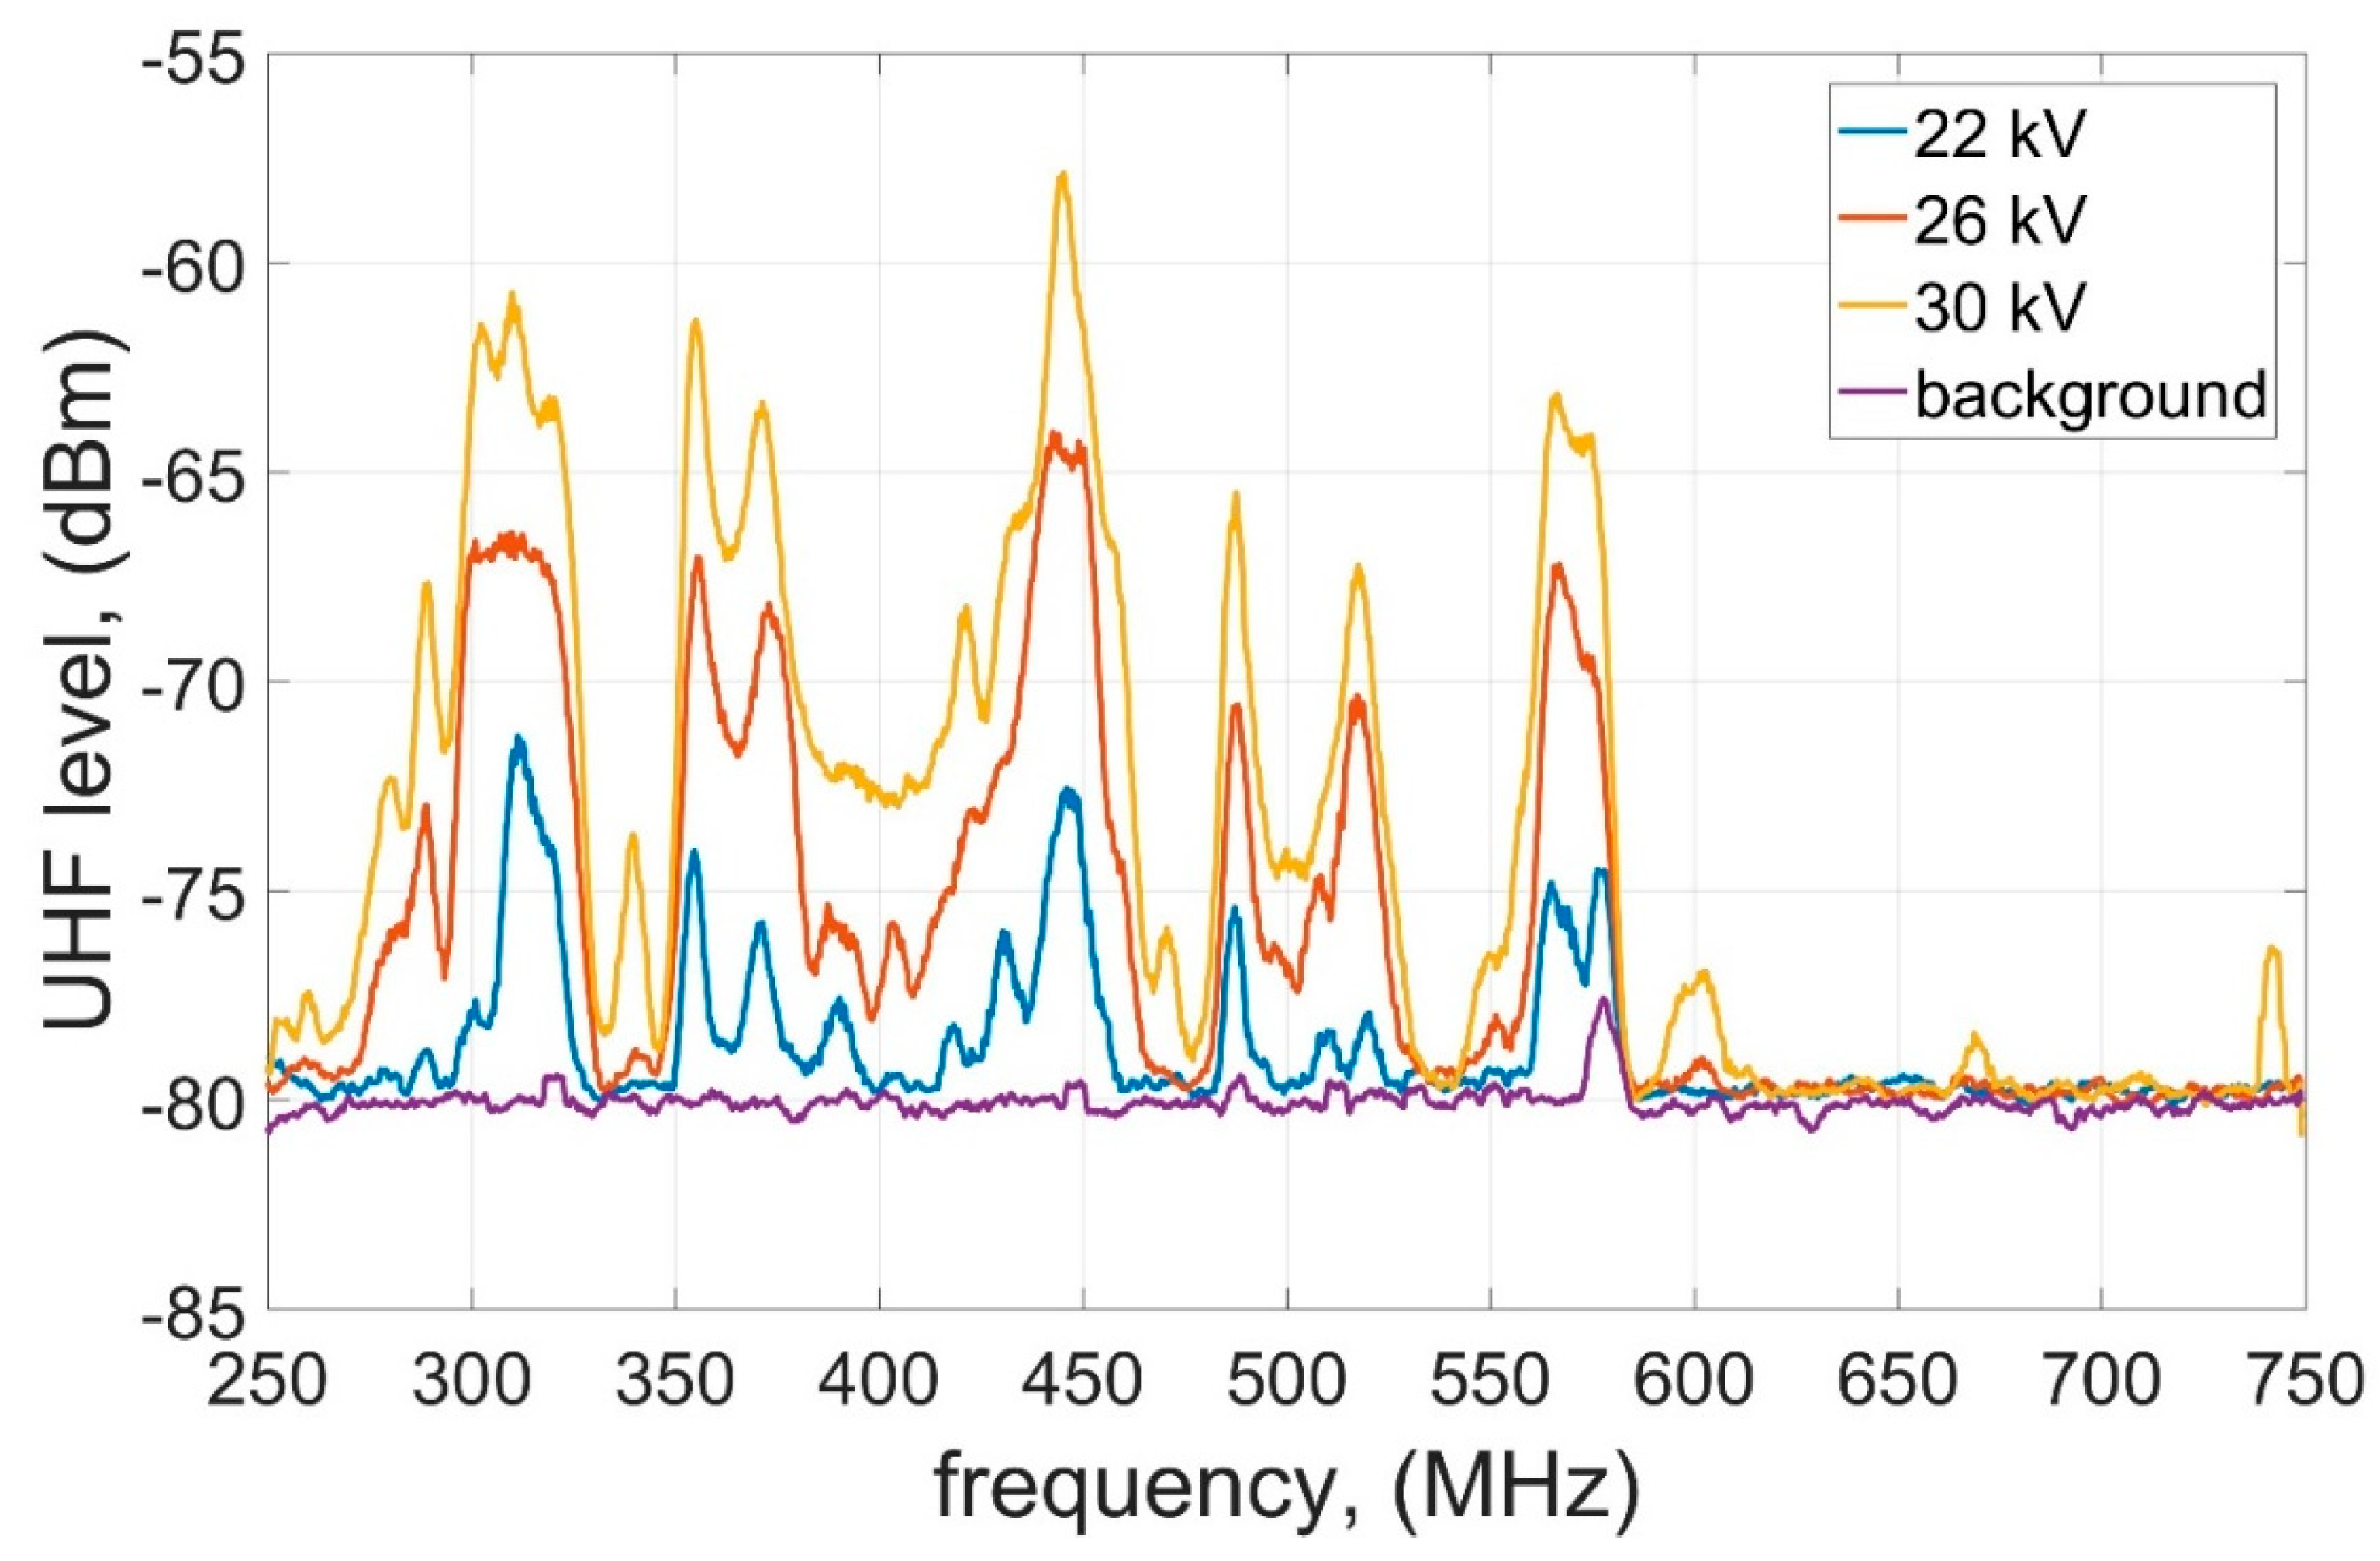
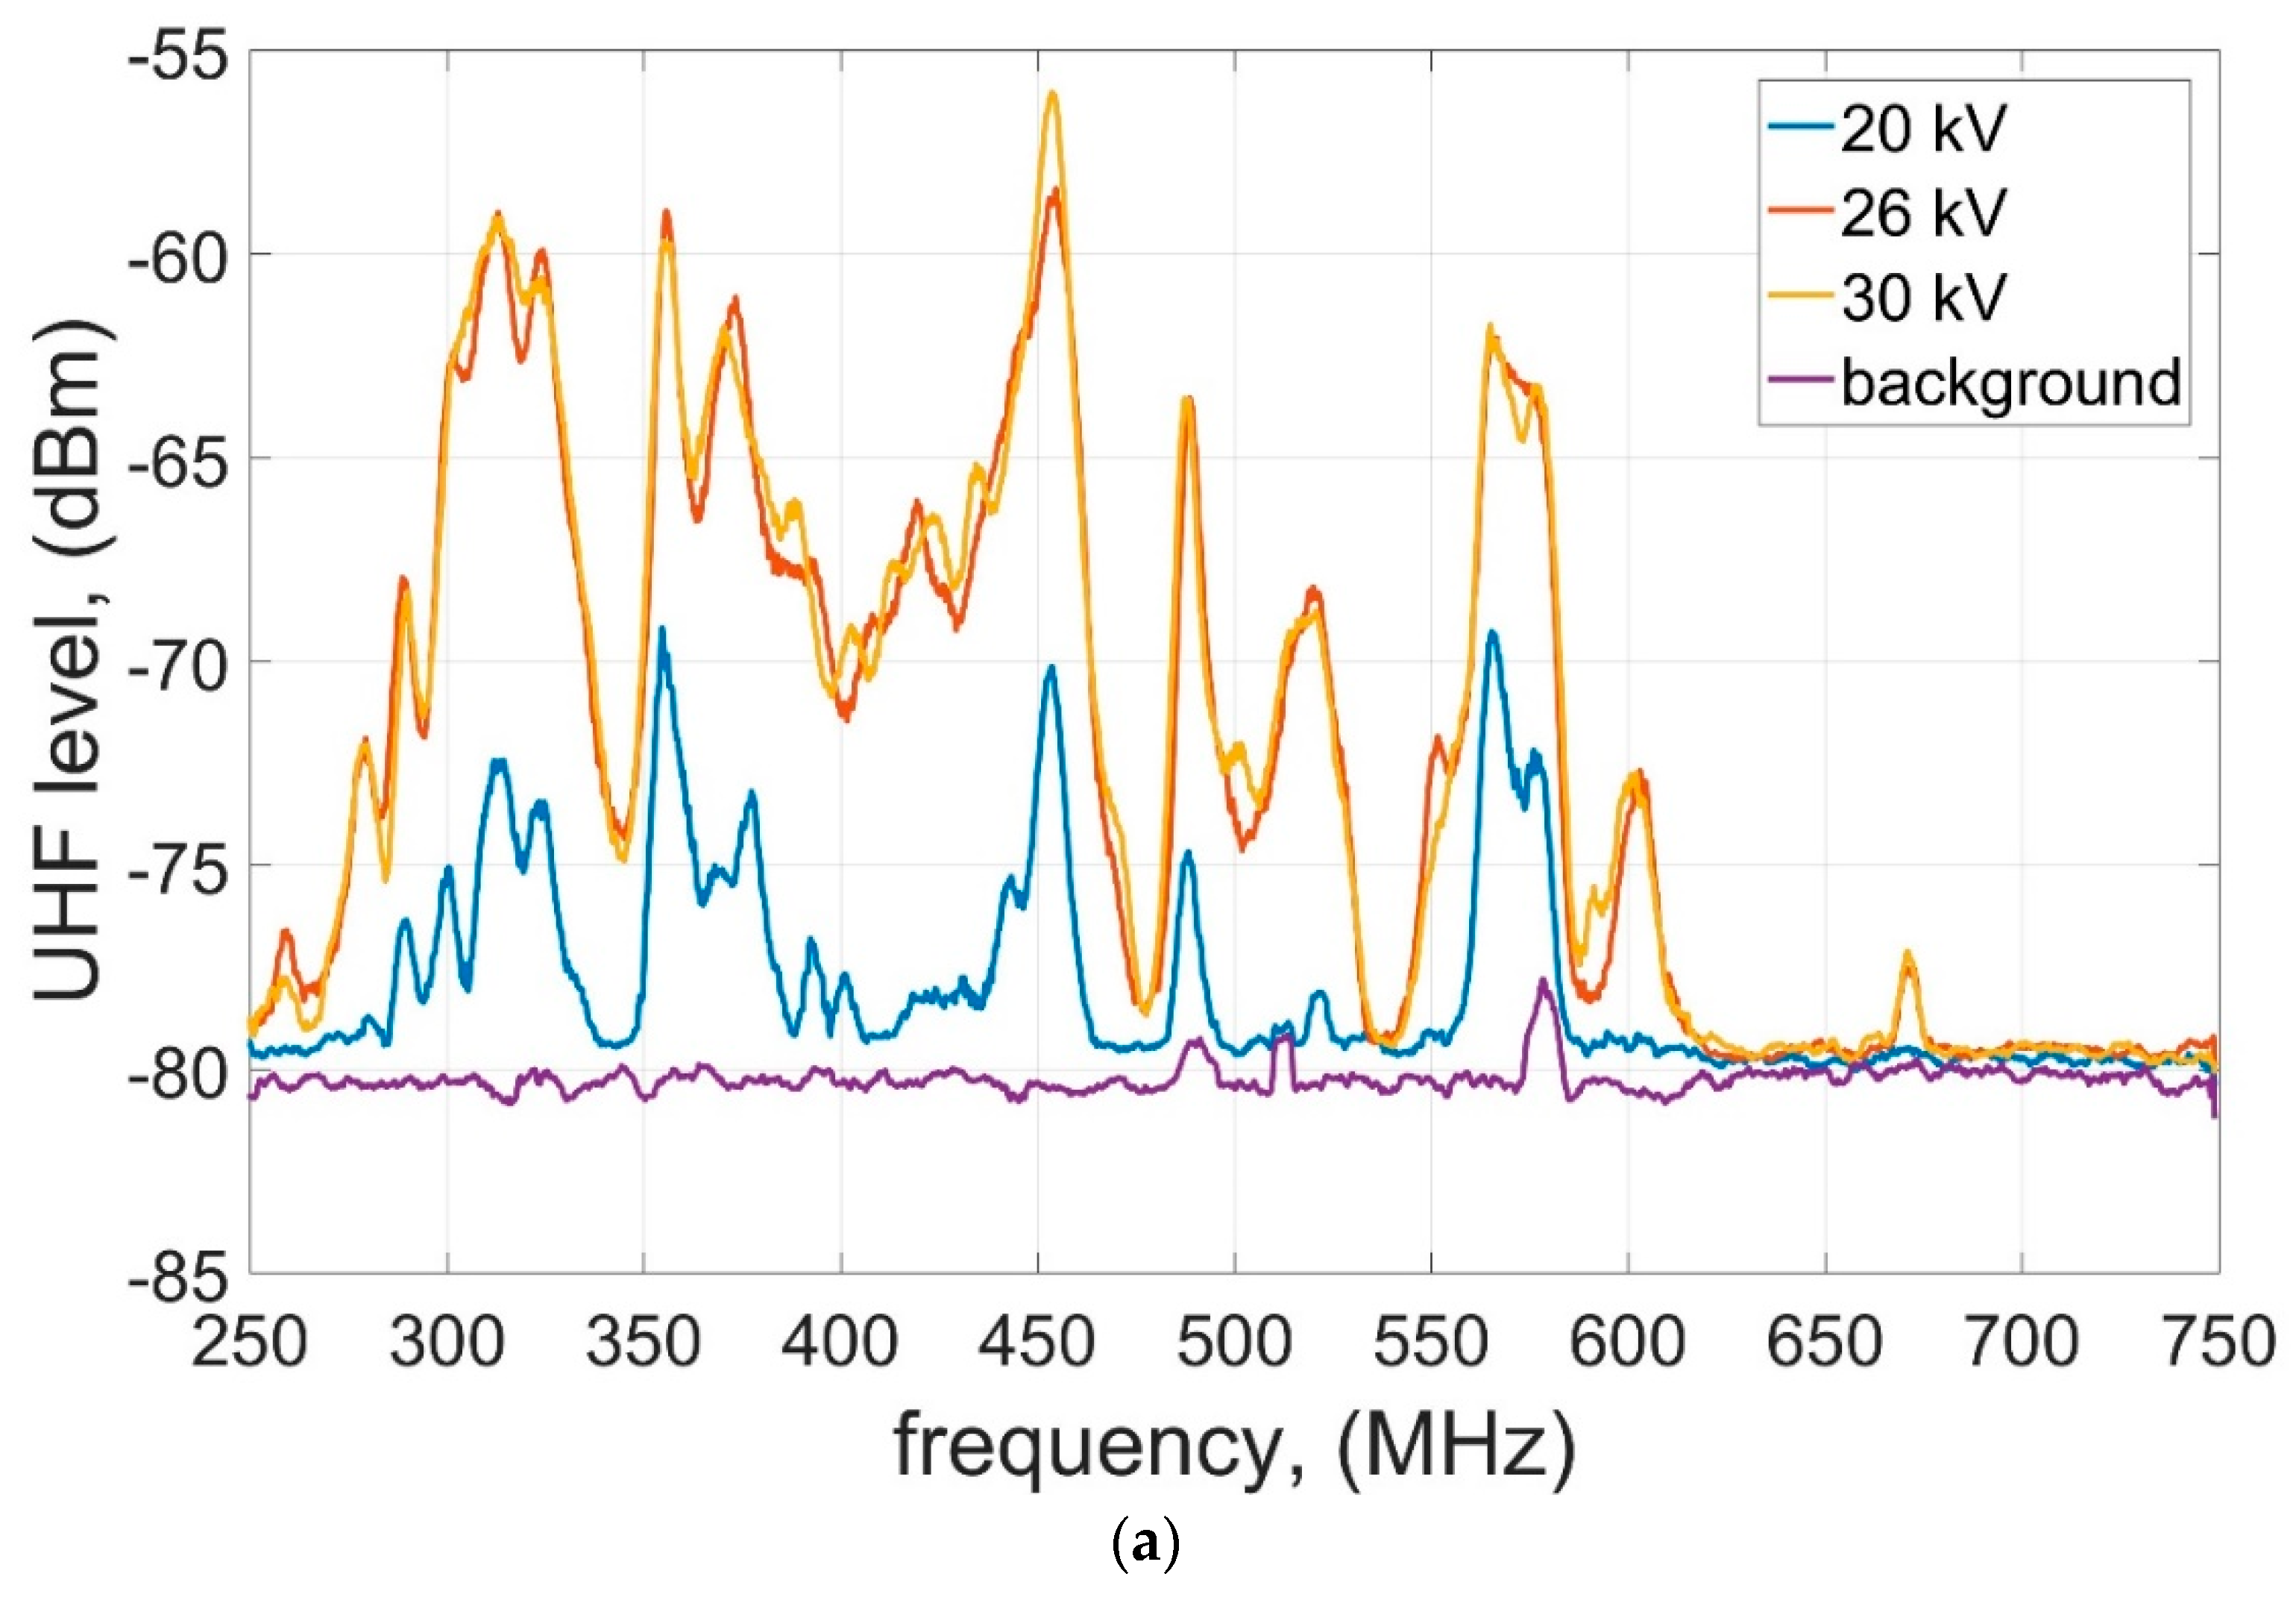
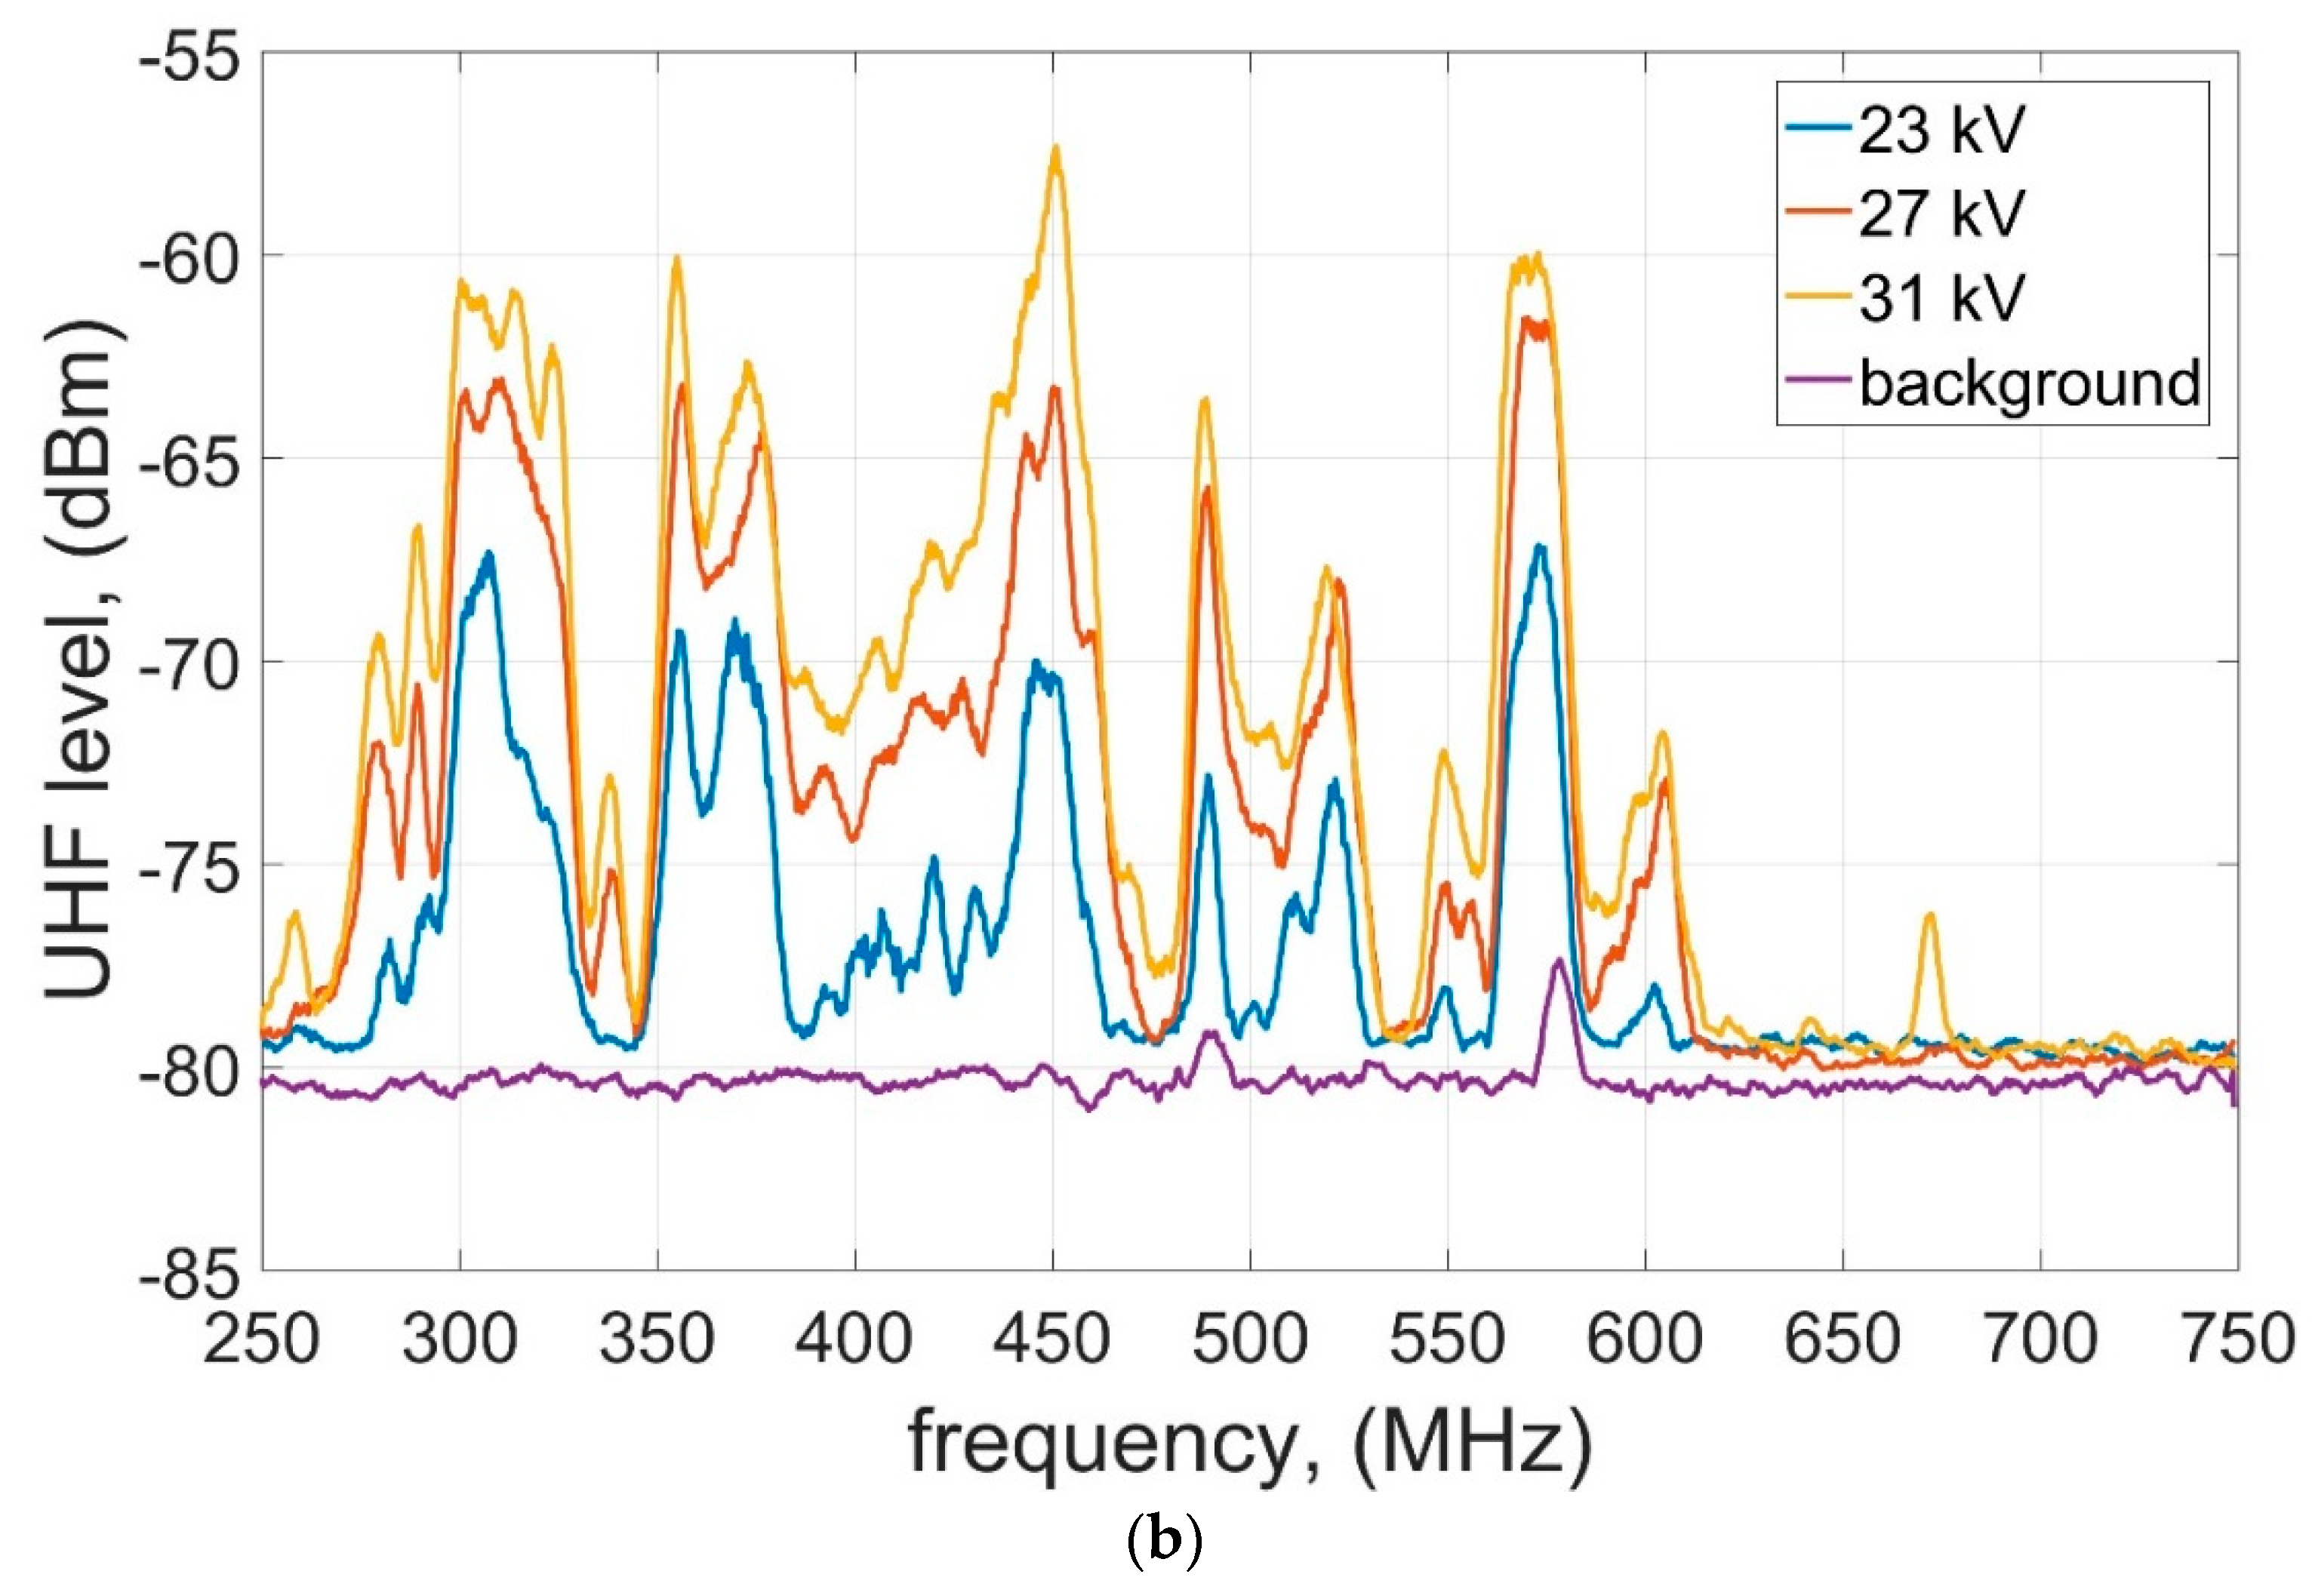
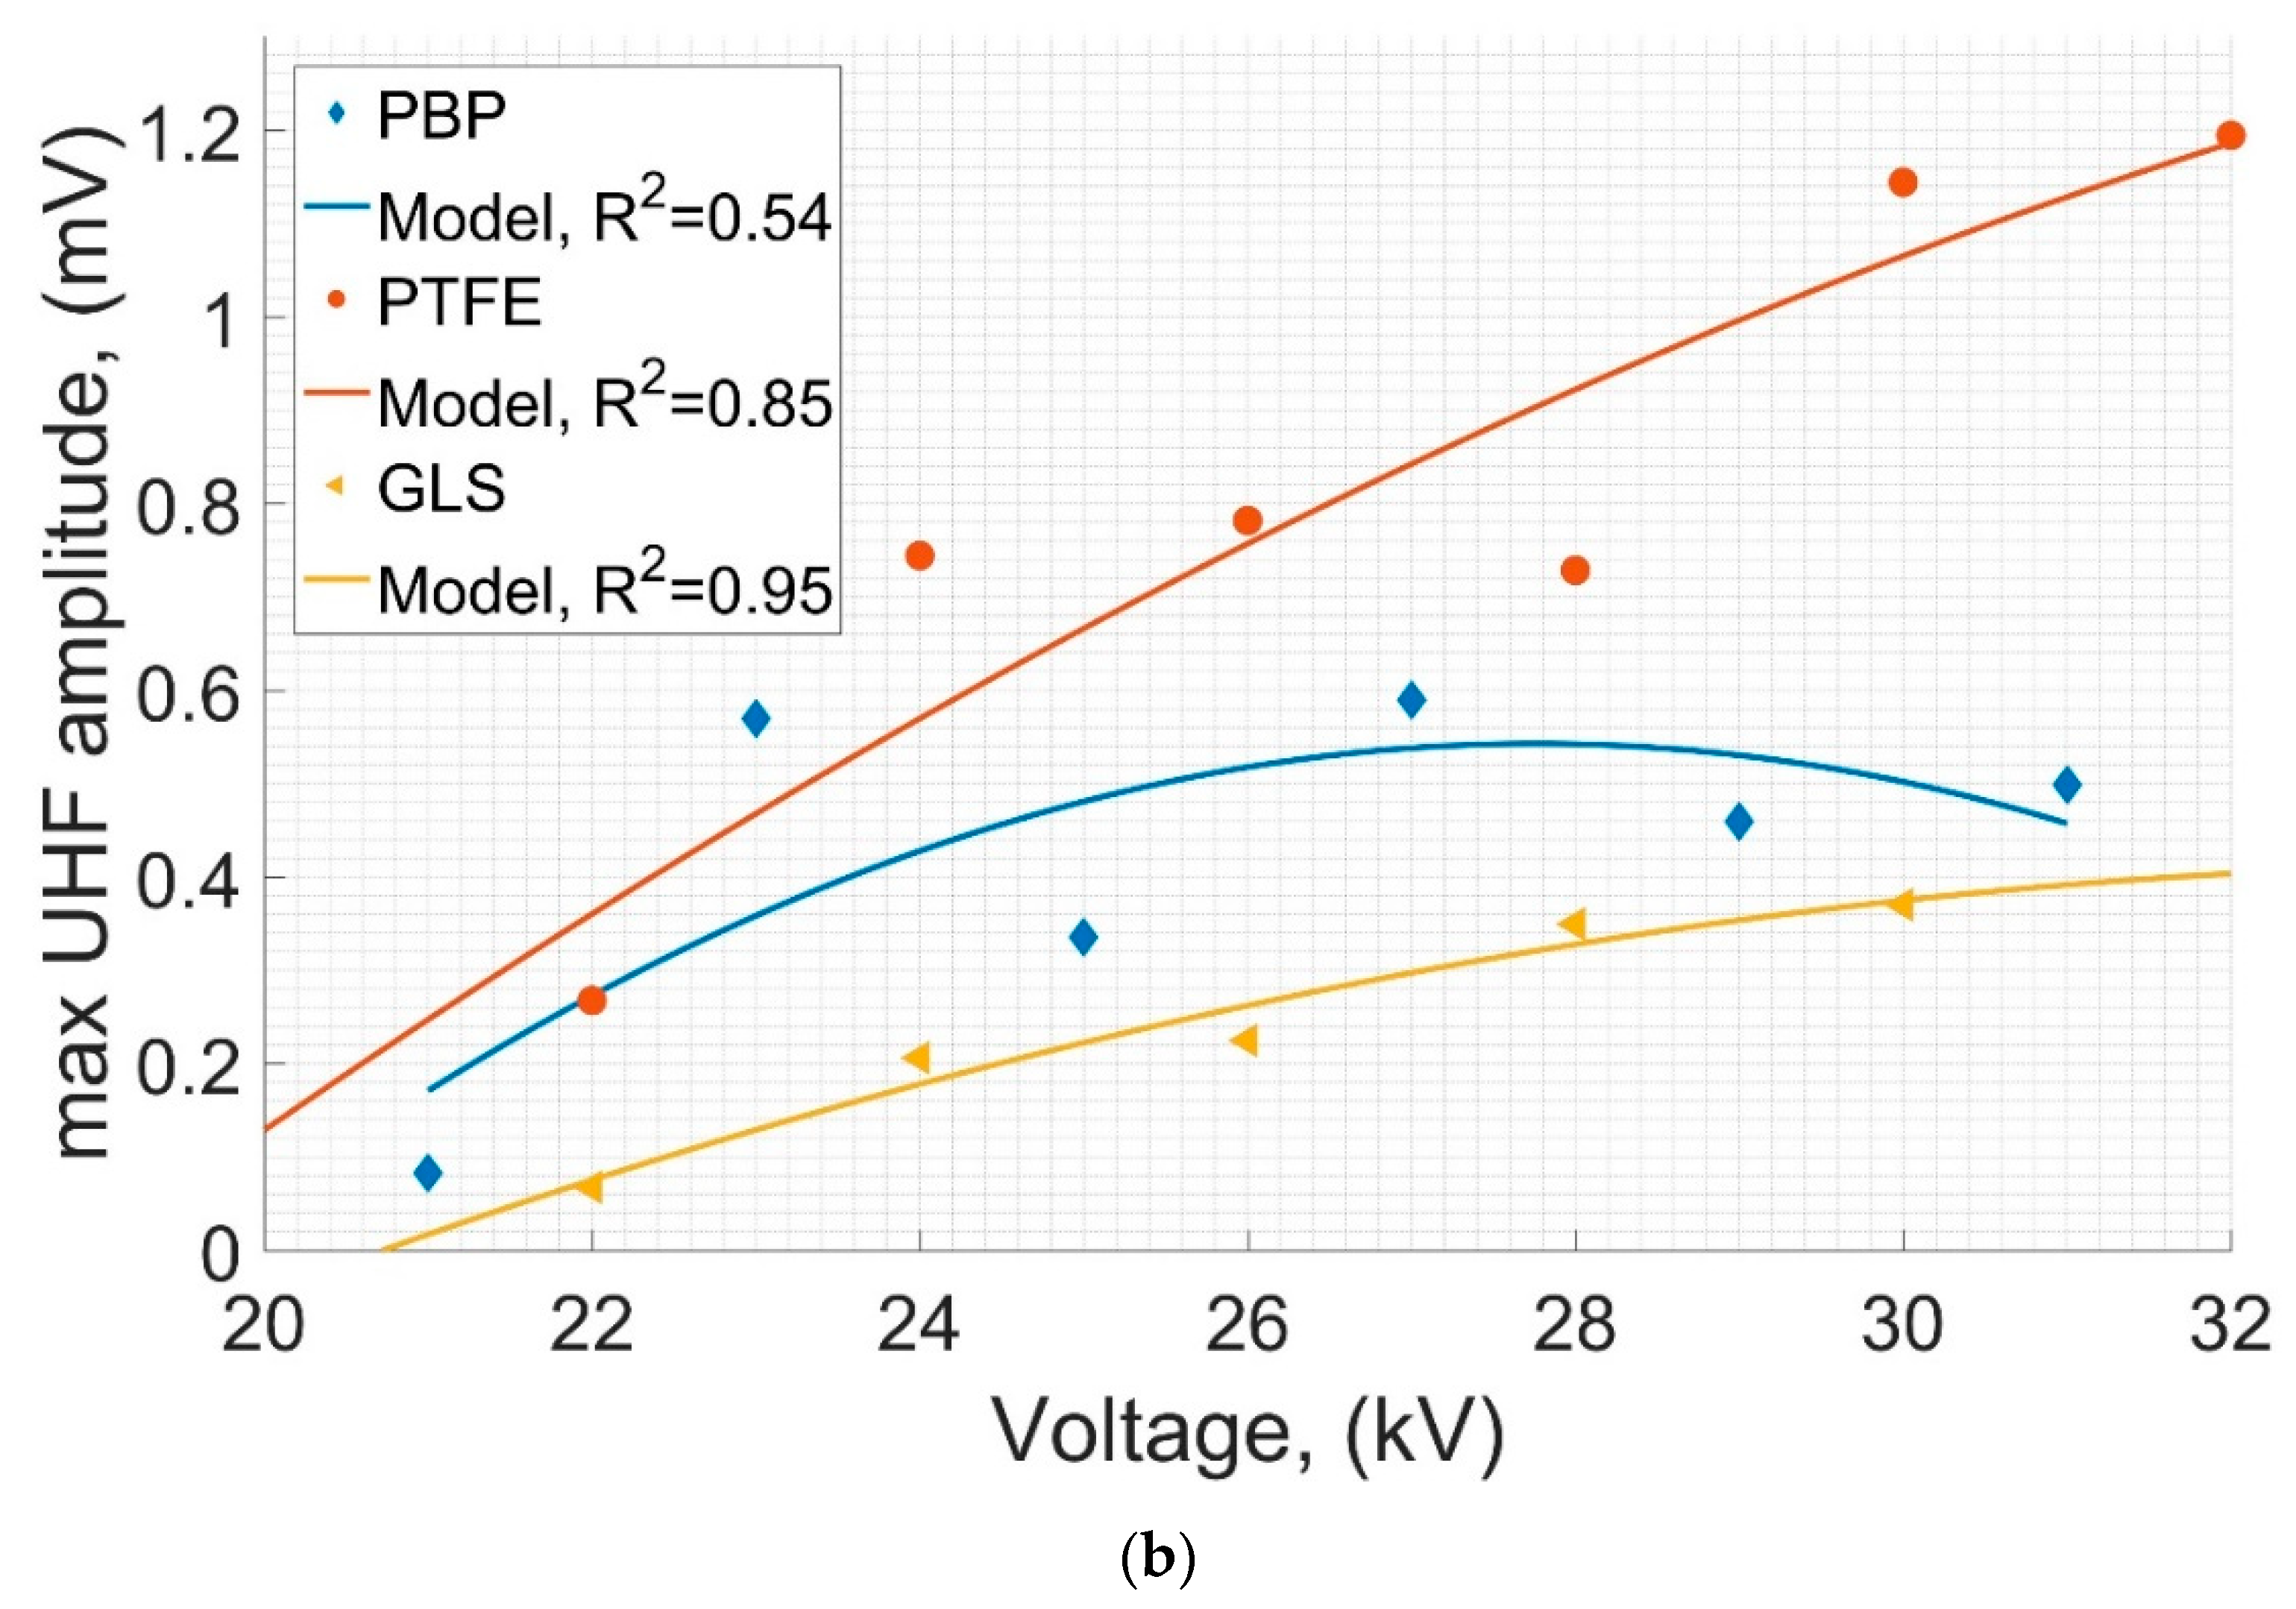
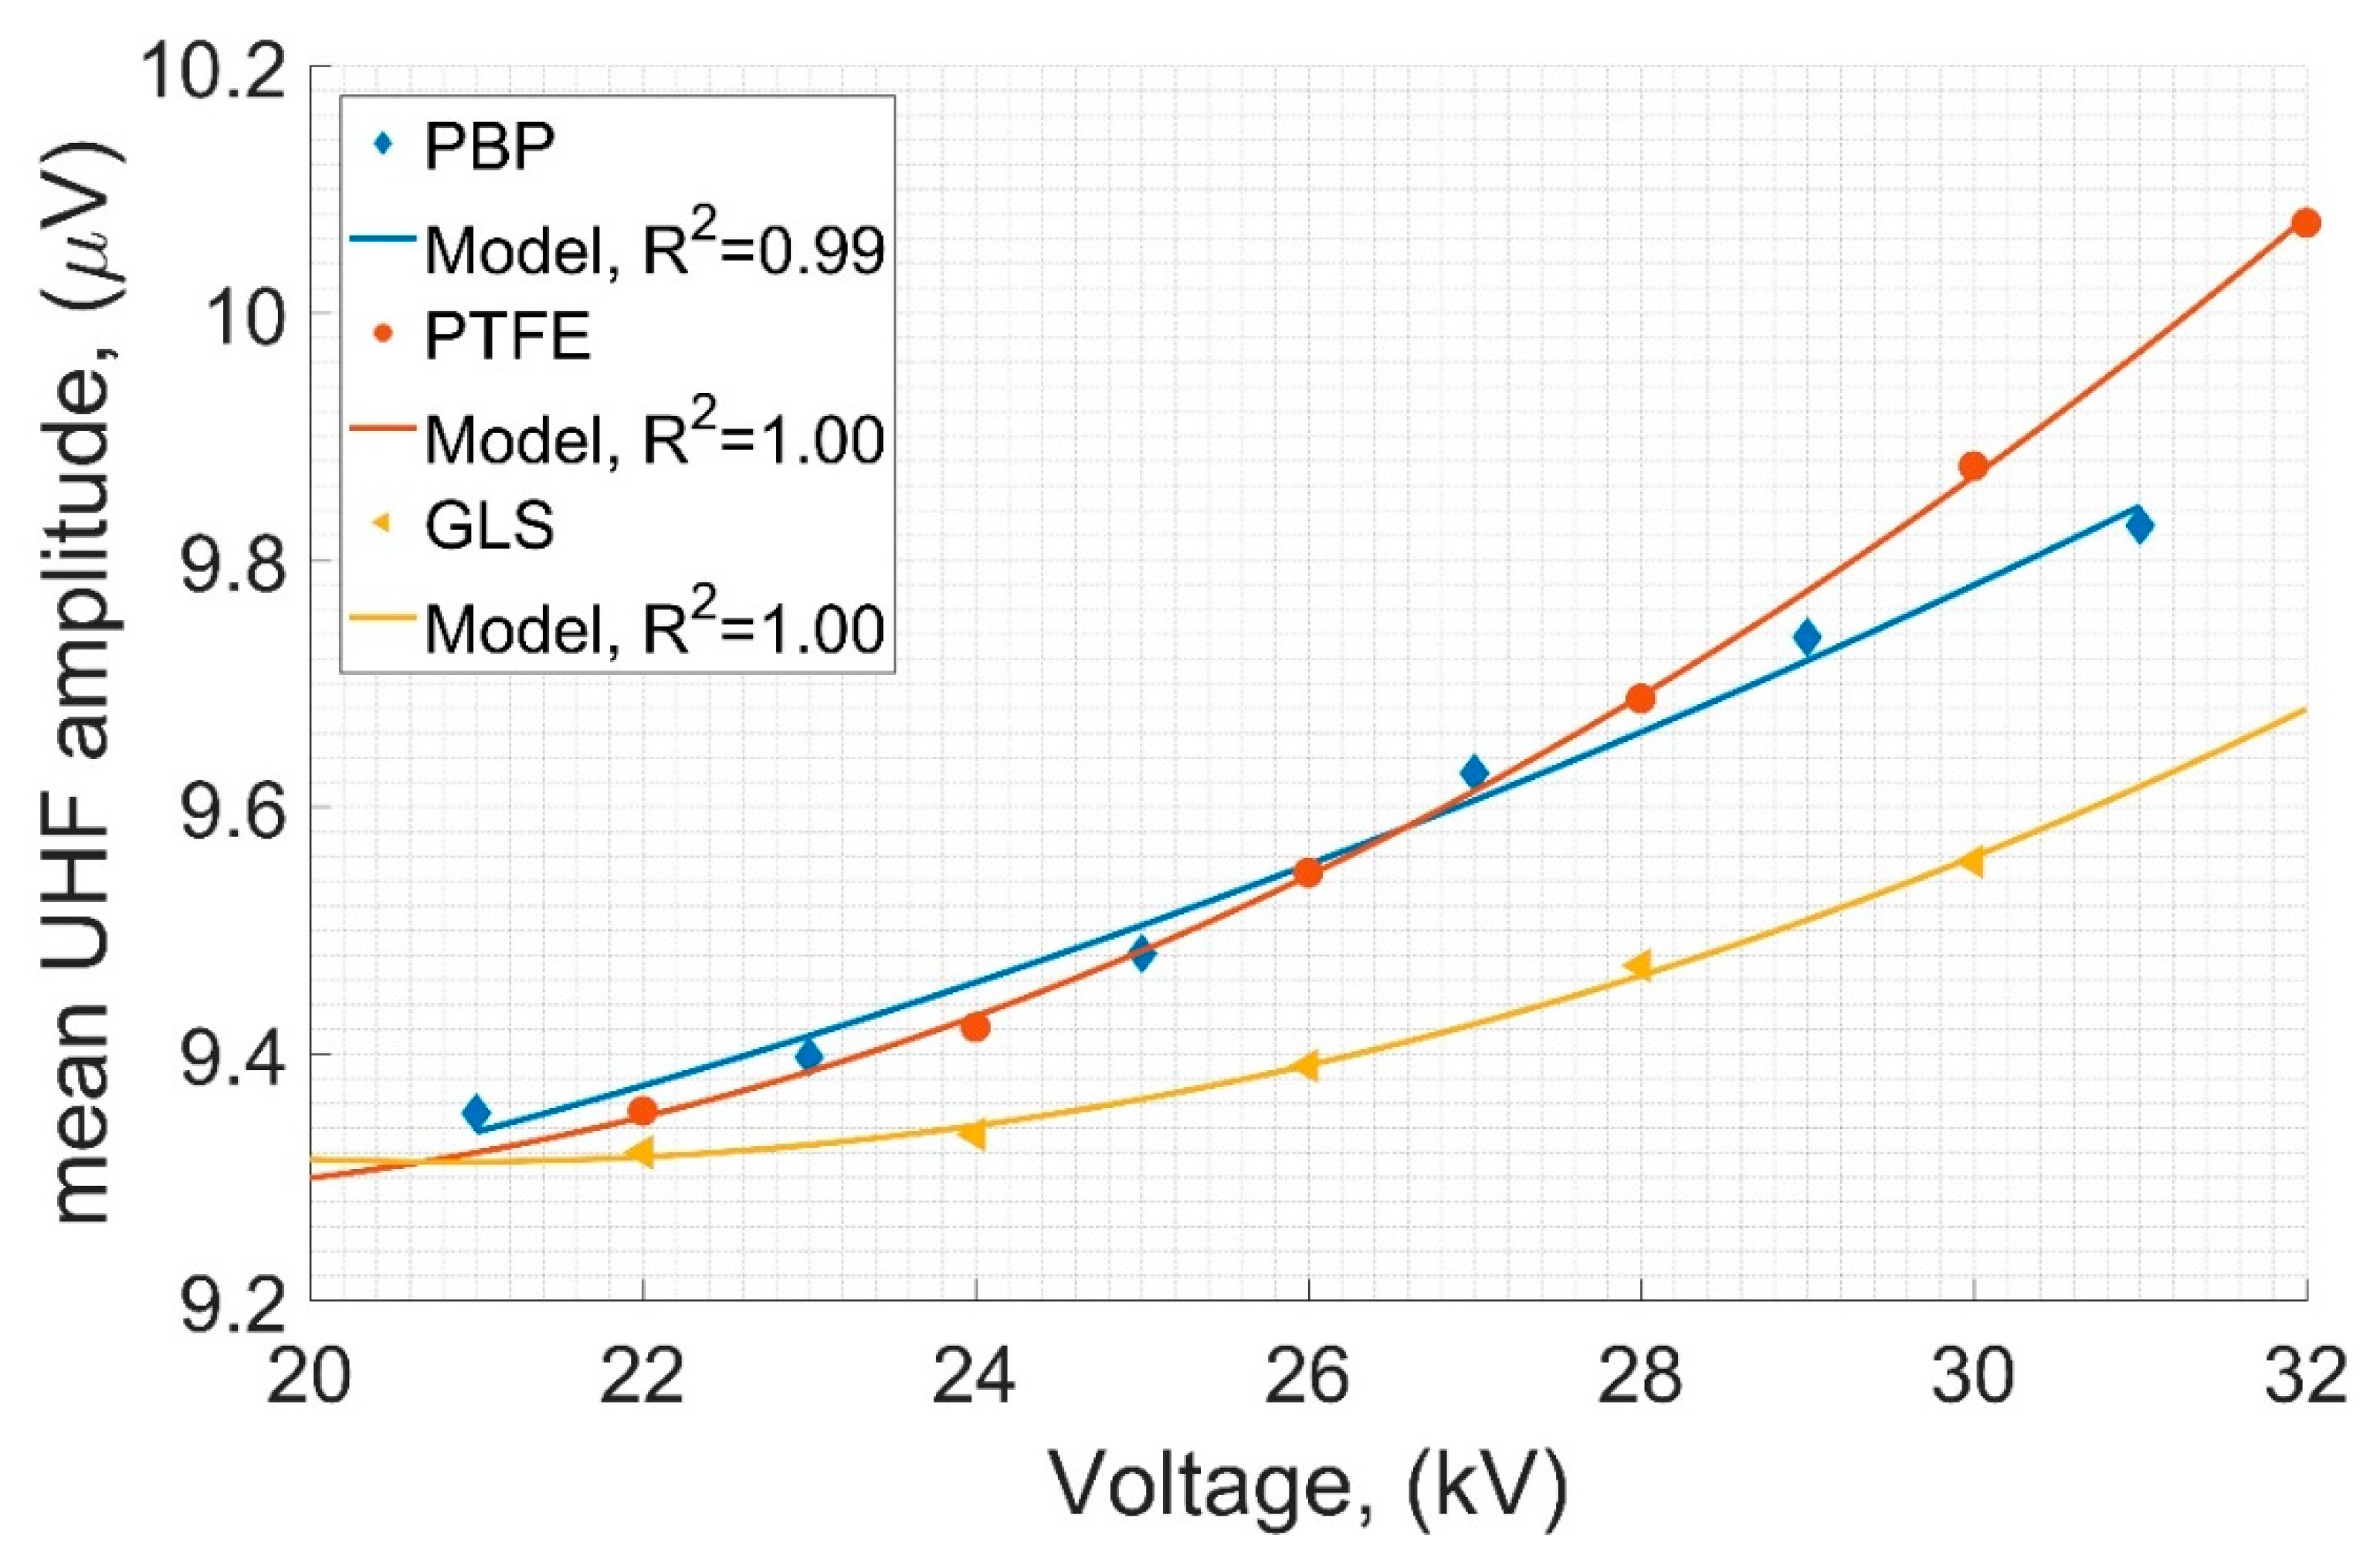
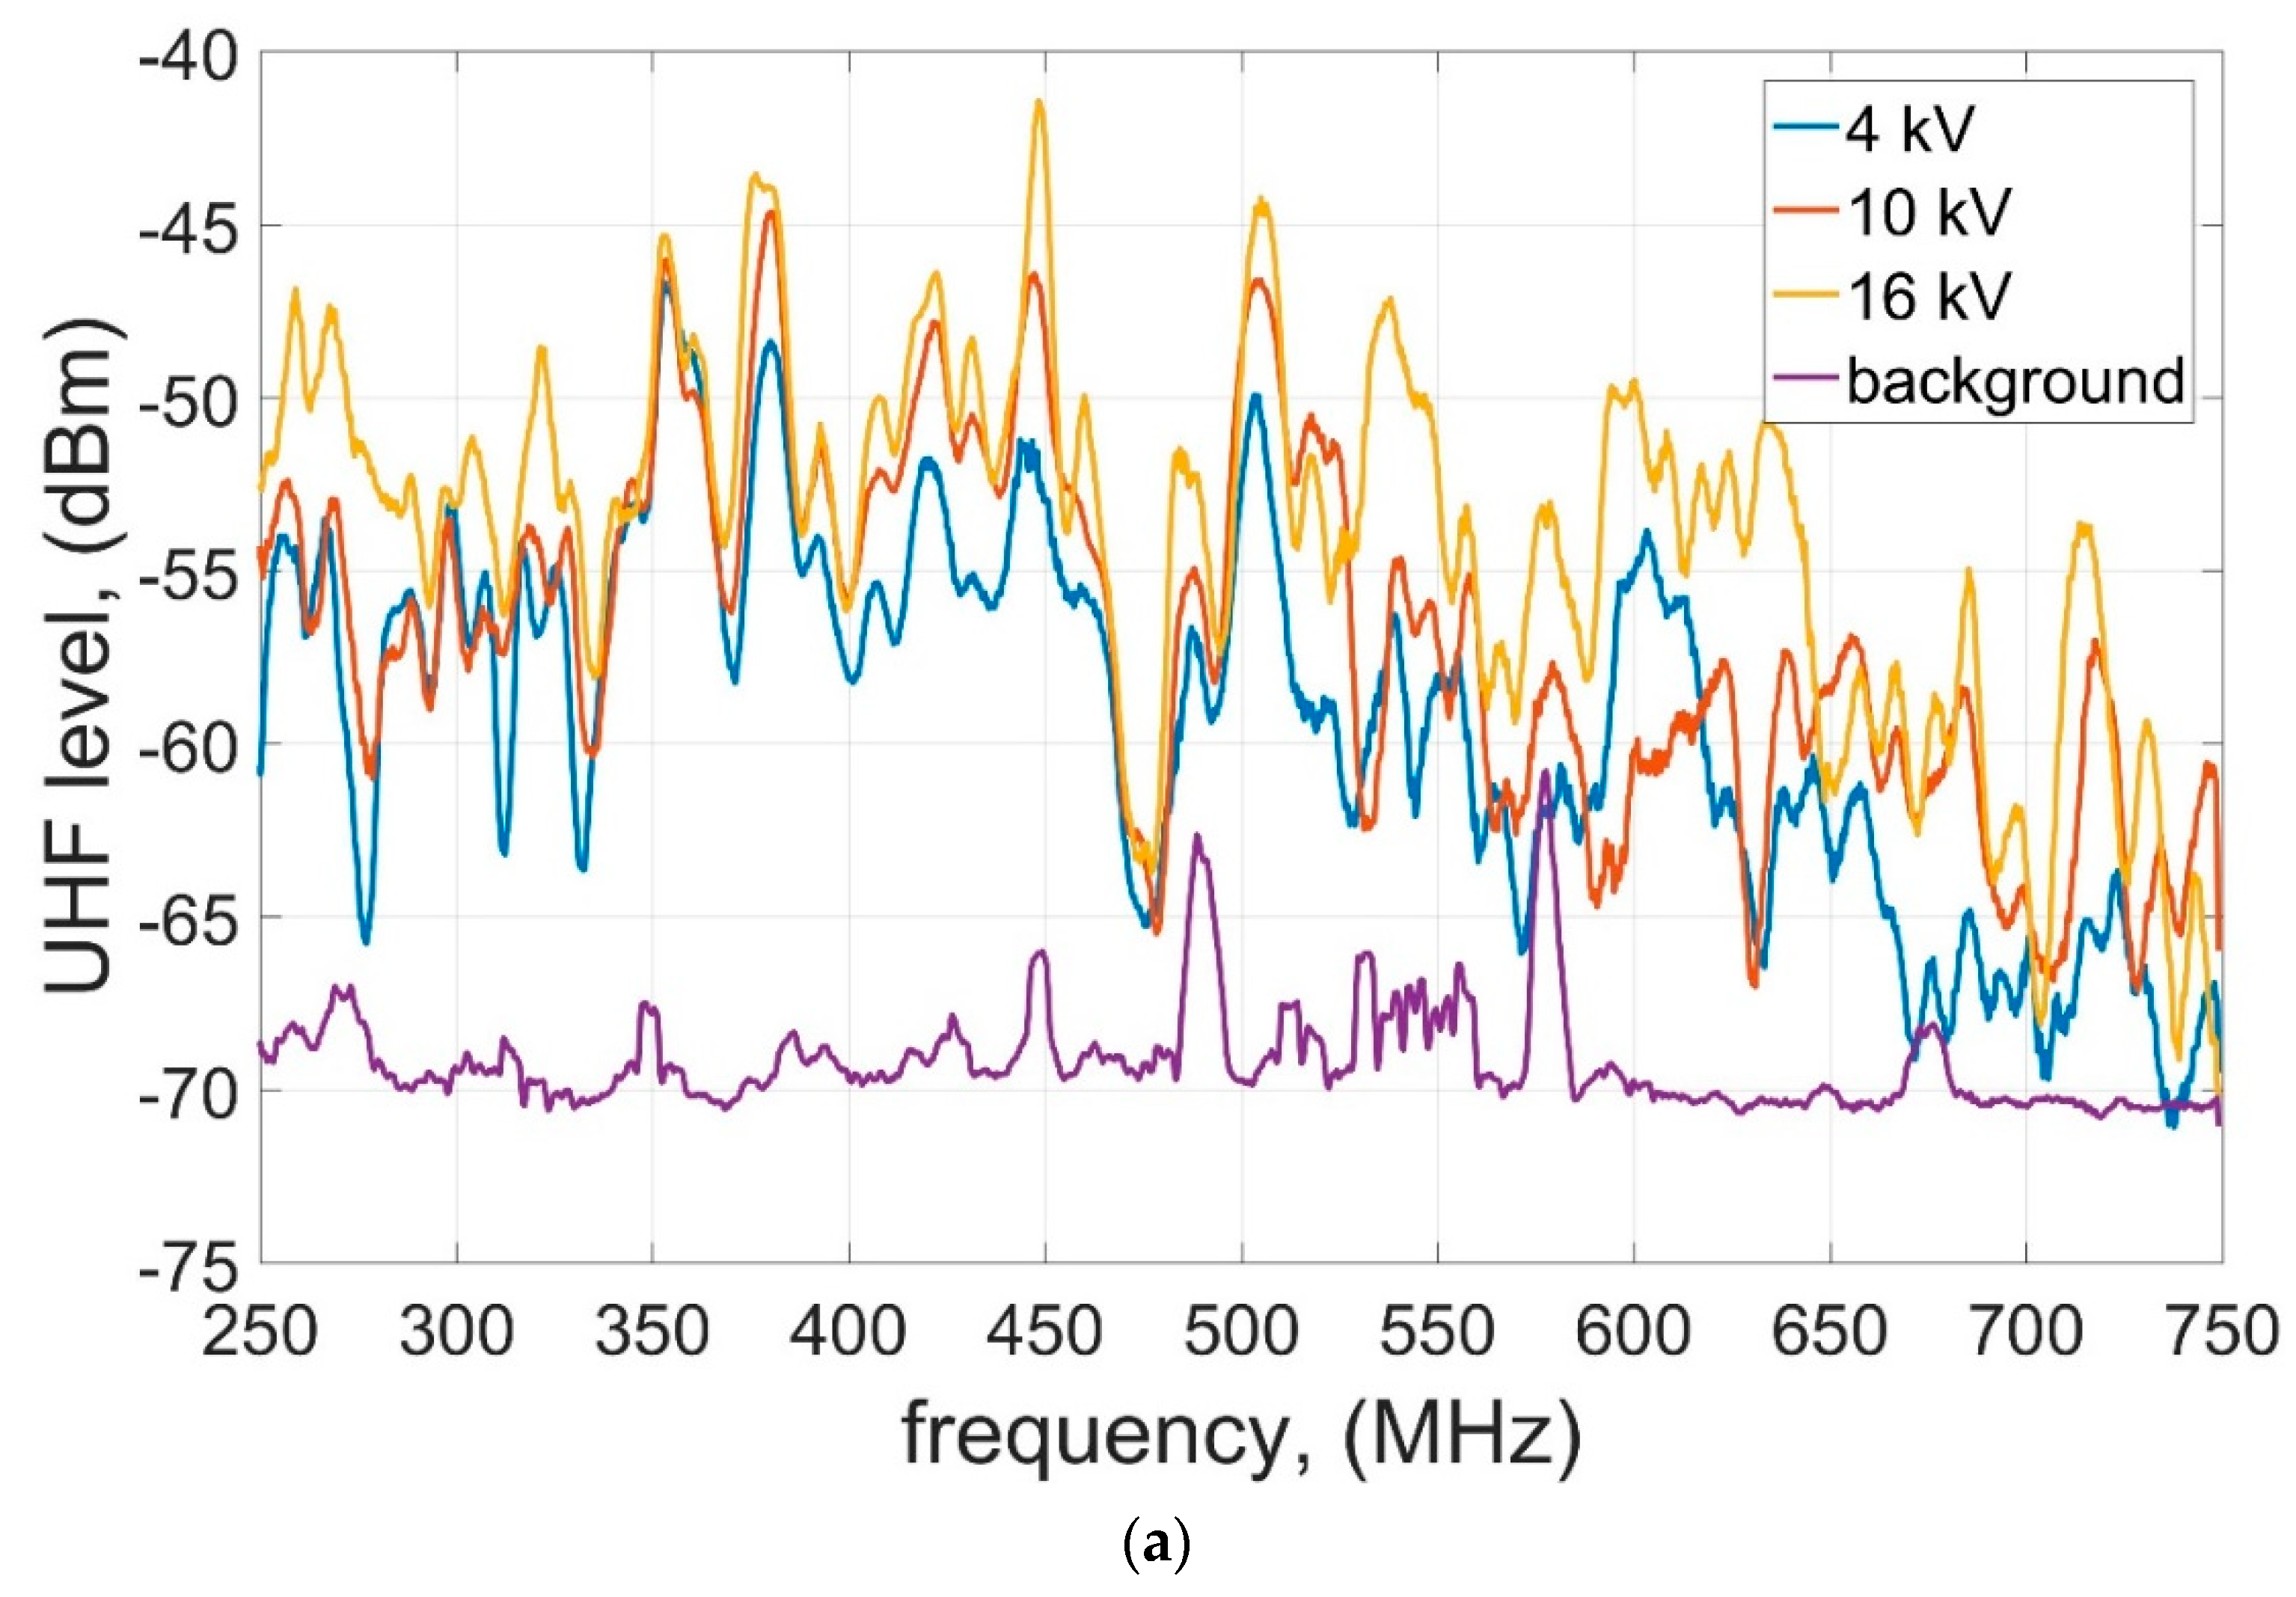
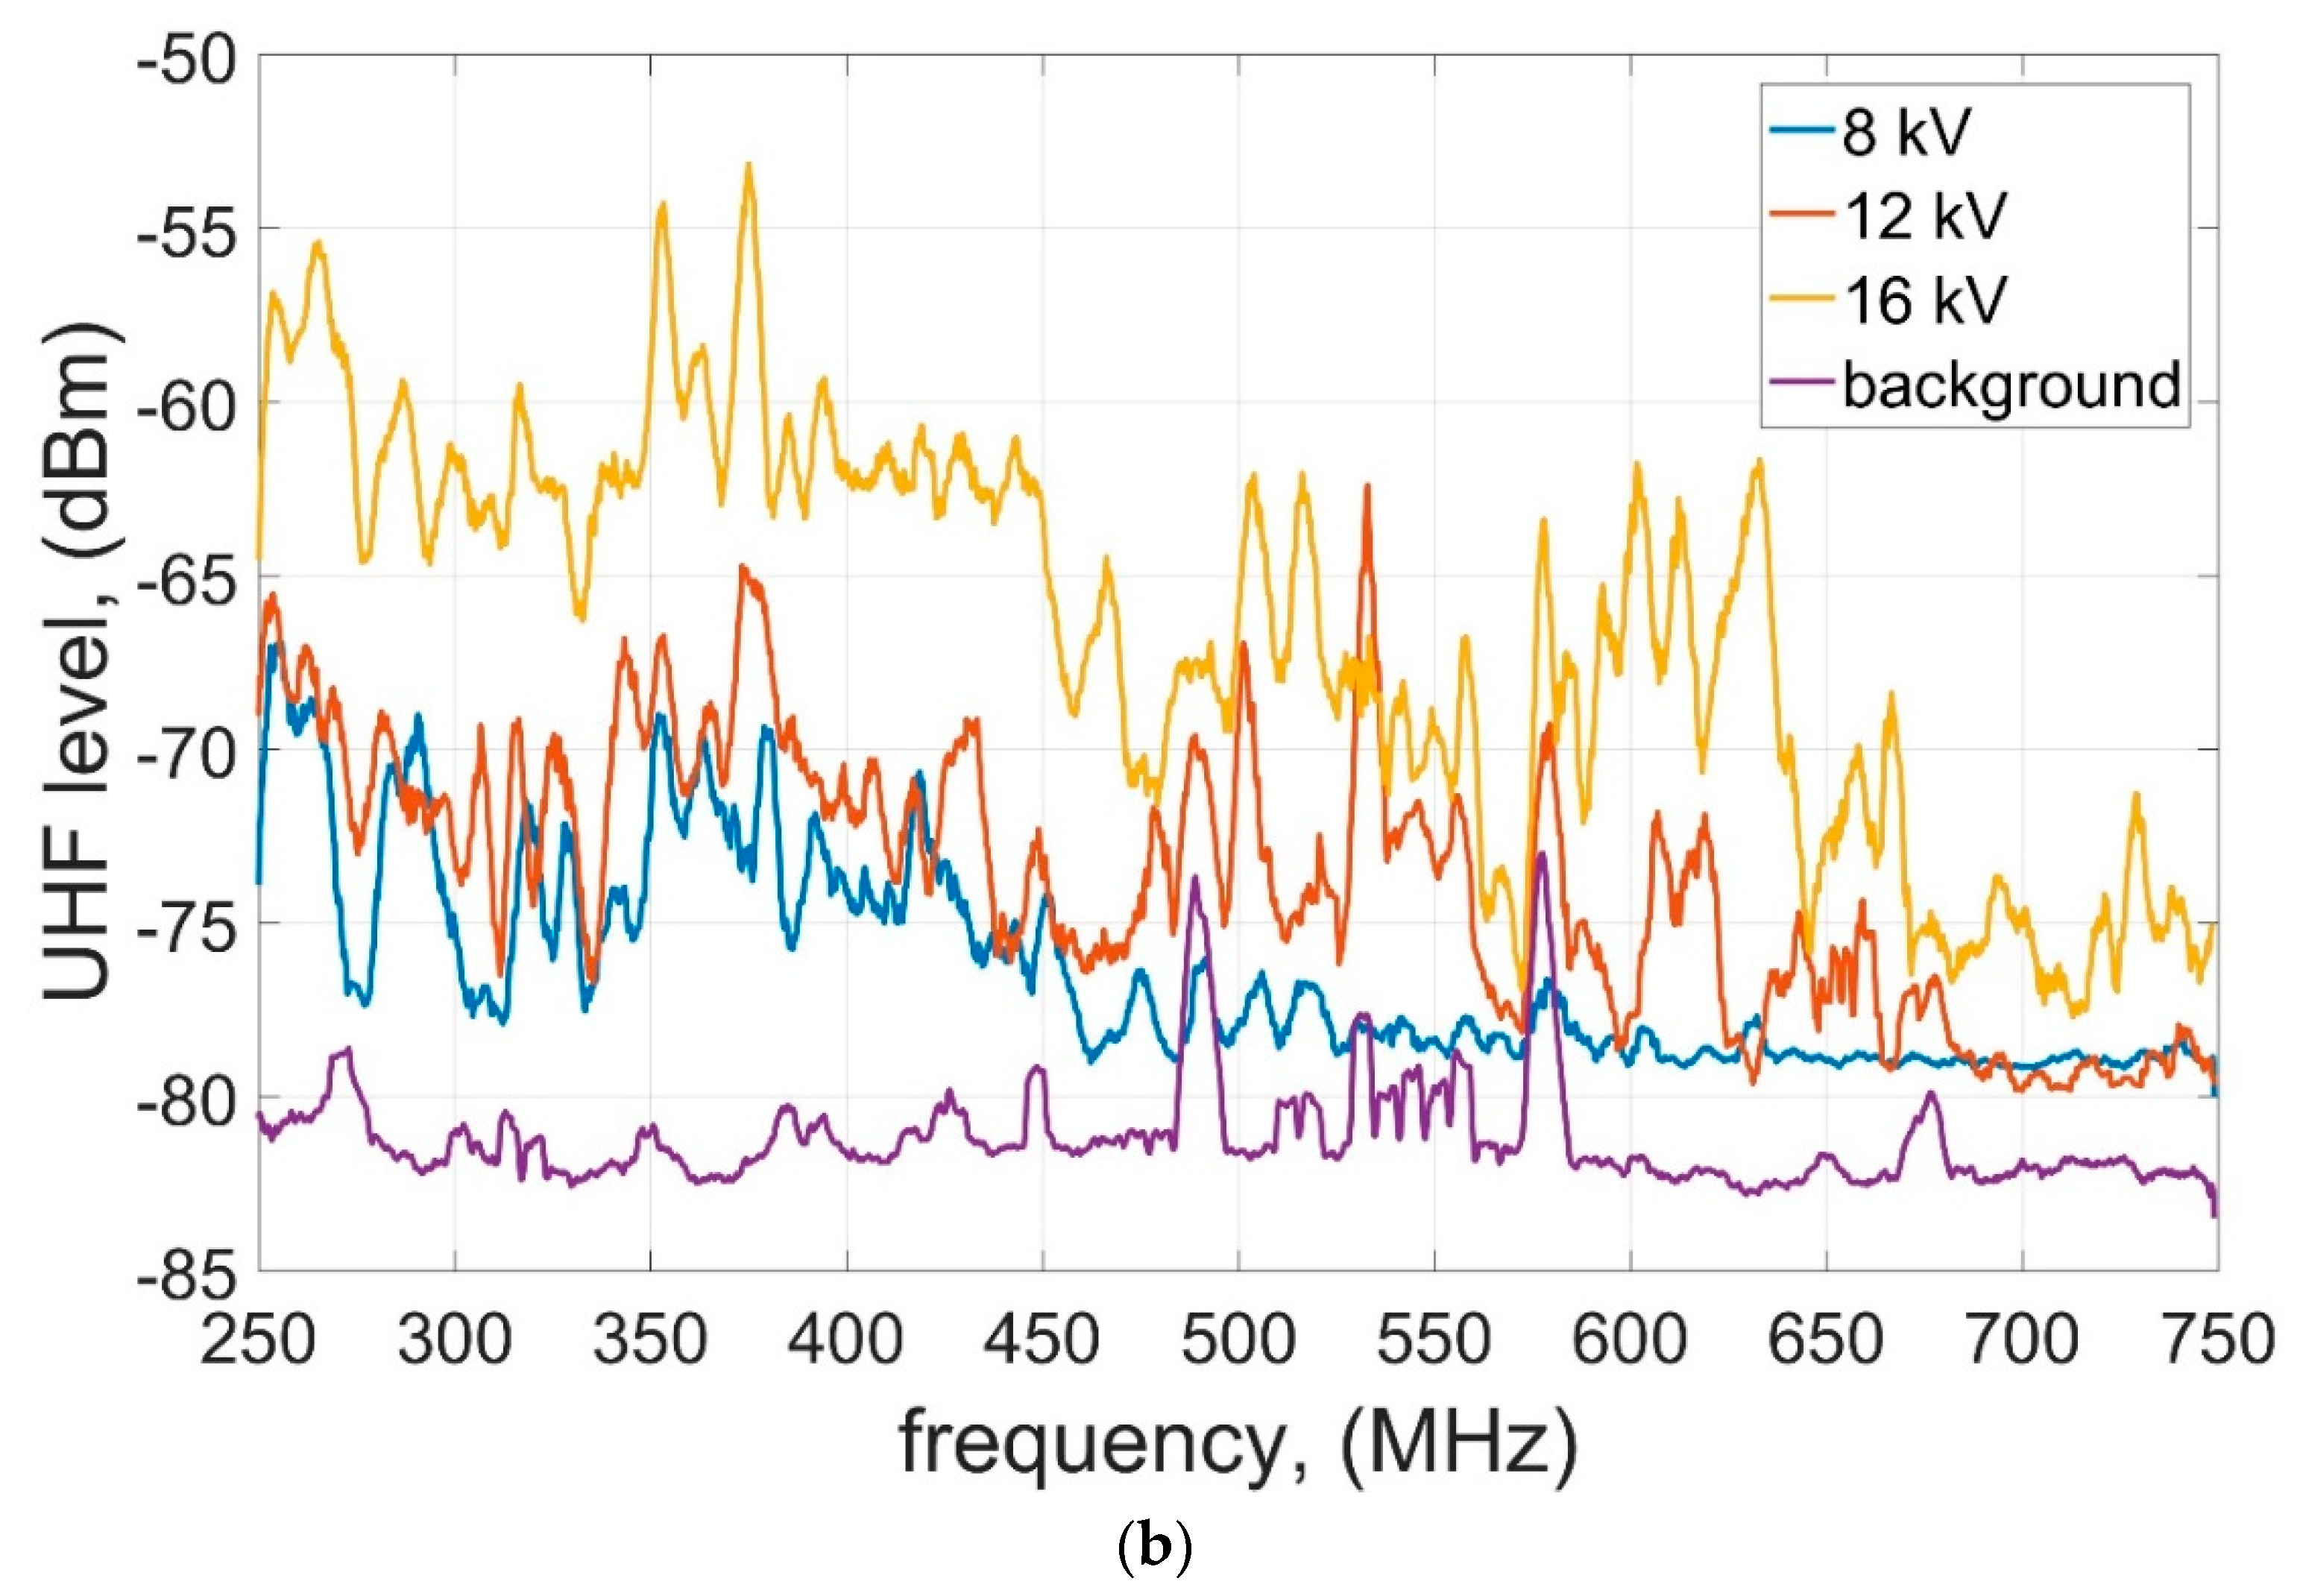
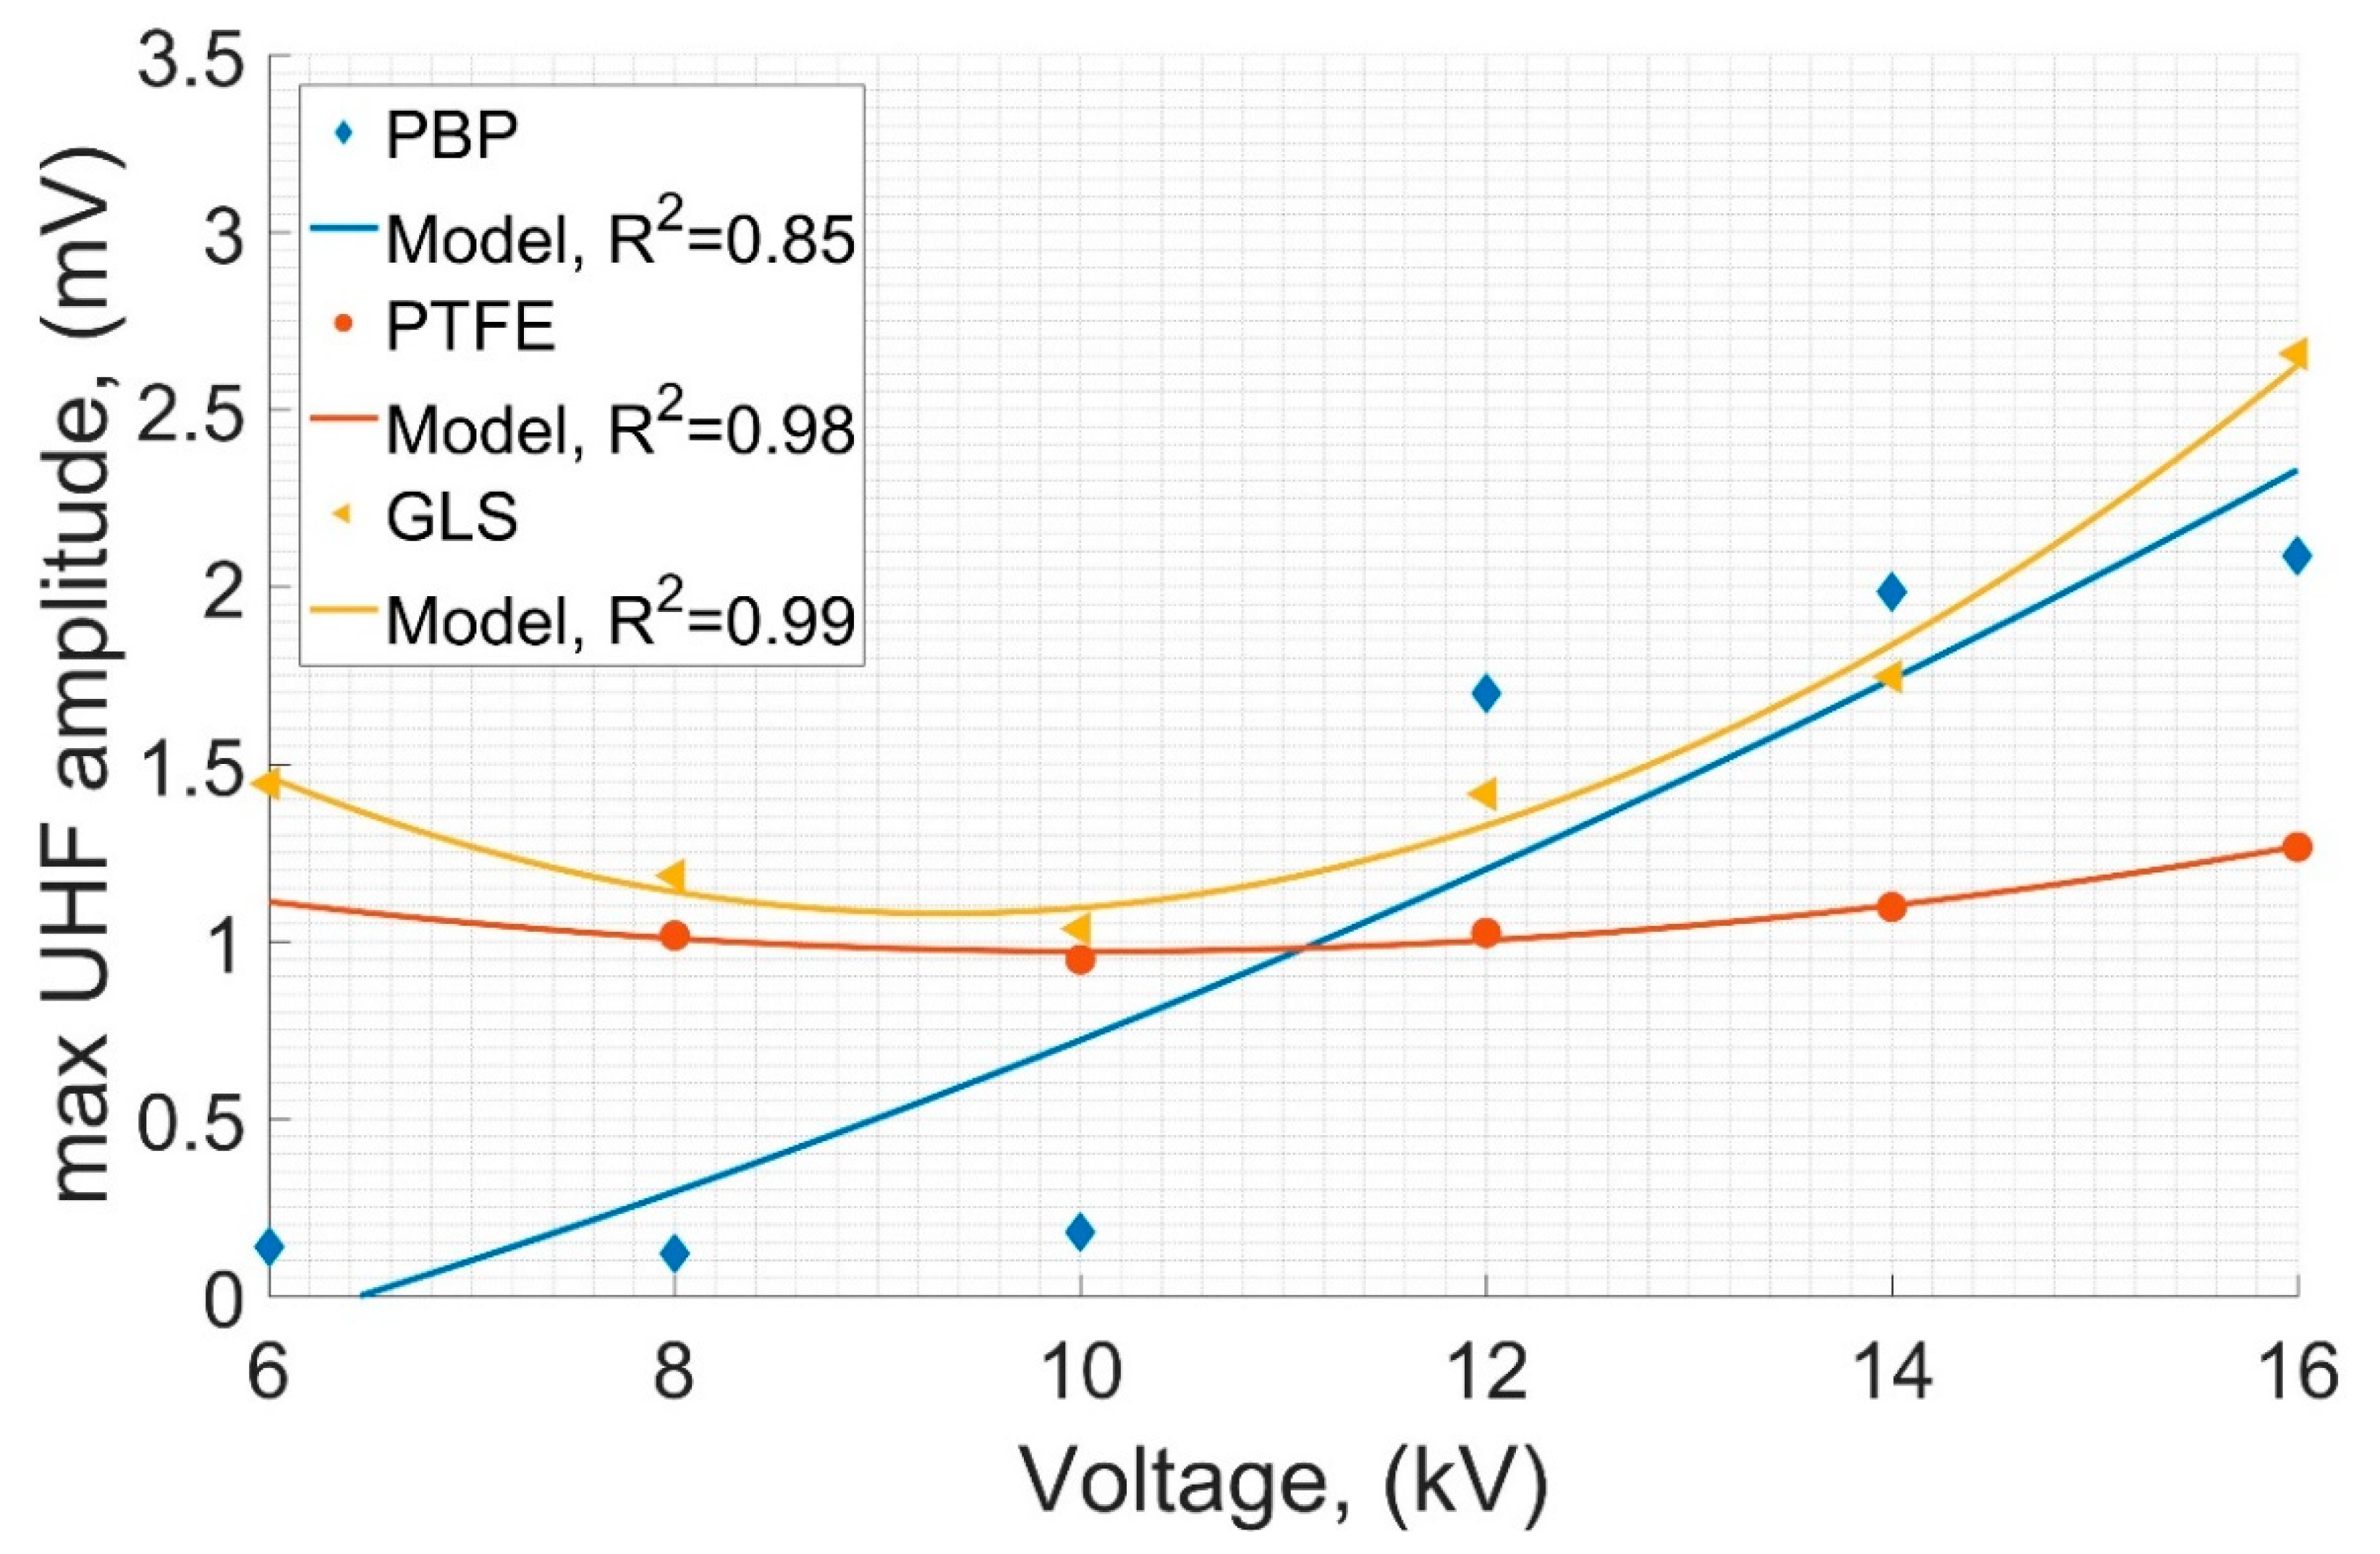
3.1. UHF Measurements
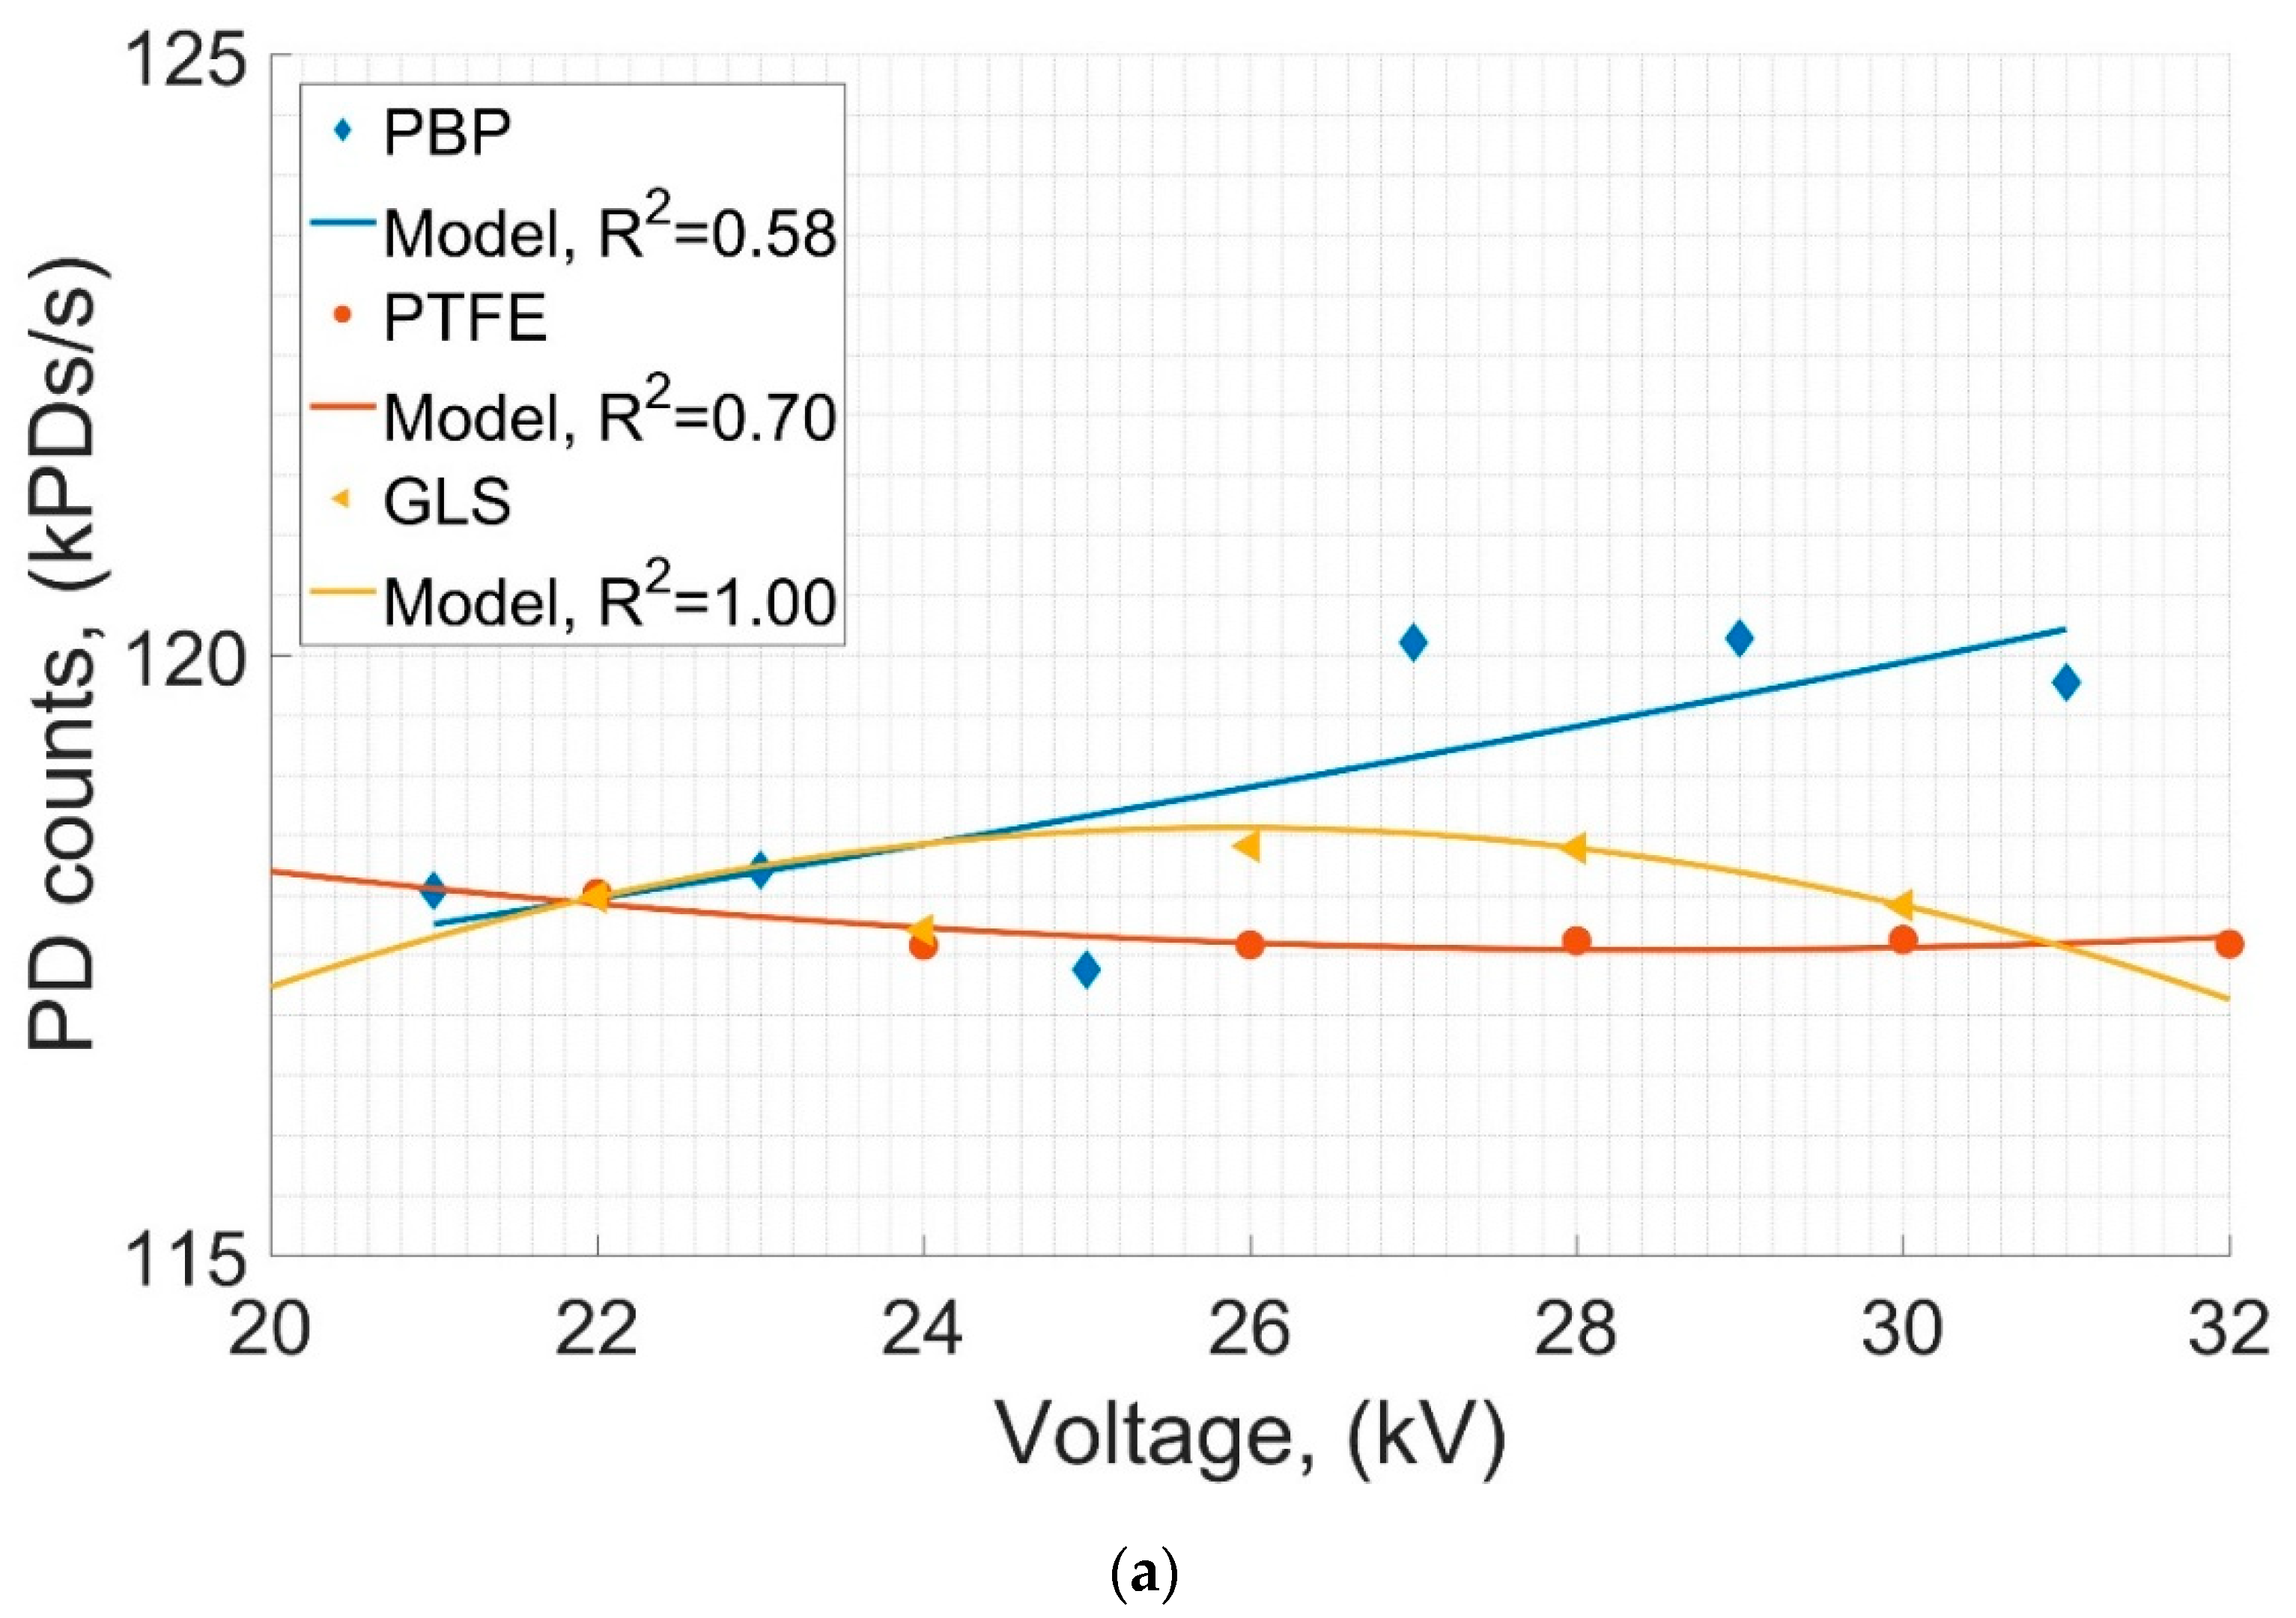
3.1.1. Measurements in the Insulating Oil
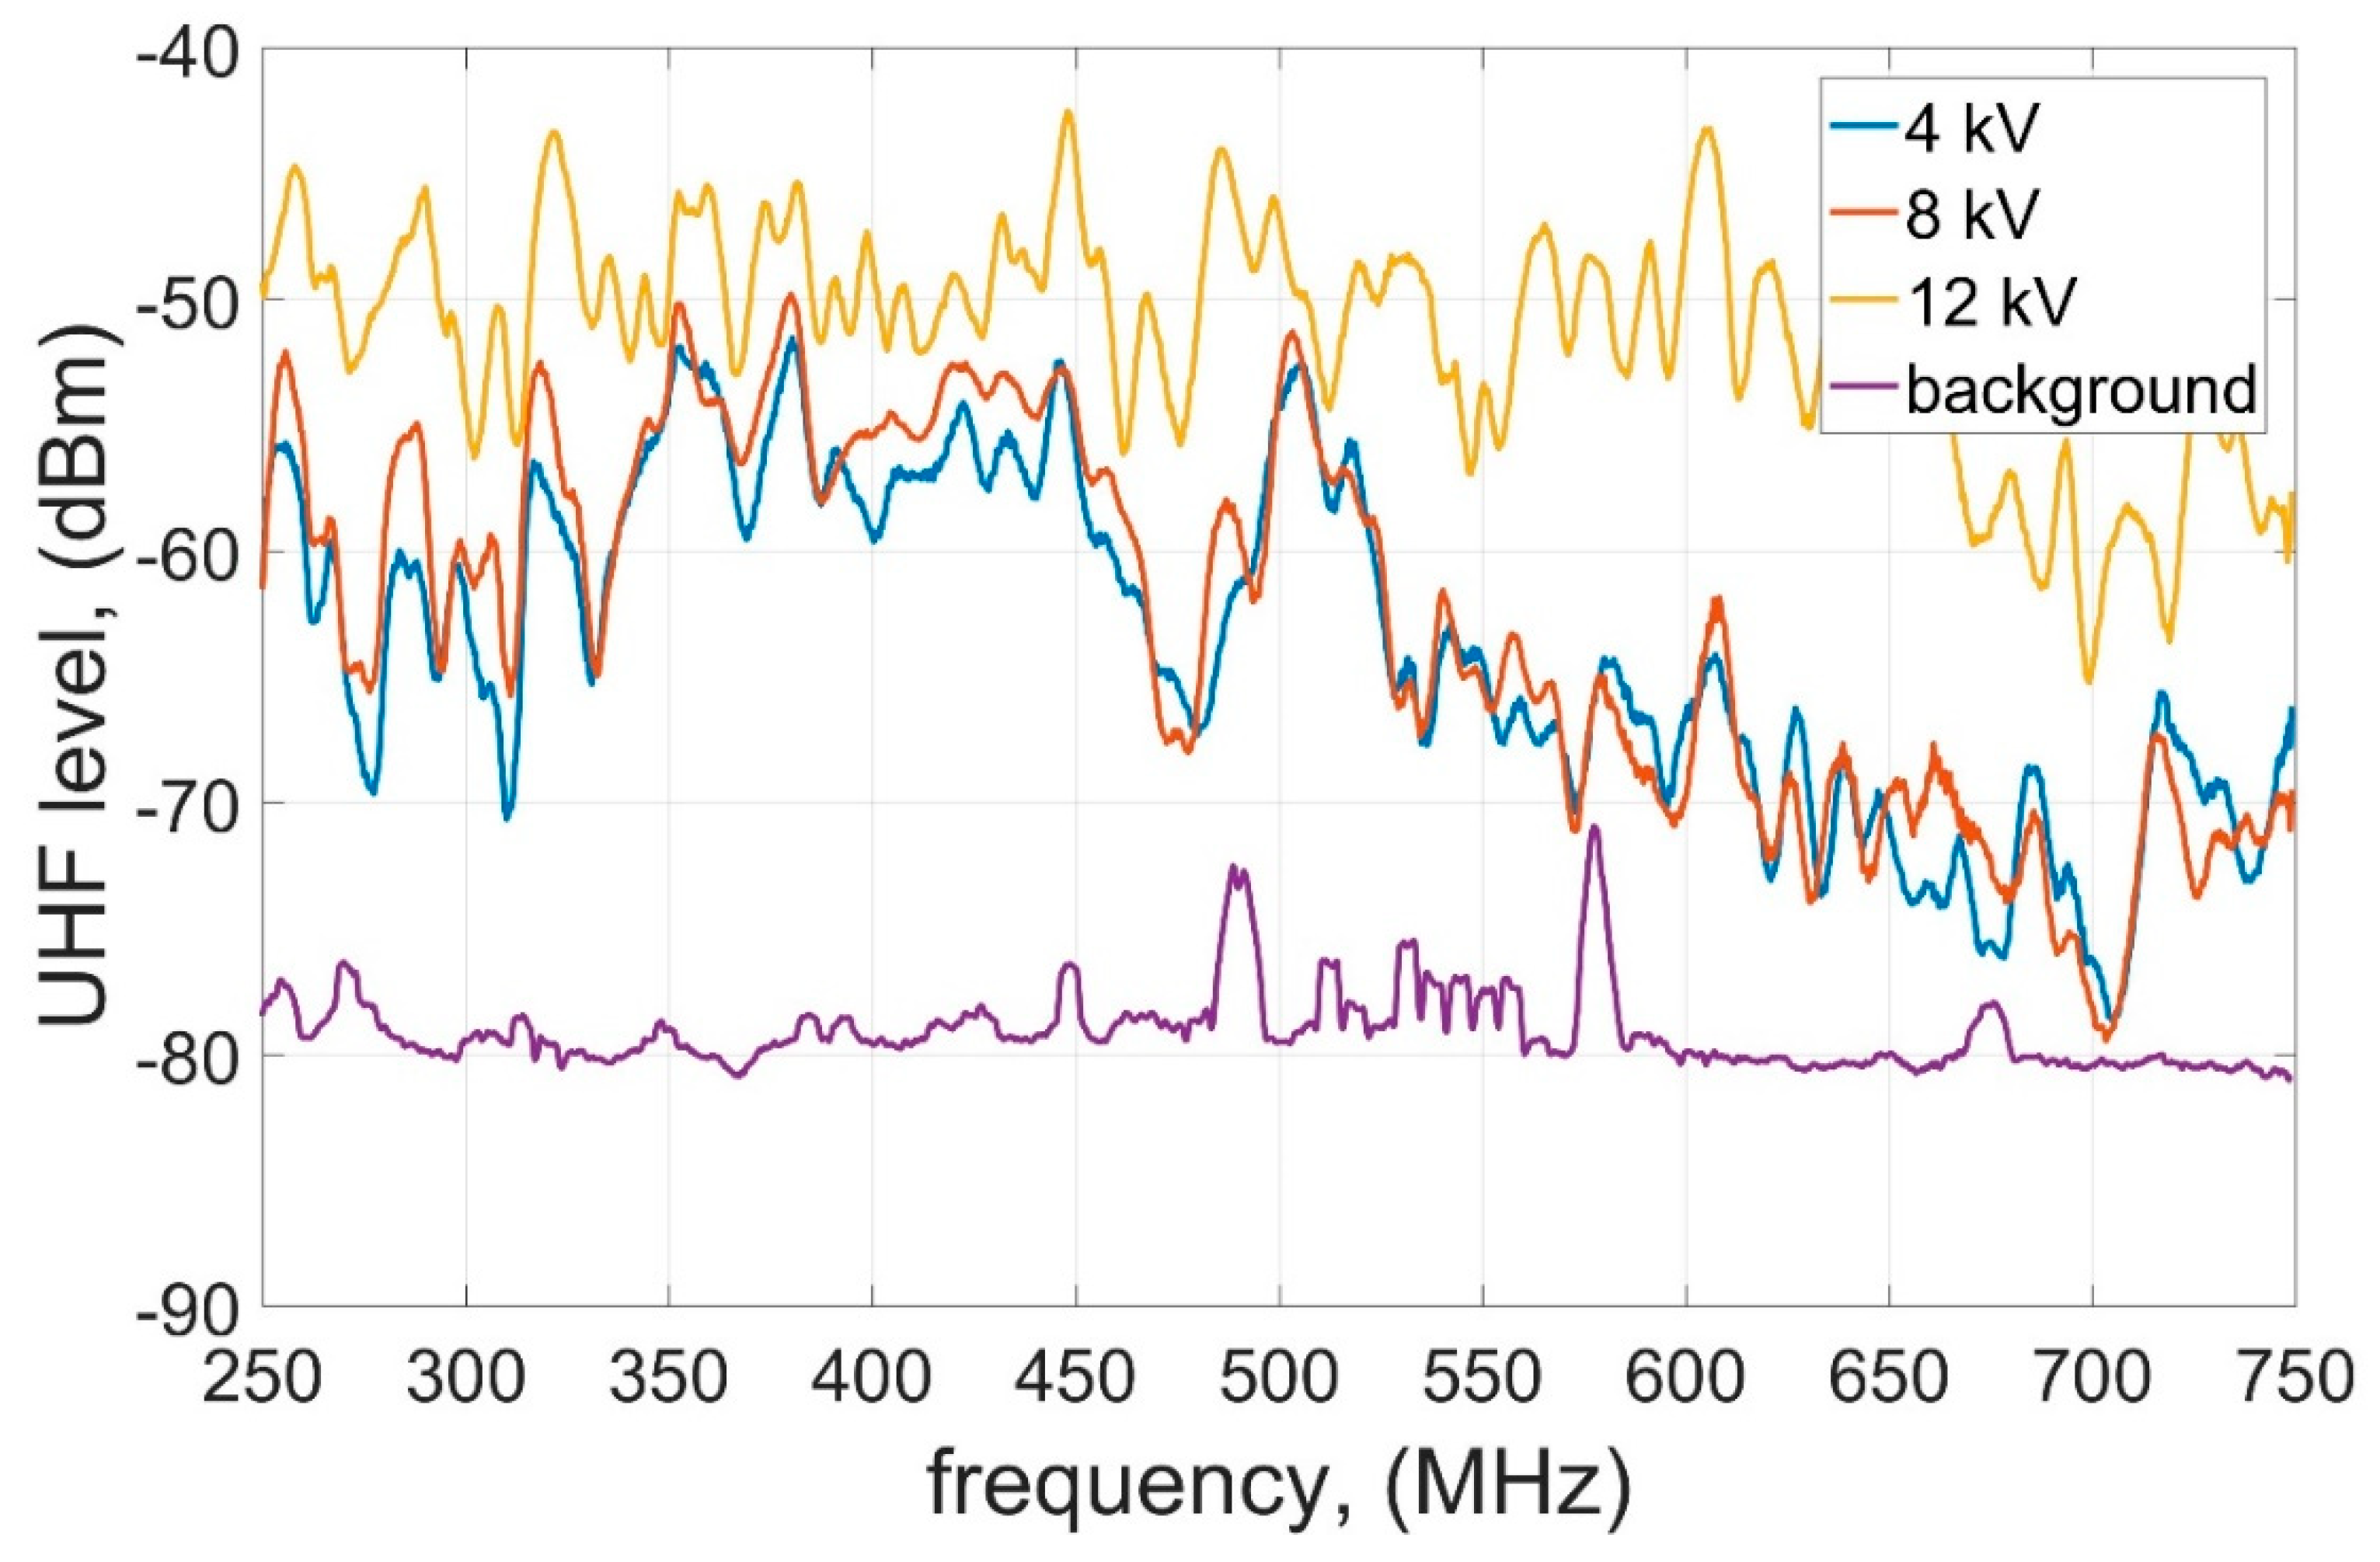
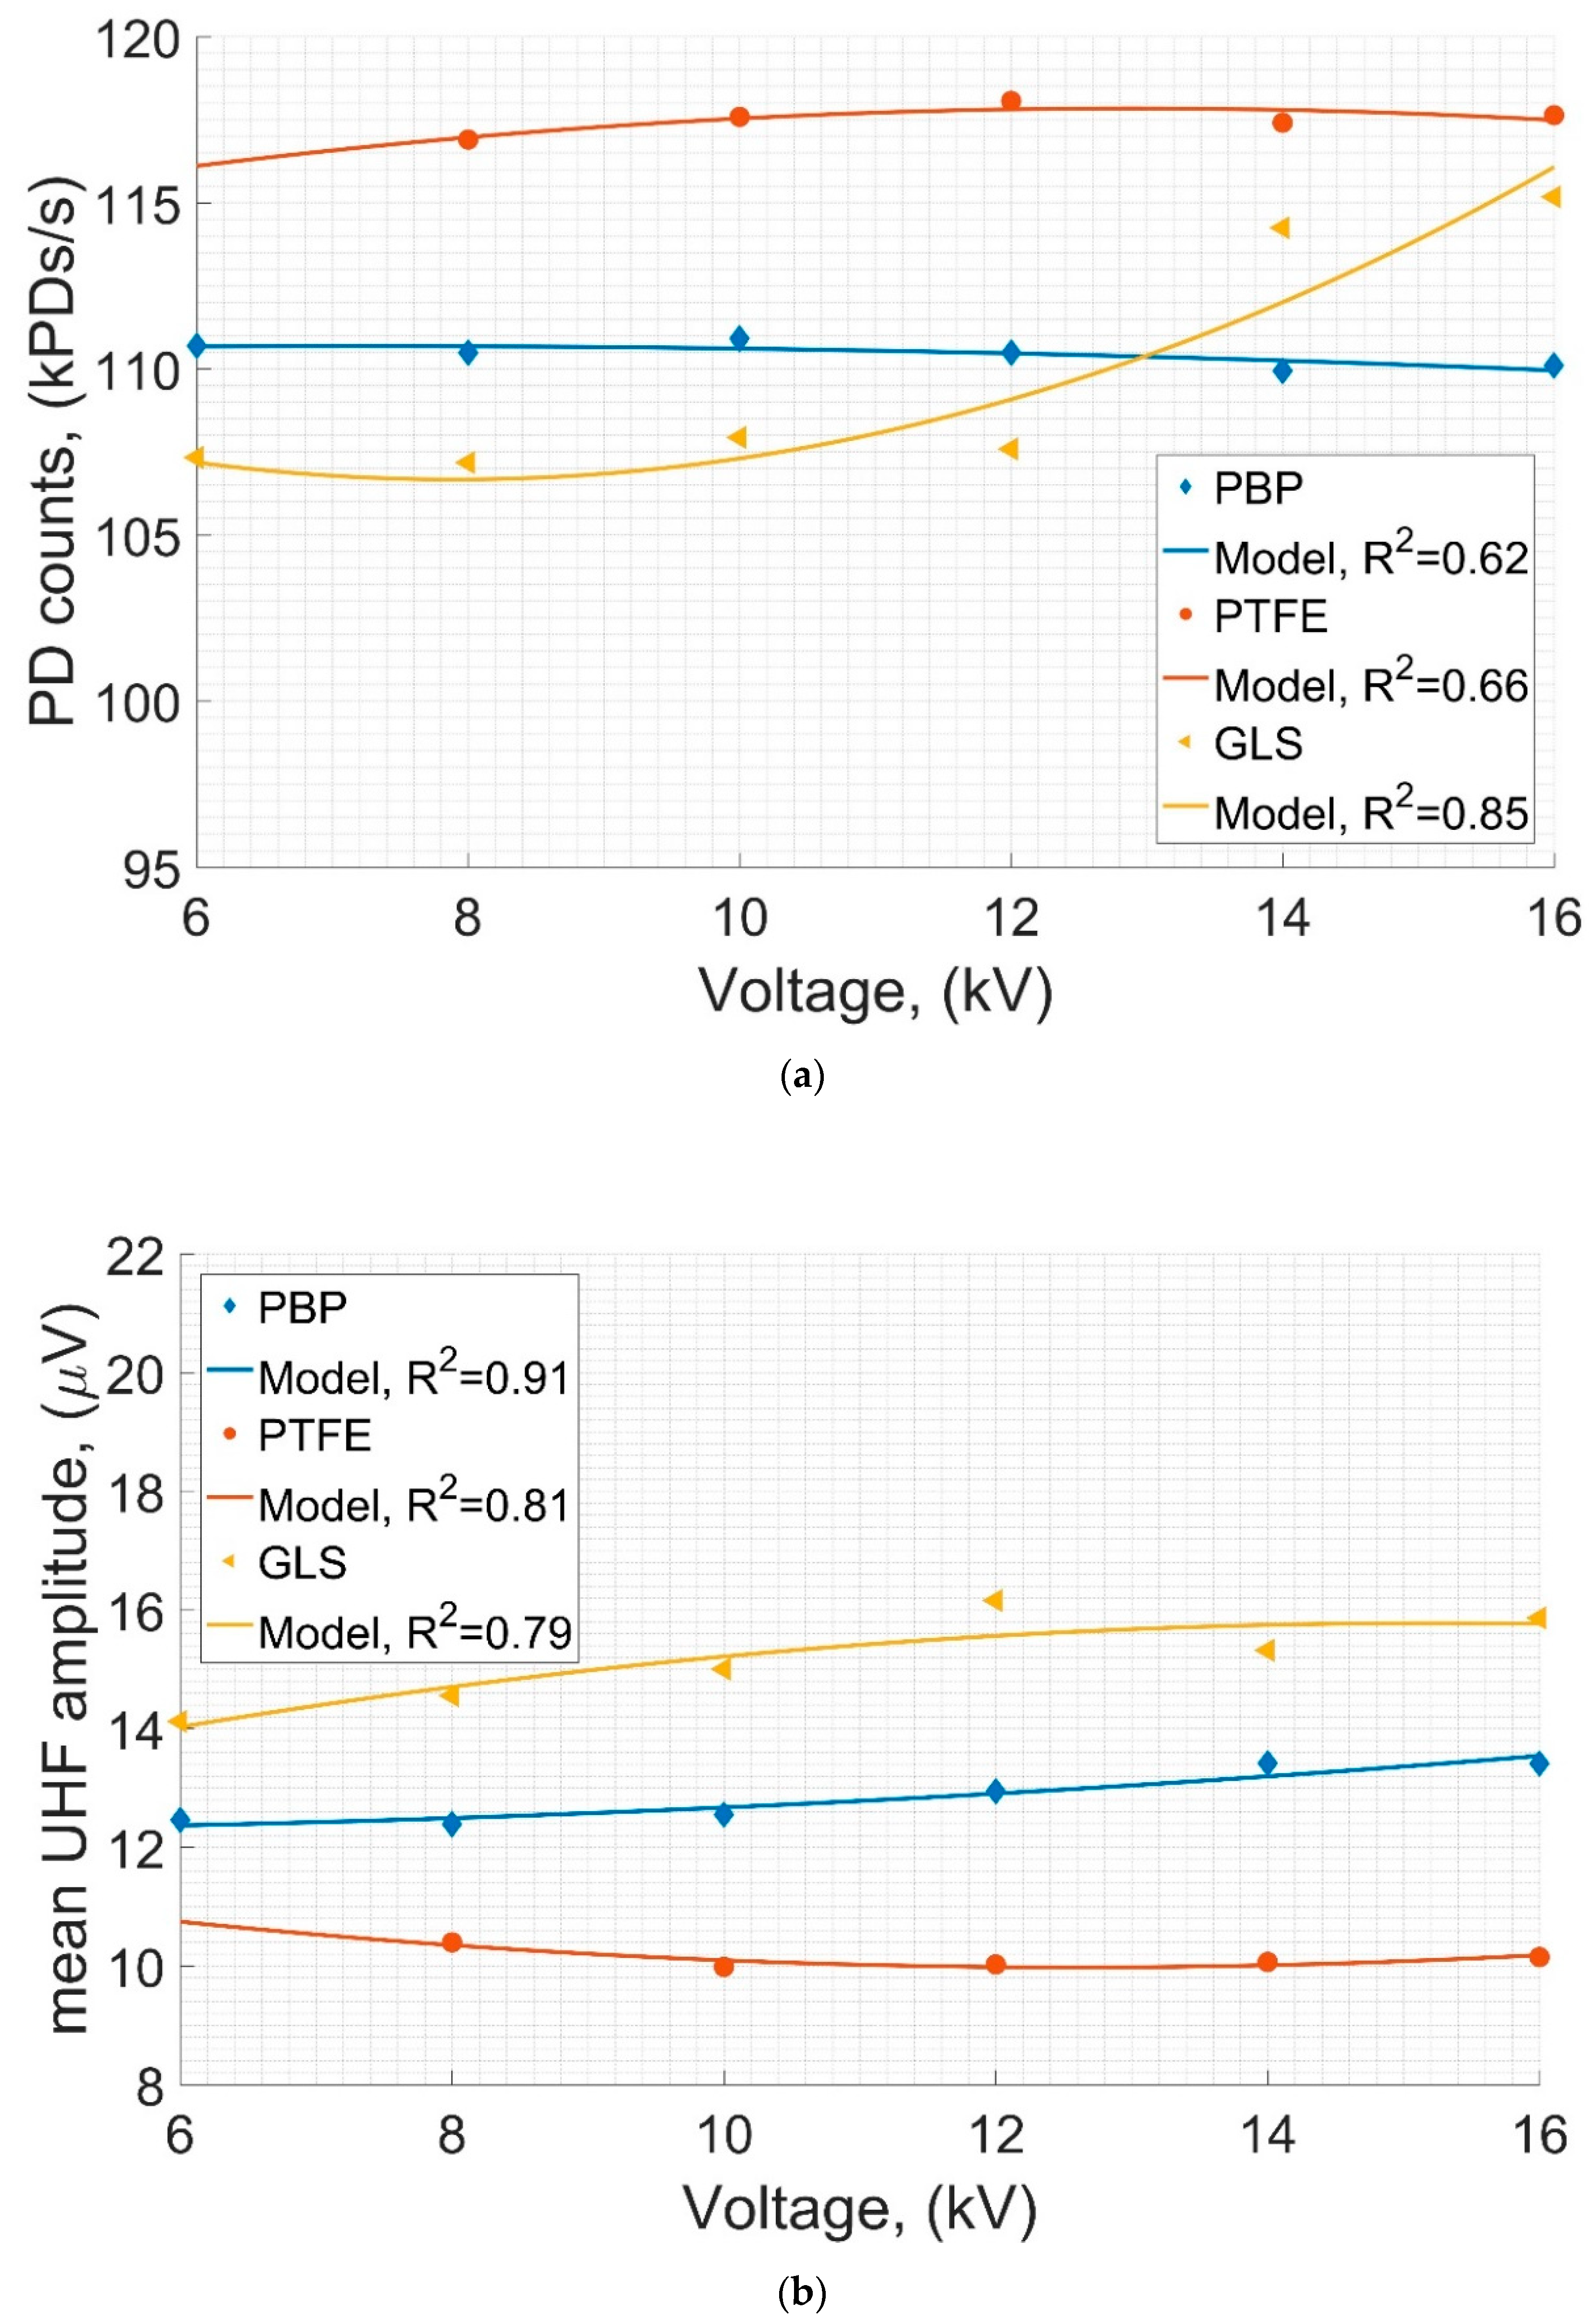
3.1.2. Measurements in Air
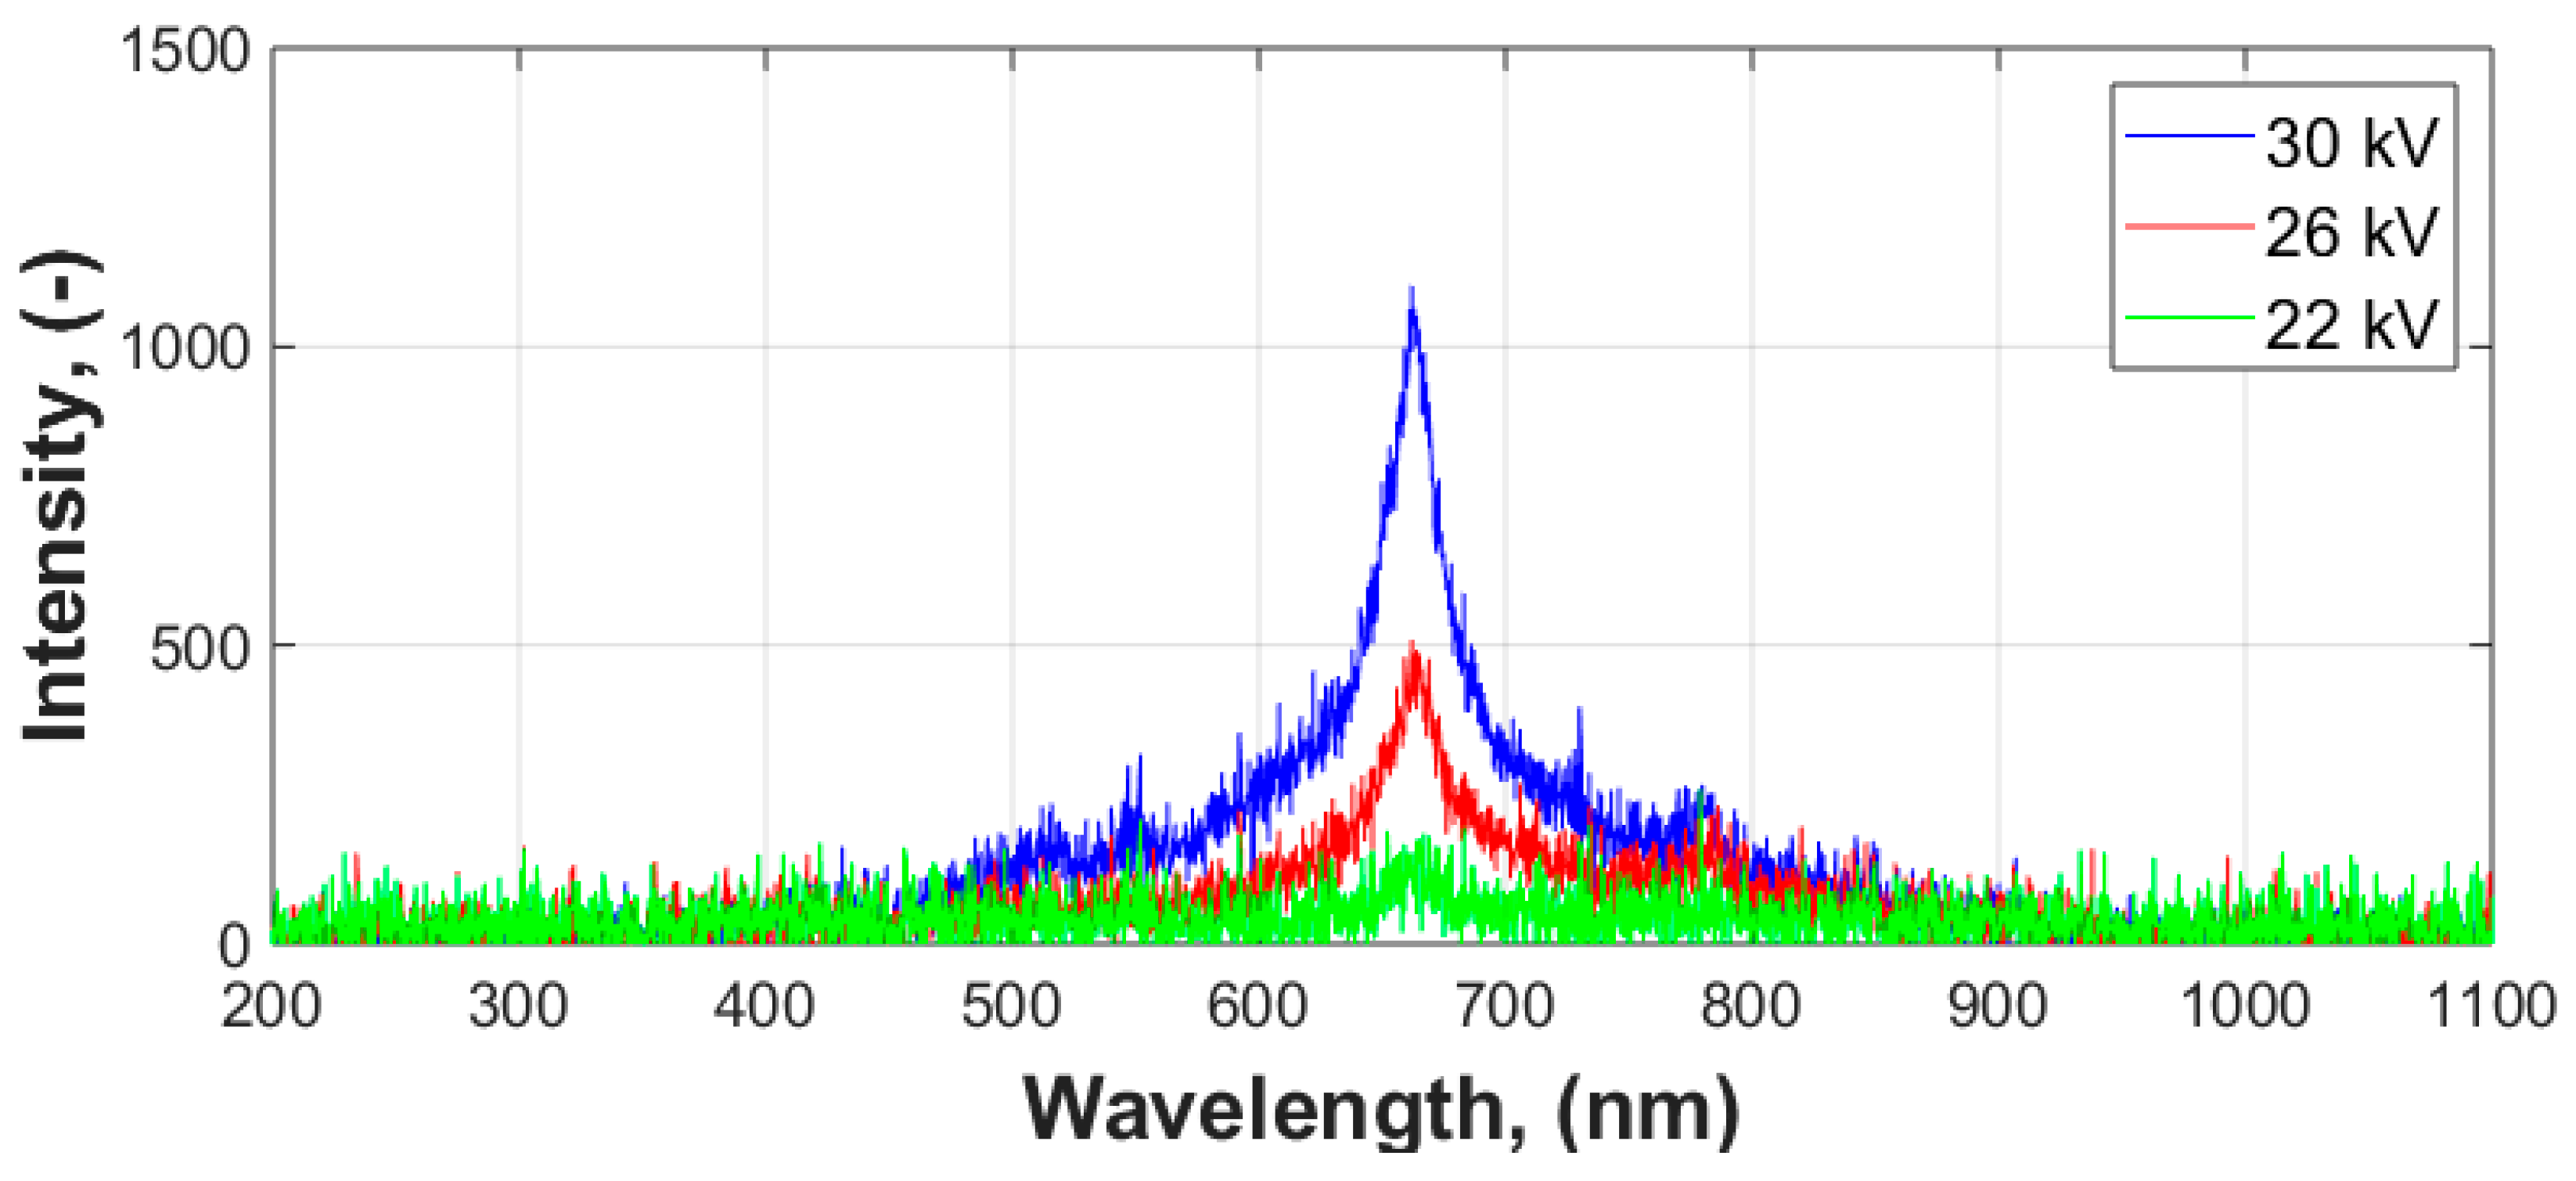
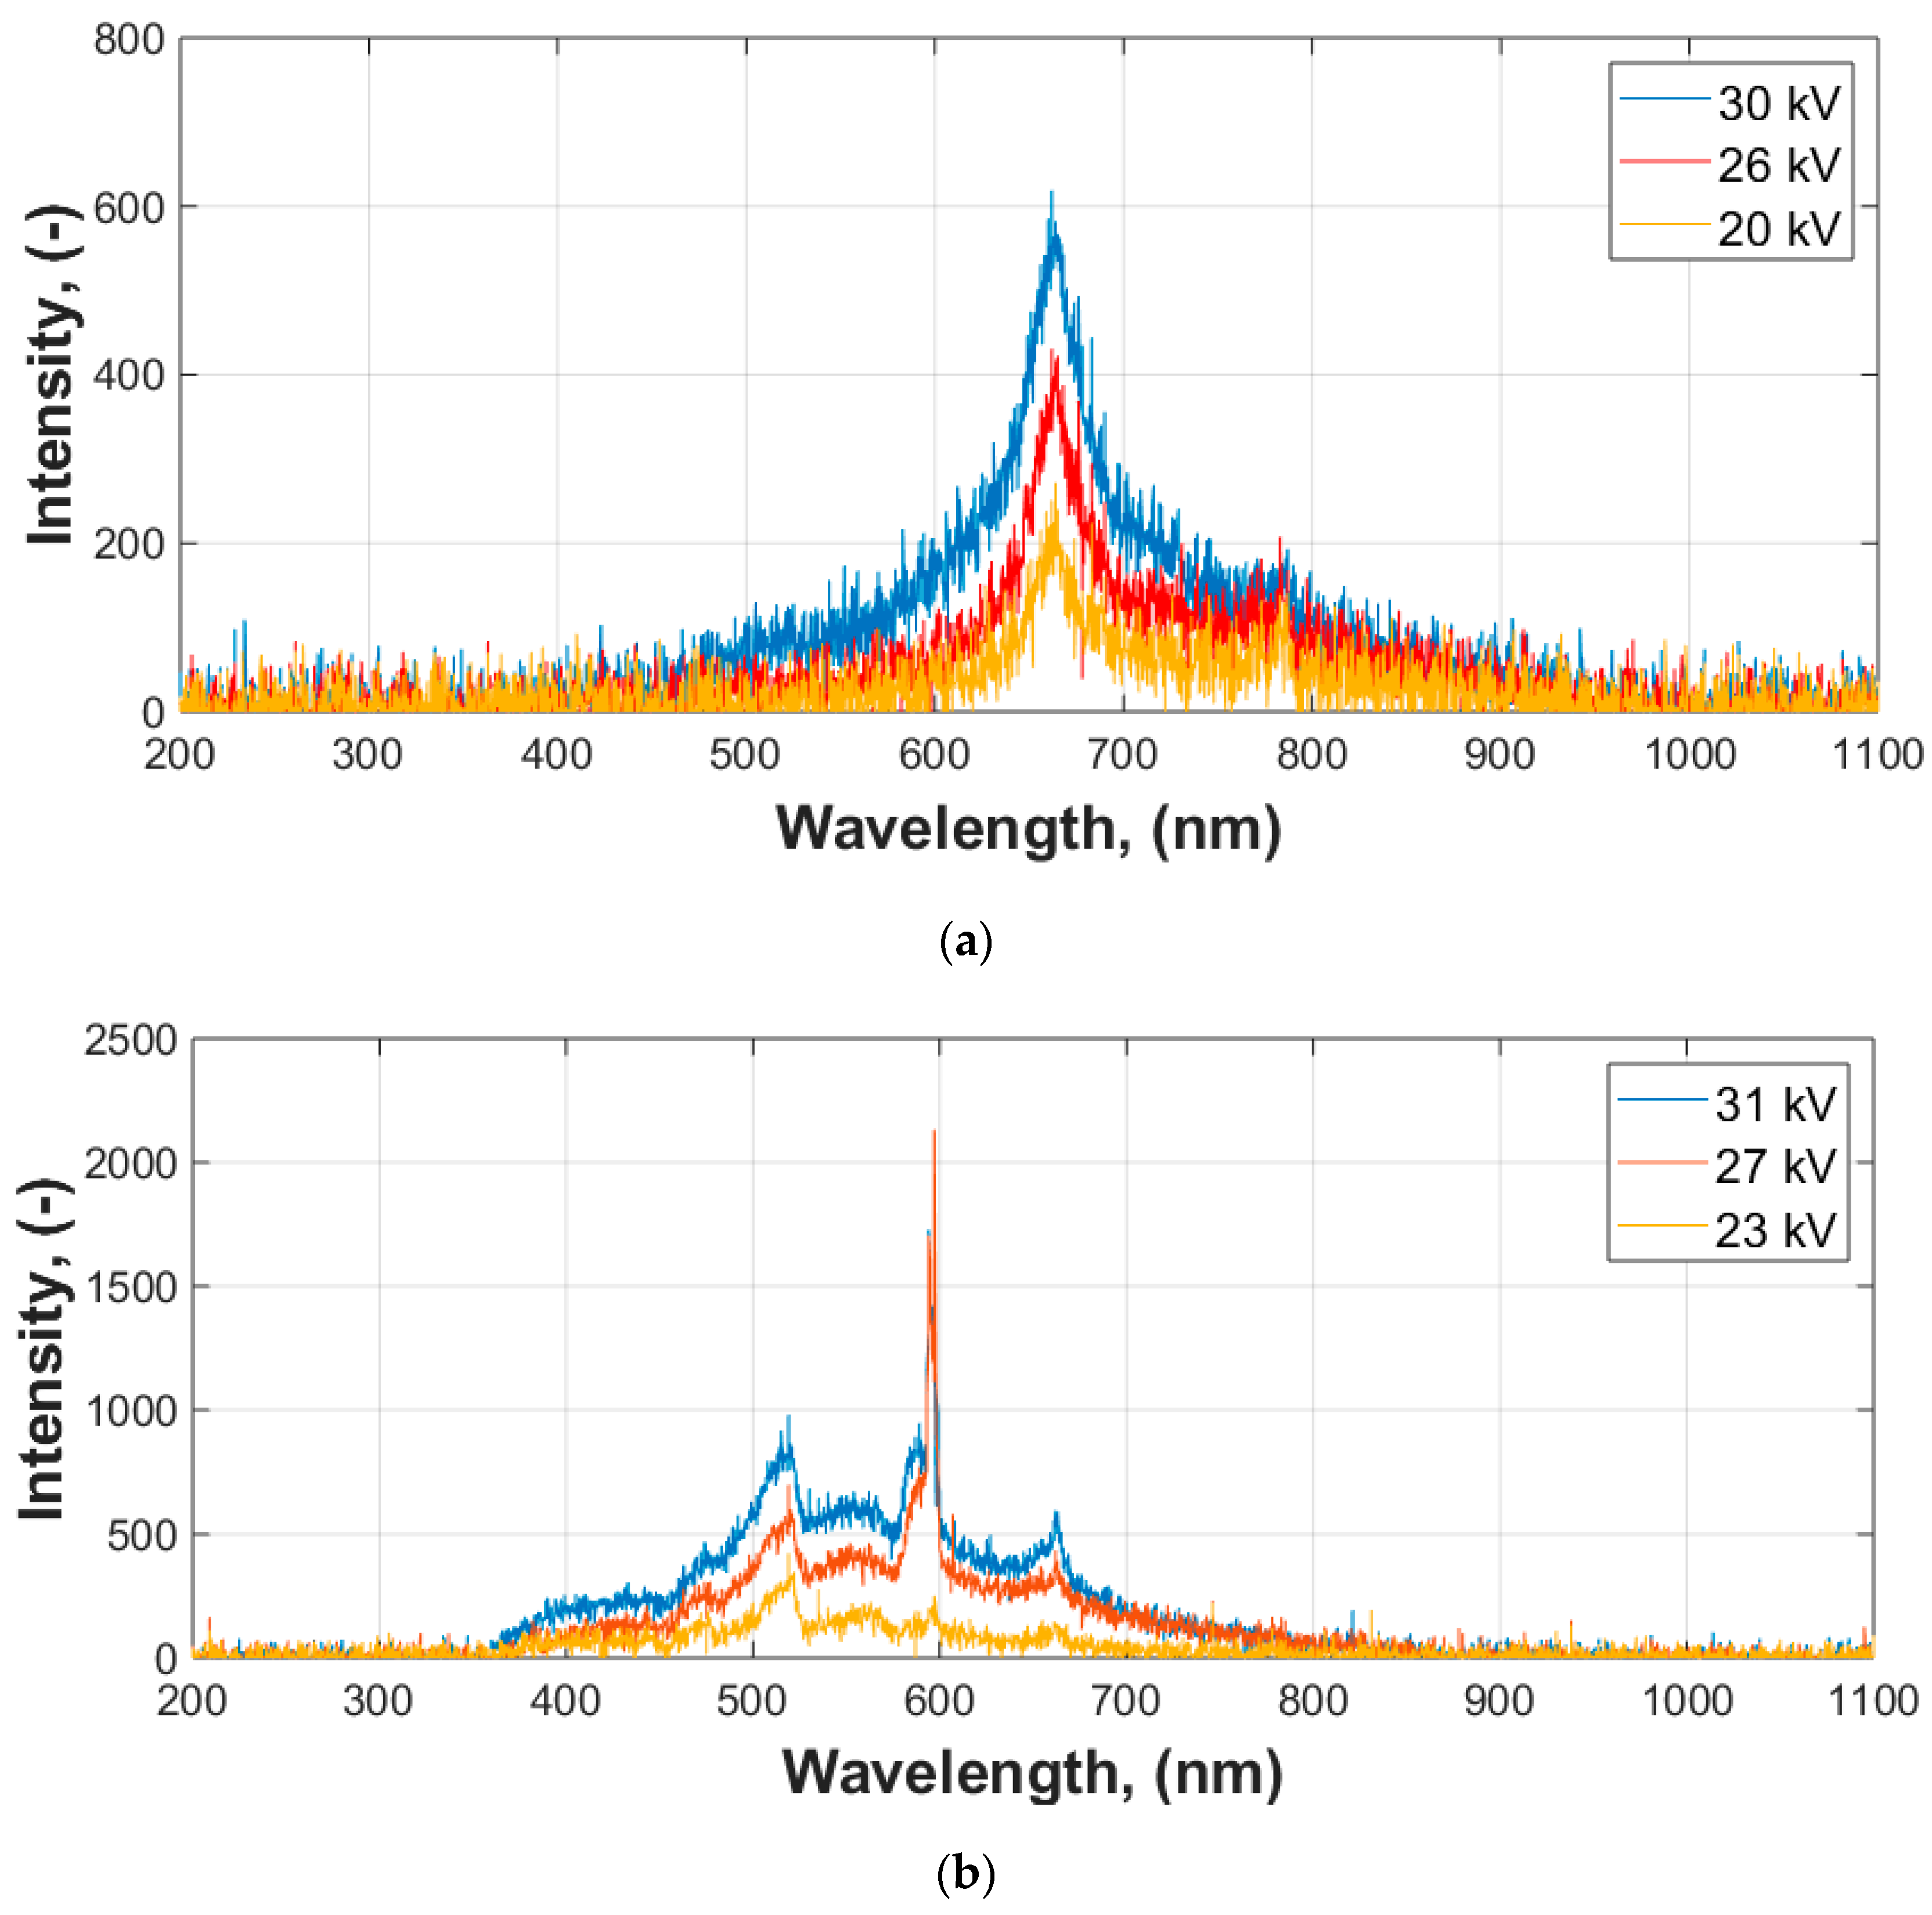
3.2. Optical Spectrophotometry Measurements
3.2.1. Measurements in the Insulating Oil
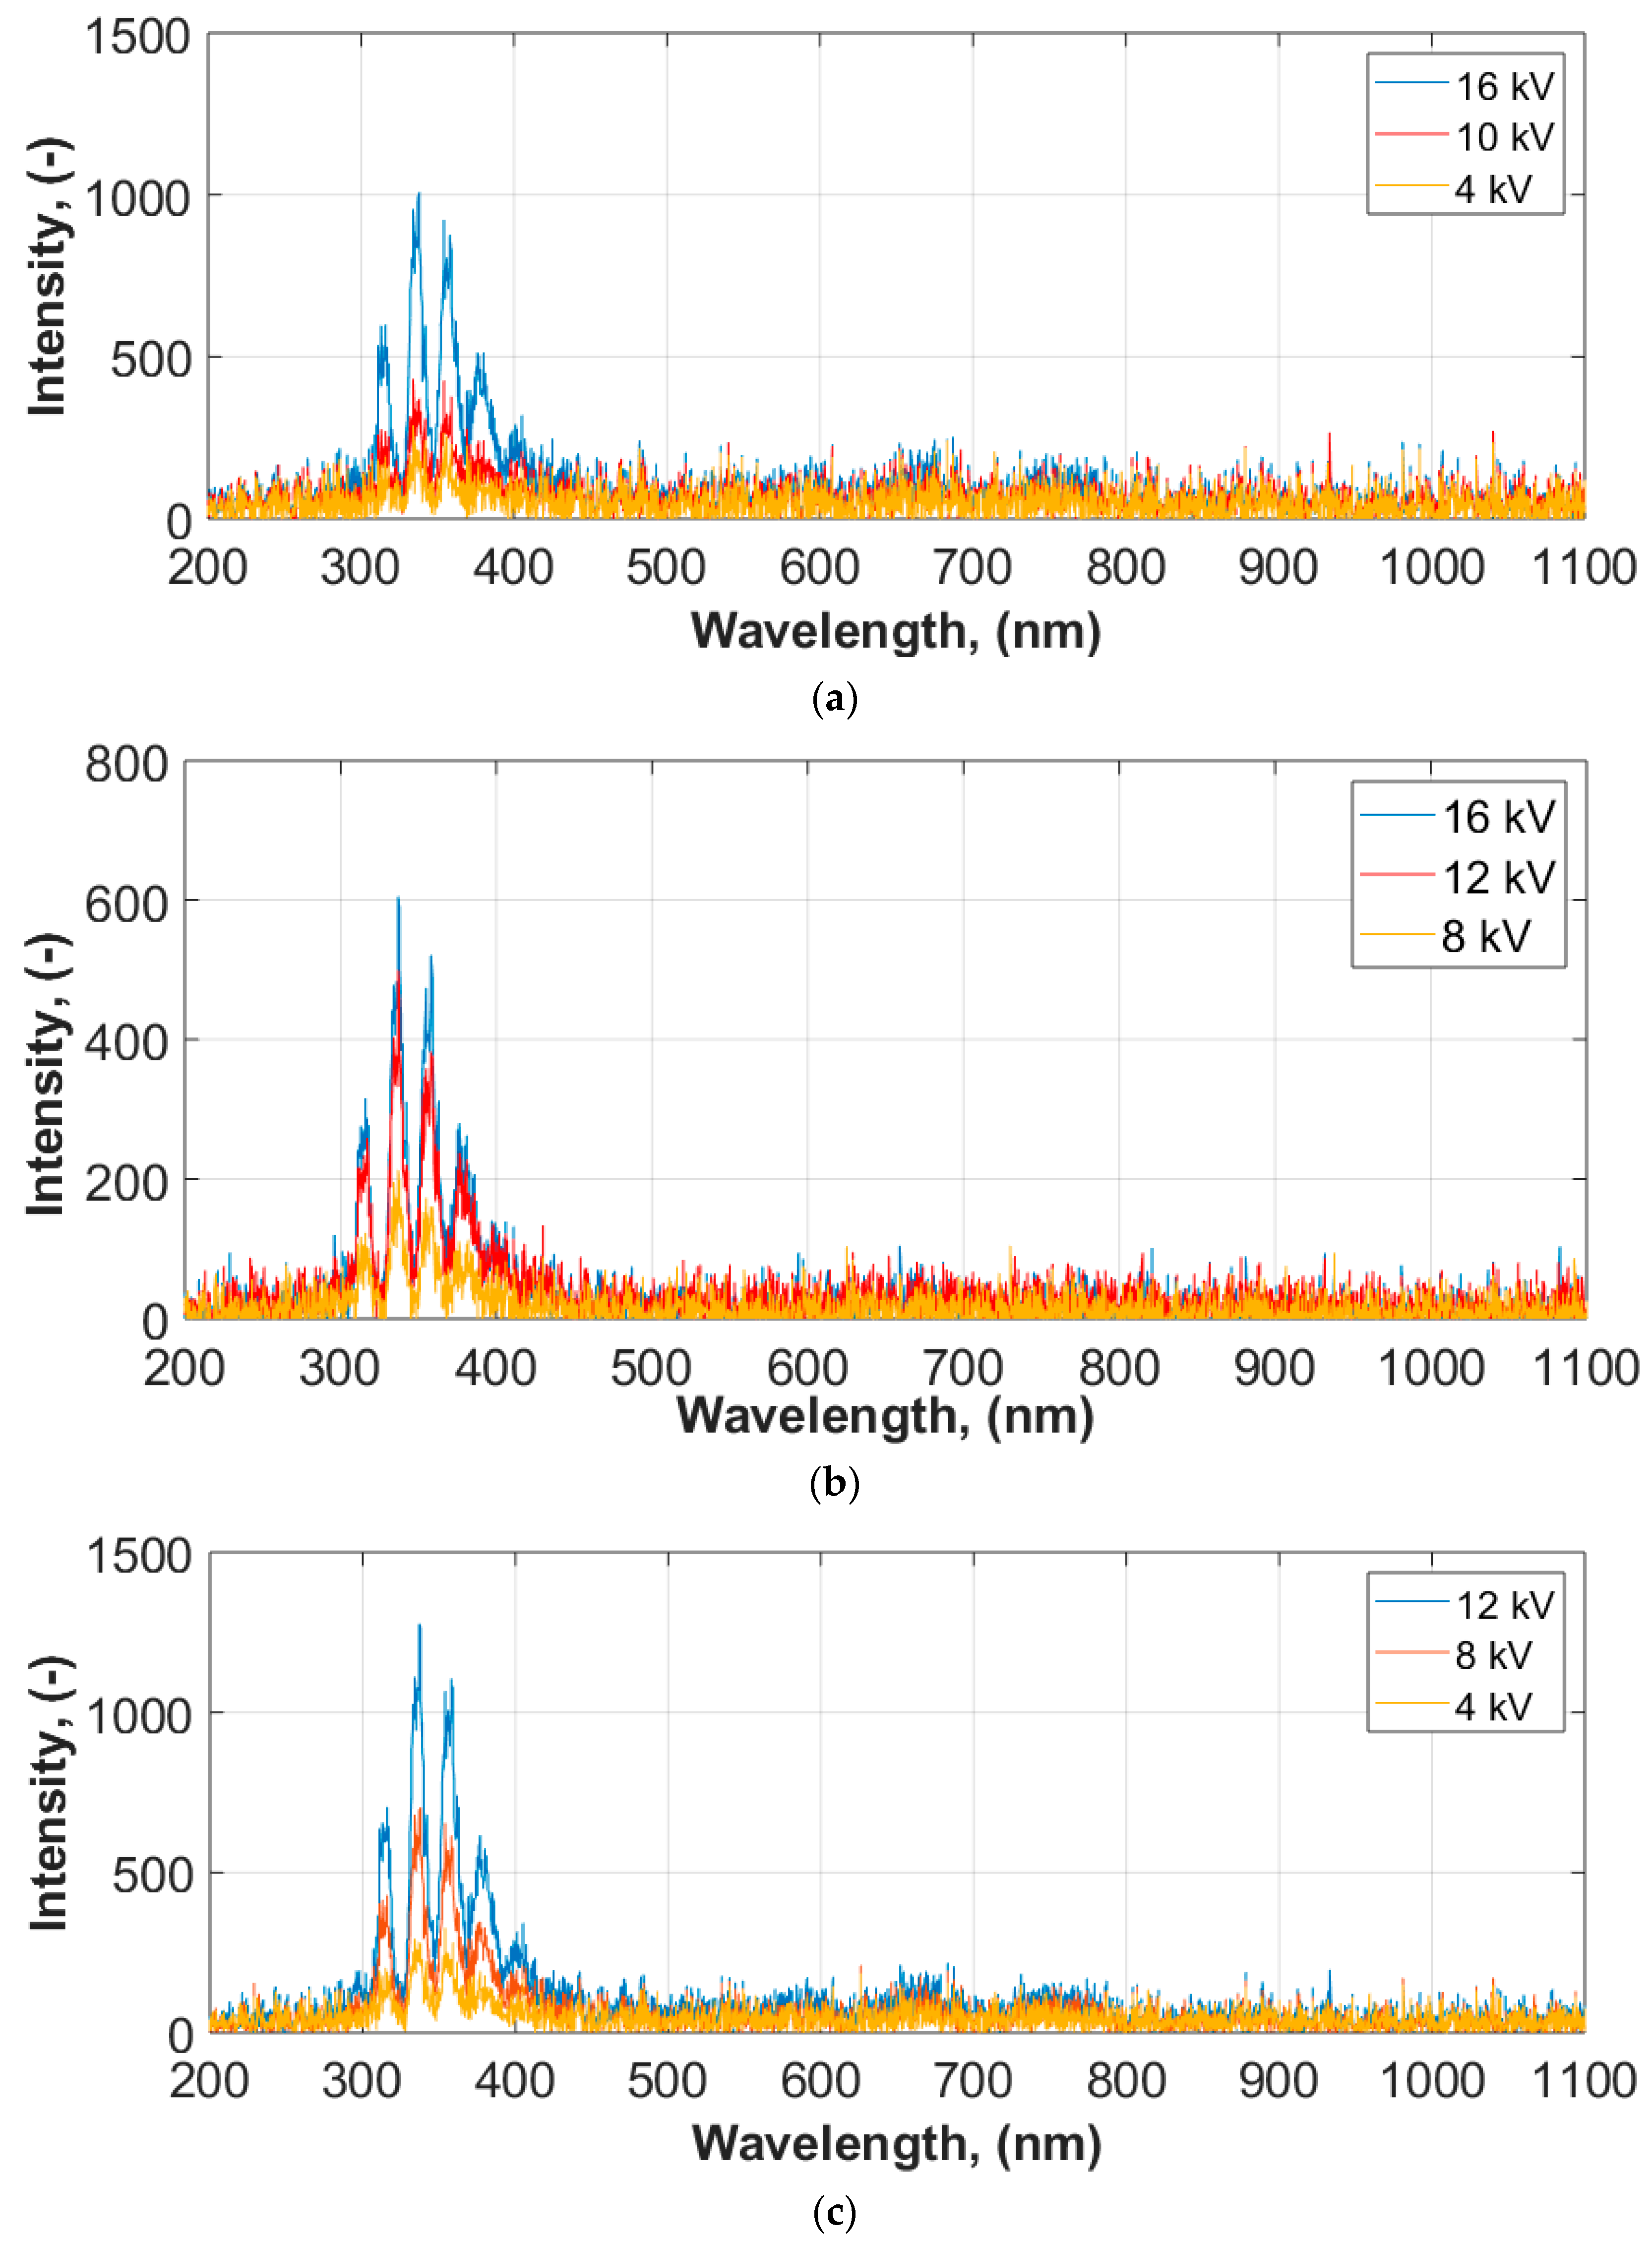
3.2.2. Measurements in the Air
5. Conclusions
Author Contributions
Funding
Conflicts of Interest
References
- Kozioł, M.; Nagi, Ł.; Kunicki, M.; Urbaniec, I. Analysis of Radiation in the UHF and Optical Range Emitted by Surface Partial Discharges. In Proceedings of the 2019 IEEE 19th International Conference on Environment and Electrical Engineering and 2019 IEEE 3rd Industrial and Commercial Power Systems Europe, EEEIC/I and CPS Europe 2019, Genoa, Italy, 11–14 June 2019. [Google Scholar]
- IEEE Recommended Practice for Partial Discharge Measurement in Liquid-Filled Power Transformers and Shunt Reactors; IEEE Std. C57.113; IEEE: Piscataway, NJ, USA, 2010.
- Kunicki, M. Variability of the UHF Signals Generated by Partial Discharges in Mineral Oil. Sensors 2019, 19, 1392. [Google Scholar] [CrossRef] [PubMed]
- Beura, C.P.; Beltle, M.; Tenbohlen, S. Positioning of UHF PD Sensors on Power Transformers Based on the Attenuation of UHF Signals. IEEE Trans. Power Deliv. 2019, 34, 1520–1529. [Google Scholar] [CrossRef]
- Kunicki, M.; Cichon, A. Application of a phase resolved partial discharge pattern analysis for acoustic emission method in high voltage insulation systems diagnostics. Arch. Acoust. 2018, 43, 235–243. [Google Scholar]
- Wotzka, D.; Koziol, M.; Nagi, L.; Urbaniec, I. Experimental analysis of acoustic emission signals emitted by surface partial discharges in various dielectric liquids. In Proceedings of the 2018 IEEE 2nd International Conference on Dielectrics, ICD 2018, Budapest, Hungary, 1–5 July 2018; pp. 1–5. [Google Scholar]
- Jongvilaikasem, K.; Maneerot, S.; Jariyanurat, K.; Pattanadech, N. Comparison of Dissolved Gases in Natural Ester under Partial Discharges. In Proceedings of the 2019 IEEE 20th International Conference on Dielectric Liquids (ICDL), Roma, Italy, 23–27 June 2019; pp. 1–4. [Google Scholar]
- Dincer, S.; Duzkaya, H.; Tezcan, S.S.; Dincer, M.S. Analysis of Insulation and Environmental Properties of Decomposition Products in SF6-N2 Mixtures in the Presence of H2O. In Proceedings of the 2019 IEEE International Conference on Environment and Electrical Engineering and 2019 IEEE Industrial and Commercial Power Systems Europe (EEEIC/I CPS Europe), Genova, Italy, 11–14 June 2019; pp. 1–6. [Google Scholar]
- Koziol, M.; Nagi, L. Analysis of Optical Radiation Spectra Emitted by Electrical Discharges, Generated by Different Configuration Types of High Voltage Electrodes. In Proceedings of the 2018 IEEE 2nd International Conference on Dielectrics, ICD 2018, Budapest, Hungary, 1–5 July 2018; pp. 1–4. [Google Scholar]
- Baug, A.; Choudhury, N.R.; Ghosh, R.; Dalai, S.; Chatterjee, B. Identification of single and multiple partial discharge sources by optical method using mathematical morphology aided sparse representation classifier. IEEE Trans. Dielectr. Electr. Insul. 2017, 24, 3703–3712. [Google Scholar] [CrossRef]
- Karmakar, S.; Meshram, S.; Kalathiripi, H. Evaluation of Partial Discharge Aged Transformer Oil Using Optical Spectroscopy Techniques. In Proceedings of the 2019 International Conference on High Voltage Engineering and Technology (ICHVET), Hyderabad, India, 7–8 February 2019; pp. 1–5. [Google Scholar]
- Kozioł, M.; Boczar, T.; Nagi, L. Identification of electrical discharges forms, generated in insulating oil, using the optical spectrophotometry method. IET Sci. Meas. Technol. 2019, 13, 416–425. [Google Scholar] [CrossRef]
- Ma, G.; Zhou, H.; Zhang, M.; Li, C.; Yin, Y.; Wu, Y. A High Sensitivity Optical Fiber Sensor for GIS Partial Discharge Detection. IEEE Sens. J. 2019, 19, 9235–9243. [Google Scholar] [CrossRef]
- Siegel, M.; Coenen, S.; Beltle, M.; Tenbohlen, S.; Weber, M.; Fehlmann, P.; Hoek, S.M.; Kempf, U.; Schwarz, R.; Linn, T. Calibration Proposal for UHF Partial Discharge Measurements at Power Transformers. Energies 2019, 12, 3058. [Google Scholar] [CrossRef]
- Nagi, Ł.; Kozioł, M.; Wotzka, D. Analysis of the spectrum of electromagnetic radiation generated by electrical discharges. IET Sci. Meas. Technol. 2019, 13, 812–817. [Google Scholar] [CrossRef]
- Shin, J.; Kim, S.; Kim, E.; Jo, H.; Sample, A.V. Partial Discharge Induction with X-rays to Detect Void Defects in Solid Insulating Materials. In Proceedings of the 2018 Condition Monitoring and Diagnosis (CMD), Perth, Australia, 23–26 September 2018; pp. 2–4. [Google Scholar]
- Rozga, P.; Stanek, M.; Rapp, K. Lightning properties of selected insulating synthetic esters and mineral oil in point-to-sphere electrode system. IEEE Trans. Dielectr. Electr. Insul. 2018, 25, 1699–1705. [Google Scholar] [CrossRef]
- Pasternak, B.; Rózga, P.; Rapp, K. Influence of Location of Pressboard Barrier on the Development of Electrical Discharges in Synthetic Esters and Mineral Oil at Negative LIV. In Proceedings of the 2019 IEEE 20th International Conference on Dielectric Liquids (ICDL), Roma, Italy, 23–27 June 2019; pp. 1–4. [Google Scholar]
- Li, X.; Li, J.; Jiang, T.; Wang, Y.; Huang, Z. Analysis of creeping discharges on oil-impregnated pressboard under combined AC and DC voltages. IEEE Trans. Dielectr. Electr. Insul. 2018, 25, 2380–2388. [Google Scholar] [CrossRef]
- Li, S.; Li, Q.; He, D. PD Classification in Oil-pressboard Insulation by Simulating a Needle-Plane Model with + DC Voltage. IEEE Trans. Dielectr. Electr. Insul. 2019, 26, 261–269. [Google Scholar] [CrossRef]
- Kunicki, M.; Cichoń, A.; Nagi, Ł. Statistics based method for partial discharge identification in oil paper insulation systems. Electr. Power Syst. Res. 2018, 163, 559–571. [Google Scholar] [CrossRef]


| Material Properties | Pressboard | Teflon | Glass |
|---|---|---|---|
| Density (g/cm3) | 1.0–1.3 | 2.2 | 2.5 |
| Permittivity (−) | 5.8 | 2.1 | 4-10 |
| Electrode System with Dielectric Made of: | Dominant Wavelength Component (nm) | Recorded Spectral Range (nm) |
|---|---|---|
| Pressboard | 662; 787 | 455–864 |
| Teflon | 662; 787 | 455–864 |
| Glass | 522; 594; 662 | 385–833 |
| Electrode System with Dielectric Made of: | Dominant Wavelength Component (nm) | Recorded Spectral Range (nm) |
|---|---|---|
| Pressboard, Teflon, Glass | 316; 334; 354; 377; 401 | 289–450 |
© 2019 by the authors. Licensee MDPI, Basel, Switzerland. This article is an open access article distributed under the terms and conditions of the Creative Commons Attribution (CC BY) license (http://creativecommons.org/licenses/by/4.0/).
Share and Cite
Kozioł, M.; Nagi, Ł.; Kunicki, M.; Urbaniec, I. Radiation in the Optical and UHF Range Emitted by Partial Discharges. Energies 2019, 12, 4334. https://doi.org/10.3390/en12224334
Kozioł M, Nagi Ł, Kunicki M, Urbaniec I. Radiation in the Optical and UHF Range Emitted by Partial Discharges. Energies. 2019; 12(22):4334. https://doi.org/10.3390/en12224334
Chicago/Turabian StyleKozioł, Michał, Łukasz Nagi, Michał Kunicki, and Ireneusz Urbaniec. 2019. "Radiation in the Optical and UHF Range Emitted by Partial Discharges" Energies 12, no. 22: 4334. https://doi.org/10.3390/en12224334
APA StyleKozioł, M., Nagi, Ł., Kunicki, M., & Urbaniec, I. (2019). Radiation in the Optical and UHF Range Emitted by Partial Discharges. Energies, 12(22), 4334. https://doi.org/10.3390/en12224334