Article

Role of Shearing Dispersion and Stripping in Wax Deposition in Crude Oil Pipelines

1
Key Laboratory for Enhanced Oil & Gas Recovery of the Ministry of Education, Northeast Petroleum University, Daqing 163318, China
2
Heilongjiang Key Laboratory of Petroleum and Petrochemical Multiphase Treatment and Pollution Prevention, Daqing 163318, China
3
Research Institute of Petroleum Engineering and Technology, Sinopec Northwest Oilfield Company, Urumqi 830011, China
*
Authors to whom correspondence should be addressed.
Energies 2019, 12(22), 4325; https://doi.org/10.3390/en12224325
Submission received: 2 September 2019 / Revised: 25 October 2019 / Accepted: 6 November 2019 / Published: 13 November 2019
(This article belongs to the Special Issue Developments in Oil and Gas Engineering)

Abstract

:
Wax deposition during crude oil transmission can cause a series of negative effects and lead to problems associated with pipeline safety. A considerable number of previous works have investigated the wax deposition mechanism, inhibition technology, and remediation methods. However, studies on the shearing mechanism of wax deposition have focused largely on the characterization of this phenomena. The role of the shearing mechanism on wax deposition has not been completely clarified. This mechanism can be divided into the shearing dispersion effect caused by radial migration of wax particles and the shearing stripping effect caused by hydrodynamic scouring. From the perspective of energy analysis, a novel wax deposition model was proposed that considered the flow parameters of waxy crude oil in pipelines instead of its rheological parameters. Considering the two effects of shearing dispersion and shearing stripping coexist, with either one of them being the dominant mechanism, a shearing dispersion flux model and a shearing stripping model were established. Furthermore, a quantitative method to distinguish between the roles of shearing dispersion and shearing stripping in wax deposition was developed. The results indicated that the shearing mechanism can contribute an average of approximately 10% and a maximum of nearly 30% to the wax deposition process. With an increase in the oil flow rate, the effect of the shearing mechanism on wax deposition is enhanced, and its contribution was demonstrated to be negative; shear stripping was observed to be the dominant mechanism. A critical flow rate was observed when the dominant effect changes. When the oil flow rate is lower than the critical flow rate, the shearing dispersion effect is the dominant effect; its contribution rate increases with an increase in the oil flow temperature. When the oil flow rate is higher than the critical flow rate, the shearing stripping effect is the dominant effect; its contribution rate increases with an increase in the oil flow temperature. This understanding can be used to design operational parameters of the actual crude oil pipelines and address the potential flow assurance problems. The results of this study are of great significance for understanding the wax deposition theory of crude oil and accelerating the development of petroleum industry pipelines.

1. Introduction

Petroleum plays a vital role in industrial production [1,2]. Many of its advantages are incomparable with other fuels and alternatives cannot be developed in a short time [3,4]. Unfortunately, some crude oils have a high wax content. During the pipeline transportation of such waxy crude oils, when the system temperature is lower than the waxing point temperature, alkanes and cycloalkanes, as the main components of wax in the crude oil phase, will constantly precipitate and crystallize, adhere to the pipe wall, and then form wax deposits along the pipeline. This will lead to an increase in the pressure drop of the pipeline, a reduction in its transmission capacity, and an increase in its operating and maintenance costs [5,6]. Therefore, prior to oil production and transmission, it is vital to predict the conditions that cause deposition and to determine the quantity of deposition that may occur [7].
Previous studies have shown that the wax deposition mechanism primarily includes molecular diffusion, shearing dispersion, Brownian diffusion, and gravity settling [8,9,10,11,12,13,14,15,16,17]. Earlier works showed that molecular diffusion is the main mechanism [8,9,15]. With respect to single-phase wax deposition, Hamouda [18] established a Bingham plastic model based on numerical heat transfer calculations, molecular diffusion rate, and rheological properties. Majeed [19] developed a model for the calculation of wax formation and deposition in pipelines and process equipment along with a new method for wax equilibrium calculations using the true boiling point of distillation cuts as the input. With advancements in research, many scholars have considered the comprehensive effects of molecular diffusion, shearing dispersion, and other mechanisms in studies on single-phase wax deposition models of waxy crude oil; their results have been widely recognized [11,12].
Wax deposition modeling becomes complicated when multiple phases are involved. A two-dimensional (2D) model of oil–water flow between two parallel plates, where deposition occurred at the upper wall, was developed by Huang [20] et al. Nonisothermal hydrodynamics and heat/mass transfer for stratified flow were studied to predict the growth of wax deposit as a function of time. Nazar’s model [21] coupled the energy equation with a removal kinetics model and a thermodynamic model. The shearing effect was revealed to be an important mechanism in turbulent flow. Owing to the role of the shearing mechanism, the wax deposition rate decreases with increasing flow rate. Zougari et al. [22] developed a set of devices for testing crude oil wax deposition. The principle of their devices was based on the pipeline flow and storage conditions. Their experiments demonstrated the relationship of the wax deposition rate with temperature, time, and shearing action. Zheng [23] improved the conventional simplified wax deposition model assuming Newtonian fluid mechanics considering non-Newtonian fluid characteristics. Couto [24] established a cold finger experimental device to investigate the effects of water salinity, temperature gradient, deposition period, oil–water emulsification characteristics, and water content on the wax deposition regularity; their results provided a solid framework for two-phase wax deposition models.
A feasible way is also to combine mathematical models with a software program to simulate wax deposition in pipelines [25,26,27]. For example, the OLGA developed by Schlumberger implements three mathematical models for the simulation of wax deposition in pipelines: The RRR (Rygg, Rydahl, and Rønningsen) model, the Matzain model, and the “heat analogy” model. However, Leporini et al. [25] found that wax deposition models still face significant uncertainties in the field application. The way to overcome this problem is to validate these models with an additional set of field data, but this can only be expected in the future.
Although wax deposition kinetic models considering the shearing role in the pipeline flow field have been developed [28,29,30,31] taking into account shearing parameters, the shearing dispersion effect caused by the radial migration of wax crystal particles and the shearing stripping effect caused by hydrodynamic scouring have not been distinguished, and a method to quantitatively interpret them has also not yet been established. There have been certain discussions on the quantitative role of the shearing mechanism [32]; however, they have assumed that there is no temperature difference between the oil and the pipe wall; moreover, the effect of molecular diffusion has been completely neglected, thereby indicating a lack of scientific and theoretical understanding. Therefore, in this study, a wax deposition model for pipelines is established and the wax deposition law in the shearing flow field is derived. On this basis, considering the contribution of the shearing mechanism, a shearing dispersion flux model and a shearing stripping flux model related to the shearing energy are established to distinguish and quantitatively describe the role of shearing dispersion and stripping in wax deposition, so as to fully illustrate the wax deposition process and mechanism in shearing flow fields of pipes.

2. Model Development

2.1. Modeling of Wax Deposition

When a medium flows in the pipe, it will be subjected to the shearing effect. As waxy crude oil flows in the pipeline, as shown in Figure 1, the shearing force on each unit area in the pipeline contributes to the flow of the medium; thus, the shearing energy is the driving force that propels the waxy crystal particles in waxy crude oil to continuously migrate, accumulate, and grow. In the pipe shearing flow field, the flow pressure drop is the macroscopic reflection of the shearing effect on the fluid. Thus, in this paper, the shearing energy in a specific flow field is described as a function of the pressure drop when waxy crude oil flows in this region, as follows:
E s = Δ P · A s · L ,
where E s is the shearing energy in the specific flow field, J; L is the characteristic length of the pipeline, m; A s is the inner surface area of the pipeline, m; and Δ P is the pressure drop, Pa.
The mass balance relationship in the wax deposition process considered in the improved model is shown in Figure 2, where A represents the mass of the wax diffusing to the deposits and B represents the mass of oil diffusing from the deposits, with B approximately equal to A ; C represents the mass of wax contributed to new deposits, D represents the mass of wax removed by shearing stripping, E represents the net variable mass of oil in the new deposits, and M represents the total mass of wax in the deposits. Therefore, the mass balance for the wax deposits can be written as follows:
M ( t , L ) = M n d ( t , L ) M s r ( t , L ) + M d e ( t , L ) .
In Equation (2):
M ( t , L ) = 0 L π ( r 0 2 r w 2 ) ρ d d x ,
M n d ( t , L ) = 0 t 0 L 2 π r w ( J c + J s d J d ) d t d x ,
M s r ( t , L ) = 0 t 0 L 2 π r w J s r · r w d t d x ,
M d e ( t , L ) = 0 t 0 L 2 π r w ( J c + J s d J s r J d ) ( 1 F w a x F w a x ) d t d x .
Substituting Equations (3)–(6) into Equation (2) yields the mass balance model for wax deposition. In terms of the shearing flux, J s = J s d + J s r , the mass balance model is equivalent to the following:
M ( t , L ) = 2 π 0 t 0 L J c · r w · 1 F w a x d t d x 2 π 0 t 0 L J d · r w · 1 F w a x d t d x + 2 π 0 t 0 L J s · r w · 1 F w a x d t d x ,
where M ( t , L ) is the total mass of wax deposits in a pipeline of length L , m; M n d ( t , L ) is the mass of wax contributed to new deposits, kg; M s r ( t , L ) is the mass of wax removed by shearing stripping, kg; M d e ( t , L ) is the net variable mass of oil in the new deposits, kg; r o is the internal radius of the pipeline, m; r w is the distance from the center of the pipe to the surface of the wax deposits, m; ρ d is the density of the wax deposits, kg/m3; and F w a x is the wax content in the deposits, %.
In Equation (7):
J c = D w ρ wax | d C w d T | L · | d T d r w | L ,
J s = k · α · S w · | d E s d L | r w · ρ wax r w · μ · F wax 2.3 ,
J d = D e | d C w d T | L · | d T d r w | L ,
where J c is the convective flux, kg/(m2 · s); J s is the shearing flux, kg/(m2 · s); J d is the diffusive flux, kg/(m2 · s); D W is the diffusion coefficient; D e is the effective diffusion coefficient; and α is the aspect ratio of wax crystals, as shown in the Appendix A.
Substituting Equations (8)–(10) into Equation (7) and combining Equation (3), the following can be obtained:
0 L π ( r 0 2 r w 2 ) ρ d d x = 2 π 0 t 0 L D w ρ wax · | d C w d T | L · | d T d r w | L · r w · 1 F wax d t d x 2 π 0 t 0 L D w ρ wax 1 + α 2 F wax 2 1 F wax · | d C w d T | L · | d T d r w | L · r w · 1 F wax d t d x + 2 π 0 t 0 L k · α · S w · | d E s d L | r w · ρ wax r w · μ · F wax 2.3 · r w · 1 F wax d t d x
Taking the derivative with respect to the pipeline length and the time successively, the distance from the center of the pipe to the surface of the deposits can be obtained as follows:
r w = D w · ρ wax · t 4 ρ d F wax · | d C w d T | L · | d T d r w | L · ( 1 ( 1 + α 2 F wax 2 1 F wax ) 1 ) + t 4 ρ d F wax [ ( D w ρ wax | d C w d T | L | d T d r w | L ( 1 ( 1 + α 2 F wax 2 1 F wax ) 1 ) ) 2 + 4 k α S w | d E s d L | r w ρ d ρ wax μ · F wax 2.3 ) ] 1 2
After introducing the shearing energy to the flux equations, the correlation between the bulk flow parameters in the shearing field and the microscopic rheological parameters of waxy crude oil can be obtained. An improved wax deposition model can be given as follows:
t M ( t , L ) = 2 π 0 L D w ρ wax · | d C w d T | L · | d T d r w | L · r w · 1 F wax d x 2 π 0 L D w ρ wax 1 + α 2 F wax 2 1 F wax · | d C w d T | L · | d T d r w | L · r w · 1 F wax d x + 2 π 0 L k · α · S w · | d E s d L | r w · ρ wax r w · μ · F wax 2.3 · r w · 1 F wax d x

2.2. Modeling of Shearing Flux

As shown in Figure 3, when waxy crude oil flows through the specific sections of the pipe, the work generated by the shearing forces of the wall considering the thickness of the deposition layer on the pipe wall can be written as follows:
W sr = 2 π 0 L τ sr · r w d x ,
where W sr is the work generated by the shearing force of the wall considering the thickness of the deposition layer on the pipe wall, J; L is the characteristic length of the pipeline, m; τ sr is the shearing stress at the pipeline wall, Pa; and r w is the distance from the center of the pipe to the surface of the wax deposits, m.
The work generated by the wall shearing force is a reflection of the shearing energy. Thus, the shearing energy considering the thickness of the deposition layer of the pipe wall can be written as follows:
E sr = 2 π 0 L τ sr · r w d x ,
where E sr is the shearing energy considering the thickness of the deposition layer on the pipe wall, J; L is the characteristic length of the pipeline, m; τ sr is the shearing force at the pipeline wall, Pa; and r w is the distance from the center of the pipe to the surface of the wax deposits, m.
The work generated by the shearing dispersion driving force can be written as follows:
W s d = 2 π 0 L 0 r w τ sd · r d r d x ,
where W s d is the work generated by the shearing dispersion driving force, J; and τ sd is the shearing dispersion driving force, Pa.
Similar to E sr , the shearing dispersion driving energy of waxy crude oil in a pipeline is given as:
E sd = 2 π 0 L 0 r w τ sd · r d r d x .
The shearing energy of the pipe transmission flow field includes the pipe wall shearing energy and the shearing dispersion driving energy. Thus, the shearing dispersion driving energy can be expressed as:
E sd = E s E sr .
The shearing dispersion driving energy is | d E sd d L | r w in a pipe of length L and the distance from the center of the pipe to the surface of the wax deposits is r w . This can also be written as:
| d E sd d L | r w = d ( E s E sr ) d L .
Substituting the average shearing dispersion driving force in a pipe of length L as τ sd ¯ , the following equation can be obtained:
τ sd ¯ = d d L ( E s E sr ) π r w 2 .
By considering the wax crystal shape factor, shearing energy characteristics, wax deposition layer strength, and wax density, based on the π theorem, the shearing dispersion flux in the process of wax deposition in a waxy crude oil field can be obtained as follows:
J sd = a · S w · γ ˙ ,
where a is the shearing dispersion effect coefficient, kg/m2; and γ ˙ is the shearing rate of the flow field, 1/s.
In a pipe shearing flow field, the shearing dispersion driving force is related to the shearing rate. For Newtonian and non-Newtonian flow patterns, the shearing dispersion flux can be distinguished as follows.
The shearing dispersion flux of a Newtonian flow pattern is given as:
J sd = a · S w · ξ · τ sd ¯ μ .
The shearing dispersion flux of a non-Newtonian flow pattern is given as:
J sd = a · S w · ( ξ · τ sd ¯ K ) 1 n .
By, substituting Equation (20) into Equations (22) and (23), the following equations can be obtained.
The shearing dispersion flux model of a Newtonian flow pattern:
J sd = a · S w · ξ · d d L ( E s E sr ) μ π r w 2 .
The shearing dispersion flux model of a non-Newtonian flow pattern:
J sd = a · S w · [ ξ · d d L ( E s E sr ) K π r w 2 ] 1 n ,
where μ is the viscosity of waxy crude oil, Pa. s; K is the coefficient of consistency, Pa. sn; n is the rheological index, and ξ is the correction coefficient.
The shearing stripping flux model of a Newtonian flow pattern is given as:
J sr = S w r w · μ · [ α · k · ρ wax · | d E s d L | r w F wax 2.3 a · ξ · d d L ( E s E sr ) π r w ] .
The shearing stripping flux model of a non-Newtonian flow pattern is given as:
J sr = S w · { α · k · ρ wax · | d E s d L | r w r w · μ · F wax 2.3 a · [ ξ · d d L ( E s E sr ) K π r w 2 ] 1 n } .
The shearing flux models that were substituted as well as their detailed parameters are shown in the Appendix A.

3. Experiments

3.1. Experimental Materials

The samples of waxy crude oil used in the experiments were collected from the Daqing Oilfield. The basic physical properties of waxy crude oil were obtained through experimental measurements. The freezing point, wax content, and phase inversion point were found to be 35.3 °C, 19.2%, and 55%, respectively. Prior to the experiments, the crude oil was heated to ensure its completely uniform state. The specific details are provided in a previous paper [9,33,34].

3.2. Experimental Setup and Procedure

3.2.1. Thermal Analysis Experiments

Thermal analysis is a kind of technology to understand the relationship between material physical properties and temperature under the program control temperature. Differential scanning calorimetry (DSC) is the best method of quantification and repeatability in the existing technology [2]. The waxing characteristics of the waxy crude oil were measured by the thermal analysis method. The samples were heated to 55 °C above the wax appearance temperature (WAT), and then cooled at a rate of 2.5 °C per minute. The data for each temperature point were recorded and the DSC curve was plotted. By analyzing the curve in a specific temperature range, the wax appearance content at that temperature can be obtained; then, the wax appearance percentage at that temperature can be obtained, which can be regarded as the solubility coefficient of wax crystals.

3.2.2. Flow Loop Experiments

The flow loop experiment is a classical method for testing the flow characteristics of crude oil in pipelines, including the heating history, shearing history, and hydraulic characteristics [33]. The variation of the flow pressure drop, and the adhesion of pipe wall deposition are the main macroscopic manifestations of wax deposition in waxy crude oil pipelines. The results of experiments conducted under different temperature and flow conditions can provide the experimental basis and basic data for establishing a wax deposition model to predict the wax deposition rate in waxy crude oil pipelines. The experimental method in this study is based on the principle that the additional increase in the pressure drop over the pipe section is caused by the reduction in the hydraulic diameter when wax deposition occurs. Thus, the deposition rate can be determined by measuring the pressure drop of the test pipe sections. The experimental device is an improved loop device as shown in Figure 4. The main body of the device consists of a storage tank, pipeline, temperature control system, power system, refrigeration unit, measurement system, and data acquisition and processing system. DN65 pipelines were selected for both the closed horizontal test section and the closed reference section, and the effective length of the pressure drop test section is 2.4 m. The design pressure range, temperature control range, and flow regulation range of the device are 0–2.0 MPa, −20–80 °C, and 0–6 m3/h, respectively.
During the experiment, waxy crude oil was first poured into the storage tank and heated to 55 °C. Then, the mixing system and temperature control system of the storage tank began operation and the initial flow temperature of the loop was controlled according to the experimental scheme. Next, the inner circulation pump was started, the data acquisition and control system were initiated, the bypass valve of the storage tank was switched, and the flow parameters, including flow pressure drop and cumulative time of wax deposition stabilization in the pipe section, under various conditions were tested. Finally, the test sections were dismantled using flexible connections, the deposits on the walls of different parts were scraped, and the density and wax content of the deposits were measured. The values of flow parameters in the experiments are indicated in Table 1. The conventional balance cylinder method was used to determine the density of the depositions on the pipe wall, and the alumina adsorption chromatography method [35] was used to determine the wax content.

3.2.3. Cold Finger Experiments

The traditional cold finger experiment is a measure for testing the static wax deposition rate, and the method was extended to a dynamic environment by attaching a stirrer in the apparatus [9]. As shown in Figure 5, a paraffin rate test instrument was used for the cold finger experiments. During these experiments, the temperature difference between the inner wall of the test cup and the surrounding environment was controlled to ensure molecular diffusion of the wax particles. At the same time, the wax deposition rate under the conditions of zero static shearing and equivalent stirring with a Reynolds number was measured. Furthermore, the variation in the wax deposition rate under the effect of an equivalent diffusion mechanism in a specific shearing range was recorded by the cold finger method, and the shearing dispersion flux of wax in the waxy crude oil system was distinguished by changing the shearing degree of the waxy crude oil. Then, the shearing dispersion coefficient was determined according to Equation (21). The specific temperature values and stirring shearing rate values in the experiments are indicated in Table 2.

4. Results and Discussion

4.1. Prediction of Wax Deposition Rate

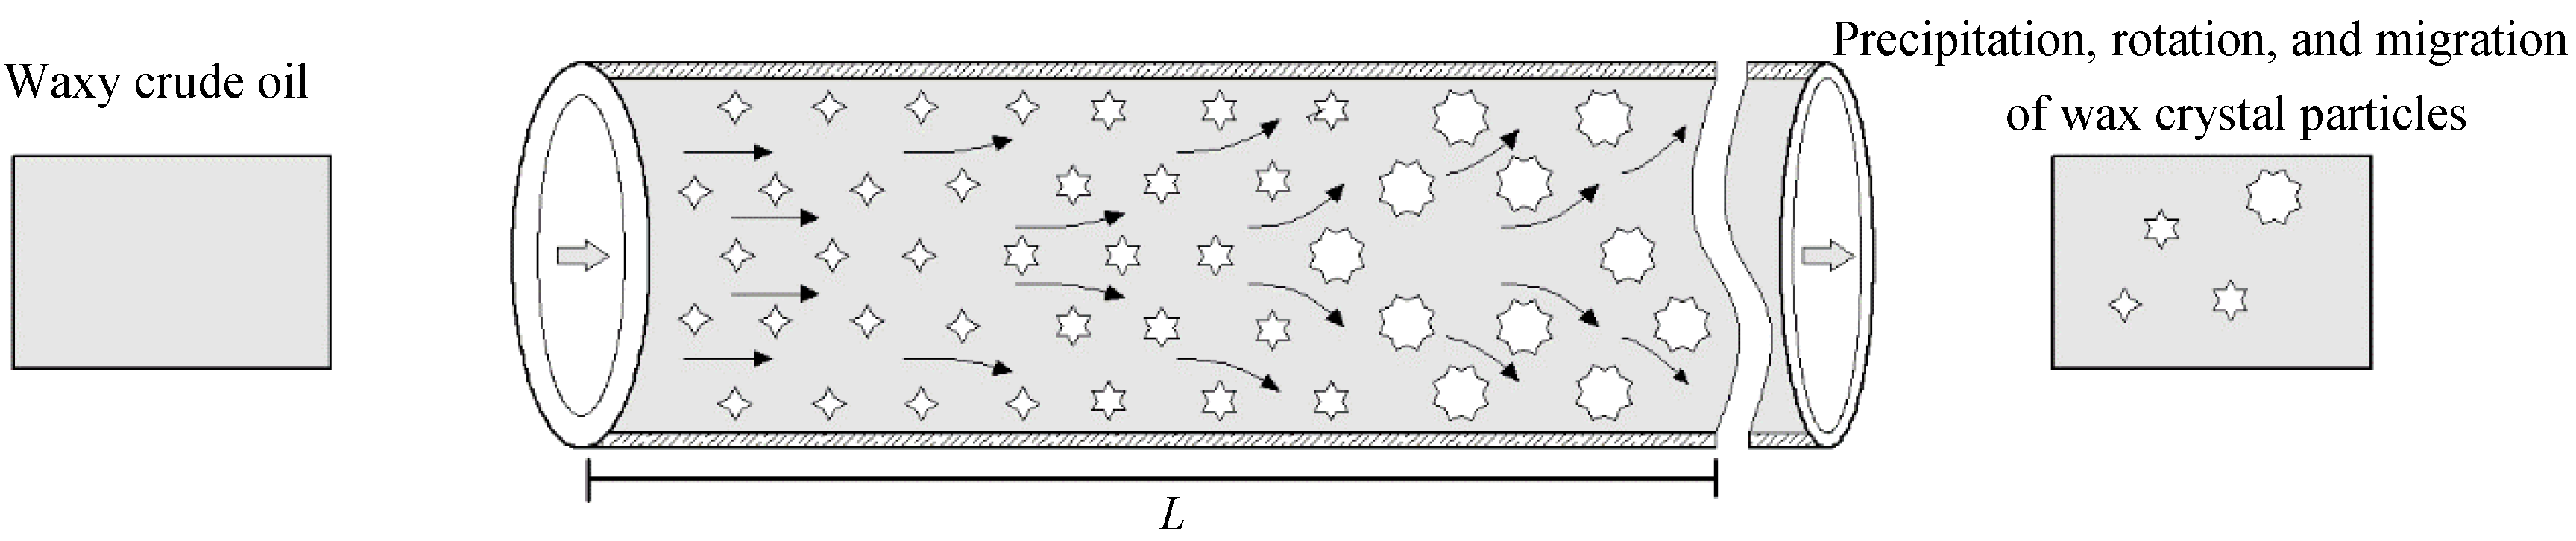
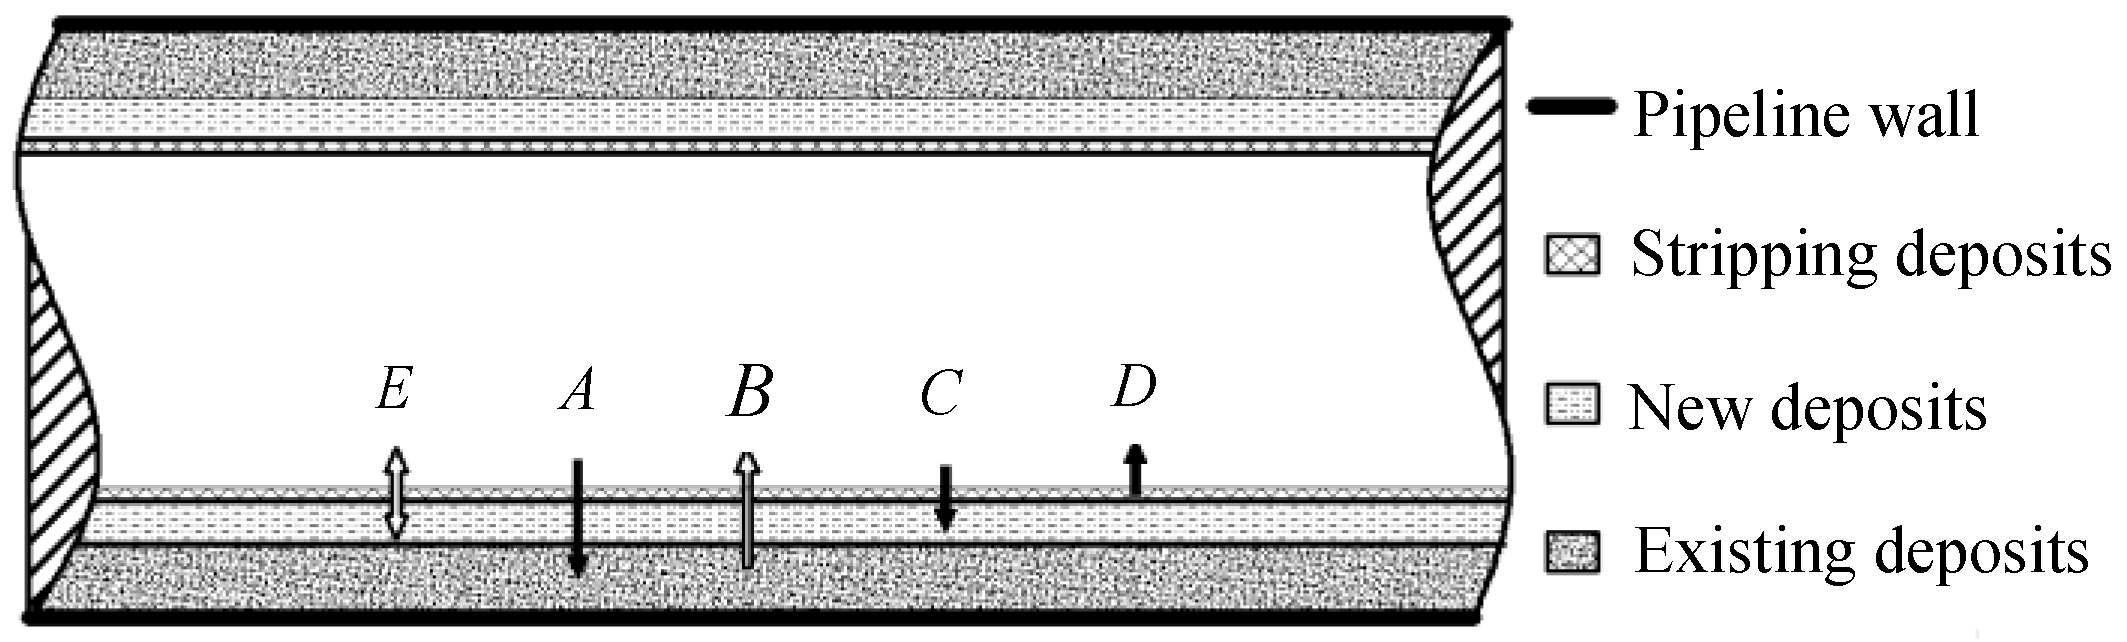
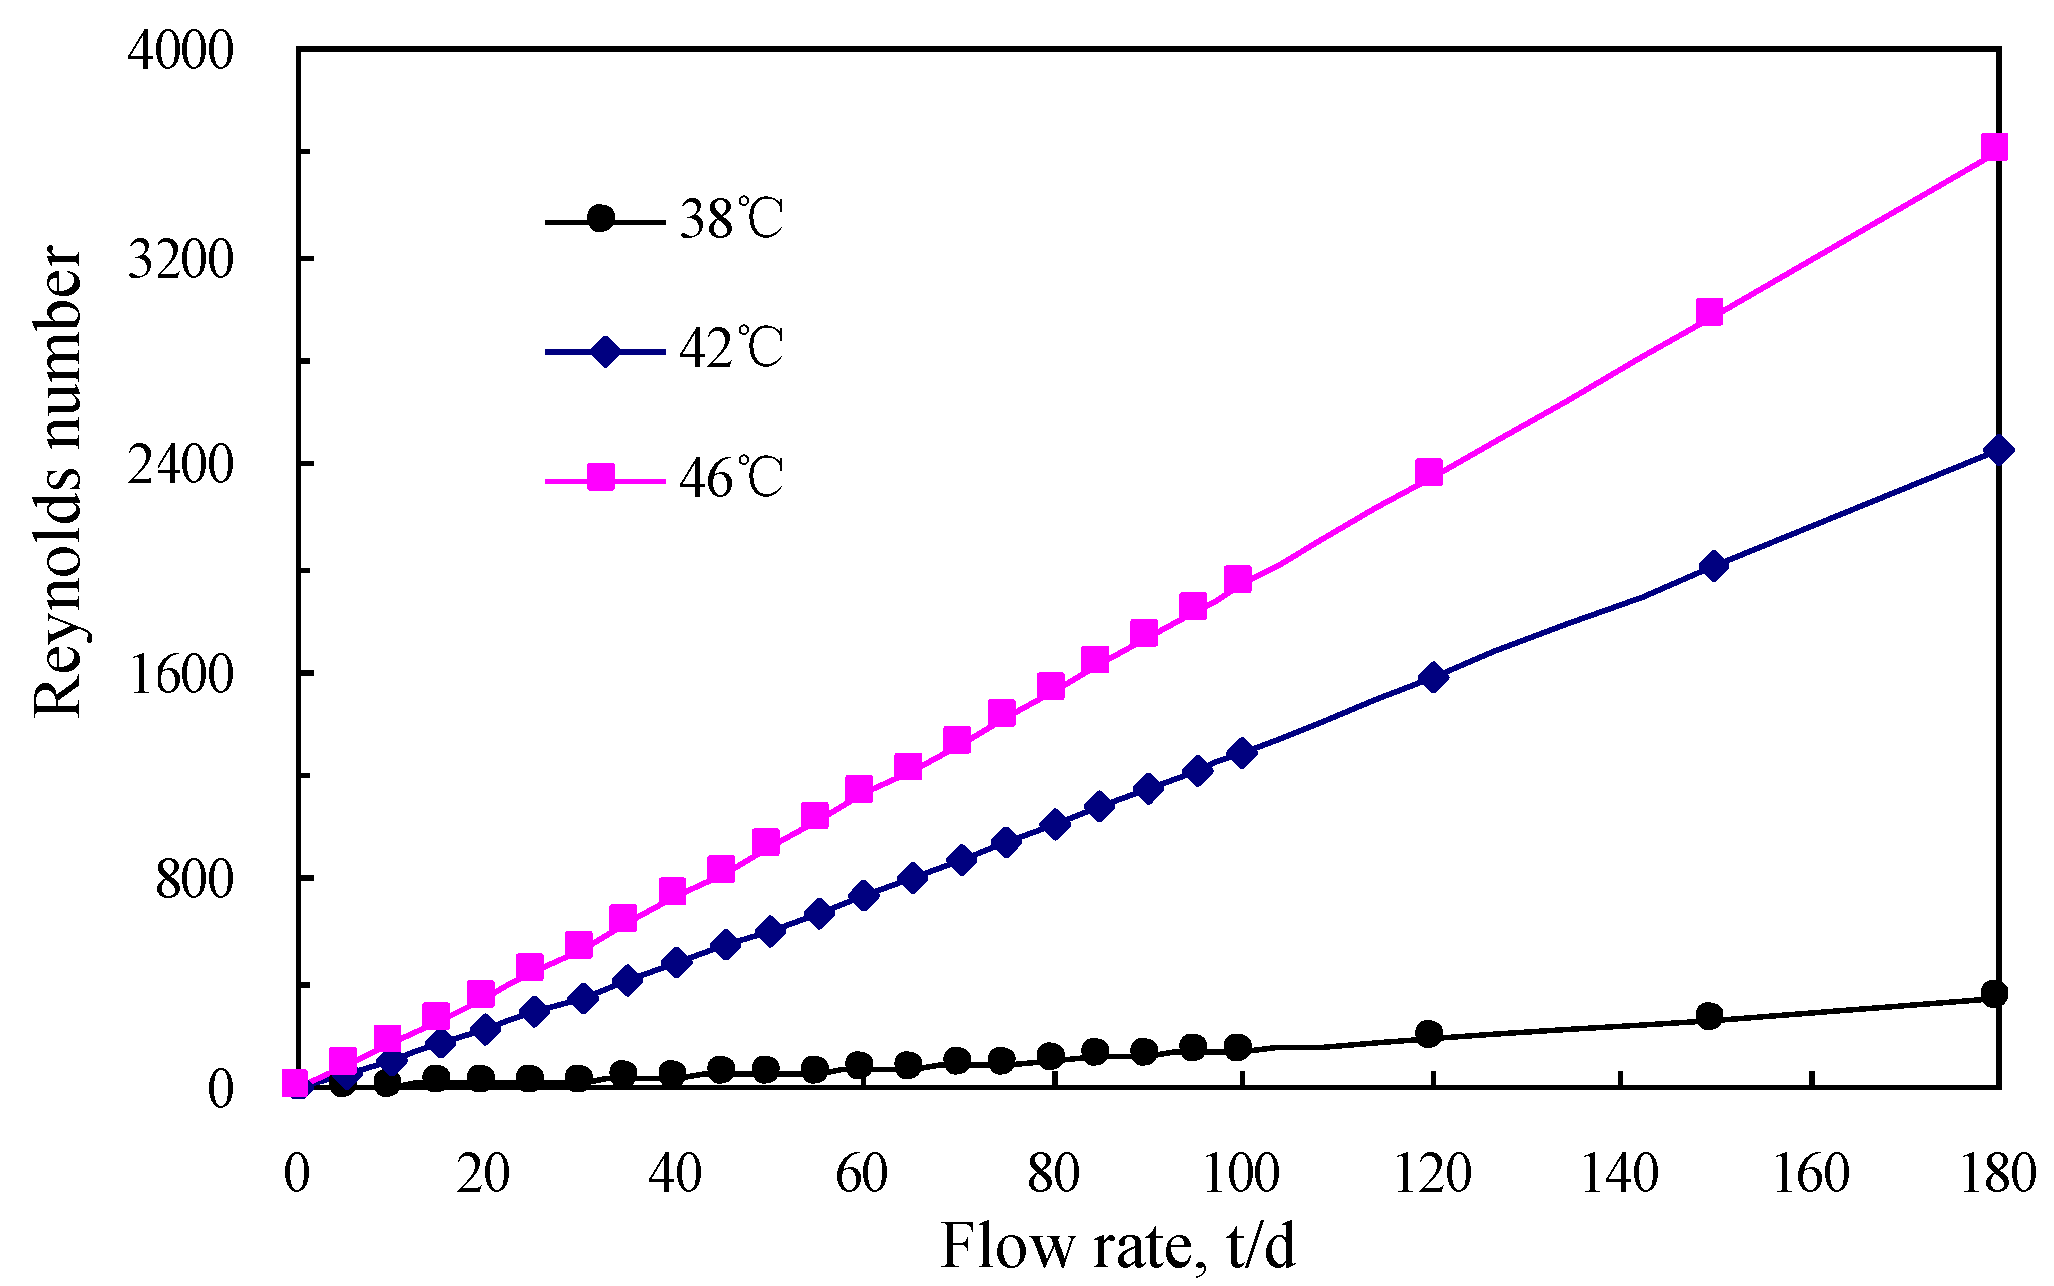
4.1.1. Flow and Deposition Behavior

According to the DSC thermogram of the tested waxy crude oil, the distribution characteristics of wax precipitation when the temperature of waxy crude oil decreases are shown in Figure 6. The results indicated that the WAT was 48.5 ℃, the peak temperature of wax precipitation was 22.3 °C and the peak temperature range of wax precipitation was in the range 5–32 °C.
As mentioned in the section discussing thermal analysis experiments, the percentage of wax precipitation at a certain temperature can be regarded as the corresponding solubility coefficient of wax crystals. This percentage is considered to be the most basic data required to predict wax deposition during pipeline transmission. According to Figure 6, the relationship between the solubility coefficient and the temperature of wax crystals can be piecewise fitted. The detailed results are shown in the Appendix A.
The results of the flow pressure drop obtained from the loop experiments are summarized in Table 1. This indicates that the peak value of the pressure drop in the pipeline flow is related to the temperature and flow rate, and the time to reach the peak value is most significantly affected by environmental temperature. The cumulative time at the lowest environmental temperature is approximately 1/2 of that at the highest environmental temperature.
The basic physical properties of waxy crude oil used in all flow loop experiments were the same, and the waxy deposition tends to be in an equilibrium and stable state under all working conditions before the flow experiments were completed. Temperature, which includes environmental and flow temperature, as well as the flow rate, are the main factors affecting the driving force (such as molecular and thermal diffusion) of the equilibrium and stable state of wax deposition. The performance is measured using the macroscopic increase in the rate of the pressure drop, and it considerably affects the composition characteristics of the formed deposition. The experimental data indicate that the wax content in the wax deposits on the wall of waxy crude oil pipelines ranges from 35.14% to 47.90%, with an average of 42.03%, and the density of the deposition ranges from 0.8531 to 0.8647 g/cm3, with an average of 0.8575 g/cm3.
Table 2 indicates that the wax deposition rate contributed by the shearing dispersion effect was obtained according to the results of cold finger experiments.

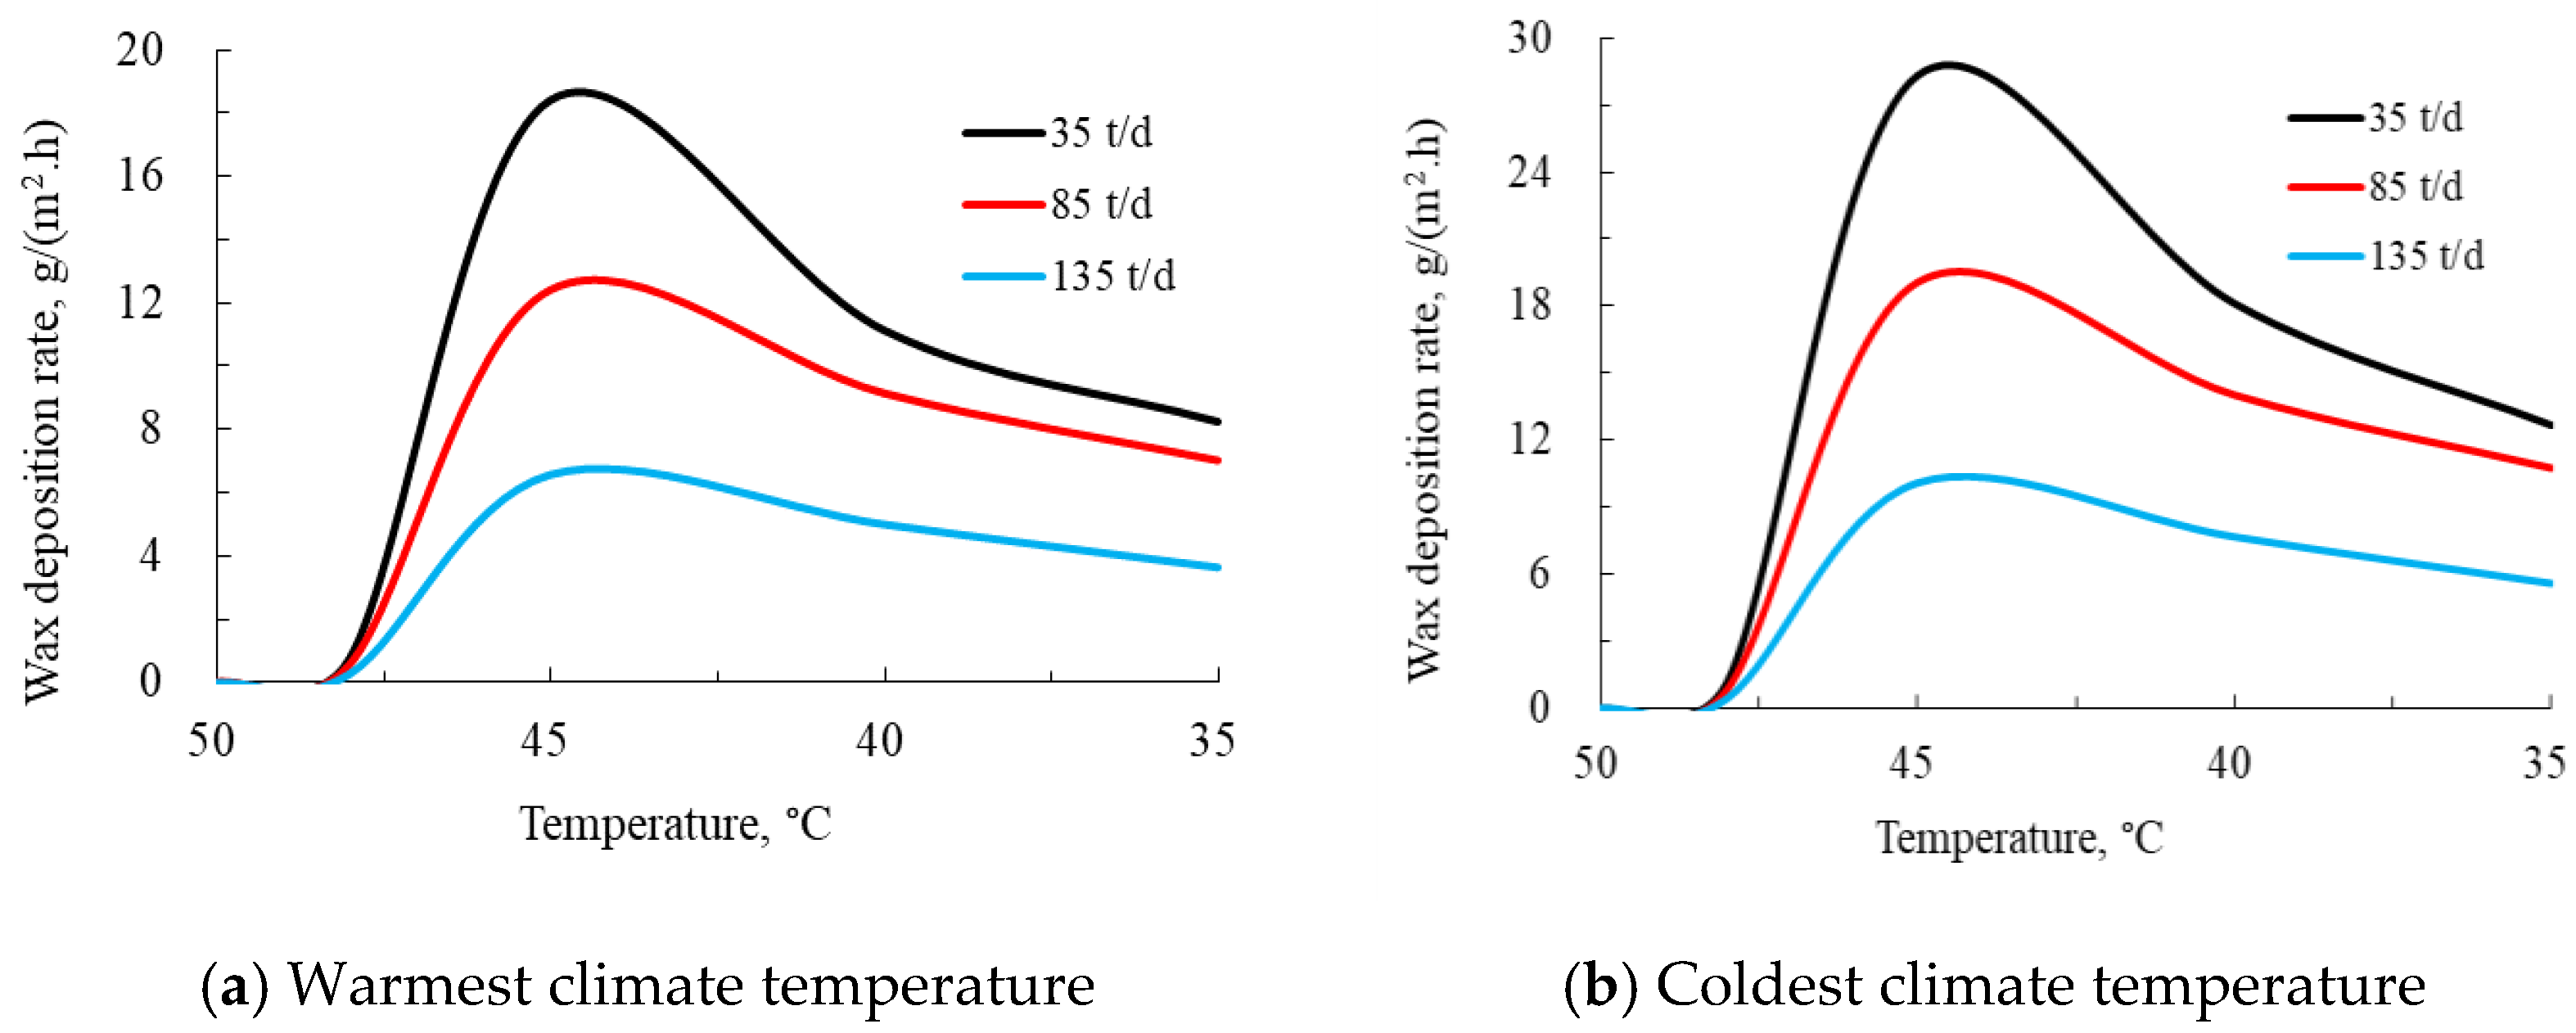
4.1.2. Effect of Oil Flow Temperatures on Wax Deposition

Figure 7 shows that the influence of oil flow temperature on wax deposition can be divided into two parts: Above and below the limit of 45 °C. This limit is approximately 10 °C above the freezing point of crude oil and approximately 4 °C below the WAT of crude oil. When the oil flow temperature was below 45 °C, the deposition rate decreases with the oil flow temperature. This is due to the decrease of the radial temperature gradient and the solubility coefficient of wax crystals during the continuous temperature reduction process, which weakened the molecular diffusion. However, when the temperature is above 45 °C, not only is the molecular diffusion effect weakened, but the wax deposition intensifies as the temperature approaches the freezing point of crude oil. Their combined effect causes the wax deposition rate to increase with the decrease in the oil flow temperature. The wax deposition law under the influence of the oil flow temperature agrees well with the conclusions of existing studies [24,33]. In addition, it indicated that various ambient temperature conditions affect the deposition rate values differently; however, they have no effect on the above deposition laws.

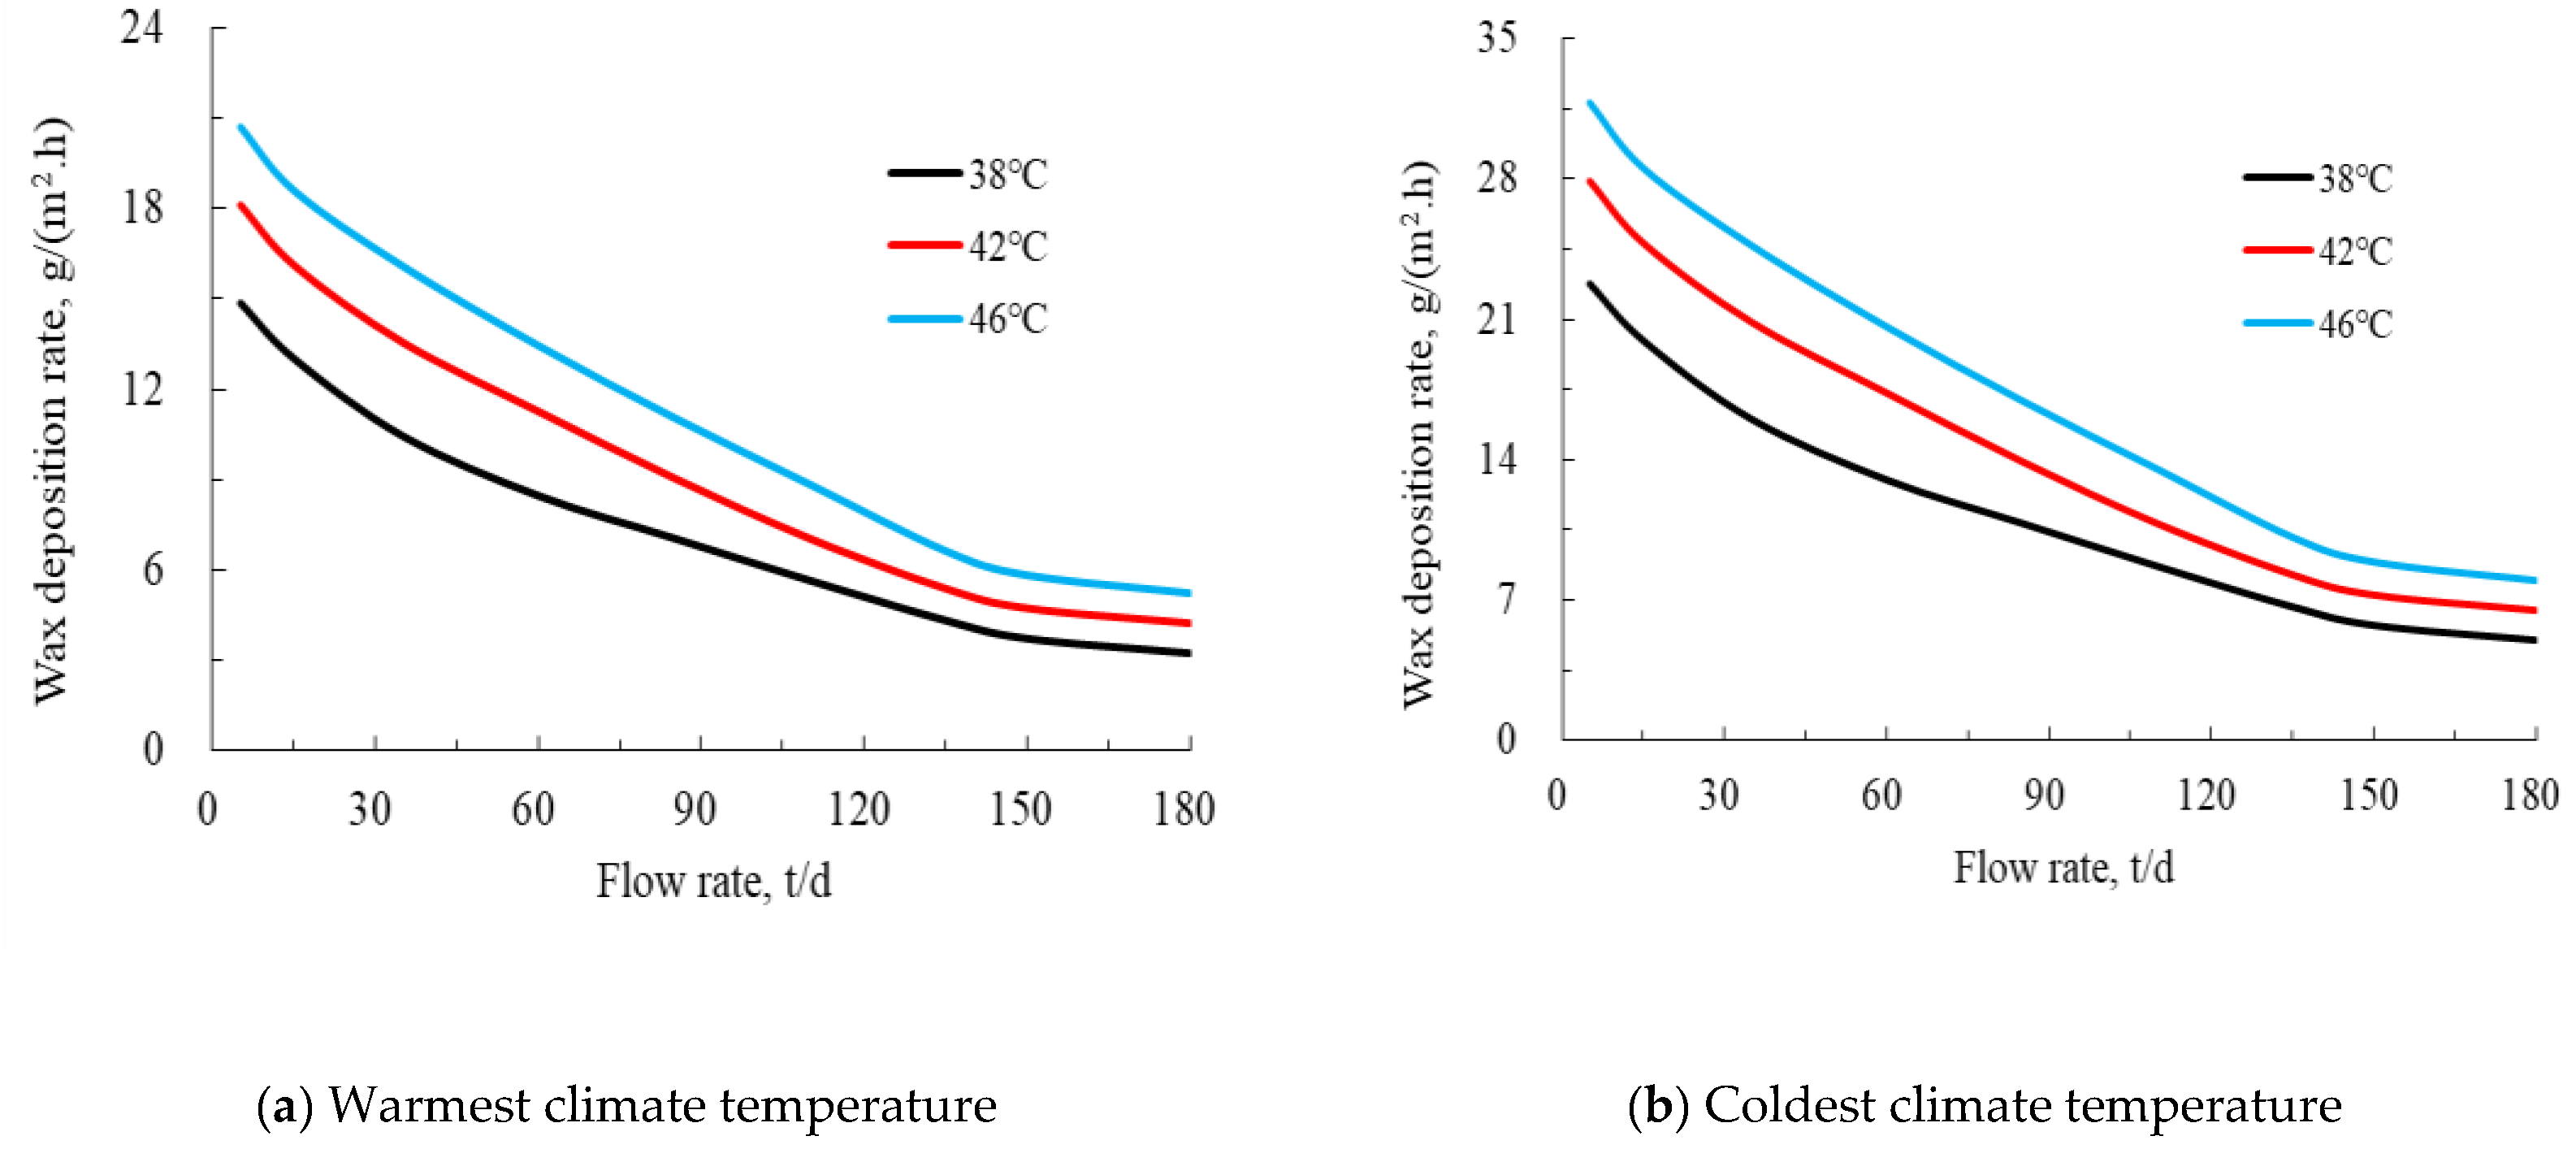
4.1.3. Effect of Oil Flow Rates on Wax Deposition

The influence of the flow rate on wax deposition rate of waxy crude oil is shown in Figure 8. Under all working conditions, the wax deposition rate decreases with the increase in the pipe flow. This is due to the shearing dispersion effect of lateral migration and the movement of wax crystals induced by the radial velocity gradient, which contributes to the growth of deposition. Meanwhile, the shearing stripping effect induced by hydrodynamic scouring leads to the degradation of the deposited layer. With the increase of the flow rate and competition between them, the shearing degree of the pipeline flow field increases, the deposition rate decreases, and wax deposition behavior is inhibited. Similarly, the variation in ambient temperature conditions leads to different deposition rates under different working conditions, which has no significant impact on the above deposition laws. However, compared with the warmest climate temperature, the wax deposition rate increases significantly at the coldest climate temperature. Moreover, the predictions exhibit good agreement with the conclusions of existing studies [24,33].

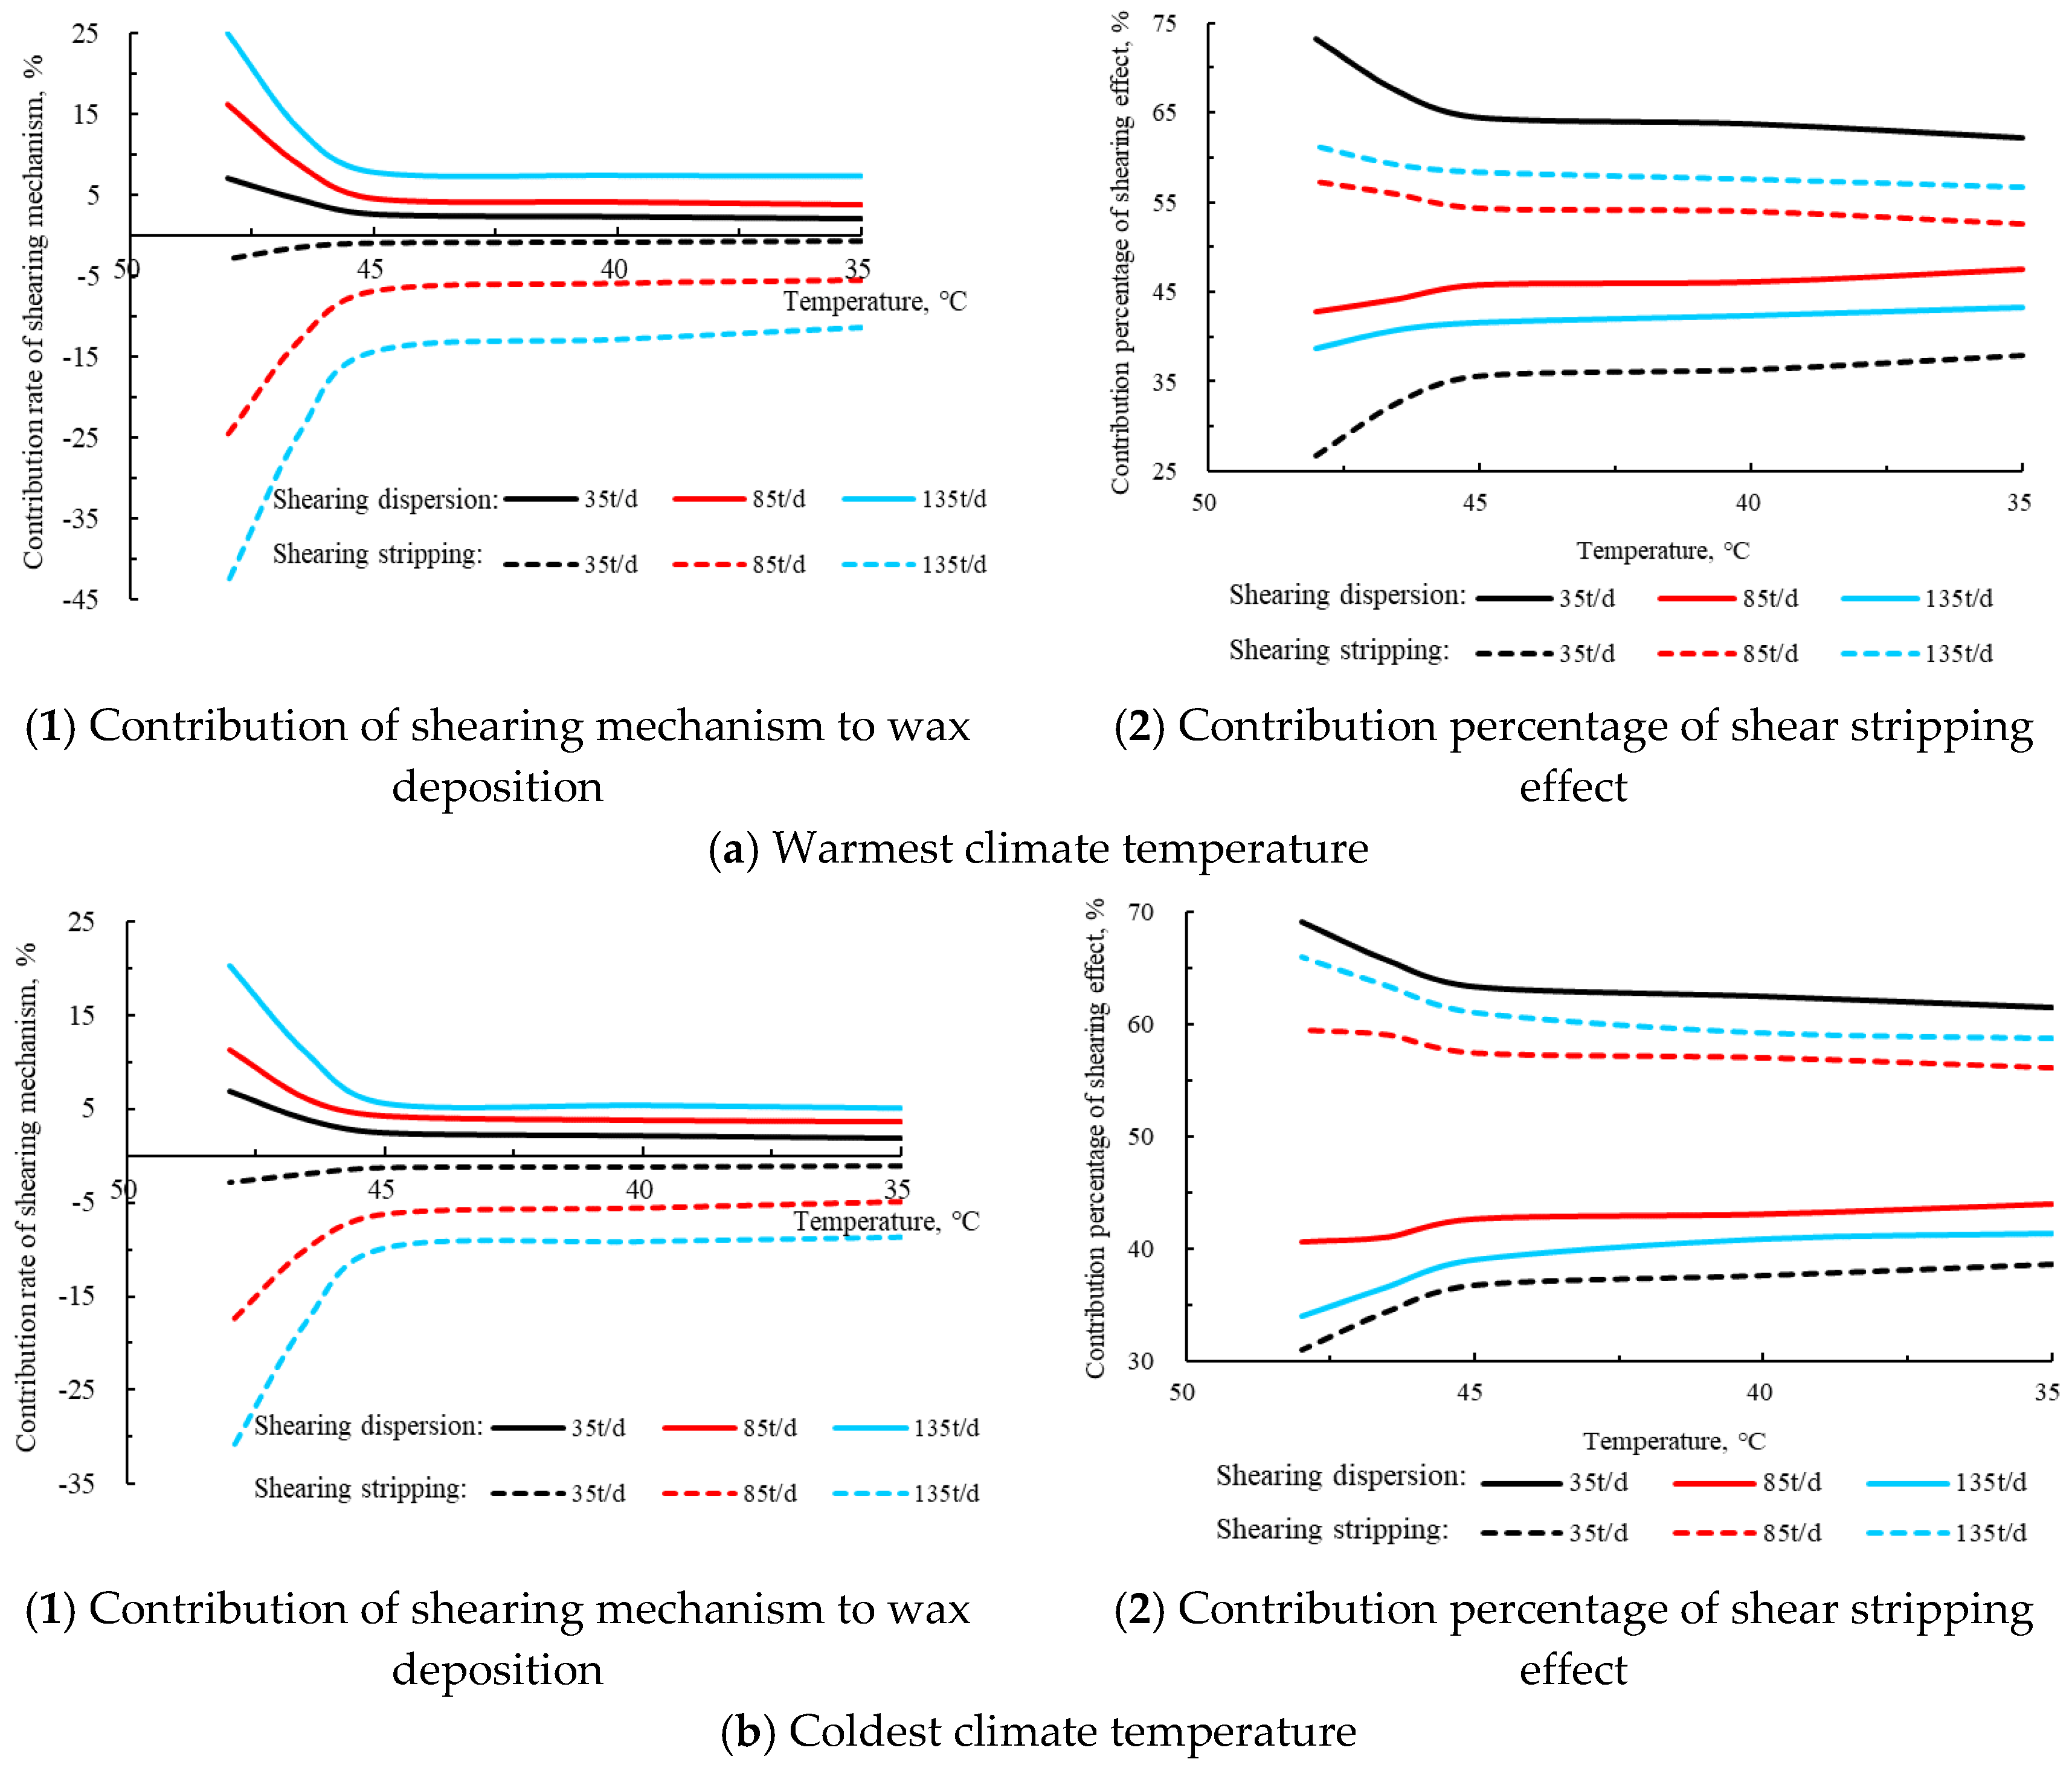
4.2. The Role of Shearing Mechanism to Wax Deposition

Based on the prediction results of the wax deposition law mentioned above, the contribution percentage of shearing dispersion and the stripping effect in wax deposition were quantitatively distinguished and described, and the percentage of the contribution of shearing dispersion and the stripping effect in the mechanism of shearing behavior was distinguished as well.

4.2.1. Shearing Dispersion Coefficient

According to Metzner–Reed’s description of non-Newtonian fluids, R e MR , the Reynolds number of waxy crude oil flow, can be given as follows [36]:
R e MR = ρ υ 2 n D n K 8 ( 6 n + 2 n ) n ,
where ρ is the density of waxy crude oil, kg/m3; υ is the average flow velocity of waxy crude oil, m/s; D is the pipeline inner diameter, m; K is the coefficient of consistency, Pa. sn; and n is the rheological index.
The critical Reynolds number that is described using the power law equation can be used to distinguish laminar flow from turbulent flow for a non-Newtonian fluid, and it can be written as follows:
( R e MR ) C = 404 n ( n + 2 ) n + 2 n + 1 ( 4 n 3 n + 1 ) 2 .
In contrast, when R e MR > ( R e MR ) C , turbulent and laminar flow is observed.
Thus, Figure 9 shows that the R e MR at 38, 42, and 46 °C under the flow rate of DN65 specification pipeline can be obtained. According to the slope characteristics of the curve, the critical pipe flow rate at which the shearing effect is only reflected by shearing dispersion under each working condition can be determined. The results are summarized in Table 3. They indicate that for a waxy crude oil system, the shearing role of the flow field is only shearing dispersion when the flow rate is lower than 25 t/d at 38 °C, 5 t/d at 42 °C, and 5 t/d at 46 °C, respectively.
The shearing dispersion coefficient can be determined by non-linear regression fitting by substituting the data of wax deposition obtained using the equivalent diffusion mechanism (Table 2) in Equation (21); the temperature of the waxy crude oil system is considered to be T and the temperature difference with the surrounding environment is Δ T . The result obtained is a = 5.211 × 10 14 T 4.519 Δ T 5.646 .

4.2.2. Correction Coefficient

To determine the driving energy of shearing dispersion, the flow loop experiments were conducted by monitoring the flow pressure drop under equivalent diffusion; the characteristic data of the flow pressure drop in the pipeline were obtained as summarized in Table 1. The shearing dispersion driving energy was then calculated using Equation (1). Therefore, based on the shearing dispersion driving force and flux obtained by the shearing dispersion driving energy, the correction coefficient ξ = 1.632 × T + 0.024 G 62.313 was determined by non-linear regression fitting. The influence of the temperature of the waxy crude oil system is considered to be T , the temperature difference with surrounding environment, Δ T , and the mass flow rate of pipeline, G , on the shearing dispersion driving force. Finally, the shearing diffusion and stripping flux models can be established, respectively, as shown in Appendix A.

4.2.3. Effect of Oil Flow Temperature on Shearing Mechanisms to Wax Deposition

Figure 10a shows that at the warmest climate temperature of the year, the contribution of the shearing mechanism to wax deposition increased with the crude oil flow temperature below WAT. Figure 10(a1) shows that for the 35, 85, and 135 t/d flow rate conditions, the contribution rate of the shearing mechanism to wax deposition was enhanced from 1.39%, −1.78%, and 4.05% to 4.17%, −8.49%, and −18.00%, respectively, when the crude oil flow temperature increased from 35 to 48 °C. In this section, the positive value indicates that the contribution facilitates the growth of the wax deposition, and a negative value indicates that the contribution reduces the formation of wax deposits. This is the same in another section. There appears to be an exponential relationship between the crude oil flow temperature and the contribution rate of shearing dispersion and stripping. Under the aforementioned three flow rates, the positive contribution rate of the shearing dispersion mechanism to wax deposition was enhanced from 2.04%, 3.74%, and 7.28% to 7.14%, 16.15%, and 24.98%, respectively, when the temperature increased from 35 to 48 °C. The negative contribution rate of the shearing stripping mechanism was enhanced from 0.66%, 5.53%, and 11.34% to 2.96%, 24.64%, and 42.98%, respectively. This can be attributed to the fact that the temperature difference between the oil and the wall increased and the waxy crude oil viscosity decreased with the increase of the crude oil flow temperature below WAT. These observations are consistent with the existing understanding [4,33] that the wax deposition intensifies as the oil temperature increases below the gel point derived from various mechanisms. Moreover, the results indicate that the contribution rate of the shearing stripping mechanism greater than that of the shearing dispersion mechanism increased with the elevating crude oil flow temperature. This revealed that there is a potential competition mechanism between the radial migration ability of wax crystals and the pipe wall shearing intensity. The decrease in the viscosity of waxy crude oil increases the radial velocity gradient of oil flow that boosts wax crystal particles’ radial migration and activates the so-called shearing dispersion effect. However, the decrease in the flow pressure gradient due to the decrease in viscosity is considerable, which in turn considerably affects the pipe wall shearing intensity. This decreases the wax deposits by hydrodynamic scouring and activates the so-called shearing stripping effect.
Furthermore, Figure 10(a2) indicates that the shearing role is dominated by the shearing stripping effect under high flow rate situations of 85 and 135 t/d, and the of percentage contribution of the shearing dispersion effect tends to be smaller as the crude oil flow temperature increases. The average contribution percentage of the two flow rates decreases from 45.39% at 35 °C to 40.73% at 48 °C. However, the dispersion effect is dominant at the low flow rate of 35 t/d, and the percentage of the contribution of the shearing dispersion effect increases with the crude oil flow temperature. The percentage of contribution enhanced from 62.16% at 35 °C to 73.21% at 48 °C. By comparison, the percentage of the contribution of the shearing stripping effect increases with the crude oil flow temperature under high flow rate situations of 85 and 135 t/d. The average percentage of contribution of the two flow rates decreased from 54.61% at 35 °C to 59.28% at 48 °C. At a low flow rate of 35 t/d, the percentage of the contribution of the shearing stripping effect decreases with the increase of the crude oil flow temperature; the percentage of contribution decreased from 37.84% at 35 °C to 26.79% at 48 °C. This can be attributed to the fact that the radial migration of wax particles caused by the increase of the oil flow radial velocity gradient is not as strong as the pipe wall shearing created by the decrease of the pressure drop loss under low flow rate situations. This indicates that the percentage of the contribution of the shearing dispersion mechanism is higher than that of the shearing stripping mechanism, and the percentage of the contribution of the shearing dispersion mechanism was heightened with the increase of the crude oil flow temperature below WAT. When the waxy crude oil flow rate increases, the decrease in the flow pressure drop caused by the decrease in the crude oil viscosity creates favorable conditions for remarkable pipe wall shearing strength; this hydrodynamic scouring effect is stronger than the radial migration ability of wax crystals, reducing the formation of wax deposits. The percentage of the contribution of the shearing stripping mechanism to wax deposition is higher than that of the shearing dispersion mechanism, and the percentage of the contribution also increased with the crude oil flow temperature below WAT.
Figure 10b shows that at the coldest climate temperature of the year, the effect of the oil flow temperature on the contribution characteristics of shearing mechanisms is similar to the transmission conditions under the warmest climatic conditions. The contribution of the shearing mechanism to wax deposition also increased with the crude oil flow temperature below WAT. When the flow rate is low, the shearing dispersion effect is dominant, and its contribution increased with the oil flow temperature below WAT. However, under high flow rate situations, the shearing stripping effect is dominant, and its contribution increased with the oil flow temperature below WAT.

4.2.4. Effect of Flow Rate on Shearing Mechanisms to Wax Deposition

Figure 11 shows that the contribution of the shearing mechanism to wax deposition increased with the waxy crude oil flow rate, and the role of the shearing stripping effect in the wax deposition process was magnified with the constantly increasing flow. This result is in agreement with those of other works [4,33]. Figure 11a shows that at the warmest climate temperature of the year, for oil flow temperatures of 38, 42, and 46 °C, the contribution rate of the shearing mechanism to wax deposition was enhanced from 1.92%, 2.30%, and 2.94% to −6.22%, −6.67%, and −7.53%, respectively, when the flow rate increased from 5 to 180 t/d. There appears to be a linear relationship between the oil flow rate and contribution rates of the shearing dispersion and stripping. Under the aforementioned three oil flow temperatures, the positive contribution rate of the shearing dispersion mechanism to wax deposition was enhanced from 1.92%, 2.30%, and 2.94% to 9.87%, 12.11%, and 14.79%, respectively, when the oil flow rate increased from 5 to180 t/d, and the negative contribution rate of the shearing stripping mechanism enhanced from 0.00%, 0.00%, and 0.00% to 16.09%, 18.78%, and 22.32%, respectively. This can be attributed to the increase of the oil flow radial velocity gradient and pipe wall shearing strength with the oil flow rate. The process of wax crystal particles’ radial migration was facilitated and the effect of hydrodynamic scouring was also created. Both the radial migration of wax crystals and the remarkable pipe wall shearing strength originated from the shearing mechanism established under favorable conditions for wax deposition in pipelines. However, there is a critical flow rate value in the percentage of the contribution from the shearing dispersion and stripping mechanisms. Figure 11(a2,b2) shows that when the flow rate is less than approximately 60 t/d, the percentage of the contribution of the shearing dispersion mechanism to wax deposition is higher than that of the shearing stripping mechanism, and the percentage of the contribution decreases consistently, approaching that from the shearing stripping mechanism with the heightened oil flow rate. When the flow rate is more than approximately 60 t/d, the percentage of the contribution of the shearing dispersion mechanism to wax deposition is lower than that of the shearing stripping mechanism, and the percentage of contribution continues to decrease as the oil flow rate increases. The percentage of the contribution of the shearing stripping effect is dominant as the oil flow rate continues to increase. In conclusion, the characteristic of the contribution must inhibit wax deposition. The results are also in agreement with the predictions of wax deposition obtained using the proposed model in this study.
Figure 11b shows that at the coldest climate temperature of the year, the effect of the oil flow rate on the contribution characteristics of shearing mechanisms is similar to the transmission conditions under the warmest climatic conditions. The contribution of the shearing mechanism to wax deposition continues to increase with the oil flow rate. The process shearing dispersion mechanism was constantly weakened, and the shearing stripping mechanism continually strengthened with the increase in the oil flow rate, and the flow rate was approximately 60 t/d when the dominant mechanism on wax deposition was converted.

5. Conclusions

A novel wax deposition model was established in this work. The model included the flow characteristic parameters of waxy crude oil in pipelines instead of rheological parameters to alleviate shearing energy. The prediction results obtained using the proposed model indicated that the wax deposition rate increased with the decrease of temperature above the crude oil freezing point of about 10 °C, and decreased with the temperature was below the crude oil freezing point of about 10 °C. In contrast, as the oil flow rate increased, the wax deposition rate decreased constantly. An increased theoretical understanding of wax deposition in crude oil indicated that although molecular diffusion is the main mechanism of wax deposition, the role of the shearing mechanism in wax deposition behavior cannot be ignored. During wax deposition in pipeline transmission, the contribution of the shearing mechanism is related to the temperature and oil flow rate, and the results demonstrated that the contribution from the shearing mechanism can reach about 10% on average and nearly 30% on maximum. Considering the two effects of shearing dispersion and shearing stripping coexist, with either one of them being the dominant mechanism, a shearing dispersion flux model and a shearing stripping model were established. Furthermore, a quantitative method to distinguish between the roles of shearing dispersion and shearing stripping in wax deposition was developed. The effect of the shearing mechanism on wax deposition increased with the oil flow temperature. When the oil flow rate is lower than a critical flow rate, the shearing dispersion effect is dominant, and the contribution rate of the dispersion effect increased with the oil flow temperature. When the oil flow rate is higher than a critical flow rate, the shearing stripping effect is dominant, and its contribution rate increased with the oil flow temperature. The effect of the shearing mechanism on wax deposition increased with the oil flow rate, and its contribution was manifested as a negative contribution dominated by shearing stripping. The flow rate was approximately 60 t/d when the dominant mechanism between the shearing dispersion and the shearing stripping on wax deposition was converted in this study. The findings are of great application potential for the design of operational parameters of the actual crude oil pipelines, establishing some pipeline treatment technologies.

Author Contributions

Z.W. performed all the modeling and the experiments. Y.X. prepared the manuscript. Y.Z. and Z.L. collected the field data and discussed the results. Y.L. assisted for experimental design and revised the manuscript. J.H. proofread and edited the manuscript. The whole work was supervised by Z.W. and Y.L.

Funding

This research was funded by the State Key Program of National Natural Science Foundation of China (Grant No. 51534004) and PetroChina Innovation Foundation.

Acknowledgments

The authors gratefully acknowledge the support from the Heilongjiang Touyan Innovation Team Program, the State Key Program of National Natural Science Foundation of China, the PetroChina Innovation Foundation, and the University Nurturing Program for Young Scholars with Creative Talents in Heilongjiang Province.

Conflicts of Interest

The authors declare no conflict of interest.

Nomenclature

A s = internal surface area of pipeline, m2
C w = wax concentration, %
D w = diffusion coefficient of wax in oil, m2/s
E s = shearing energy, J
F wax = wax content of/in wax deposits, %
J c = convective flux, kg/(m2·s)
J s = shear flux, kg/(m2·s)
J sd = shearing dispersion flux, kg/(m2·s)
J sr = shear stripping flux, kg/(m2·s)
J d = diffusive flux, kg/(m2·s)
L = pipeline length, m
Δ P = pressure drop, Pa
P G ¯ = average rising rate of pressure drop gradient, Pa/(m·h)
Q = volume flow rate, 10−5 m3/s
r 0 = inner radius of pipeline, m
r w = distance from the pipe center to the surface of deposits, m
S w = volume concentration of wax crystals on the deposits surface, equivalent to F wax , %
T = temperature, K
t = formation time of deposits, hr
t m = flow time for the maximum pressure drop, hr
V A = molar volume of the wax, valued as 435, cm3/mol
ρ d = density of deposits, kg/m3
ρ wax = density of wax, kg/m3
μ = viscosity of waxy crude oil, Pa.s
k = shearing coefficient
α = aspect ratio of wax crystals

Appendix A

Diffusion coefficient D w :
D w = 13.3 × 10 8 × T 1.47 μ γ V A 0.71 ,
where
γ = 10.2 V A + 2.209 .
Effective diffusion coefficient D e :
D e = D w ρ wax 1 + α 2 F wax 2 1 F wax .
The aspect ratio of wax crystals:
α = 9.439 ln Q + 40.283 .
The relation between solubility coefficient of wax crystal ( d C w d T ) and temperature (T):
When the temperature is in the range −20–44 °C:
d C w d T = 4 × 10 11 T 5 7 × 10 9 T 4 1 × 10 7 T 3 + 3 × 10 6 T 2 + 1 × 10 4 T + 0.0364 ,
where the fitting coefficient ( R 2 ) of this temperature range is 0.9992.
When the temperature is in the range 44–46 °C:
d C w d T = 0.0007 T 3 0.0983 T 2 + 4.4197 T 66.193 ,
where the fitting coefficient ( R 2 ) of this temperature range is 1.0000.
When the temperature is in the range 46–48.5 °C:
d C w d T = 0.0006 T 5 + 0.149 T 4 14.208 T 3 + 677.13 T 2 16131 T + 153664 ,
where the fitting coefficient ( R 2 ) of this temperature range is 0.9971.
The shearing diffusion flux model:
J sd = 5.211 × 10 14 T 4.519 Δ T 5.646 · S w · [ ( 1.632 × T + 0.024 G 62.313 ) · d d L ( E s E sr ) K π r w 2 ] 1 n .
The shearing stripping flux model:
J sr = S w · 4.01 × 10 14 · ρ wax · | d E s d L | r w r w · μ · F wax 2.3 5.211 × 10 14 T 4.519 Δ T 5.646 · S w · [ ( 1.632 × T + 0.024 G 62.313 ) · d d L ( E s E sr ) K π r w 2 ] 1 n

References

  1. Liu, Y.; Chen, S.; Guan, B.; Xu, P. Layout optimization of large-scale oil-gas gathering system based on combined optimization strategy. Neurocomputing 2019, 332, 159–183. [Google Scholar] [CrossRef]
  2. Wang, Z.; Bai, Y.; Zhang, H.; Liu, Y. Investigation on gelation nucleation kinetics of waxy crude oil emulsions by their thermal behavior. J. Pet. Sci. Eng. 2019, 181, 106230. [Google Scholar] [CrossRef]
  3. Rui, Z.; Peng, F.; Ling, K.; Chang, H.; Chen, G.; Zhou, X. Investigation into the performance of oil and gas projects. J. Nat. Gas Sci. Eng. 2017, 38, 12–20. [Google Scholar] [CrossRef]
  4. Wu, X.; Pu, H.; Zhu, K.; Lu, S. Formation damage mechanisms and protection technology for Nanpu nearshore tight gas reservoir. J. Pet. Sci. Eng. 2017, 158, 509–515. [Google Scholar] [CrossRef]
  5. Leporini, M.; Marchetti, B.; Corvaro, F.; Polonara, F. Reconversion of offshore oil and gas platforms into renewable energy sites production: Assessment of different scenarios. Renew. Energy Int. J. 2019, 135, 1121–1132. [Google Scholar] [CrossRef]
  6. Venkatesan, R.; Nagarajan, N.R.; Paso, K.; Yi, Y.B.; Sastry, A.M.; Fogler, S.H. The strength of paraffin gels formed under static and flow conditions. Chem. Eng. Sci. 2005, 60, 3587–3598. [Google Scholar] [CrossRef]
  7. Zendehboudi, S.; Shafiei, A.; Bahadori, A.; James, L.A.; Elkamel, A.; Lohi, A. Asphaltene precipitation and deposition in oil reservoirs technical aspects, experimental and hybrid neural network predictive tools. Chem. Eng. Res. Des. 2014, 92, 857–875. [Google Scholar] [CrossRef]
  8. Mendell, J.L.; Jessen, F.W. Paraffin inhibition and flow improvement in crude oil system. J. Can. Pet. Technol. 1972, 11, 60–66. [Google Scholar] [CrossRef]
  9. Wang, W.; Huang, Q.; Zheng, H.; Li, S.; Long, Z.; Wang, Q. Investigation of wax deposition and effective diffusion coefficient in water-in-oil emulsion system. J. Therm. Anal. Calorim. 2018, 134, 1031–1043. [Google Scholar] [CrossRef]
  10. Huang, Q.; Li, Y.; Zhang, J. Unified wax deposition model. Acta Pet. Sin. 2008, 29, 459–462. [Google Scholar]
  11. Bern, P.A.; Withers, V.R.; Cairns, J.R. Wax deposition in crude oil pipeline. In Proceedings of the European Offshore Petroleum Conference, London, UK, 21–24 October 1980. [Google Scholar]
  12. Correra, S.; Fasano, A.; Fusi, L.; Merino-Garcia, D. Calculating deposit formation in the pipelining of waxy crude oils. Meccanica 2007, 42, 149–165. [Google Scholar] [CrossRef]
  13. Zhang, Y.; Gong, J.; Ren, Y.; Wang, P. Effect of emulsion characteristics on wax deposition from water-in-waxy crude oil emulsions under static cooling conditions. Energy Fuels 2010, 24, 1146–1155. [Google Scholar] [CrossRef]
  14. Miao, Q.; Jiang, B.; Tao, J.; Hu, S.; Liu, J. A model for predicting the average hydraulic wax deposition thickness of a long-term unpigged crude pipeline. In Proceedings of the ASME International Pipeline Conference, Calgary, AB, Canada, 27 September–1 October 2010; pp. 345–349. [Google Scholar]
  15. Zhou, Y.; Gong, J.; Wang, P. Modeling of wax deposition for water-in-oil dispersed flow. Asia-Pac. J. Chem. Eng. 2016, 11, 108–117. [Google Scholar] [CrossRef]
  16. Azevedo, L.F.A.; Teixeira, A.M. A critical review of the modeling of wax deposition mechanisms. Pet. Sci. Technol. 2003, 21, 393–408. [Google Scholar] [CrossRef]
  17. Burger, E.D.; Perkins, T.K.; Striegler, J.H. Studies of wax deposition in the Trans Alaska pipeline. J. Pet. Technol. 1981, 33, 1075–1086. [Google Scholar] [CrossRef]
  18. Hamouda, A.A.; Ravnoy, J.M. Prediction of wax deposition in pipelines and field experience on the influence of wax on drag reducer performance. In Proceedings of the 24th Annual OTC, Houston, TX, USA, 4–7 May 1992. [Google Scholar]
  19. Majeed, A.; Bringedal, B.; Overa, S. Model calculates wax deposition for N. Sea oils. Oil Gas J. 1990, 88, 63–69. [Google Scholar]
  20. Huang, Z.Y.; Michal, S.; Ravi, K.; Fogler, S.H. Wax deposition modeling of oil/water stratified channel flow. AIChE J. 2011, 57, 841–851. [Google Scholar] [CrossRef]
  21. Nazar, A.R.S.; Dabir, B.; Islam, M.R. Experimental and mathematical modeling of wax deposition and propagation in pipes transporting crude oil. Energy Sour. 2007, 27, 185–207. [Google Scholar] [CrossRef]
  22. Zougari, M.I. Shear driven crude oil wax deposition evaluation. J. Pet. Sci. Eng. 2010, 70, 28–34. [Google Scholar] [CrossRef]
  23. Zheng, S.; Fogler, S.H. Fundamental investigation of wax diffusion characteristics in water-in-oil emulsion. Ind. Eng. Chem. Res. 2015, 54, 4420–4428. [Google Scholar] [CrossRef]
  24. Couto, G.H.; Chen, H.; Dellecase, E.; Sarica, C.; Volk, M. An investigation of two-phase oil/water paraffin deposition. SPE Prod. Oper. 2008, 23, 49–55. [Google Scholar] [CrossRef]
  25. Leporini, M.; Terenzi, A.; Marchetti, B.; Giacchetta, G.; Corvaro, F. Experiences in numerical simulation of wax deposition in oil and multiphase pipelines: Theory versus reality. J. Pet. Sci. Eng. 2019, 174, 997–1008. [Google Scholar] [CrossRef]
  26. Leporini, M.; Terenzi, A.; Marchetti, B.; Corvaro, F.; Polonara, F. On the numerical simulation of sand transport in liquid and multiphase pipelines. J. Pet. Sci. Eng. 2019, 175, 519–535. [Google Scholar] [CrossRef]
  27. Giacchetta, G.; Leporini, M.; Marchetti, B.; Terenzi, A. Numerical study of choked two-phase flow of hydrocarbons fluids through orifices. J. Loss Prev. Process Ind. 2014, 27, 13–20. [Google Scholar] [CrossRef]
  28. Singh, P.; Venkatesan, R.; Fogler, S.H. Formation and aging of incipient thin film wax-oil gels. Aiche J. 2000, 46, 1059–1074. [Google Scholar] [CrossRef]
  29. Pal, R. Rheology of simple and multiple emulsions. Curr. Opin. Colloid Interface Sci. 2011, 16, 41–60. [Google Scholar] [CrossRef]
  30. Bruno, A.; Sarica, C.; Chen, H.; Volk, M. Paraffin deposition during the flow of water-in-oil and oil-in-water dispersions in pipes. In Proceedings of the SPE Annual Technical Conference and Exhibition, SPE-114747, Denver, CO, USA, 21–24 September 2008. [Google Scholar]
  31. Trallero, J.L.; Sarica, C.; Brill, J.P. A study of oil-water flow patterns in horizontal pipes. SPE Prod. Oper. 1997, 12, 165–172. [Google Scholar] [CrossRef]
  32. Li, R.; Huang, Q.; Huo, F.; Fan, K.; Li, W.; Zhang, D. Effect of shear on the thickness of wax deposit under laminar flow regime. J. Pet. Sci. Eng. 2019, 181, 106212. [Google Scholar] [CrossRef]
  33. Wang, Z.; Liu, Y.; Li, J.; Zhuge, X.; Zhang, L. Study on two-phase oil-water gelling deposition behavior in low-temperature transportation. Energy Fuels 2016, 30, 4570–4582. [Google Scholar] [CrossRef]
  34. Wang, Z.; Lin, X.; Yu, T.; Zhou, N.; Zhong, H.; Zhu, J. Formation and rupture mechanisms of visco-elastic interfacial films in polymer-stabilized emulsions. J. Dispers. Sci. Technol. 2019, 40, 612–626. [Google Scholar] [CrossRef]
  35. Yang, W.; Wang, J.; Hua, M.; Zhang, Y.; Shi, X. Characterization of effluent organic matter from different coking wastewater treatment plants. Chem. Environ. Toxicol. Risk Assess. 2018, 203, 68–75. [Google Scholar] [CrossRef] [PubMed]
  36. Metzner, A.B.; Reed, J.C. Flow of non-newtonian fluids-correlation of the laminar, transition, and turbulent-flow regions. Am. Inst. Chem. Eng. 1955, 1, 434–440. [Google Scholar] [CrossRef]
Figure 1. Schematic of the shearing energy concept for waxy crude oil flowing through a pipeline.
Energies 12 04325 g001
Figure 2. Schematic of the wax deposition process in a shearing field.
Energies 12 04325 g002
Figure 3. Schematic of work generated by the wall shearing force.
Energies 12 04325 g003
Figure 4. Schematic of the flow loop device.
Energies 12 04325 g004
Figure 5. Schematic of the cold finger device.
Energies 12 04325 g005
Figure 6. Wax mass percent as a function of temperature for the experimental crude oil.
Energies 12 04325 g006
Figure 7. Wax deposition rate as a function of temperature.
Energies 12 04325 g007
Figure 8. Wax deposition rate as a function of the flow rate.
Energies 12 04325 g008
Figure 9. Reynolds number curve of waxy crude oil at different pipeline flow rates.
Energies 12 04325 g009
Figure 10. Effect of oil flow temperature on shearing mechanisms to wax deposition.
Energies 12 04325 g010
Figure 11. Effect of oil flow temperature on shearing mechanisms to wax deposition.
Energies 12 04325 g011aEnergies 12 04325 g011b
Table 1. Flow pressure drop data.
ItemExperimental ParametersTest Results
Ambient Temperature, °COil Temperature, °CFlow Rate, t/dMaximum Pressure Drop, kPaFlow Time, h
Pressure drop data in flow loops experiment1238853.5051.6
42203.6371.3
503.4802.6
853.3123.0
1202.6244.2
46852.5305.5
−438853.6161.0
42203.8040.8
503.5191.2
853.3401.6
1202.6072.3
46852.6403.2
Pressure drop data under the condition of equivalent diffusion2838254.1170.75
324253.9100.85
364653.6241.25
Table 2. Data of wax deposition with equivalent diffusion mechanism.
Experimental ParametersTest Results
Test cup inner Wall Temperature °CTemperature Difference °CShearing Parameters of Flow FieldWax Deposition Rate, g/(m2·h)
Stirring Shearing Rate, 1/sEquivalent Velocity, m/s
381000165.33
10.630.104190.06
421000141.57
12.060.021162.24
461000113.46
19.640.021130.01
Table 3. Discriminatory flow rate of the shearing effect and Reynolds number bounds.
38 °C42 °C46 °C
Critical Flow Rate, t/dReynolds Number R e M R Critical Flow Rate, t/dReynolds Number R e M R Critical Flow Rate, t/dReynolds Number R e M R
250.9251.4252.67

