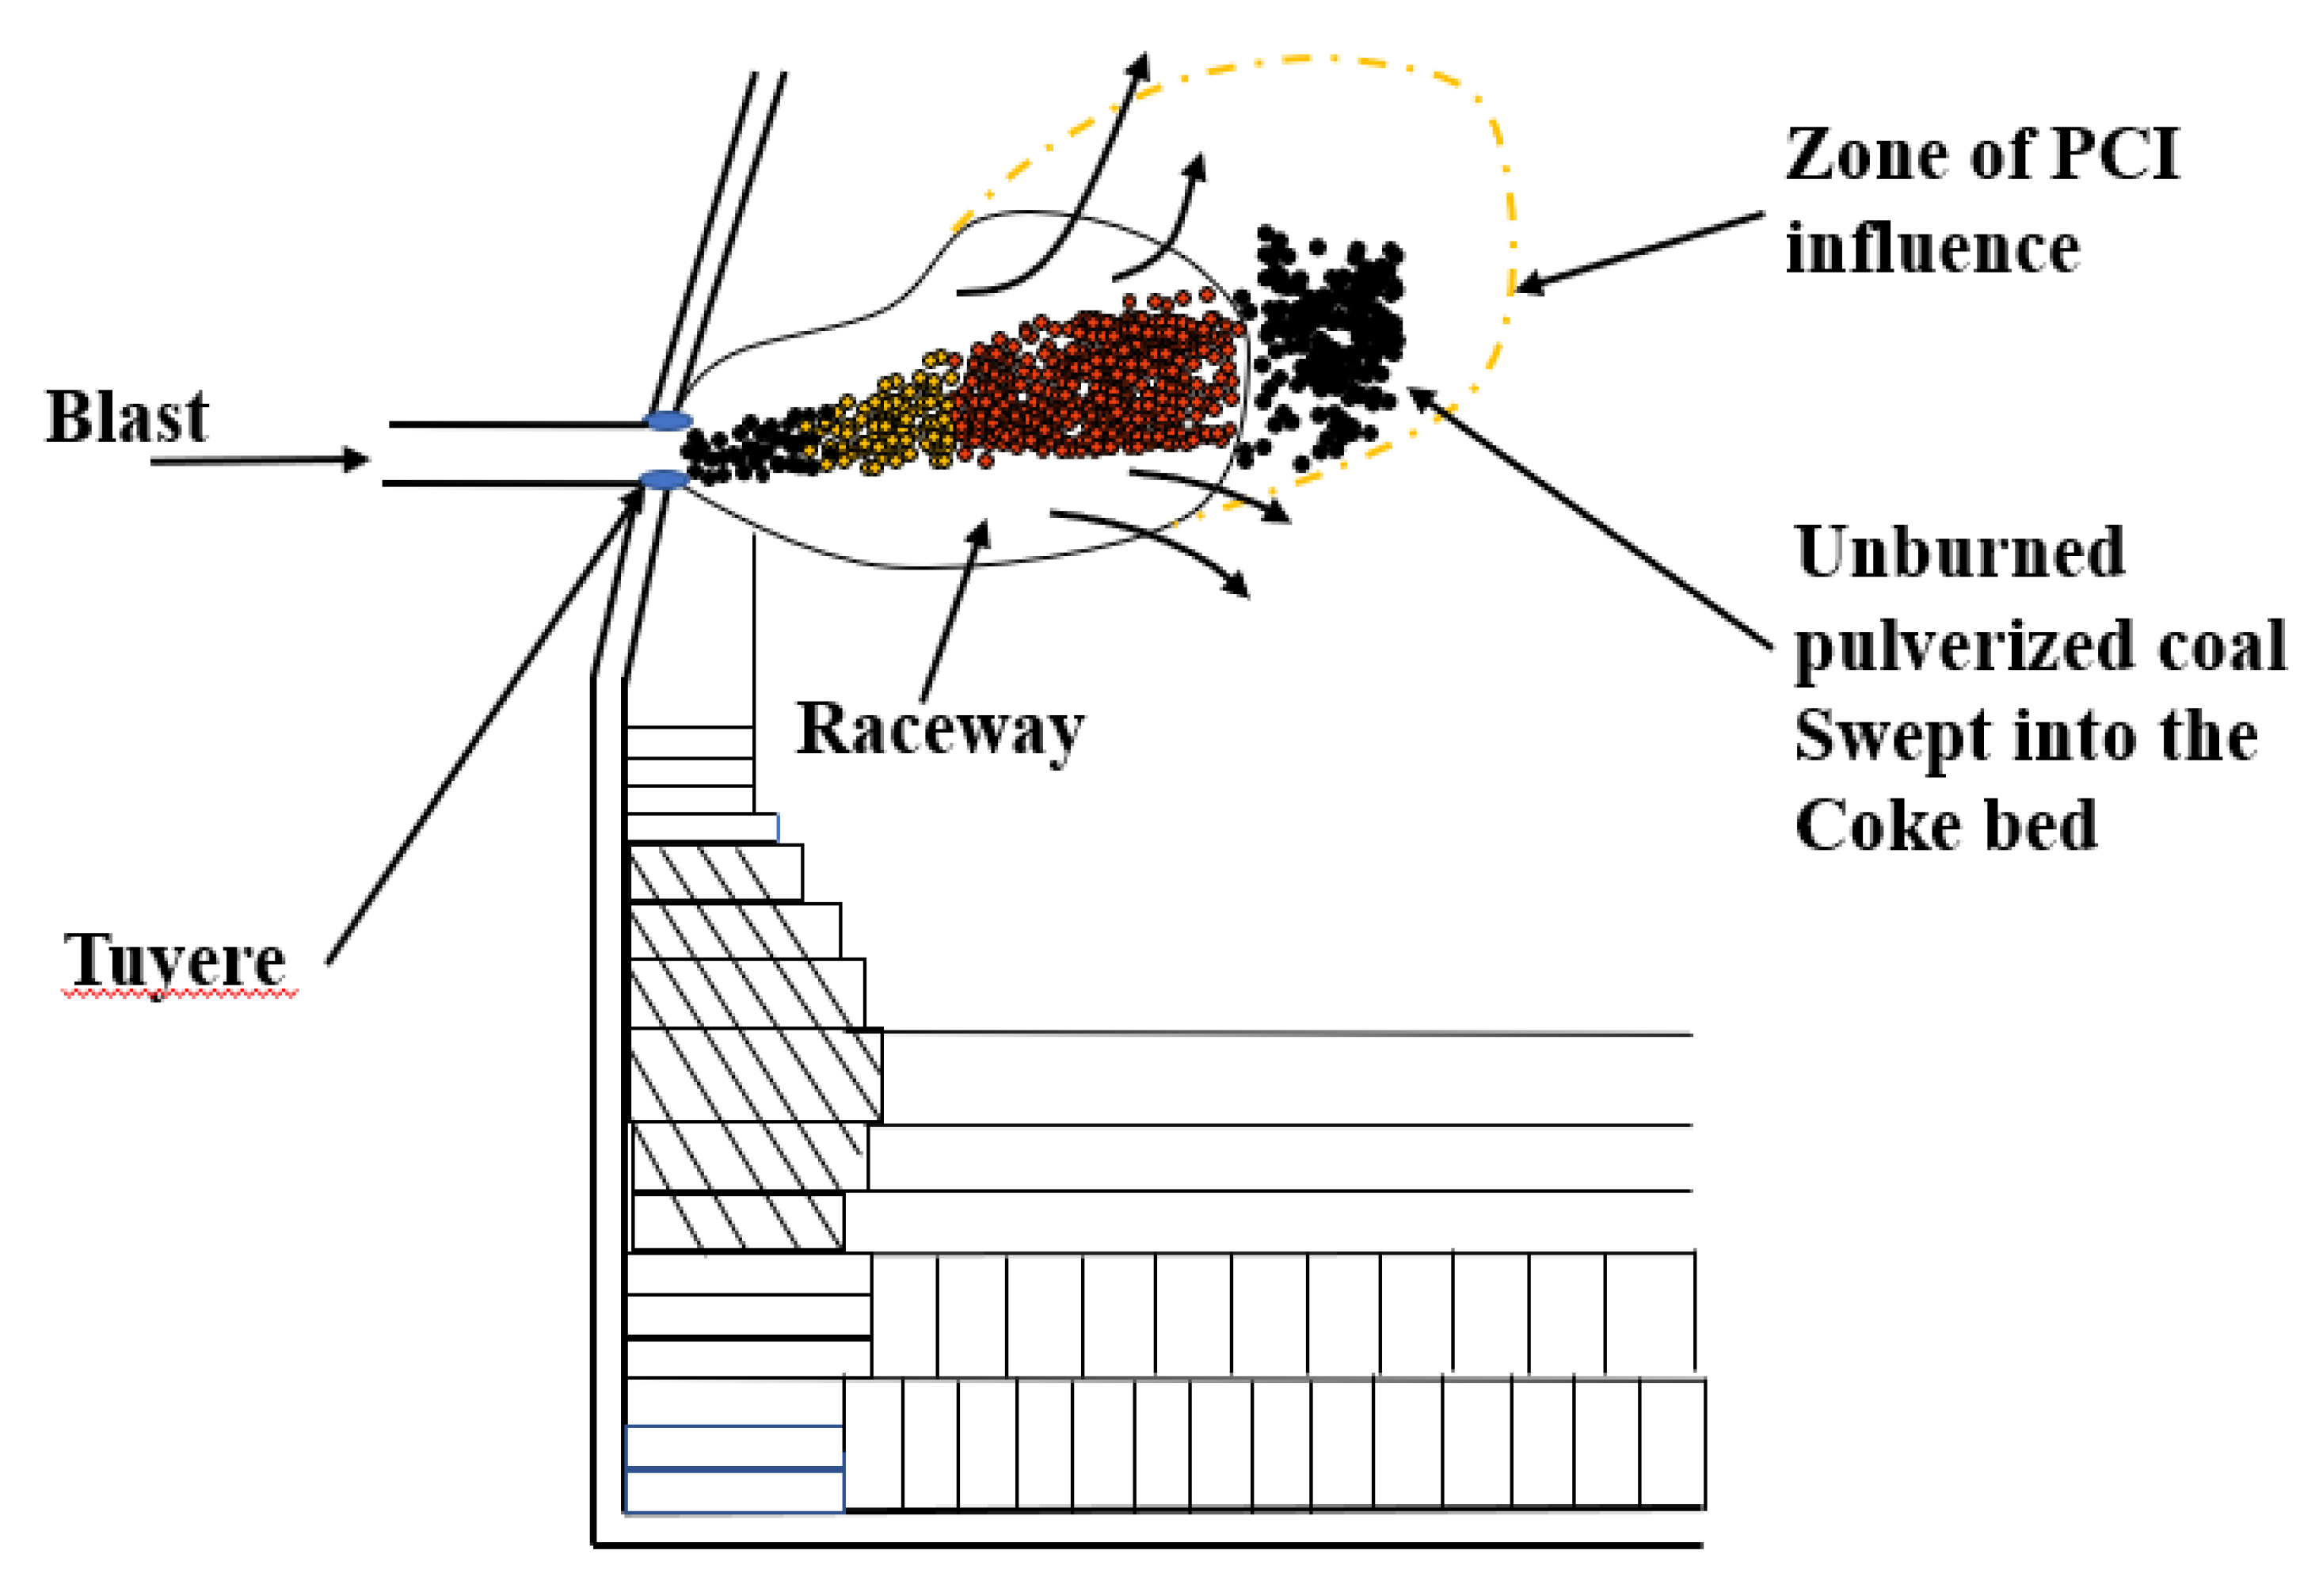
Article

Gasification Characteristics and Kinetics of Unburned Pulverized Coal in Blast Furnaces

1
State Key Laboratory of Refractories and Metallurgy, Key Laboratory for Ferrous Metallurgy and Resources Utilization of Ministry of Education, Wuhan University of Science and Technology, Wuhan 430081, China
2
Chair of Ferrous Metallurgy, Montanuniversität Leoben, Franz-Josef-Straße 18, A-8700 Leoben, Austria
*
Authors to whom correspondence should be addressed.
Energies 2019, 12(22), 4324; https://doi.org/10.3390/en12224324
Submission received: 21 September 2019 / Revised: 6 November 2019 / Accepted: 9 November 2019 / Published: 13 November 2019

Abstract

:
Pulverized coal injected into a blast furnace (BF) burns incompletely in a very limited amount of time. A considerable amount of unburned pulverized coal (UPC) escapes from the raceway to the coke layer. The unburned pulverized coal reacts with CO2 in the coke layer, and this has a very significant impact on the operation of the BF. The gasification reaction characteristics of the UPC with CO2 were assessed by thermogravimetric analysis. The microstructure and specific surface area of the pulverized coal and UPC were characterized by scanning electron microscopy (SEM), and a specific surface area testing apparatus together with the Brunauer-Emmett-Teller (BET) method, respectively. The results showed that Qingding UPC requires a higher temperature to complete the gasification reaction. At the same heating rate, the Tm (maximum reaction rate temperature) of the Shenhua UPC is much lower and the reaction rate is larger than those of the Qingding UPC. An increased heating rate is beneficial for the gasification reaction of the two UPCs. The kinetics analysis results showed that the optimal mechanism function models for the Shenhua and Qingding UPCs are chemical reaction models. The apparent activation energies of gasification of the Shenhua UPC and Qingding UPC under different conditions were 269.89–223.41 KJ/mol and 266.70–251.54 KJ/mol, respectively.

1. Introduction

Presently, global warming and air pollution are becoming extremely serious concerns and are attracting increasing attention. Notably, the iron and steel industry need to prioritize reducing CO2 emissions. The amount of CO2 emissions from iron and steel plants accounts for 5–7% of the total global CO2 emissions [1,2]. To reduce the cost of ironmaking and the emissions of CO2 and other polluting gases, iron and steel enterprises worldwide have carried out studies on reducing the coke ratio. Many new technologies to reduce the use of coke in blast furnaces (BFs), such as pulverized coal injection (PCI), ferro-coke technology and natural gas injection have been adopted [3,4,5,6,7]. PCI is a useful method that can reduce coke consumption and ironmaking costs. Coal injection with high oxygen enrichment has become a mainstream BF approach [8,9].
Mathieson et al. [10] noted that the combustion of pulverized coal is always incomplete in a limited time. A large amount of unburned pulverized coal (UPC) escapes from the raceway and enters the coke bed. A schematic of UPC production and the movement track is shown in Figure 1. Xiang et al. [11] also stated that a large amount of UPC is present in the blast furnace because the pulverized coal cannot be completely burned in a space with a narrow tuyere. Generally, a large amount of coal is injected to minimize the coke ratio in the BF. Once the amount of coal injection has increased to a certain extent, a large amount of UPC appears in the BF [12]. The UPC behaves in several ways: it participates in the gasification reaction of carbon; it participates in the carburization reaction of the hot metal; it participates in the direct reduction reaction of iron; it deposits in the slag; and it escapes with the gas [13]. When the amount of UPC reaches a certain threshold, it adversely affects the BF operation, for example, by creating poor permeability and unstable pressure [14]. Yu et al. [15] studied the behavior of UPC using a thermal model of a coke-packed bed under similar operational conditions as those at Baosteel. The results showed that UPC participates in the gasification reaction of coke at 1100 °C, and the strength of the coke increases from 55.9% to 63.2%. The existence of an appropriate amount of UPC can protect coke from degradation. Takashi [16] used a mathematical model to quantitatively analyze the movement and accumulation of UPC in the lower part of the BF. The results indicated that the movement of UPC was affected by the gas flow rate, particle size and amount of pulverized coal. Diao et al. [17] analyzed the effect of UPC on the slag viscosity by adding UPC to the slag. The results indicated that the slag viscosity increased with the addition of UPC. Iwanaga [18] studied the effects of different proportion of CO2, CO, N2 and different temperature on the gasification reaction of unburned coal and coke. The results showed that the gasification reaction rate of unburned coal was seven times that of coke, and unburned coal inhibited the degradation of coke.
Xiang et al. [11] investigated the combustion characteristics of two kinds of UPC by using the thermogravimetric analysis method and the reaction kinetics mechanism of UPC gasification with CO2 at 1000–1100 °C. An excellent kinetic analysis was conducted and it has greatly enhanced the understanding of the reaction kinetics of coal in a blast furnace. However, the UPC was prepared in a high-temperature furnace in Xiang’s study; this equipment was not able to simulate the injection status of coal with high speed in the raceway.
In order to simulate the conditions of a blast furnace raceway more realistically, self-developed equipment was used in this study. The UPC was prepared with a high temperature and a high speed in the simulated blast furnace atmosphere. Furthermore, the gasification characteristics of two typical kinds of UPCs at different heating rates were studied in this paper. The kinetic parameters of the gasification reaction were calculated by the gas-solid reaction mechanism function. The microstructure and specific surface area of the pulverized coal and UPC were characterized by scanning electron microscopy (SEM) and a specific surface area testing apparatus along with the Brunauer-Emmett-Teller (BET) method to reveal the gasification behavior of UPC powder in a BF. This study helps in the selection of pulverized coal and provides a theoretical basis for the improvement of coal injection operations.

2. Experimental Materials and Methods

2.1. Raw Materials

The two kinds of pulverized coal (Shenhua and Qingding) used in this study were from a BF in China. After screening, pulverized coal with a particle size of 160–200 mesh was selected as the experimental material. The proximate and ultimate analyses of the Shenhua and Qingding pulverized coal was carried out according to the Chinese standard (GB/T212-2008 and GB/T214-2007, GB/T476-2008). The results are shown in Table 1. From the proximate analysis, the fixed carbon and ash content of the Qingding pulverized coal is much higher than that of Shenhua pulverized coal, but the moisture and volatile matter content are much lower.

2.2. Experimental Equipment and Methods

2.2.1. Combustion Conversion Degree

The Shenhua UPC and Qingding UPC were prepared using a self-developed coal injection simulation device. This device consisted of a hot blast stove, coal combustion furnace, coal injection lance, and a data acquisition and control system. The hot blast furnace and coal combustion furnace were heated using a MoSi2 heating element. The height and inner diameter of the alumina tube in the hot blast stove are 560 mm and 60 mm, respectively, and the height and inner diameter of the alumina tube in the combustion furnace are 1050 mm and 55 mm, respectively. Because the actual blast temperature of the BF was 1100–1250 °C [17], the air flow needed to be heated from ambient temperature to 1200 °C through the hot blast stove. In order to achieve this target, the temperature of the hot blast stove was set as 1400 °C, and the temperature of the pulverized coal combustion furnace was set as 1200 °C. The coal injection lance is shown as 14 in Figure 2, and it is composed of an upper pulverized coal bunker (capacity: 10 g), a pulverized coal conveying winch, rotating motor and coal injection pipe. The pulverized coal in the coal bunker was transported into the coal injection pipe for injection through the winch driven by the motor. When the certain amount of pulverized coal was transported, the N2 injection valve was opened, and the pulverized coal was fed into the combustion furnace by a N2 gas jet for the combustion reaction. The heating temperature was controlled by the PID(proportional-integral-derivative control)-controllers, and the gas flow was controlled by the mass flowmeter. The device control software was developed by the Xingyuanda Company and installed in a computer to obtain the experimental data and adjust the operation parameters.
The UPC was prepared as follows. First, we prepared 50 g pulverized coal samples of less than 200 meshes, weighed 10 g of the pulverized coal samples and put them into the coal bunker. Secondly, we heated the hot blast stove and combustion furnace. The pulverized coal combustion furnace was heated to 950 °C in 100 min, then increased from 950 °C to 1200 °C in 60 min, and then kept at 1200 °C. The hot blast stove was heated to 200 °C in 30 min, increased from 200 °C to 800 °C in 60 min, then increased from 800 °C to 1400 °C in 100 min, and then held at 1400 °C. Thirdly, the air was blown into the hot blast stove at a flow rate of 20 L/min. The air passed through the hot blast stove and then arrived at the pulverized coal combustion stove to participate in the coal combustion. Fourthly, after the hot blast stove and the pulverized coal combustion furnace were raised to the specified temperature and stabilized for 5 min, and then the coal injection operation started. N2 was used as the carrier gas, and the rotating frequency of the stepping rotating motor was 50 R/min. After 1 min rotating, the N2 valve was opened, and the coal in the injection pipe was blown into the combustion furnace. In this experiment, the coal injection rate was about 0.371 g/min, and the interval between two injections was 5 s. Finally, after the experiment was completed, the ash collecting tank was removed and the UPC was collected. The experimental simulation device for BF coal injection is shown in Figure 2. After screening the UPC, particles of 160–200 mesh were selected for the subsequent experiments.

2.2.2. Specific Surface Area

The specific surface area of the pulverized coal was characterized by a JW-BK112 specific surface area and pore size analyzer. The experiment followed the Chinese standard (GB/T19587-2004).

2.2.3. Microscopic Characterization

The micro-morphology of the two kinds of pulverized coal and UPC was characterized using a high-resolution field-emission scanning electron microscope (Nova400-Nano) at 1000× and 2000×.

2.2.4. Gasification Reaction

Gasification experiments were conducted using an HCT-3 thermal analyzer. Approximately 10-mg samples were placed in an alumina crucible (Ф6.5 mm × 1.5 mm) with 100 mL/min of carbon dioxide. The UPC obtained by the pulverized coal combustion test was heated from ambient temperature to 1250 °C at heating rates of 5 °C/min, 10 °C/min, 15 °C/min, and 20 °C/min.
The computer automatically collects the mass loss of UPC during the heating process, and the TG and DTG of the sample can be calculated by the following equations:
TG = ( 100 m t m 1 m e m 1 ) × 100 %
DTG = 1 m 1 d m d t × 100 %
where m1 is the initial mass of the sample at time t1, mg; mt is the mass of the sample at time t, mg; and me is the residual mass of the sample at the end of the reaction, mg.

3. Results and Discussion

3.1. Combustion Conversion Degree of Pulverized Coal

The combustion conversion degree was calculated according to the ash balance calculation method [19,20]:
R = A 1 A 0 A 1 × ( 1 A 0 100 ) × 100 %
where R is the pulverized coal combustion conversion degree; A0 is the ash content before pulverized coal combustion, %; and A1 is the ash content of UPC, %. The combustion conversion degree results are shown in Table 2.
As shown in Table 2, the combustion conversion degree of the Shenhua pulverized coal is much higher than that of the Qingding pulverized coal. This can be explained as follows. Firstly, the volatile matter content of the Shenhua pulverized coal is higher than that of Qingding pulverized coal. The higher the volatile content is, the higher the degree of combustion conversion. Also, it can be observed in Figure 3 that most particles of Shenhua pulverized coal are rough and have obvious protrusions, which increases the contact area between the pulverized coal and oxygen. Furthermore, the specific surface area of the Shenhua pulverized coal is larger than that of Qingding pulverized coal, as shown in Figure 4, which enhances the adsorption of oxygen. Therefore, the Shenhua pulverized coal has a higher degree of combustion conversion.

3.2. Gasification Characteristics of UPC

The thermogravimetry (TG) and differential thermogravimetry (DTG) curves of the Shenhua UPC and Qingding UPC at heating rates of 5 °C/min, 10 °C/min, 15 °C/min and 20 °C/min are shown in Figure 5 and Figure 6. Comparing the TG and DTG curves at the same heating rate, it can be seen that the Qingding UPC required a higher temperature to complete the gasification reaction. The maximum reaction rate temperature of the Shenhua UPC is lower and the reaction rate is higher. The gasification reaction of the Shenhua UPC is more intense. As the heating rate increases, the maximum reaction rate of both UPCs increases gradually. A higher heating rate enhances the gasification reaction of the UPCs.
To quantitatively analyze the difference between the gasification characteristics of the Shenhua UPC and Qingding UPC, the gasification result at the heating rate of 10 °C/min was selected, as shown in Figure 7. It can be observed that the reaction rate curves of the two kinds of UPC have similar characteristics with a single peak. The process of UPC gasification can be divided into three stages: preheating, rapid gasification reaction, and a termination stage. The second stage is the most intense during the gasification process, therefore, it will better reflect the gasification characteristics of the UPC. To quantitatively compare and analyze the gasification characteristics of the two UPCs, the gasification characteristic parameters were defined. The temperatures at conversion rates of 10% and 90% were defined as the gasification initial reaction temperature T10 and termination reaction temperature T90, respectively. The temperature at the reaction rate peak was defined as Tm.
The gasification characteristic parameters of the two UPCs are shown in Table 3. It can be seen from the table that T10, T90 and Tm of the Shenhua UPC are 839 °C, 964 °C and 919 °C, respectively, whereas T10, T90 and Tm of the Qingding UPC are 934 °C, 1090 °C and 1047 °C, respectively. The results show that T10, T90 and Tm of the Shenhua UPC are lower than those of the Qingding UPC, indicating that the gasification reaction of the Shenhua UPC begins at a lower temperature and the Qingding UPC needs higher temperatures to complete gasification.

3.3. Effect of the Heating Rate on the Gasification Behaviour of the UPC

Figure 5 and Figure 6 show the TG and DTG curves for the Shenhua UPC and Qingding UPC at different heating rates. The gasification characteristic temperatures are listed in Table 4. Figure 5 and Figure 6 show that as the heating rate increases, the gasification reaction curve gradually moves into the high temperature zone. From Table 4, it can be seen that as the heating rate increased, the characteristic temperature T10 of the Shenhua UPC increased from 824 °C to 871 °C, Tm increased from 893 °C to 961 °C, and T90 increased from 941 °C to 1019 °C. The characteristic temperature T10 of the Qingding UPC increased from 908 °C to 979 °C, Tm increased from 998 °C to 1099 °C, and T90 increased from 1047 °C to 1146 °C. Thus, T10, T90 and Tm increased with an increasing heating rate. On the one hand, this phenomenon occurs because as the heating rate increases, CO2 consumes less UPC at the same temperature. On the other hand, the gasification reaction of UPC is composed of two steps: heat transfer from the outside to the inside and mass transfer from the inside to the surface of UPC. The greater the heating rate, the greater the temperature difference between the inside and outside, resulting in the lag of heat and mass transfer.

3.4. Relationship between Structural Characteristics and Gasification Reaction of UPC

To further study the reasons for the different gasification reaction performance of the two UPCs, the microstructure of the UPC was characterized by SEM, as shown in Figure 8. Most of the Shenhua UPC particles have irregular protrusions and large open pores, which indicates that the combustion of Shenhua pulverized coal is very effective during the combustion experiment. Most of the surface of the Qingding UPC is relatively flat with no obvious protrusions. The open pores are smaller than those in the Shenhua UPC. Therefore, the Shenhua UPC has a larger contact area with CO2, and the gasification reaction is easier to develop than that in the Qingding UPC.

3.5. Kinetics of UPC Gasification

During the entire UPC gasification process, the mass loss rate is a function of the reaction time and reaction temperature, and the functional relationship is expressed as:
d x d t = k ( T ) f ( x )
where d x d t is the mass loss rate, s−1; k ( T ) is the rate constant, which is a function of temperature; f ( x ) is the differential form of the reaction mechanism function; t is the reaction time, s; and x is the reaction conversion.
The rate constant k ( T ) is calculated by the Arrhenius equation:
k = A e x p ( E R T )
where A is the pre-exponential factor; E is the activation energy, kJ/mol; and R is the standard molar gas constant, kJ mol−1 K−1.
During the non-isothermal heating process, the heating rate β is constant:
β = d T d t
The following formula can be obtained from Equations (5) and (6):
d x d T = A β e x p ( E R T ) f ( x )
Equation (7) can be integrated to give:
G ( x ) = 0 x d x f ( x ) = A β 0 T e x p ( E R T ) d T
Equations (9) and (10) can be obtained by the approximate calculation:
A β 0 T e x p ( E R T ) d T A R T 2 β E ( 1 2 R T E ) e x p ( E R T )
1 2 R T E 1
The following formula can be obtained from Equations (9) and (10):
ln [ G ( x ) T 2 ] = ln ( A R β E ) E R T
During an actual reaction, E, A and β are constants; therefore, ln(AR/βE) in Equation (11) is also a constant. A straight line can be obtained if the left-hand side of Equation (11) is plotted versus 1/T. The slope of this line is −E/R, and the intercept is ln(AR/βE). The apparent activation energy E can be obtained by the slope, and the value of the pre-exponential factor A can be obtained by substituting E into the intercept. Through the coefficient of determination (R2), the most appropriate mechanism function of the UPC gasification reaction can be determined. Since the gasification reaction of the UPC is a typical gas-solid reaction, the general gas-solid reaction mechanism functions are used in this study, as shown in Table 5 [21,22,23,24].
Based on the gas-solid reaction mechanism functions, the gasification kinetics parameters of the two UPCs can be obtained. The gasification reaction is most intense during the second stage (rapid gasification reaction stage) compared to the other two reaction stages as mentioned before, so the experimental data from this stage were used for model fitting and kinetic parameters calculation. When the heating rate is 5 °C/min, the kinetic parameters and the fitting results of the Shenhua UPC are shown in Table 6 and Figure 9, respectively. Table 6 shows that in the second reaction, the Shenhua UPC gasification belongs to the chemical reaction rate control model (F1), which has the highest R2 value. The results show that the gasification reaction of the Shenhua UPC at 5 °C/min is controlled by an interfacial chemical reaction.
By using the abovementioned analysis method, the optimum mechanism function of the gasification reaction of the two UPCs at different heating rates can be confirmed, as shown in Figure 10. The kinetic parameters are shown in Table 7. According to the fitting results, it can be concluded that the gasification reactions for the two UPCs at different heating rates show the same reaction mechanism: a chemical reaction rate control of N = 1 (F1). In Table 7 it can be seen that with the increase in heating rate, the apparent activation energy of Shenhua UPC decreased from 269.89 KJ/mol to 223.41 KJ/mol, and that of Qingding UPC decreased from 266.70 KJ/mol to 251.54 KJ/mol. When the heating rates are 5 °C/min, 10 °C/min and 15 °C/min, the apparent activation energies of the two UPCs are similar. However, the pre-exponential factor A of the Shenhua UPC is larger than that of the Qingding UPC. The results show that the molecular collision frequency of the Shenhua UPC is faster, so its reaction rate is higher. When the heating rate is 20 °C/min, the apparent activation energy of the Shenhua UPC is less than that of the Qingding UPC, indicating that the energy required for the gasification reaction of the Shenhua UPC is smaller. In summary, the Shenhua UPC gasification reaction occurs more easily than that of the Qingding UPC. In order to further verify consistency between the hypothesis of Equation (10) and the fitting results, the following calculations are carried out. As shown in Table 8. It can be seen that the assumption is appropriate in this study.
It can be seen that the assumption is appropriate in this study.

4. Conclusions

In this paper, by studying the CO2 gasification behavior and kinetics of two kinds of UPC at four different heating rates we were able to draw the following conclusions.
(1) Under the same conditions, the combustion conversion degree of Shenhua pulverized coal is larger than that of Qingding pulverized coal. A high volatile content, rough surface structure and high specific surface area are the reasons for the higher degree of combustion conversion of Shenhua pulverized coal than that of the Qingding pulverized coal.
(2) The gasification reaction occurs more easily for the Shenhua UPC than for the Qingding UPC, and the gasification reaction rate is much higher. The Qingding UPC requires a higher temperature to complete the gasification reaction. The Shenhua UPC has a lower Tm and a higher reaction rate than that of the Qingding UPC and the gasification reaction of the Shenhua UPC is more intense. The porous structure of the Shenhua UPC provides better kinetic conditions for its gasification reaction.
(3) The gasification reaction curves of the Shenhua and Qingding UPC gradually moved to a high temperature zone with an increasing heating rate. The maximum reaction rate of the UPCs gradually increased with an increasing heating rate.
(4) Under non-isothermal heating conditions, the optimum model for the two UPC gasification reactions is the chemical reaction model. The apparent activation energies of the Shenhua UPC and Qingding UPC are 269.89–223.41 KJ/mol and 266.70–251.54 KJ/mol, respectively.

Author Contributions

R.Z., W.W., and R.X. conceived and designed the experiments; R.Z. and H.W. performed the experiments; R.Z. and R.X. analyzed the data and wrote the original manuscript; J.S., H.Z. and R.X. reviewed and corrected the paper.

Funding

This research was funded by the National Natural Science Foundation of China grant number U1760101, 51704216, 51974212, 51474164.

Acknowledgments

The authors acknowledge financial support from the National Natural Science Foundation of China (U1760101, 51704216, 51974212, 51474164).

Conflicts of Interest

The authors declare no conflicts of interest.

References

  1. Wang, H.T.; Zhao, W.; Chu, M.S.; Liu, Z.G.; Tang, J.; Ying, Z.W. Effects of coal and iron ore blending on metallurgical properties of iron coke hot briquette. Powder Technol. 2018, 328, 318–328. [Google Scholar] [CrossRef]
  2. Wang, C.; Ryman, C.; Dahl, J. Potential CO2 emission reduction for BF–BOF steelmaking based on optimised use of ferrous burden materials. Int. J. Greenh. Gas Control 2009, 3, 29–38. [Google Scholar] [CrossRef]
  3. De Assis, C.F.C.; Tenório, J.A.S.; Assis, P.S.; Nath, N.K. Experimental Simulation and Analysis of Agricultural Waste Injection as an Alternative Fuel for Blast Furnace. Energy Fuels 2014, 28, 7268–7273. [Google Scholar] [CrossRef]
  4. Assis, P.S.; Vieira, C.B.; Sobrinho, P.J.N. New Developments for Powder Coal Injection into the Blast Furnaces. Steel Res. Int. 2004, 75, 235–239. [Google Scholar] [CrossRef]
  5. Halim, K.S.A.; Andronov, V.N.; Nasr, M.I. Blast furnace operation with natural gas injection and minimum theoretical flame temperature. Ironmak. Steelmak. 2009, 36, 12–18. [Google Scholar] [CrossRef]
  6. Xu, R.S.; Dai, B.W.; Wang, W.; Schenk, J.; Xue, Z.L. Effect of iron ore type on the thermal behaviour and kinetics of coal-iron ore briquettes during coking. Fuel Process. Technol. 2018, 173, 11–20. [Google Scholar] [CrossRef]
  7. Xu, R.S.; Zheng, H.; Wang, W.; Johannes, S.; Xue, Z.L. Influence of iron minerals on the volume, strength, and CO2 gasification of ferro-coke. Energy Fuels 2018, 32, 12118–12127. [Google Scholar] [CrossRef]
  8. Birk, W.; Marklund, O.; Medvedev, A. Video monitoring of pulverized coal injection in the blast furnace. IEEE Trans. Ind. Appl. 2002, 38, 571–576. [Google Scholar] [CrossRef]
  9. Kazuyoshi, Y.; Hiromitsu, U.; Kenji, T. Maximum Injection Rate of Pulverized Coal into Blast Furnace through Tuyeres with Consideration of Unburnt Char. ISIJ Int. 1992, 32, 716–724. [Google Scholar] [CrossRef]
  10. Mathieson, J.G.; Truelove, J.S.; Rogers, H. Toward an understanding of coal combustion in blast furnace tuyere injection. Fuel 2005, 84, 1229–1237. [Google Scholar] [CrossRef]
  11. Xiang, D.W.; Shen, F.M.; Yang, J.L.; Jiang, X.; Zheng, H.Y.; Gao, Q.J.; Li, J.X. Combustion characteristics of unburned pulverized coal and its reaction kinetics with CO2. Int. J. Miner. Metall. Mater. 2019, 26, 811–821. [Google Scholar] [CrossRef]
  12. Yu, Y.W.; Bai, C.G.; Liang, D.; Wang, F. Numerical simulation characteristics of unburned pulverised coal in blast furnace. Ironmak. Steelmak. 2009, 36, 279–285. [Google Scholar] [CrossRef]
  13. Diao, R.S.; Hu, B.S. Behavior of unburned particle in blast furnace pulverized coal injection. Iron Steel Vanadium Titan. 2003, 24, 18–21. [Google Scholar] [CrossRef]
  14. Yu, Q.Y. Experiment Research on BF Unburned Pulverized Coal and Carbon Consumption. Baosteel Technol. 2004, 29–32. [Google Scholar] [CrossRef]
  15. Yu, Q.Y.; Cao, J.; Shen, F.M. Experiment research on effect of unburned pulverized coal on coke reactivity in blast furnace. Baosteel Technol. 2006, 31–34. [Google Scholar] [CrossRef]
  16. Takashi, S. Experimental and numerical analysis on the movement and the accumulation of powder in the deadman and the dripping zone of boast furnace. Tetsuto-Hagane 1996, 82, 29–34. [Google Scholar] [CrossRef]
  17. Diao, R.S.; Hu, B.S. Influence of unburned PCI on the blast furnace slag viscosity in Panzhihua Steel Co. Iron Steel 2004, 39, 14–16. [Google Scholar] [CrossRef]
  18. Iwanaga, Y. Gasification rate analysis of unburnt pulverized coal in blast furnace. ISIJ Int. 1991, 31, 500–504. [Google Scholar] [CrossRef]
  19. Du, S.W.; Chen, W.H.; Lucas, J.A. Pulverized coal burnout in blast furnace simulated by a drop tube furnace. Energy 2010, 35, 576–581. [Google Scholar] [CrossRef]
  20. Chen, W.H.; Du, S.W.; Tsai, C.H.; Wang, Z.Y. Torrefied biomasses in a drop tube furnace to evaluate their utility in blast furnaces. Bioresour. Technol. 2012, 111, 433–438. [Google Scholar] [CrossRef]
  21. Zheng, H.; Wang, W.; Xu, R.S.; Zan, R.A.; Schenk, J.; Xue, Z.L. Effect of the particle size of iron ore on the pyrolysis kinetic behaviour of coal-iron ore briquettes. Energies 2018, 11, 2595. [Google Scholar] [CrossRef]
  22. Zhang, S.F.; Zhu, F.; Bai, C.G.; Wen, L.Y.; Peng, H.J. High temperature pyrolysis behaviour and kinetics of lump coal in COREX melter gasifier. Ironmak. Steelmak. 2013, 41, 219–228. [Google Scholar] [CrossRef]
  23. Li, P.; Yu, Q.; Xie, H.; Qin, Q.; Wang, K. CO2 Gasification rate analysis of datong coal using slag granules as heat carrier for heat recovery from blast furnace slag by using a chemical reaction. Energy Fuels 2013, 27, 4810–4817. [Google Scholar] [CrossRef]
  24. Vlaev, L.T.; Markovska, I.G.; Lyubchev, L.A. Non-isothermal kinetics of pyrolysis of rice husk. Thermochim. Acta 2003, 406, 1–7. [Google Scholar] [CrossRef]
Figure 1. Production of unburned pulverized coal (UPC) and movement behavior in a blast furnace (BF).
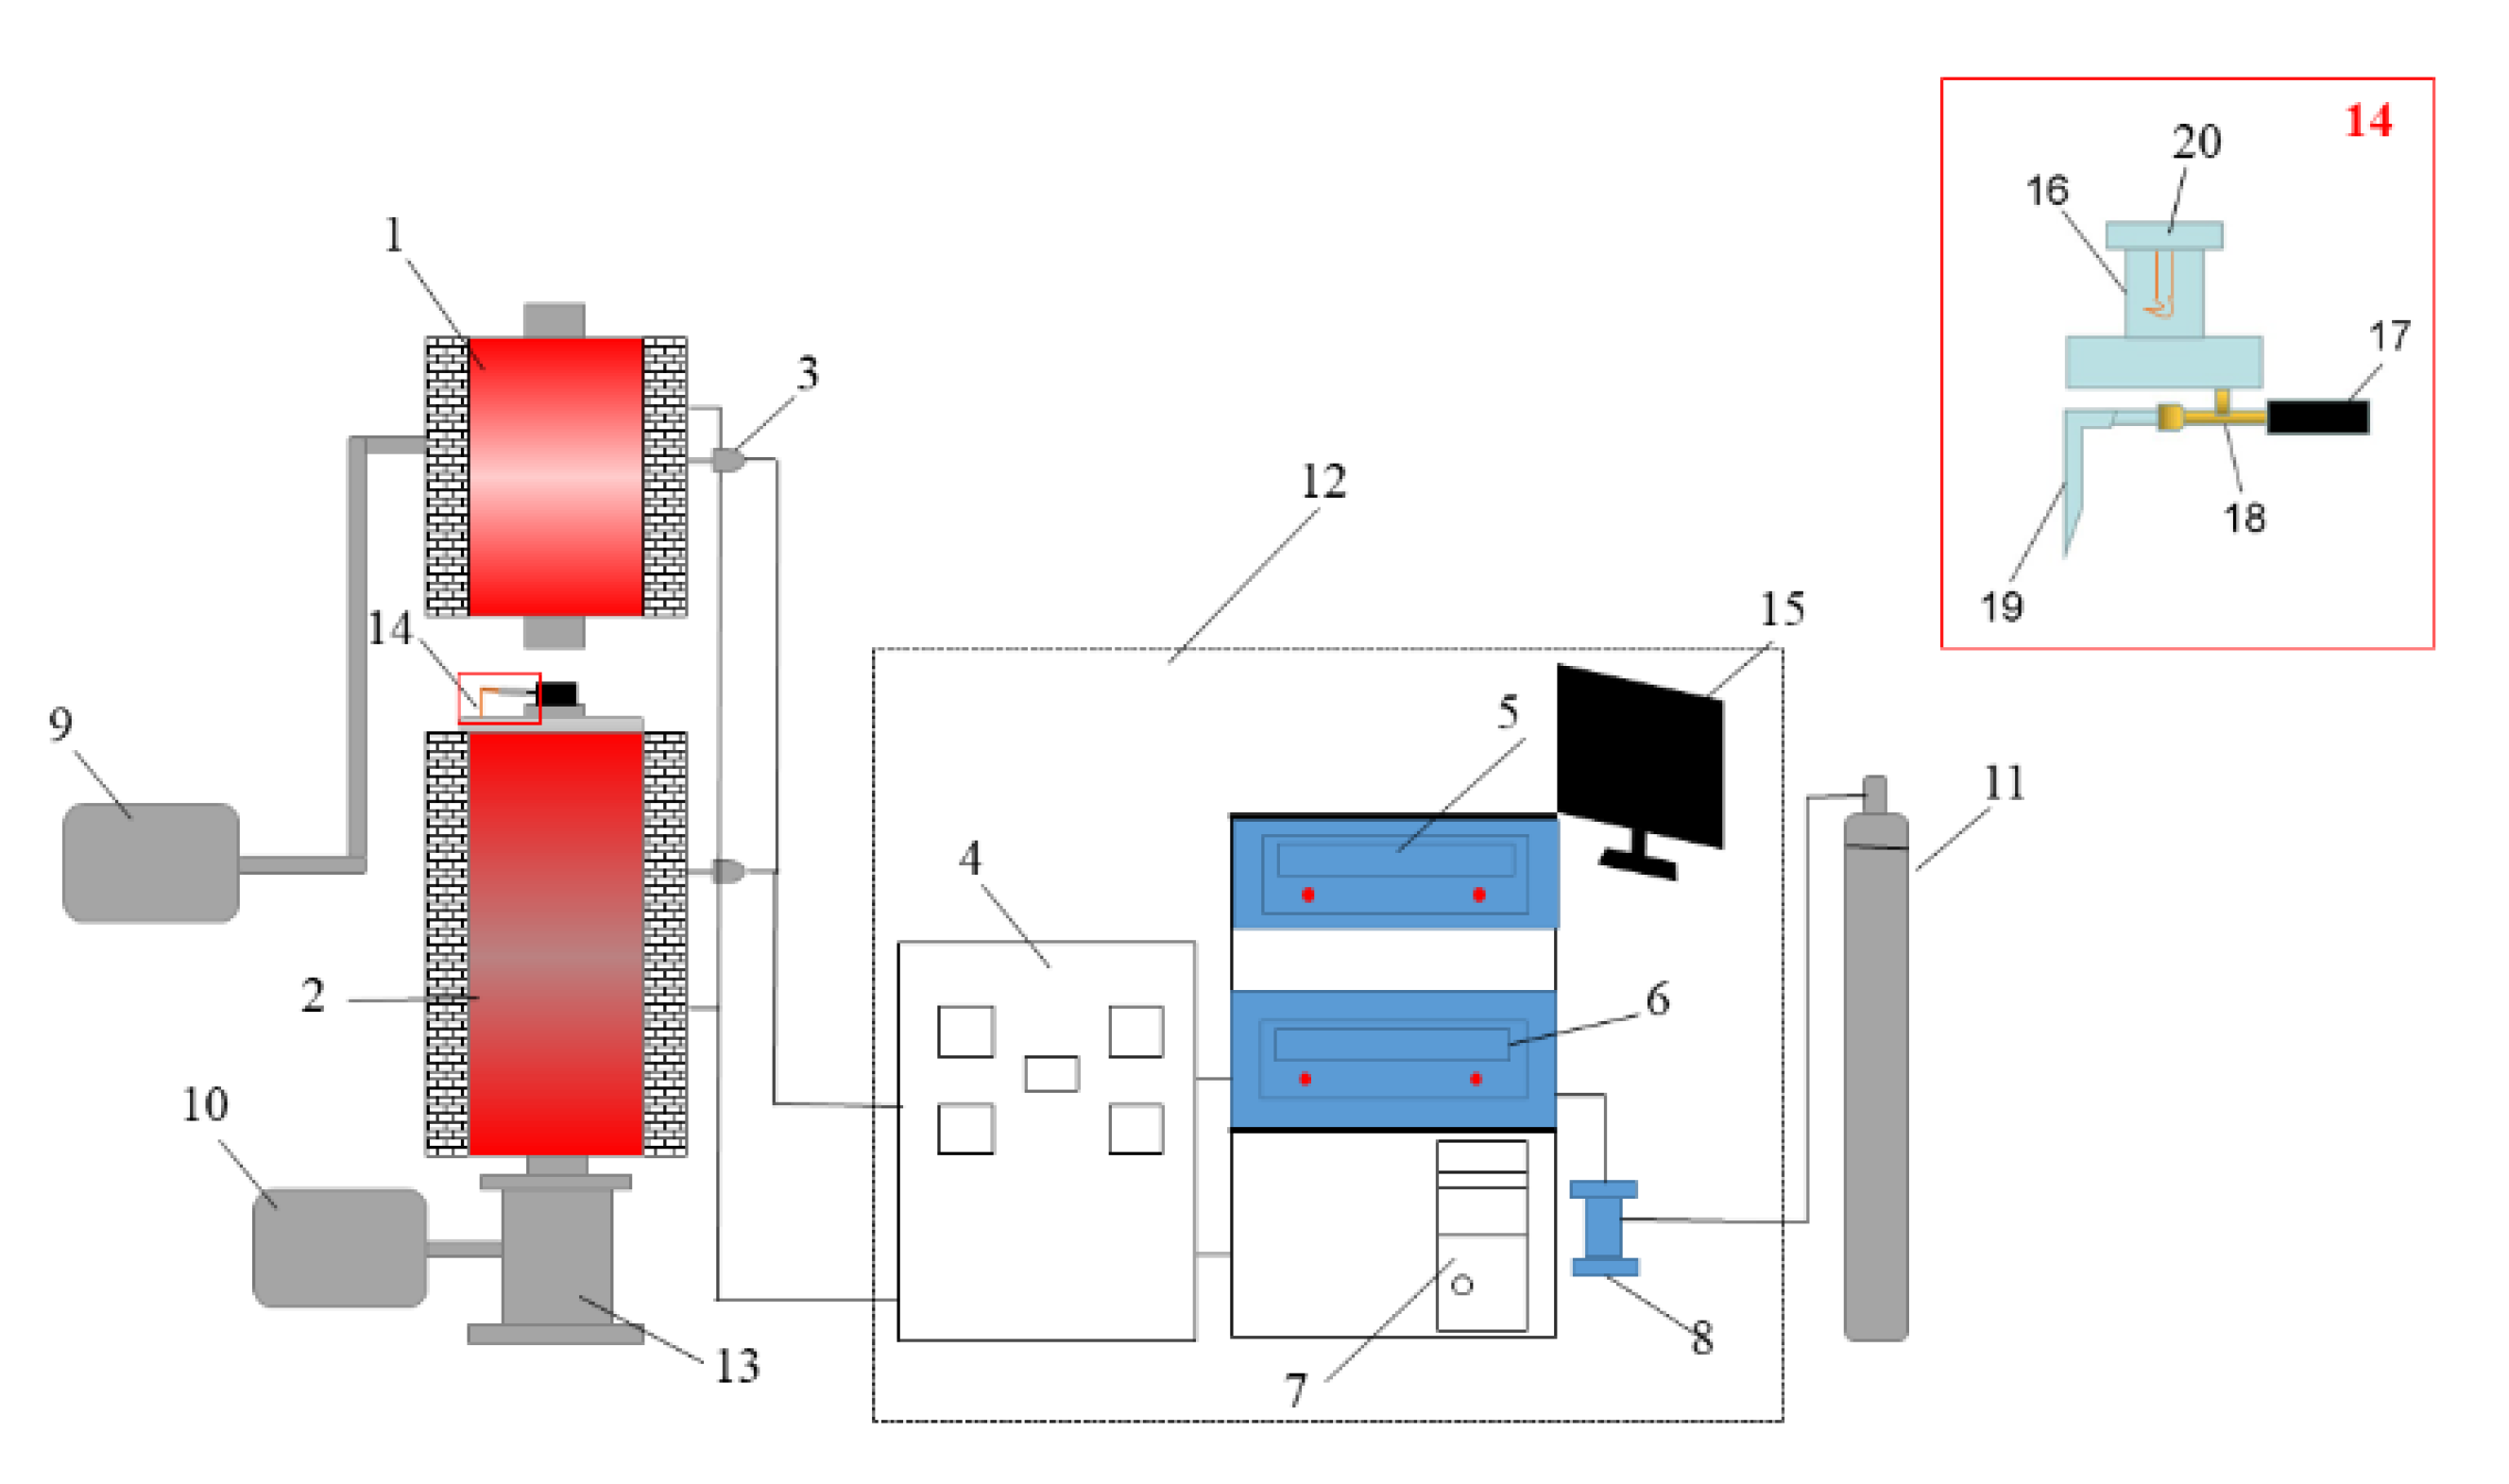
Energies 12 04324 g001
Figure 2. Experimental simulation device for BF coal injection. 1. Hot blast stove, 2. Pulverized coal combustion furnace, 3. Thermocouple, 4. Current and voltage display meter, 5. Hot blast stove console, 6. Pulverized coal combustion furnace console, 7. Computer, 8. Air flow meter, 9. Air compressor, 10. Drawing fan, 11. N2 gas, 12. Data acquisition and control system, 13. UPC collecting tank, 14. Coal injection lance, 15. Computer monitor, 16. Coal bunker, 17. Sealed casing ring, 18. Copper injection pipe, 19. Gas nozzle and 20. Pulverized coal agitator.
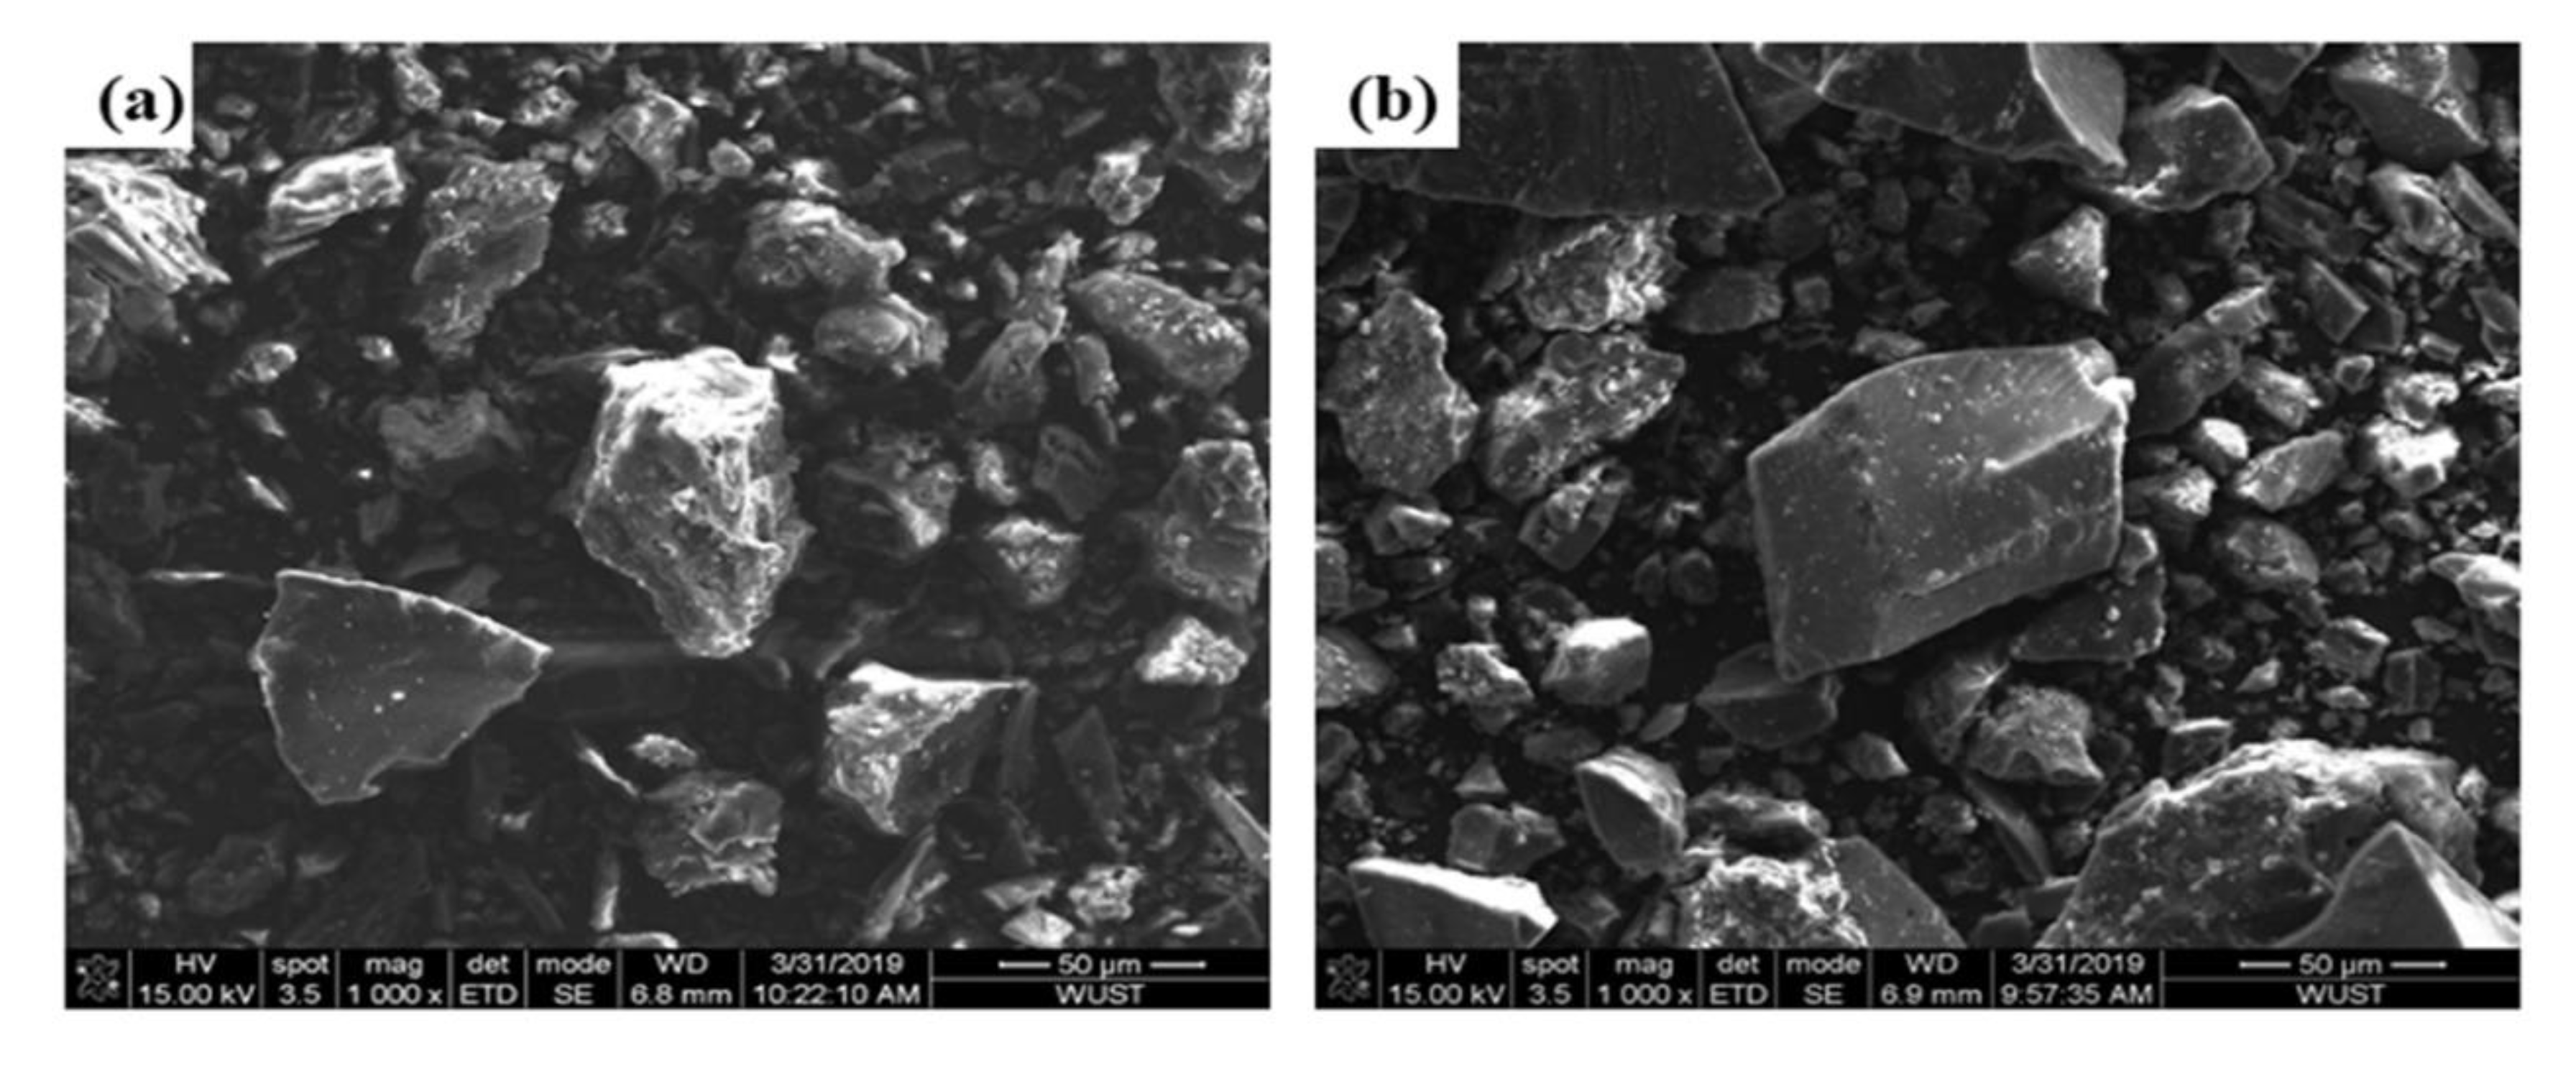
Energies 12 04324 g002
Figure 3. SEM image of Shenhua and Qingding pulverized coal: (a) Shenhua and (b) Qingding.
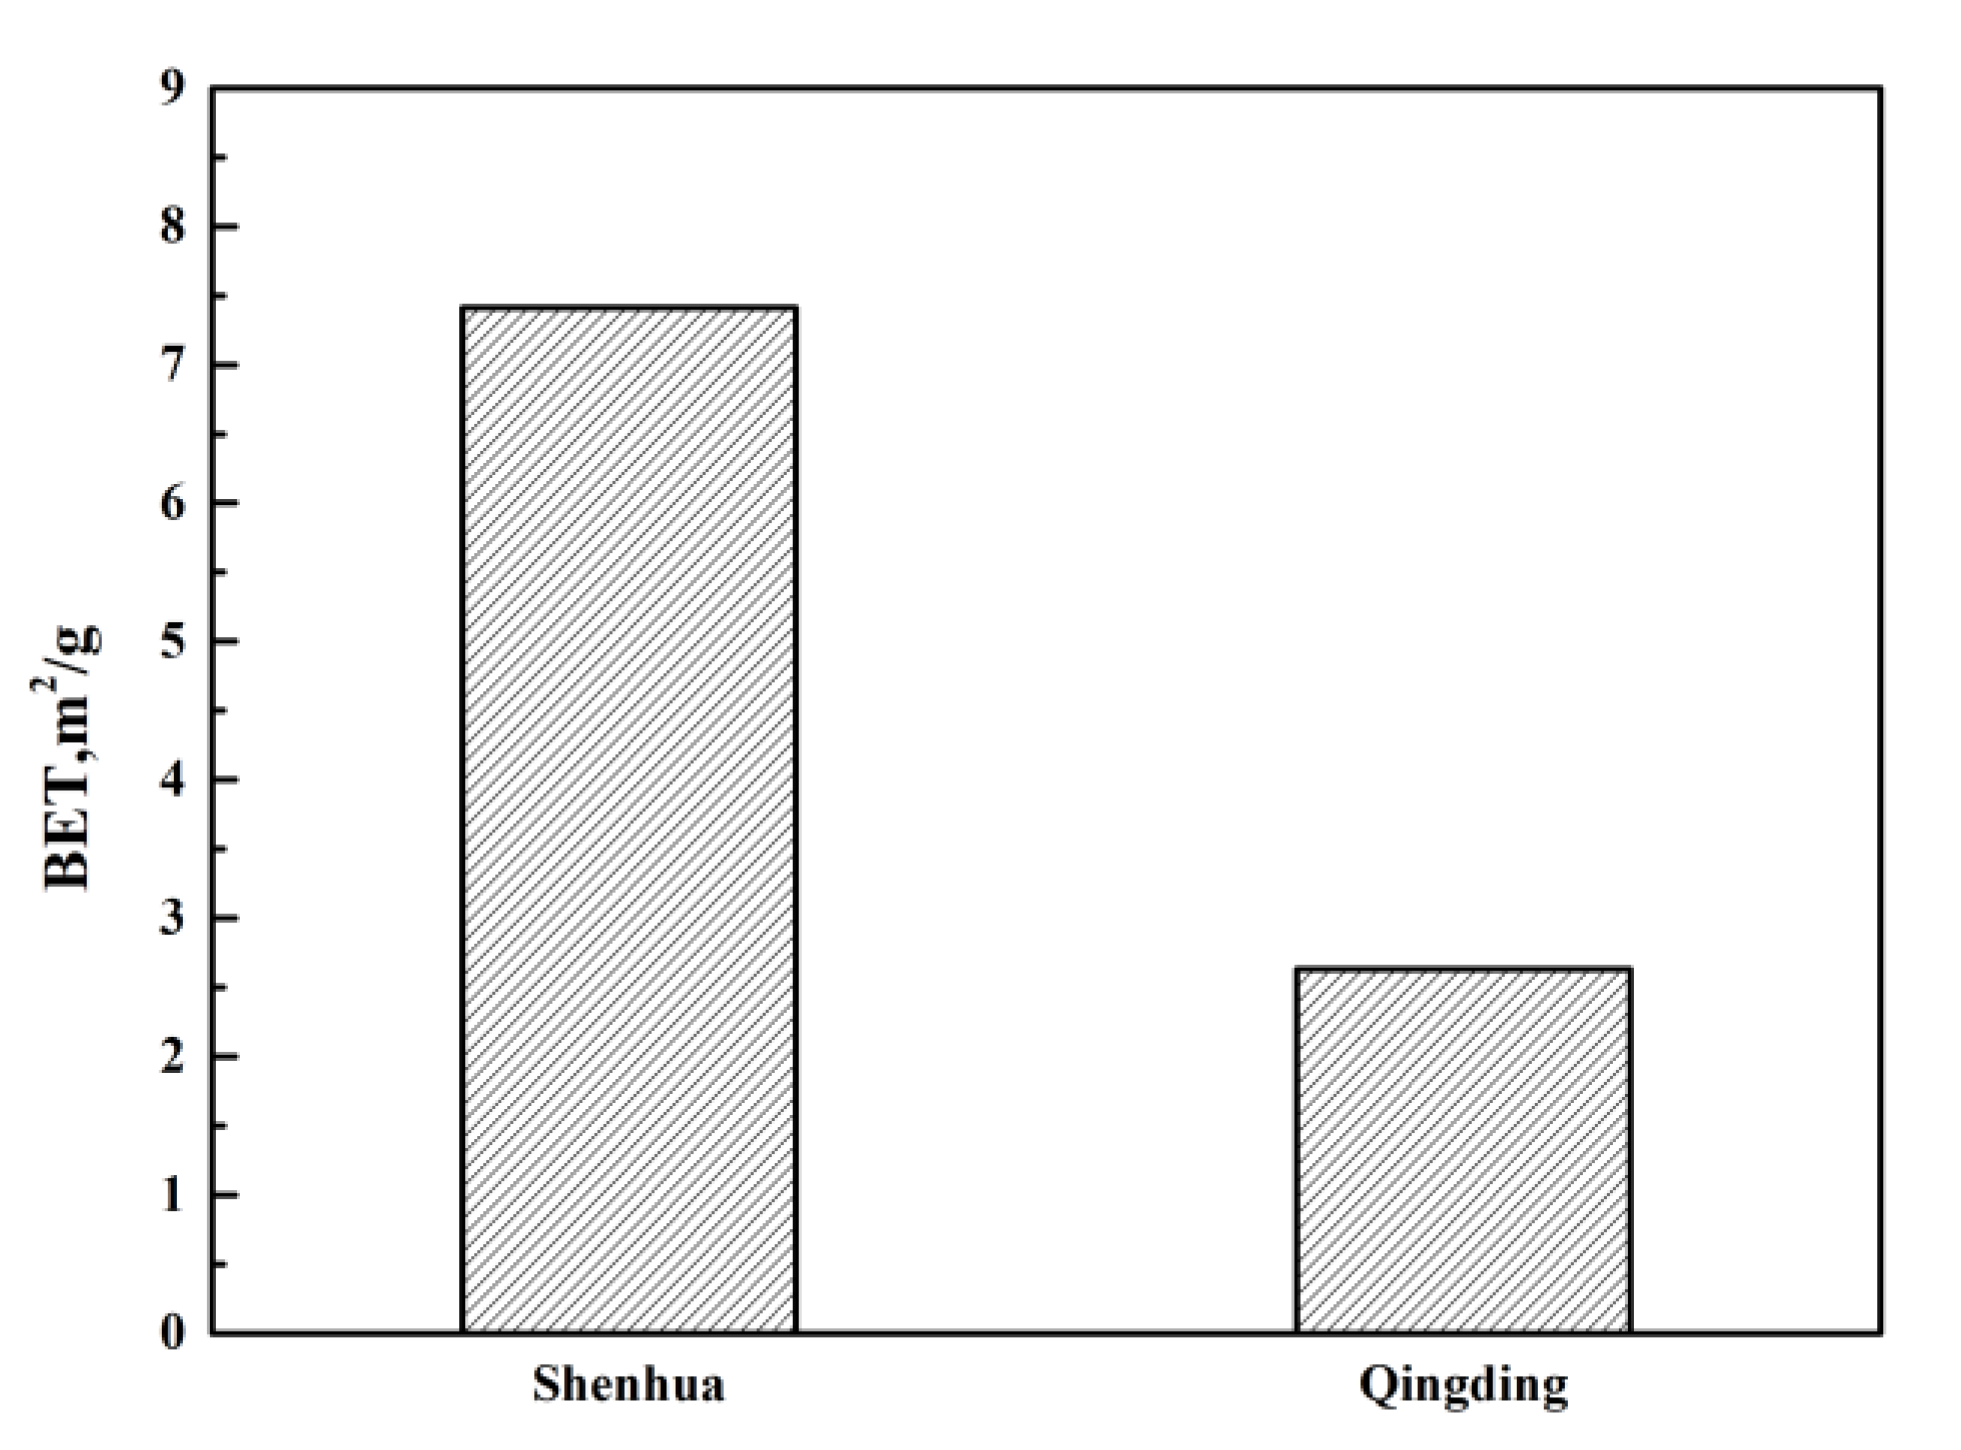
Energies 12 04324 g003
Figure 4. Brunauer-Emmett-Teller (BET) results for two kinds of pulverized coal.
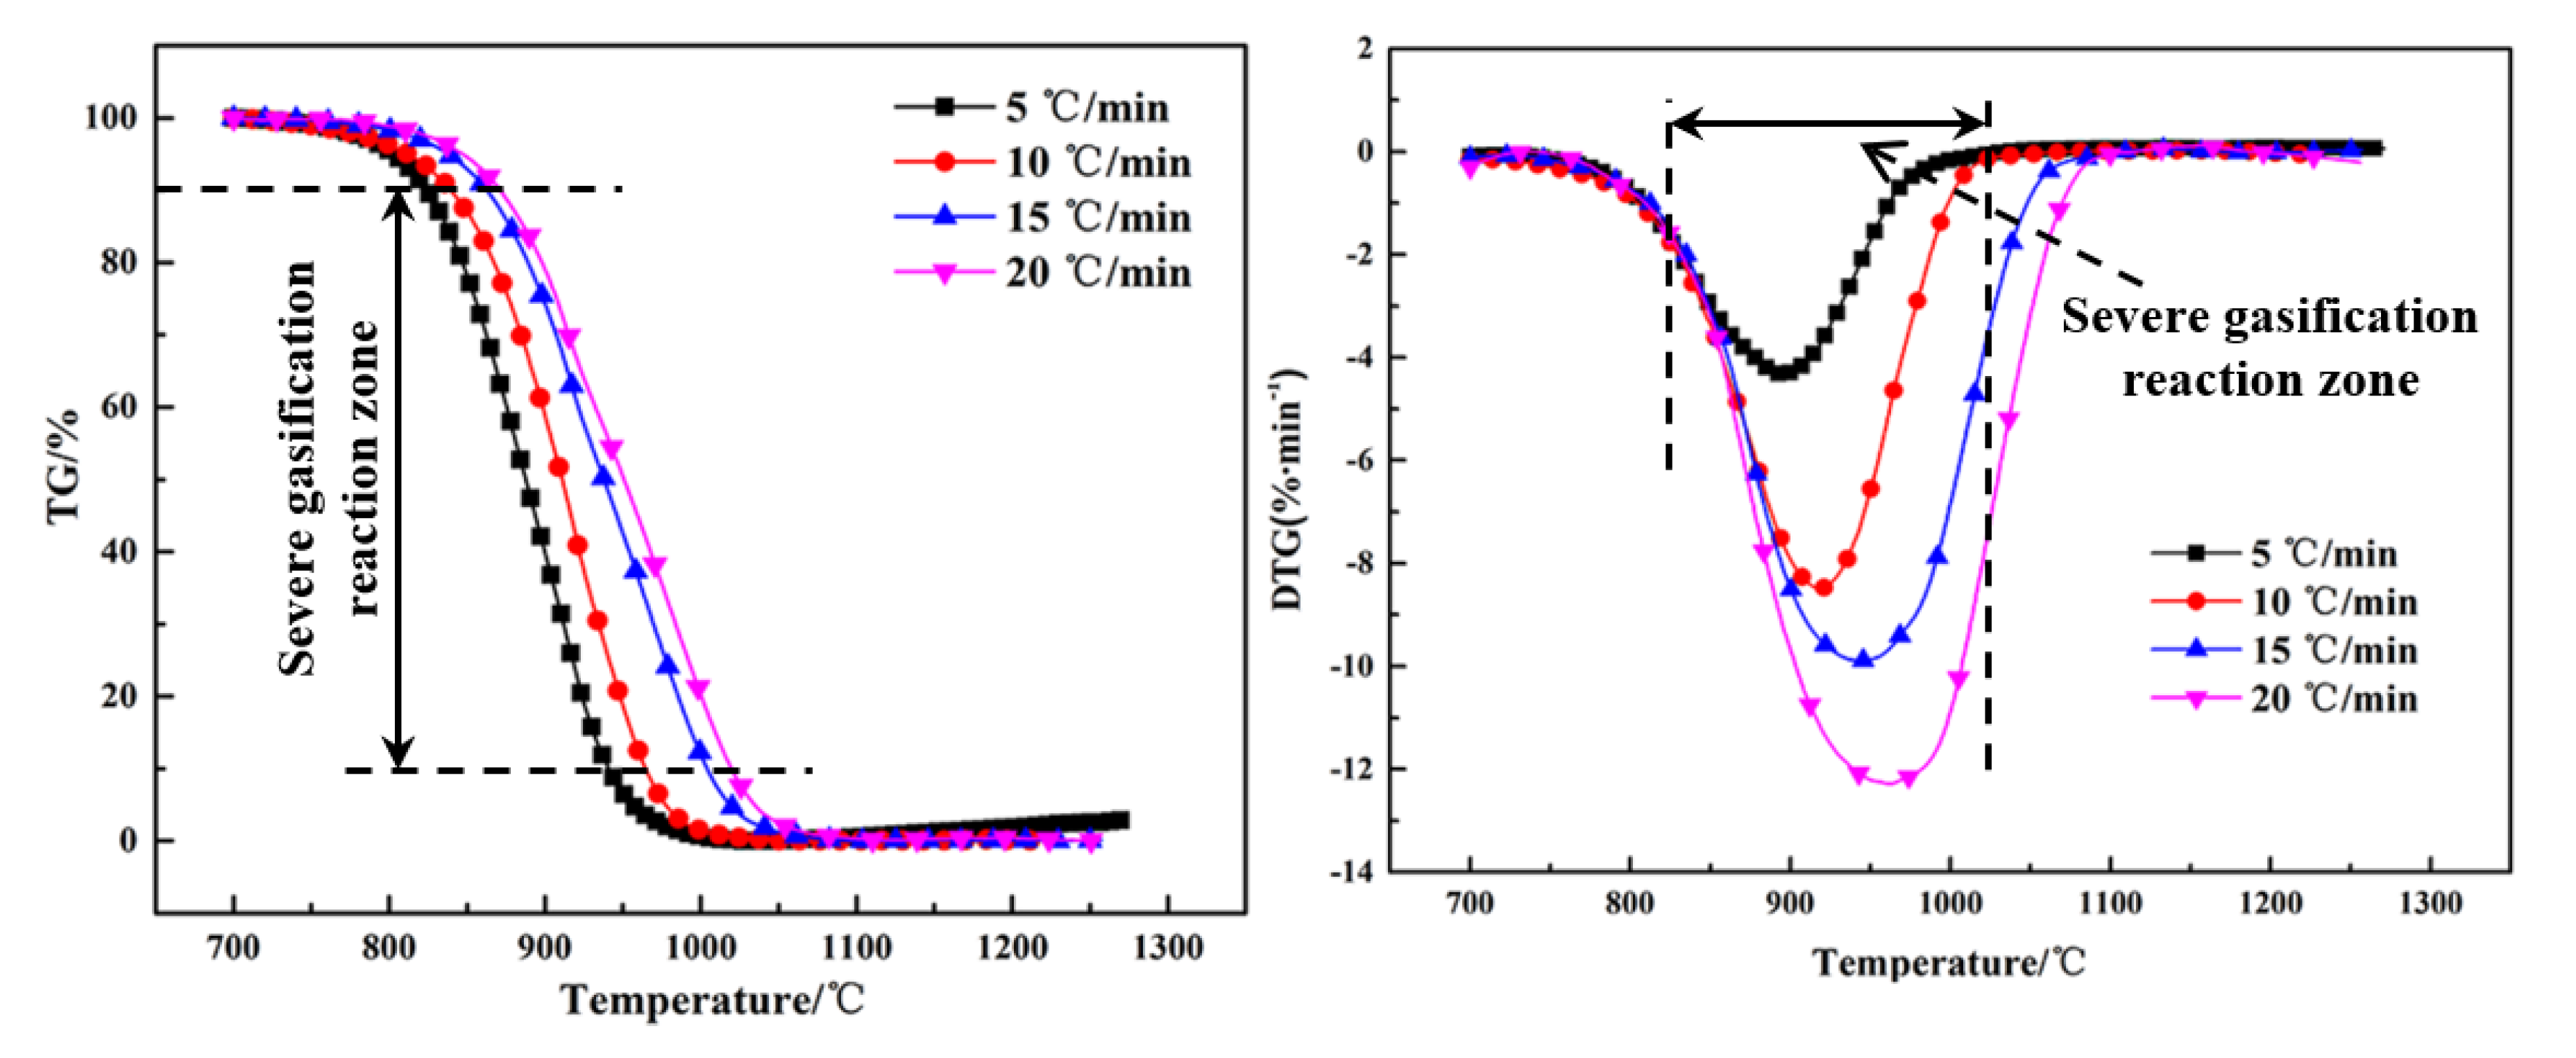
Energies 12 04324 g004
Figure 5. Thermogravimetry (TG) and differential thermogravimetry (DTG) curves of Shenhua UPC.
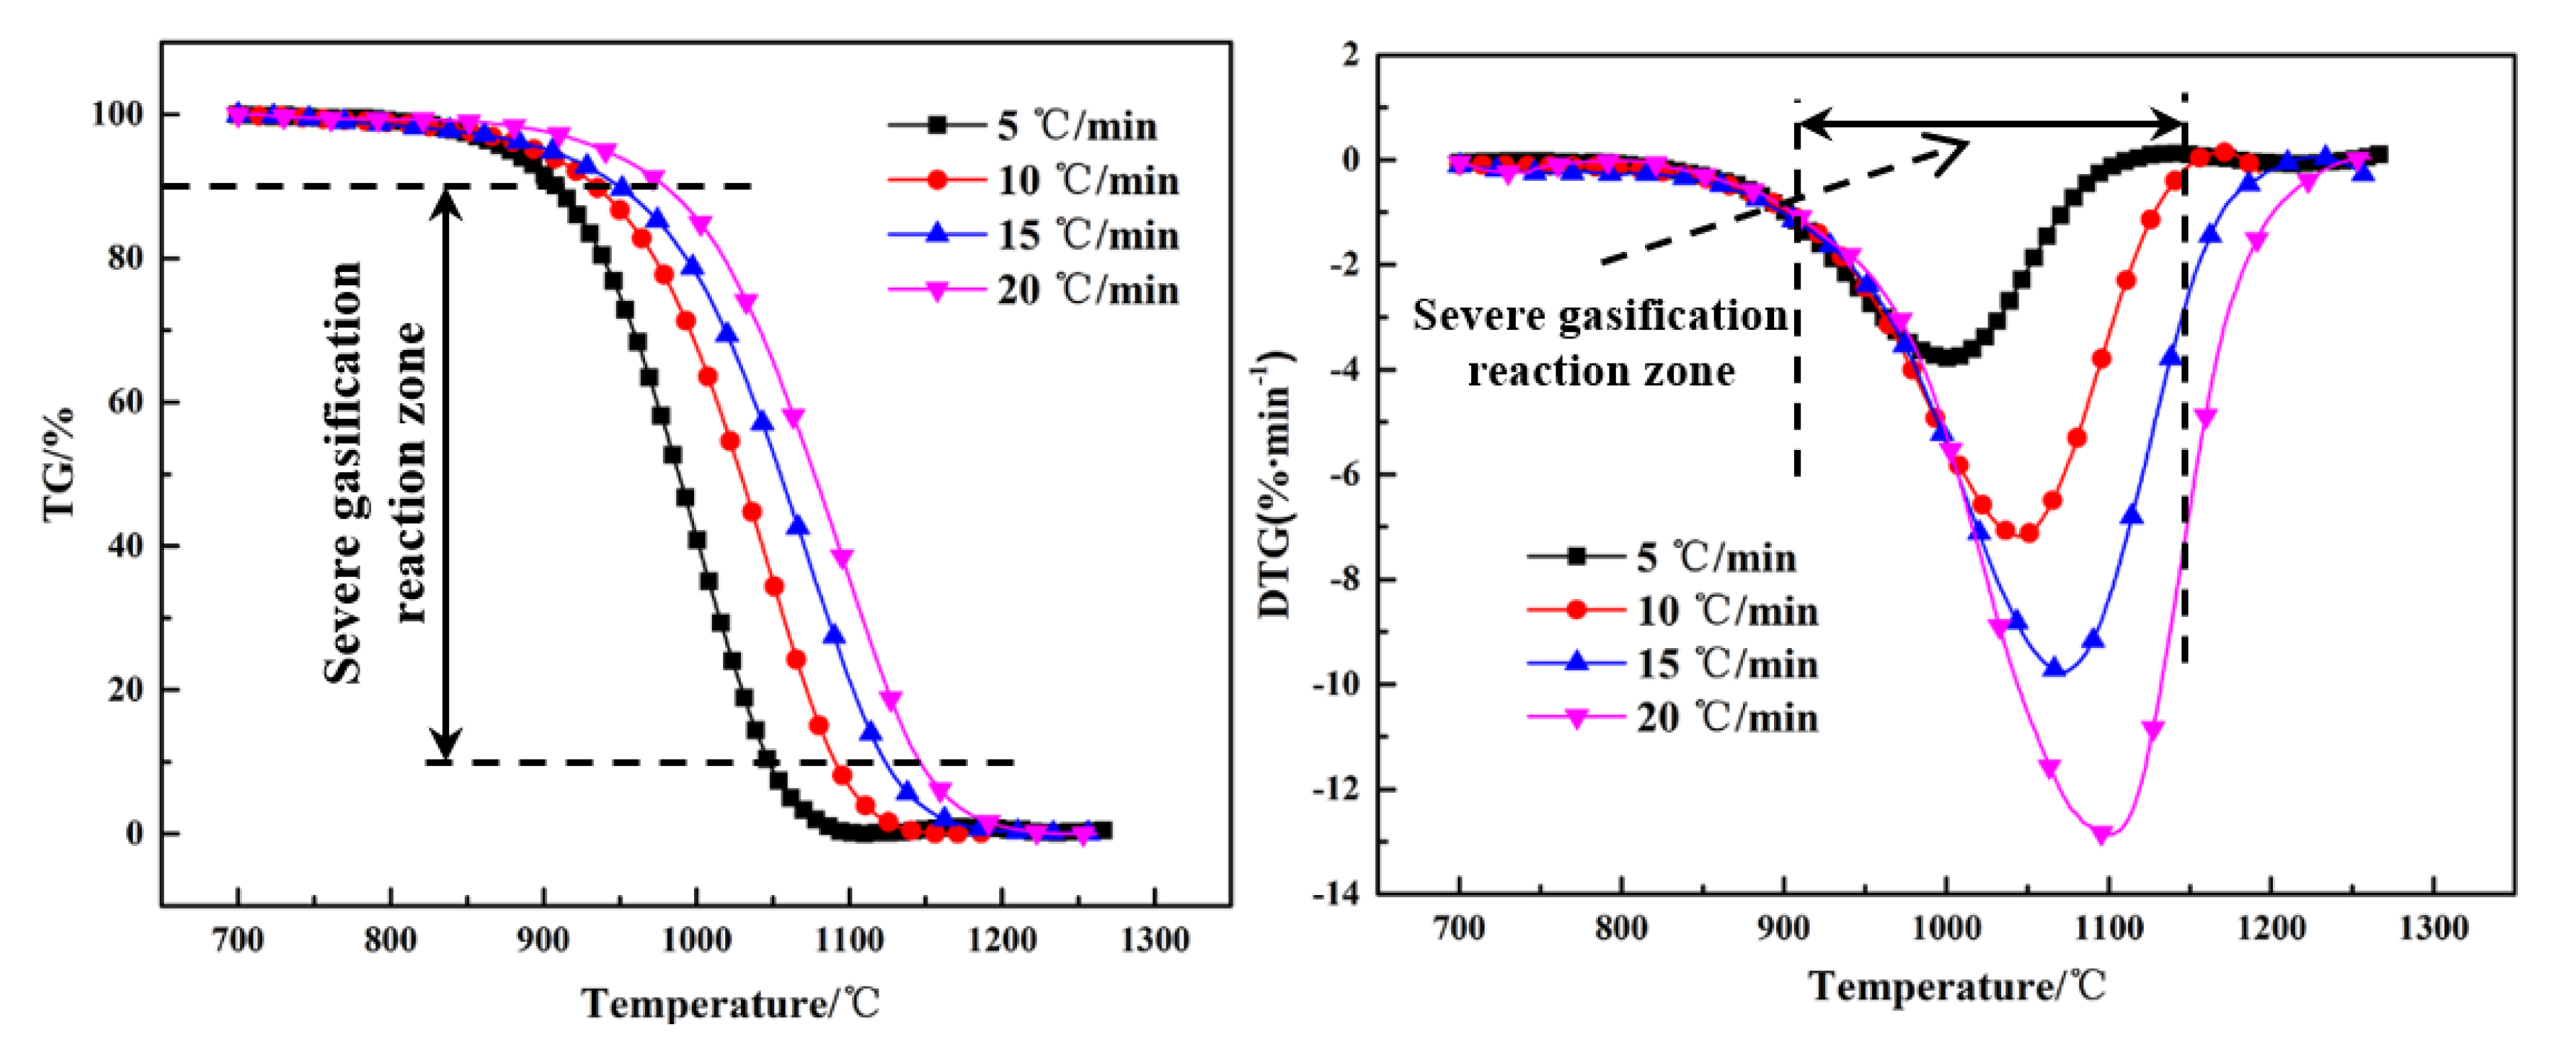
Energies 12 04324 g005
Figure 6. TG and DTG curves for Qingding UPC.
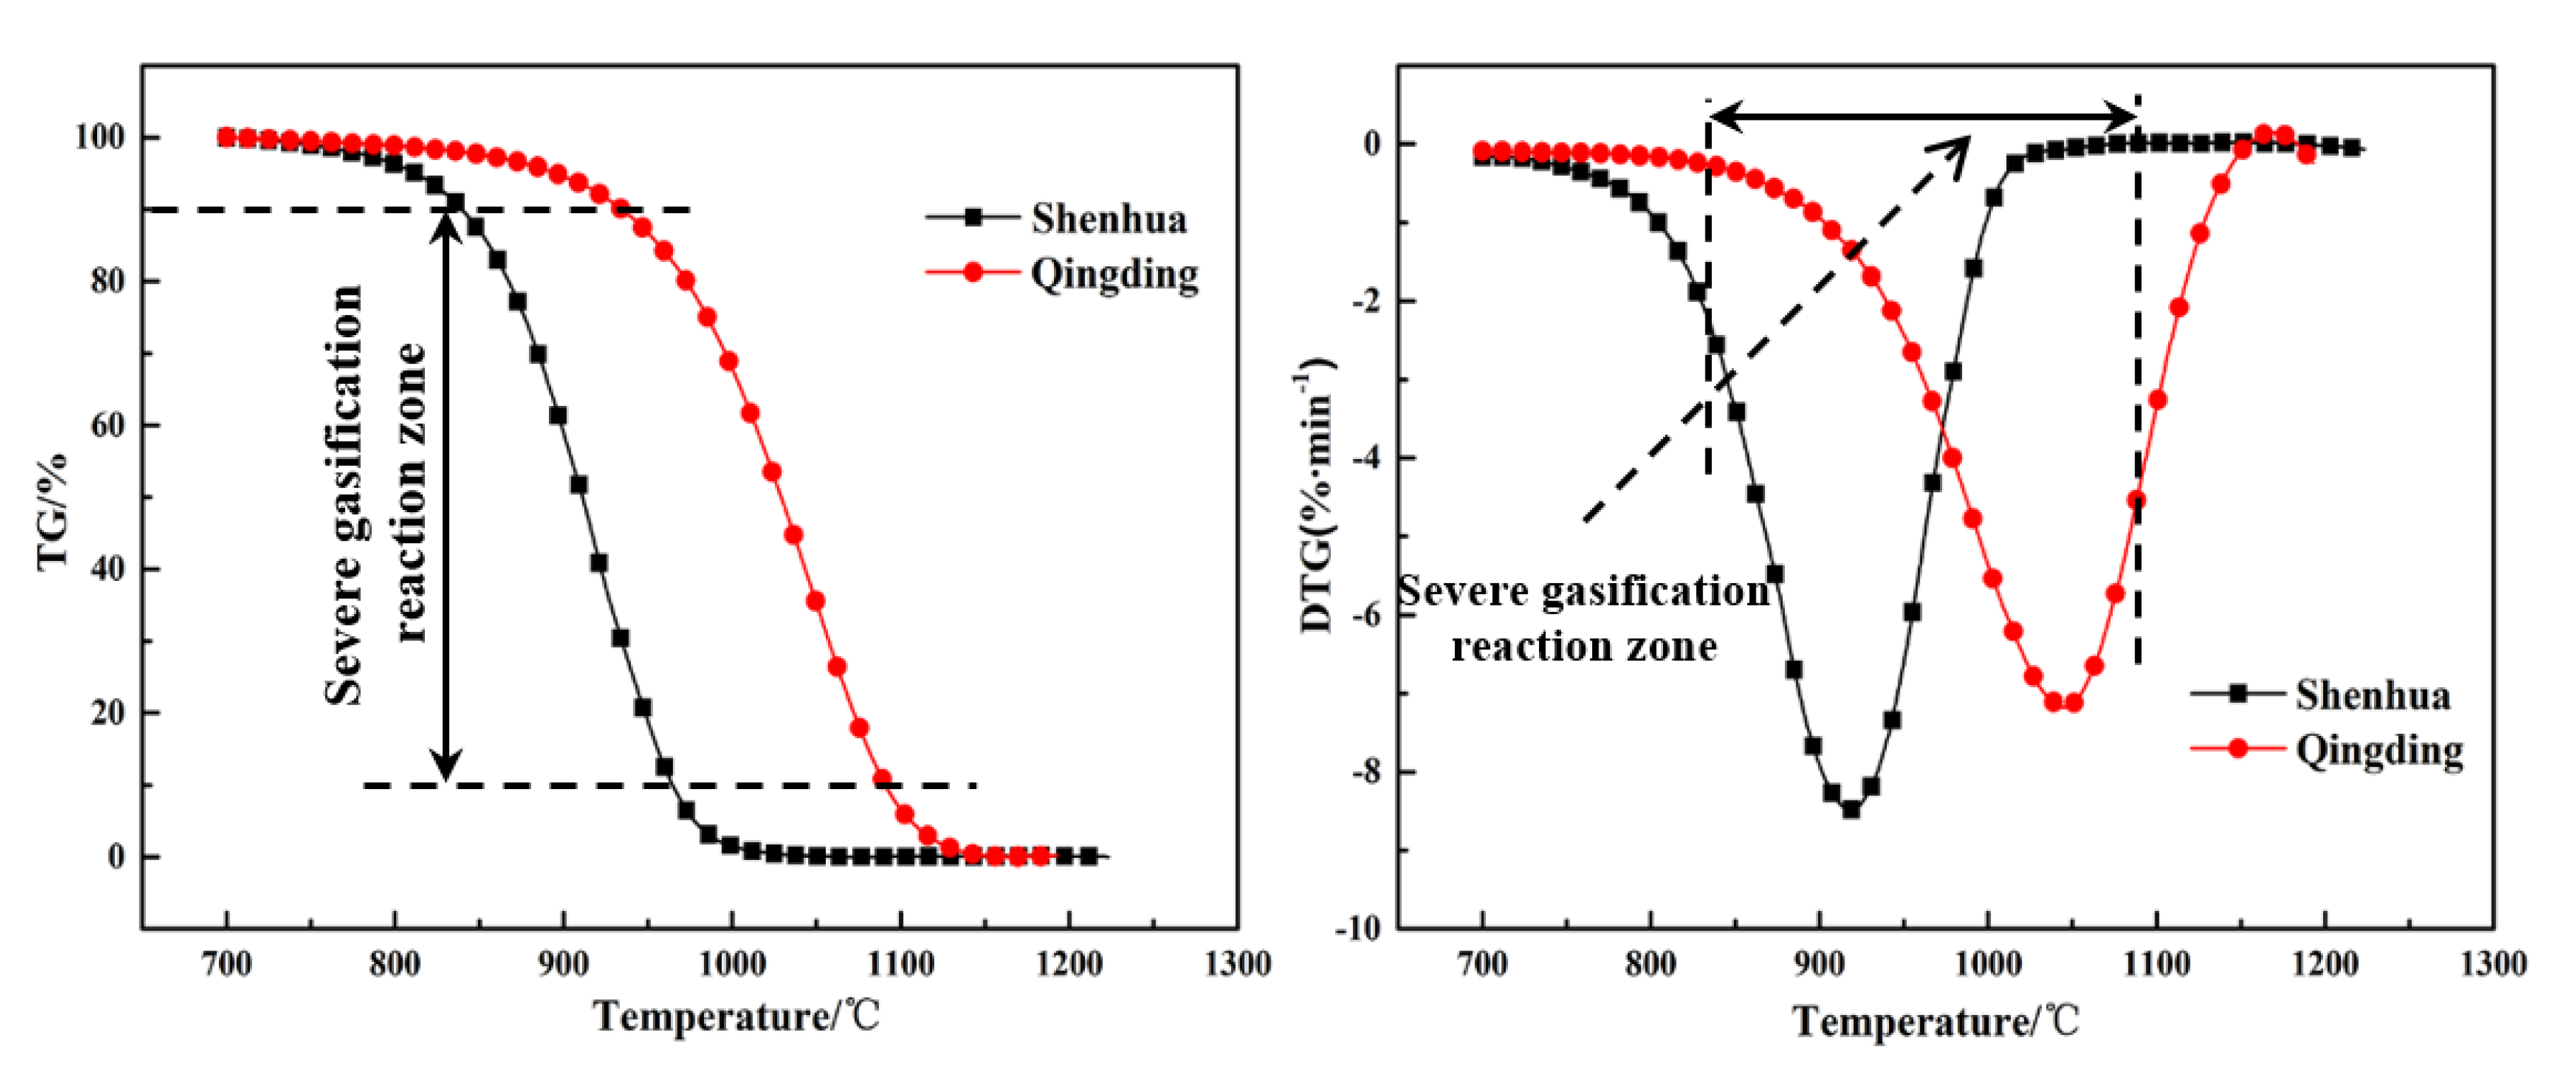
Energies 12 04324 g006
Figure 7. TG and DTG curves for Shenhua UPC and Qingding UPC at a heating rate of 10 °C/min.
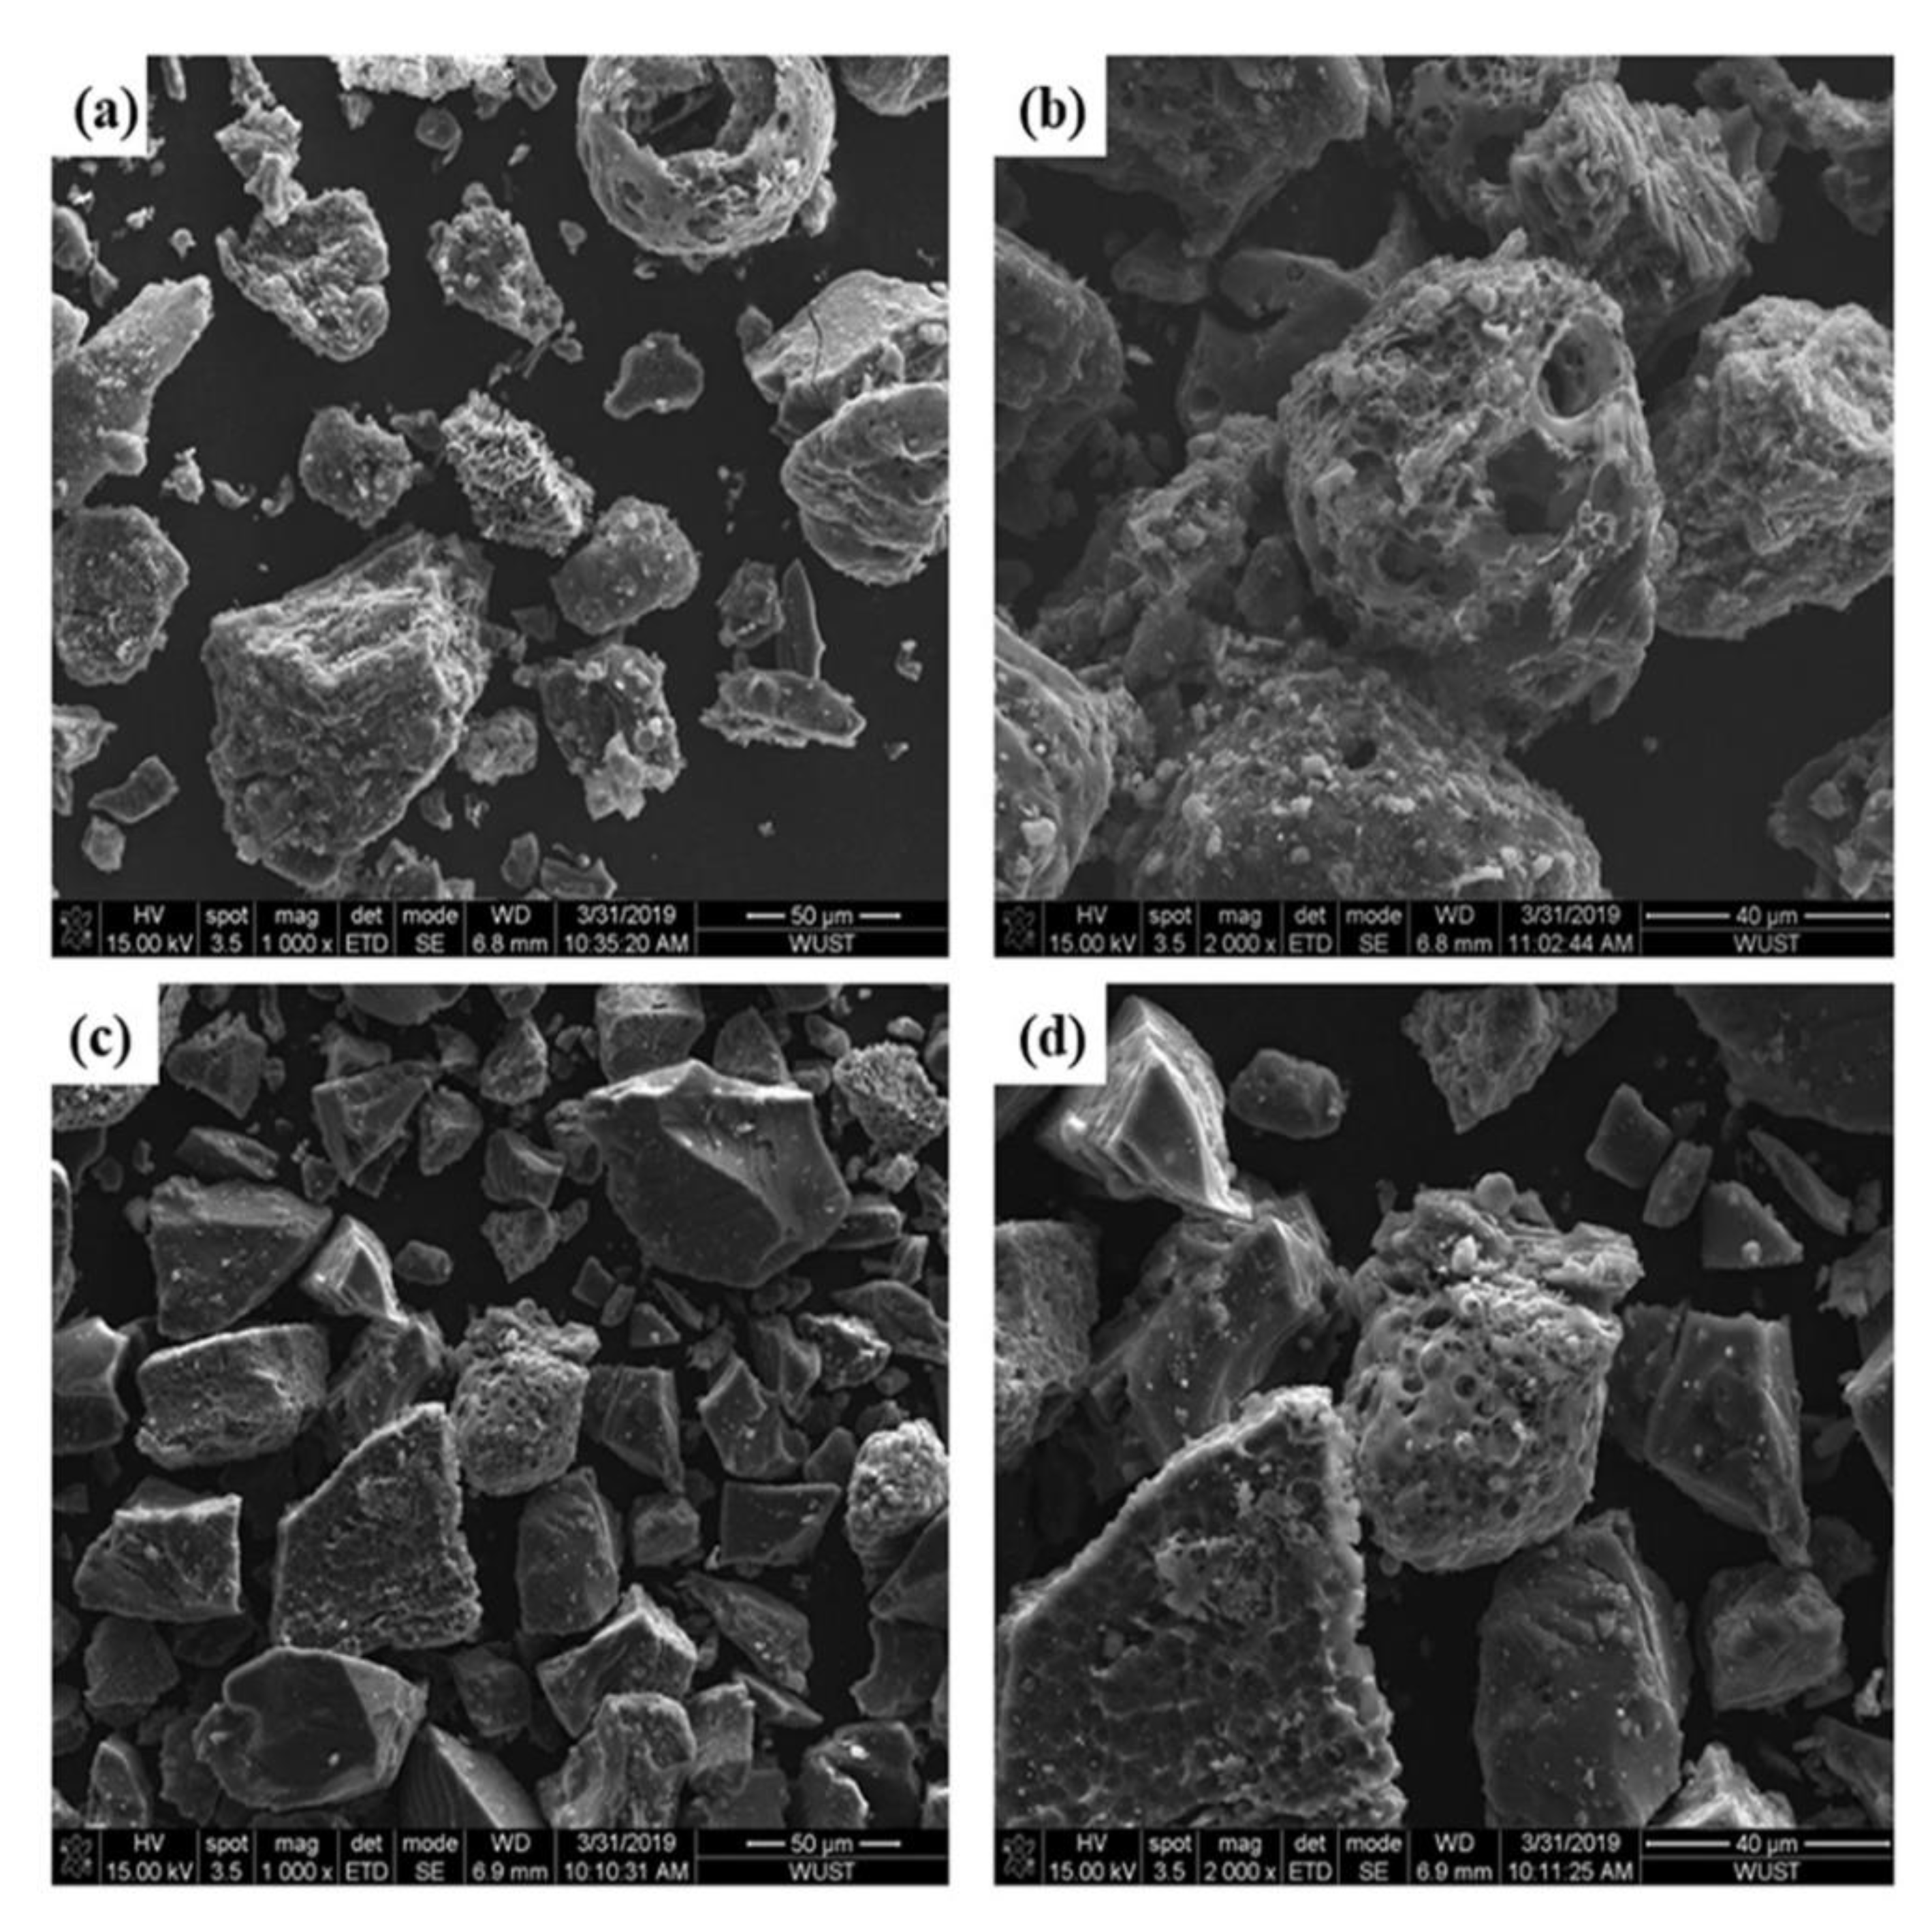
Energies 12 04324 g007
Figure 8. SEM image of (a,b) Shenhua UPC and (c,d) Qingding UPC.
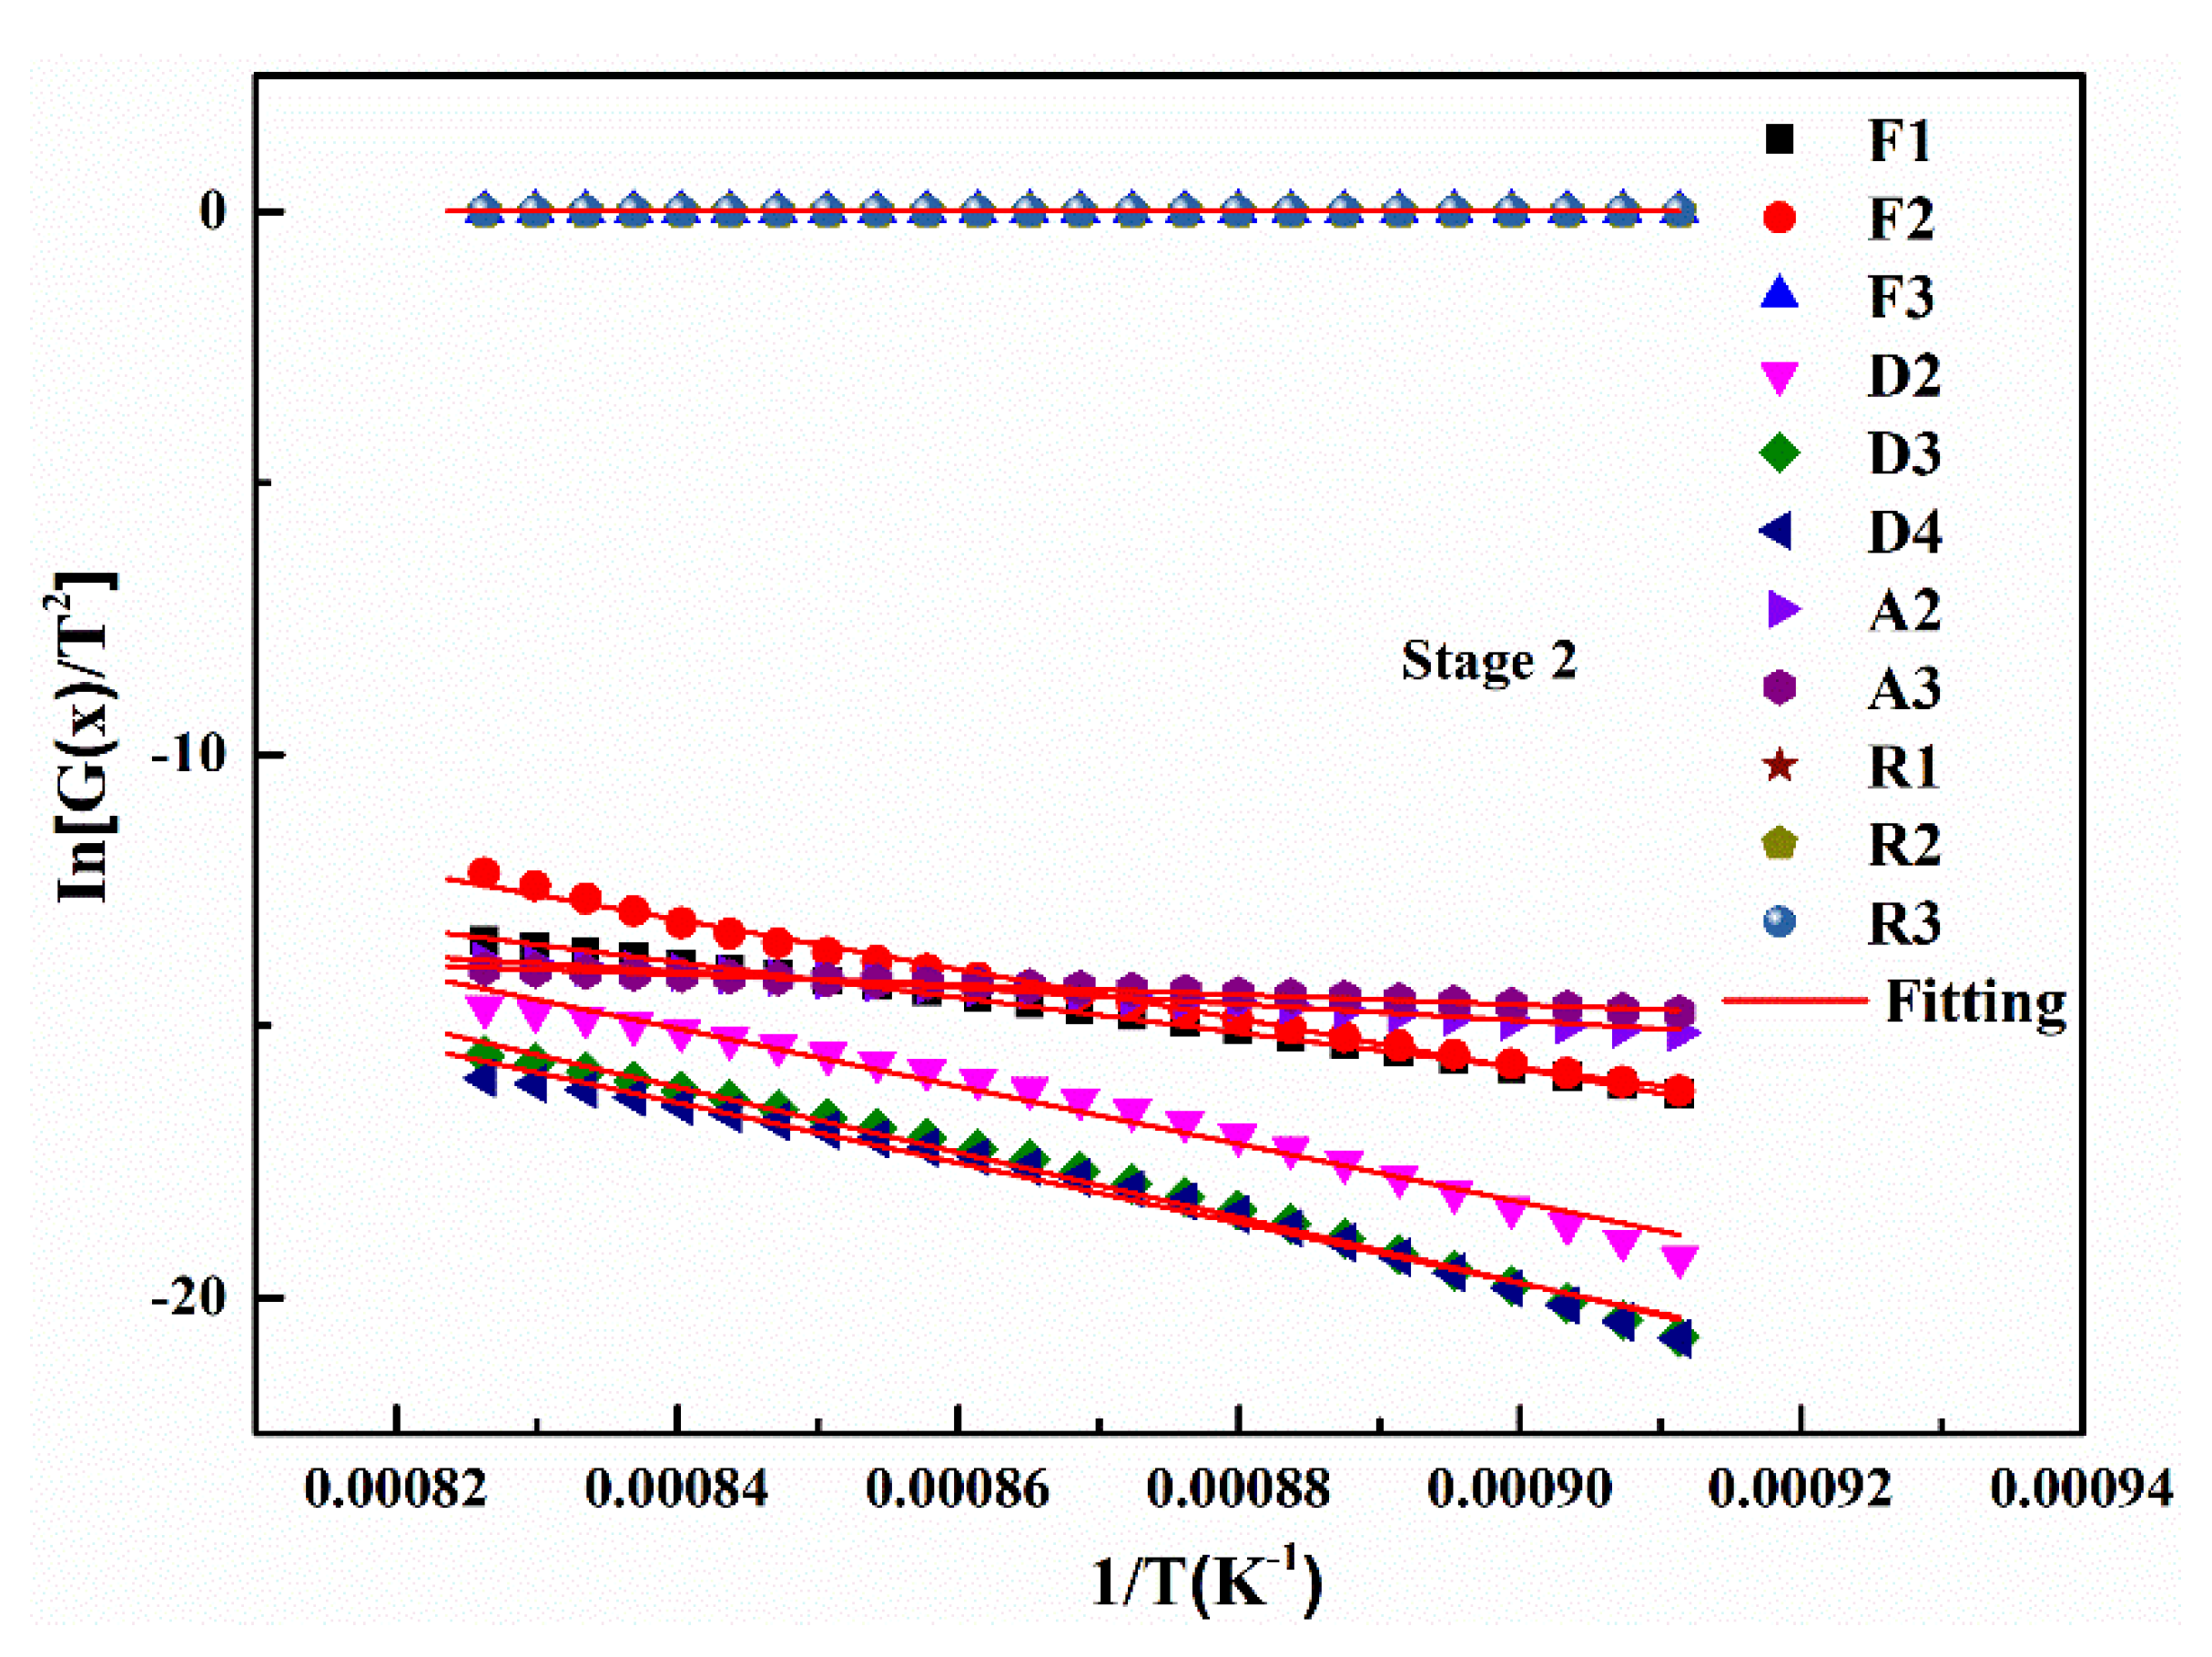
Energies 12 04324 g008
Figure 9. Linear fitting of the mechanism function for the second stage of the Shenhua UPC gasification reaction at 5 °C/min.
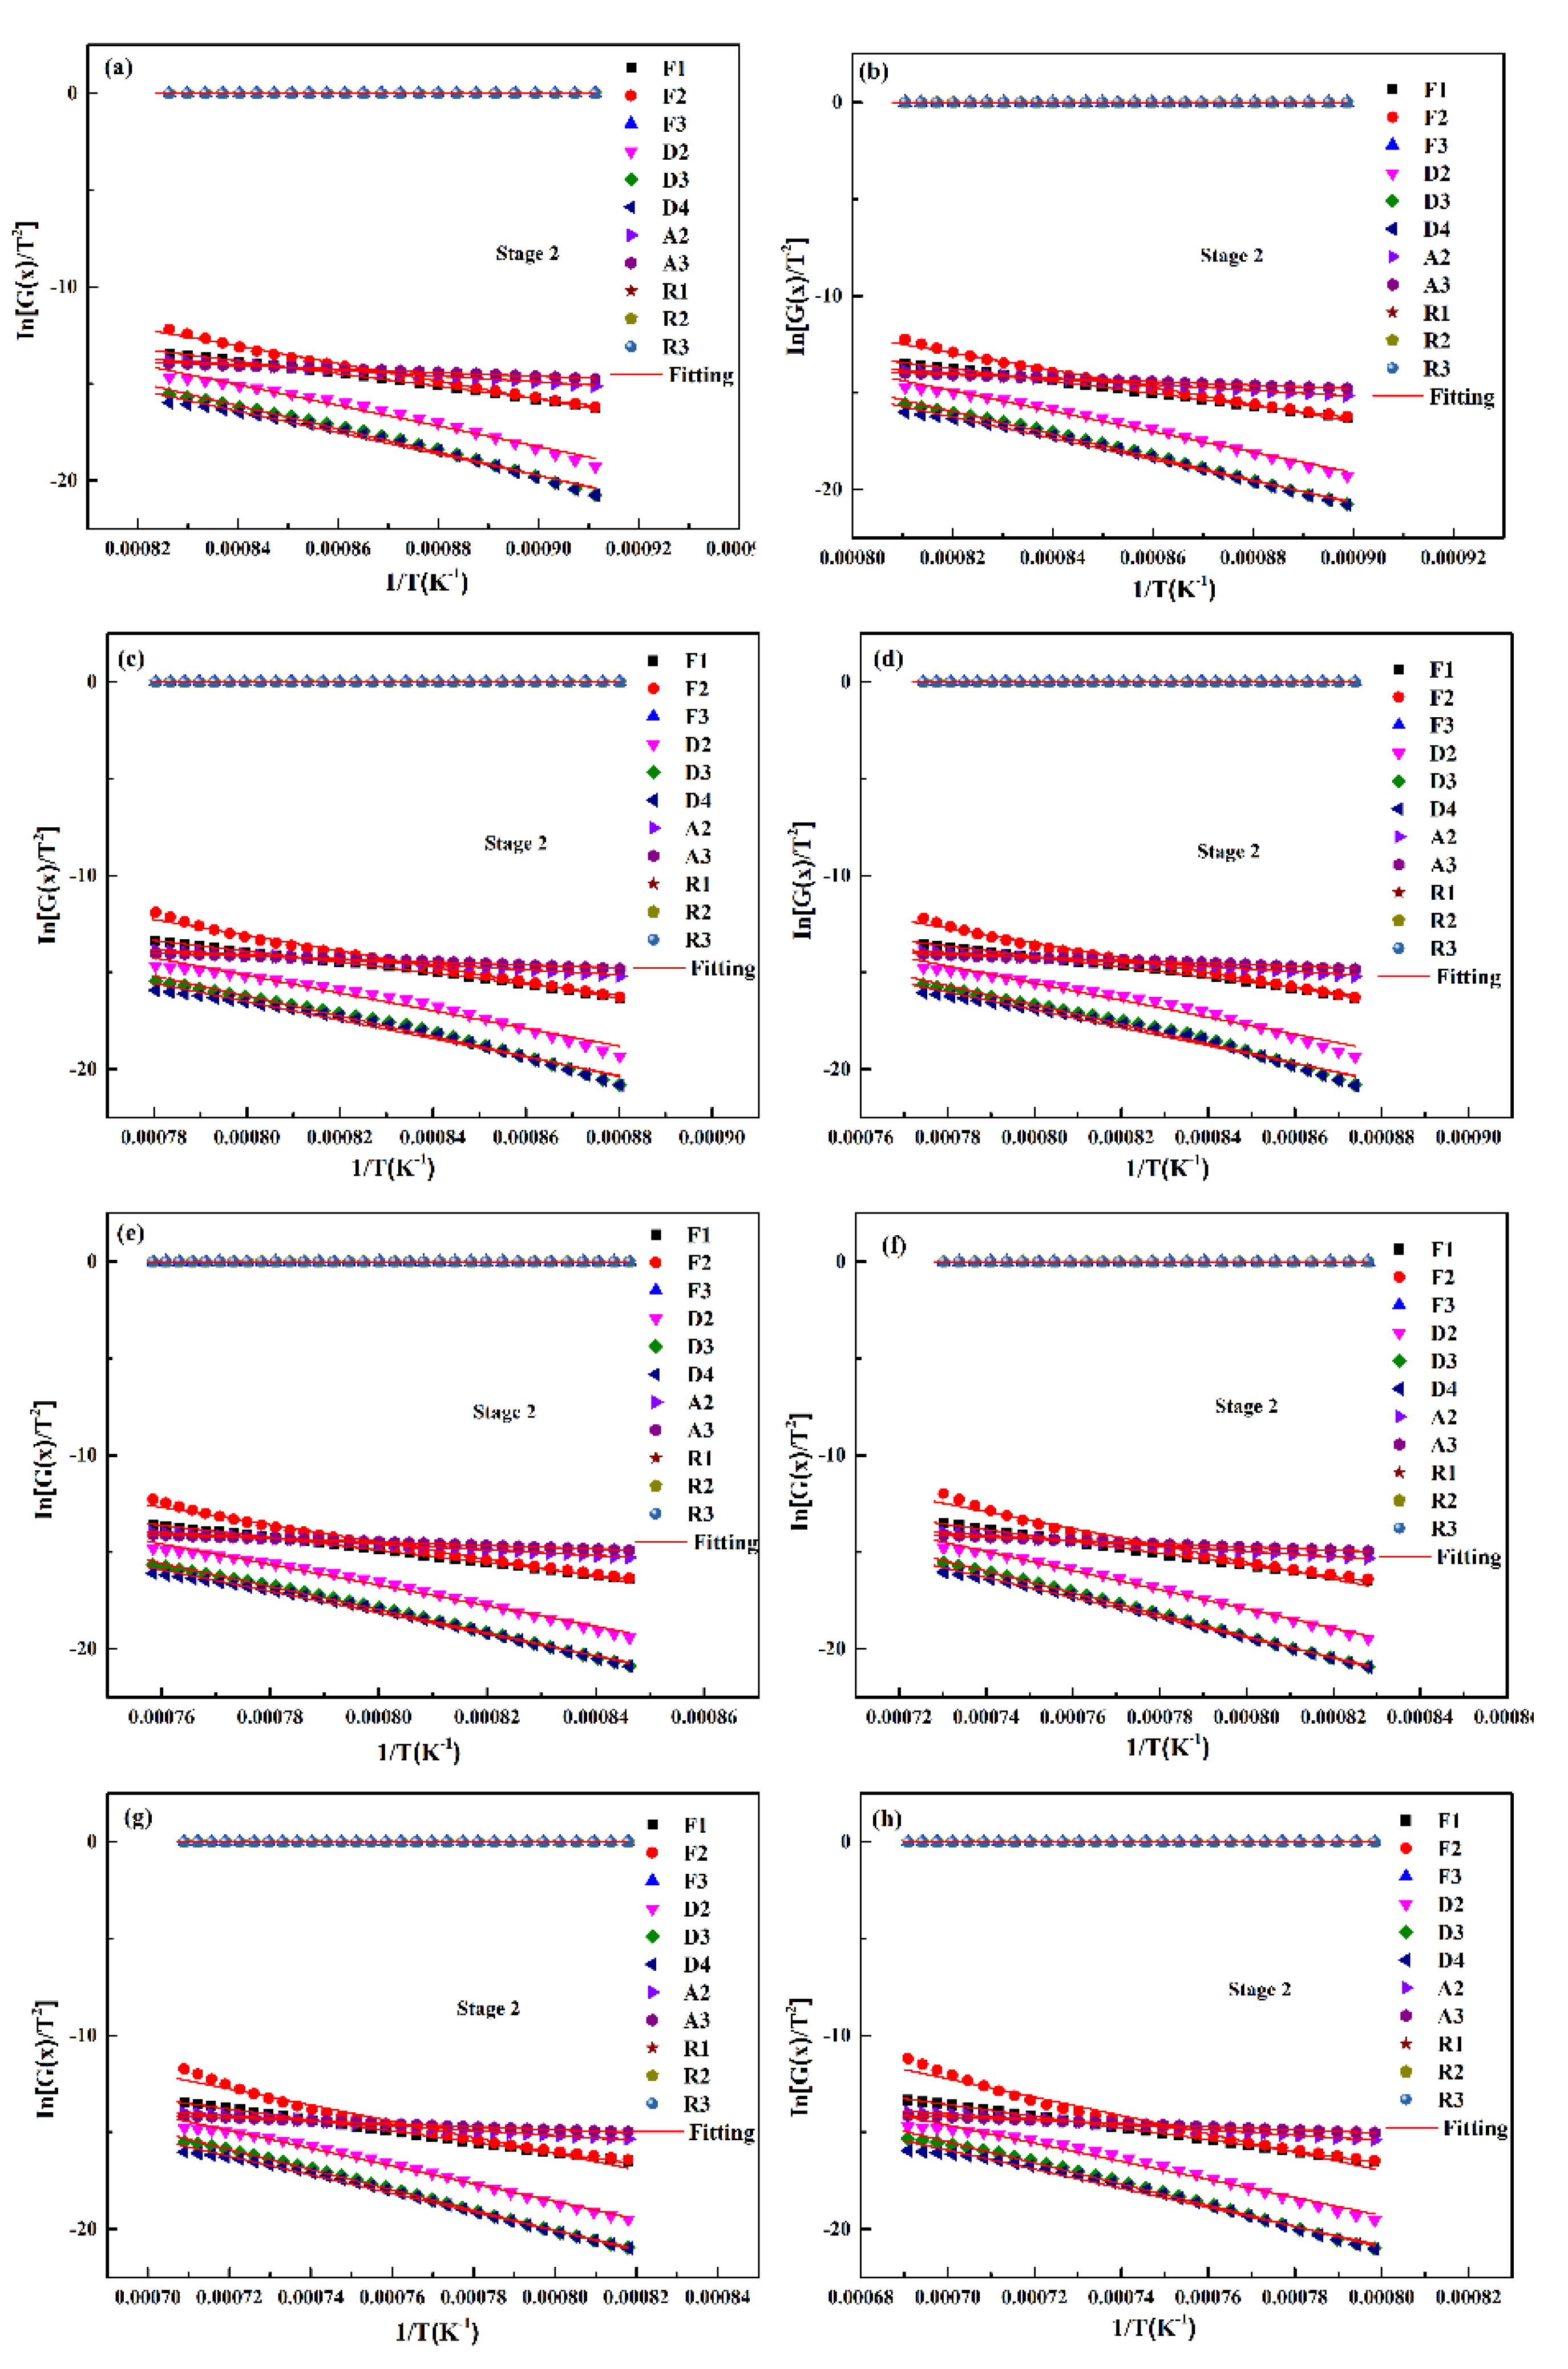
Energies 12 04324 g009
Figure 10. Linear fitting of the mechanism function for the second stage of the two UPCs at 5 °C/min, 10 °C/min, 15 °C/min and 20 °C/min: (a) Shenhua UPC at 5 °C/min, (b) Shenhua UPC at 10 °C/min, (c) Shenhua UPC at 15 °C/min, (d) Shenhua UPC at 20 °C/min, (e) Qingding UPC at 5 °C/min, (f) Qingding UPC at 10 °C/min, (g) Qingding UPC at 15 °C/min, and (h) Qingding UPC at 20 °C/min.
Energies 12 04324 g010
Table 1. Proximate and ultimate analysis of Shenhua and Qingding pulverized coal (mass %), air dry basis.
SampleProximate AnalysisUltimate Analysis
MoistureVolatilesAshFixed CarbonCHONSt
Shenhua5.2723.944.9865.8168.314.8910.230.860.26
Qingding1.207.9912.2578.5683.570.171.990.970.71
Table 2. Combustion conversion degree of Shenhua and Qingding pulverized coal (%).
SampleAsh Content of UPCCombustion Conversion Degree
Shenhua13.1765.43
Qingding21.0847.74
Table 3. Characteristic temperatures of the gasification reaction of the different UPCs at 10 °C/min heating rate.
SampleT10, °CTm, °CT90, °C
Shenhua839919964
Qingding93410471090
Table 4. Characteristic temperature of gasification reaction of UPC under different heating rates.
SampleHeating Rate (°C/min)T10, °CTm, °CT90, °C
Shenhua UPC5824893941
10839919964
158639451004
208719611019
Qingding UPC59089981047
1093410471090
1594910721123
2097910991146
Table 5. Mechanism functions of common gas-solid reaction models.
MechanismCodeDifferential FormIntegral Form
Chemical reactionN = 1F1(1 − x )−In(1 − x )
N = 2F2(1 − x )2(1 − x )−1 − 1
N = 3F3(1 − x )3[(1 − x )−2 − 1]/2
DiffusionThe two-dimensional diffusion controlD2[−In(1 − x )]−1 x + (1 − x )In(1 − x )
The two-dimensional diffusion control (Jander function)D31.5(1 − x )2/3[1 − (1 − x )1/3][1 − (1 x )1/3]2
The three-dimensional diffusion control (Ginstling-Brounshten function)D41.5[1 − (1 − x )1/3 − 1]−1(1 − 2 x /3) − (1 − x )2/3
Shrinking coreShrinking coreR12(1 − x)1/21 − (1 − x)1/2
Shrinking coreR23(1 − x)2/31 − (1 − x)1/3
Shrinking core (n = 2)R3 1 2 (1 − x)−11 − (1 − x)2
Random nucleation and nuclei growthTwo-dimensionalA22(1 − x )[−In(1 − x )]1/2[−In(1 − x )]1/2
Three-dimensionalA33(1 − x )[−In(1 − x )]2/3[−In(1 − x )]1/3
Table 6. Kinetic parameters of different mechanism functions of the Shenhua UPC in the second stage at 5 °C/min.
CodeStage 2
E/(kJ/mol)A/s−1R2
F1269.891.12 × 10110.9972
F2380.222.40 × 10160.9933
F33.95 × 10−42.83 × 10−10.9873
D2442.502.03 × 10180.9805
D3498.682.26 × 10200.9915
D4461.013.50 × 10180.9849
A2125.351.99 × 1040.9966
A377.178.92 × 100.9959
R12.07 × 10−41.24 × 10−10.9791
R22.22 × 10−41.34 × 10−10.9844
R31.25 × 10−47.52 × 10−20.9074
Table 7. Optimum mechanism function kinetic parameters for the second stage of the UPC gasification reaction at different heating rates.
SampleHeating RateStage/°CReaction MechanismE/(kJ/mol)A/s−1R2
Shenhua UPC5 °C/min2F1269.891.12 × 10110.9972
10 °C/min2F1265.167.73 × 10100.9995
15 °C/min2F1233.742.26 × 1090.9941
20 °C/min2F1223.418.16 × 1080.9922
Qingding UPC5 °C/min2F1266.707.63 × 1090.9998
10 °C/min2F1252.011.63 × 1090.9993
15 °C/min2F1235.433.10 × 1080.9989
20 °C/min2F1251.541.43 × 1090.9998
Table 8. Verification results of Equation (10).
Shenhua UPC5 °C/min10 °C/min
T(K)R J/(mol*K)E(kJ/mol)T(K)R J/(mol*K)E(kJ/mol)
1155.58.314269.891174.58.314265.16
1 2 R T E = 0.93 1 2 R T E = 0.93

