Reaction Kinetics and Coreflooding Study of High-Temperature Carbonate Reservoir Stimulation Using GLDA in Seawater

 ,
, 
 ,
, 
Abstract
1. Introduction
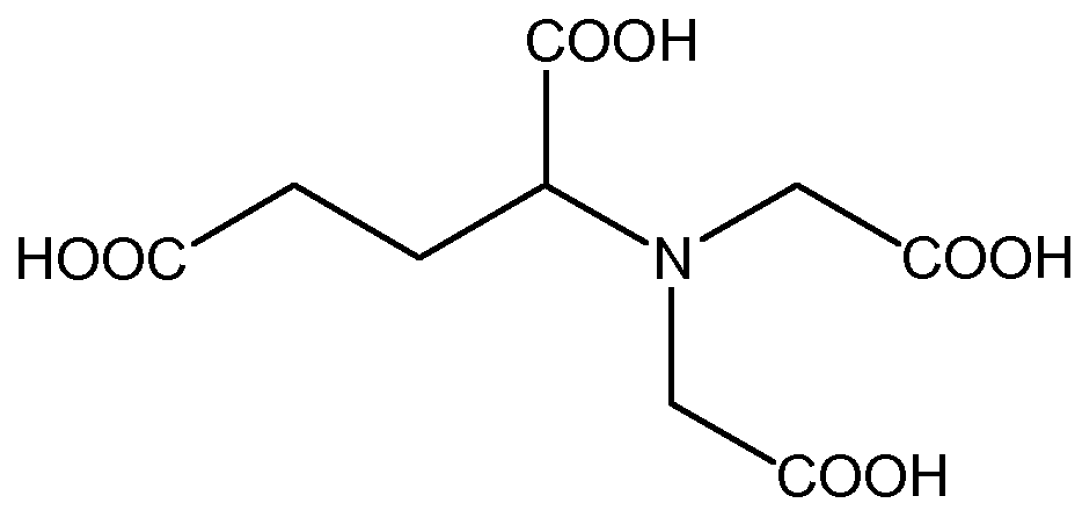
2. Chelating Agents
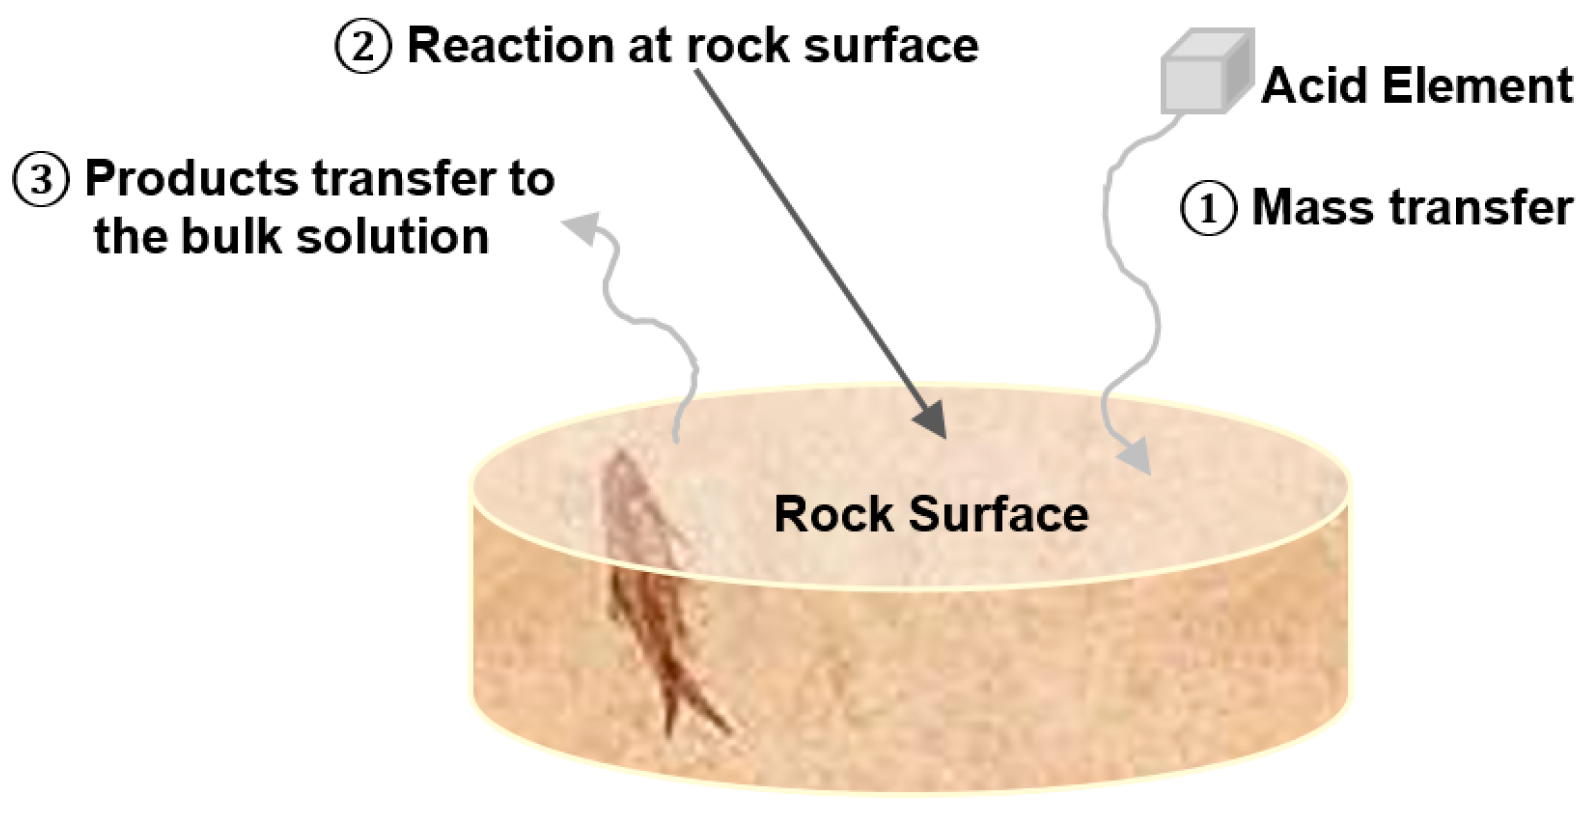
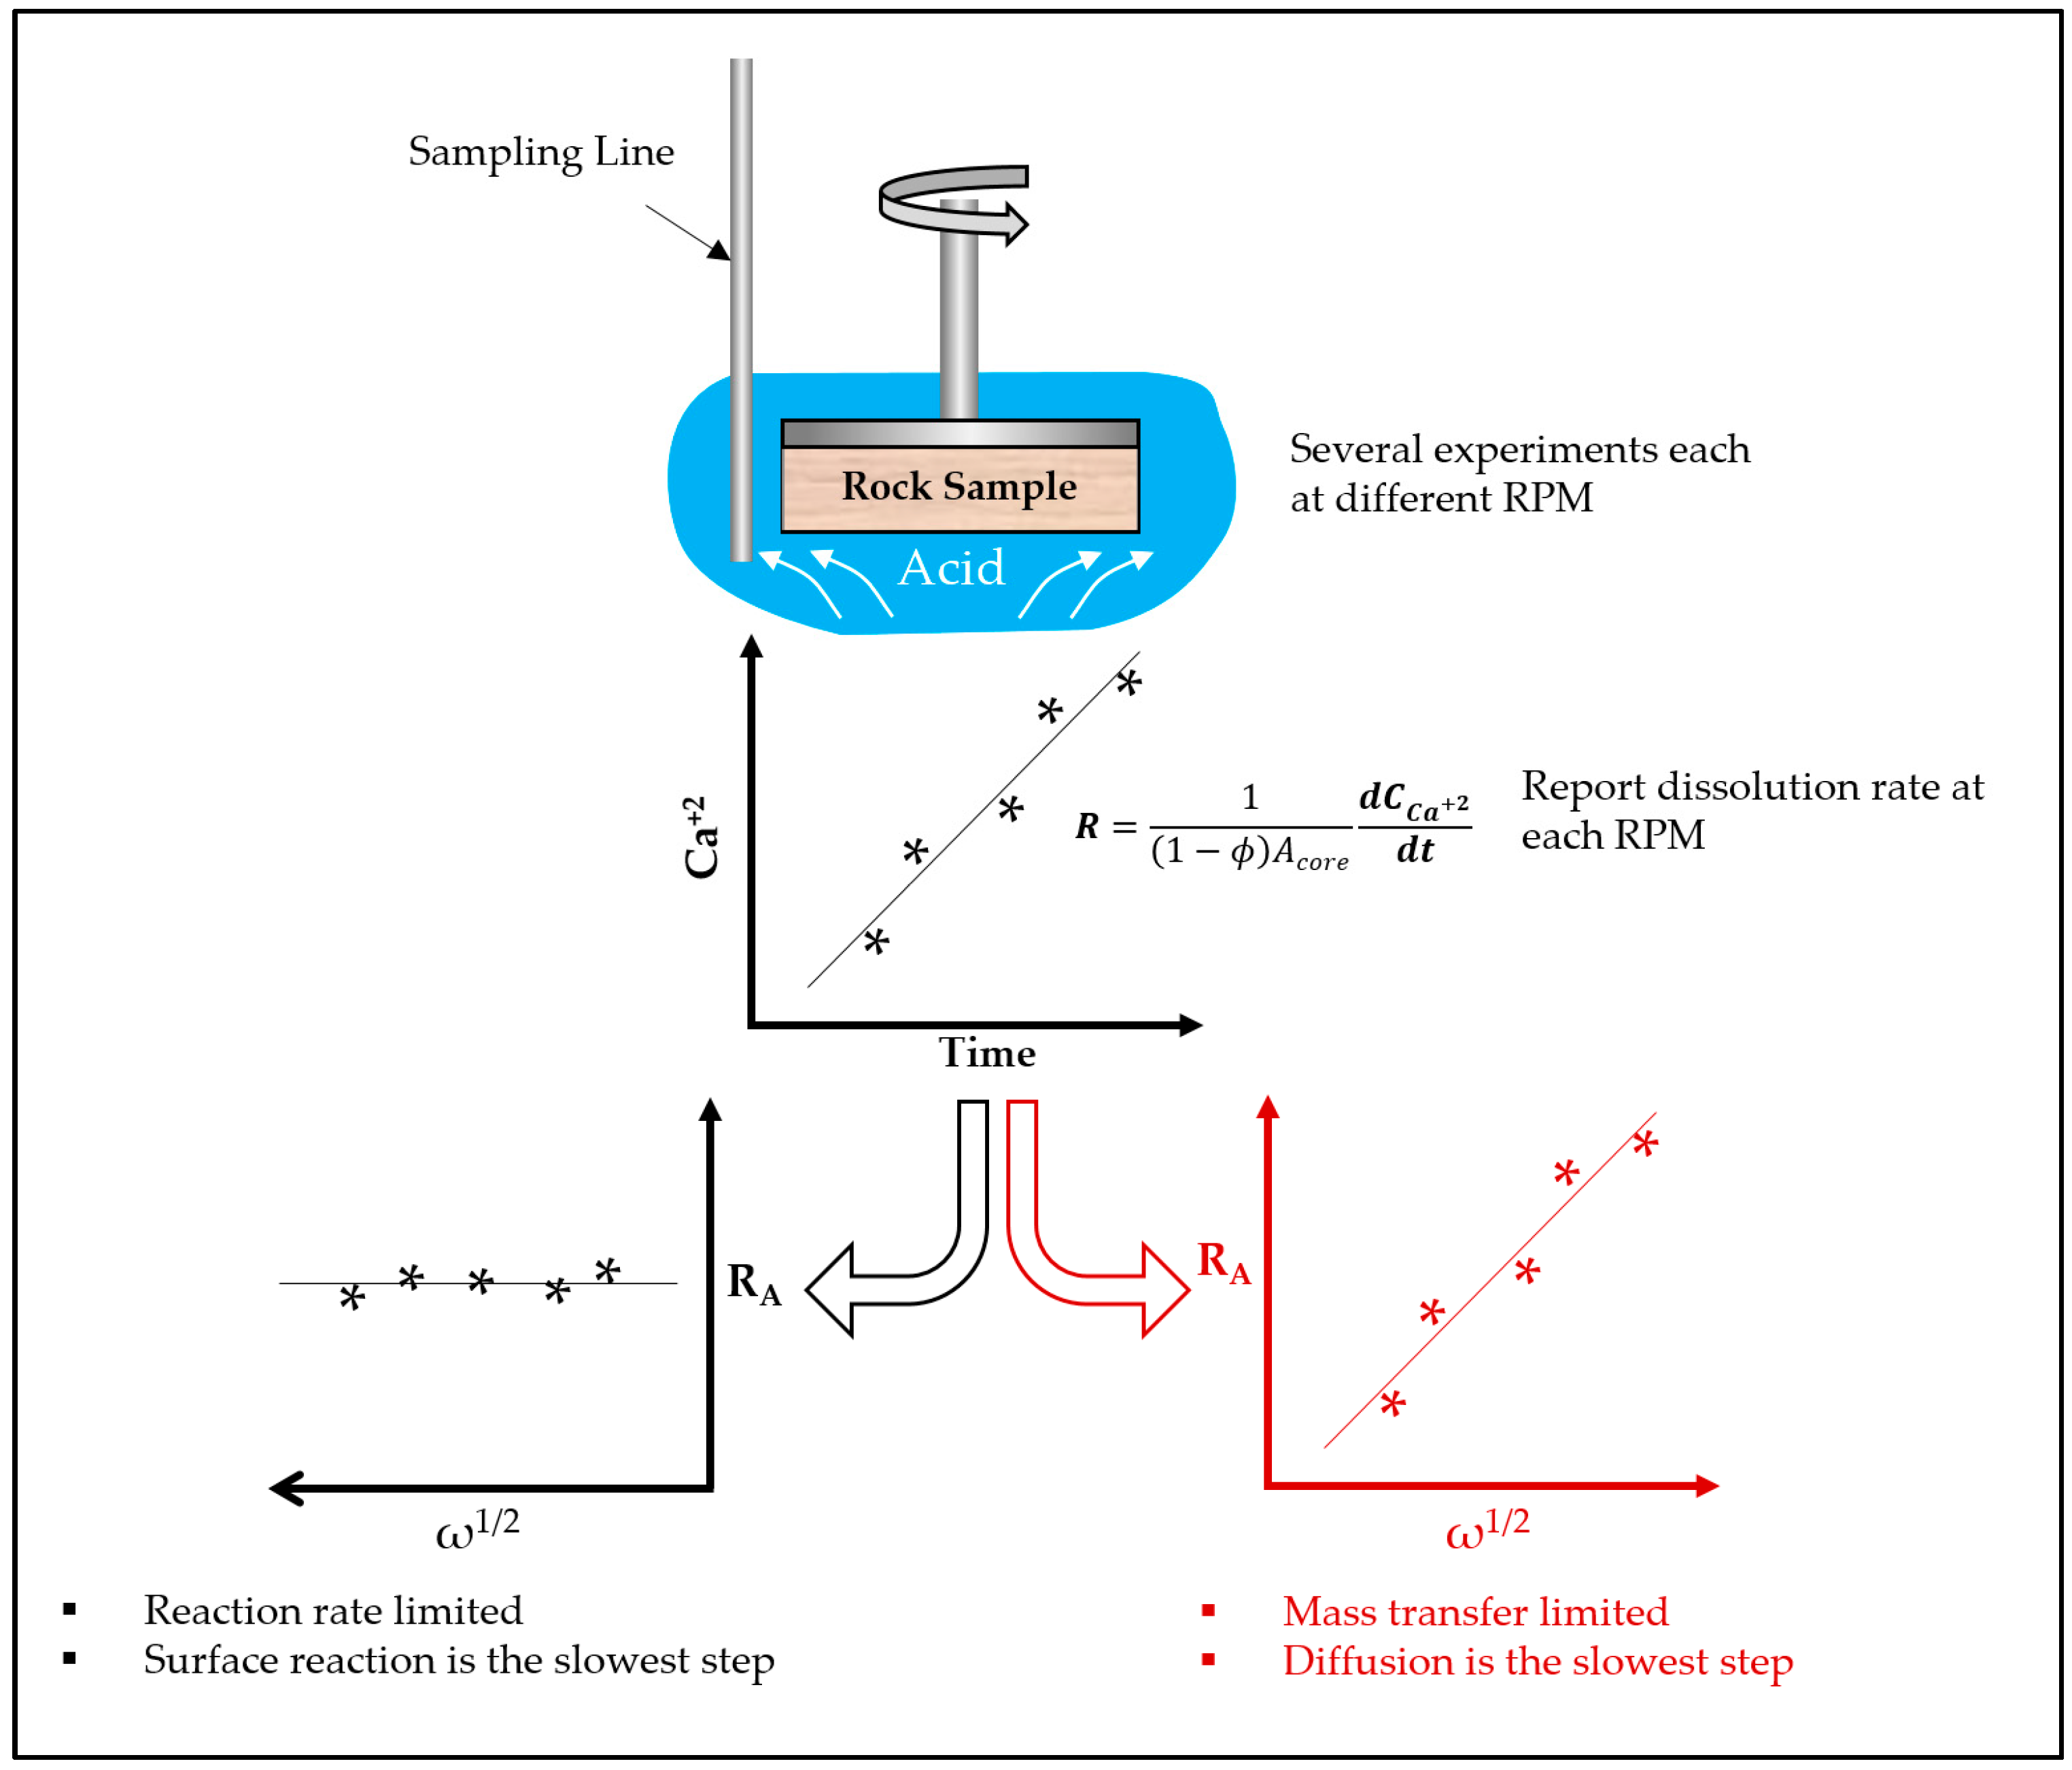
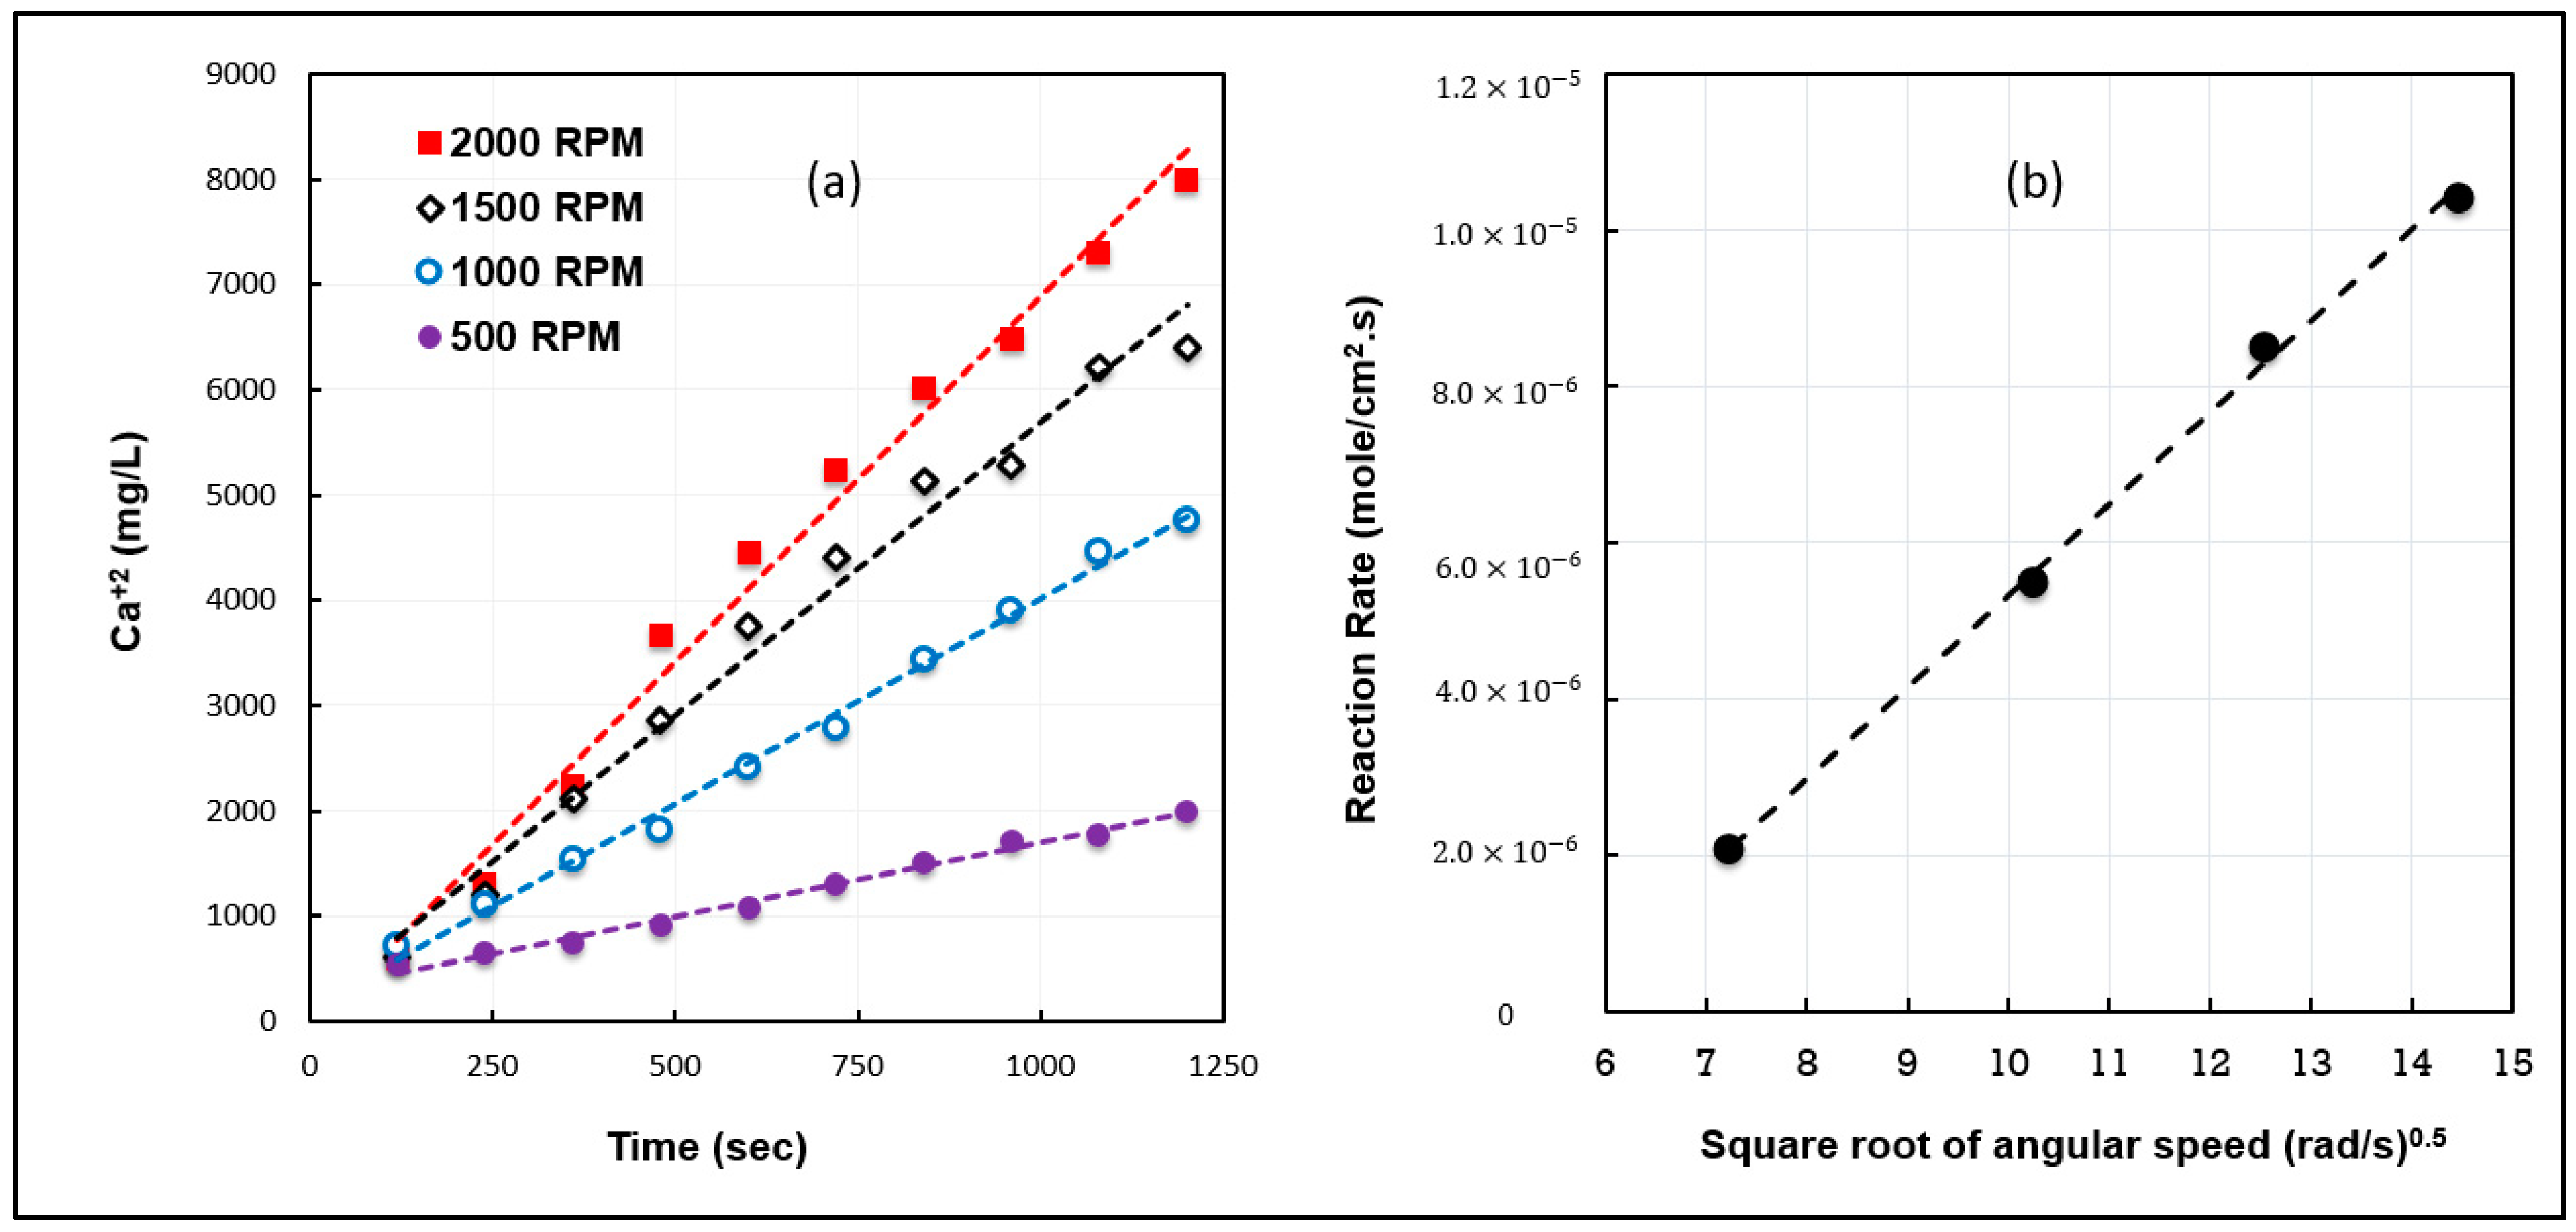
3. Rotating Disk Theory
- -
- Reactant transport to the rock surface.
- -
- Reaction at the rock surface.
- -
- Products transport from the rock surface.
4. Materials and Methodology
4.1. Rock Samples and Fluids
4.2. Methodology
5. Experimental Work
5.1. Rock Samples Preparation
5.2. RDA Experiments
6. Results and Discussion
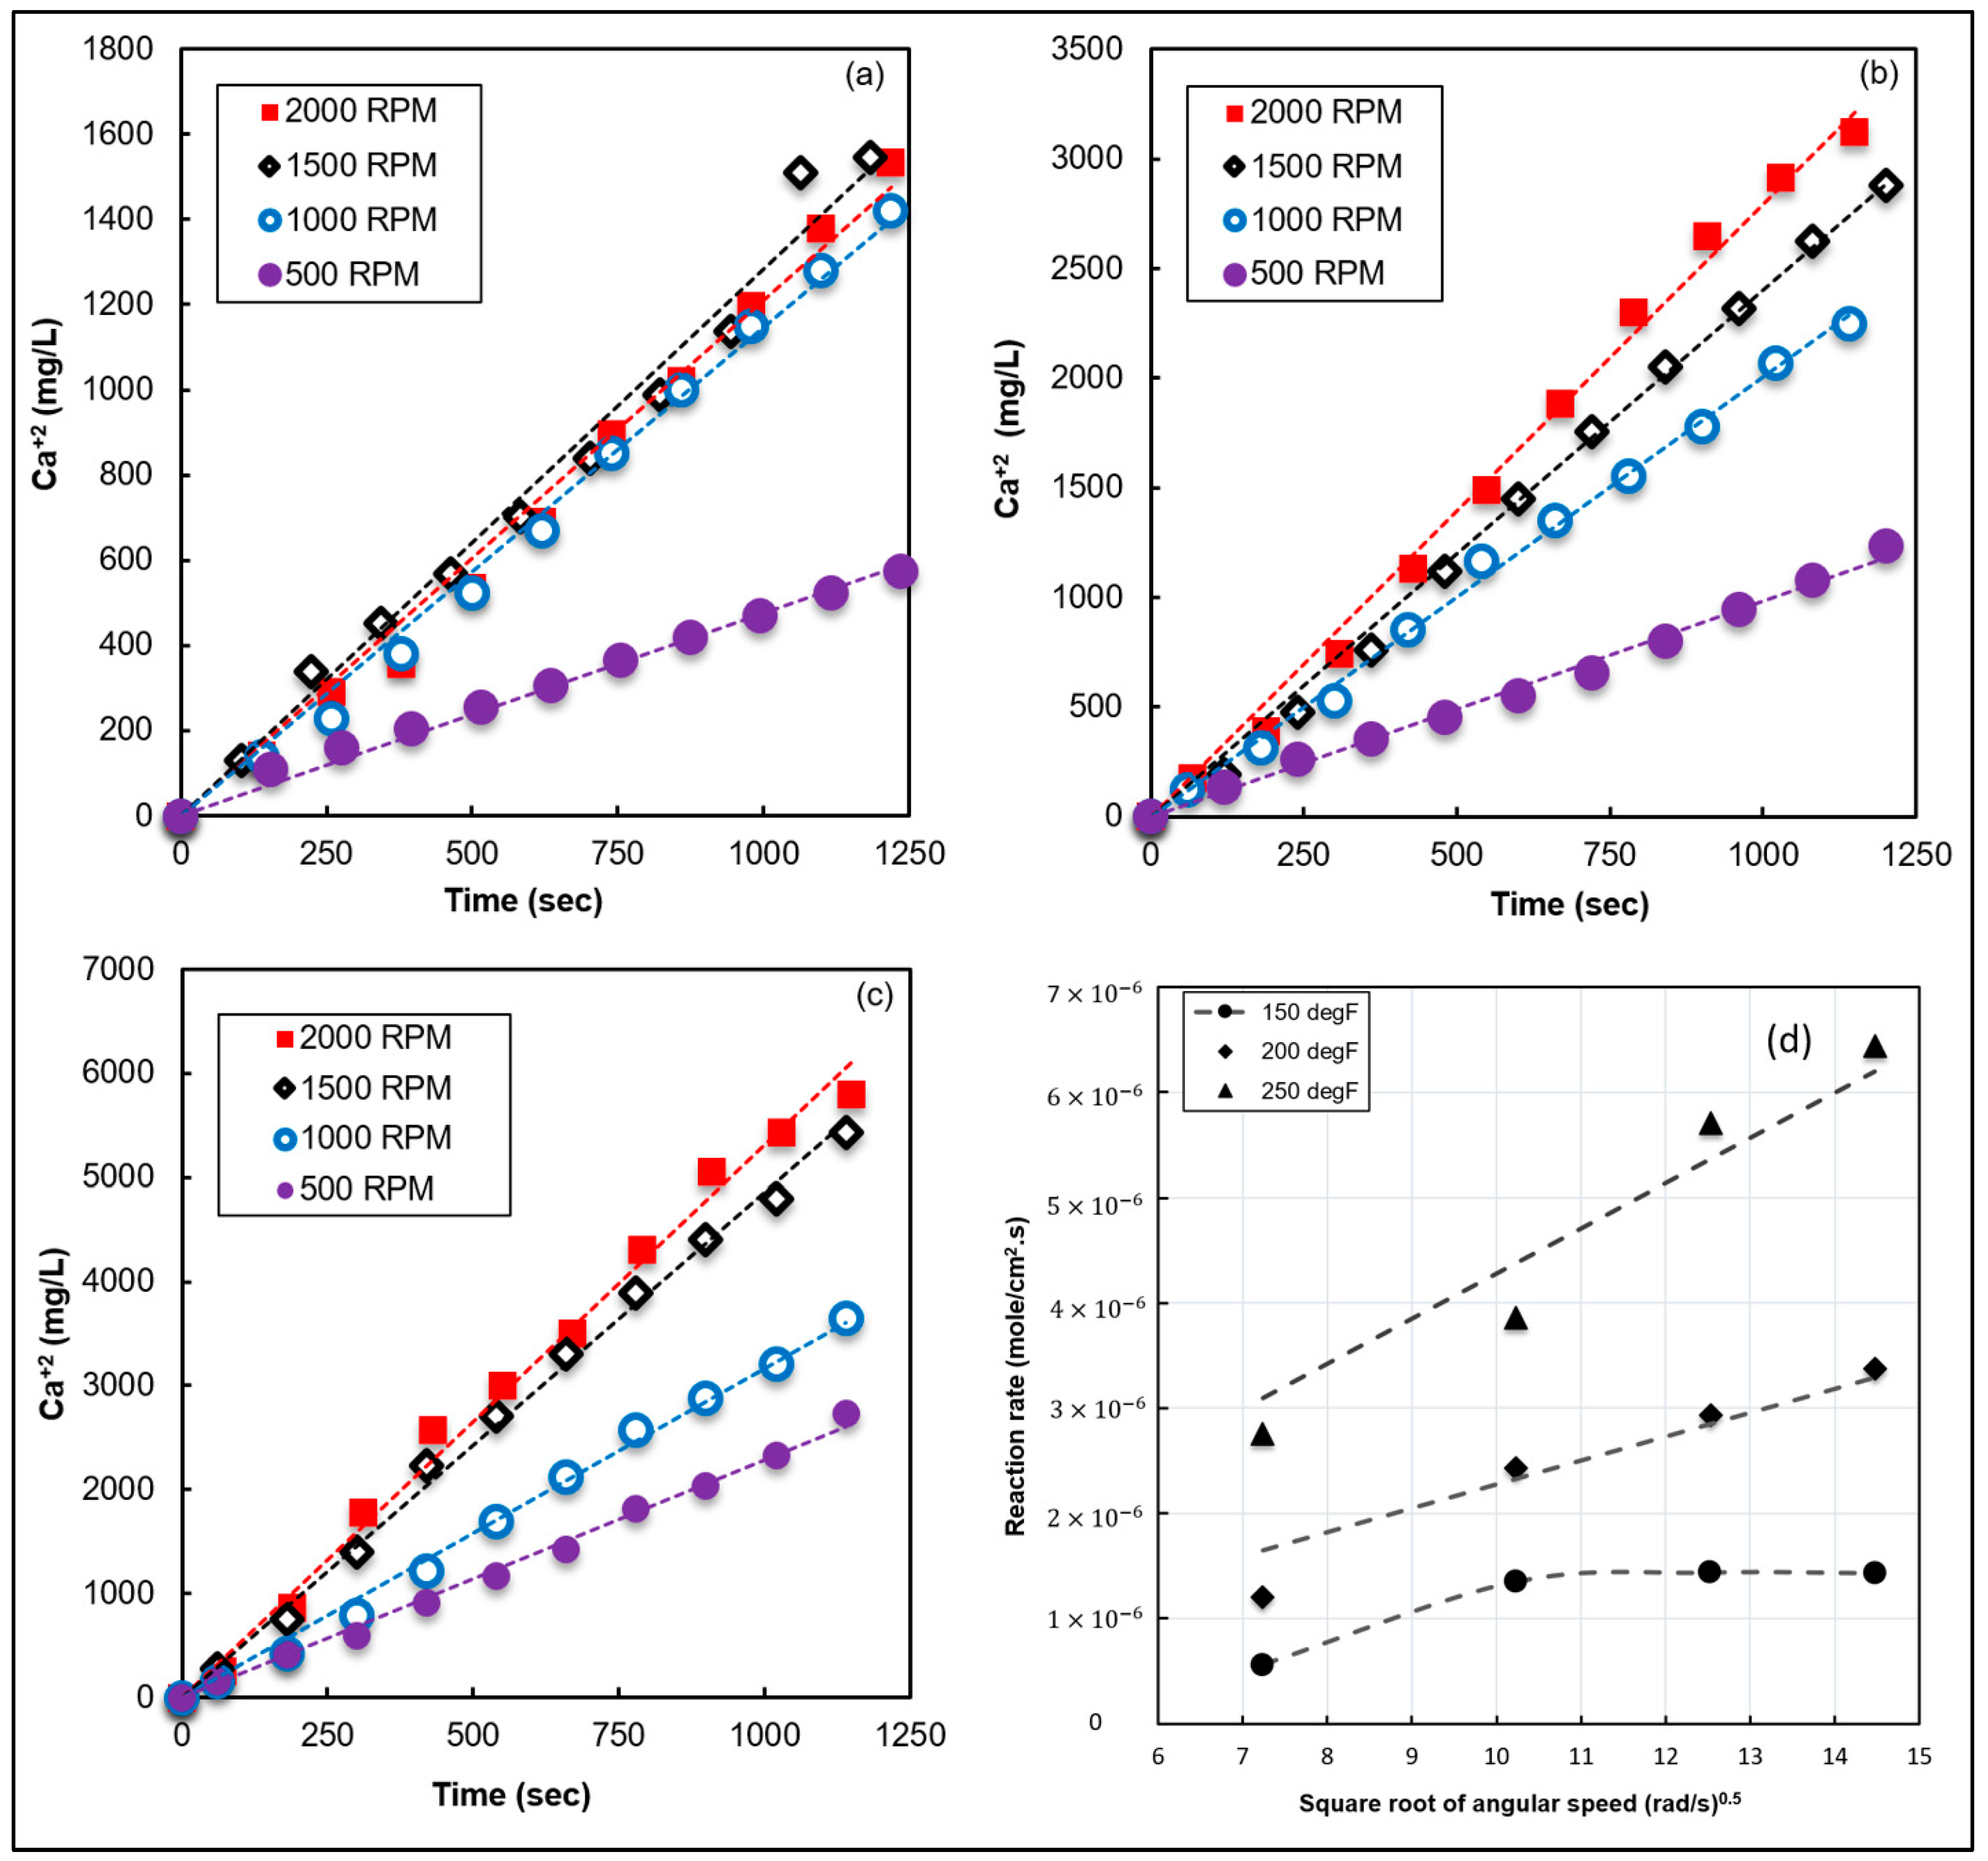
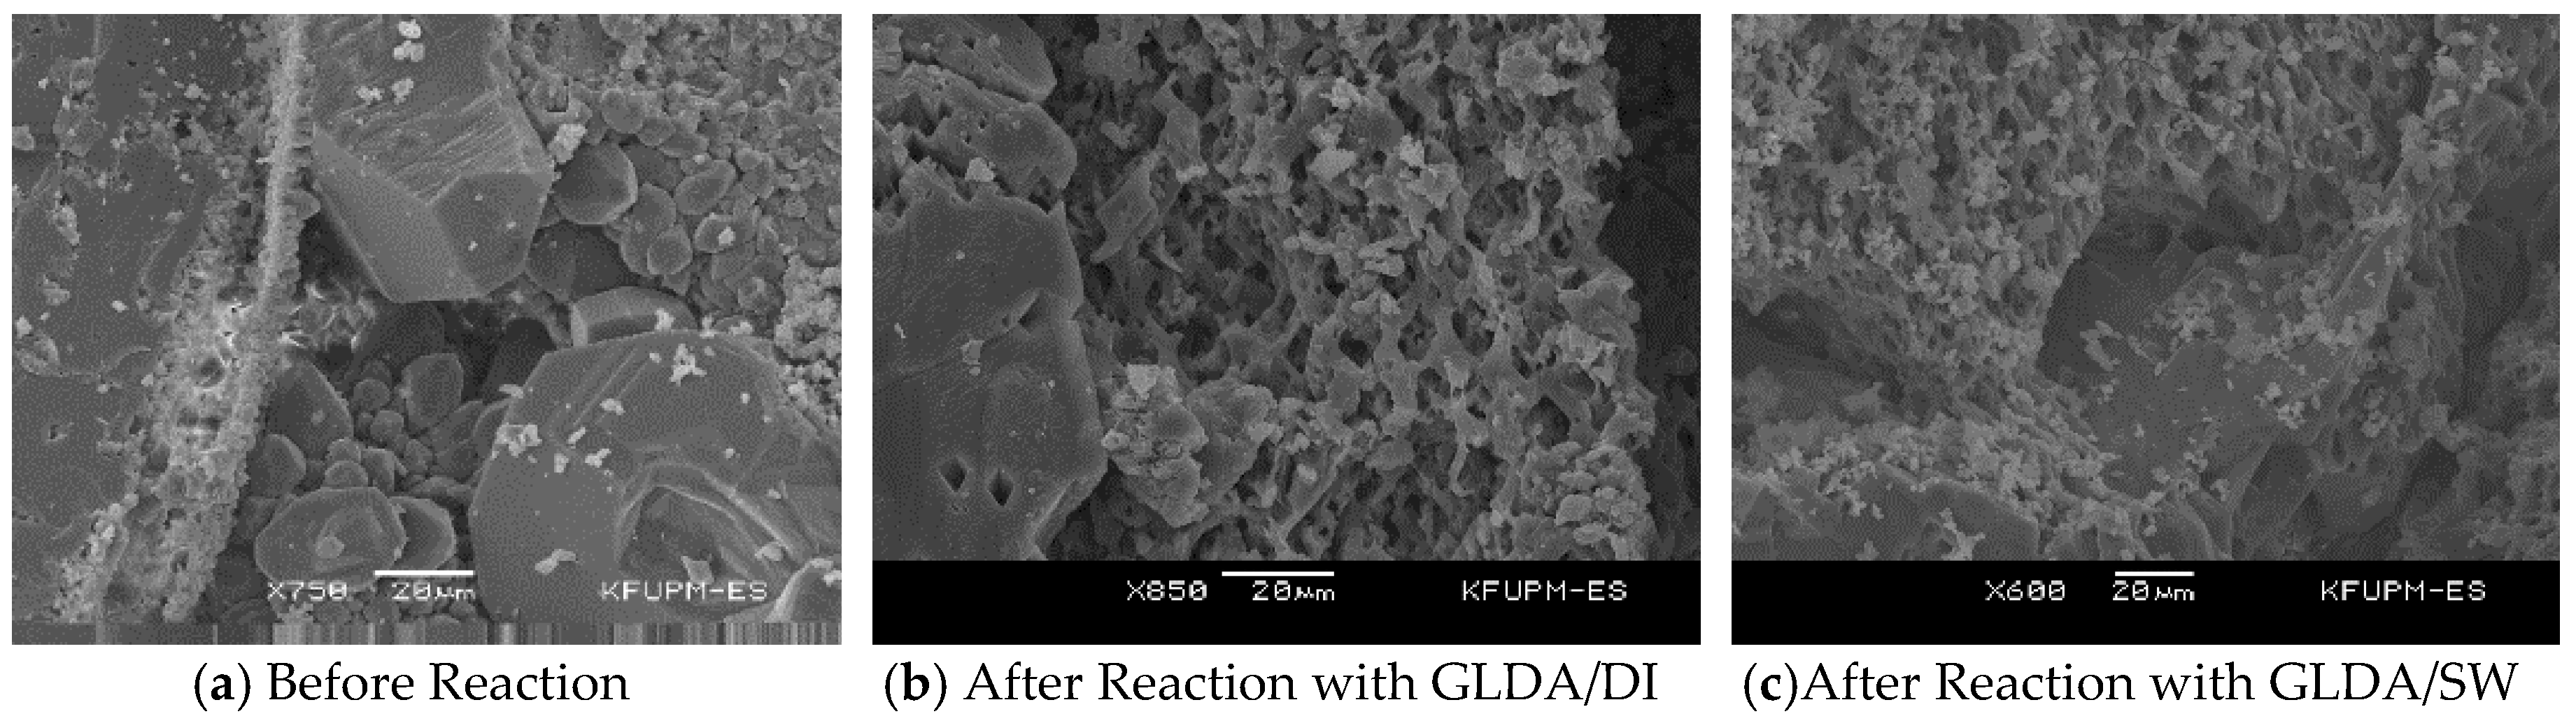
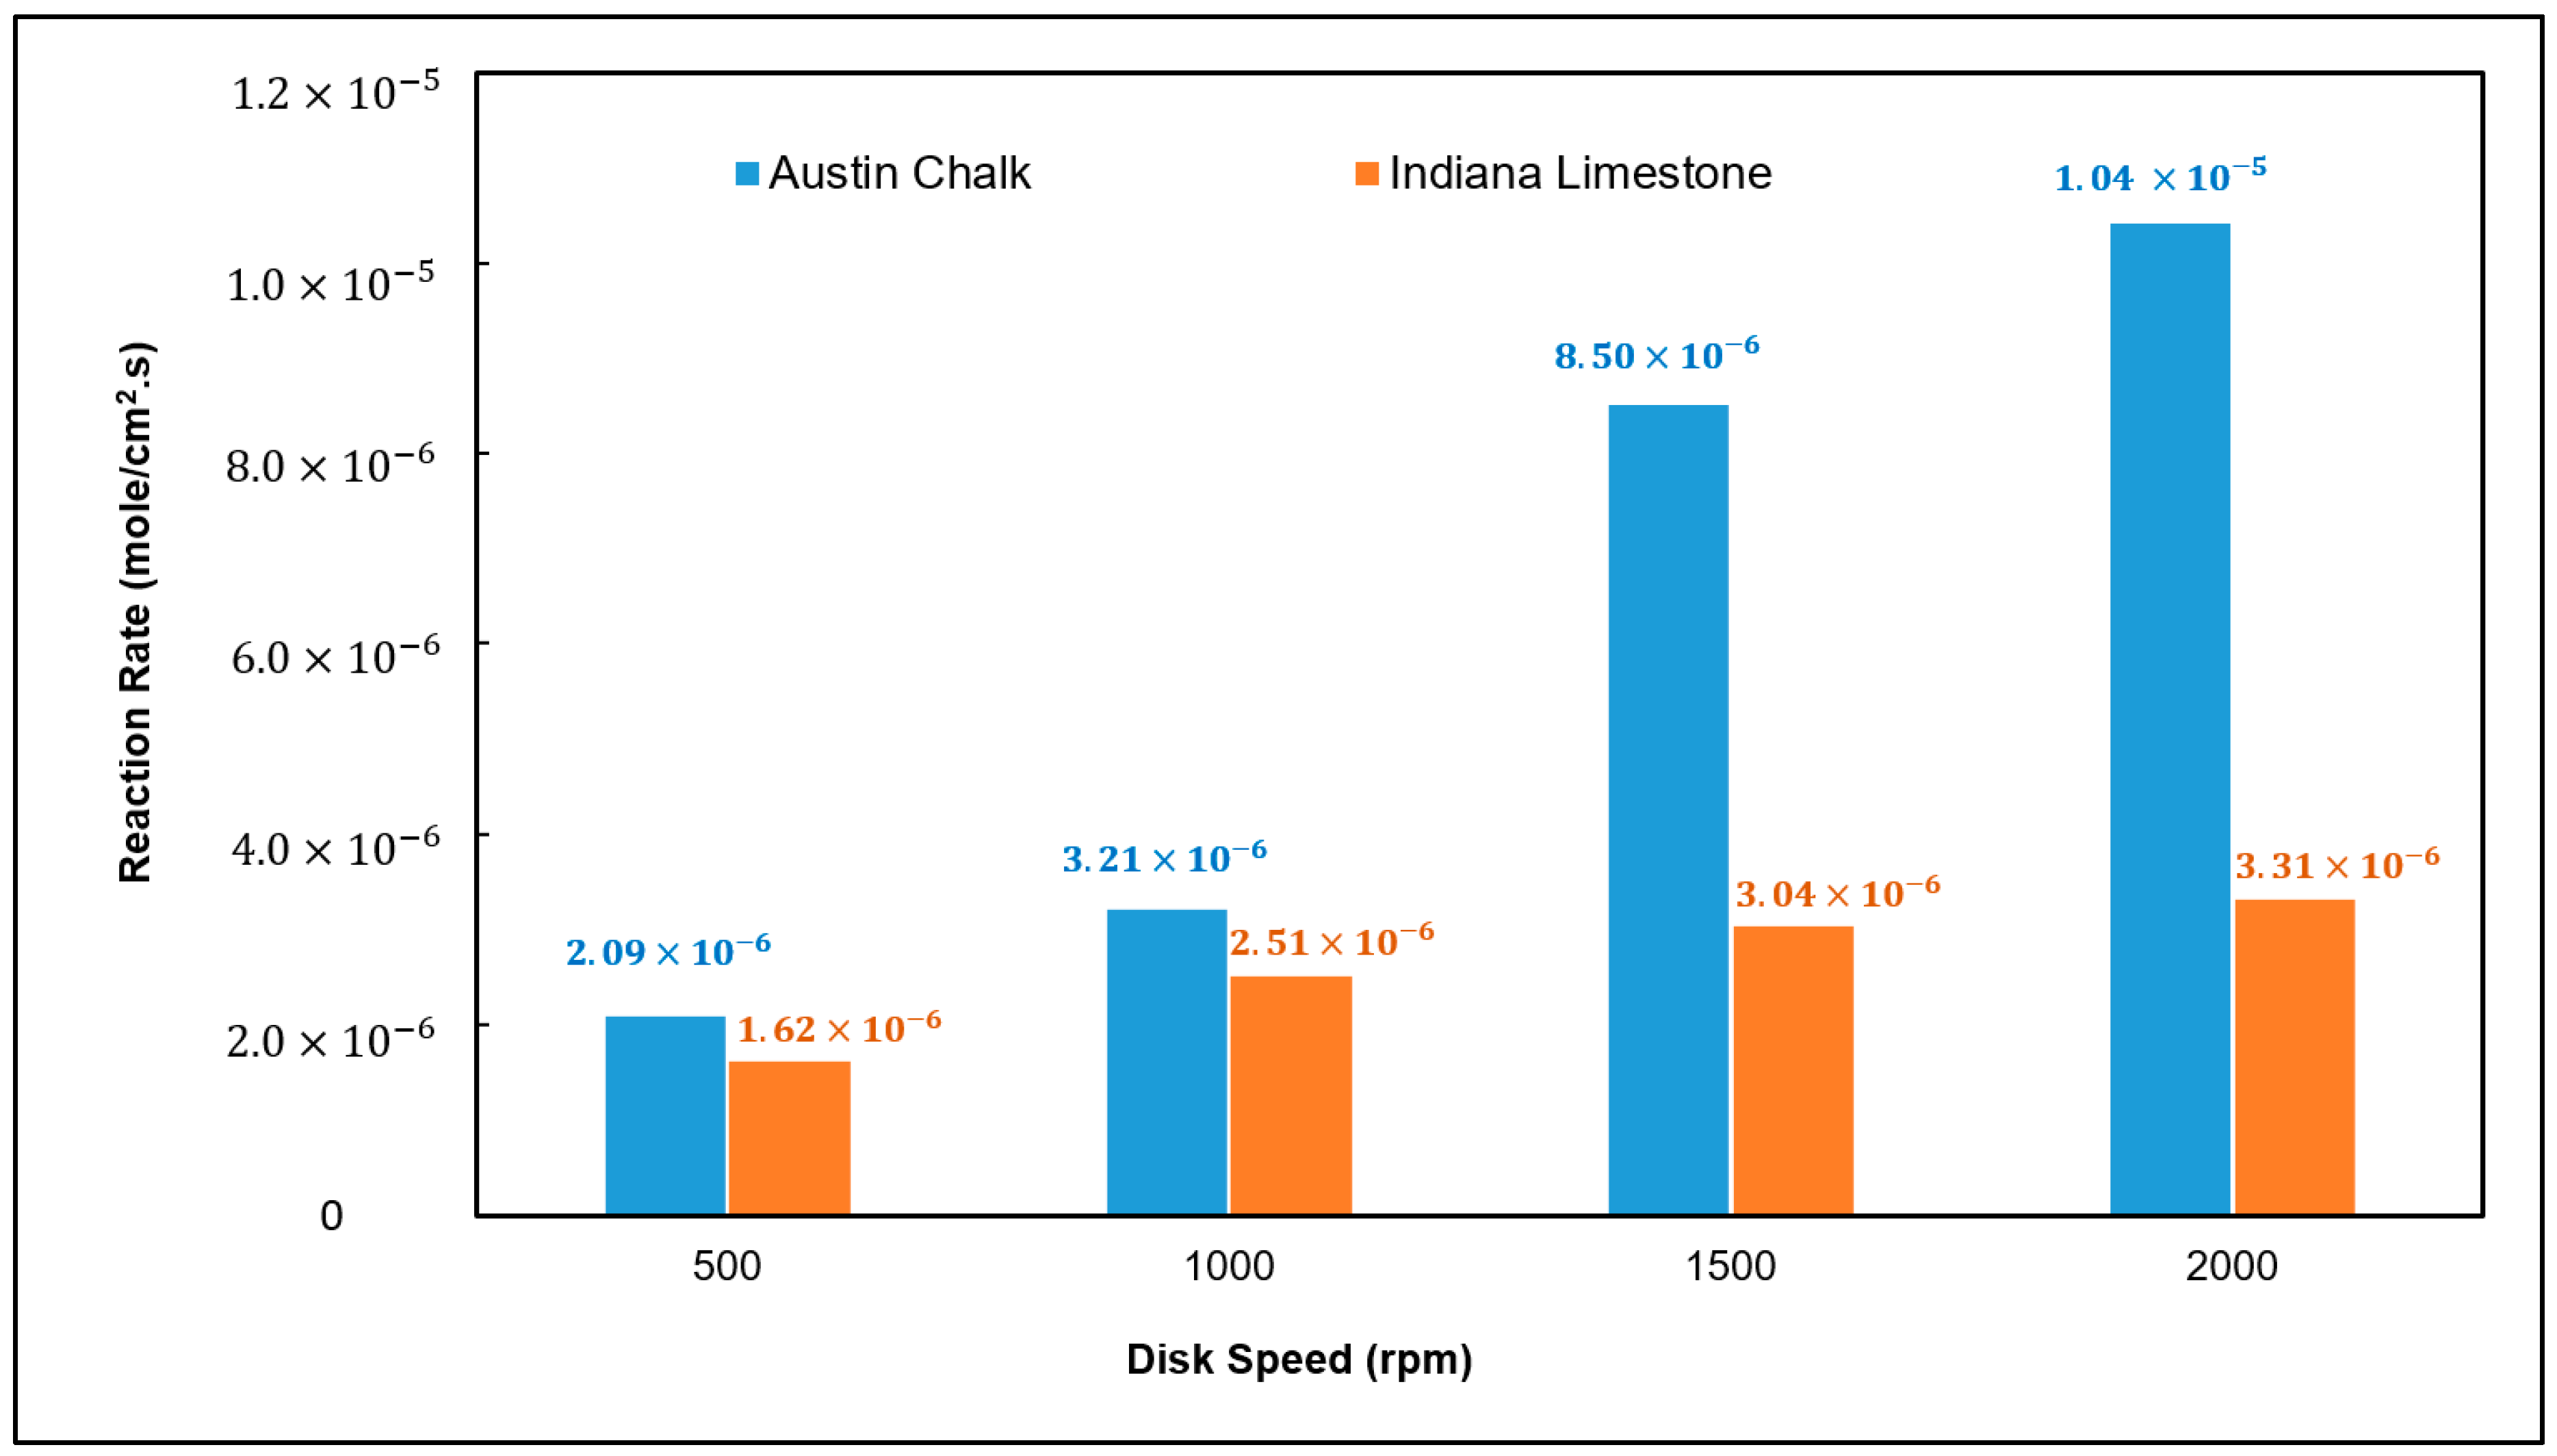
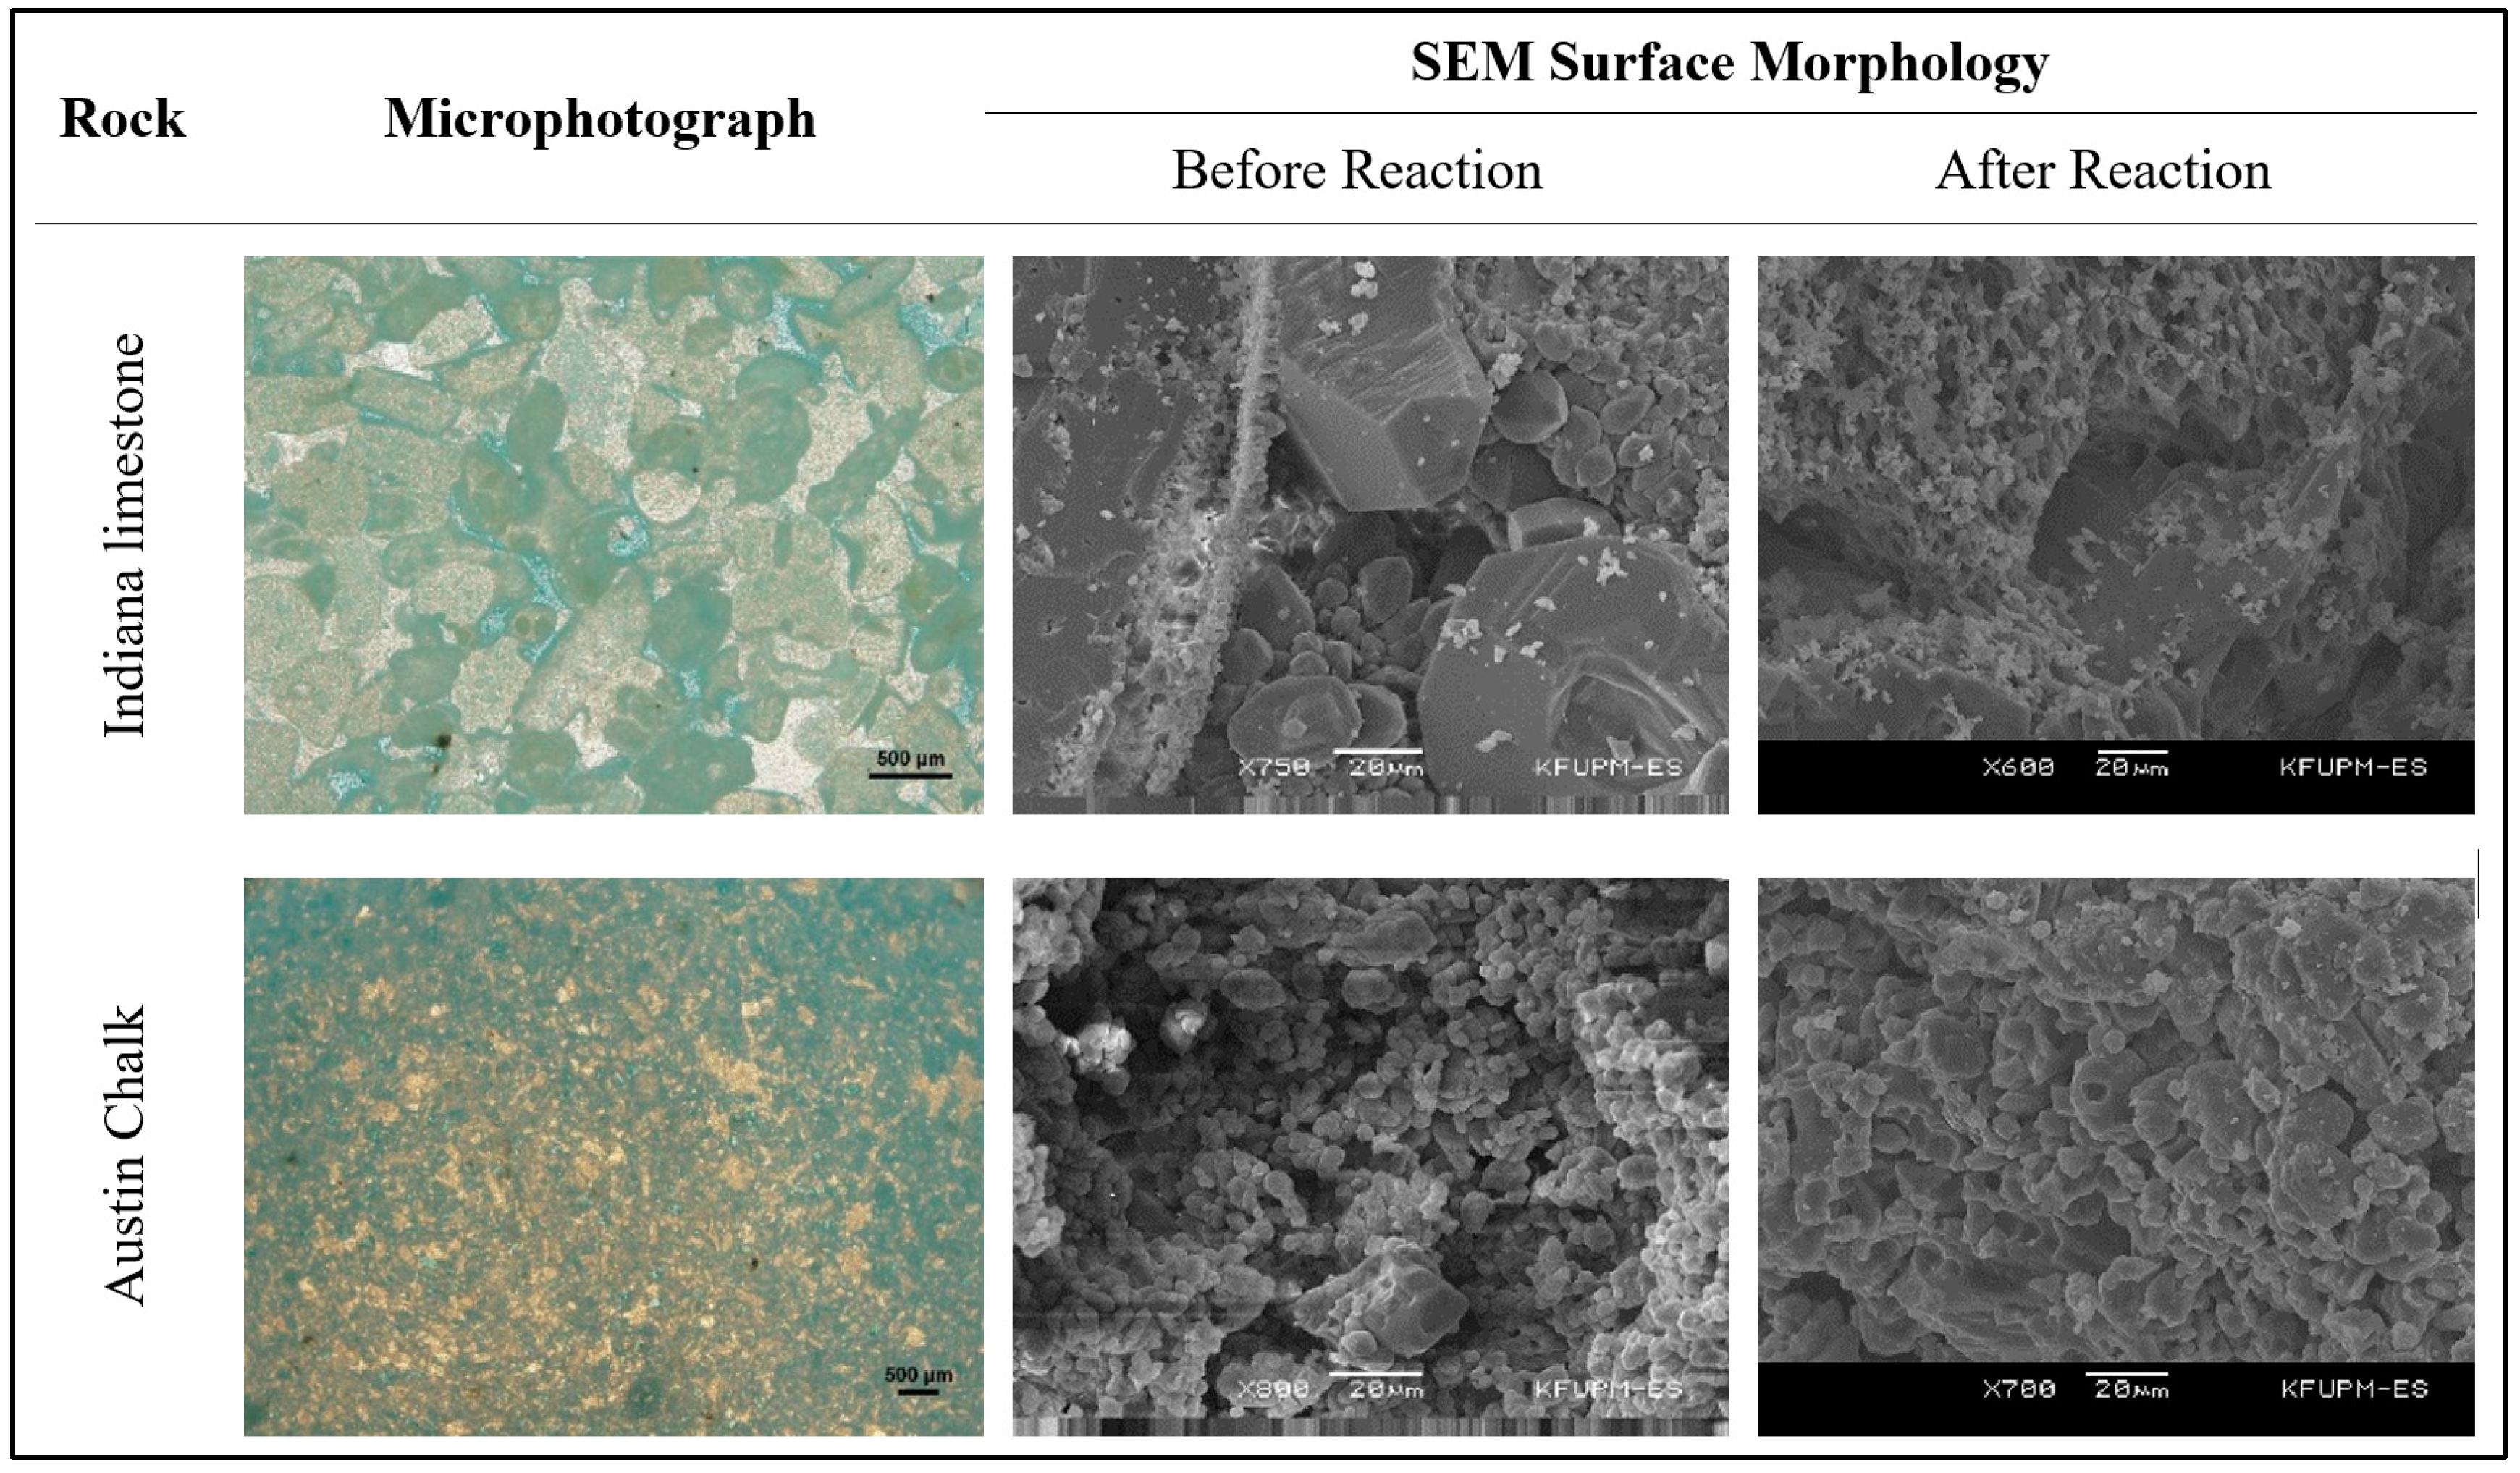
6.1. Indiana Limestone
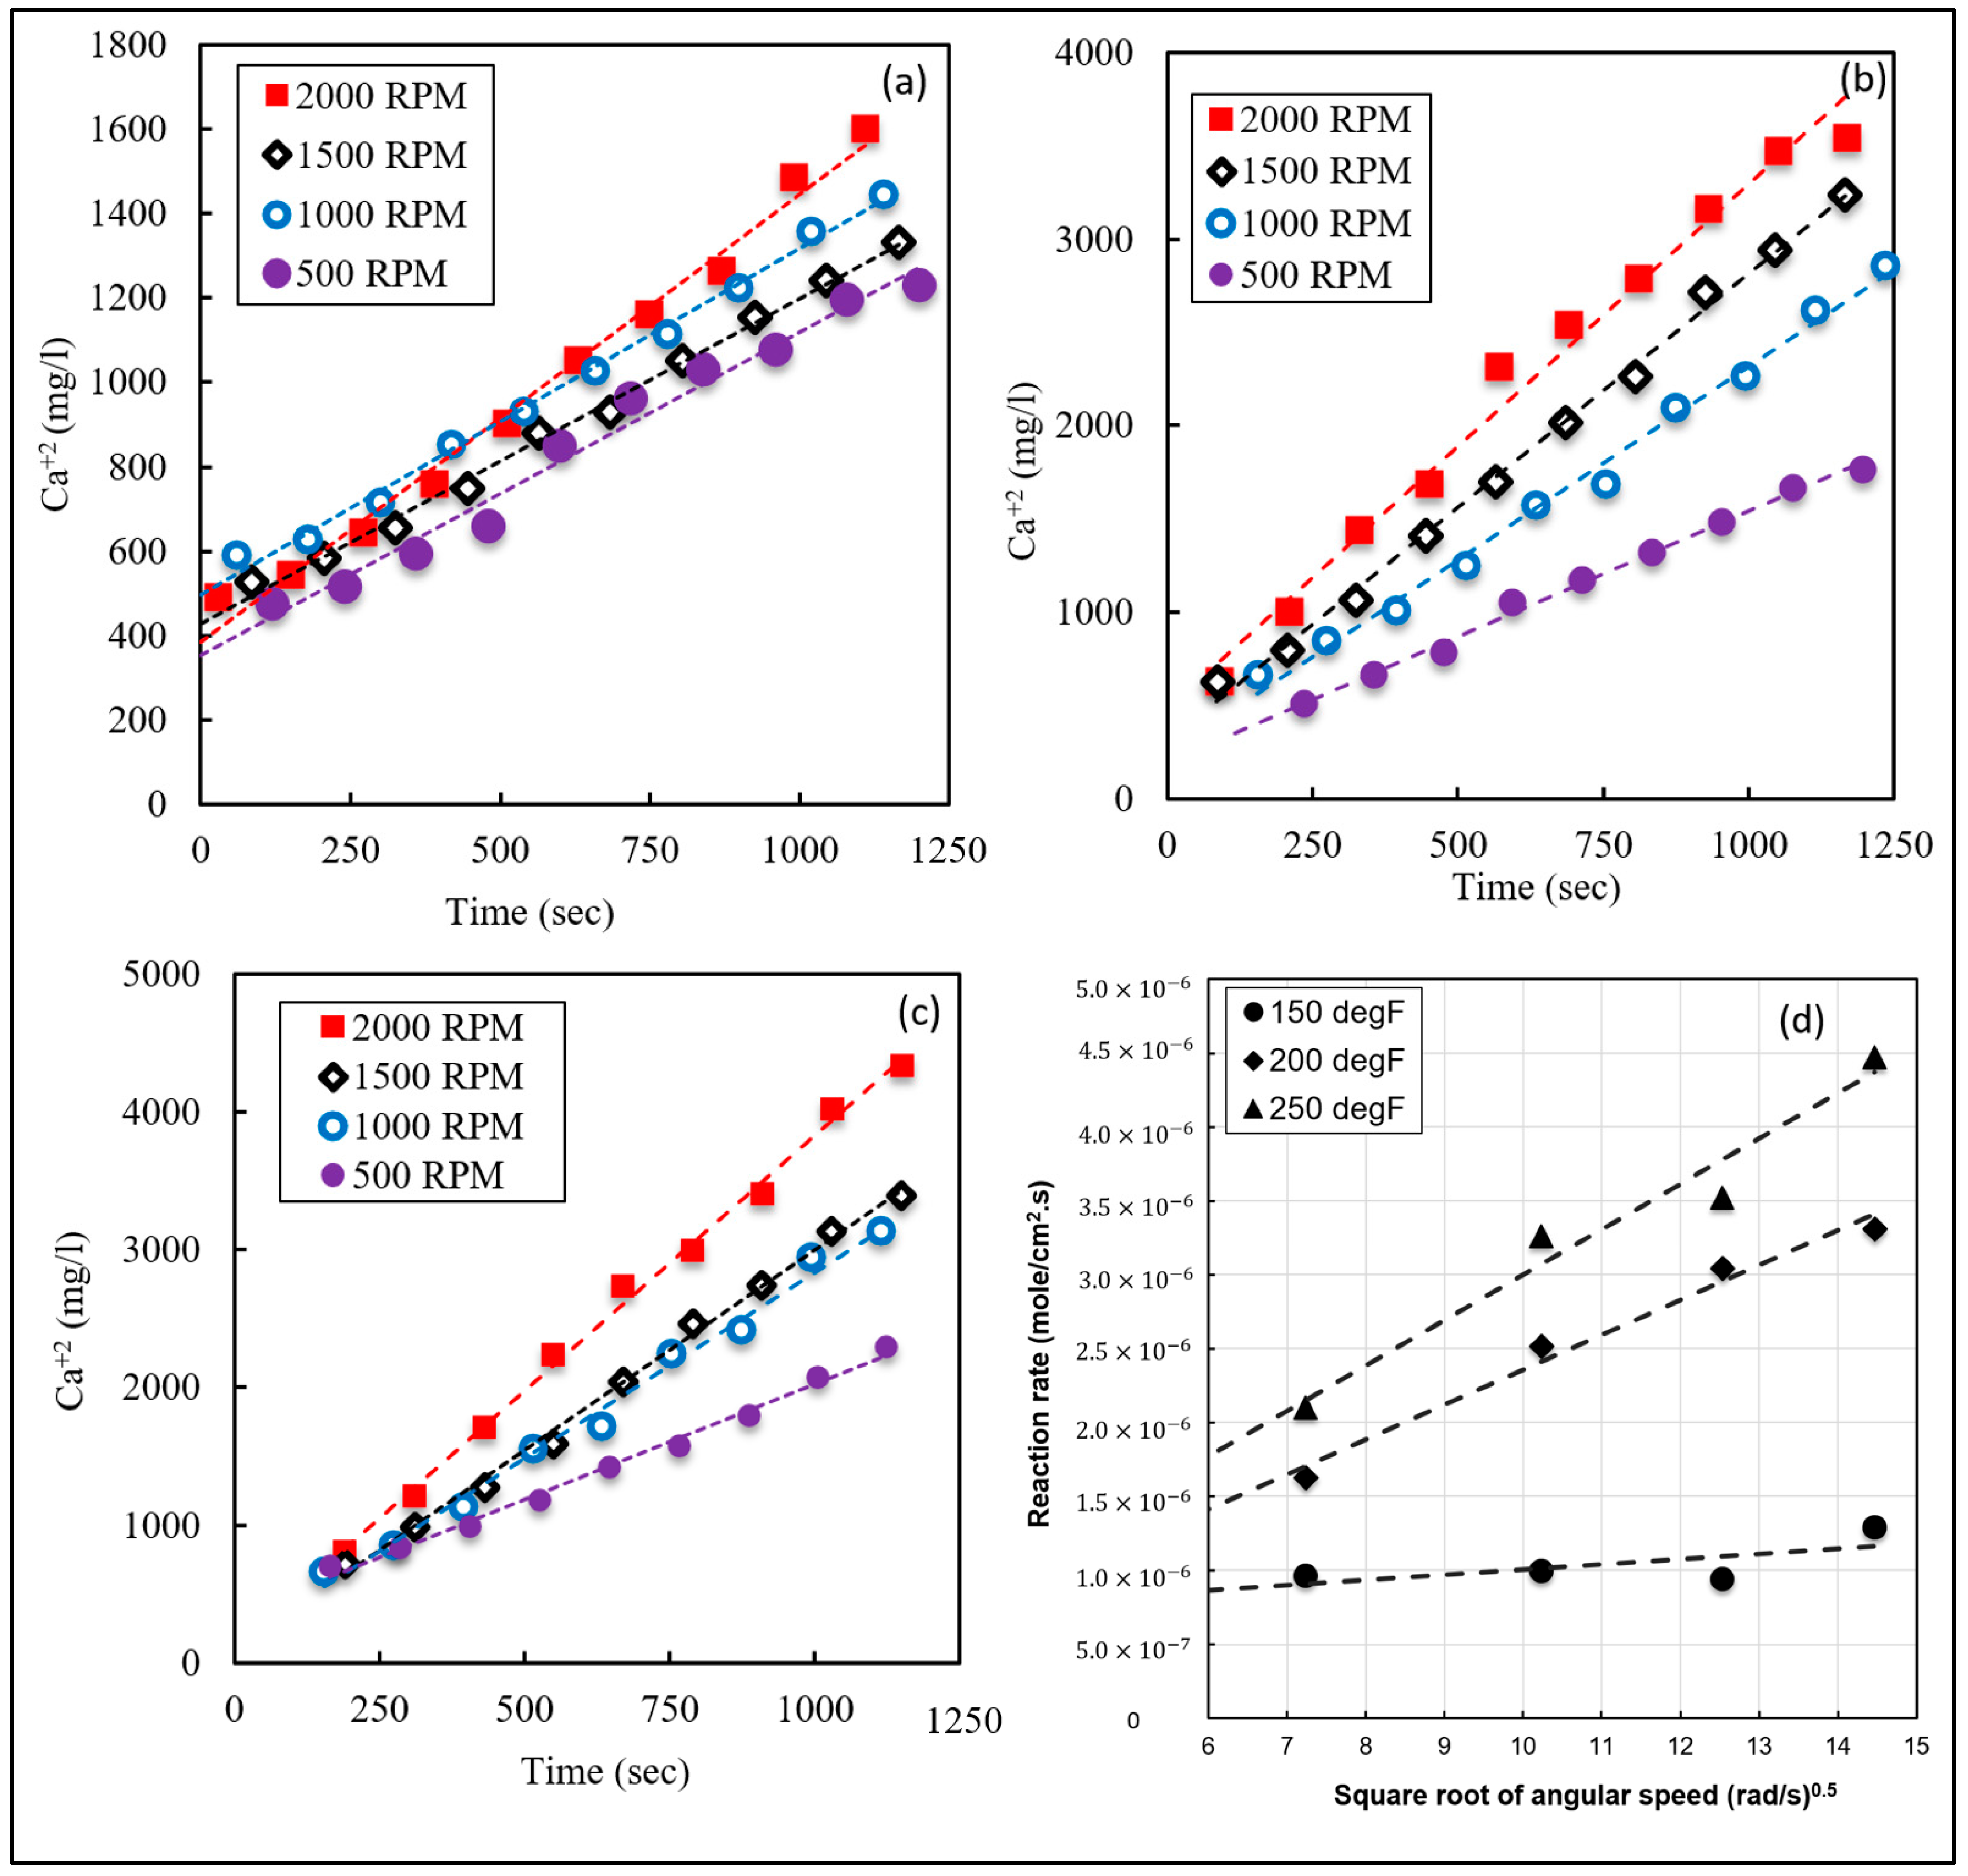
6.2. Austin Chalk
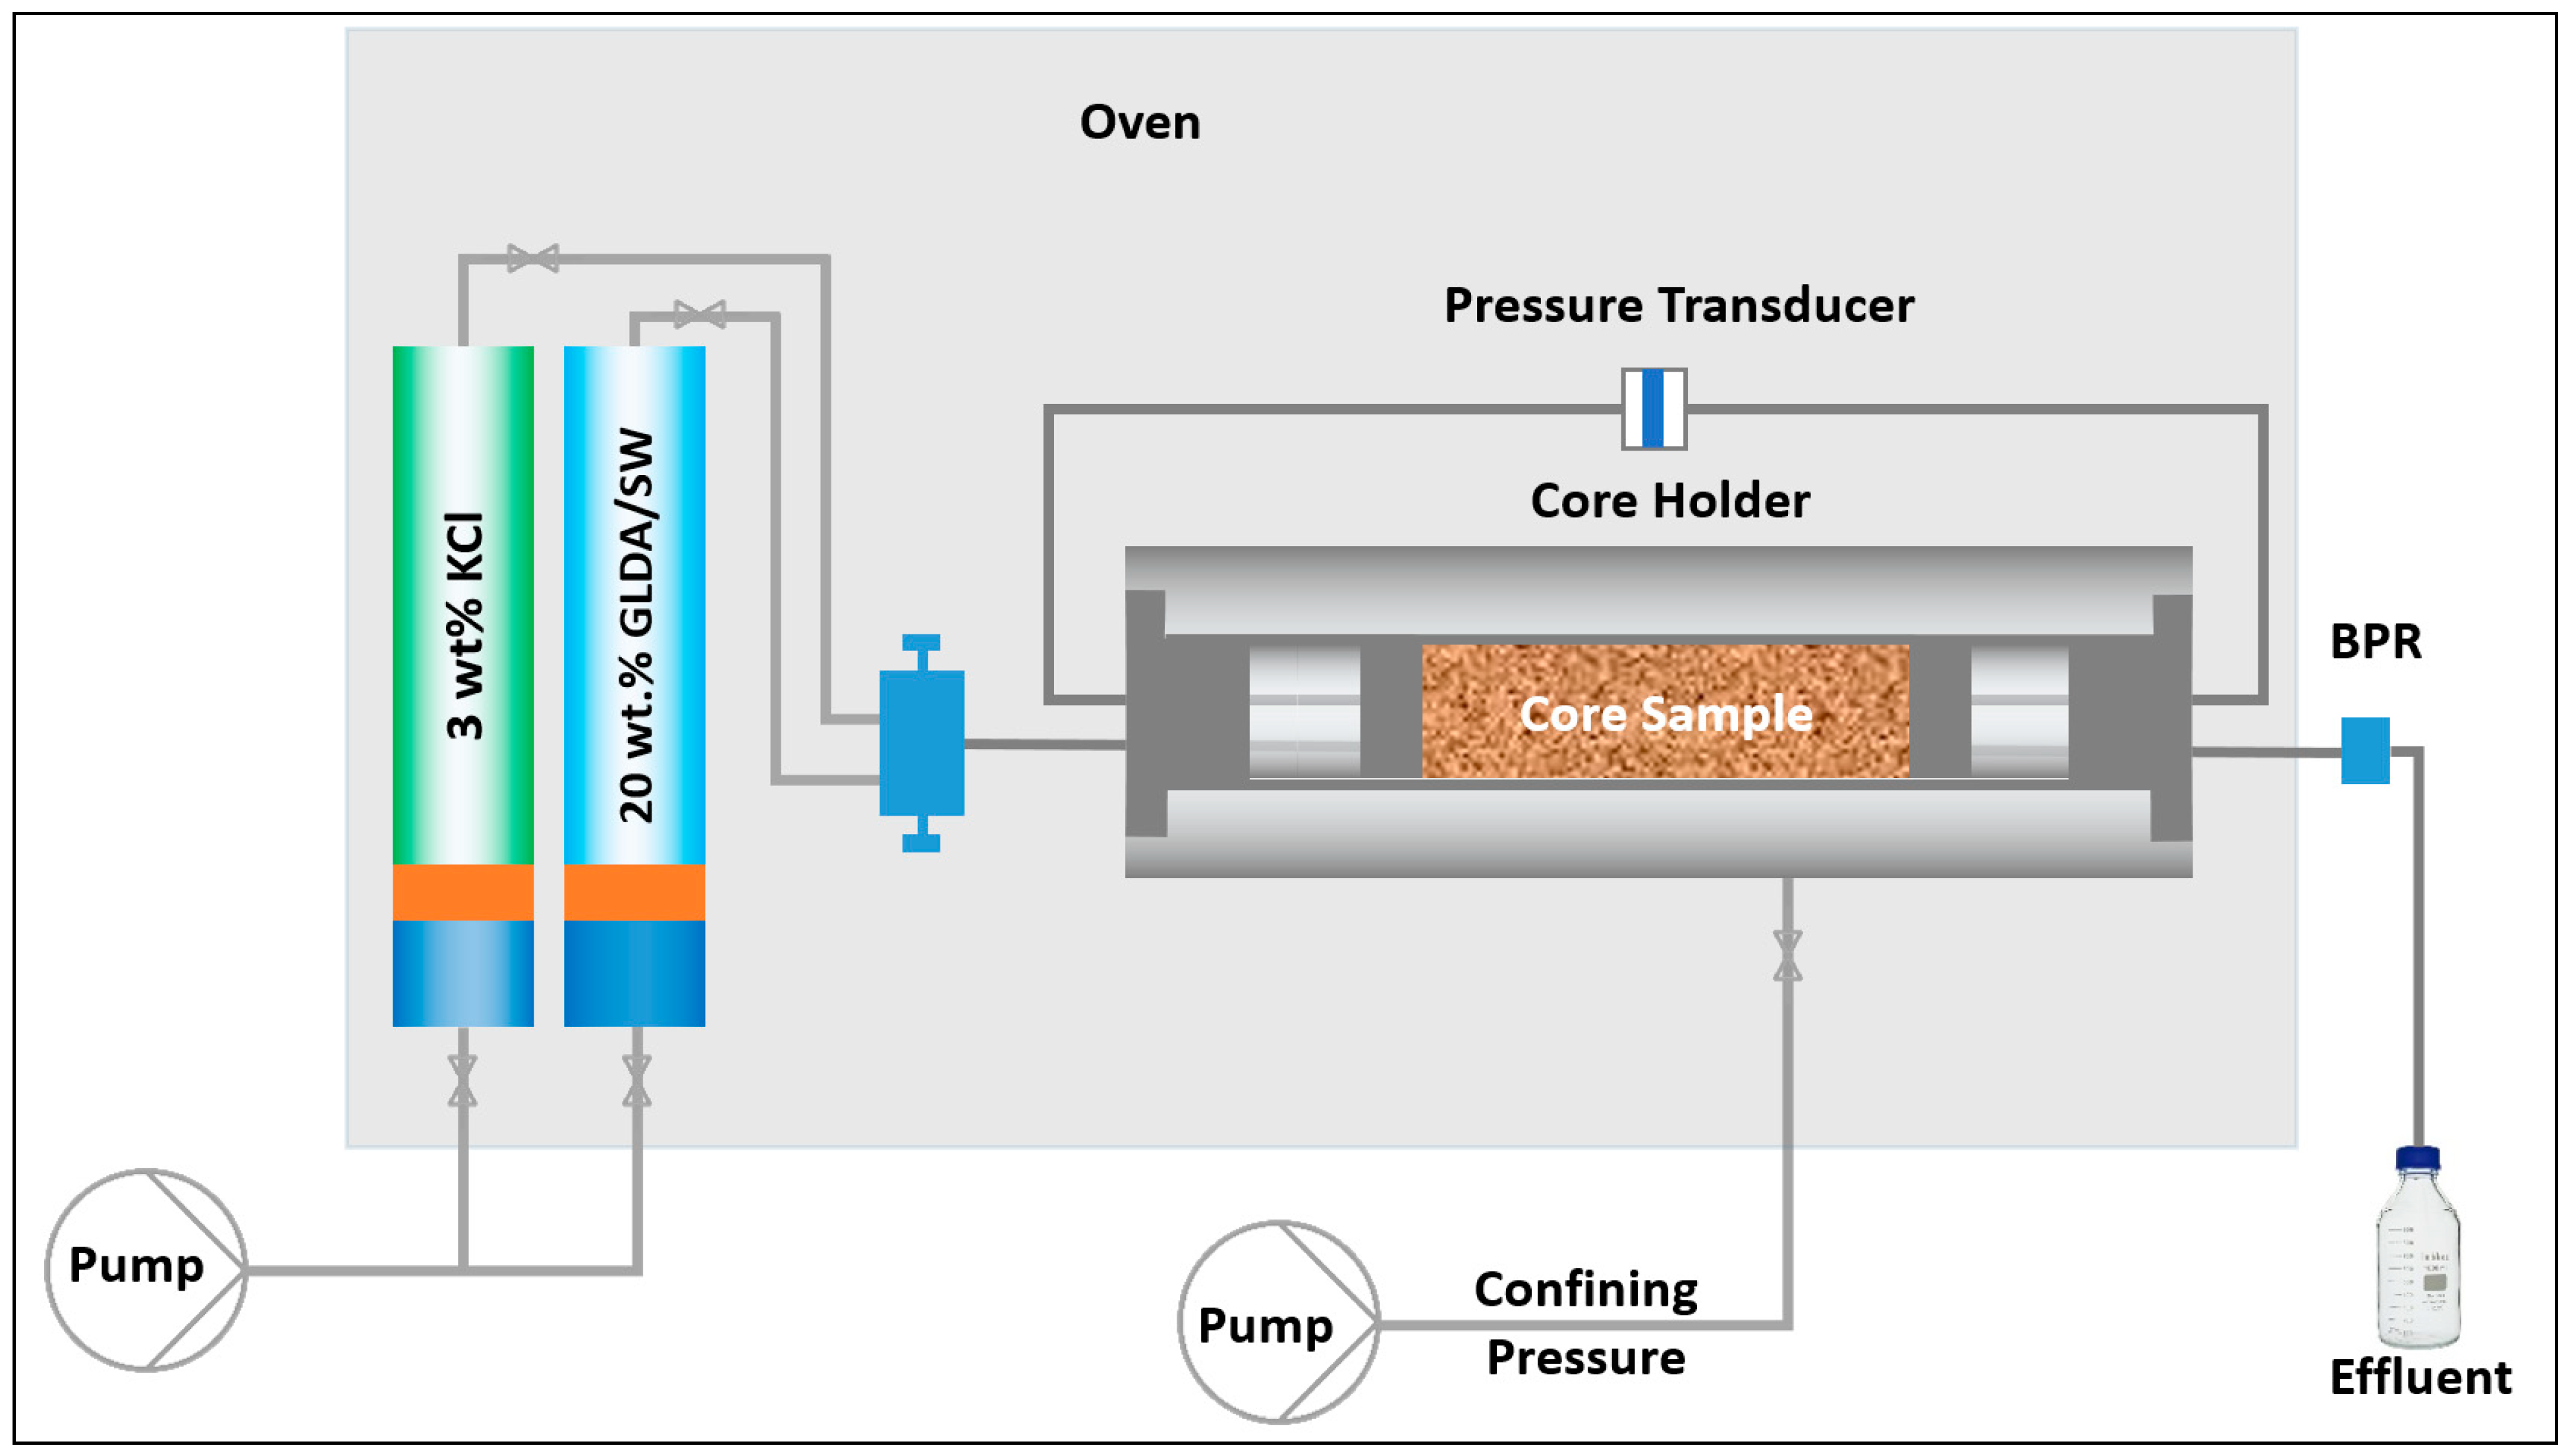
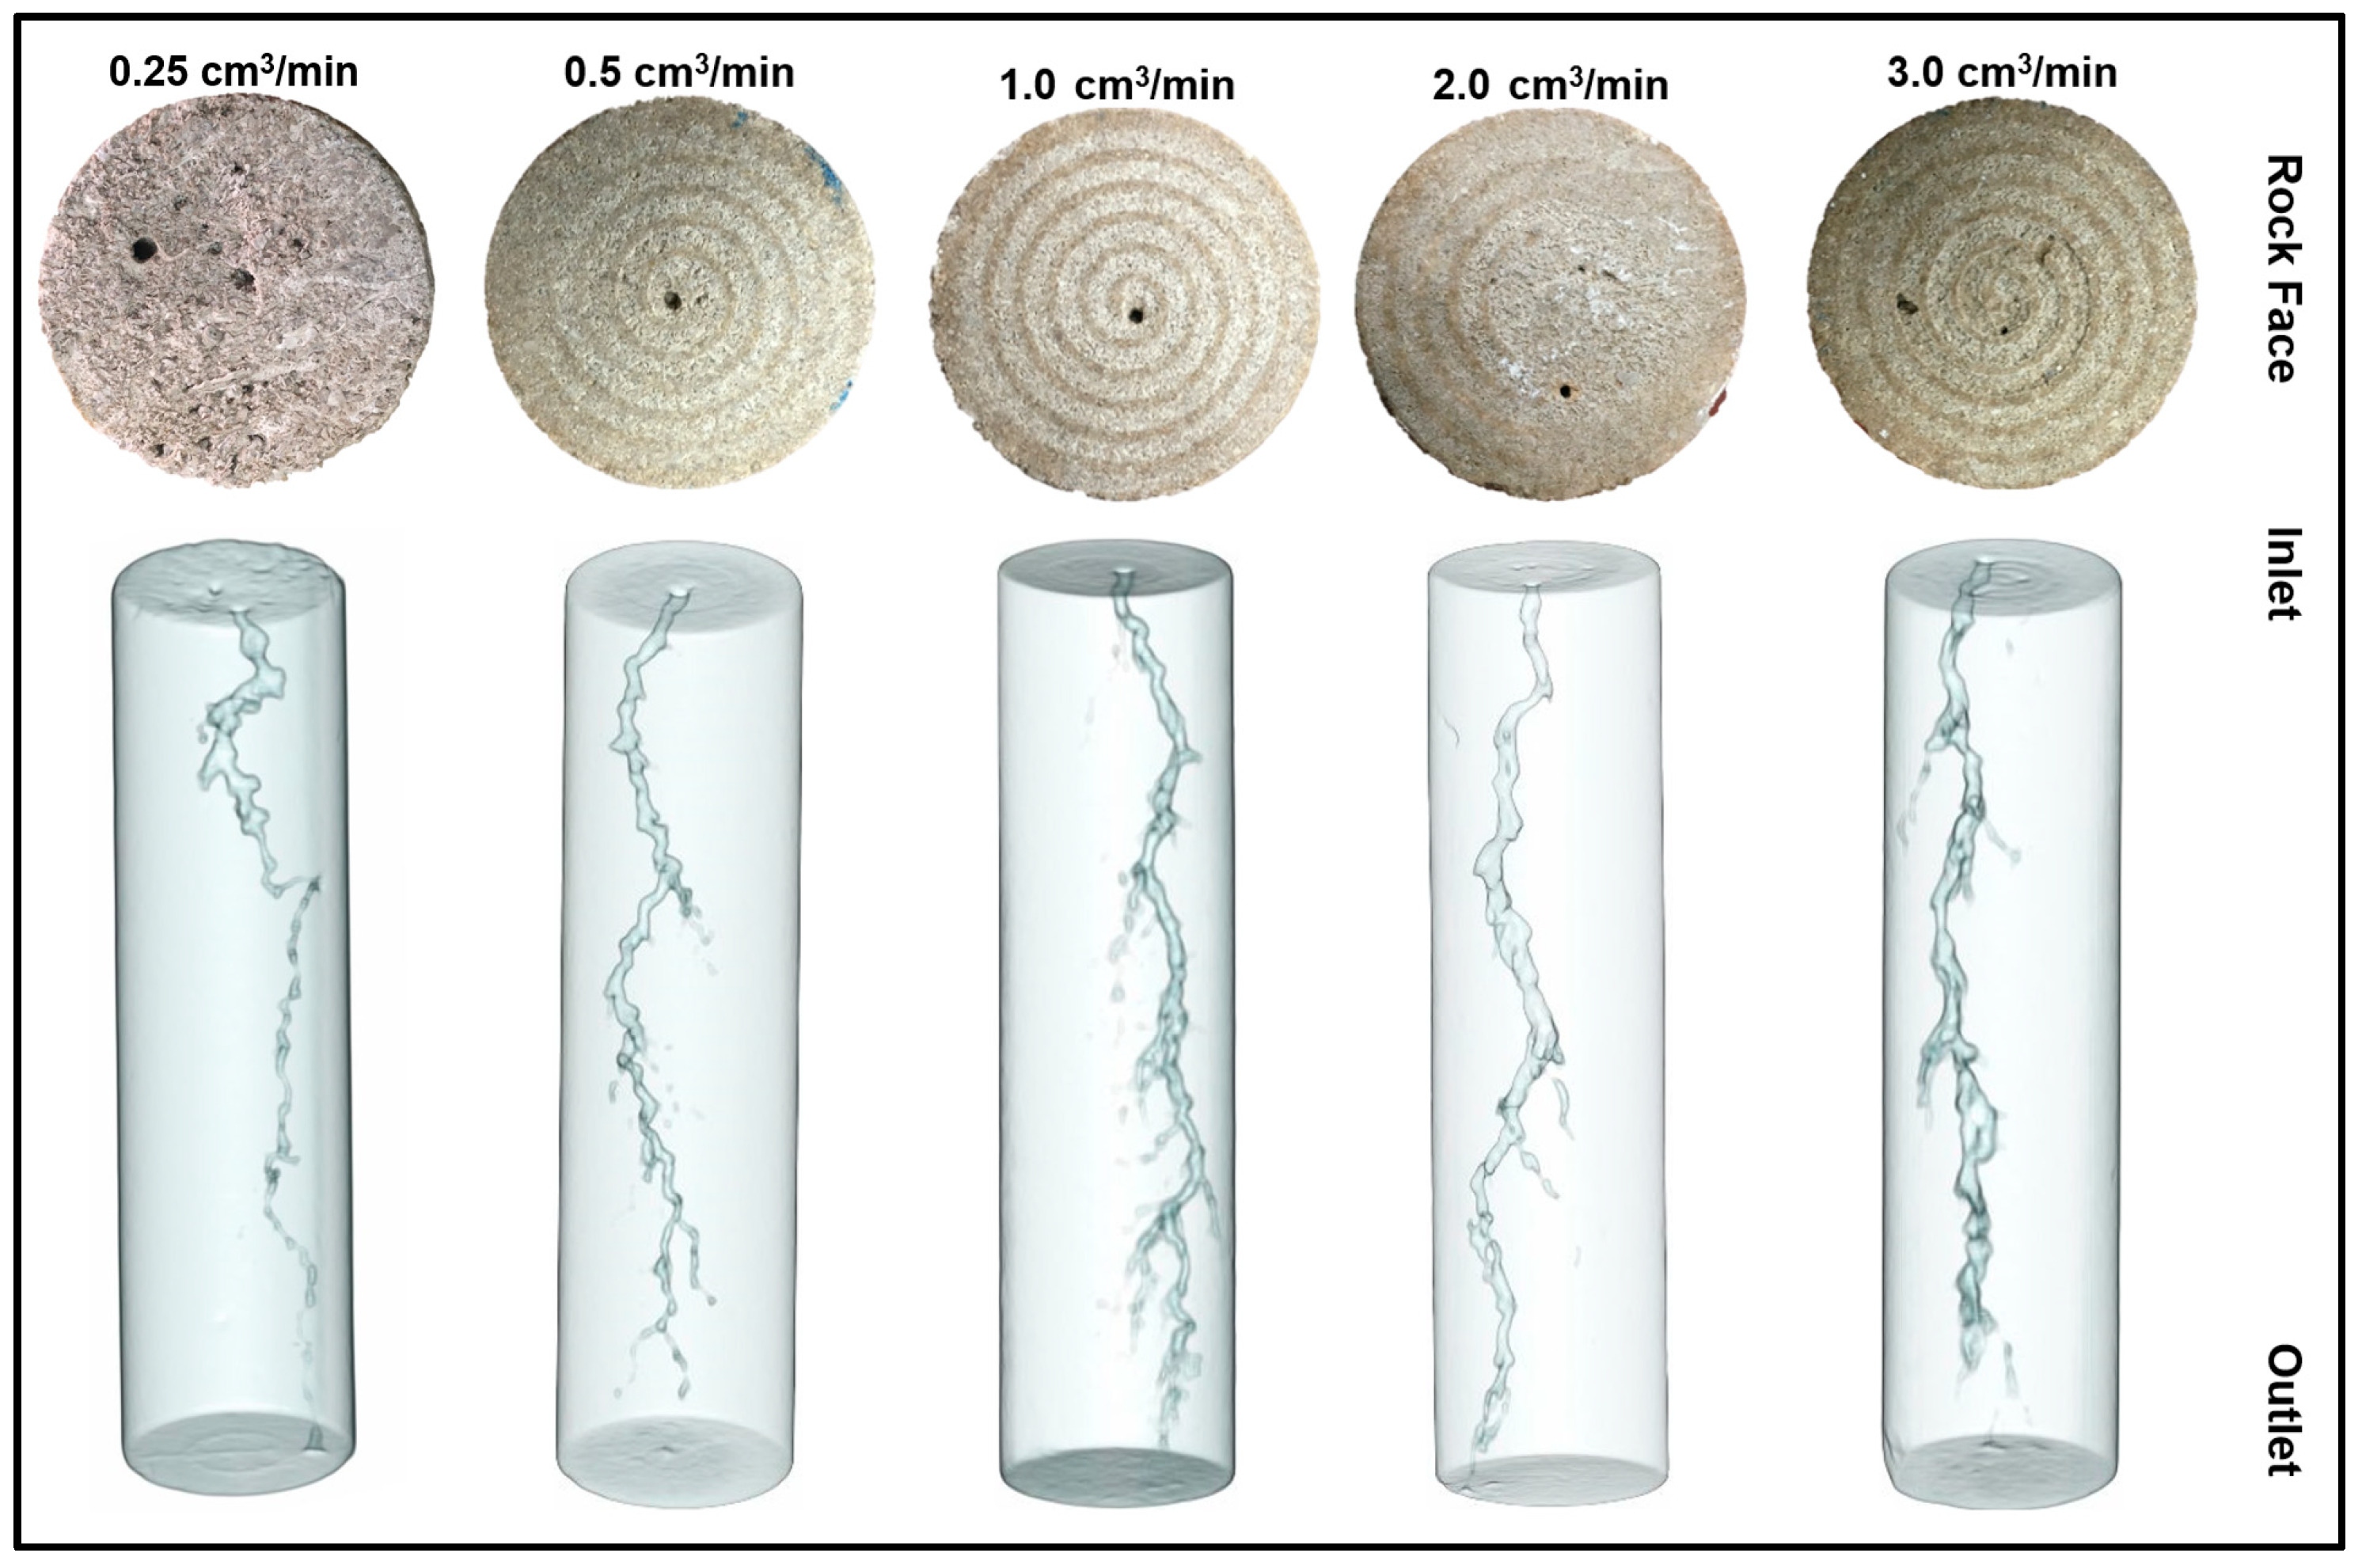
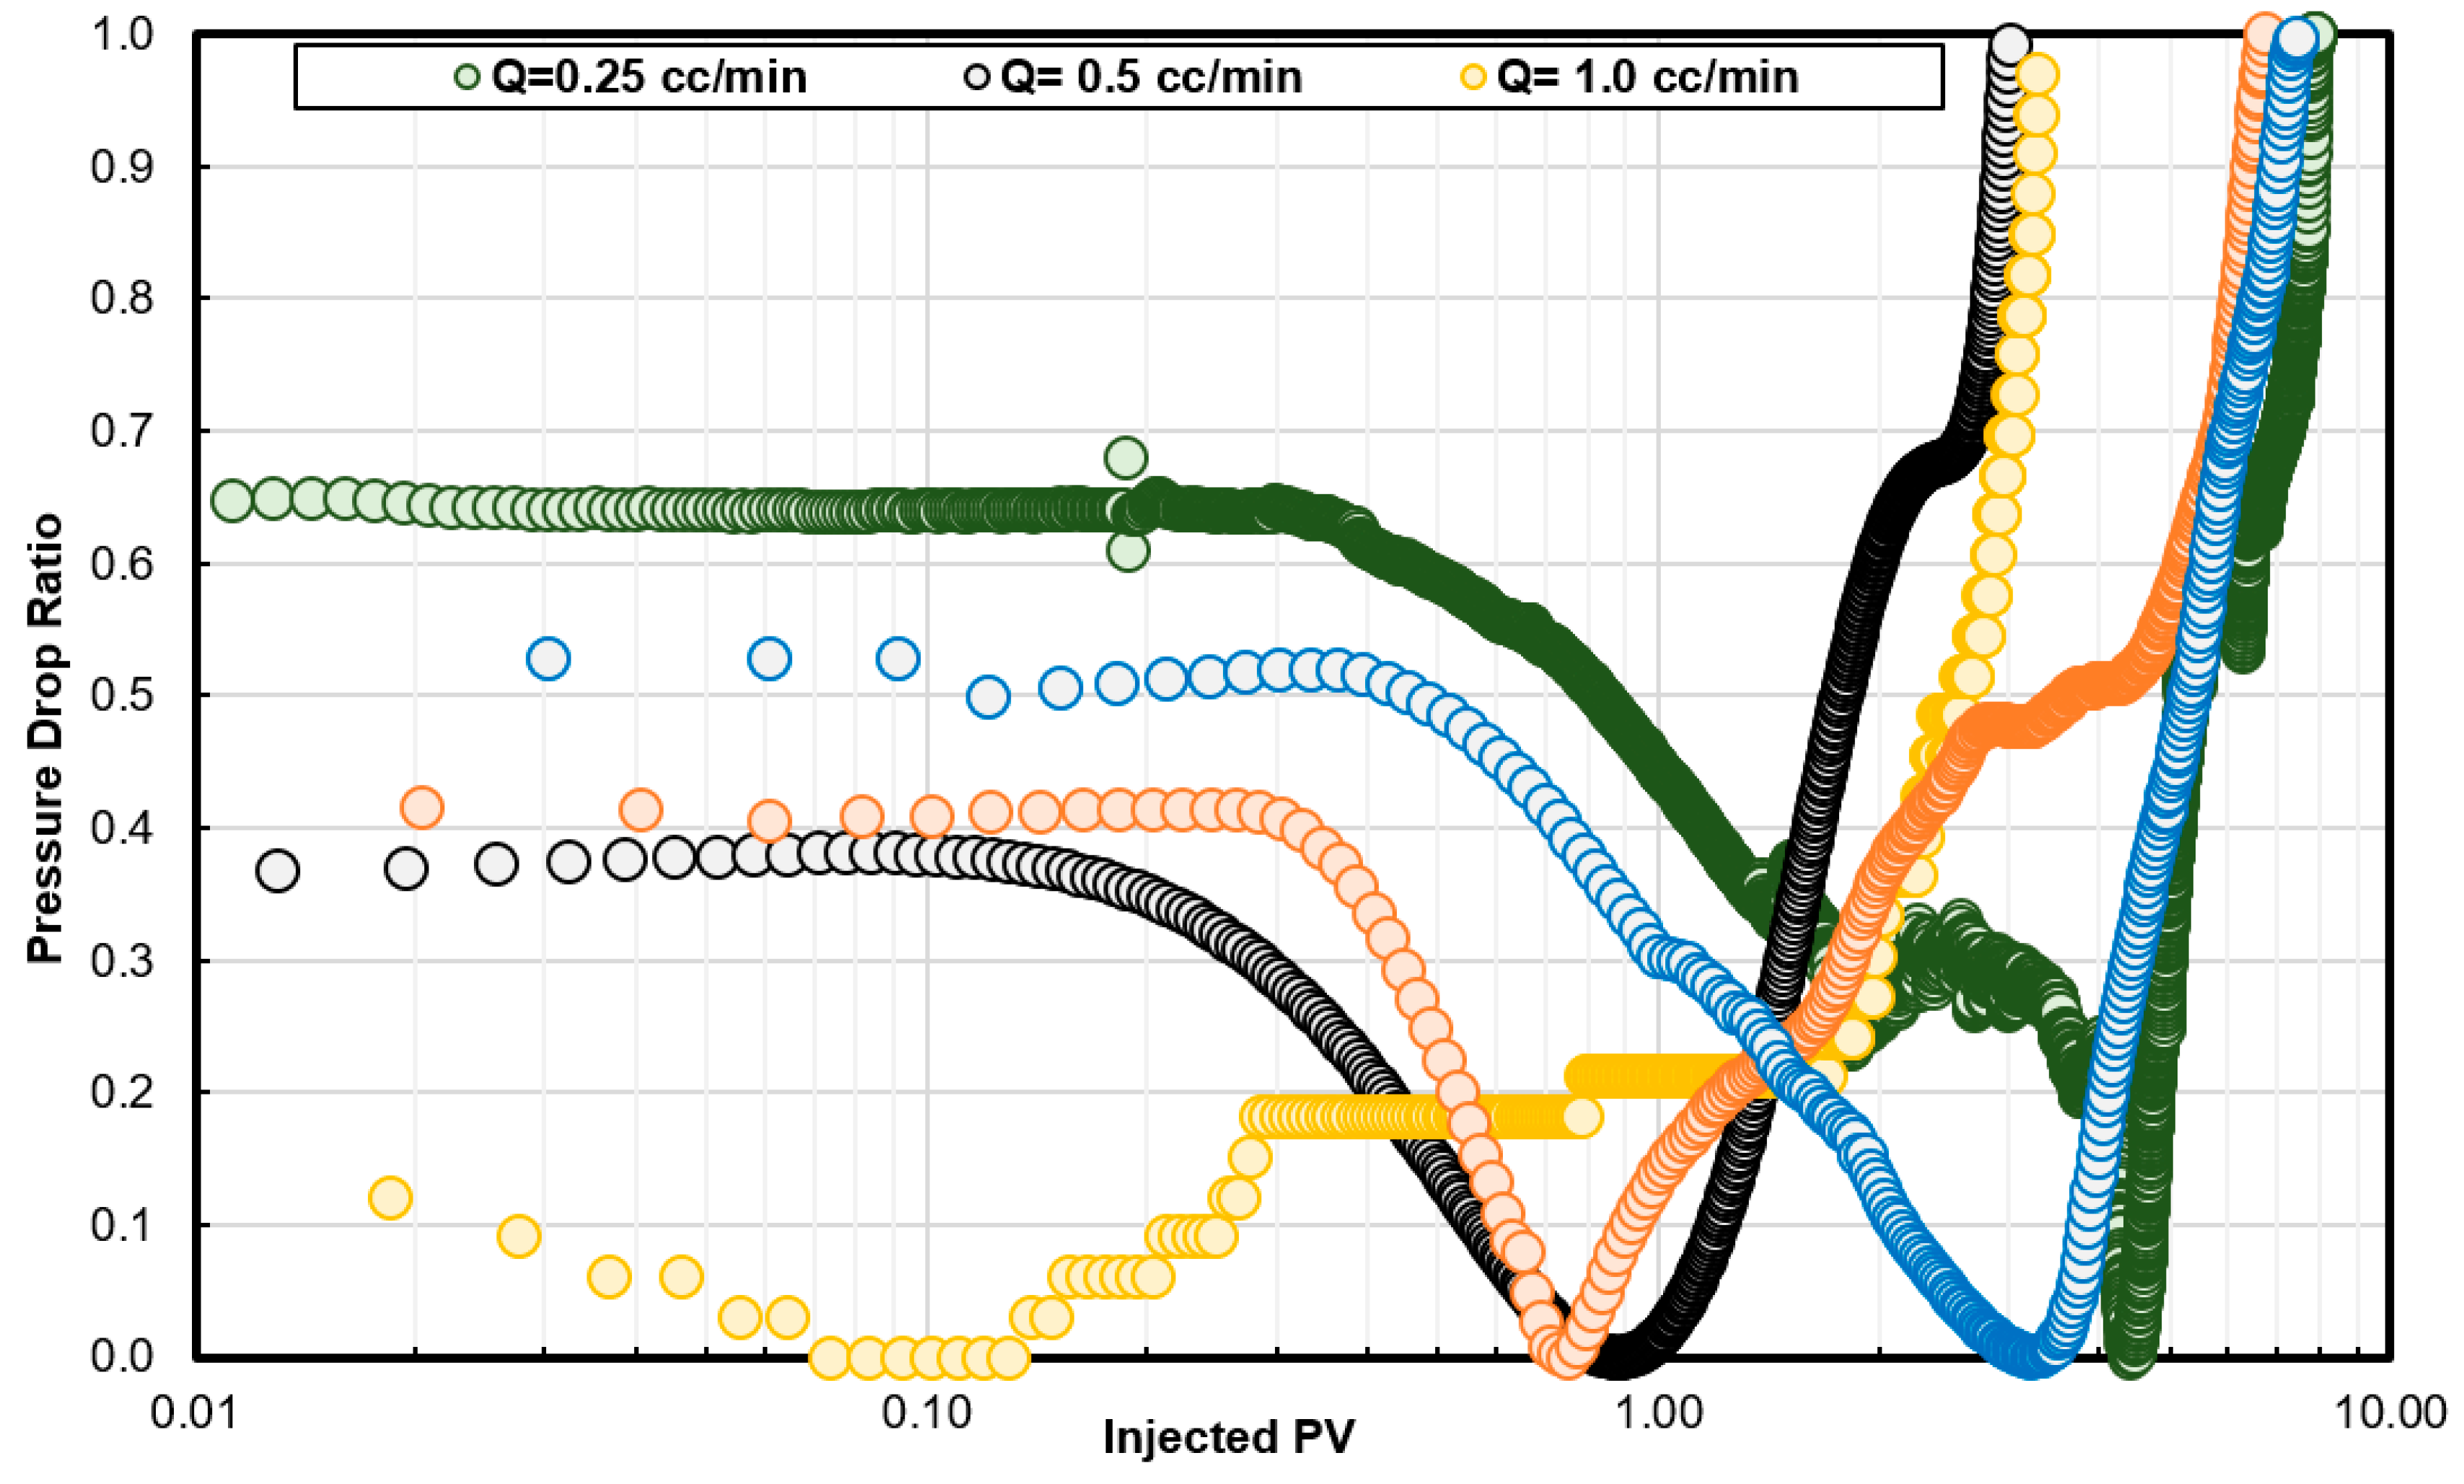
6.3. Coreflooding Experiments
7. Conclusions
- -
- Rock facies (porosity type) as well as rock strength highly affected the reaction kinetics of GLDA with calcite. This means that the kinetics for each reservoir rock should be investigated with the stimulation fluid. The two tested rocks in this study (Indiana limestone and Austin chalk) are almost 100% calcite but they behaved differently at the same conditions of reaction experiments.
- -
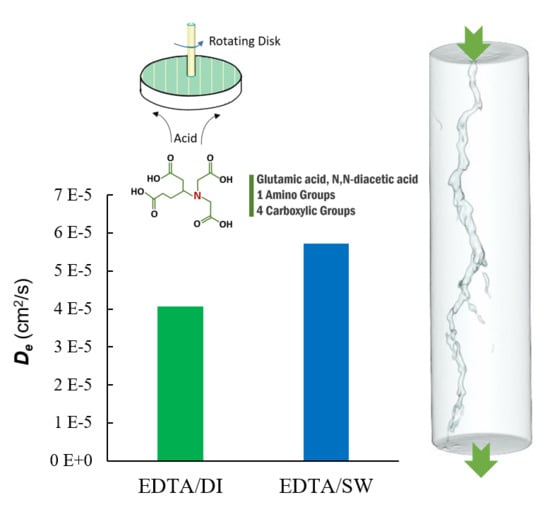
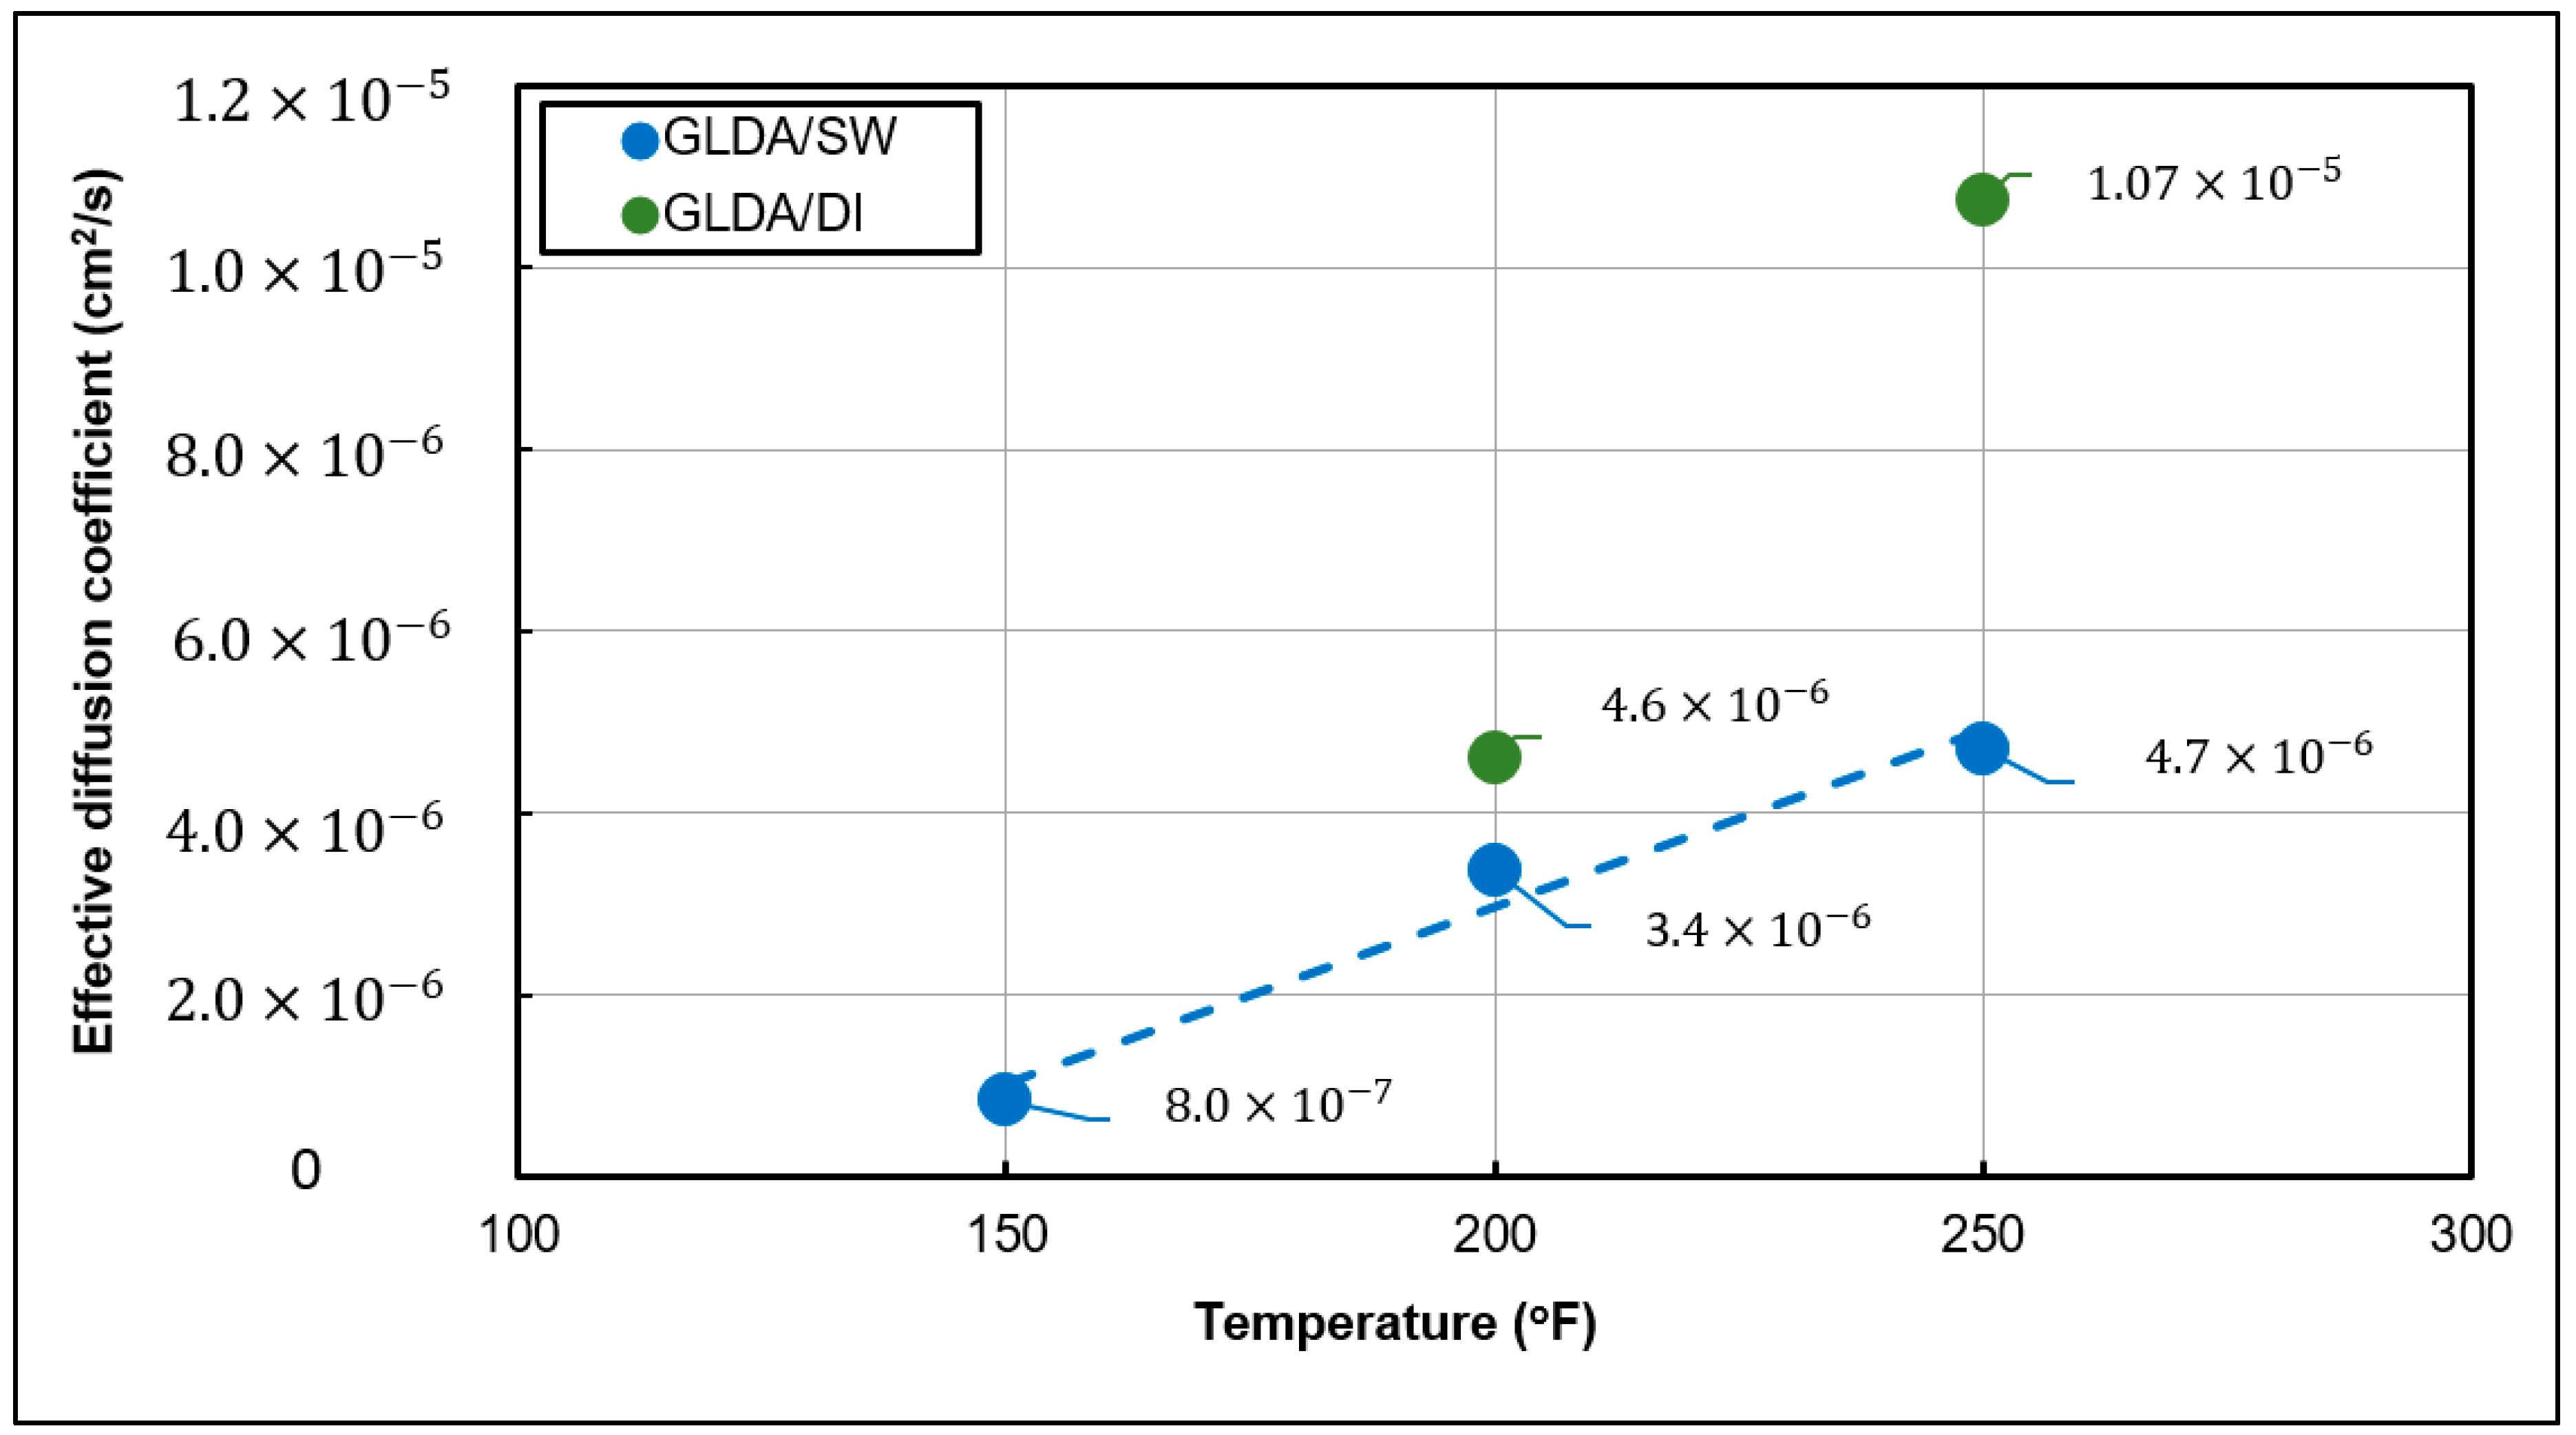
- Using seawater to prepare GLDA did not affect the reaction regime at 200 and 250 °F. The reaction regime is limited by mass transfer for both seawater and deionized water based GLDA.
- -
- The salt content in seawater retarded the reaction when seawater was used as a base for GLDA. The effect was minor at 200 °F and it was prominent at 250 °F. At 250 °F, the GLDA/seawater diffusion coefficient is 50% that in the case of GLDA/deionized water. This is considered as a positive point in the case of GLDA/seawater because it will achieve deep acid penetration due to the retardation effect of the salt in the seawater.
- -
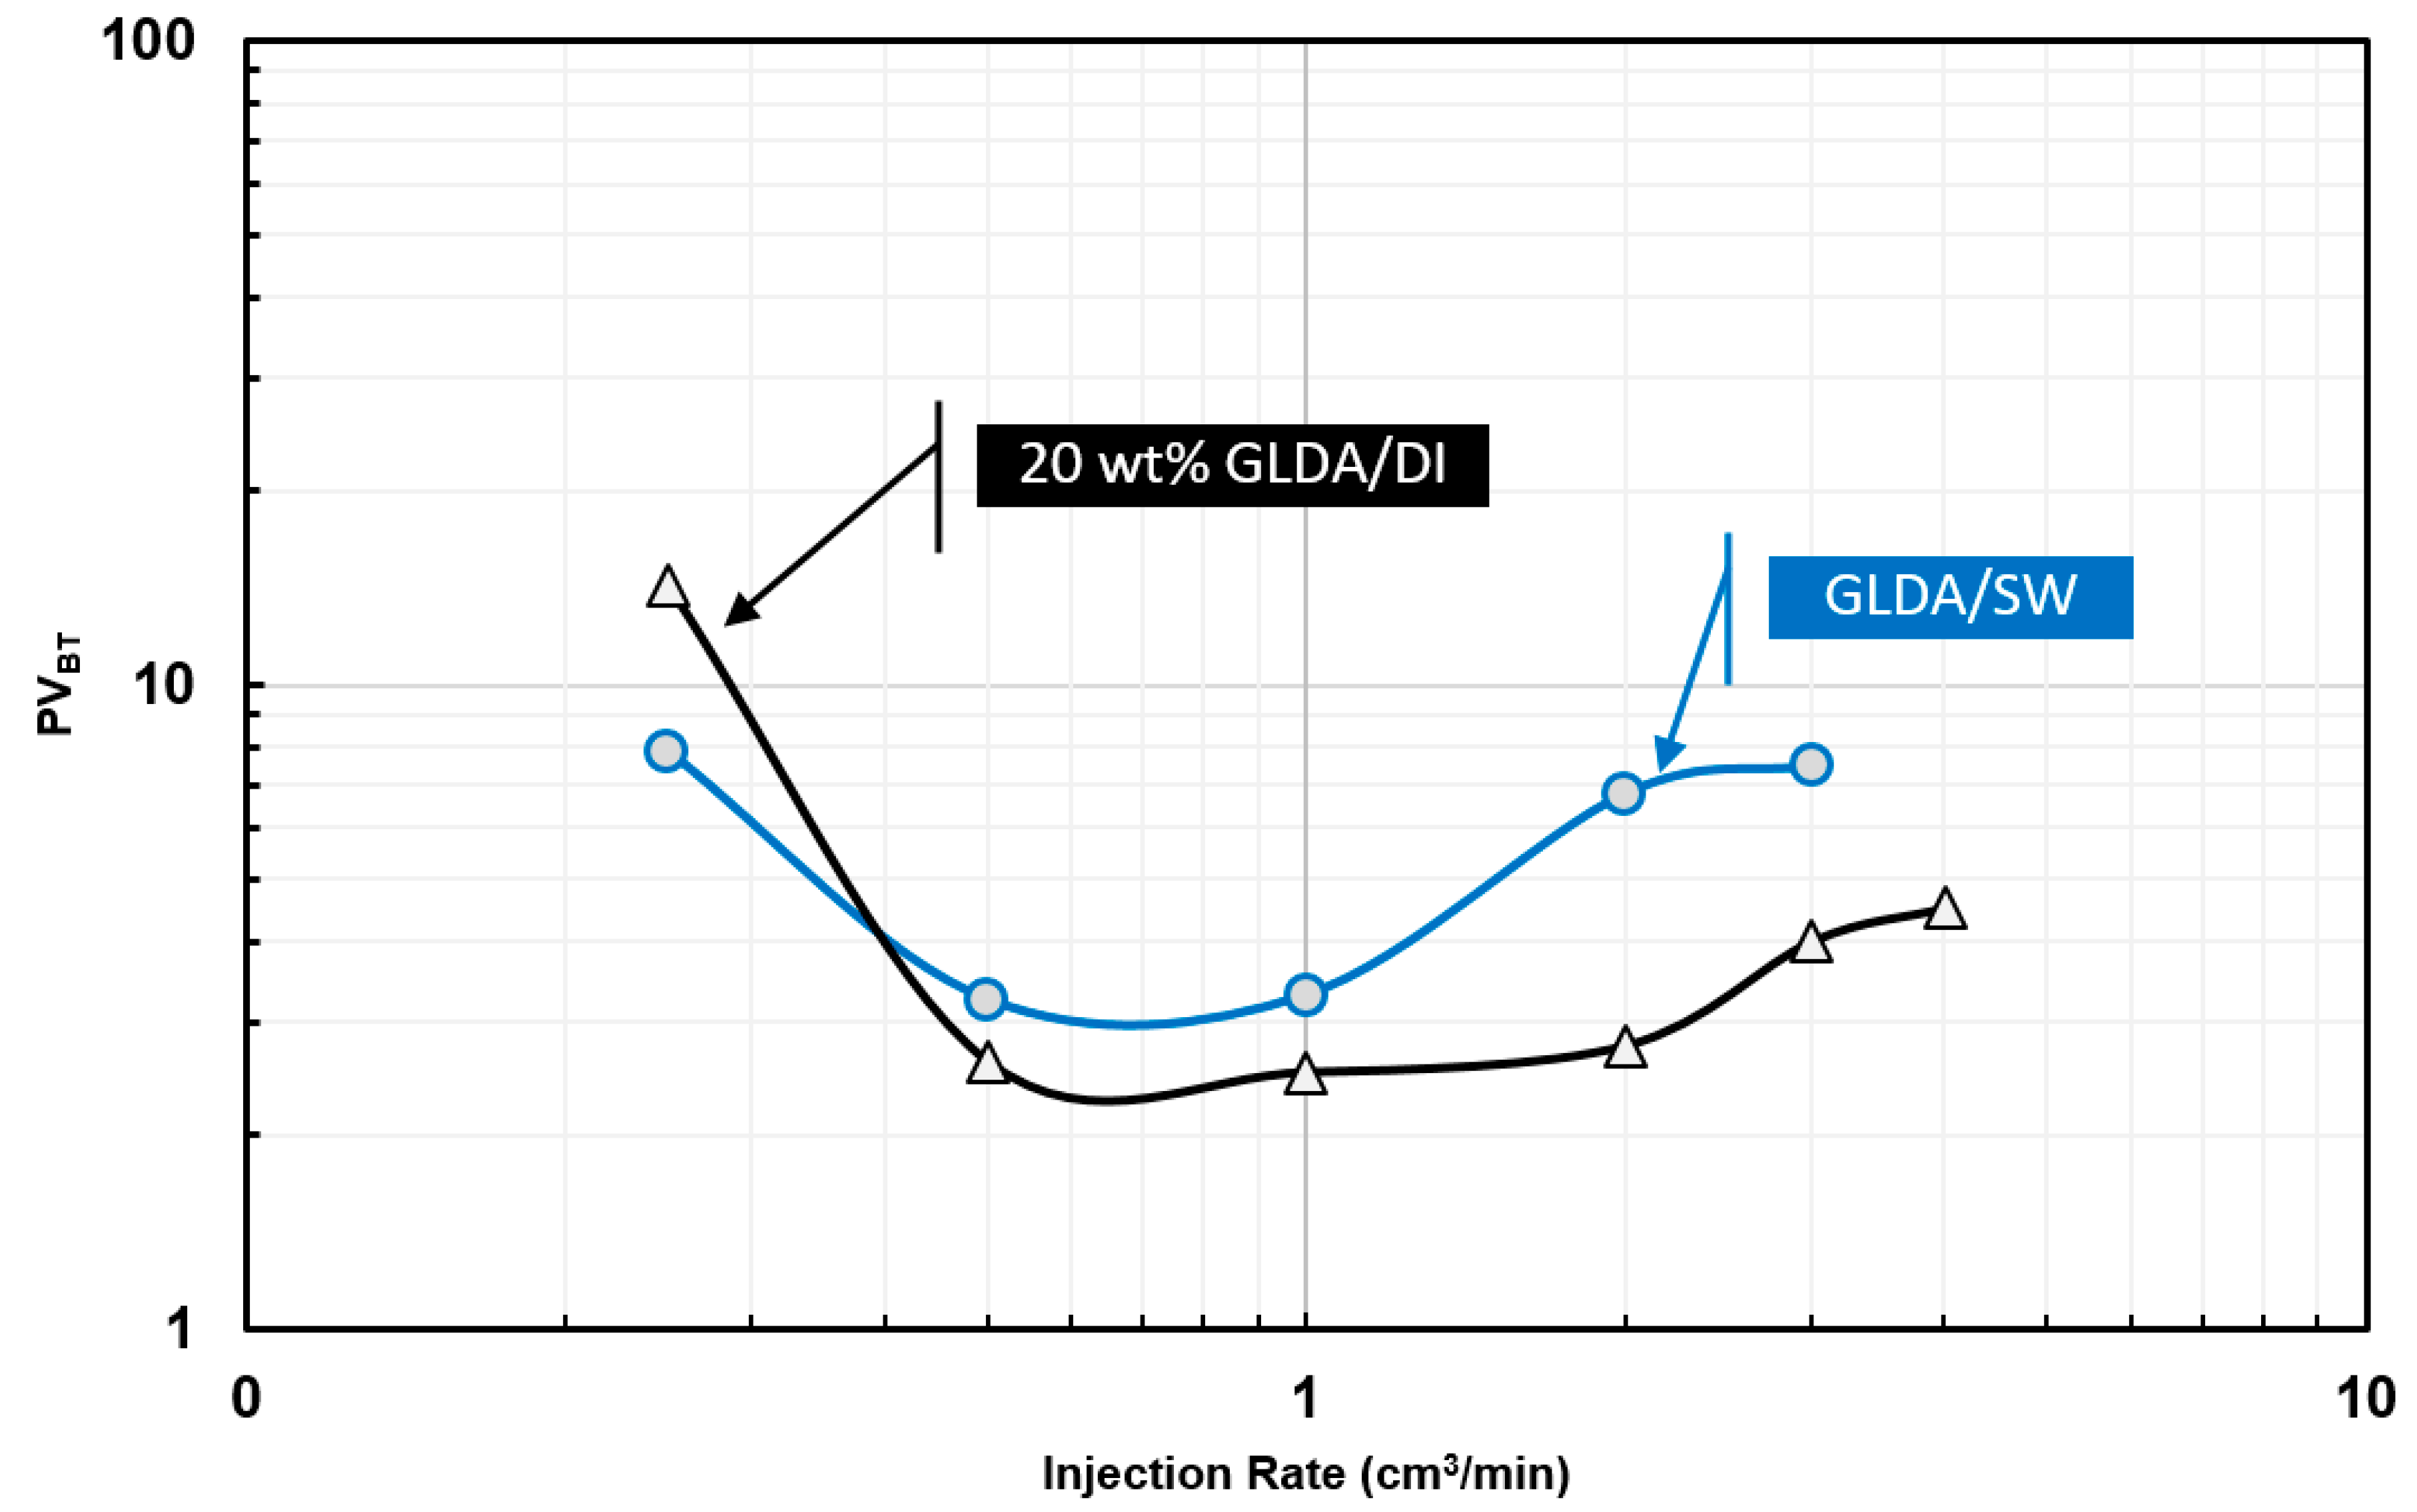
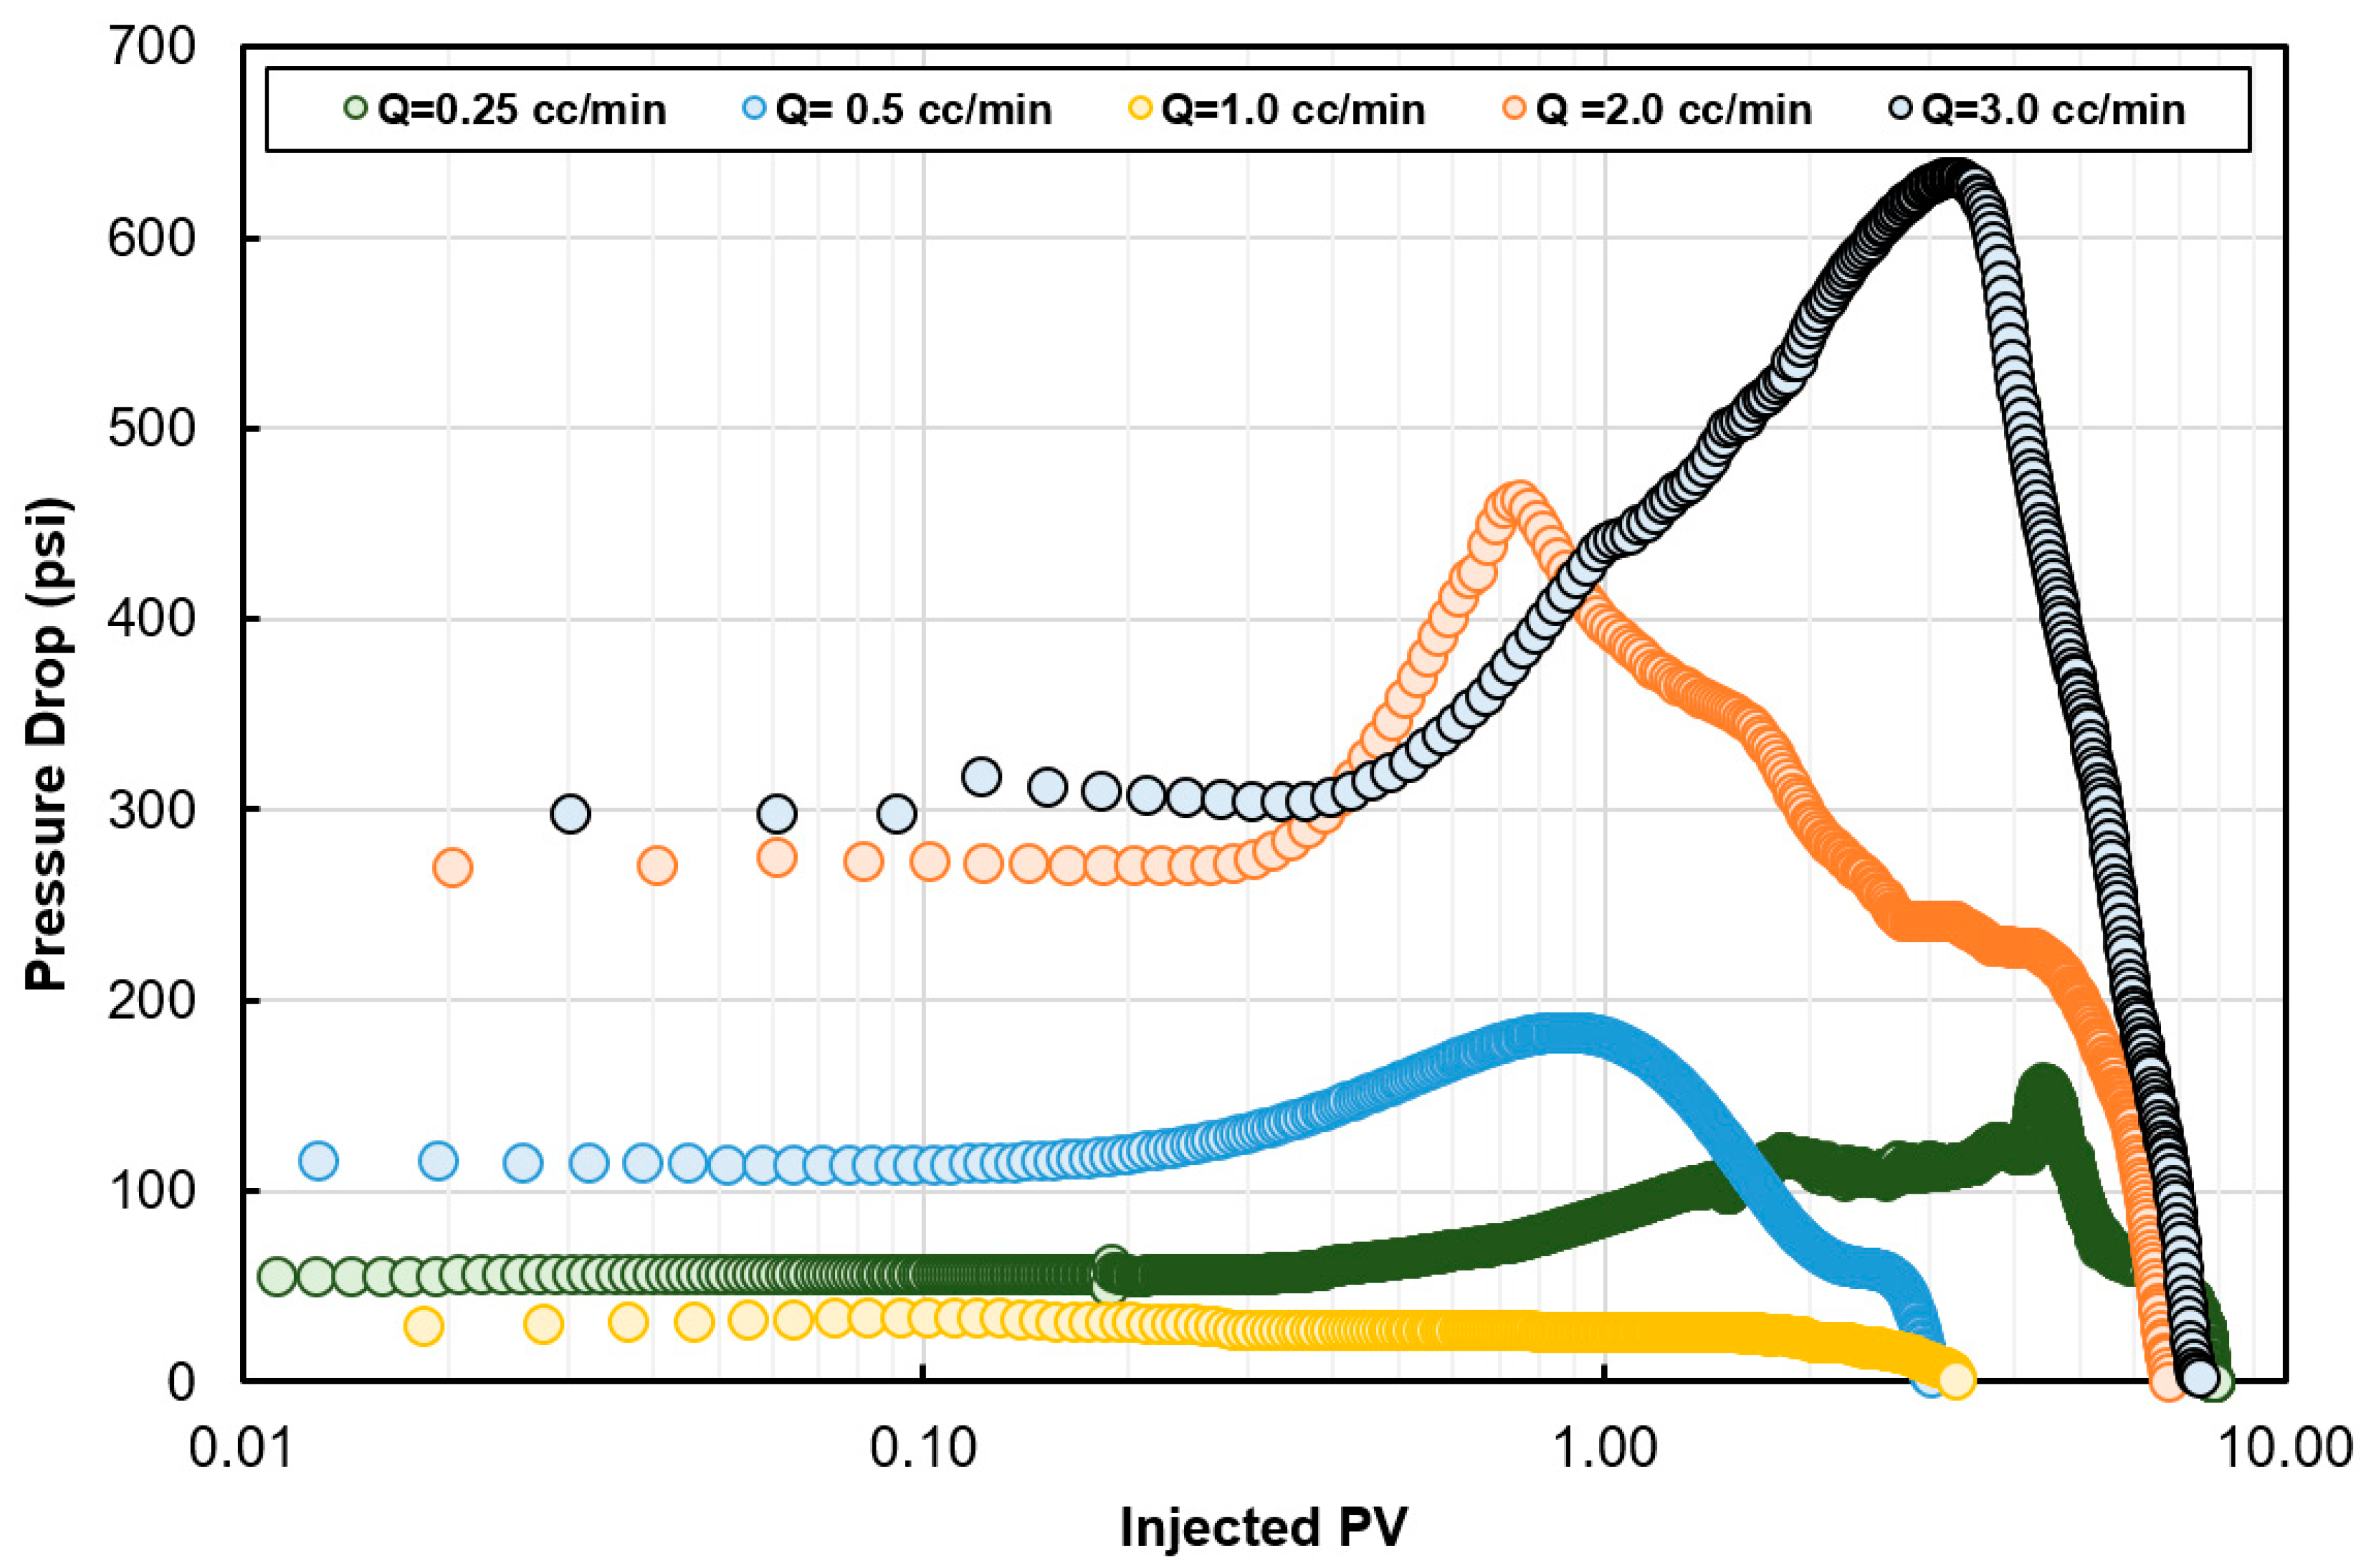
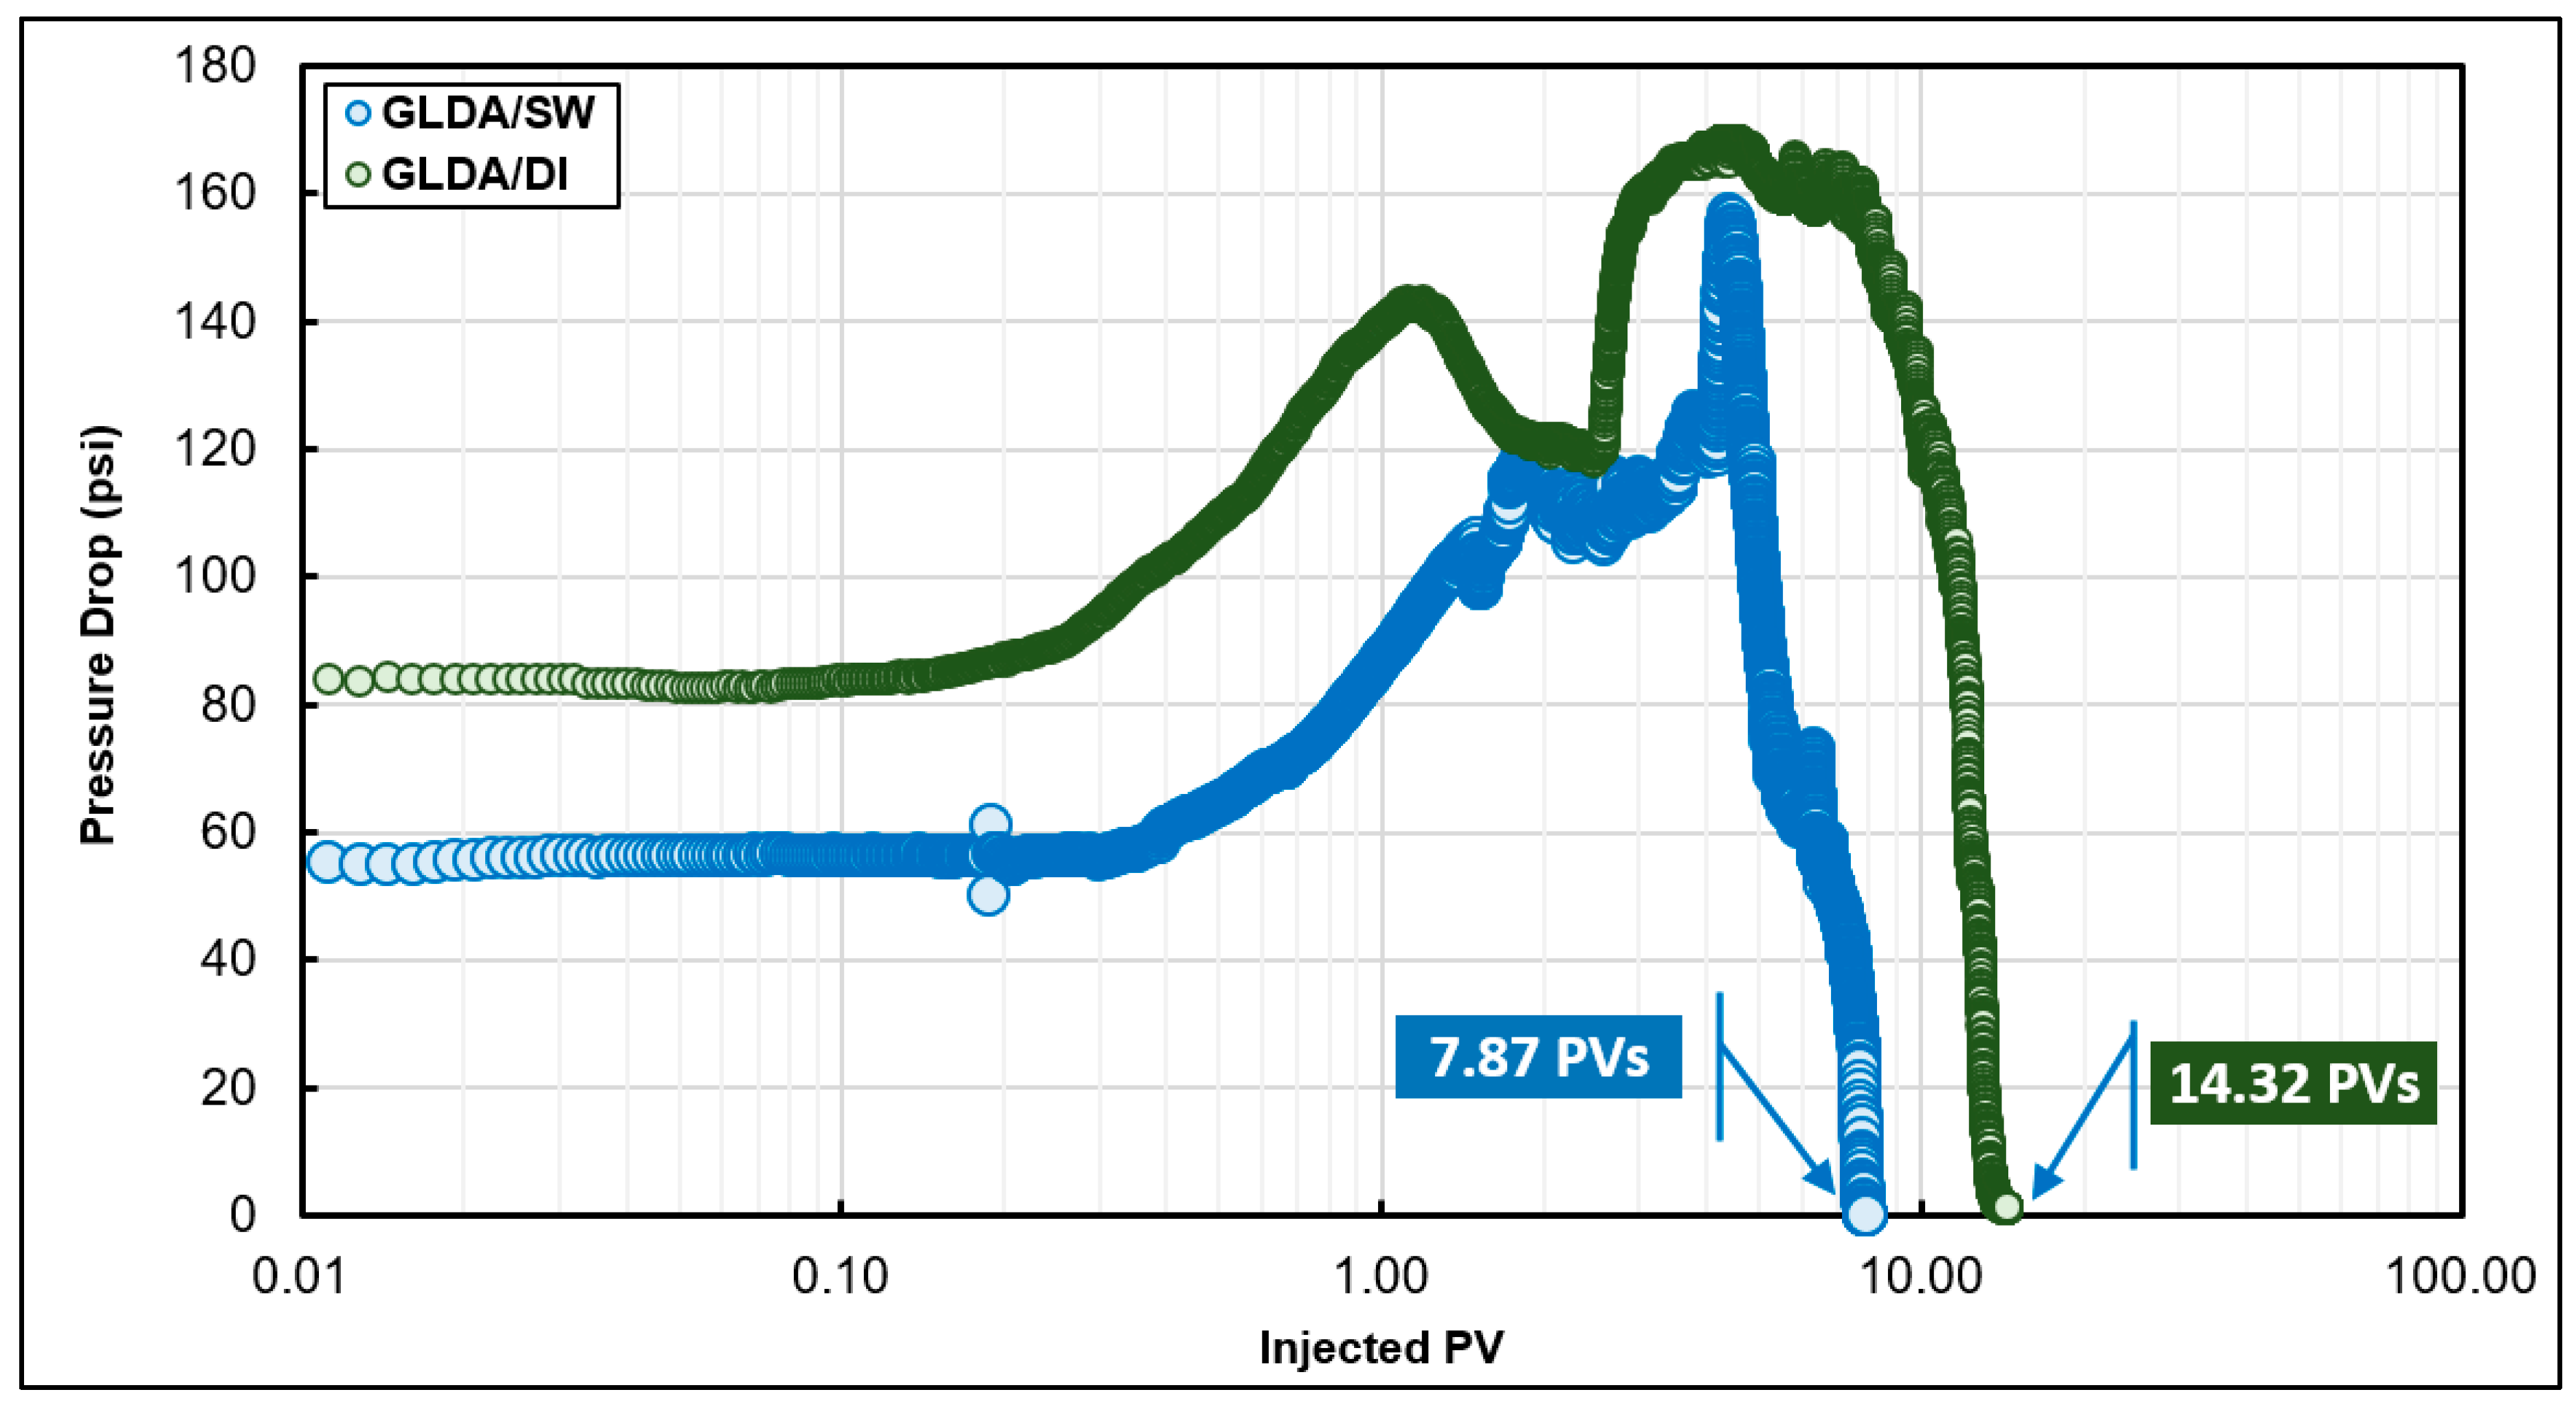
- A new approach based on dimensionless pore volume to breakthrough, dimensionless time to breakthrough, and the pressure drop ratio was introduced to determine the optimum injection rate in the case of GLDA/seawater stimulation fluid. Unlike HCl and other stimulation fluid, GLDA does not have a sharp optimum injection rate. GLDA has a range for optimum injection rate and the best one can be determined based on the new approach introduced in this study.
- -
- This study reveals that the rotating disk reaction experiments can be used instead of coreflooding experiments to predict the optimum injection rate in the case of stimulation fluids of mass transfer limited reaction regime.
- -
- To include the effect of damage length or core length during the coreflooding experiments, more coreflooding experiments are required while a single diffusion coefficient can be used to define the optimum injection rate as a function of core length, which makes the rotating disk approach more convenient in most of the cases. For example, the optimum injection rate predicted from coreflooding was 0.5 cm3/min and that from the rotating disk experiments was 0.43 cm3/min.
Author Contributions
Funding
Acknowledgments
Conflicts of Interest
References
- Williams, B.; Gidley, J.; Schechter, R. Acidizing Fundamentals; SPE Monograph Series; Henry L. Doherty Memorial Fund of AIME, Society of Petroleum Engineers of AIME: Richardson, TX, USA, 1979. [Google Scholar]
- Daccord, G. Chemical dissolution of a porous medium by a reactive fluid. Phys. Rev. Lett. 1987, 58, 479–482. [Google Scholar] [CrossRef] [PubMed]
- Hoefner, M.L.; Fogler, H.S. Pore evolution and channel formation during flow and reaction in porous media. AIChE J. 1988, 34, 45–54. [Google Scholar] [CrossRef]
- Wang, Y.; Hill, A.D.; Schechter, R.S. The Optimum Injection Rate for Matrix Acidizing of Carbonate Formations. In Proceedings of the SPE Annual Technical Conference and Exhibition, Houston, TX, USA, 3–6 October 1993. [Google Scholar] [CrossRef]
- Daccord, G.; Liétard, O.; Lenormand, R. Chemical dissolution of a porous medium by a reactive fluid—II. Convection vs. reaction, behavior diagram. Chem. Eng. Sci. 1993, 48, 179–186. [Google Scholar] [CrossRef]
- Fredd, C.N.; Fogler, H.S. Influence of transport and reaction on wormhole formation in carbonate porous media. AIChE J. 1998, 44, 1933–1949. [Google Scholar] [CrossRef]
- Bazin, B. From matrix acidizing to acid fracturing: A laboratory evaluation of acid/rock interactions. SPE Prod. Facil. 2001, 16, 22–29. [Google Scholar] [CrossRef]
- Fredd, C.N.; Miller, M. Validation of carbonate matrix stimulation models. In Proceedings of the SPE International Symposium on Formation Damage Control, Lafayette, LA, USA, 23–24 February 2000. [Google Scholar] [CrossRef]
- Golfier, F.; Zarcone, C.; Bazin, B.; Lenormand, R.; Lasseux, D.; Quintard, M. On the ability of a Darcy-scale model to capture wormhole formation during the dissolution of a porous medium. J. Fluid Mech. 2002, 475, 213–254. [Google Scholar] [CrossRef]
- Glasbergen, G.; Kalia, N.; Talbot, M.S. The Optimum Injection Rate for Wormhole Propagation: Myth or Reality? In Proceedings of the 8th European Formation Damage Conference, Scheveningen, The Netherlands, 27–29 May 2009. [Google Scholar] [CrossRef]
- Maheshwari, P.; Balakotaiah, V. Comparison of Carbonate HCl Acidizing Experiments with 3D Simulations. SPE Prod. Oper. 2013, 28, 402–413. [Google Scholar] [CrossRef]
- Fredd, C.N. The Influence of Transport and Reaction on Wormhole Formation in Carbonate Porous Media: A Study of Alternative Stimulation Fluids. Ph.D. Thesis, University of Michigan, Ann Arbor, MI, USA, 1998. Available online: http://hdl.handle.net/2027.42/130957 (accessed on 15 June 2017).
- Darren, M.; Shuchart, C.; Jackson, S.; Postl, D.; Brown, J.S. Understanding Wormholes in Carbonates: Unprecedented Experimental Scale and 3D Visualization. J. Pet. Technol. 2010, 62, 78–81. [Google Scholar] [CrossRef]
- Nierode, D.E.; Williams, B.B. Characteristics of Acid Reaction in Limestone Formations. SPE J. 1971, 11, 406–418. [Google Scholar] [CrossRef]
- Mahmoud, M.; Al-Duailej, Y.; Al-Khaldi, M.; Kwak, H.; Shebatalhamd, A.; Al-Yami, I. NMR as a Characterization Tool for Wormholes. SPE Prod. Oper. 2016, 31, 362–373. [Google Scholar] [CrossRef]
- Conway, M.W.; Asadi, M.; Penny, G.S.; Chang, F. A Comparative Study of Straight/Gelled/Emulsified Hydrochloric Acid Diffusivity Coefficient Using Diaphragm Cell and Rotating Disk. In Proceedings of the SPE Annual Technical Conference and Exhibition, Houston, TX, USA, 3–6 October 1999. [Google Scholar] [CrossRef]
- Dwyer, F.P.J.; Mellor, D.P. Chelating Agents and Metal Chelates; Academic Press Inc.: New York, NY, USA, 1964. [Google Scholar] [CrossRef]
- Crabetree, M.; Eslinger, D.; Fletcher, P.; Miller, M.; Johnson, A.; King, G. Fighting scale-removal and prevention. Schlumberger Oil Field Rev. 1999, 11, 30–45. [Google Scholar]
- Tomson, M.B.; Fu, G.; Watson, M.A.; Kan, A.T. Mechanisms of Mineral Scale Inhibition. SPE Prod. Facil. 2003, 18, 192–199. [Google Scholar] [CrossRef]
- Mahmoud, M.; Abdelgawad, K.Z.; Elkatatny, S.M.; Akram, A.; Stanitzek, T. Stimulation of Seawater Injectors by GLDA (Glutamic-Di Acetic Acid). SPE Drill. Compl. 2016, 31, 178–187. [Google Scholar] [CrossRef]
- Ba-geri, B.; Mahmoud, M.; Abdulraheem, A.; Al-Mutairi, S.; Elkatatny, S.; Shawabkeh, A. Single stage filter cake removal of barite-weighted water based drilling fluid. J. Pet. Sci. Eng. 2017, 149, 476–484. [Google Scholar] [CrossRef]
- Mahmoud, M.A.; Abdelgawad, K.Z. Chelating-Agent Enhanced Oil Recovery for Sandstone and Carbonate Reservoirs. SPE J. 2015, 20, 483–495. [Google Scholar] [CrossRef]
- Attia, M.; Mahmoud, M.A.; Al-Hashim, H.S.; Sultan, A.S. Shifting to a New EOR Area for Sandstone Reservoirs with High Recovery, No Damage, and Low Cost. In Proceedings of the SPE EOR Conference at Oil and Gas West Asia, Muscat, Oman, 31 March–2 April 2014. [Google Scholar] [CrossRef]
- Frenier, W.W.; Fredd, C.N.; Chang, F. Hydroxyaminocarboxylic Acids Produce Superior Formulations for Matrix Stimulation of Carbonates. In Proceedings of the European Formation Damage Conference, The Hague, The Netherlands, 21–22 May 2001. [Google Scholar] [CrossRef]
- Frenier, W.W.; Rainey, M.; Wilson, D.; Crump, D.; Jones, L. A Biodegradable Chelating Agent is Developed for Stimulation of Oil and Gas Formations. In Proceedings of the SPE/EPA/DOE Exploration and Production Environmental Conference, San Antonio, TX, USA, 10–12 March 2003. [Google Scholar] [CrossRef]
- De Wolf, C.A.; Nasr-El-Din, H.A.; Bouwman, A.; Bang, E.R.A.; Naylor, E. Corrosion rates of Cr- and Ni-based alloys with organic acids and chelating agents used in stimulation of deep wells. SPE Prod. Oper. 2017, 32, 208–217. [Google Scholar] [CrossRef]
- LePage, J.N.; De Wolf, C.; Bemelaar, J.; Nasr-El-Din, H.A. An Environmentally Friendly Stimulation Fluid for High-Temperature Applications. Society of Petroleum Engineers. In Proceedings of the SPE International Symposium on Oilfield Chemistry, The Woodlands, TX, USA, 20–22 April 2009. [Google Scholar] [CrossRef]
- Mahmoud, M.A.; Nasr-El-Din, H.A.; De Wolf, C.; LePage, J.; Bemelaar, J. Evaluation of a New Environmentally Friendly Chelating Agent for High-Temperature Applications. SPE J. 2011, 16, 559–574. [Google Scholar] [CrossRef]
- Nasr-El-Din, H.A.; Dana, H.; Tomos, V.; Stanitzek, T.; de Wolf, C.A.; Alex, A. Field Treatment to Stimulate an Oil Well in an Offshore Sandstone Reservoir Using a Novel, Low Corrosive, Environmentally Friendly Fluid. In Proceedings of the SPE International Symposium and Exhibition on Formation Damage Control, Lafayette, LA, USA, 26–28 February 2014. Paper SPE-168163-MS. [Google Scholar] [CrossRef]
- Barri, A. Identifying Optimum Conditions for Stable Wormholes Created by Chelating Agents. Master’s Thesis, King Fahd University of Petroleum and Minerals, Dhahran, Saudi Arabia, 2015. Available online: http://eprints.kfupm.edu.sa/139626/ (accessed on 15 June 2017).
- Begum, Z.; Rahman, I.; Tate, Y.; Egawa, Y.; Maki, T.; Hasegawa, H. Formation and stability of binary complexes of divalent ecotoxic ions (Ni, Cu, Zn, Cd, Pb) with biodegradable aminopolycarboxylate chelants (DL-2-(2- carboxymethyl)nitrilotriacetic acid, GLDA, and 3-hydroxy-2,20-iminodisuccinic acid, HIDS) in aqueous solutions. J. Solut. Chem. 2012, 41, 1713–1728. [Google Scholar] [CrossRef]
- Mahmoud, M.A.; Nasr-El-Din, H.A.; LePage, J.N.; De Wolf, C. Optimum Injection Rate of a New Chelate That Can Be Used to Stimulate Carbonate Reservoirs. SPE J. 2011, 16, 968–980. [Google Scholar] [CrossRef]
- Nasr-El-Din, H.A.; de Wolf, C.A.; Stanitzek, T.; Alex, A.K.; Gerdes, S.; Lummer, N.R. Field Treatment to Stimulate a Deep, Sour, Tight-Gas Well Using a New, Low Corrosion and Environmentally Friendly Fluid. SPE Prod. Oper. 2013, 28, 277–285. [Google Scholar] [CrossRef]
- Nuñez, W.; Bautista, O.; Cepeda, F.A.; Kleber, M.A.; Dos Santos, A.A.; Oliveira, E.; Rodriguez, O. Field Treatment of an Injector Well in a Sandstone Formation Using a Low Corrosive Environmentally Friendly Fluid that Does Not Require Flow-Back. In Proceedings of the SPE Latin America and Caribbean Petroleum Engineering Conference, Buenos Aires, Argentina, 17–19 May 2017. [Google Scholar] [CrossRef]
- Ameur, Z.O.; Kudrashou, V.Y.; Nasr-El-Din, H.A.; Forsyth, J.P.J.; Mahoney, J.J.; Daigle, B.J. Stimulation of High Temperature SAGD Producer Wells Using a Novel Chelating Agent (GLDA) and Subsequent Geochemical Modeling Using PHREEQC. In Proceedings of the SPE International Symposium on Oilfield Chemistry, The Woodlands, TX, USA, 13–15 April 2015. [Google Scholar] [CrossRef]
- Klaewkla, R.; Arend, M.; Hoelderich, W.F. A Review of Mass Transfer Controlling the Reaction Rate in Heterogeneous Catalytic Systems. In Mass Transfer—Advanced Aspects, 1st ed.; Nakajima, H., Ed.; INTECH: Rijeka, Croatia, 2011; Chapter 29; pp. 667–684. [Google Scholar] [CrossRef]
- Levich, V.G. Physicochemical Hydrodynamics; Scripta Technica, Inc., Translator; Prentice-Hall: Englewood Cliffs, NJ, USA, 1962. [Google Scholar]
- Newman, J. Schmidt Number Correction for the Rotating Disk. J. Phys. Chem. 1966, 70, 1327–1328. [Google Scholar] [CrossRef]
- Yen, S.C.; Wang, J.S.; Chapman, T.W. Experimental Mass Transfer at a Forced-Convective Rotating-Disk Electrode. J. Electrochem. Soc. 1992, 139, 2231–2238. [Google Scholar] [CrossRef]
- Ellison, B.T.; Cornet, I. Mass transfer to a Rotating disk. J. Electrochem. Soc. 1970, 118, 68–72. [Google Scholar] [CrossRef]
- Lund, K.; Fogler, H.S.; McCune, C.C. Acidization—I. The dissolution of dolomite in hydrochloric acid. Chem. Eng. Sci. 1973, 28, 691–700. [Google Scholar] [CrossRef]
- Sayed, M.; Nasr-El-Din, H.A.; Nasrabadi, H. Reaction of emulsified acids with dolomite. J. Can. Pet. Technol. 2013, 52, 164–175. [Google Scholar] [CrossRef]
- Taylor, K.C.; Al-Ghamdi, A.H.; Nasr-El-Din, H.A. Effect of Additives on the Acid Dissolution Rates of Calcium and Magnesium Carbonates. SPE Prod. Facil. 2004, 19, 122–127. [Google Scholar] [CrossRef]
- Abdelgawad, K.Z.; Mahmoud, M.; Hussein, I. Stimulation of high temperature carbonate gas reservoirs using seawater and chelating agents: Reaction kinetics. J. Nat. Gas Sci. Eng. 2018, 55, 595–605. [Google Scholar] [CrossRef]
- Mahmoud, M.A.; Nasr-El-Din, H.A. Modeling flow of chelating agents during stimulation of carbonate reservoirs. Arab. J. Sci. Eng. 2014, 39, 9239–9248. [Google Scholar] [CrossRef]


| Dissociation | pKa |
|---|---|
| pKa1 = 9.4 | |
| pKa2 = 5.0 | |
| pKa3 = 3.5 | |
| pKa4 = 2.6 |
| Ions | Concentration (mg/L) |
|---|---|
| Sodium | 18,300 |
| Calcium | 650 |
| Magnesium | 2110 |
| Sulfate | 4290 |
| Chloride | 32,200 |
| Carbonate | 0 |
| Bicarbonate | 120 |
| Total dissolved salts (TDS) | 57,670 |
| Experiment No. | Fluid/Rock | Temperature (°F) | Disk Porosity (%) | Disk Angular Velocity (RPM) |
|---|---|---|---|---|
| 1 | 20 wt% GLDA/DI/Indiana Limestone | 150 | 6.82 | 500 |
| 2 | 6.82 | 1000 | ||
| 3 | 7.07 | 1500 | ||
| 4 | 7.15 | 2000 | ||
| 5 | 200 | 10.02 | 500 | |
| 6 | 9.62 | 1000 | ||
| 7 | 10.14 | 1500 | ||
| 8 | 9.20 | 2000 | ||
| 9 | 250 | 9.08 | 500 | |
| 10 | 9.99 | 1000 | ||
| 11 | 6.75 | 1500 | ||
| 12 | 9.46 | 2000 | ||
| 13 | 20 wt% GLDA/SW with Indiana Limestone | 150 | 12.41 | 500 |
| 14 | 9.42 | 1000 | ||
| 15 | 9.75 | 1500 | ||
| 16 | 9.43 | 2000 | ||
| 17 | 200 | 9.30 | 500 | |
| 18 | 9.55 | 1000 | ||
| 19 | 9.66 | 1500 | ||
| 20 | 6.916 | 2000 | ||
| 21 | 250 | 9.24 | 500 | |
| 22 | 9.53 | 1000 | ||
| 23 | 9.53 | 1500 | ||
| 24 | 12.41 | 2000 | ||
| 25 | 20 wt% GLDA/SW with Austin Chalk | 200 | 26.07 | 500 |
| 26 | 22.45 | 1000 | ||
| 27 | 27.96 | 1500 | ||
| 28 | 26.79 | 2000 |
| Fluid/Rock | Temperature (°F) | Diffusion Rates (cm2/s) |
|---|---|---|
| 20 wt% GLDA/DI/Indiana limestone | 150 | - |
| 200 | 4.59 × 10⁻⁶ | |
| 250 | 1.07 × 10⁻⁵ | |
| 20 wt% GLDA/SW/Indiana limestone | 150 | 8.31 × 10⁻⁷ |
| 200 | 3.37 × 10⁻⁶ | |
| 250 | 4.71 × 10⁻⁶ | |
| 20 wt% GLDA/SW/Austin chalk | 200 | 3.96 × 10⁻⁵ |
| Experiment | L (cm) | D (cm) | (%) | PV (cm3) | K (mD) | Q (cm3/min) |
|---|---|---|---|---|---|---|
| 1 | 14.94 | 3.81 | 9.17 | 15.61 | 0.30 | 0.25 |
| 2 | 15.09 | 3.81 | 8.30 | 14.30 | 0.51 | 0.5 |
| 3 | 15.02 | 3.81 | 10.54 | 18.06 | 1.86 | 1.0 |
| 4 | 15.03 | 3.81 | 9.55 | 16.37 | 0.75 | 2.0 |
| 5 | 15.17 | 3.81 | 9.51 | 16.46 | 0.81 | 3.0 |
© 2019 by the authors. Licensee MDPI, Basel, Switzerland. This article is an open access article distributed under the terms and conditions of the Creative Commons Attribution (CC BY) license (http://creativecommons.org/licenses/by/4.0/).
Share and Cite
Abdelgawad, K.Z.; Mahmoud, M.; Elkatatny, S.; Abdulraheem, A.; Patil, S. Reaction Kinetics and Coreflooding Study of High-Temperature Carbonate Reservoir Stimulation Using GLDA in Seawater. Energies 2019, 12, 3407. https://doi.org/10.3390/en12183407
Abdelgawad KZ, Mahmoud M, Elkatatny S, Abdulraheem A, Patil S. Reaction Kinetics and Coreflooding Study of High-Temperature Carbonate Reservoir Stimulation Using GLDA in Seawater. Energies. 2019; 12(18):3407. https://doi.org/10.3390/en12183407
Chicago/Turabian StyleAbdelgawad, Khaled Z., Mohamed Mahmoud, Salaheldin Elkatatny, Abdulazeez Abdulraheem, and Shirish Patil. 2019. "Reaction Kinetics and Coreflooding Study of High-Temperature Carbonate Reservoir Stimulation Using GLDA in Seawater" Energies 12, no. 18: 3407. https://doi.org/10.3390/en12183407
APA StyleAbdelgawad, K. Z., Mahmoud, M., Elkatatny, S., Abdulraheem, A., & Patil, S. (2019). Reaction Kinetics and Coreflooding Study of High-Temperature Carbonate Reservoir Stimulation Using GLDA in Seawater. Energies, 12(18), 3407. https://doi.org/10.3390/en12183407