Article

Effect of Water Vapor Injection on the Distributions of Equivalence Ratio and the NO Emission Reduction in a CI Engine

1
Graduate School of Mechanical Engineering, Kongju National University, Chungnam 31080, Korea
2
Department of Mechanical and Automotive Engineering, Kongju National University, Chungnam 31080, Korea
*
Author to whom correspondence should be addressed.
Energies 2019, 12(22), 4248; https://doi.org/10.3390/en12224248
Submission received: 28 September 2019 / Revised: 29 October 2019 / Accepted: 30 October 2019 / Published: 7 November 2019
(This article belongs to the Special Issue Environmental and Energy Assessment of Alternative Fuels)

Abstract

:
The objective of this study was to investigate the influence of a water vapor injection into the intake port of a small compression ignition engine and analyze the effect of the collisions between the water particles and the injected fuel on combustion and exhaust emission performances. To simulate the water vapor by the ultrasonic humidifier in the numerical analysis, the water particles were introduced into the cylinder through an intake port during the intake process, and the amount was varied from 10% to 30% of the injected fuel mass per stroke. When the water vapor was injected into the intake port, the rich equivalence ratio region was distributed in the center of cylinder. In addition, the ISNO (indicated specific nitrogen oxide) values decreased up to 46% more than the values for the condition without the water-vapor-injection. However, the ISSoot (indicated specific soot) exhibited similar values in any conditions. For starts of energizing timing that were BTDC (before top dead center) 25 deg and 15 deg, the ISFC (indicated fuel consumption) values decreased with increased portions of water vapor. However, in the case of BTDC 05deg, the ignition delay was too long, which deteriorated combustion performance.

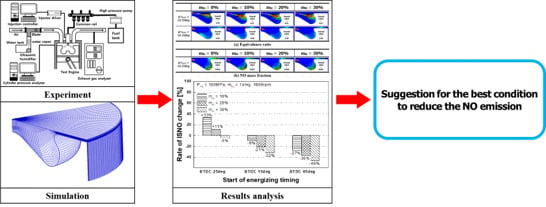
Graphical Abstract

1. Introduction

The compression ignition (CI) engine has been attracting attention because it has a higher thermal efficiency and higher torque at low engine speeds than spark ignition (SI) engines. However, it also has a high flame temperature and an increased potential for incomplete combustion, which are the main causes of nitrogen oxide (NOX) and soot generation [1].
In order to reduce NOX and soot emissions, Su et al. [2] and Gafoor et al. [3] conducted a numerical study which investigated changes in the geometry of the combustion chamber for a homogeneous air–fuel mixture. It was found that the various chamber geometries had a different swirl ratio, which changed the distributions of air–fuel. As a result, they found that, when the chamber geometries resulted in high swirl intensity, a smaller amount of soot was discharged. Min et al. [4] and Park et al. [5] studied the effect of various injector nozzle-hole geometries on mixture formation and reported that fuel injected from a converging group hole nozzle had a smaller SMD (Sauter mean diameter) and a longer spray tip penetration than a single-hole nozzle. As a result, air and fuel were mixed homogeneously, which generated a smaller amount of soot because of the improved combustion performance.
EGR (exhaust gas recirculation) is a general method for reducing NOX emissions. It reduces the oxygen concentration in the cylinder to suppress increased combustion temperature [6,7,8]. However, applying EGR has the disadvantage of increasing soot emissions. To overcome the problem, a method of introducing water into the cylinder was recently proposed. This suppresses the formation of NOX by lowering the combustion temperature, due to the high latent heat of vaporization and the high specific heat of the water.
Various methods have been used to introduce water into the cylinder, such as direct water injection into the cylinder [9,10], a water emulsion fuel [11,12], and water injection into the intake port [13,14,15]. By accurately controlling the amount of water mass and the water injection timing into the cylinder, the direct injection of water into the cylinder was reported to largely reduce the amount of NOX emissions. However, product cost is increased by the addition of injectors for water injection and changes in the cylinder structure.
In the next method, water emulsion fuel was reported to reduce soot and NOX emissions due to the improved fuel atomization produced by micro-explosions of water in the fuel. Furthermore, this method does not require any changes in the structure of a conventional engine. However, emulsion fuel has a price problem because a surfactant should be used to mix water and fuel, and a mixing device such as ultrasonic equipment is required.
Finally, there is the method of injecting water into the intake port. It can corrode the intake port made by steel. However, this problem can be solved by making the intake port out of plastic or aluminum. Currently, its intake port, which is made of plastic or aluminum, is widely used. In addition, although this method does not require changes to the cylinder structure, it does require an additional system to inject water into the intake port. However, it is less expensive than direct water injection into the cylinder. It was also reported to have an excellent effect on the NOX reduction.
As reported in previous studies [11,14], the water enters the cylinder, evaporates, and then expands, thereby increasing the cylinder pressure. As a result, combustion performance is improved, while exhaust emissions, such as soot and NOX, are reduced because the intake air temperature is lowered, which increases the amount of intake air. Xavier et al. [15] also reported that a large amount of air can be introduced into the cylinder because the temperature of the intake air is lowered by the water absorbing heat. Min et al. [16] studied reduction of NOX emission in a CI engine by using specific heat of H2O; it was found that the NOX emission was reduced up to 27% than without water vapor injection.
As mentioned above, the method of injecting water into the intake port is cheaper than direct water injection because it does not require a change in engine structure. In addition, when the injected water is effectively evaporated, NOX is dramatically reduced. In this study, an ultrasonic humidifier was used to introduce the water into the intake port, which improves its evaporation in the cylinder by reducing the size of water particles. In the experimental studies, it is often difficult to observe the distributions of equivalence ratio and the formation/oxidation reaction of exhaust emissions.
Compared with conventional emulsion fuel or water direct injection, the humidification system in the intake port used in this study can be applied to the current CI engine without any major modification, because it is a simple system. Therefore, the objective of this study is how much exhaust emissions can be reduced by a water-vapor-injection system compared with the above two methods, and the optimization conditions were investigated to find the suitable portion of water vapor, which was introduced into the cylinder, in a CI engine. At the same time, the effect of equivalence ratio distributions on combustion performance was confirmed. The distributions of NO and soot were compared, in order to observe the formation/oxidation of exhaust emissions.

2. Experimental and Numerical Descriptions

2.1. Experimental Setup

The experimental system consisted of a test engine, an intake humidification system, an intake system, a test-engine control system, and an exhaust-emissions analyzer, as shown in Figure 1. The intake humidification system consisted of a water tank, an ultrasonic humidifier, and an intake pipe with a blade. To homogeneously mix the air and water vapor, the blade was installed in an intake pipe. When the ultrasonic humidifier was engaged, 1.11 mg per stroke was introduced into the intake port at 1800 rpm. Figure 2 shows the geometry of combustion chamber at top dead center (TDC).
The test engine was a single-cylinder engine with a common-rail fuel-injection system. The detailed specifications of the test engine are listed in Table 1. The engine speed was controlled by an AC dynamometer (25 kW, AVL, Graz in Austria), and the temperature of coolant and engine oil were fixed at 80 °C. The pressure of the common-rail was controlled by a pressure regulator (PCV Driver, TEMS Ltd., Prague in Czech), and the injector was operated by using an injector driver (NI9751, National Instruments, Austin in USA). The crank angle was measured in 0.1 CA (crank angle) by using a rotary encoder (E40S6-1000-6-L-5, Autonics, Busan in Korea), and its data was obtained by an injector control module (cRio-9024, National Instruments, Austin in USA), which adjusted the injection timing. The top dead center (TDC) signal was adjusted to overlap the signal of the crank angle and cam signals. The cam signal was obtained by using a proximity sensor (PR18-5DP, Autonics, Busan in Korea). The pressure in the combustion chamber was measured by a piezoelectric-type pressure sensor (6052C, Kistler, Winterthur in Switzerland), which was installed in a glow-plug position. The NO and soot emissions were measured with an emission bench (MAXA 9100D-EGR, HORIBA, Kyoto in Japan) and a condensation particle counter (CPC, 3772, TSI, Shoreview in USA), as listed in Table 2. These data, which were extracted for 120 s, were averaged, and the average values were calculated as the emissions per stroke.

2.2. Numerical Sub-Model

The engine combustion analysis program (AVL Fire) was used to investigate the effect of the water vapor injected into the intake port on performance improvement in a small CI engine. The physical and chemical models for the numerical analysis are listed in Table 3 [17,18,19,20].
The combustion model and break-up model employed the ECFM-3Z (The 3-Zones Extended Coherent Flame Model) model and the Wave model, respectively. The ECFM-3Z model is composed of 3 mixture air zones (Air, Fuel, And Mixture) and 2 combustion zones (Burned gasses, and Unburned gasses). Twelve species (O2, N2, CO2, H2, H2O, O, H, N, OH, NO, and Fuel) can be considered in this model [18].
In the Wave model, the rate approach for the radius reduction of the parent drops is given by Equation (1):
d r d t = ( r s t a b l e r ) τ a
where τ a is the break-up time in the model. It can be obtained by using Equation (2):
τ a = 3.726 · C 2 · r Λ · Ω
where C 2 is the characteristic of the nozzle with respect to the break-up time.
In Equation (1), r s t a b l e in Equation (3) means the radius of the initial droplet:
r s t a b l e = C 1 Λ
where C 1 has a fixed value of 0.61, as a Reitz constant value [19]. Λ is the wavelength of the fastest growing surface of the droplet from Equation (4). In addition, Ω is the growth rate of the wavelength in Equation (5):
Λ = 9.02 · r ( 1 + 0.45 · O h 0.5 ) ( 1 + 0.4 · T 0.7 ) ( 1 + 0.87 · W e g 1.67 ) 0.6
Ω = ( ρ d r 3 σ ) 0.5 0.34 + 0.38 · W e g 1.5 ( 1 + O h ) ( 1 + 1.4 · T 0.6 )
where O h (in both equations) means Ohnesorge number, and T is O h · W e 0.5 [20].
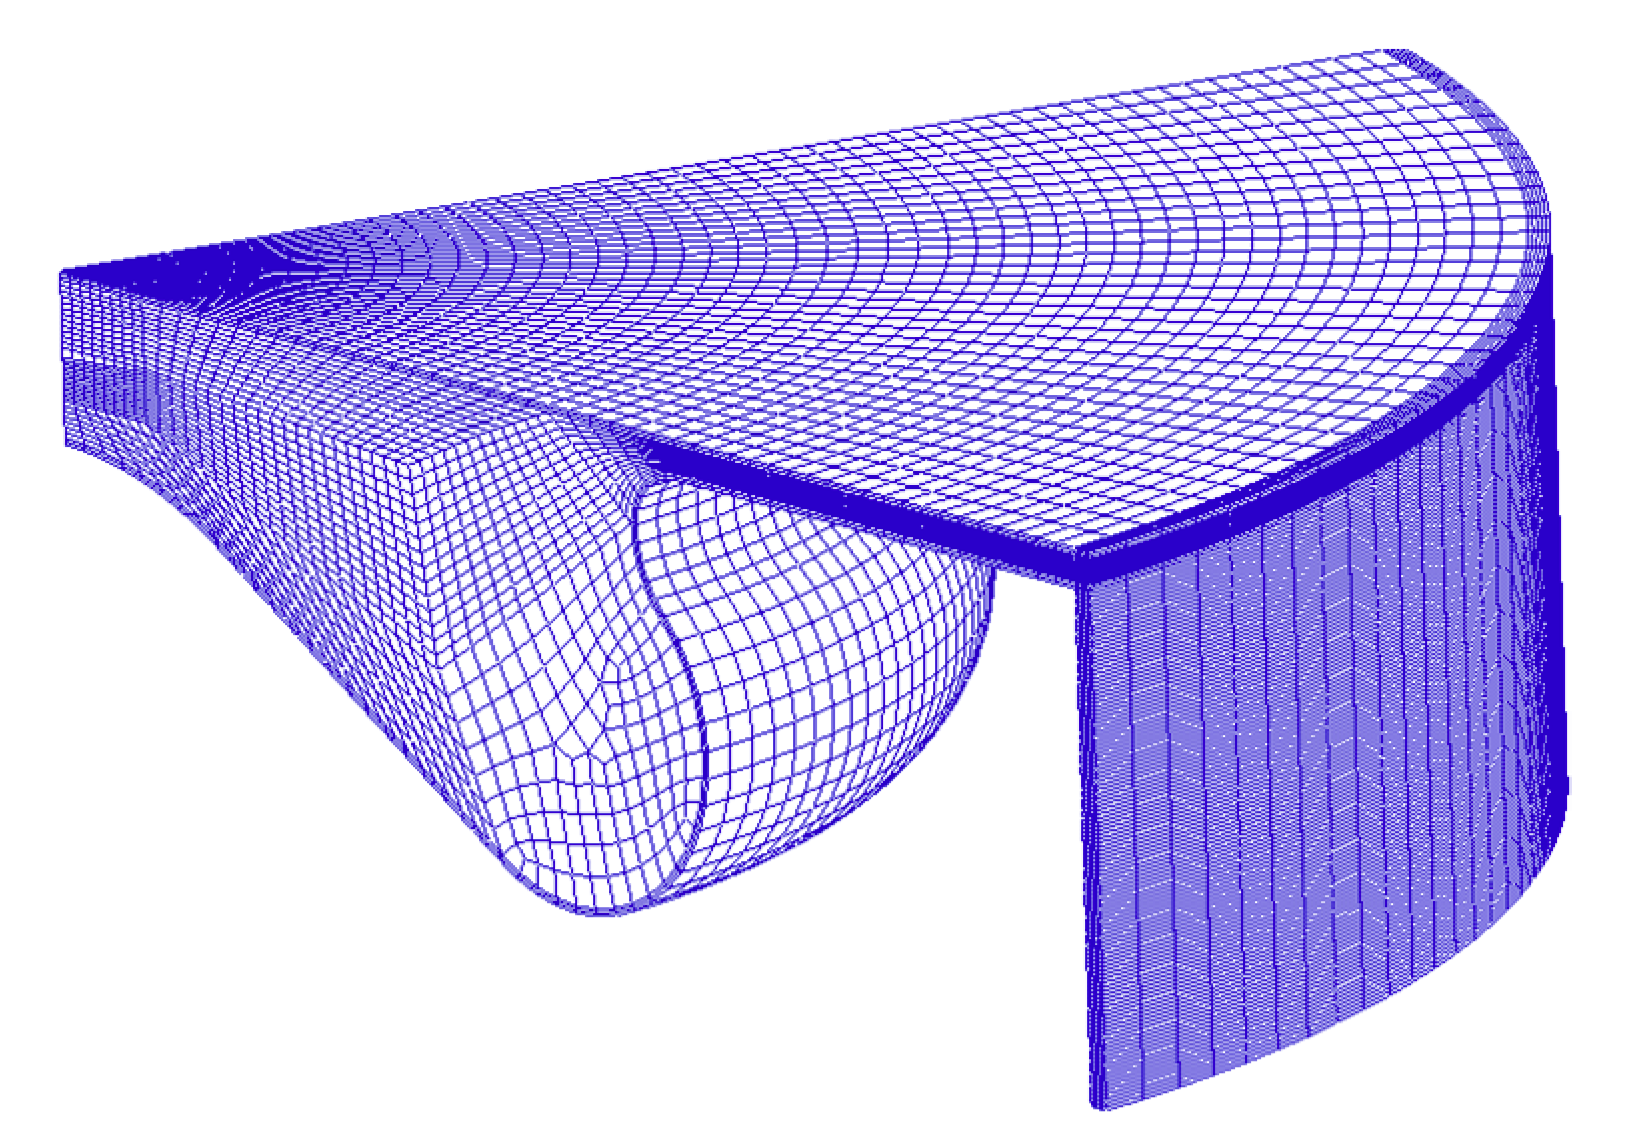
The geometry of the combustion chamber mesh for the numerical analysis was generated to be a re-entrant bowl, considering the actual cylinder geometry. To reduce computation time, only 1/5 of the whole cylinder engine mesh was generated. Its mesh size was set by dividing it into the regions of active chemical reaction (from BTDC 36.7deg to ATDC 36.7deg) and inactive chemical reaction. The mesh size in the active chemical reaction region was set to a maximum of 0.5 mm; otherwise, it was set to a maximum of 1.0 mm. To introduce water vapor into the cylinder during the intake stroke, an intake port mesh was added to the piston’s top surface. In the numerical analysis, to simulate the water vapor generated by the ultrasonic humidifier, the size of the water particles was set to 0.01 mm, after referring to the manual of the ultrasonic humidifier. The water particle was set to be introduced into the cylinder via the intake port inlet. The convergence criteria were set from a minimum of 10 times to a maximum of 100 times, to improve accuracy. The reduction residual of the calculation was set to 0.01, based on pressure and momentum.

2.3. Experimental and Numerical Conditions

Experiments were performed under the same conditions, in order to validate the numerical analyses. The load of the ultrasonic humidifier was varied from 0% to 100%. The water vapor generated by the ultrasonic humidifier was introduced into the intake port as 0 and 1.11 mg/stroke, at an operating speed of 1800 rpm. The start of energizing timing (teng) and the fuel injection mass were fixed at BTDC (before top dead center) 15deg and 14 mg, respectively.
To investigate the effect of the injected water vapor into the intake port on the performance improvement in a CI engine, the mass of the introduced water vapor (mH) was varied by 10% (1.4 mg), 20% (2.8 mg), and 30% (4.2 mg) of the injected fuel mass per stroke, and the start of energizing timing was swept from BTDC 05deg to BTDC 20deg. The distributions of equivalence ratio, NO mass fraction, cylinder temperature, and soot mass fraction in the cylinder were also analyzed to investigate the performance improvement in a CI engine. Diesel-D1 (C13H23) was employed in this work, with reference to the library in AVL Fire [17]. The injection-rate data required to carry out this study were measured using Bosch’s suggestion [21]. The detailed numerical analysis conditions are listed in Table 4.

3. Results and Discussions

3.1. Validation of Numerical Model

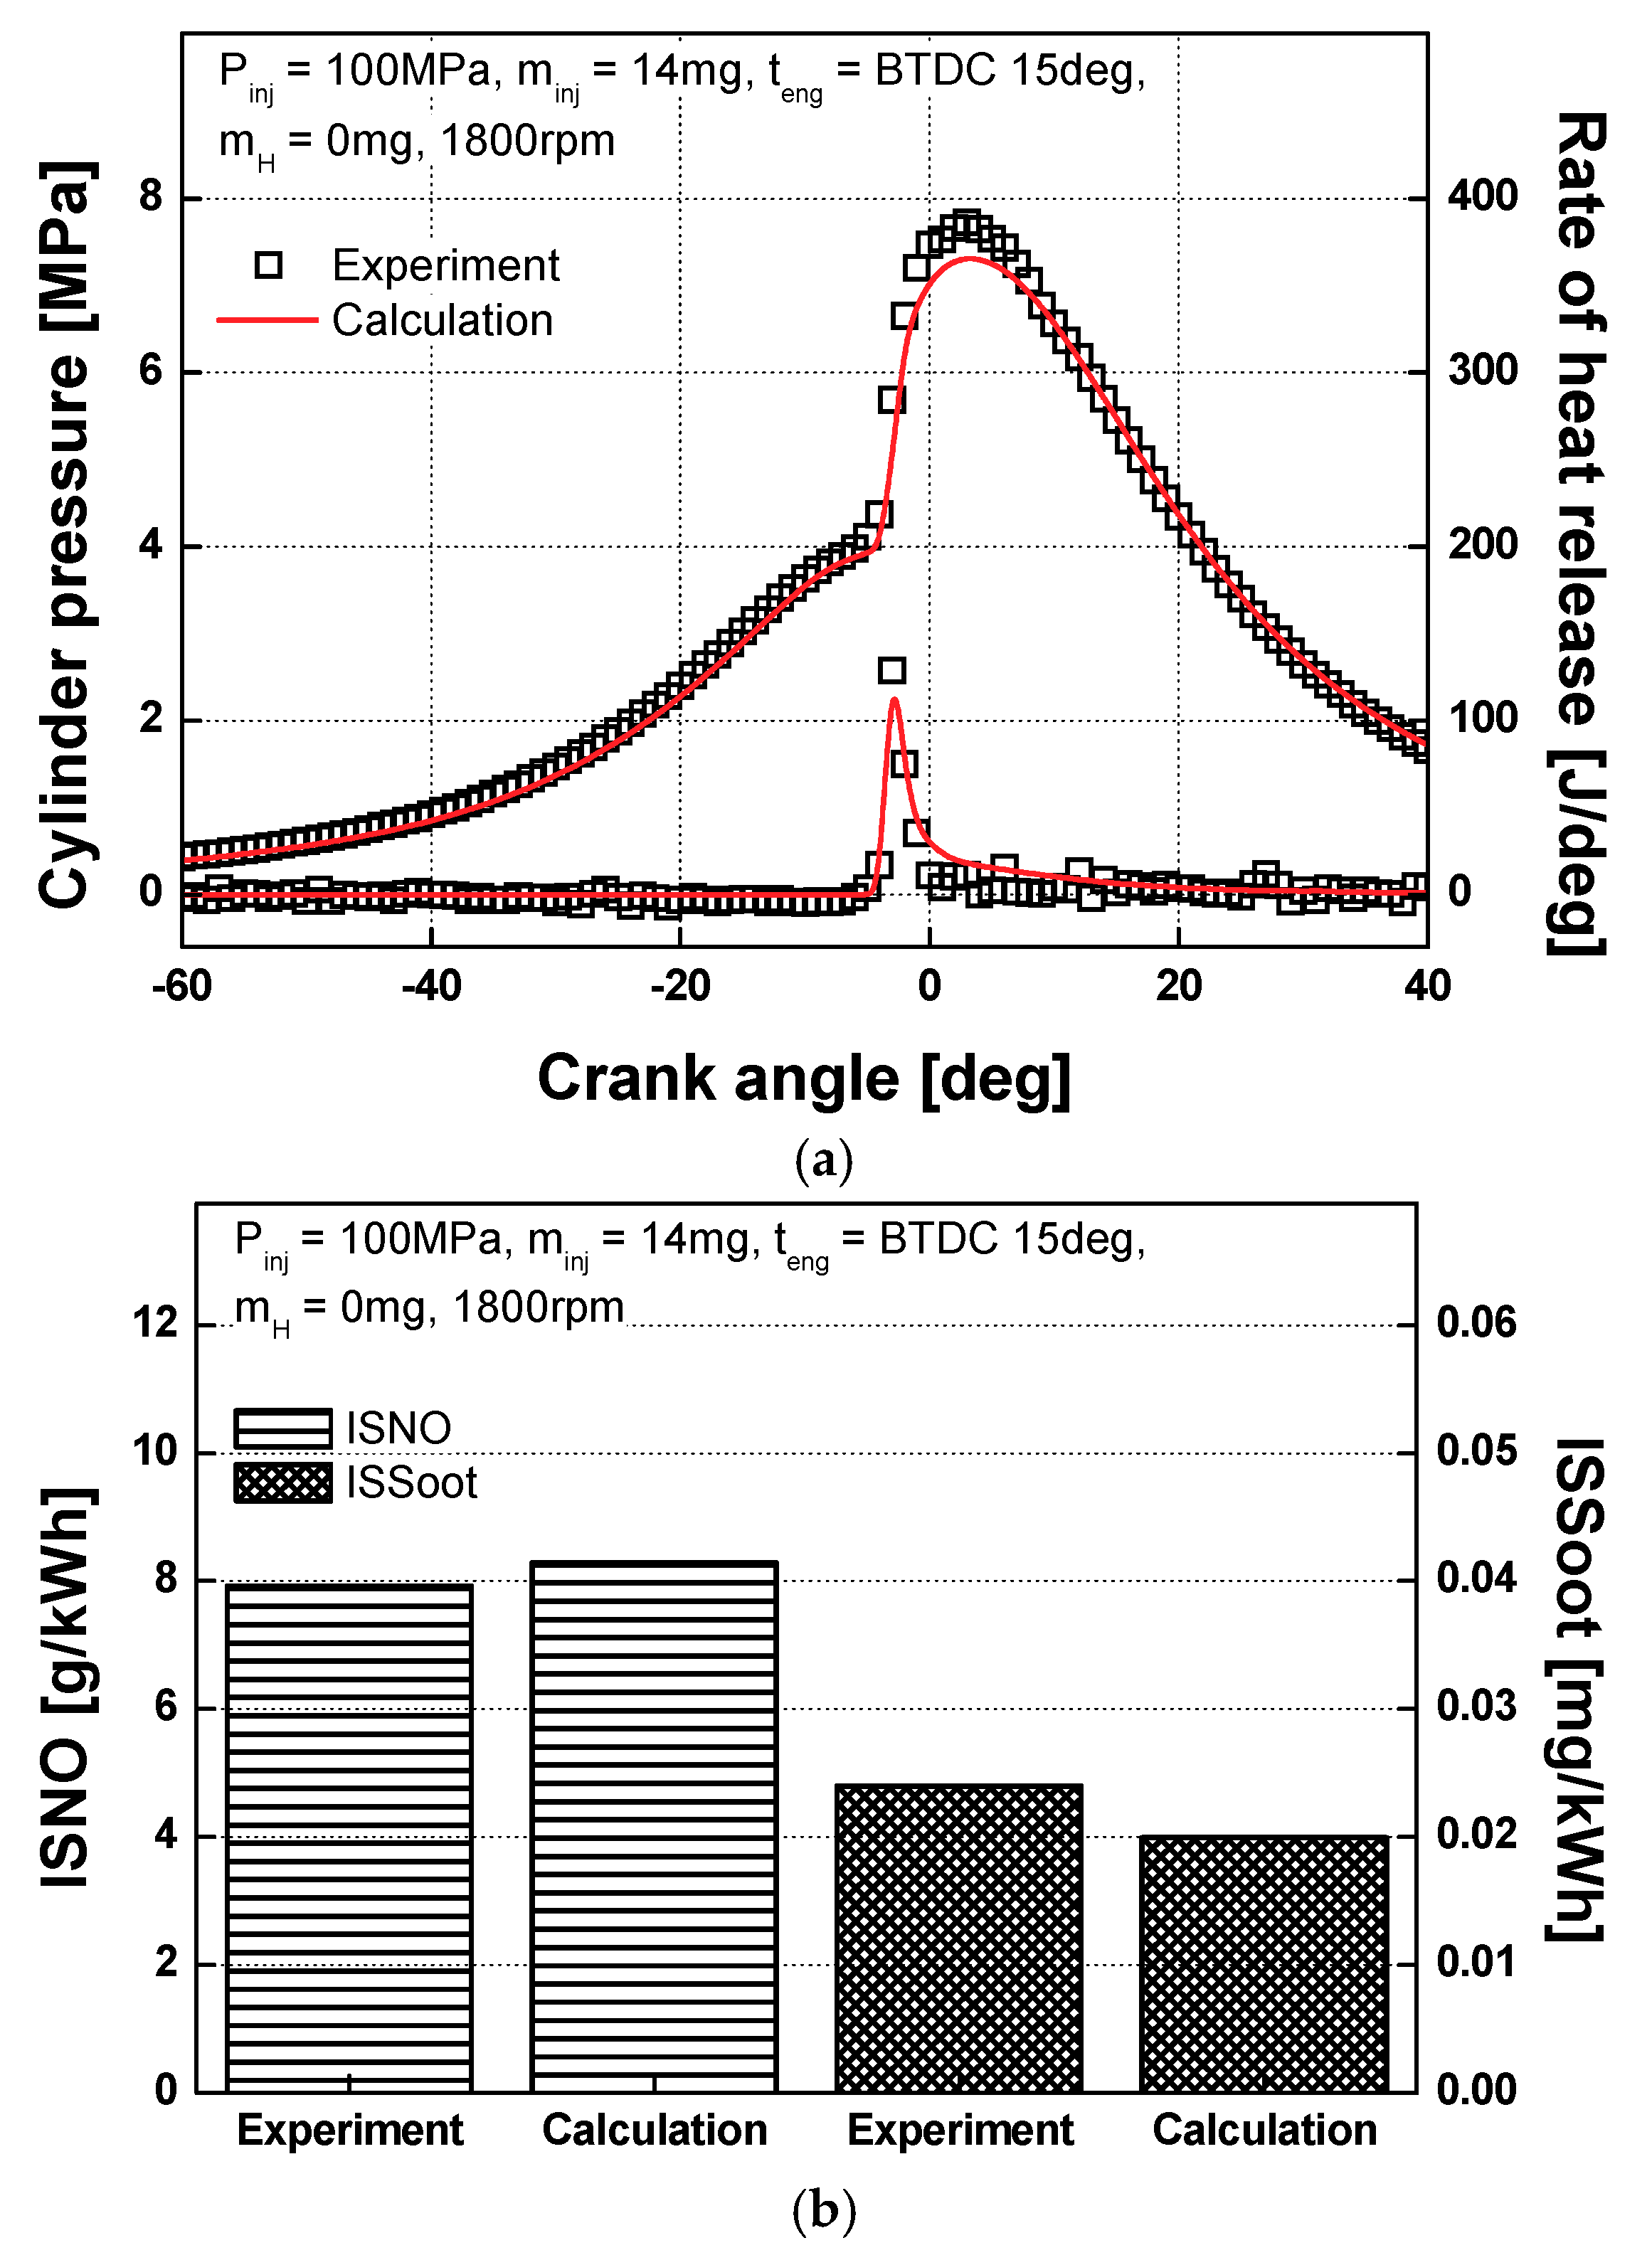
In this study, the reliability of the numerical analysis results was validated by comparison with the experimental results obtained under the same conditions, as shown in Figure 3 and Figure 4.
Figure 3 shows the comparison of the combustion and exhaust emission characteristics without water vapor injection. As shown in Figure 3a, the results of peak cylinder pressure were well matched within an error rate of 5.3%. The experimental and numerical results for exhaust emission also showed good agreement with an error rate of 4.67% for ISNO (indicated specific nitrogen oxide) and 16.67% for ISSoot (indicated specific soot), as shown in Figure 3b. The error rate for ISSoot was relatively high because its value was very small (approximately 0.004 mg/kWh).
Figure 4 shows the combustion and exhaust emissions characteristics with the water vapor injection. The error rate for the experimental and numerical cylinder pressure results was within 7.1%, as shown in Figure 4a. Figure 4b shows good agreement, with an error rate for exhaust emissions of 8.4% for ISNO and 10.6% for ISSoot. It was found that the ISNO value decreased when water vapor was introduced into the intake port; however, the ISSoot value increased. These results show the same tendency as previous studies [13,14,15,16] on water injection into the intake port. Considering the results for cylinder pressure (error rate = 7.1%) and ISNO value (error rate = 8.4%), it can be said that the simulation results in this work are reliable.

3.2. Effect of Water Vapor Injection on the Distributions of the Equivalence Ratio and the Exhaust Emissions in the Cylinder

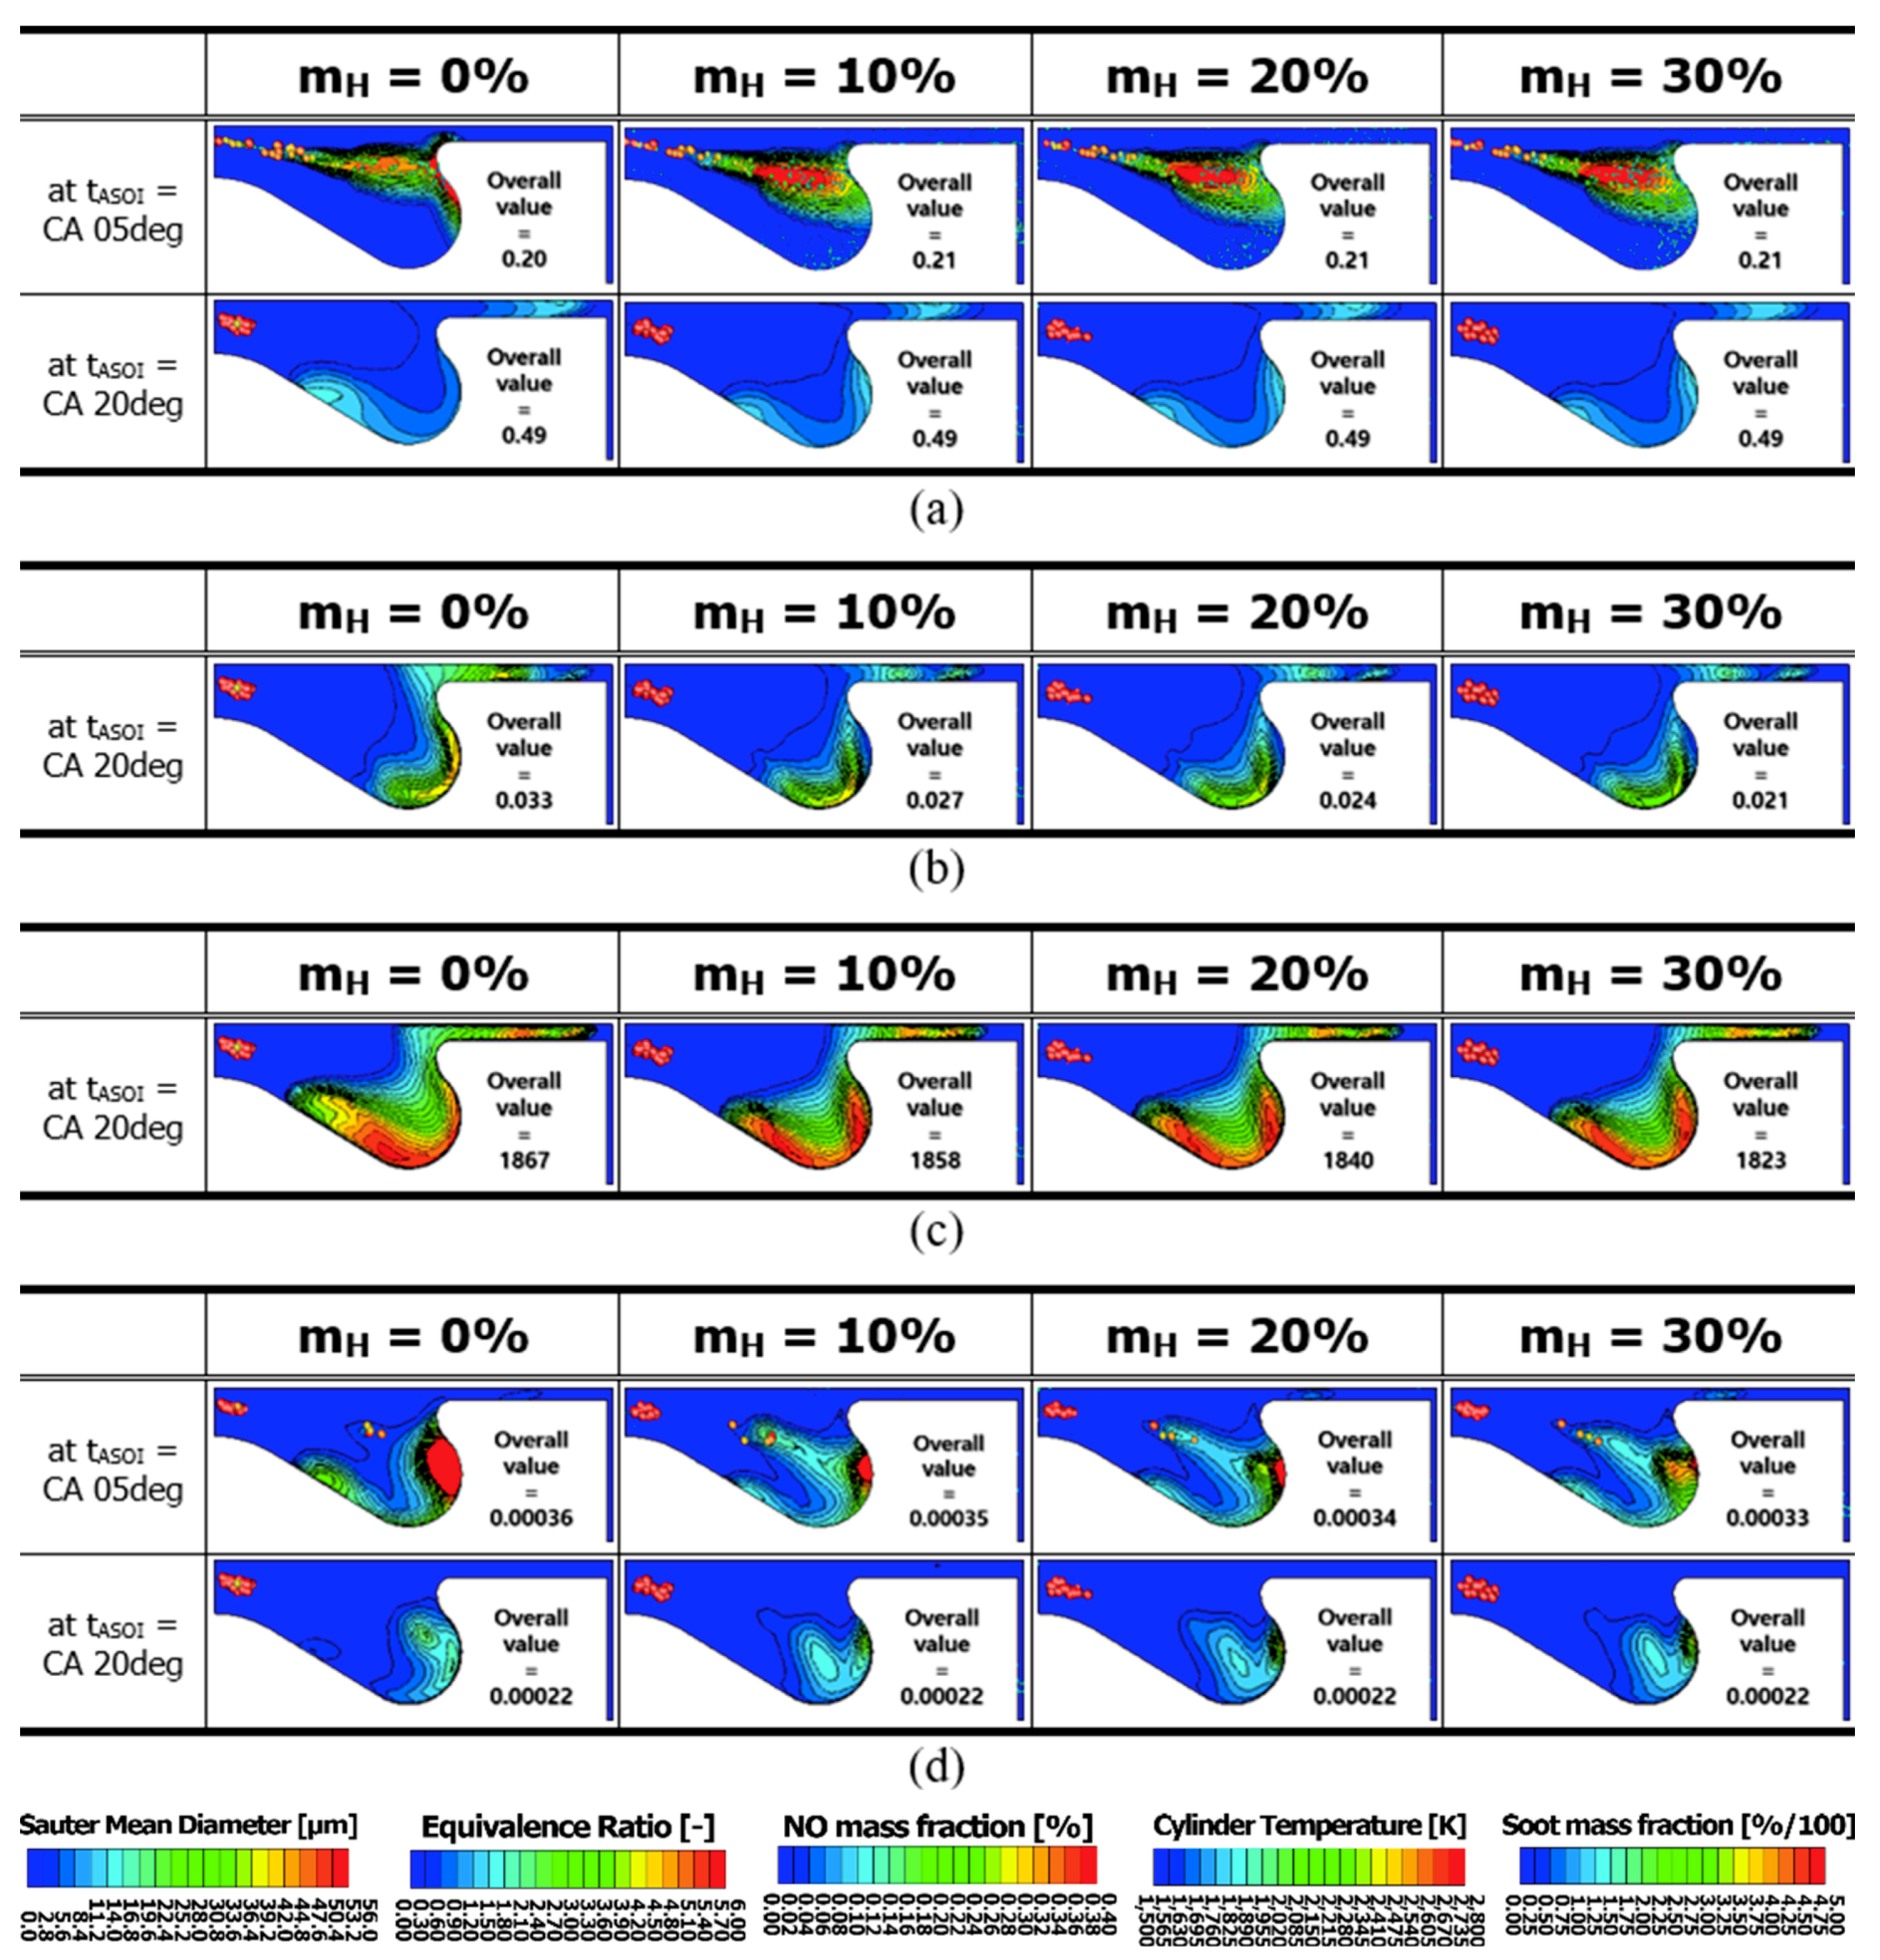
The distributions of equivalence ratio, NO mass fraction, and cylinder temperature according to the portion of water vapor when the start of energizing timing was BTDC 15deg are shown in Figure 5.
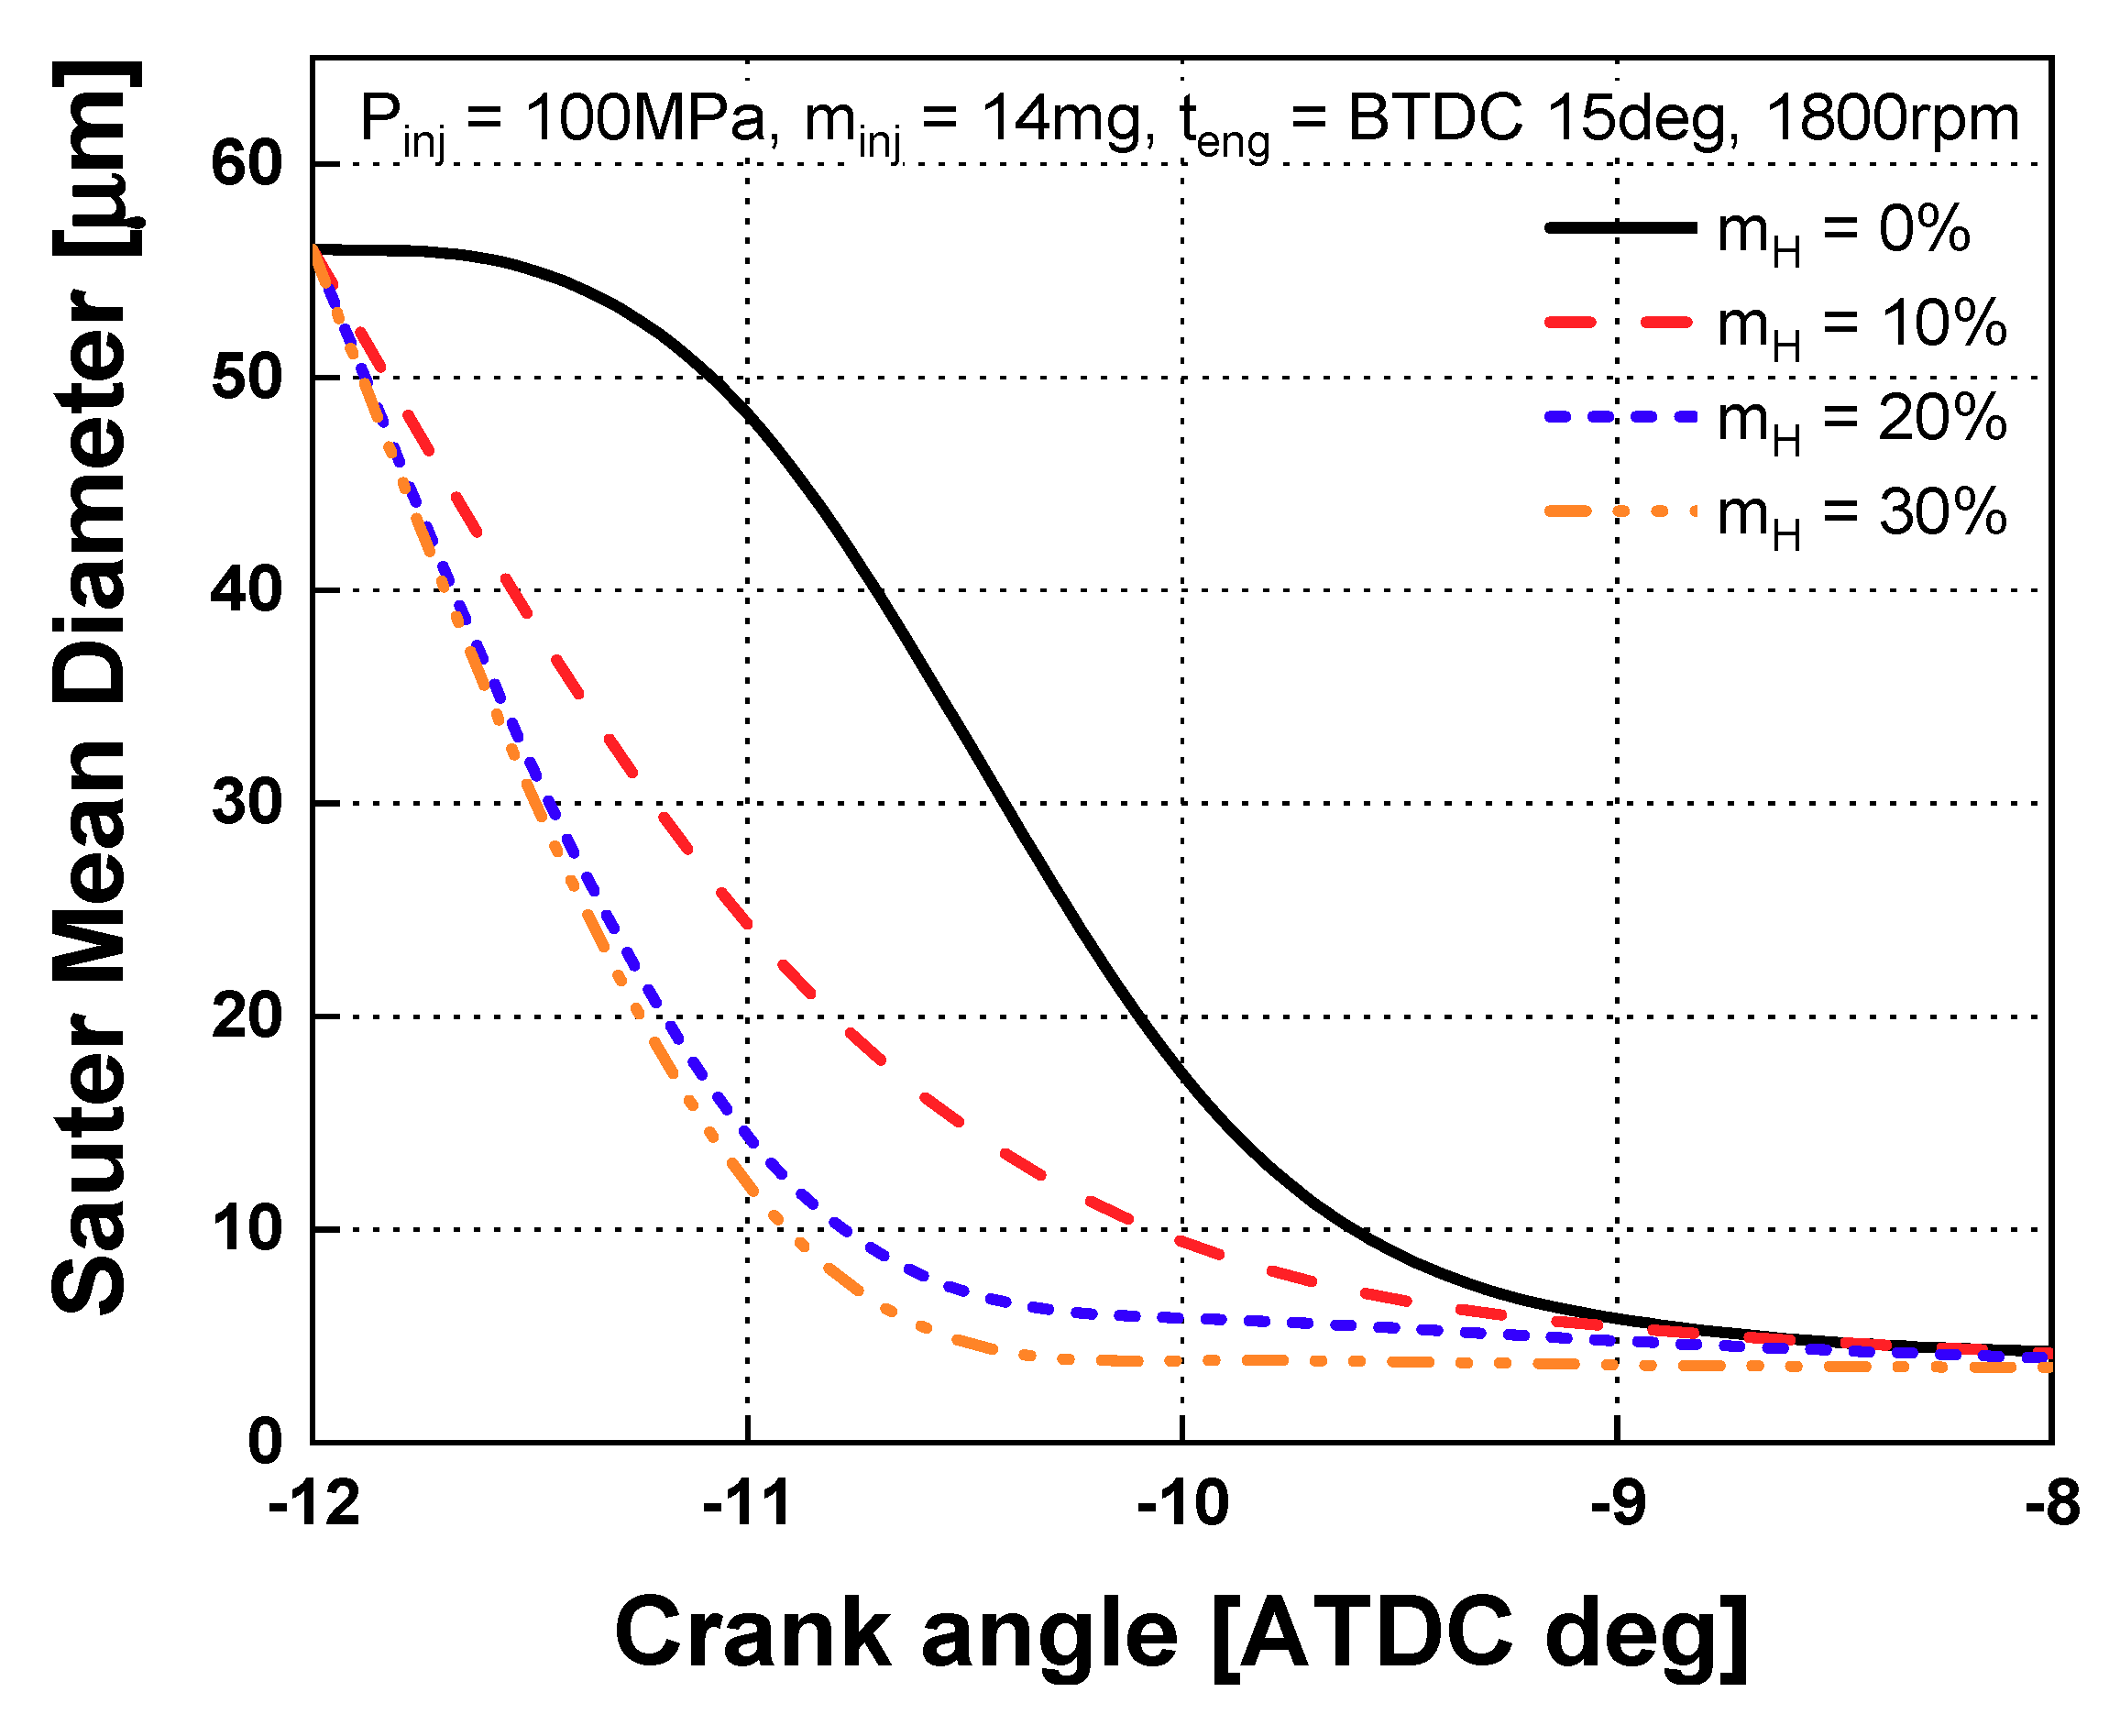
The distributions of equivalence ratios for the different portions of water vapor are shown in Figure 5a. Without the water vapor injection, the area of rich equivalence ratio was distributed around of the piston rim region, because the injected fuel hit the piston rim, and the collided fuel droplet evaporated. On the other hand, when the water vapor was introduced into the cylinder, the area of rich equivalence ratio was more widely distributed in the center of the cylinder than the case without the water vapor injection because the injected fuel collided with the remaining water particles. Its collision effect occurred to improve the atomization performance of the fuel droplet, and the area of rich equivalence ratio was widely distributed because the atomized fuel droplet can evaporate well. As shown in Figure 6, increasing the water vapor portion increased the collision effect between fuel and water droplets. The SMDs of the fuel droplet were respectively decreased by about 2.2%, 5.2%, and 10.7% than the one without the water vapor injection. As a result, the area of rich equivalence ratio was distributed at the center of the cylinder.
Figure 5b shows the distributions of NO mass fraction according to the water vapor portion. In general, NO generation is a function of combustion temperature, and emissions increase with rising combustion temperature [22]. When the water vapor portion was increased, the amount of NO generation decreased, because the combustion temperature decreased, as shown in Figure 5c. The combustion temperature was suppressed due to the specific heat of the introduced water in the cylinder (the specific heat (Cp) values of water vapor and air are 1.8723 and 1.005 kJ/kg·K [23], respectively). As a result, the cylinder temperature was reduced by as much as 44 K by increasing the water vapor portion.
Figure 5d shows the effect of the water particle portion on the soot mass fraction. It was observed that the area of rich soot was distributed when the water vapor portion was increased at tASOI = CA 05deg. The reason is that, as mentioned above, the droplets of fuel evaporated well due to the collision between the injected fuel and the remaining water particles, and the resistance of the remaining water particles allowed enough time for the air and fuel to mix. As a result, a small amount of soot was formed, as shown in Figure 7. However, at tASOI = CA 20deg, all cases had similar distributions and overall values of soot, because although a small amount of soot was formed, the low cylinder temperature resulting from the high specific heat and the latent heat of vaporization suppressed the oxidation of soot. As a result, all cases had a similar soot mass fraction value in relation to the portion of water vapor.

3.3. Effect of Water Vapor Portion on Combustion Characteristics

Figure 8 shows the effect of water vapor portion on the cylinder pressure and ROHR (rate of heat release) under different starts for the energizing timing. The cylinder pressure increased by advancing the start of the energizing timing because the advanced start of energizing timing increases the air–fuel mixing time, and it brings the rise of premixed combustion proportion. As a result, the peak ROHR value increased, and the cylinder pressure raised.
For teng = BTDC 25deg, the peak cylinder pressure when water vapor was injected into the intake port was at least 0.13 MPa higher than the case without the water vapor injection. This was because, as described in Figure 5a, combustion performance was improved by the improved atomization, which was produced by the collisions between the remaining water particle and the injected fuel. However, for teng = BTDC 15deg and BTDC 05deg, the peak cylinder pressure with the water vapor injection was lower than without the water vapor injection, because the rise in combustion temperature was suppressed by the specific heat of water. Due to the low cylinder temperature, the cylinder pressure decreased by up to 0.42 MPa. From these results, it was determined that the unevaporated and remaining water particles enhanced combustion performance, due to the improved atomization by collisions with the injected fuel. However, when the remaining water particles were given time to evaporate, by retarding the start of energizing timing, the rise in combustion temperature was suppressed, and this deteriorated the combustion performance.

3.4. Effect of the Portion of Water Vapor on Exhaust-Emission Characteristics

Figure 9 shows the effect of water vapor portion on the ISNO value under different starts for energizing timing. It was observed that, when the start of energizing timing was advanced, the ISNO value increased, because, as mentioned above, this secured enough air–fuel mixing time to increase the premixed combustion, and it has a high combustion temperature. Thereby, lots of NO was formed.
Except for teng = BTDC 25deg, the ISNO values decreased with increasing water vapor portion. The rates of ISNO change at each start of energizing timing under mH = 30% decreased by a maximum of 5%, 32%, and 46% than that without the water vapor injection, as shown in Figure 9b. The amount of generated NO, which is a function of combustion temperature, was small because, as mentioned in Figure 5b, the cylinder temperature decreased as the portion of water vapor increased.
When the start of energizing timing was BTDC 25deg and the water vapor portions were 10% and 20%, the ISNO values were 33% and 11% higher than without the water vapor injection. The reason is that these cases had a small amount of water vapor, which only improved the atomization of fuel droplets, rather than suppressing combustion temperature. On the other hand, for mH = 30%, which had a relatively large amount of water vapor, the remaining water particles in the cylinder improved the atomization of the fuel droplets and suppressed the combustion temperature. When the starts of energizing timing were BTDC 15deg and BTDC 05deg, and the water vapor portions were 10% and 20%, the ISNO values were smaller than without the water vapor injection. The reason is that the cylinder temperature was reduced before ignition by the latent heat of vaporization, because a lot of water particles in the cylinder had enough time to evaporate, unlike the case with teng = BTDC 25deg. As a result, combustion performance was deteriorated by the low cylinder temperature, as shown in Figure 8b,c, so a small amount of NO was generated.
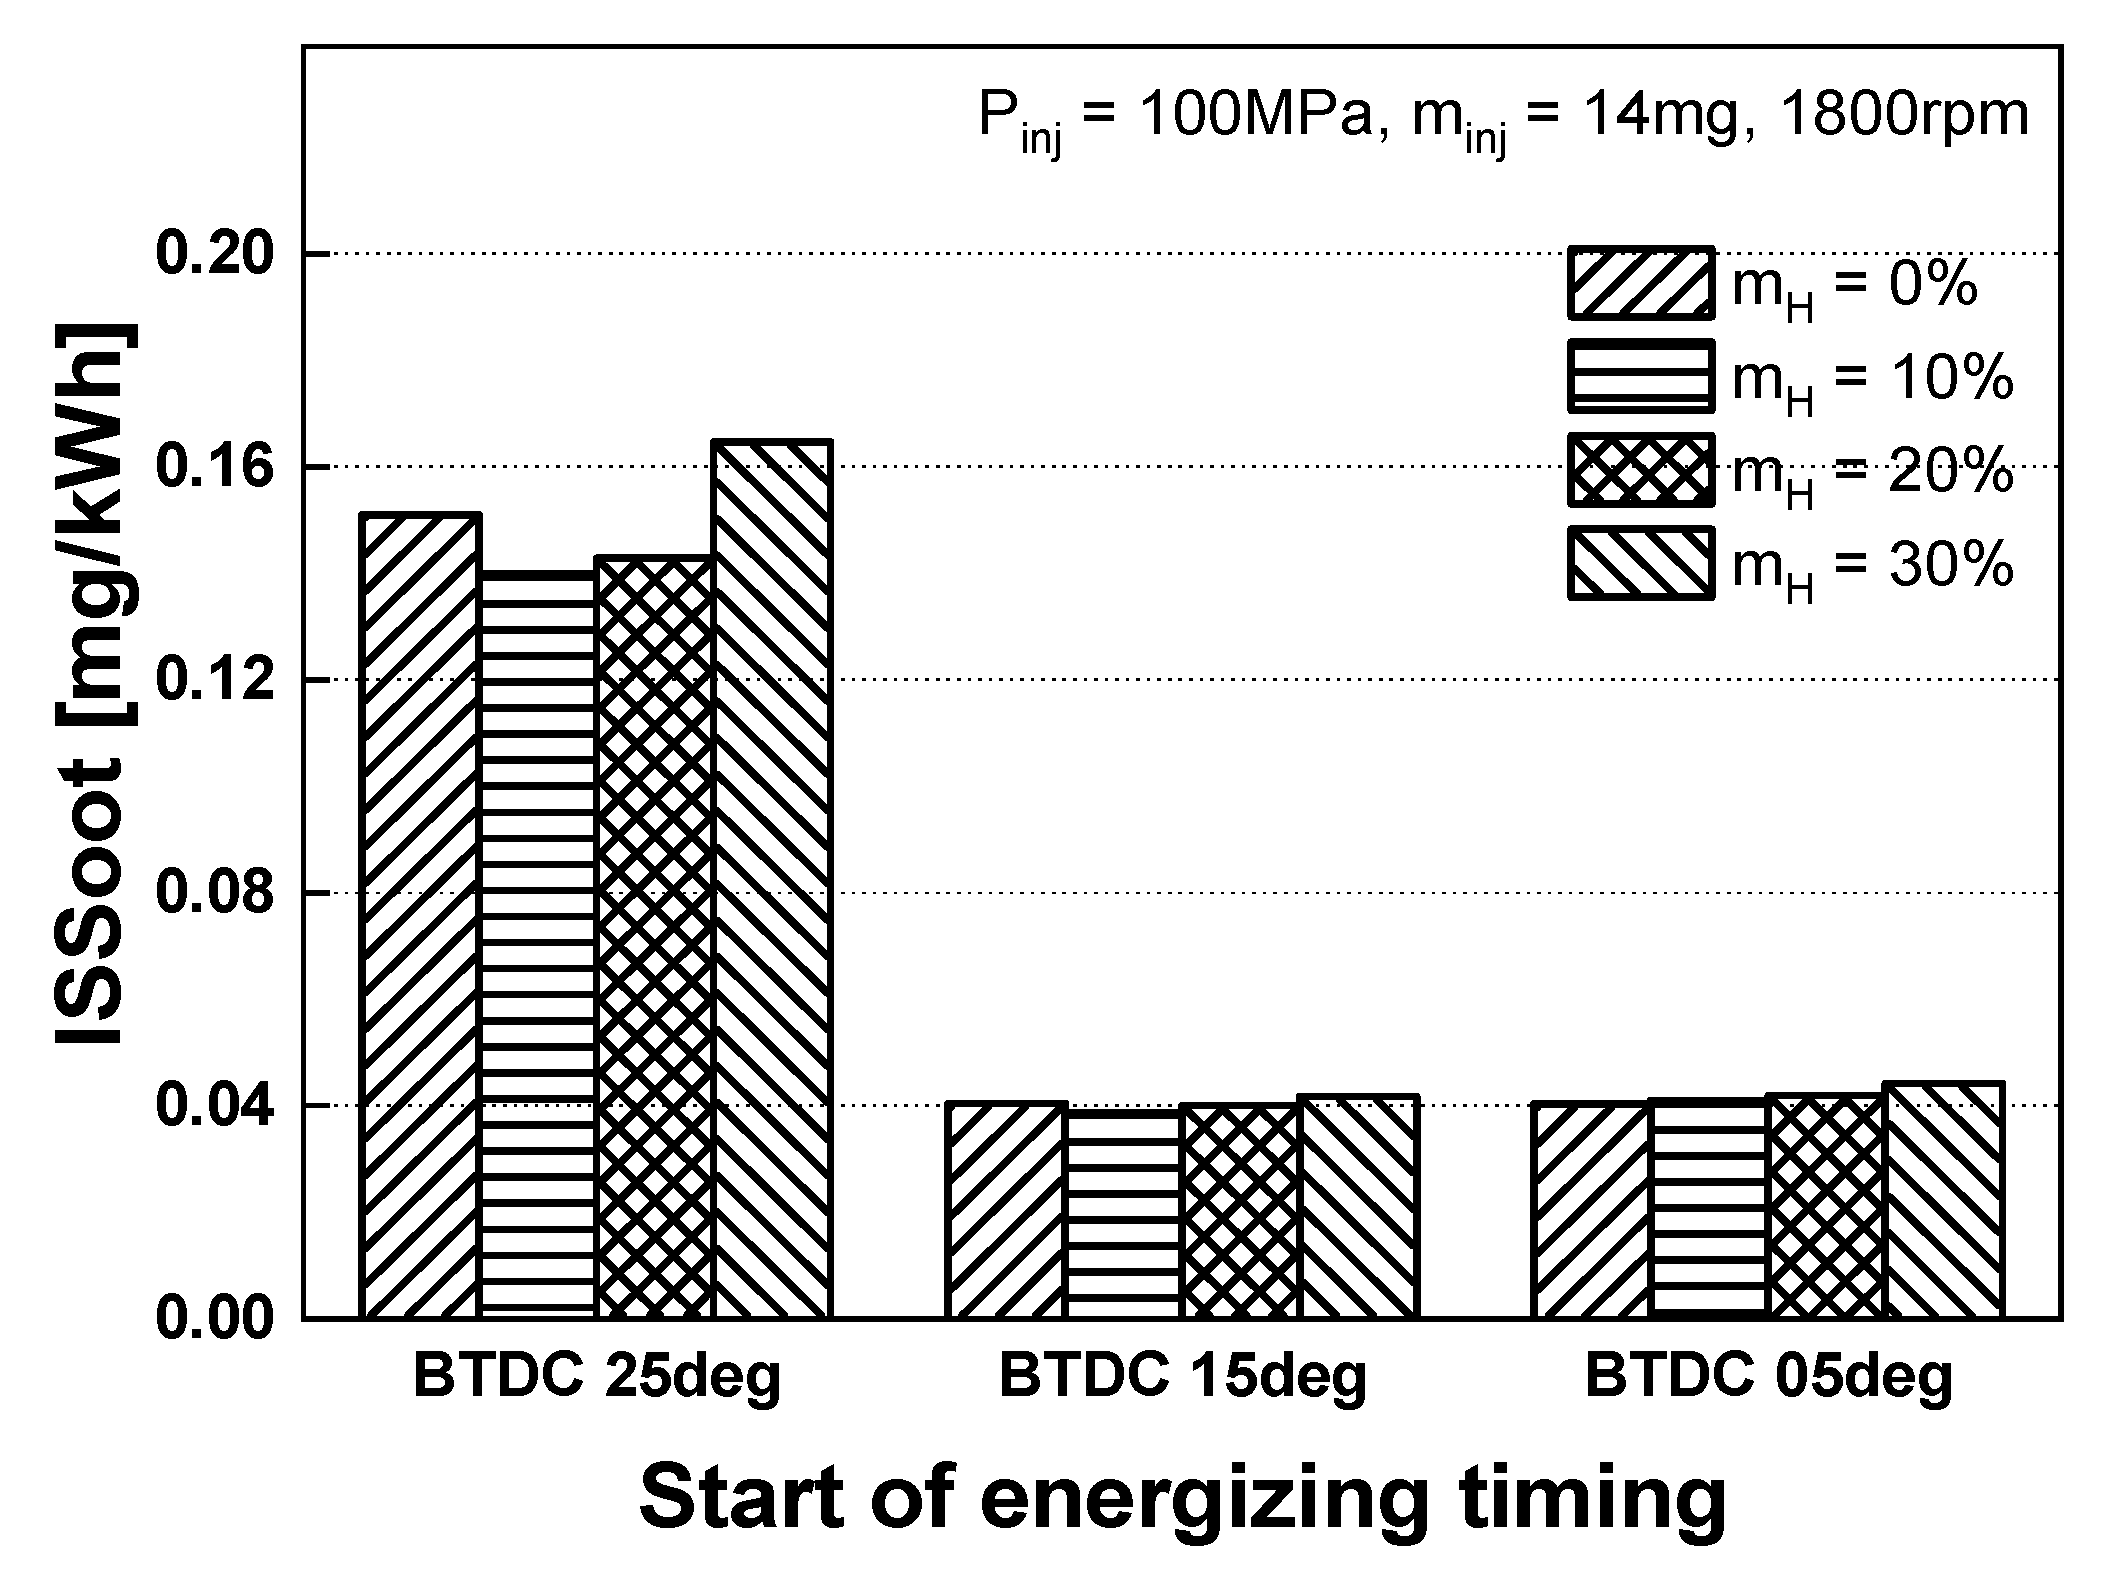
Figure 10 shows the effect of water vapor portion on the ISSoot value under different starts for energizing timing. When the start of energizing timing was BTDC 25deg, the ISSoot value was the highest because some of the injected fuel was introduced into the squish volume by early injection timing. It formed the soot, and the formed soot didn’t oxidize, due to the small amount of oxygen in the squish volume.
When the start of energizing timing was BTDC 25deg, the ISSoot value for mH = 10% reached the lowest value, because numerous collisions occurred between the remaining water particles and the injected fuel. The suppression of combustion temperature was smaller than in other cases because it had the smallest water vapor portion. Furthermore, when the starts of energizing timing were BTDC 15deg and BTDC 05deg, differences in ISSoot values were difficult to observe because, as mentioned in Figure 5a, the area of rich equivalence ratio was distributed in the center of the cylinder, and it formed a relatively homogeneous air–fuel mixture, which suppressed soot generation. As a result, although the oxidation reaction of soot was deteriorated by the low cylinder temperature after introducing the water vapor, all cases had similar ISSoot values because of the small amount of soot generation.

3.5. Effect of Water Vapor Portion on the ISFC Characteristics

The effect of the water vapor portion on the ISFC (indicated specific fuel consumption) value under different starts for energizing timing is shown in Figure 11. For teng = BTDC 25deg and BTDC 15deg, the ISFC values decreased as much as 2.5% with the increasing water vapor portion, because the peak cylinder pressure occurred after TDC (top dead center), which reduced compression loss. However, for teng = BTDC 05deg, the ISFC value without water particle injection had the lowest value. The ignition delay became too long when water particles were injected into the cylinder because of lowered cylinder temperature, which decreased the cylinder pressure, as shown in Figure 8.
To find the best conditions to improve the performance of the small CI engine, the effect of water vapor portion on the ISNO versus ISFC was examined under different starts of energizing timing, as shown in Figure 12. It was found that the ISFC value and ISNO value tended to decrease with increasing amounts of injected water vapor. In addition, when the start of energizing timing was BTDC 05deg, it had the lowest ISFC value, and when the portion of water vapor was 30%, the ISNO value was the lowest. Therefore, considering these results, the best condition was determined to be teng = BTDC 05deg and mH = 30%. Based on these results, it was concluded that injecting water vapor into the intake port of a CI engine can improve combustion performance and reduce NO emissions.

4. Conclusions

This study investigated the effect of injecting water vapor into the intake port of a small CI engine and analyzed the effects of collisions between the water particle and the injected fuel on the combustion and exhaust-emission performance improvement. The following conclusions were obtained from this study.
  • Without the water vapor injection, the area of rich equivalence ratio was distributed around the piston-rim region; however, with the water vapor injection, the area of rich equivalence ratio was more widely distributed in the center of cylinder, because the injected fuel collided with the remaining water particles.
  • The ISNO value with water vapor injection was decreased up to 46% than without water vapor injection, because the combustion temperature was suppressed by the high specific heat and vaporization latent heat of water introduced into the cylinder.
  • The difference of ISSoot values with or without the water vapor injection was difficult to observe because a small amount of soot was formed, although the oxidation reaction of soot with water vapor injection had deteriorated.
  • In the cases of teng = BTDC 25deg and BTDC 15deg, the ISFC values decreased with the increasing water vapor portion, because the peak cylinder pressure occurred after TDC, which reduced the compression loss.
  • In the case of teng = BTDC 05deg, the ISFC values were increased by increasing the water vapor portion, because the ignition delay was too long, which deteriorated combustion performance.
  • From these results, injecting water vapor into the intake port of a CI engine can be expected to reduce ISNO by up to 46% than without injecting water vapor, while producing a similar ISSoot value as the conventional method.

Author Contributions

Conceptualization, S.H.M., H.K.S.; Formal analysis, S.H.M.; Funding acquisition, H.K.S.; Investigation, S.H.M., H.K.S.; Methodology, S.H.M.; Project administration, H.K.S.; Software, S.H.M.; Supervision, H.K.S.; Validation, S.H.M.; Visualization, S.H.M.; Writing—original draft, S.H.M., H.K.S.; Writing—review & editing, S.H.M., H.K.S.

Funding

This research received no external funding.

Acknowledgments

This research was supported by the Basic Science Research Program through the National Research Foundation of Korea (NRF), funded by the Ministry of Science, ICT & Future Planning (NRF-2017R1D1A3B03032337).

Conflicts of Interest

The authors declare no conflicts of interest.

References

  1. Han, D.S.; Lee, B.H.; Bae, M.J.; Chang, Y.J.; Jeon, C.H.; Song, J.H. A Numerical Study on the Spray Characteristic of a Marine Diesel Engine of Injection Spray Angle and Hole Diameter. In Proceedings of the Trans. Korean Soc. Mech. Eng. Spring Conference, Jeongseon, Korea, 23–25 April 2008; pp. 572–577. [Google Scholar]
  2. Su, L.W.; Li, X.R.; Zhang, Z.; Liu, F.S. Numerical Analysis on the Combustion and Emission Characteristics of Forced Swirl Combustion System for DI Diesel Engines. J. Energy Convers. Manag. 2014, 86, 20–27. [Google Scholar] [CrossRef]
  3. Gafoor, A.; Gupta, R. Numerical Investigation of Piston Bowl Geometry and Swirl Ratio on Emission from Diesel Engines. J. Energy Convers. Manag. 2015, 101, 541–551. [Google Scholar] [CrossRef]
  4. Min, S.H.; Suh, H.K. The Effect of Nozzle Hole Geometry on the Small CI Engine Performances. In Proceedings of the ICAT Conference, Gwangju, Korea, 7–8 July 2016; p. 322. [Google Scholar]
  5. Park, S.W.; Reitz, R.D. A gas jet superposition model for CFD modeling of group-hole nozzle sprays. Int. J. Heat Fluid Flow 2009, 30, 1193–1201. [Google Scholar] [CrossRef]
  6. Hountalas, D.T.; Mavropoulos, G.C.; Binder, K.B. Effect of exhaust gas recirculation (EGR) temperature for various EGR rates on heavy duty DI diesel engine performance and emissions. J. Energy 2008, 30, 272–283. [Google Scholar] [CrossRef]
  7. Park, Y.S.; Bae, C.S. Experimental study on the effects of high/low pressure EGR proportion in a passenger car diesel engine. J. Appl. Energy 2014, 133, 308–316. [Google Scholar] [CrossRef]
  8. Han, M.B. The Effect of Cetane Number on Exhaust Emissions in Low-temperature Diesel Combustion. Trans. KSAE 2011, 19, 17–22. [Google Scholar]
  9. Wei, M.R.; Nguyen, T.S.; Turkson, R.F.; Liu, J.P. Water injection for higher engine performance and lower emissions. J. Energy Inst. 2017, 90, 285–299. [Google Scholar]
  10. Stanglmaier, R.H.; Dingle, P.J.; Stewart, D.W. Cycle-controlled water injection for steady-state and transient emissions reduction from a heavy-duty diesel engine. J. Eng. Gas Turbine Power 2008, 130, 3. [Google Scholar] [CrossRef]
  11. Park, S.K.; Woo, S.C.; Kim, H.I.; Lee, K.H. The characteristic of spray using diesel water emulsified fuel in a diesel engine. J. Appl. Energy 2016, 176, 209–220. [Google Scholar] [CrossRef]
  12. Chen, Z.B.; Wang, X.C.; Pei, Y.Q.A.; Zhang, C.L.; Xiao, M.W.; He, J.G. Experimental investigation of the performance and emissions of diesel engines by a novel emulsified diesel fuel. J. Energy Convers. Manag. 2015, 95, 334–341. [Google Scholar] [CrossRef]
  13. Ma, X.K.; Zhang, F.J.; Han, K.; Zhu, Z.X.; Liu, Y.Y. Effects of Intake Manifold Water Injection on Combustion and Emissions of Diesel Engine. J. Energy Procedia 2014, 61, 777–781. [Google Scholar] [CrossRef] [Green Version]
  14. Kokkulunk, G.K.; Gonca, G.V.; Ayhan, V.Z.; Cesur, I.; Parlak, A. Theoretical and experimental investigation of diesel engine with steam injection system on performance and emission parameters. J. Appl. Therm. Eng. 2013, 54, 161–170. [Google Scholar] [CrossRef]
  15. Xavier, T.; Alain, M.; Samiur, R.S. Experimental study of inlet manifold water injection on combustion and emissions of an automotive direct injection Diesel engine. J. Energy 2010, 35, 3628–3639. [Google Scholar]
  16. Min, S.H.; Suh, H.K. Reduction of NOX Emission in a CI Engine by using Specific Heat of H2O. In Proceedings of the Transactions of KSAE Spring Conference, Cheonan, Korea, 2 June 2017; pp. 70–72. [Google Scholar]
  17. AVL List GmbH. Fire Version 2013 ESE-Diesel (Engine Simulation Environment) Module Manual; AVL: Graz, Austria, 28 February 2013. [Google Scholar]
  18. AVL GmbH. Fire Version 2013 Combustion Module Manual; AVL: Graz, Austria, 30 September 2012. [Google Scholar]
  19. Liu, A.B.; Reitz, R.D. Modeling the Effects of Drop Drag and Breakup on Fuel Sprays. SAE Trans. J. Engines 1993, 102, 83–95. [Google Scholar]
  20. AVL List GmbH. Fire Version 2013.2 Spray Module Manual; AVL: Graz, Austria, 30 September 2014. [Google Scholar]
  21. Bosch, W. The Fuel Rate Indicator: A New Measuring Instrument for Display of the Characteristics of Individual Injection; SAE 1966 Transactions Vol. 75-A, 1966, SAE 660749; SAE International: Warrendale, PA, USA, 1966. [Google Scholar]
  22. Turns, S. An Introduction to Combustion: Concepts and Applications, 3rd ed.; McGraw-Hill, Inc.: New York, NY, USA, 2012. [Google Scholar]
  23. Cengel, Y.A.; Boles, M.A. Thermodynamics an Engineering Approach, 17th ed.; McGraw-Hill, Inc.: New York, NY, USA, 2011. [Google Scholar]
Figure 1. Test engine with water vapor injection system. (a) Schematic of experimental setup and (b) experimental apparatus.
Energies 12 04248 g001
Figure 2. Geometry of combustion chamber at top dead center (TDC).
Energies 12 04248 g002
Figure 3. Reliability validation of numerical analysis with experimental results without water vapor injection. (a) Cylinder pressure and rate of heat release (ROHR); and (b) exhaust emissions. Pinj = 100 MPa, minj = 14 mg, teng = BTDC (before top dead center) 15deg, mH = 0 mg, 1800 rpm.
Energies 12 04248 g003
Figure 4. Reliability validation of numerical analysis with experimental results with water vapor injection. (a) Cylinder pressure and ROHR; and (b) exhaust emissions. Pinj = 100 MPa, minj = 14 mg, teng = BTDC 15deg, mH = 1.11 mg, 1800 rpm.
Energies 12 04248 g004
Figure 5. Effect of water vapor portion on the distributions of equivalence ratio, NO mass fraction, cylinder temperature, and soot mass fraction. (a) Equivalence ratio; (b) NO mass fraction; (c) cylinder temperature; and (d) soot mass fraction. Pinj = 100 MPa, minj = 14 mg, teng = BTDC 15deg, 1800 rpm.
Energies 12 04248 g005
Figure 6. Effect of water vapor portion on the Sauter mean diameter (SMD). Pinj = 100 MPa, minj = 14 mg, teng = BTDC 15deg, 1800 rpm.
Energies 12 04248 g006
Figure 7. Effect of water vapor portion on the overall soot mass fraction. Pinj = 100 MPa, minj = 14 mg, teng = BTDC 15deg, 1800 rpm.
Energies 12 04248 g007
Figure 8. Effect of water vapor portion on the cylinder pressure and ROHR under different starts for energizing timing (Pinj = 100 MPa, minj = 14 mg, 1800 rpm): (a) teng = BTDC 25deg; (b) teng = BTDC 15deg; and (c) teng = BTDC 05deg.
Energies 12 04248 g008aEnergies 12 04248 g008b
Figure 9. Effect of water vapor portion on the ISNO characteristics under different starts for energizing timing (Pinj = 100 MPa, minj = 14 mg, 1800 rpm). (a) ISNO characteristics and (b) rate of ISNO change.
Energies 12 04248 g009
Figure 10. Effect of water vapor portion on the indicated specific soot (ISSoot) characteristics under different start of energizing timing (Pinj = 100 MPa, minj = 14 mg, 1800 rpm).
Energies 12 04248 g010
Figure 11. Effect of vapor portion on the ISFC characteristic under different starts of energizing timing (Pinj = 100 MPa, minj = 14 mg, 1800 rpm).
Energies 12 04248 g011
Figure 12. Effect of water vapor portion on the ISNO versus ISFC under different starts for energizing timing (Pinj = 100 MPa, minj = 14 mg, 1800 rpm).
Energies 12 04248 g012
Table 1. Specifications of test engine and test nozzle.
ItemSpecification
EngineBore × Stoke83 mm × 92 mm
Displacement498 cc
Compression ratio17.7
InjectorNozzle5 hole mini-sac type
Hole diameter0.168 mm
Injection angle154deg
Table 2. Specifications of emission bench (MAXA 9100D-EGR, HORIBA) and condensation particle counter (CPC, 3772, TSI).
Emission Measuring DeviceItemExplanation
MAXA 9100D-EGR
(NOX)
MethodCLD (CLA-150)
Range0~10,000 ppm
Linearity±1.0% of full scale
Response±1.0% of full scale
CPC 3772Theoretical size range7.23~710.5
Dilution ratio110:1
Heating temperature190 °C
Table 3. Sub-model for numerical analysis [16,17,18].
PhenomenonModel
Turbulencek-zeta-f
Break-upWave
EvaporatingMulti-component
Wall interactionWalljet1
CombustionECFM-3Z
NOExtended Zel’dovich
SootKennedy-Hiroyasu-Magnussen
Table 4. Detailed numerical analysis conditions.
RPM1800
Injection pressure [MPa]100
Injection mass [mg]14
Start of energizing timing [ATDC deg]−20, −15, −10, −5
Water vapor portion [%]10, 20, 30