Abstract
In tight oil reservoirs, water imbibition is the key mechanism to improve oil production during shut-in operations. However, the complex microstructure and composition of minerals complicate the interpretation of oil migration during water imbibition. In this study, nuclear magnetic resonance (NMR) T2 spectra was used to monitor the oil migration dynamics in tight oil reservoirs. The factors influencing pore size distribution, micro-fractures, and clay minerals were systematically investigated. The results show that the small pores corresponded to a larger capillary pressure and a stronger imbibition capacity, expelling the oil into the large pores. The small pores had a more effective oil recovery than the large pores. As the soaking time increases, the water preferentially entered the natural micro-fractures, expelling the oil in the micro-fractures. Subsequently, the oil in the small pores was slowly expelled. Compared with the matrix pores, natural micro-fractures had a smaller flow resistance and were more conducive to water and oil flow. Clay minerals may have induced micro-fracture propagation, which can act as the oil migration channels during water imbibition. In contrary to the inhibitory effect of natural micro-fractures, the new micro-fractures could contribute to the oil migration from small pores into large pores. This study characterized the oil migration characteristics and provides new insight into tight oil production.
1. Introduction
As a key unconventional energy, tight oil has received increased attention by many scholars and has gradually become another research topic following shale gas [1]. The commercial exploitation of tight oil has greatly affected the energy structure of the world, especially North America [2,3]. A tight oil reservoir is characterized by low permeability (<0.1 mD), low porosity (<10%), and micro/nano pores. Currently, multistage hydraulic fracturing is the key technology for commercial exploitation. This technology can induce complex fracture networks by injecting large-scale fracturing fluid into the formation, thus increasing the reservoir’s exposed area and improving oil production [4]. After hydraulic fracturing stimulation, shut in operations for a period are beneficial to the production increase of tight oil. Extended shut in time can promote fracturing fluid imbibition into reservoirs to displace crude oil and has been proven to be effective for enhanced oil recovery [1].
In tight oil reservoirs, complex imbibition characteristics result in the uncertainties of appropriate shut-in operations. Lan et al. (2014) [5] conducted a series of spontaneous imbibition experiments to establish dimensionless time model and calculate shut-in time. However, a dimensionless time model cannot involve the effects of pore structure and clay minerals and is not suitable for tight oil reservoirs. Jiang et al. (2018) [6] considered that the water imbibition is generated under confining pressure and carries out a large number of forced imbibition experiments by means of nuclear magnetic resonance (NMR). A modified model of dimensionless time was established by considering the relationship between pore radius and confining pressure [7,8]. Field studies found that not all tight oil wells are suitable for shut-in operation and extending the shut-in time may intensify the damage of the fracturing fluid to the reservoirs, which was not conducive to oil production [9]. Understanding the imbibition characteristics and relevant influencing factors (e.g., complex microstructure and minerals) contributes to conduct-appropriate shut-in operations.
Understanding water imbibition into matrix pores is the key for clarifying microscopic physical mechanism during the shut-in periods. Many published studies have focused on shale, tight sandstone and volcanic rock reservoirs [10,11]. The capillary pressure caused by interfacial tension and the osmotic pressure induced by water activity difference are the main forces that imbibe water into matrix pores. Capillary pressure is inversely proportional to pore radius. Micro/nano pores may result in an ultra-high capillary pressure to imbibe the fracturing fluid [12,13]. The capillary pressure also increases pore pressure within the matrix pores, triggering the propagation of tensile fractures [14,15]. In addition, tight reservoirs have a more complex pore structure than conventional reservoirs, leading to complex imbibition behaviors. Hu et al. (2012) [16] performed imbibition experiments on Barnett shale and found the imbibition behavior to present low pore connectivity. The existence of micro-fractures and bedding planes can enhance the imbibition rate of fracturing fluid. For clay-rich rock, the water imbibition of osmotic pressure is much stronger than that of the capillary pressure, which may result in micro-fracture propagation to increase the imbibition rate [17]. Xu et al. (2018) [1] found that the current imbibition tests were carried out under the atmospheric pressure without considering the effect of forced pressure. Based on low-field nuclear magnetic resonance, a large number of forced imbibition experiments have been conducted on tight sandstone to clarify the imbibition characteristics and influencing factors.
At present, the fracturing fluid imbibition involves physical and chemical process that are not well understood in the tight reservoirs. Oil migration among the multiscale pore structure and the effects of clay minerals on oil migration still need further study. In this study, a large number of imbibition experiments were conducted and the NMR T2 spectra was used to monitor oil migration dynamics. The imbibition oil recovery of different diameters pores was studied and the effects of pore size distribution, micro-fractures, and clay minerals were analyzed.
2. Experimental Materials and Methods
2.1. Rock Samples and Fluids
The tight reservoirs samples were taken from Ordos Basin, Songliao Basin and Junggar Basin, which are the greatest potential reservoirs for tight oil production in China. Considering that these formations are characterized by a different pore structure and mineral composition, this study can present the oil migration characteristics influenced by microstructure and minerals. The core plugs of 2–5 cm in length and 2.5 cm in diameter were drilled from larger core materials. The end faces of the plugs were cut by a line cutting machine. The X-ray diffraction test for mineral composition was performed on the rock fragments collected from the drilling process. After removing residual oil from the core plugs, the porosity and permeability measurement was conducted on the core plugs.
Table 1 presents the basic properties of tight reservoirs samples that involve source, size, porosity and permeability. The porosity of the samples was measured by a helium porosimeter and ranged from 2.7% to 9.2%. It showed that tight oil reservoirs have the low porosity properties. According to the measurement method of Brace et al. (1968) [18], the pulse-decay permeability was determined under the condition of confining pressure (8 MPa), pore pressure (5 MPa) and room temperature (25 °C). The permeability of samples is not corrected by Klinbenberg effects. In contrary to the porosity, the permeability of samples was significantly different, ranging from 0.0053 to 0.24 mD. The different permeability characteristics may result in the existence of micro-fractures that can connect the matrix pores and increase the permeability.

Table 1.
The physical properties of tight reservoirs samples.
The results of the mineral composition are presented in Table 2. The formation of UC7 and LC7 was mainly composed of quartz and feldspar. The content of clay minerals was lower than 16%. Therefore, clay expansion was not considered during water imbibition. The UC7 and LC7 formation samples were used to study the effects of pore size distribution and micro-fractures on oil migration. The content of the clay minerals was larger than 20% in the formation of QT and WEH. The water absorption of clay minerals may change the pore structure. A moderate content of clay minerals (20.5–30.2%) may induce micro-fracture propagation to relieve the reservoir damage and the high content of clay minerals (36.8%) may destroy matrix pores to aggravate the reservoir damage. The QT and WEH formations were used to study for the pore structure change due to clay minerals and their effects on oil migration. In addition, the samples are not organic-rich and the TOC measurement are not conducted.
Table 2.
The results of the mineral composition analysis.
The experimental fluids included deionized water, MnCl2 solution and kerosene. The basic properties of density, viscosity and surface tension are shown in Table 3. The deionized water was prepared for chemical solutions of MnCl2. The NMR signal of hydrogen atom decreased significantly with the MnCl2 solution concentration, and the high concentration of MnCl2 solution did not have the NMR signal [11]. During the imbibition experiments, an MnCl2 solution of 15 wt.% was used as the wetting fluid to displace the non-wetting fluid. The non-wetting fluid was kerosene instead of crude oil.
Table 3.
The basic properties of the experimental fluid (25 °C).
2.2. Experimental Apparatus
The experimental device for sample mass determination was a Mettler Toledo balance (ME204E, Mettler Toledo, Shanghai, China) with an accuracy of 0.0001 g, as shown in Figure 1a. The volume of the imbibition water and the expelled oil was estimated by sample mass change and the density difference between oil and water. The NMR device (MinNMR, Niumag Analytical Instrument Corporation, Suzhou, China) is shown in Figure 1b. NMR is a non-destructive test method, and the T2 spectra can well reflect the pore structure and fluid distribution characteristics. The higher the T2 value, the larger the pore size of the fluid concentration. The T2 spectra amplitude is positively related to fluid volume in the certain aperture pores. By measuring the changes of T2 spectra amplitude during the imbibition process, it is possible to understand the oil and water migration characteristics due to capillary pressure imbibition.
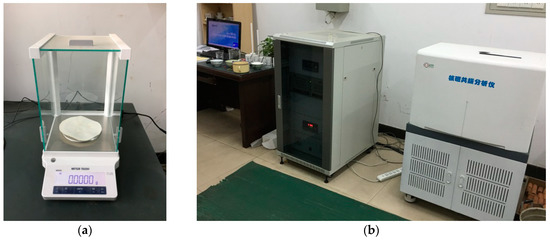
Figure 1.
The apparatus for water imbibition experiment: (a) analytical balance, (b) NMR device (MiniMR-VTP).
The setting parameters during the NMR test had a large influence on the test results. For the different reservoir rocks, the test coefficients needed to be determined. In general, the NMR test had four test coefficients: waiting time (RD), echo time interval (TE), signal superposition times (SCANS), and echo numbers (NECH). If the RD is too short, the large aperture signals would be lost. On the other hand, if the RD is too long, the measurement time significantly increases. In conventional sandstone, RD > 3000 ms is appropriate. As for tight sandstones, RD > 8000 ms is suitable. Similarly, the large values of NECH and SCANS can improve the test accuracy, but they also can increase the test time. In this study, the values of NECH and SCANS were set to 2048 and 64 respectively. In addition, the TE was set to 0.3 ms, which is the minimum value of low-field NMR equipment, which contributes to the recognition of micro-pores. The intensity of the magnetic field was about 0.3 ± 0.05 T.
2.3. Experimental Procedure
During the imbibition experiments, the NMR T2 spectra as a function of time was measured and oil recovery of different-scale pores was comparatively analyzed. The experimental process is presented as follows:
- (1)
- Before the experiments, the tight reservoirs samples should be cleaned to remove the residual oil. The cleaning solvent are mixture of toluene and ethyl ether, and the process lasts about one month.
- (2)
- The samples were placed in a saturating device and evacuated for 2 to 3 h to remove air. Then, the kerosene was injected under a 20 MPa pressure. The saturation process lasted for 72 h to fill the samples fully with kerosene.
- (3)
- The samples were taken out and the mass and size of the samples were measured. They were immersed in the MnCl2 solution. After a period of time, the masses of the samples were measured and the T2 spectra was tested using NMR apparatus.
- (4)
- Step (3) was repeated, and the T2 spectra variation was drawn over soaking time.
The schematic diagram of the experimental procedure is shown in Figure 2.
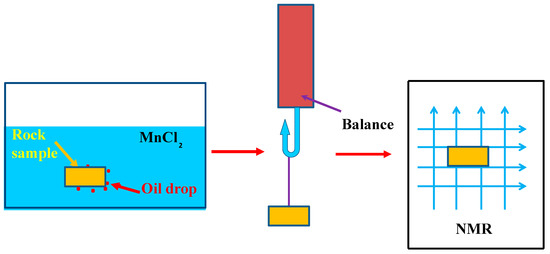
Figure 2.
The schematic diagram of the experimental procedure.
3. Experimental Results and Discussions
3.1. Effects of Pore Size Distribution on Oil Migration
The water entered into matrix pores due to the capillary pressure and the oil droplet was gradually expelled to adhere to the surface of the sample. As the volume of the oil droplets was relatively small, the droplets tended to be more evenly distributed on the sample surface, as shown in Figure 3. As for the tight reservoirs, the capillary imbibition can spontaneously displace the oil in the pores, which contributes to the tight oil production. Figure 4 shows the T2 spectra changes of UC7-1 and LC7-1 over time. As Figure 4 shows, the UC7-1 and LC7-1 had the same T2 spectra characteristics. In the initial stage of imbibition, the water preferentially enters into the small pores to displace the oil, causing a rapid decline of oil saturation.
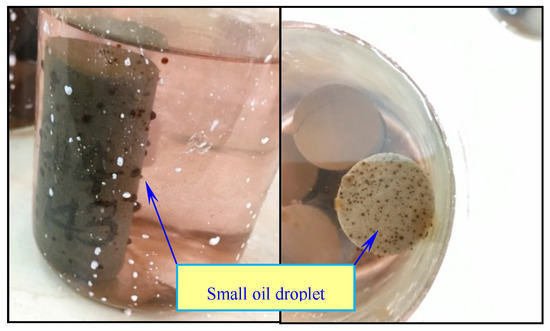
Figure 3.
The small oil droplet displaced by water in UC7-1 samples.
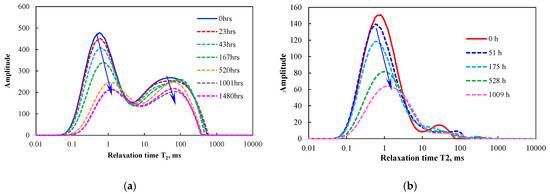
Figure 4.
The T2 spectra vs soaking time in UC7-1 and LC7-1 samples: (a) UC7-1 and (b) LC7-1.
When the soaking time exceeded 520 h, the T2 spectra area did not change substantially, indicating that the residual oil in the pores could not be expelled only by capillary pressure (Figure 4). The oil saturation was no longer reduced and the imbibition process ended to some extent. In addition, the samples UC7-1 and LC7-1 have different pore size distribution characteristics. The sample of UC7-1 has a dual-peak distribution with a range of 0.06 to 5 ms for the left peak and 5 to 600 ms for the right peak. The sample LC7-1 has a single peak distribution with a range of 0.06–10 ms. Thus, the permeability (0.0062 mD) of LC7-1 is much smaller than that of UC7-1 (0.24 mD). At a soaking time of 520 h, the imbibition oil recovery of UC7-1 was about 34.2%, and that of LC7-1 was about 35.7%. The sample LC7-1 had a slightly larger imbibition oil recovery than UC7-1.
According to the T2 relaxation time of Meng et al. (2016) [19], the tight rock pores were divided into micro-pores (<1 ms), small pores (1–10 ms), largish pores (10–100 ms) and large pores (>100 ms). The largish pores and large pores included micro-fractures and matrix pores. Figure 5 presents oil recovery in different diameter pores. The oil recovery of the micro-pores was larger than 70%, that of small pores and largish pores was much lower than 30% and that of largish pores was about 40%. Unexpectedly, the smaller pores did not have a much larger imbibition oil recovery.
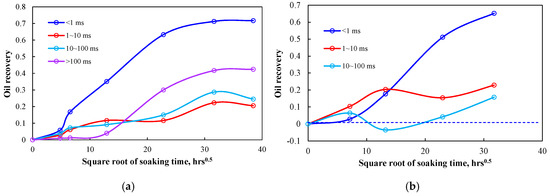
Figure 5.
Oil recovery in different diameter pores: (a) UC7-1 and (b) LC7-1.
In Figure 5a, the oil in micro-pores began to decrease at 0 h, but the oil in large pores began to decrease at 100 h. The water preferentially enters the micro-pores under the capillary pressure and the oil drop displaced by water enters the large pores. Figure 6 presents the schematic diagram of oil migration among the different pores. The smaller pores correspond to a larger capillary pressure and a stronger imbibition capacity. Therefore, the oil of micro-pores tended to migrate into small and largish pores and that of small and largish pores tends to migrate into large pores. The small and largish pores act as bridges to connect the micro-pores and large pores.
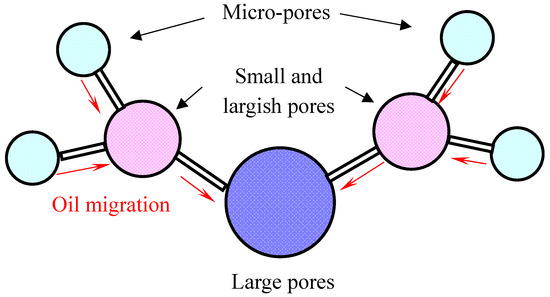
Figure 6.
The schematic diagram of oil migration among the different pores.
3.2. Effects of Natural Fractures on Oil Migration
The UC7-2 samples contained many micro-fractures that were visible to the naked eye. They were in the direction of bedding planes. Microscopic observation shows that the crack width was about 100–350 μm (Figure 7b). Figure 8 shows the NMR imaging at a soaking time of 0 h and 59 h. The water imbibition experiments on UC7-2 can help understand the effects of natural fractures on oil migration.
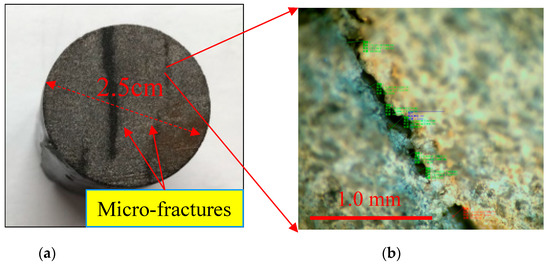
Figure 7.
The micro-fractures on the sample surface: (a) naked eye observation and (b) microscopic observation.
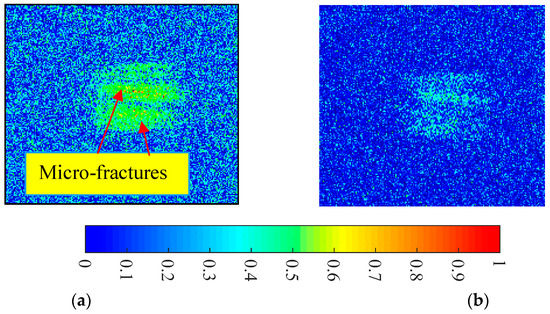
Figure 8.
NMR imaging: (a) 0 h and (b) 59 h. The color bar can reflect oil saturation.
Figure 9 shows the relationship between T2 spectra and soaking time. The distribution range of fractures corresponds to >10 ms, which involves largish pores and large pores. The sample LC7-2 contained a small amount of micro-fractures that were speculated by T2 spectra. The samples of UC7-2 and LC7-2 were embedded by micro-fractures and characterized by different oil migration features. The amplitude decline velocity of largish pores and large pores was larger than that of micro-pores. Compared with the micro-pores, the micro-fractures were the dominant channels for oil migration. According to the NMR imaging shown in Figure 8, a large amount of oil exited in the micro-fractures. As the soaking time increased, the water preferentially entered the natural micro-fractures, expelling the oil in the micro-fractures. Subsequently, the oil in the small pores was slowly expelled. When the soaking time was 500 h, the imbibition oil recovery of sample UC7-2 and LC7-2 were about 36.6% and 34.1% respectively. Sample UC7-2 had more micro-fractures that were beneficial to imbibition oil recovery to some extent.
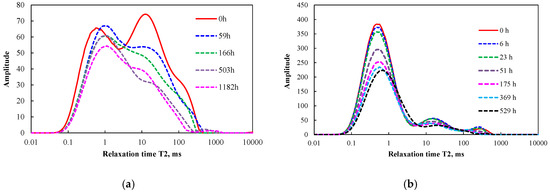
Figure 9.
The T2 spectra vs soaking time in UC7-2 and LC7-2 samples: (a) UC7-2 and (b) LC7-2.
Figure 10 presents the oil recovery in different diameter pores of UC7-2 and LC7-2. In the UC7-2, the oil recovery of micro-pores, small pores, largish pores and large pores was 32.1, 23.5, 55.2 and 82.7% respectively. In the LC7-2, the oil recovery of micro-pores, small pores, largish pores and large pores was 45.6, 1.5, 30.5 and 66.8% respectively. The oil recovery of large pores was much larger than that of micro-pores. Water preferentially enters the micro-fractures to expel the oil. The micro-pores oil recovery of UC7-2 and LC7-2 was much smaller than that of UC7-1 and LC7-1. Therefore, the existence of micro-fractures may hinder oil migration from micro-pores into large pores. This results in higher residual oil saturation in the micro-pores.
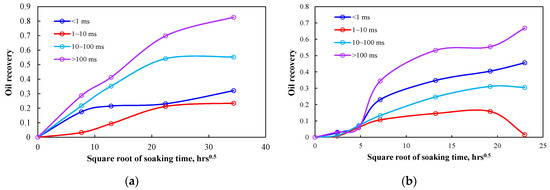
Figure 10.
Oil recovery in different diameter pores: (a) UC7-2 and (b) LC7-2.
3.3. Effects of Fracture Propagation on Oil Migration
The Figure 11 shows the observations of QT-1 before and after experiments. It can be seen that a large amount of oil droplets was precipitated, and the volume of the oil droplets significantly exceeded that of the sample UC7-1. Figure 12 presents the NMR images at different soaking times. Evidently, there was no fractures in the sample at the beginning of the experiment. When the soaking time exceeded 43 h, a large number of micro-fractures were generated on the surface of sample. The micro-fractures were not natural fractures and they were induced during the experiments. It should be noted that nuclear magnetic signals can only be detected when oil is contained in the micro-fractures. This suggests that a large amount of oil migrates into the micro-fractures during the process of micro-fracture propagation. The new fractures were in the direction of the formation bedding planes, which may result from the opening of bedding planes. The QT reservoir had a clay mineral content of about 23.7%, which formed a strong expansion stress to induce the fracture propagation after encountering water [11].
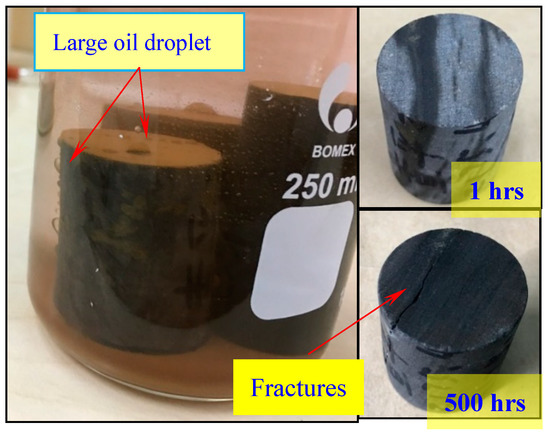
Figure 11.
The observations of QT-1 before and after experiments.
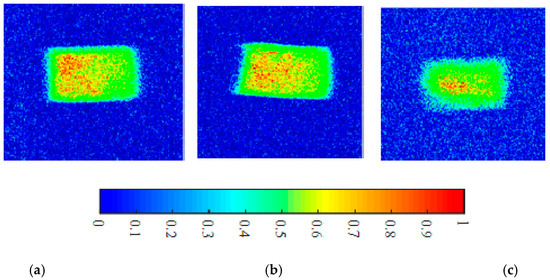
Figure 12.
The magnetic resonance imaging of QT-1 sample: (a) 0 h, (b) 6 h and (c) 23 h.
Figure 13 presents the curves of T2 spectra in the QT-1 and QT-2 samples. The T2 spectra of QT formation had single peak features and the T2 value ranged from 0.1 ms to 800 ms. It contained micro-pores, small pores, largish pores and large pores. As the soaking time increased, the total area of T2 spectra shows a downward trend, suggesting that the water was imbibed into matrix pores to expel the oil. The amplitude of pores corresponding to 5–50 ms decreased at the beginning, rose in the medium term, and fell in the later period. At the beginning, the oil in the pores was gradually displaced, resulting in a T2 amplitude drop. In the medium term, the clay mineral expansion induced a lot of micro-fractures and the oil gradually migrated into new micro-fractures, leading to a T2 amplitude rise. In the later period, the oil in the micro-fractures was expelled and the velocity of oil entry was larger than that of oil departure, causing the T2 amplitude to drop. The imbibition oil recovery of QT-1 and QT-2 was 44.3 and 32%, respectively.
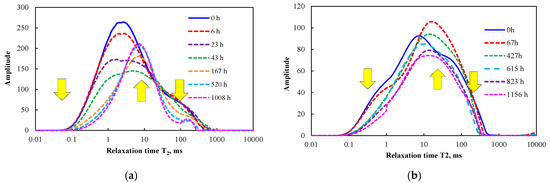
Figure 13.
The T2 spectra vs soaking time in QT-1 and QT-2 samples: (a) QT-1 and (b) QT-2.
Figure 14 presents the oil recovery in different diameter pores of the QT-1 and QT-2 samples. In the QT-1, the oil recovery of micro-pores, small pores, largish pores and large pores was 81.5, 35.4, 21.9 and 63.3% respectively. In the QT-2, the oil recovery of micro-pores, small pores, largish pores and large pores was 57, 27.3, 10.2 and 37.0% respectively. The oil recovery order of different diameters pores was micro-pores > large pores > small pores > largish pores. In addition, the oil recovery of largish pores and large pores descended below the zero at first and then increased above zero. The negative value of oil recovery suggests that the fractures propagated to form new space during water imbibition and oil gradually entered the new fractures to decrease the oil recovery factor. The new micro-fractures correspond to largish pores and large pores. Therefore, part of the oil in micro-pores and small pores may also have migrated into the largish pores and large pores.
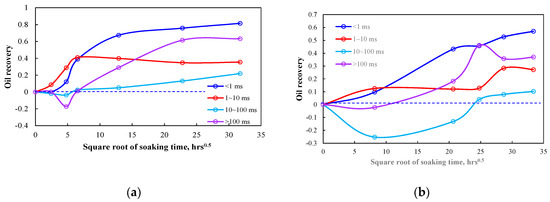
Figure 14.
Oil recovery in different diameter pores: (a) QT-1 and (b) QT-2.
3.4. Effects of Clay Mineral on Oil Migration
Figure 15 presents pictures of the samples before and after the imbibition experiments. At 1 h, the samples began to expand and the consolidated strength of samples decreased. At 60 h, the samples had broken into grains, resulting in the interruption of the imbibition experiments. This can be explained by an abundance of clay minerals in WEH formation.
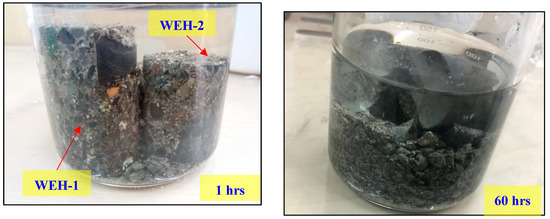
Figure 15.
The surface change of the WEH-1 and WEH-2 samples with the soaking time.
Figure 16 presents the change of T2 spectra during water imbibition. The T2 spectra of WEH-1 had single peak features and that of WEH-2 had dual-peak features. The T2 spectra of WEH-1 and WEH-2 decreased gradually over the soaking time. When the soaking time exceeded 43 h, the samples turned into grains and imbibition experiments ends. The imbibition oil recovery of WEH-1 and WEH-2 was 37.5 and 47% respectively. The WEH-2 had larger oil recovery because of more micro-pores and small pores. To an extent, the imbibition oil recovery of WEH-1 and WEH-2 may be close to 100%. The pore structure of the samples completely disintegrated and all the oil trapped by matrix pores was released.
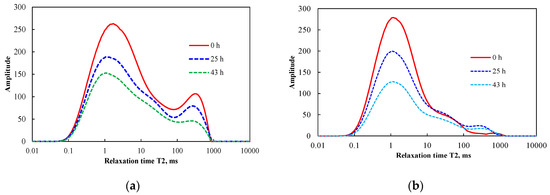
Figure 16.
The T2 spectra vs soaking time in WEH-1 and WEH-2 samples: (a) WEH-1 and (b) WEH-2.
Figure 17 shows the oil recovery in different diameter pores of the WEH-1 and WEH-2 samples. In the WEH-1, the oil recovery of micro-pores, small pores, largish pores and large pores was 33.3, 44.4, 31.4 and 54.0% respectively. The two peak features of WEH-1 suggest that it contained a large amount of micro-fractures. The WEH formation are tight conglomerate formation containing a large amount of gravels. These micro-fractures are well developed along the edge of gravels, which are gravel-edge fractures. The water was imbibed into gravel-edge fractures to displace the oil, resulting in larger oil recovery. In the WEH-2, the oil recovery of micro-pores, small pores, largish pores and large pores was 52.7, 53.1, 26.1, and −0.89% respectively. It did not contain the gravel-edge fractures, and the pores were the main channels for water imbibition. Therefore, the smaller pores had a larger oil recovery. The negative value of oil recovery in >100 ms pores suggests that the micro-fracture propagation and oil migration into new micro-fractures decreased the oil recovery during water imbibition.
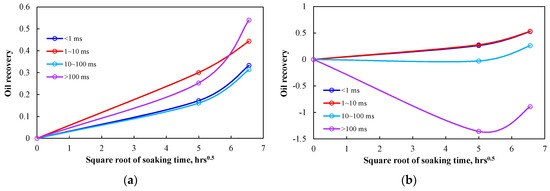
Figure 17.
Oil recovery in different diameter pores: (a) WEH-1 and (b) WEH-2.
3.5. Scaling the Imbibition Results of Different Reservoirs
The ratio of final spectra area to original spectra area is regarded as imbibition oil recovery. In order to study the influencing factors of imbibition oil recovery, the authors used the dimensionless time tD to scale the experimental results. According to Ma et al. (1997) [20], the dimensionless time tD is given by
where k is the rock permeability, is the fractional porosity of rock, t is the soaking time, is the interfacial tension, is the oil viscosity, is the water viscosity, and Ls is the characteristic length defined by Ma et al. (1997) [20] that involves the effects of sample shapes and boundary conditions.
During the imbibition experiments, the experimental fluids were MnCl2 solution and kerosene. Considering that all the experiments used the same fluids, the surface tension could be set to 45 mN/m, which is the surface tension of kerosene–water. This may not have had significant effects on the analytical results. Figure 18 shows the results of scaling the imbibtion results using the Ma’s model. The Ma’s dimensionless time tD did not function satisfactorily for all the different samples, indicating that it was not suitable for tight oil reservoirs. The mineral composition and pore structure were very different, and they were not scaled by this method. According to Akin et al. (2000) [21], the effects of these influncing factors on the imbibition rate can be studied based on the plots of imbibition oil recovery vs dimensionless time tD0.5 (Figure 18b). In Figure 18b, the different lines represent the different experimens of tight reservoirs samples. Despite of the marked differences in physical property, pore structure and mineral composition, similar trends are found in these curves. The relationship between oil recovery and dimensionless tD0.5 is close to a straight line. The slope of curves represents the imbibition rate that was affected by mineral composition and pore structure. According to Yang et al. (2016) [22], the slope of curves could be defined as a dimensionless imbibition rate, which suggests a stong imbibition potential for water. The imbibition process of tight reservoirs was very slow and need a long time for water front to arrive at the end or center of sample. Therefore, it was difficult to obtain the final oil recovery with the imbibition experiments. However, it can be speculated that the final imbibiton oil recovery was about 35–45% in tight oil reservoirs.
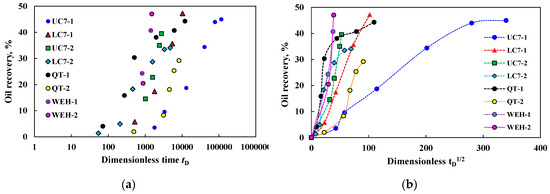
Figure 18.
The oil recovery vs dimensionless time tD and tD0.5: (a) oil recovery vs tD and (b) oil recovery vs tD0.5.
The dimensionless imbibition rate of different reservoirs samples is presented in Figure 19. The pore (P) type rock represents the tight reservoirs that only developed matrix pores for the oil migration channel. The natural fracture (NF) type corresponds to the tight reservoirs that developed both matrix pores and micro-fractures. The fracture propagation (FP) type means that the clay expansion could induce fracture propagation during water imbibition. The effects of in situ stress on fracture propagation were not taken into account. The clay (C) type refers to the tight reservoirs that are characterized by a high content of clay minerals (>40%). These different types of tight reservoirs were comparatively studied (Figure 19).
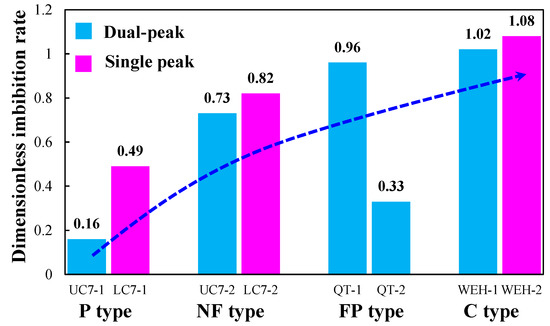
Figure 19.
The dimensionless imbibition rate of different reservoirs samples.
For the same type reservoirs, the pore size distribution of single peak tended to have a larger capillary pressure, resulting in a stronger imbibition potential than that of dual-peak. As for the tight reservoirs with the pore size distribution of a single peak, the dimensionless imbibition rates of the P type, NF type, FP type and C type were 0.16, 0.73, 0.33–0.96, and 1.02, respectively. Evidently, the dimensionless imbibition rates of the NF type, FP type and C type rival surpassed those of P type due to clay minerals and micro-fractures. The imbibition rate of the NF type was 4.5 times that of the tight rock P type. Compared with the matrix pores, the micro-fractures had smaller flow resistance and were more conducive to water and oil flow. The imbibition rates of the FP type and C type were six times those of the P type. The more the clay mineral, the larger the imbibition rate. This can be explained by driving force. The imbibition driving force was only capillary pressure in low clay content sample, but the imbibition driving forces were both capillary pressure and osmotic pressure in high clay content sample. However, when the clay mineral content exceeded 23%, the increase in clay mineral content had little effect on the imbibition rate [11]. Excessive clay minerals can also give reservoirs a strong water sensitivity and seriously disperse in water (Figure 15). Under the reservoir condition, solid particle may plug the pores and decrease the in-place permeability, which is not conducive to the production of tight oil. In this studies, the spontaneous imbibition experiments were mainly carried out at atmospheric pressure, which does not reflect the actual situation. In the future, it will be necessary to perform the imbibition experiments under the reservoir conditions.
4. Conclusions
In this study, a series of imbibition experiments were conducted on tight reservoirs samples and the NMR T2 spectra was used to monitor oil migration dynamics. The oil recovery in different diameters pores was comparatively analyzed. The effects of pore size distribution, micro-fractures, and clay minerals were studied by scaling the imbibition results. The conclusions are as follows:
- (1)
- Concerning the tight reservoirs without clay minerals and micro-fractures, the oil migration due to water imbibition was mainly determined by the pore size. The smaller pores corresponded to a larger capillary pressure and a stronger imbibition capacity. Therefore, the oil of micro-pores tended to migrate into small and largish pores and that of the small and largish pores tended to migrate into large pores. The small and largish pores acted as bridges to connect the micro-pores and large pores. Compared with small and largish pores and large pores, the micro-pores had the largest oil recovery.
- (2)
- As the soaking time increased, the water preferentially entered the natural micro-fractures, expelling the oil in the micro-fractures. Subsequently, the oil in the small pores was slowly expelled. Compared with the matrix pores, micro-fractures have smaller flow resistance and are more conducive to water and oil flow.
- (3)
- The clay minerals of middle content may have induced the fracture propagation. A large amount of oil migrated into the new micro-fractures during the process of micro-fracture propagation. In contrary to the inhibitory effect of natural micro-fractures, the new micro-fractures could have contributed to the oil migration from micro-pores into large pores. The clay minerals of high content can completely decentralize pore structure and significantly increase the imbibition oil recovery at atmospheric pressure. Under the reservoir condition, the effects of excessive clay minerals need to be studied in the future. More clay minerals may result in water sensitivity damage and do not contribute to oil production.
Author Contributions
Methodology, L.Y.; Data curation, S.W.; Writing—review & editing, Z.T.; Visualization, R.L.; Writing—review & editing and Investigation, J.Y.
Funding
This research was funded by the National Natural Science Foundation of China, grant number 11702296 and National Key Research and Development Program, grant number 2016YFC0600906.
Acknowledgments
The financial support of our shale research program is from the Foundation of the National Natural Science Foundation of China (No. 11702296), the National Key Research and Development Program (2016YFC0600906), the Fundamental Research Funds for the Central Universities, the Major National Science, and Technology Projects of China (No. 2017ZX05049003-005).
Conflicts of Interest
The authors declare no conflict of interest. The funders had no role in the design of the study; in the collection, analyses, or interpretation of data; in the writing of the manuscript, or in the decision to publish the results.
References
- Xu, G.; Shi, Y.; Jiang, Y.; Jia, C.; Gao, Y.; Han, X.; Zeng, X. Characteristics and Influencing Factors for Forced Imbibition in Tight Sandstone Based on Low-Field Nuclear Magnetic Resonance Measurements. Energy Fuels 2018, 32, 8230–8240. [Google Scholar] [CrossRef]
- Liu, P.; Zhang, X.; Wu, Y.; Li, X. Enhanced oil recovery by air-foam flooding system in tight oil reservoirs: Study on the profile-controlling mechanisms. J. Pet. Sci. Eng. 2017, 150, 208–216. [Google Scholar] [CrossRef]
- Gu, X.Y.; Pu, C.; Huang, H.; Huang, F.; Li, Y.; Liu, Y.; Liu, H. Micro-influencing mechanism of permeability on spontaneous imbibition recovery for tight sandstone reservoirs. Pet. Explor. Dev. 2017, 44, 1003–1009. [Google Scholar] [CrossRef]
- Todd, H.B.; Evans, J.G. Improved Oil Recovery IOR Pilot Projects in the Bakken Formation. In Proceedings of the SPE Low Perm Symposium, Denver, CO, USA, 5–6 May 2016. [Google Scholar]
- Lan, Q.; Ghanbari, E.; Dehghanpour, H. Water Loss Versus Soaking Time: Spontaneous Imbibition in Tight Rocks. In Proceedings of the SPE/EAGE European Unconventional Resources Conference and Exhibition, Vienna, Austria, 25–27 February 2014. [Google Scholar]
- Jiang, Y.; Shi, Y.; Xu, G.; Jia, C.; Meng, Z.; Yang, X.; Zhu, H.; Ding, B. Experimental Study on Spontaneous Imbibition under Confining Pressure in Tight Sandstone Cores Based on Low-Field Nuclear Magnetic Resonance Measurements. Energy Fuels 2018, 4, 56–78. [Google Scholar] [CrossRef]
- Xu, J.; Sun, B.; Chen, B. A hybrid embedded discrete fracture model for simulating tight porous media with complex fracture systems. J. Pet. Sci. Eng. 2019, 174, 131–143. [Google Scholar] [CrossRef]
- Shen, W.; Li, X.; Lu, X.; Guo, W.; Zhou, S.; Wan, Y. Experimental study and isotherm models of water vapor adsorption in shale rocks. J. Nat. Gas Sci. Eng. 2018, 52, 484–491. [Google Scholar] [CrossRef]
- Ezulike, O.D.; Ghanbari, E.; Siddiqui, S.; Dehghanpour, H.; Sidduqui, S. Pseudo-steady state analysis in fractured tight oil reservoirs. J. Pet. Sci. Eng. 2015, 129, 40–47. [Google Scholar] [CrossRef]
- Ge, H.; Yang, L.; Shen, Y.; Ren, K.; Meng, F.; Ji, W.; Wu, S. Experimental investigation of shale imbibition capacity and the factors influencing loss of hydraulic fracturing fluids. Pet. Sci. 2015, 12, 636–650. [Google Scholar] [CrossRef]
- Yang, L.; Zhang, X.; Zhou, T.; Lu, X.; Zhang, C.; Zhang, K. The effects of ion diffusion on imbibition oil recovery in salt-rich shale oil reservoirs. J. Geophys. Eng. 2019, 16, 525–540. [Google Scholar] [CrossRef]
- Dehghanpour, H.; Lan, Q.; Saeed, Y.; Fei, H.; Qi, Z. Spontaneous imbibition of brine and oil in gas shales: Effect of water adsorption and resulting micro fractures. Energy Fuels 2013, 27, 3039–3049. [Google Scholar] [CrossRef]
- Ghaderi, S.M.; Clarkson, C.R.; Ghanizadeh, A.; Barry, K.; Fiorentino, R. Improved Oil Recovery in Tight Oil Formations: Results of Water Injection Operations and Gas Injection Sensitivities in the Bakken Formation of Southeast Saskatchewan. In Proceedings of the SPE Unconventional Resources Conference, Calgary, AB, Canada, 15–16 February 2017. [Google Scholar]
- Yuan, J.; Jiang, R.; Zhang, W. The workflow to analyze hydraulic fracture effect on hydraulic fractured horizontal well production in composite formation system. Adv. Geo-Energy Res. 2018, 2, 319–342. [Google Scholar] [CrossRef]
- Habibi, A.; Xu, M.; Dehghanpour, H.; Bryan, D.; Uswak, G. Understanding Rock-Fluid Interactions in the Montney Tight Oil Play. In Proceedings of the SPE/CSUR Unconventional Resources Conference, Calgary, AB, Canada, 20–22 October 2015. [Google Scholar]
- Hu, Q.H.; Ewing, P.R.; Dultz, S. Low pore connectivity in natural rock. J. Contam. Hydrol. 2012, 133, 76–83. [Google Scholar] [CrossRef] [PubMed]
- Tian, X.; Cheng, L.; Cao, R.; Wang, Y.; Zhao, W.; Yan, Y.; Liu, H.; Mao, W.; Zhang, M.; Guo, Q. A new approach to calculate permeability stress sensitivity in tight sandstone oil reservoirs considering micro-pore-throat structure. J. Pet. Sci. Eng. 2015, 133, 576–588. [Google Scholar] [CrossRef]
- Brace, W.F.; Walsh, J.B.; Frangos, W.T. Permeability of granite under high pressure. J. Geophys. Res. Space Phys. 1968, 73, 2225–2236. [Google Scholar] [CrossRef]
- Meng, M.; Ge, H.; Ji, W.; Wang, X. Research on the auto-removal mechanism of shale aqueous phase trapping using low field nuclear magnetic resonance technique. J. Pet. Sci. Eng. 2016, 137, 63–73. [Google Scholar] [CrossRef]
- Shouxiang, M.; Morrow, N.R.; Zhang, X. Generalized scaling of spontaneous imbibition data for strongly water-wet systems. J. Pet. Sci. Eng. 1997, 18, 165–178. [Google Scholar] [CrossRef]
- Akin, S.; Schembre, J.; Bhat, S.; Kovscek, A. Spontaneous imbibition characteristics of diatomite. J. Pet. Sci. Eng. 2000, 25, 149–165. [Google Scholar] [CrossRef]
- Yang, L.; Ge, H.; Shi, X.; Cheng, Y.; Zhang, K.; Chen, H.; Shen, Y.; Zhang, J.; Qu, X. The effect of microstructure and rock mineralogy on water imbibition characteristics in tight reservoirs. J. Nat. Gas Sci. Eng. 2016, 34, 1461–1471. [Google Scholar] [CrossRef]


© 2019 by the authors. Licensee MDPI, Basel, Switzerland. This article is an open access article distributed under the terms and conditions of the Creative Commons Attribution (CC BY) license (http://creativecommons.org/licenses/by/4.0/).