Article

The Industrial Applicability of PEA Space Charge Measurements, for Performance Optimization of HVDC Power Cables

1
LEPRE Laboratory, Dipartimento di Ingegneria, Università di Palermo, 90128 Palermo, Italy
2
The Tony Davies High Voltage Laboratory, University of Southampton, Southampton SO17 IBJ, UK
*
Author to whom correspondence should be addressed.
Energies 2019, 12(21), 4186; https://doi.org/10.3390/en12214186
Submission received: 12 September 2019 / Revised: 28 October 2019 / Accepted: 29 October 2019 / Published: 2 November 2019
(This article belongs to the Special Issue Design and Testing of Power Cable System)

Abstract

:
Cable manufacturing industries are constantly trying to improve the electrical performance of power cables. During the years, it was found that one of the most relevant degradation factors influencing the cable lifetime is the presence of space charge in the insulation layer. To detect the accumulated charge, the pulsed electro-acoustic (PEA) method is the most used technique. Despite the wide use of the PEA cell, several issues are still present. In particular, the PEA output signal is strongly disturbed by the acoustic waves reflections within the PEA cell. This causes the distortion of the output signal and therefore the misinterpretation of the charge profiles. This, in turn, may result in an incorrect cable characterization from the space charge phenomenon point of view. In 2017, due to the proved degradation effect of the space charge accumulation phenomenon, the IEEE Std 1732 was developed. This standard describes the steps to be followed for the space charge measurement in cables specimens during pre-qualification or type tests. Therefore, cable manufacturing industries started to take a particular interest in these measures. In the light of this, the aim of the present work is to highlight that the enacted standard is not easily applicable since various problems are still present in the PEA method for cables. In particular, in this work, the effect of multiple reflected signals due to the different interfaces involved, but also the effect of the signal attenuation due to cable dielectric thickness, as well as the effect of the PEA cell ground electrode thickness in the output charge profile, are reported. These issues have been demonstrated by means of an experimental test carried out on a full-size cable in the Prysmian Group High Voltage laboratory. To better understand the PEA cell output signal formation, a PEA cell model was developed in a previous work and it has been experimentally validated here. In particular, simulations have been useful to highlight the effect of the reflection phenomena due to the PEA cell ground electrode thickness on the basis of the specimen under test features. Moreover, by analyzing the simulation results, it was possible to separate the main signal from the reflected waves and, in turn, to calculate the suitable ground electrode thickness for the cable specimen under test.

1. Introduction

Energy efficiency in both high voltage alternating current (HVAC) and high voltage direct current (HVDC) transmission systems strictly depends on the cable design. One of the most important elements in a cable is the insulation layer [1,2,3]. For this reason, cable manufacturers are continuously testing dielectric materials that can provide the best performances [4,5].
Typically, from the electrical point of view, capacitance, resistivity, dielectric strength, and permittivity are the main parameters to be taken into account [6]. Cross linked polyethylene (XLPE) material was found to be the best solution for these systems, as it has a high dielectric strength, low dielectric permittivity, and low electrical resistivity compared to other dielectric materials [7]. Based on its satisfactory characteristics for HVAC applications [8], in the last decades this dielectric material has also been used in HVDC systems [9,10,11,12]. Unfortunately, due to the physical and chemical structure of XLPE material, under a constant DC stress, the space charge accumulation phenomenon is strongly present [13,14,15,16].
The presence of space charge will result in a local increment of the electric field within the insulating layer, which causes the reduction of its electrical performance and lifetime [17]. Additionally, the presence of space charges may change the insulating properties of the material itself as well as the leakage current value. This translates in a different energy efficiency of the cable and therefore of the entire HVDC system.
Based on the considerations above, in 2017, some experts in the field of high voltage tests suggested the introduction of the space charge measurement for cables, during pre-qualification or type tests load cycle. Therefore, according to “IEEE Std 1732-2017” standard, both thermal step method (TSM) [18,19] or the pulsed electro-acoustic (PEA) [20] technique can be used to test the full-size cables specimens. Both measurement techniques are widely described and compared in [21,22,23]. In the proposed work, the PEA method has been analyzed and used for the experimental test. Its working principle is essentially based on the generation, propagation, and detection of acoustic waves which carry information on the accumulated space charges. Despite the wide use of the PEA method, several issues are still present. In particular, the presence of acoustic wave reflections, due to the different interfaces involved in both PEA cell and samples under test, generates the distortion of the PEA output signal which could result in a misinterpretation of the real accumulated space charge [24,25]. Typically, in the PEA cell output signal only two main peaks due to positive and negative surface charges accumulated in the dielectric interfaces should be present. However, if the reflected waves fall between the two main peaks a signal distortion occurs [26]. For this reason, it is important to evaluate before or after a space charge measurement the acoustic wave behavior with the aim to establish the temporal location of both main peaks as well as their reflections. For this aim, in a previous work, a PEA cell model for flat specimens has been developed by the authors [27,28]. In this work, after minor changes, the same model has been used for a cable specimen. The changes essentially concern the introduction of the three layers specimen representing the cable (one dielectric and two semiconductors layers), as well as the different PEA cell component dimensions.
In this way, the spurious signals can be separated from the original one and thus the evaluation of the accumulated charges becomes more accurate. Thanks to this study, the output signal interpretation errors are overcome and thus it is possible to choose the best cable type, as well as the best dielectric material. The latter should be the one that shows the best behavior from the space charge accumulation point of view.
In the first part of this article, a brief description of the space charge accumulation phenomenon is given. Then, the standard IEEE 1732-2017 has been summarized in ten main points. After that, the PEA cell for cable specimens and its features are described. In paragraph VI, an experimental test in a full-size cable carried out in the high voltage laboratory of a cable manufacturing industry, is reported in detail. The issues found in the obtained PEA cell output signal are thoroughly discussed and reproduced with the simulation model. Finally, a theoretical solution is given, as well as two graphs useful to facilitate and make faster selection of the ground electrode and cable features in order to avoid reflections in the main space charge profile.

2. The Space Charge Accumulation Phenomenon

The space charge accumulation phenomenon, which means trapped electrons or ions in the material bulk, occurs in the insulating layer of cables, joints, and terminations employed in HVDC transmission [7]. This phenomenon is influenced by several factors, such as the voltage level, the duration of the applied voltage, the contact between dielectric material and semiconductor layer, as well as the chemical and physical properties of the dielectric material. Over that, insulation physical and geometrical parameters as well as transient conditions have a fundamental role in the space charge accumulation [29]. The main effect of this phenomenon is the distortion of the original Laplacian electric field distribution, which could cause extremely high local electric fields. This in turn may cause the insulating material to degrade and this fact can lead in turn to electrical breakdown [30,31].
To better explain this phenomenon, in Figure 1 a HVDC cable with accumulated space charges is illustrated. Considering the cable subjected to a positive high voltage, in the initial stage only the surface charges are present. In particular, the positive charges (in red color) are accumulated in correspondence of the inner semicon/dielectric interface, while, the negative surface charge (blue color) in the dielectric/outer semicon interface. After a certain time, the accumulation of charges occurs also in the insulation bulk. These charges can be injected from the electrodes (the core of the cable) or generated in the dielectric itself due, for example, to physical or chemical defects [7].
With reference to the cable in Figure 1, the typical space charge distributions measured with the PEA method and the related electric field profiles are reported in Figure 2a,b, respectively. These patterns, obtained with the simulation software, show the charges and the electric field behaviors at 5 min, 12 and 24 h after voltage application.

3. The Standard IEEE 1732-2017

Based on the space charge degradation effect, to improve the cables performance and to increase their lifetime, in 2017, a recommendation named “Recommended Practice for Space Charge Measurements on High-Voltage Direct-Current Extruded Cables for Rated Voltages up to 550 kV” was proposed [32] by IEEE. In this standard, the authors suggest a protocol to be followed for the space charge measurements during pre-qualification or type test load cycles in cables. For the PEA method, the proposed test procedure can be summarized as follows:
  • Cable heating. Specifically, the same temperature gradient at which the cable is designed to operate shall be created starting from 24 h before the measurement and maintained during the entire test;
  • Positive voltage pooling time. Now the space charge measurement can start by applying a positive polarity rated voltage;
  • First space charge measurement. After a few minutes of voltage application, the space charge distribution shall be acquired. This profile is constituted by only surface charges and is used as the reference;
  • Subsequent measurements. After the “first measurement” and every 60 min until a time equal to 3 h a first series of space charge measurements shall be performed;
  • Electric field evaluation. By taking into account the acquired space charge distributions during the “first measurement” and after 3 h of voltage application, the related electric field profiles (at 0 and 3 h) are determined. After that, the maximum absolute percentage variation between the two electric field profiles, ΔE, is calculated. If ΔE < 10% the electric field is considered stable and the subsequent step f can be neglected (go directly to point g). Otherwise, other space charge measurements are needed;
  • In case of ΔE > 10%. The space charge measurements continue and they are acquired after 4, 5, and 6 h of voltage application. From the last measurement (at 6 h) the electric field distribution is determined and compared with that previously calculated after 3 h. As in the point e the maximum absolute percentage variation between the two electric field profiles is evaluated. Additionally, in this case, if ΔE < 10% go to point g, while, if ΔE is again greater than 10% repeat the space charge measurements for other 3 h. Therefore, after 7, 8, and 9 h of voltage application. Here, the maximum absolute percentage variation is calculated between the electric field at 6 and 9 h;
  • Voltage removal. The cable conductor shall be short-circuited and grounded within a time no longer than 5 min from the voltage removal;
  • Space charge measurement during volt-off. In this phase, the charge profiles are acquired immediately after the beginning of the depolarization time and then after 1, 2, and 3 h. For all acquisitions, the electric field profiles are also plotted, but only the relevant distributions are taken into account;
  • The cable shall be left grounded for at least 24 h;
  • Negative voltage pooling time. The space charge profiles, and the related electric field distributions are measured by applying a negative polarity rated voltage. The steps from c to h shall be repeated.

4. The PEA Method for Cables

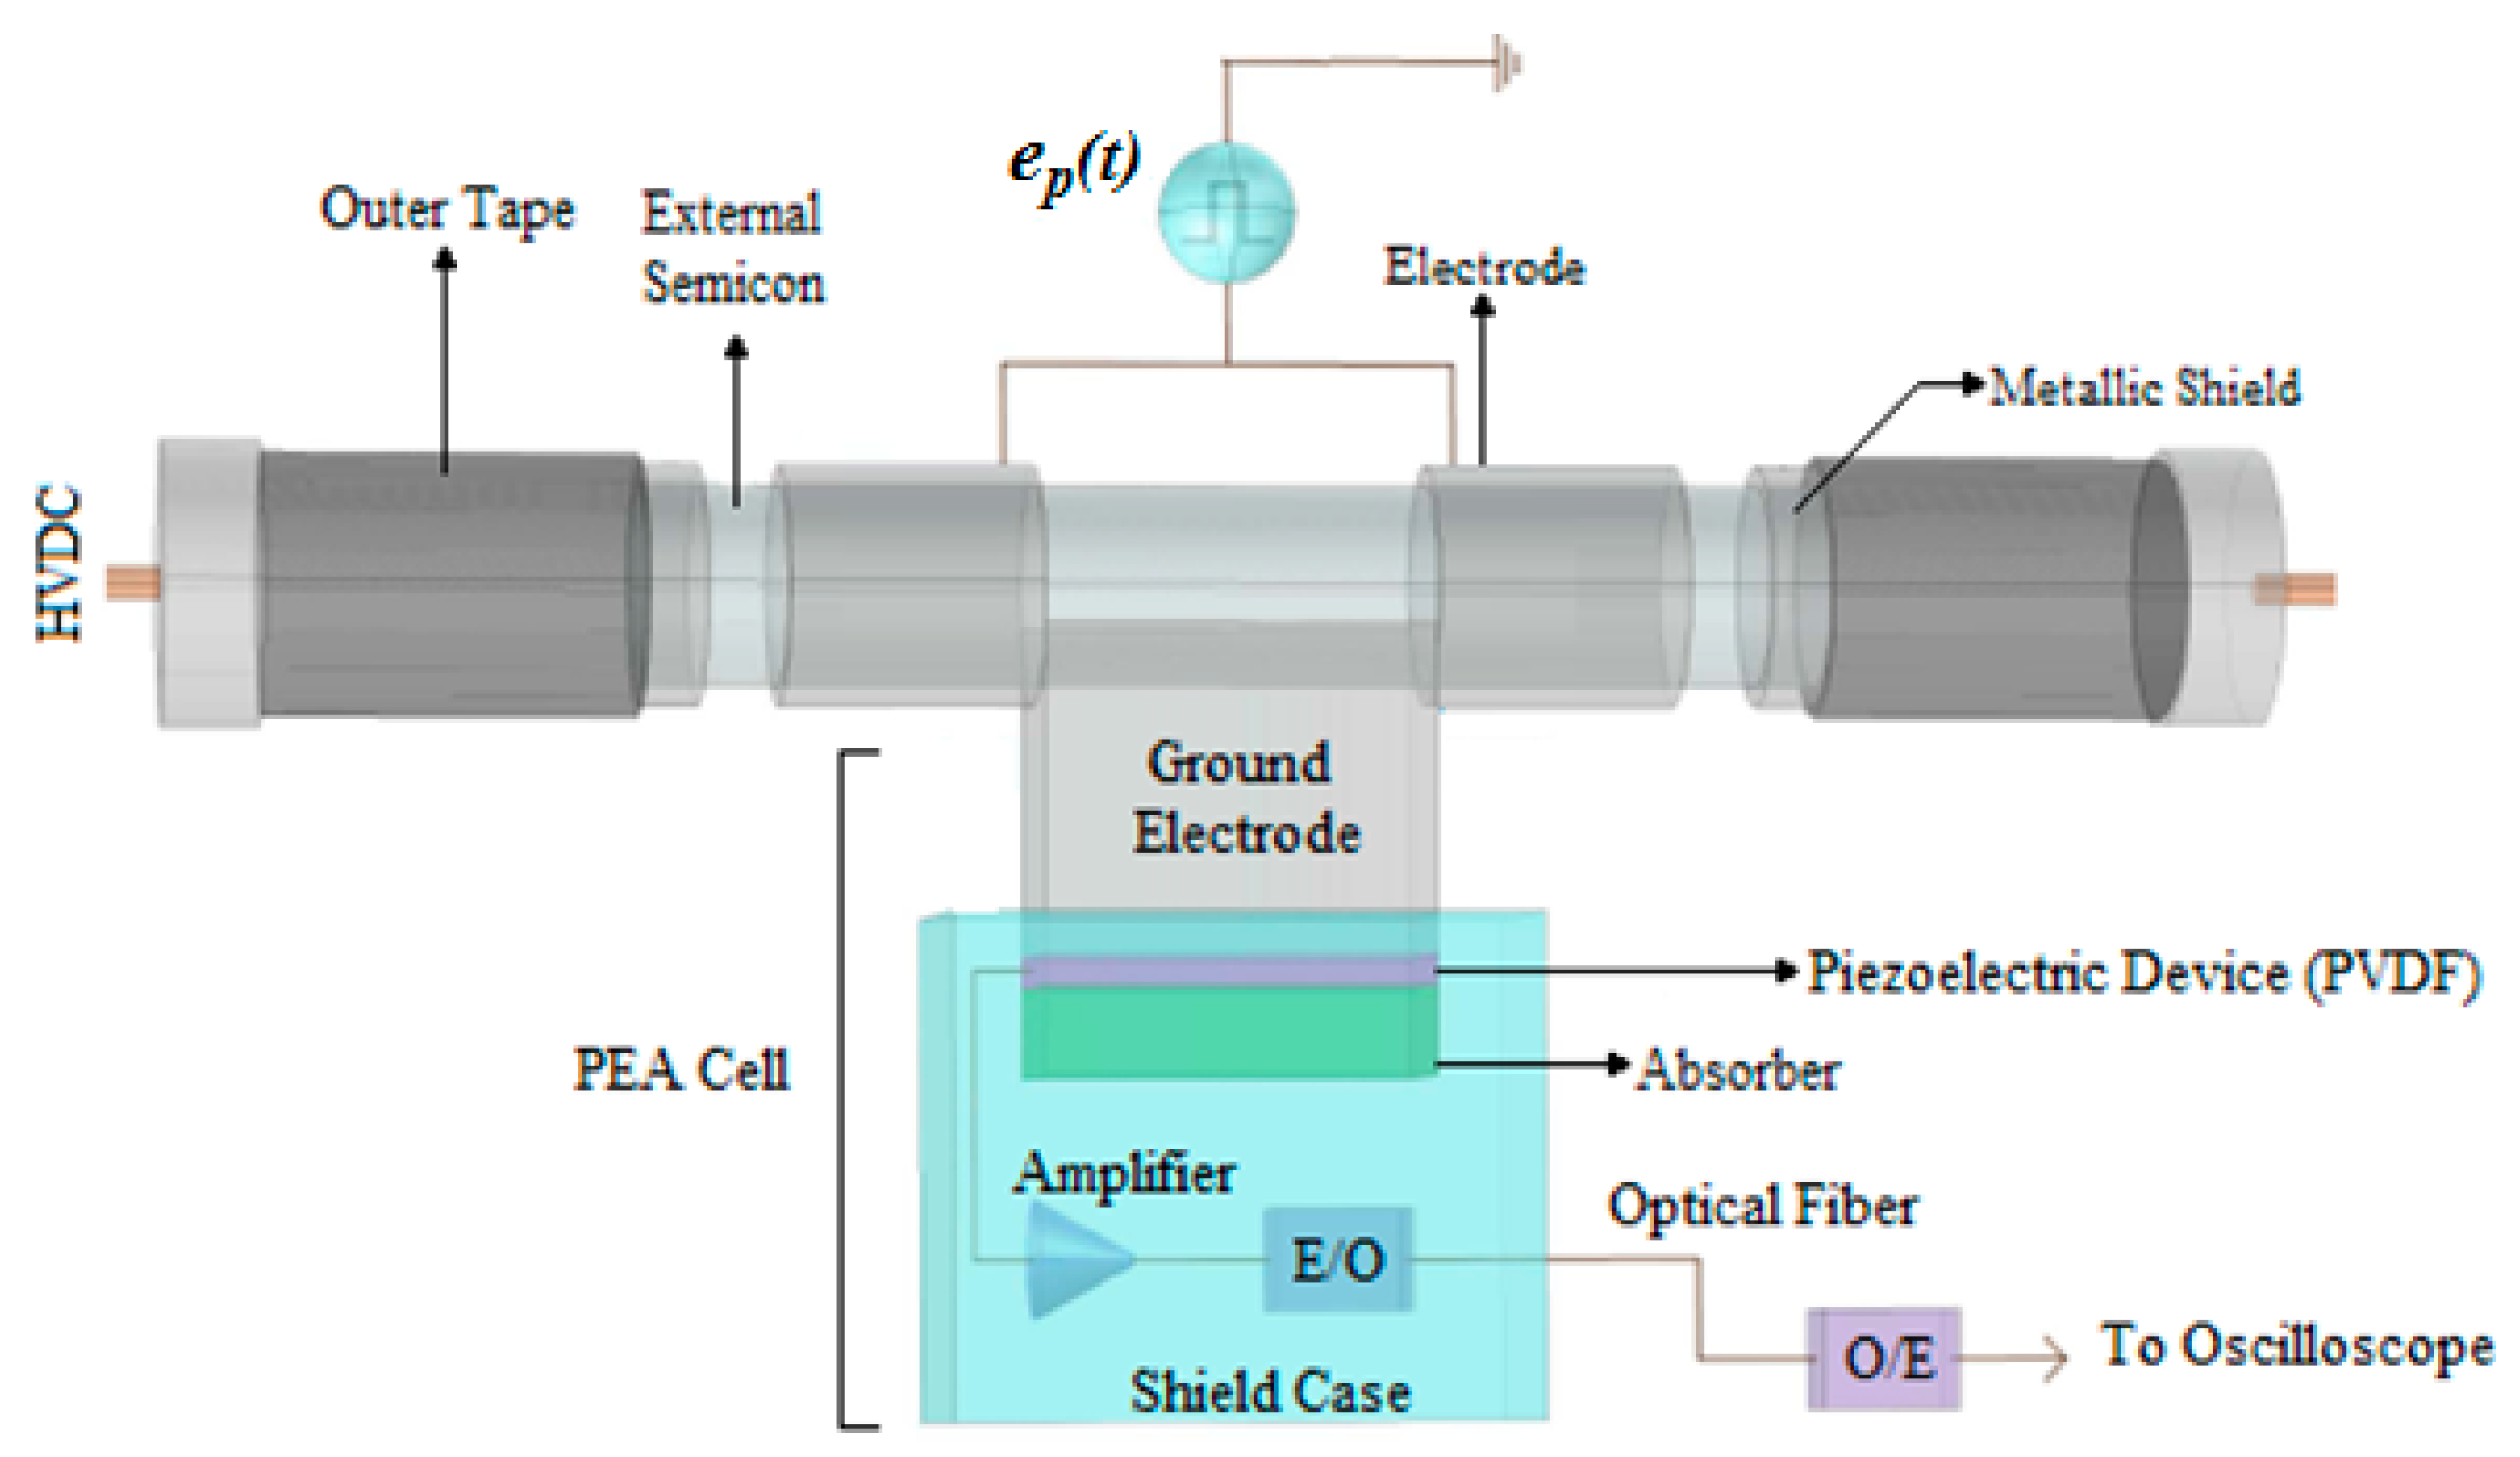
The PEA measurement setup for cable specimen is shown in Figure 3. It is mainly composed of a cable specimen, a high voltage generator HVDC, a pulse generator e p ( t ) , an oscilloscope, and a computer. First of all, the high voltage is applied in order to promote the accumulation of space charges in the cable insulation bulk. Then, to measure the accumulated charges the pulse generator is needed. The pulse voltage is used to vibrate the charges and, from its vibration, acoustic waves are generated. These waves travel to the piezoelectric sensor (which is placed underneath the ground electrode of the PEA cell) and are detected. The sensor converts the pressure signal into a voltage signal proportional to the accumulated charges. Finally, the signal is sent to the oscilloscope and to the computer in order to be displayed and elaborated. Inside the PEA cell, also an absorber and an amplifier are present. The first component allows the absorption of the acoustic waves with the aim to avoid reflection of the signal across the piezoelectric sensor. The amplifier, instead, is used to increase the voltage level of the piezoelectric sensor output signal [20,21,22,23].

5. Experimental Test on a Cable Specimen

As previously reported, according to the IEEE Std 1732-2017, cable manufacturing industries need to measure the space charge before the cable installation.
Based on the above, a space charge measurement by means of the PEA method has been made in a full-size cable. The 20 m long cable under test, equipped with a 20 mm thick XLPE dielectric layer, has been subjected to a voltage of 380 kV. After applying the pulse voltage with magnitude 8 kV, the PEA cell output signal displayed by the oscilloscope is shown in Figure 4 [33].
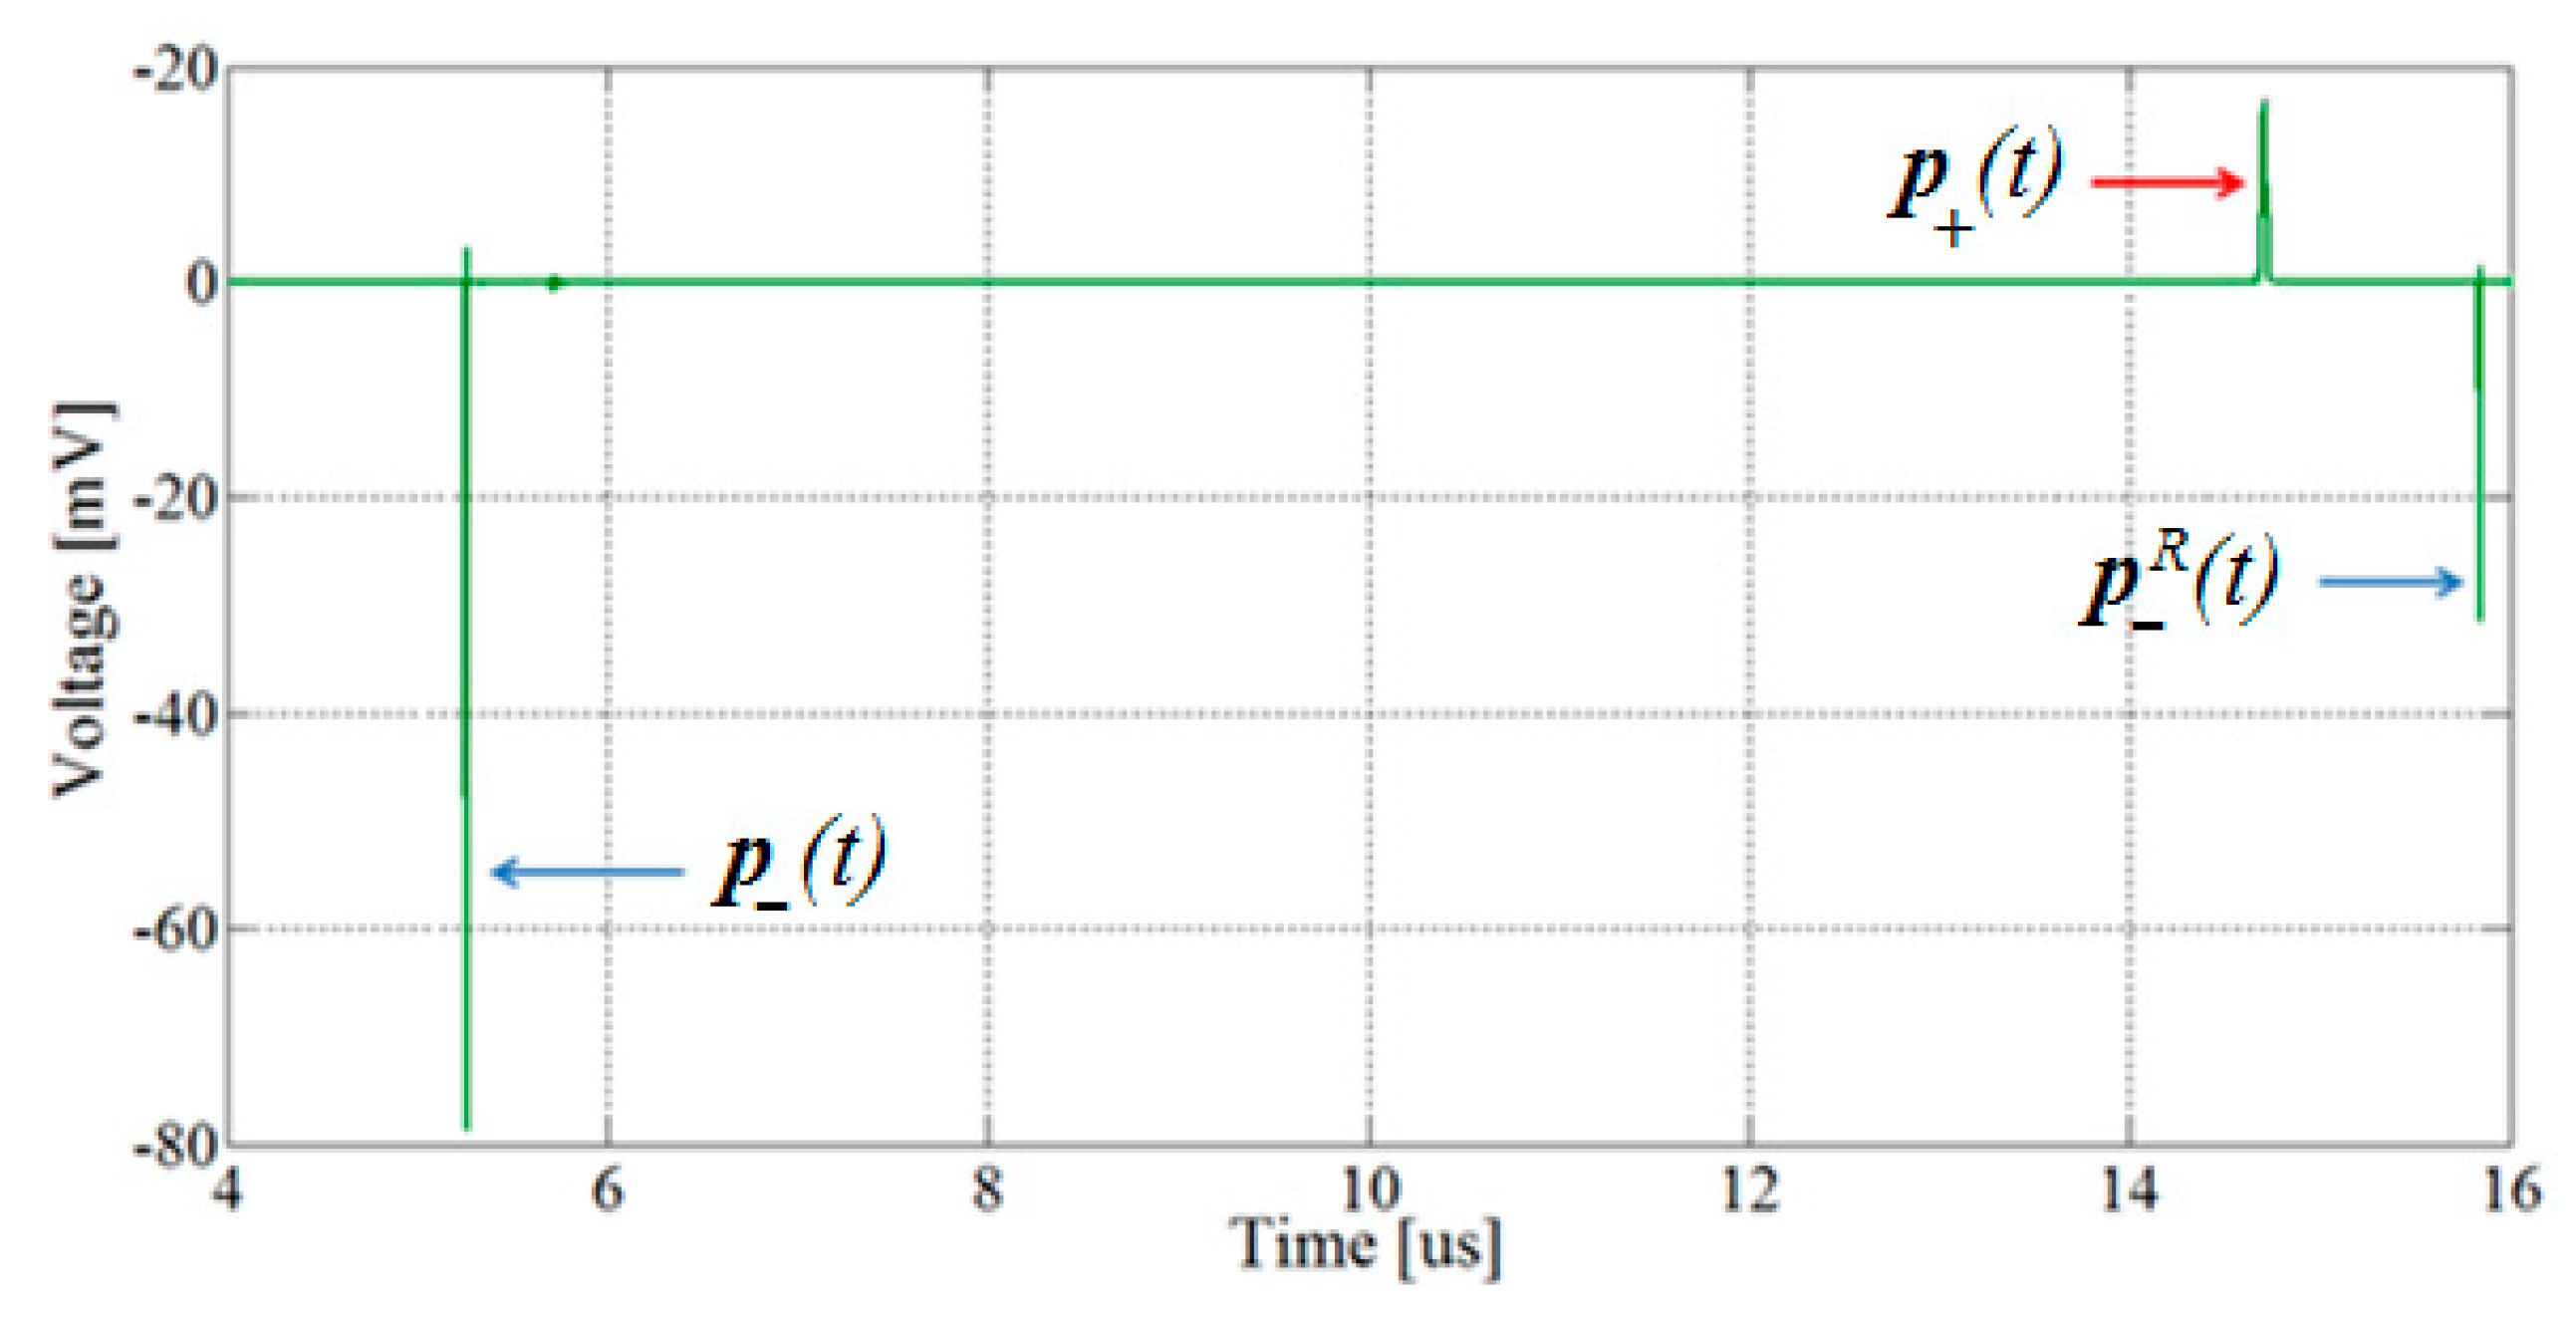
As it can be seen, the obtained space charge profile is not very clear. By visual inspection, it is possible to say that the signals named e p ( t ) and e p R ( t ) are the voltage pulse and its reflection in the PEA cell, respectively. The first peak p ( t ) is due to the accumulated charges at the dielectric/external semiconducting layer interface (see the blue charges in Figure 1). While, the signal p + ( t ) , corresponding to the positive charges (red charges in Figure 1) accumulated at the internal semiconducting layer/dielectric interface, is overlapped with the wave named p R ( t ) . After the acoustic wave behaviour analysis carried out by means of a simulation model (that will be described in the next section) it has been found that the signal p R ( t ) is the reflection of the wave p ( t ) within the ground electrode of the PEA cell.
In addition, the reflected signal e p R ( t ) falls in the same time range of the main signal and therefore it is not possible to gain a clear visualization of the accumulated charges in the insulation bulk.
For these reasons, it was not possible to appreciate the space charge profiles and therefore the electric field distributions, as requested by the IEEE Std 1732-2017.

6. Main Issues of the PEA Method for Cable Specimens

The measurement setup of the PEA method for cable specimens has been reported in Figure 3. As it can be seen, for the application of the pulse generator electrodes some parts of the cable external metallic shield must be removed in order to apply the voltage pulse in correspondence of the outer semiconductor layer. This aspect can be seen as the main application problem of the PEA method, because it turns to be destructive for the cable under test.
In addition, during the experimental test reported in the previous Section 5, several other issues affecting the PEA cell output signal have been found. In particular:
  • The acoustic waves generated in the internal semiconductor/dielectric interface, before reaching the PEA cell, travel within the entire insulation layer. The latter, has both high thickness value (~20 mm) and high acoustic attenuation coefficient. Therefore, the information about the accumulated charge in this interface is characterized by a weak signal which, in some cases, could be confused with the measurement noise.
  • the generated acoustic waves when travelling within both the cable specimen and the PEA cell are subjected to the reflection phenomenon. This is due to the different interfaces involved during the waves propagation. Specifically, when an acoustic wave reaches an interface, based on the acoustic impedance of the two materials in touch (e.g., dielectric and aluminum of the ground electrode), a part of the wave is transmitted and another part is reflected in the opposite direction. The reflected wave, after a certain time, is reflected again and directed towards the piezoelectric sensor. Based on this, the sensor detects both the main signal and its reflections. The latter signals, at least in our experimental test, fall within the main charge peaks and thus are a disturbance which do not allow the correct estimation of the accumulated charge.
The above reported issues, and in particular those regarding the reflections phenomena, have been identified by means of a PEA cell simulation model, whose working principle and related simulation results will be described in the next section.

7. The PEA Cell Model

In order to correctly evaluate the signal depicted in Figure 4, a model able to simulate the acoustic waves behavior within the PEA cell and the cable has been used. The model has been developed and widely described in a previous work published by the authors in [27,28]. The model is essentially based on the analogy between acoustic and mechanical quantities, such as the analogy between force and velocity of an acoustic wave with voltage and current of an electrical wave, respectively [34]. Therefore, the Telegraphist’s equations, describing the current and voltage behavior in electrical transmission lines, have been used to simulate the acoustic wave behavior in the PEA setup. In particular, it was possible to model each PEA cell component, as well as each cable layer, with a lossy transmission line modeled as a cascade of two-ports modules. The electrical parameters (resistance, inductance, capacitance, and conductance) of each transmission line have been calculated by means of mechanical quantities, such as the material density, the sound velocity, and the attenuation coefficient of the related PEA cell setup component. These mechanical quantities as well as the thickness of each PEA cell setup component are required by the model as input data. In addition, the model needs the magnitude value of the pulse voltage generated which simulate the generated acoustic waves due to the charges vibration. Since the model is able to simulate only the acoustic waves behavior and not the accumulated charge, the magnitude of the generated voltage pulse Vp, given by Vp = σE (where σ is the dielectric conductibility and E is the electric field within the insulating material) must be calculated before the simulation and inserted as input data.
By changing the input data (thickness, sound velocity, material density, and attenuation coefficient of the cable layers) the PEA cell model is able to simulate the acoustic wave behavior for different types of cable specimens. However, for different measurement conditions, e.g., temperature gradient, humidity, pressure or mechanical stress, further model developments are needed.
A detailed explanation of the developed PEA cell model used in this work is provided in [27,28].
Due to the one-dimensional approach referred to a single charge propagation phenomenon, the wave propagation model, developed for the flat specimens, has been identically applied to a cylindrical cable geometry. Therefore, despite the model that was developed for a PEA cell testing flat specimen, it works correctly also when the specimen has cylindrical geometry, just as the cable. This is because the presence of surface charges has been considered and, in particular, only those with acoustic waves propagating in the perpendicular direction.
In Figure 5, the configuration implemented into the model is schematically represented. It shows the section of the full-size cable and some parts of the PEA cell (of course, the entire PEA cell, as that of Figure 3, has been implemented into the model). In the same figure, the path of the waves p ( t ) , p + ( t ) , and p R ( t ) are also depicted. The detailed explanation of these acoustic waves course is given in the following.
In Table 1, the main features of the PEA cell components and cable layers involved in the acoustic waves propagation, are listed.
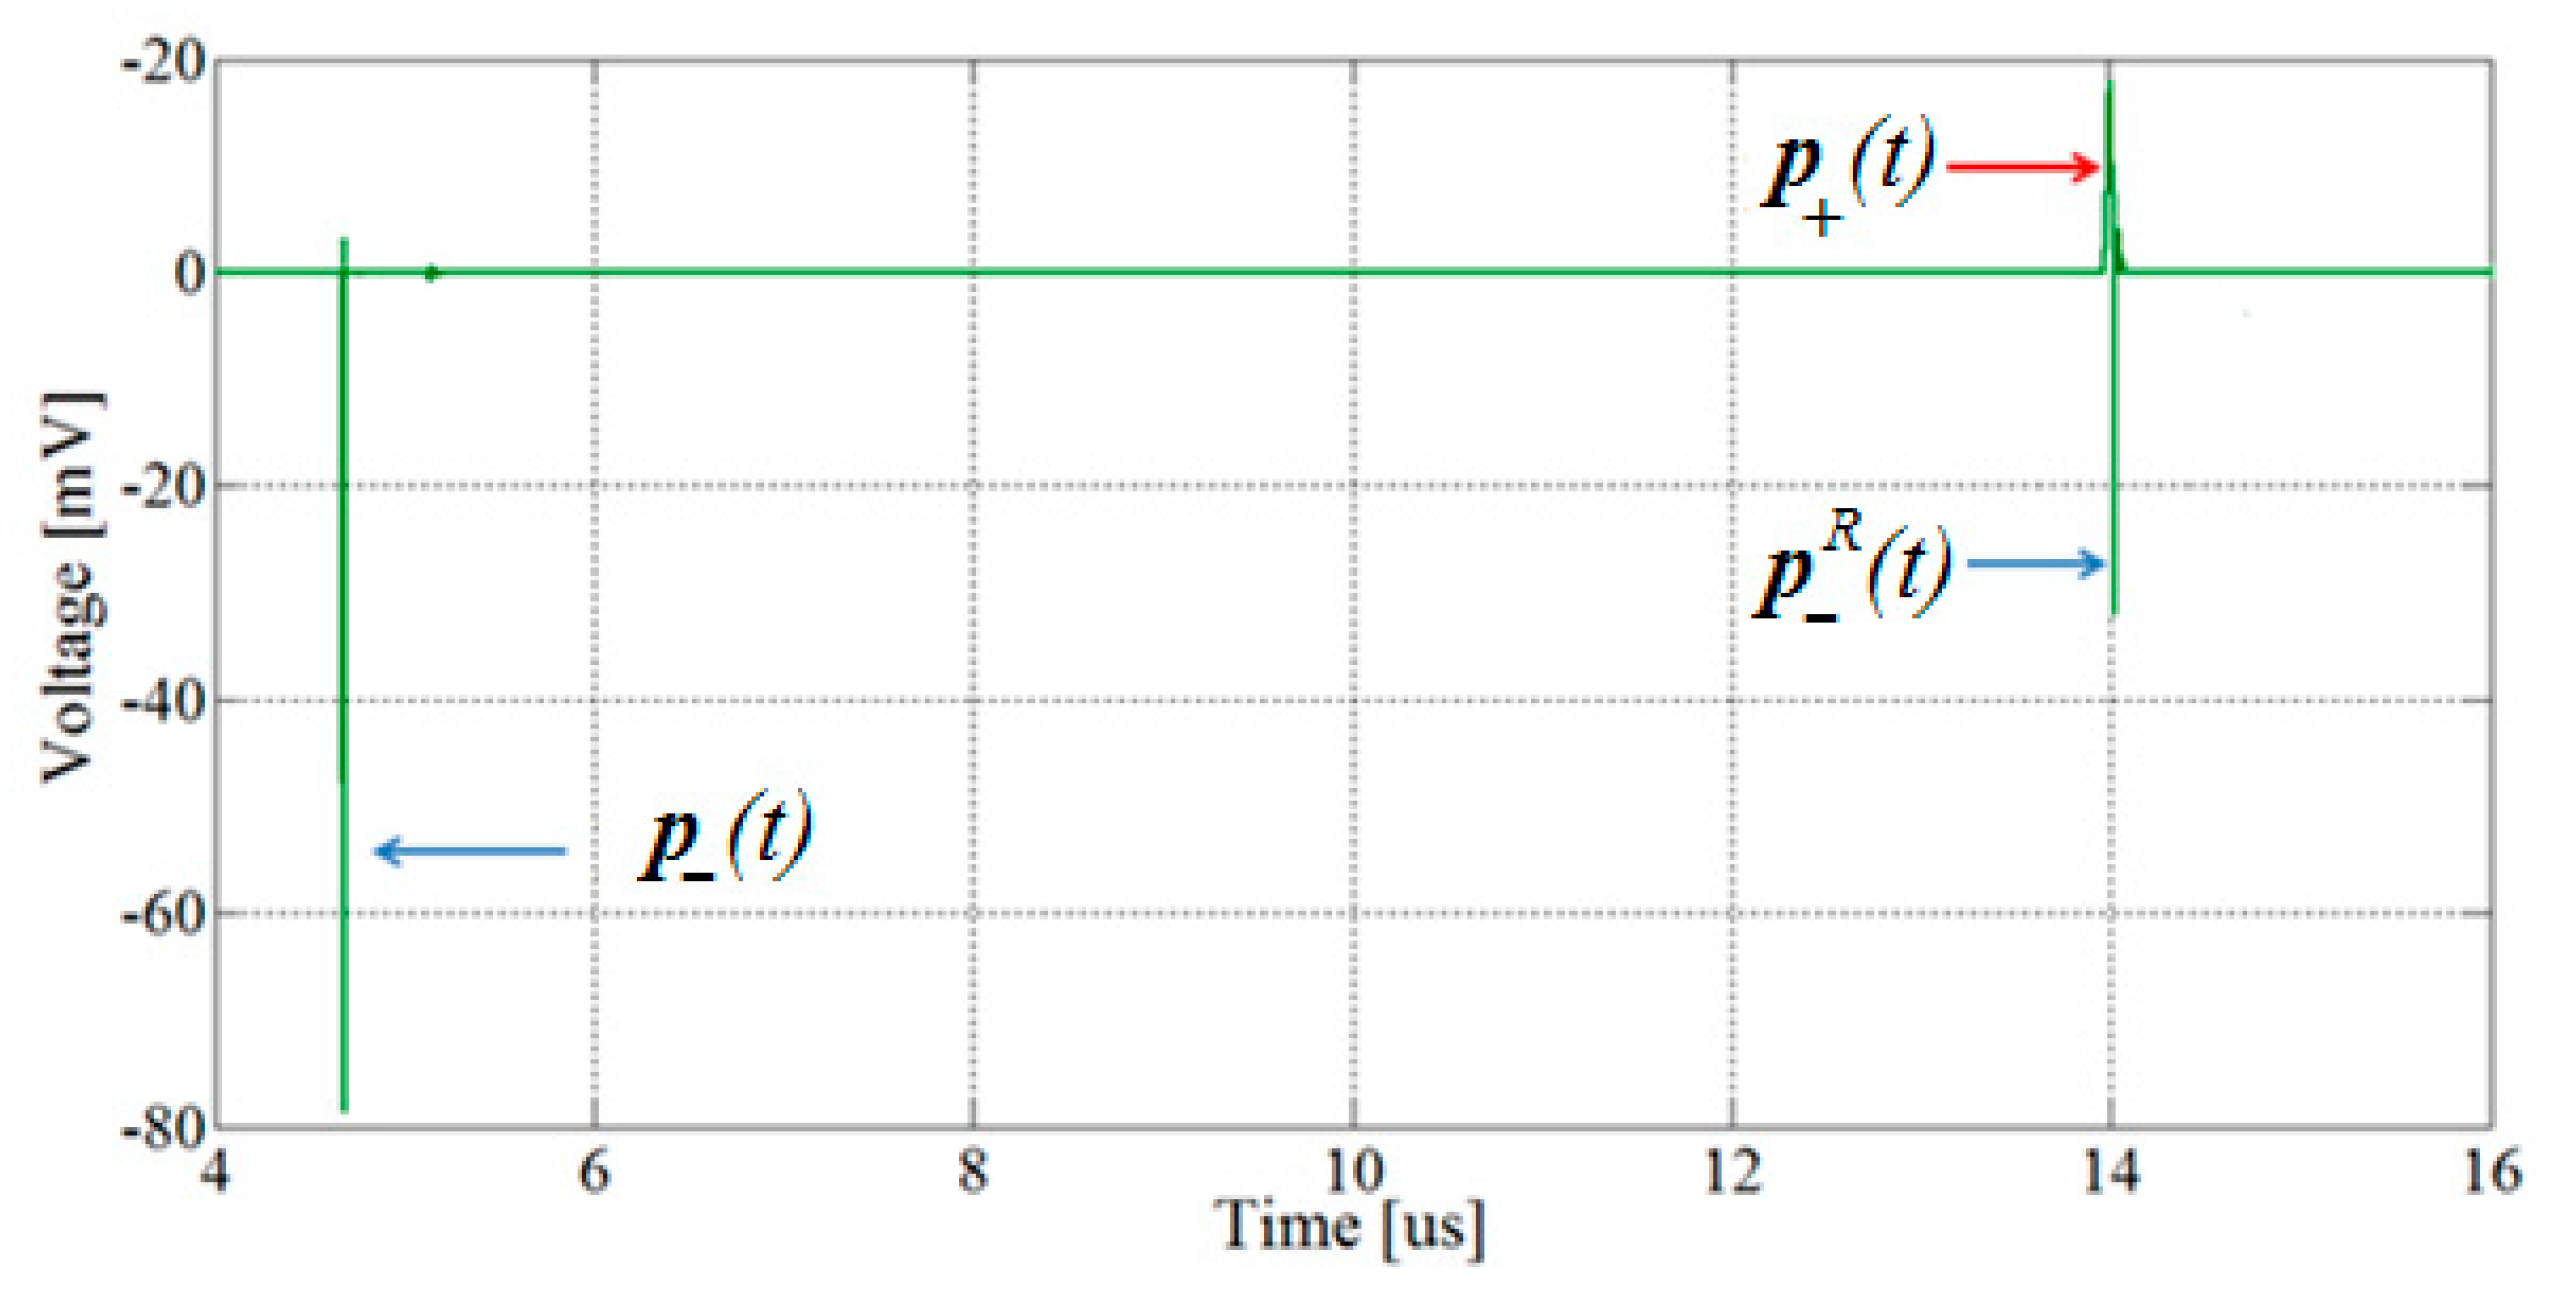
By implementing the values of Table 1 into the model and considering a pulse voltage of 8 kV, another behavior can be observed as shown by the simulation result in Figure 6.
As it can be seen from the figure below, the first acoustic wave p ( t ) is detected by the piezoelectric sensor at 4.66 μs, which is the time needed by the wave to travel within the ground electrode. The acoustic wave p + ( t ) , instead, needs around 14 μs (time useful to cross both the dielectric layer and the ground electrode) to reach the sensor. At the same time, due to the ground electrode thickness as well as to the cable dielectric layer features, reflected wave p R ( t ) is sensed by the sensor. In details, by observing the previous Figure 5, after the wave p ( t ) reaches the sensor, the latter is reflected in the opposite direction and, in correspondence of the ground electrode/cable interface it is reflected again in the sensor’s direction. Therefore, after (3 × 4.66) μs ≈ 14 μs the wave p R ( t ) reaches the sensor and overlaps with the main positive signal p + ( t ) .
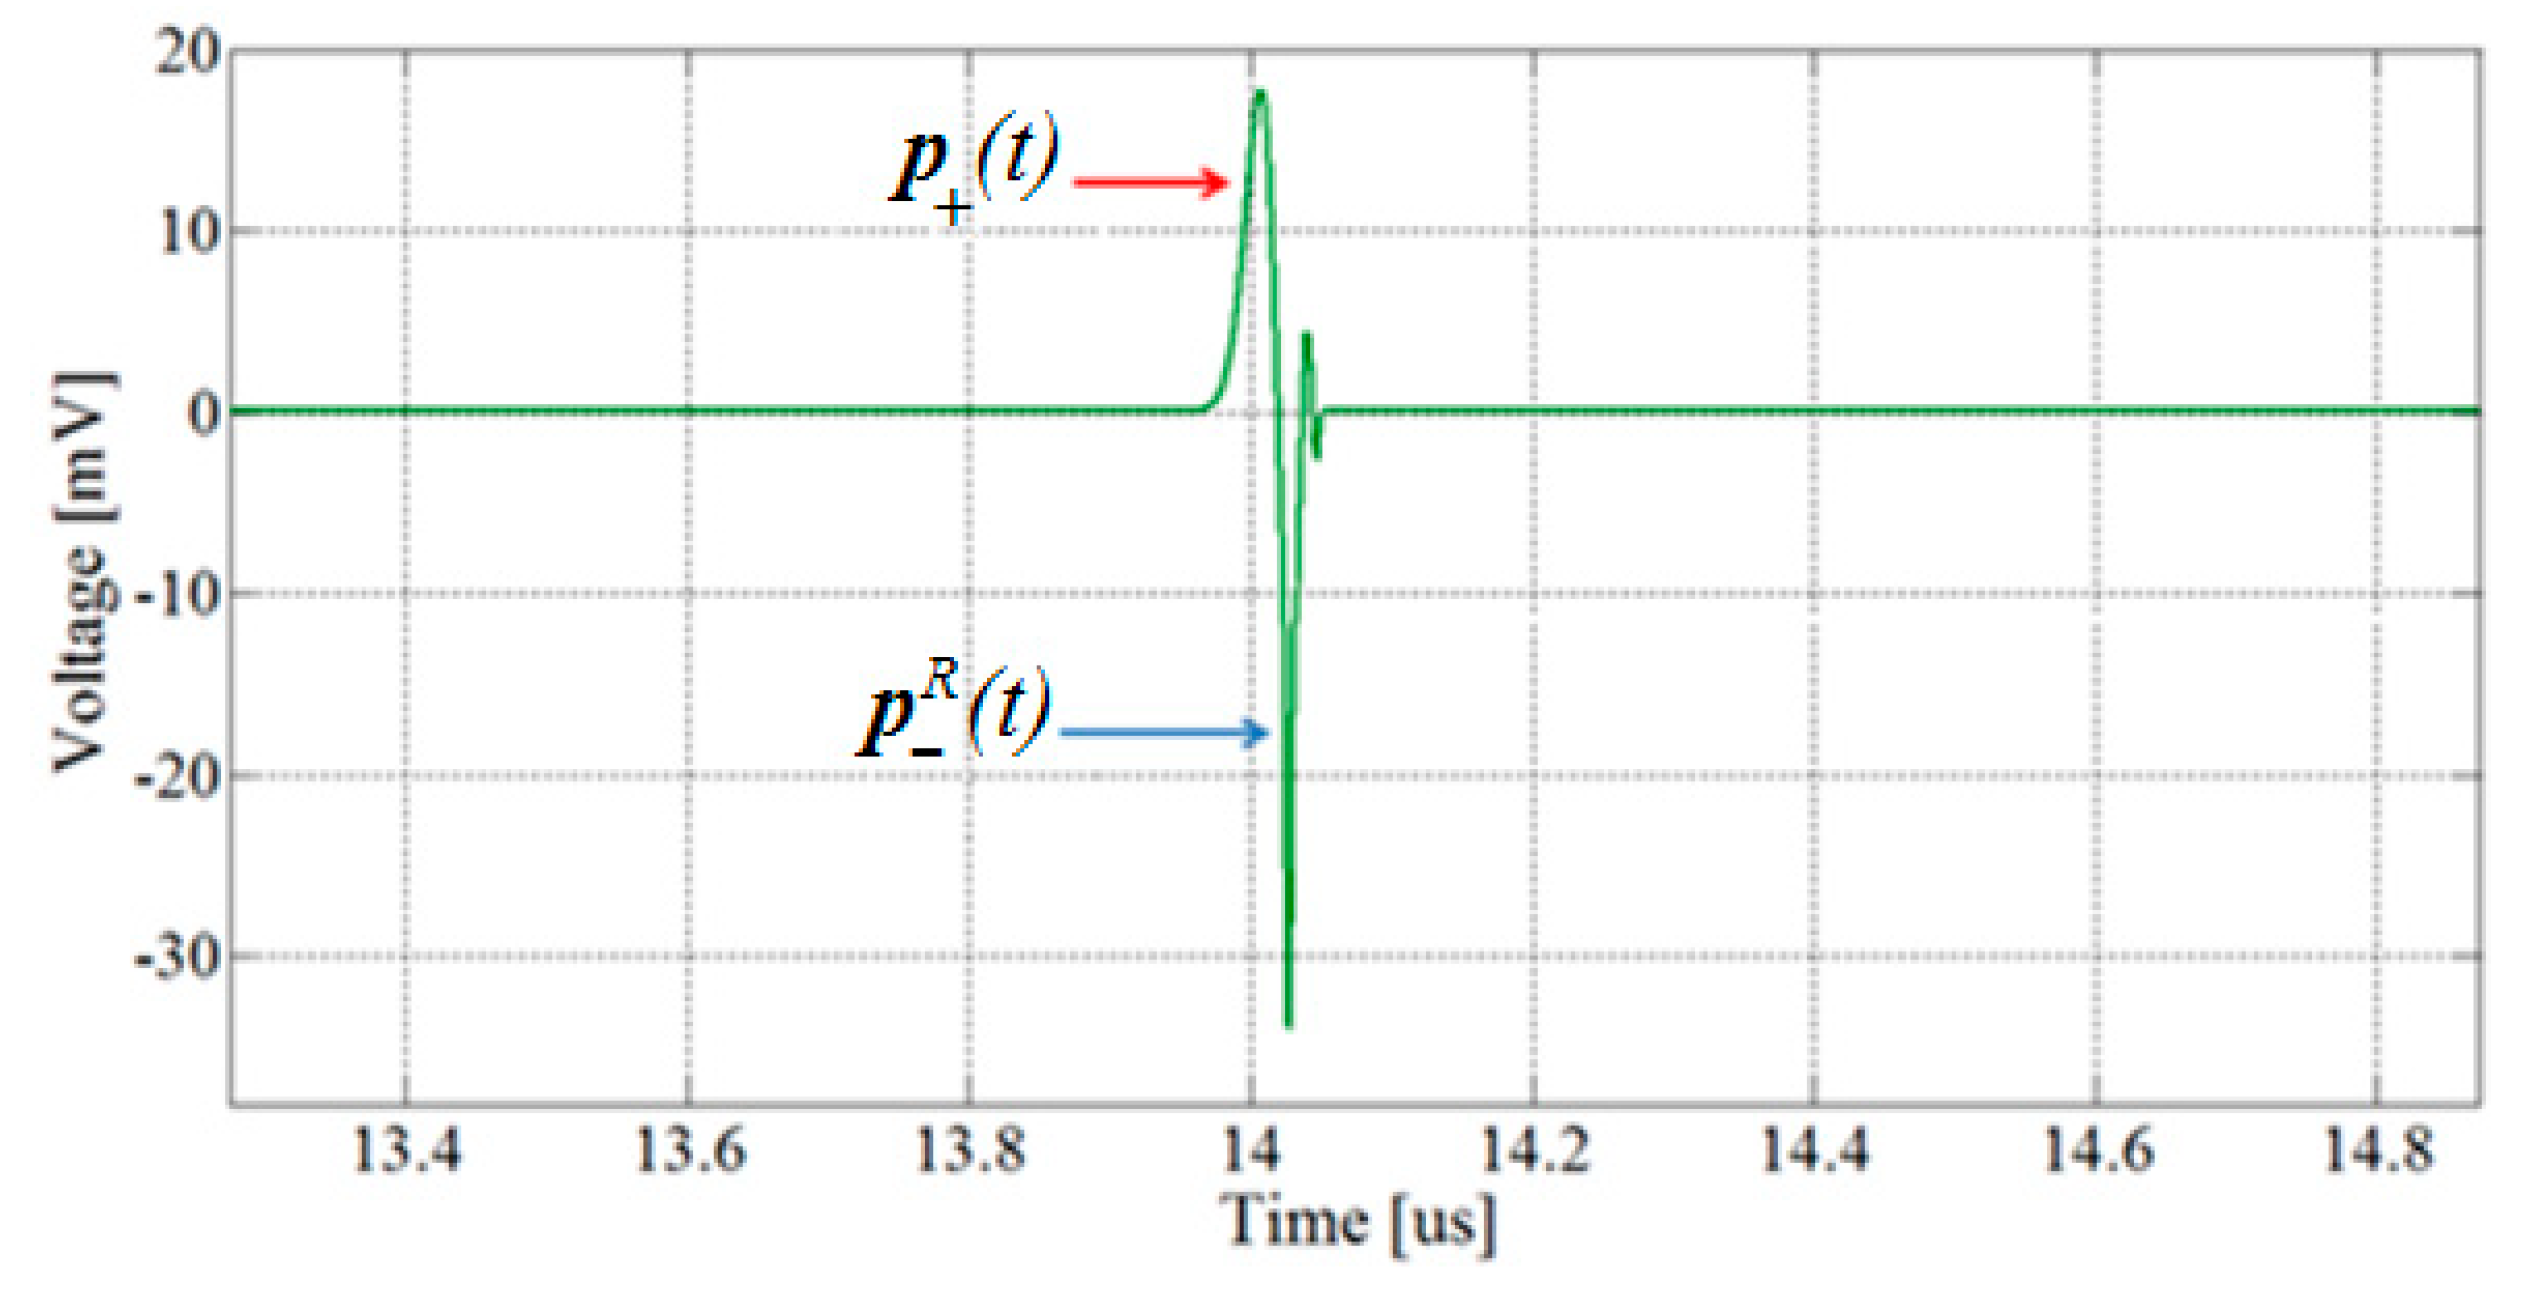
For a better visualization of the acoustic waves behavior around t = 14 μs, in Figure 7, a zoomed image is reported.
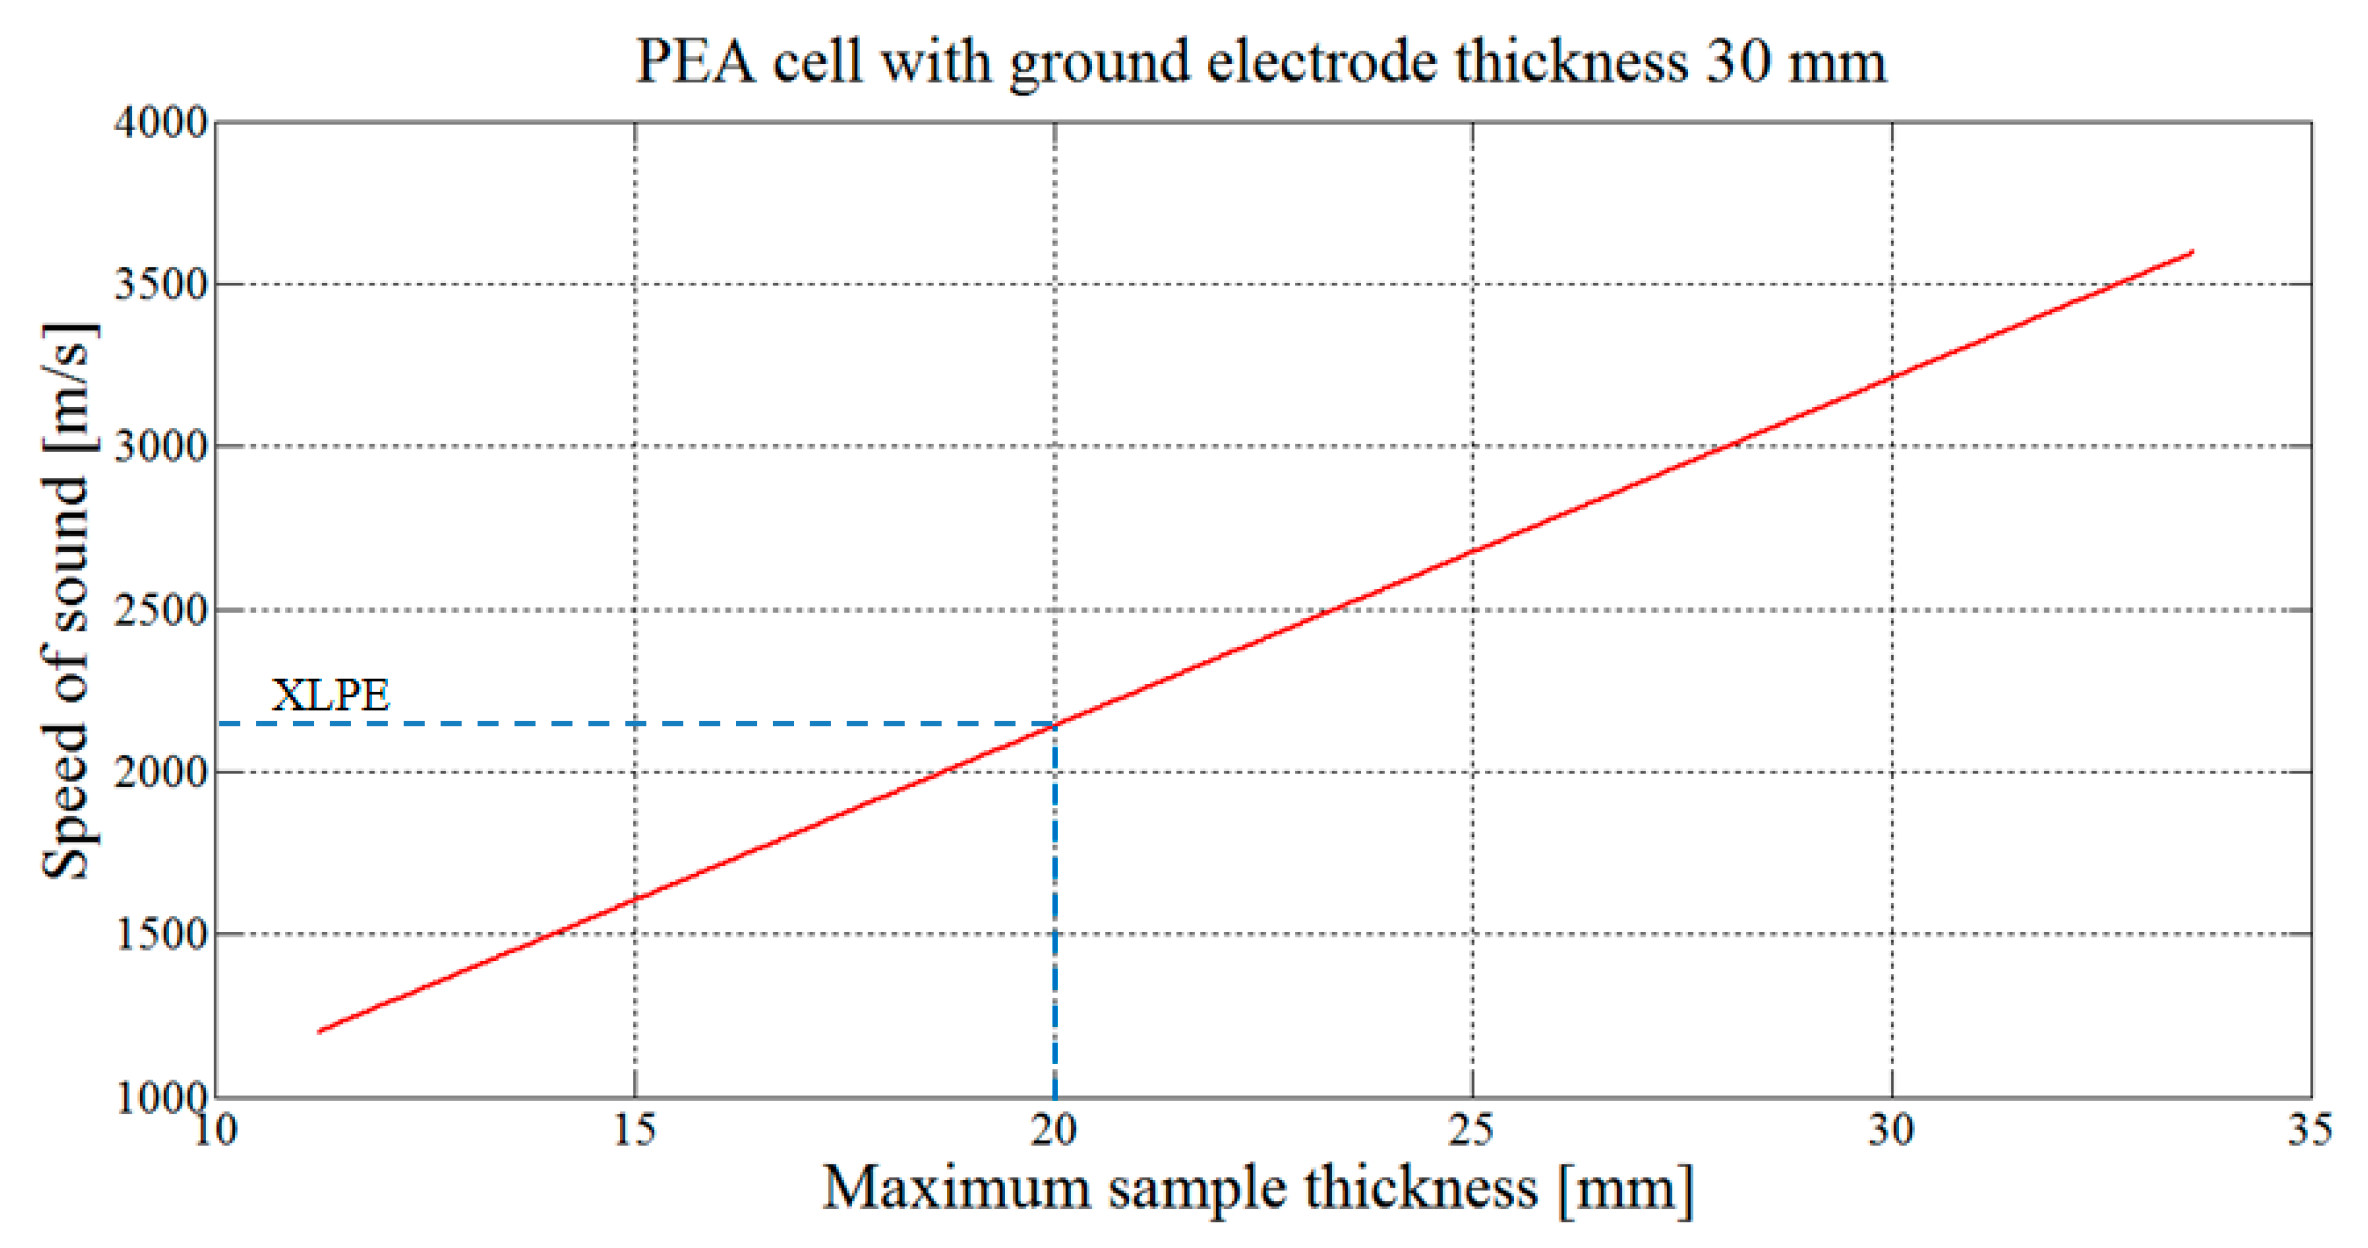
This drawback occurs because the features of the cable under test (thickness and sound velocity of the dielectric layer) are not compatible with the employed PEA cell (with 30 mm thick ground electrode). In fact, if the same PEA cell is used, the maximum allowed XLPE dielectric thickness must be lower than 20 mm, as can be calculated by means of Equation (1).
d d < 2 v d d G R v A L ;
where d d and d G R are the thicknesses of the dielectric layer and the ground electrode, respectively. While, v d and v A L are the sound velocities of the materials involved, such as dielectric and aluminum.
To better explain how Equation (1) is derived, Figure 5 can be observed. Calling t d the time needed for an acoustic wave to cross the cable insulation layer, calculated as t d = d d / v d , and t G R the time for an acoustic wave to cross the ground electrode, t G R = d G R / v G R . By neglecting the semiconductor layer, it is possible to prevent the reflected acoustic wave p R ( t ) from overlapping to the main acoustic wave p + ( t ) . The former indeed reaches the sensor after 3 t G R , while the latter needs a time interval equal to t d + t G R to reach the sensor and, as a result, the relationship 3 t G R > t d + t G R must be satisfied.
To facilitate and make a faster evaluation of the maximum dielectric thickness that can be tested with the PEA cell having the ground electrode of 30 mm, a graph has been plotted in Figure 8.
Of course, though, dielectric thickness depends on the cable’s operating voltage. This means that the PEA cell must be adapted to the specific cable in accordance with the needs of the manufacturing company. However, to overcome the above discussed problem, and therefore to avoid the presence of the reflected wave p R ( t ) in the main signal, the ground electrode of the PEA cell must be correctly sized and selected. For this aim, Equation (2), which is derived from Equation (1), can be used.
d G R > 1 2 d d v A L v d
As in the previous case, an abacus (see Figure 9) can be useful to easily determine the ground thickness on the basis of the cable features (thickness and sound velocity of the dielectric layer). In this case, in which the space charge must be measured in a cable with dielectric thickness equal to 20 mm and sound velocity of the XLPE equal to 2200 m/s, the correct ground electrode thickness must be greater than 34 mm.
To verify the above-mentioned, a simulation has been made by changing the thickness of the ground electrode from 30 (see Figure 6) to 34 mm. As it can be seen from Figure 10, which is the output of the PEA cell model, the reflected wave p R ( t ) is detected by the sensor at almost 16 μs, while the positive peak p + ( t ) at a time equal to 14.6 μs.
In this work, the pulse generator has been applied into the partially stripped outer semiconductive layer of the cable. In future work, in order to verify the effect of injecting voltage pulses into a coaxial cable, further two test methods will be considered, such as pulse injection into the cable conductor and pulse injection into the measuring electrode [35].

8. Conclusions

The purpose of this work was to provide useful information to cable manufacturing industries in order to avoid incorrect evaluation of the space charge profiles measured with the PEA method. In addition, a complete summary of the protocol to be followed and suggested by the IEEE Std 1732-2017 has also been given.
In this aim, an experimental test has been carried out inside a high voltage laboratory of a cables industry supporting the research. Measurement result obtained for a full-size XLPE insulated cable shows that the space charge profile is not clear and therefore its interpretation turns to be complex.
The obtained experimental results prove to be quite useful for cable industries that carry out pre-qualification and type tests and thus need to satisfy the standard IEEE 1732-2017. The latter standard calls for the performance of space charge measurement in cable specimens. The advantages provided by this study are useful for the choice of the PEA cell features (in particular the thickness of the ground electrode thickness) on the basis of the manufactured cables (thickness and sound velocity of the dielectric layer). Therefore, the suggestions reported in this work may be used to obtain a clear PEA cell output signal (without noise signals within the main charge profile) and thus avoid its mis-interpretation. Beyond this, a clear space charge profile allows to obtain a clear electric field distribution, which, as requested by the standard IEEE 1732-2017, must be carefully analyzed. Moreover, the model results provide a very useful tool in order to differentiate the main signal from the reflections.
The solution to the issues encountered in the proposed work has been given after analyzing simulation results provided by a PEA cell model. Simulation results show that the overlap of the acoustic waves was essentially due to the ground electrode thickness. In fact, after changing the ground electrode dimensions from 30 to 34 mm the negative reflected wave falls over the main positive space charge peak. In this way, at least in simulation, the PEA cell output signal is clear and easy to be correctly interpreted. To facilitate the choice of the ground electrode thickness as well as the maximum dielectric features that can be tested for a given PEA cell, two useful graphs are also provided.
In conclusion, it is important to notice that in the simulation model the attenuation of the acoustic waves has not been taken into account. This can be made in future work, as well as a further experimental test with the greater ground electrode thickness.

Author Contributions

Conceptualization, A.I. and P.R.; methodology, A.I. and G.R.; software, A.I.; validation, P.R. and F.V.; formal analysis, A.I., P.R. and G.R.; investigation, A.I.; resources, A.I.; writing—original draft preparation, A.I.; writing—review and editing, A.I., P.R. and E.R.S.; supervision, G.C. and G.A.

Funding

This research was funded by Prysmian Group S.p.A.

Acknowledgments

The authors thank Luca De Rai, Stefano Franchi Bononi and Marco Albertini, Prysmian Group S.p.A., for the support in the measurements at the high voltage laboratory in Milan.

Conflicts of Interest

The authors declare no conflict of interest.

References

  1. Richardson, B.; Ramachandran, R. Enhanced energy efficiency of underground cables. In Proceedings of the IEEE PES T&D 2010, New Orleans, LA, USA, 19–22 April 2010; pp. 1–5. [Google Scholar]
  2. Fard, M.A.; Farrag, M.E.; McMeekin, S.; Reid, A. Electrical Treeing in Cable Insulation under Different HVDC Operational Conditions. Energies 2018, 11, 2406. [Google Scholar] [CrossRef]
  3. Xiong, L.; Chen, Y.; Jiao, Y.; Wang, J.; Hu, X. Study on the Effect of Cable Group Laying Mode on Temperature Field Distribution and Cable Ampacity. Energies 2019, 12, 3397. [Google Scholar] [CrossRef]
  4. Ahmed Dabbak, S.Z.; Illias, H.A.; Ang, B.C.; Abdul Latiff, N.A.; Makmud, M.Z.H. Electrical Properties of Polyethylene/Polypropylene Compounds for High-Voltage Insulation. Energies 2018, 11, 1448. [Google Scholar] [CrossRef]
  5. Powers, W.F. The basics of power cable. IEEE Trans. Ind. Appl. 1994, 30, 506–509. [Google Scholar] [CrossRef]
  6. Dissado, L.A.; Fothergill, J.C. Electrical Degradation and Breakdown in Polymers; Peregrinus Press: London, UK, 1992. [Google Scholar]
  7. Mazzanti, G.; Marzinotto, M. Space Charge in HVDC extruded insulation: Storage, effect, and measurement methods. In Extruded Cables for High Voltage Direct Current Transmission: Advances in Research and Development, Power Engineering Series; Wiley-IEEE Press: Hoboken, NJ, USA, 2013; pp. 99–207. [Google Scholar]
  8. Benato, R.; Balanuye, İ.; Köksal, F.; Ozan, N.; Özdemirci, E. Installation of XLPE-Insulated 400 kV Submarine AC Power Cables under the Dardanelles Strait: A 4 GW Turkish Grid Reinforcement. Energies 2018, 11, 164. [Google Scholar] [CrossRef]
  9. Bannach, D.; Kirchner, M.; Neubert, R. Retrofitting-new high voltage XLPE cables substituting paper-insulated power cables in steel pipes. IEEE Trans. Power Deliv. 1998, 13, 287–291. [Google Scholar] [CrossRef]
  10. Hanley, T.L.; Burford, R.P.; Fleming, R.J.; Barber, K.W. A general review of polymeric insulation for use in HVDC cables. IEEE Electr. Insul. Mag. 2003, 19, 13–24. [Google Scholar] [CrossRef]
  11. Kaminaga, K. Development of 500-kV XLPE cables and accessories for long-distance underground transmission lines. Long-term performance for 500-kV XLPE cables and joints. IEEE Trans. Power Deliv. 1996, 11, 1185–1194. [Google Scholar] [CrossRef]
  12. Chen, G.; Hao, M.; Xu, Z.; Vaughan, A.; Cao, J.; Wang, H. Review of high voltage direct current cables. CSEE J. Power Energy Syst. 2015, 1, 9–21. [Google Scholar] [CrossRef]
  13. Tang, C.; Huang, B.; Hao, M.; Xu, Z.; Hao, J.; Chen, G. Progress of Space Charge Research on Oil-Paper Insulation Using Pulsed Electroacoustic Techniques. Energies 2016, 9, 53. [Google Scholar] [CrossRef]
  14. Imburgia, A.; Romano, P.; Sanseverino, E.R.; Viola, F.; Hozumi, N.; Morita, S. Space charge behavior of different insulating materials employed in AC and DC cable systems. In Proceedings of the International Symposium on Electrical Insulating Materials (ISEIM), Toyohashi, Japan, 11–15 September 2017; Volume 2, pp. 629–632. [Google Scholar]
  15. De Araujo Andrade, M. Different Space Charge Behavior of Materials Used in AC and DC Systems. In Proceedings of the IEEE Conference on Electrical Insulation and Dielectric Phenomenon (CEIDP), Fort Worth, TX, USA, 22–25 October 2017; pp. 114–117. [Google Scholar]
  16. Maeno, Y.; Hirai, N.; Ohki, Y.; Tanaka, T.; Okashita, M.; Maeno, T. Effects of crosslinking byproducts on space charge formation in crosslinked polyethylene. IEEE Trans. Dielectr. Electr. Insul. 2005, 12, 90–97. [Google Scholar] [CrossRef]
  17. Suzuki, H.; Nozomu, A.; Miyake, H.; Tanaka, Y.; Maeno, T. Space charge accumulation and electric breakdown in XLPE under DC high electric field. In Proceedings of the Annual Report Conference on Electrical Insulation and Dielectric Phenomena, Shenzhen, China, 20–23 October 2013; pp. 250–253. [Google Scholar]
  18. Notingher, P.; Toureille, A.; Agnel, S.; Castellon, J. Determination of Electric Field and Space Charge in the Insulation of Power Cables with the Thermal Step Method and a New Mathematical Processing. IEEE Trans. Ind. Appl. 2009, 45, 67–74. [Google Scholar] [CrossRef]
  19. Imburgia, A.; Romano, P.; Caruso, M.; Viola, F.; Miceli, R.; Riva Sanseverino, E.; Madonia, A.; Schettino, G. Contributed Review: Review of thermal methods for space charge measurement. Rev. Sci. Instrum. 2016, 87, 111501. [Google Scholar] [CrossRef] [PubMed] [Green Version]
  20. Ala, G.; Caruso, M.; Cecconi, V.; Ganci, S.; Imburgia, A.; Miceli, R.; Romano, P.; Viola, F. Review of acoustic methods for space charge measurement. In Proceedings of the AEIT International Annual Conference, Naples, Italy, 14–16 October 2015; pp. 1–6. [Google Scholar]
  21. Mazzanti, G. A protocol for space charge measurements in full-size HVDC extruded cables. IEEE Trans. Dielectr. Electr. Insul. 2015, 22, 21–34. [Google Scholar] [CrossRef] [Green Version]
  22. Imburgia, A.; Miceli, R.; Riva Sanseverino, E.; Romano, P.; Viola, F. Review of space charge measurement systems: Acoustic, Thermal and Optical methods. IEEE Trans. Dielectr. Electr. Insul. 2016, 23, 3126–3142. [Google Scholar] [CrossRef]
  23. Rizzo, G.; Romano, P.; Imburgia, A.; Ala, G. Review of PEA Method for space charge measurements on HVDC cables and mini-cables. Energies 2019, 12, 3512. [Google Scholar] [CrossRef]
  24. Bodega, R.; Morshuis, P.H.F.; Smit, J.J. Electrostatic force distribution in a multi-layer dielectric tested by means of the PEA method. In Proceedings of the 2004 IEEE International Conference on Solid Dielectrics, 2004, Toulouse, France, 5–9 July 2004; Volume 1, pp. 264–267. [Google Scholar]
  25. Bodega, R.; Morshuis, P.H.F.; Smit, J.J. Space charge measurements on multi-dielectrics by means of the pulsed electroacoustic method. IEEE Trans. Dielectr. Electr. Insul. 2006, 13, 272–281. [Google Scholar] [CrossRef]
  26. De Araujo Andrade, M. Interpretation of PEA Output Signal in a Multilayer Specimen. In Proceedings of the IEEE Conference on Electrical Insulation and Dielectric Phenomena (CEIDP), Cancun, Mexico, 21–24 October 2018; pp. 101–104. [Google Scholar]
  27. Imburgia, A.; Romano, P.; Ala, G.; Riva Sanseverino, E.; Giglia, G. The Role of Right Interpretation of Space Charge Distribution for Optimized Design of HVDC Cables. IEEE Trans. Ind. Appl. 2019. [Google Scholar] [CrossRef]
  28. Romano, P.; Imburgia, A. Effect of Acoustic Wave Reflections on Space Charge Measurements with PEA Method. In Proceedings of the International Forum on Research and Technology for Society and Industry (RTSI), Palermo, Italy, 10–13 September 2018; pp. 1–6. [Google Scholar]
  29. Alatawneh, N. Effects of cable insulations′ physical and geometrical parameters on sheath transients and insulation losses. Int. J. Electr. Power Energy Syst. 2019, 110, 95–106. [Google Scholar] [CrossRef]
  30. Stancu, C. Computation of the Electric Field in Cable Insulation in the Presence of Water Trees and Space Charge. IEEE Trans. Ind. Appl. 2009, 45, 30–43. [Google Scholar] [CrossRef] [Green Version]
  31. Luo, K.; Yi, H.; Tan, H.; Wu, J. Unified Lattice Boltzmann Method for Electric Field–Space Charge Coupled Problems in Complex Geometries and Its Applications to Annular Electroconvection. IEEE Trans. Ind. Appl. 2017, 53, 3995–4007. [Google Scholar] [CrossRef]
  32. Mazzanti, G.; Marzinotto, M.; Castellon, J.; Chen, G.; Fothergill, J.; Fu, M.; Hozumi, N.; Lee, J.-H.; Li, J.; Mauseth, F.; et al. Recommended Practice for Space Charge Measurements on High-Voltage Direct-Current Extruded Cables for Rated Voltages up to 550 Kv; IEEE Standard Association (IEEE-SA): Piscataway, NJ, USA, 2017. [Google Scholar]
  33. Imburgia, A.; Romano, P.; Sanseverino, E.R.; De Rai, L.; Bononi, S.F.; Troia, I. Pulsed Electro-Acoustic Method for specimens and cables employed in HVDC systems: Some feasibility considerations. In Proceedings of the AEIT International Annual Conference, Bari, Italy, 3–5 October 2018; pp. 1–6. [Google Scholar]
  34. Bauer, B. Equivalent circuit analysis of mechano-acoustic structures. Trans. IRE Prof. Group Audio 1954, 2, 112–120. [Google Scholar] [CrossRef]
  35. Wang, X. Comparison and analysis of three pulse injection methods in the pulsed electroacoustic technique used for long cables. IEEE Electr. Insul. Mag. 2018, 34, 17–31. [Google Scholar] [CrossRef]
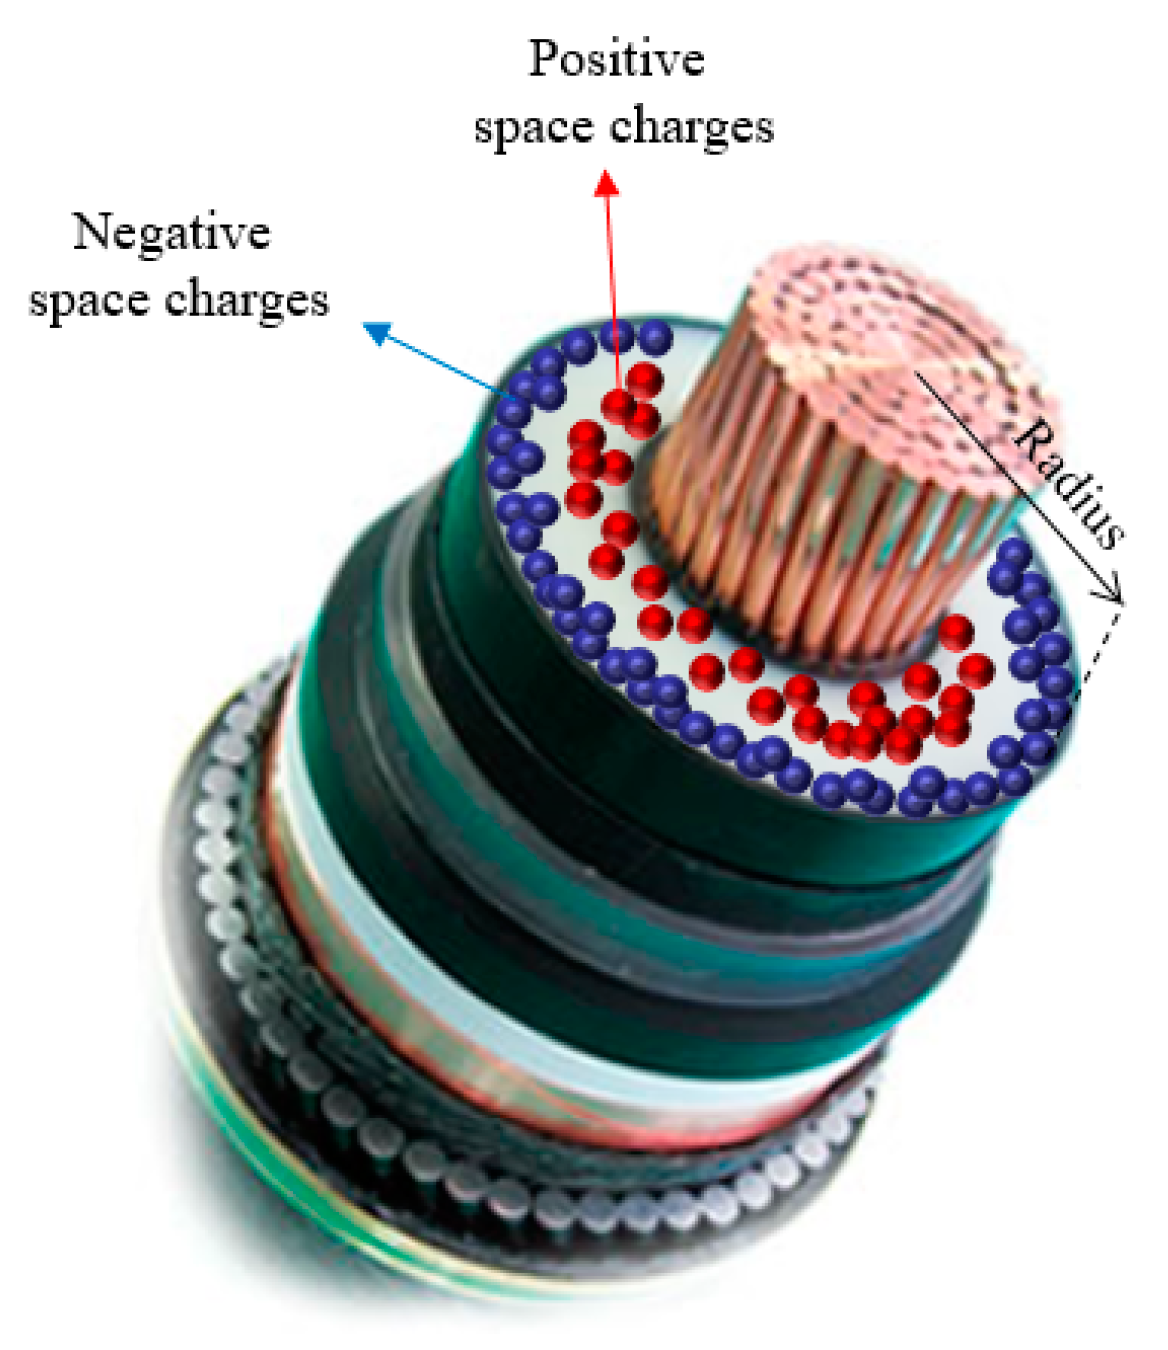
Figure 1. High voltage direct current (HVDC) cable with accumulated surface and space charges.
Energies 12 04186 g001
Figure 2. (a) Space charge distribution in a full-size cable and (b) related electric field profiles.
Energies 12 04186 g002
Figure 3. Pulsed electro-acoustic (PEA) measurement setup for space charge measurement in cables.
Energies 12 04186 g003
Figure 4. PEA cell output signal depicted by the oscilloscope.
Energies 12 04186 g004
Figure 5. Section of the cable under test and the part of the PEA cell, the latter being responsible of acoustic waves reflection. The paths of the positive and negative waves, both direct and reflected, are reported.
Energies 12 04186 g005
Figure 6. Simulation result for dielectric thickness equal to 20 mm and ground electrode thickness equal to 30 mm. The positive acoustic wave overlaps with the negative wave reflected within the ground electrode.
Energies 12 04186 g006
Figure 7. Zoom of simulation result in correspondence of the time in which the negative reflected wave and positive wave are superimposed.
Energies 12 04186 g007
Figure 8. Graph useful to determine the maximum sample thickness that can be tested without reflections in the main output signal, on the basis of the 30 mm thick ground electrode.
Energies 12 04186 g008
Figure 9. Abacus for the choice of the minimum ground electrode thickness needed to avoid reflections in the main output signal. The red dotted line highlights our case in which the dielectric layer made of XLPE material have sound velocity of 2200 m/s and thickness 20 mm.
Energies 12 04186 g009
Figure 10. Simulation result for dielectric thickness equal to 20 mm and ground electrode thickness equal to 34 mm. The negative reflected wave falls outside the positive acoustic wave.
Energies 12 04186 g010
Table 1. Main PEA cell and cable layers features.
ComponentLayerMaterialSound Speed (m/s)Thickness (m)
CableDielectricXLPE220020 × 10−3
SemiconductorSemiconductor~22002 × 10−3
PEA cellGround ElectrodeAluminum642030 × 10−3
PiezoelectricPVDF204040 × 10−6