Abstract
The impacts of energy accidents are of primary interest for risk and resilience analysts, decision makers, and the general public. They can cause human health and environmental impacts, economic and societal losses, which justifies the interest in developing models to mitigate these adverse outcomes. We present a classification model for sorting energy accidents in the natural gas sector into hazard classes, according to their potential fatalities. The model is built on decision rules, which are knowledge blocks in the form of “if (condition), then (classification to hazard class x)”. They were extracted by the rough sets method using natural gas accident data from 1970–2016 of the Energy-related Severe Accident Database (ENSAD) of the Paul Scherrer Institut (PSI), the most authoritative information source for accidents in the energy sector. This was the first attempt to explore the relationships between the descriptors of energy accidents and the consequence (fatalities). The model was applied to a set of hypothetical accidents to show how the decision-making process could be supported when there is an interest in knowing which class (i.e., low, medium, high) of fatalities an energy accident could cause. The successful use of this approach in the natural gas sector proves that it can be also adapted for other energy chains, such as oil and coal.
1. Introduction
Societies worldwide rely on energy to satisfy many of their needs, among others, cooking, warming, cooling, transportation, and electricity generation [1]. Nonetheless, maintaining a constant provision of energy is a technological and political challenge, since there are continuous disruptions that can affect its reliable and efficient supply. They can be initiated by different causes, such as man-made (e.g., lack of maintenance), technological (e.g., collapse of an infrastructure), and natural (e.g., earthquake, flood), resulting in events such as, for example, explosions, fires, and release of toxic substances. These disruptions cause health, environmental, economic, and social impacts [2], such as fatalities, injuries, evacuees, ban on consumption of food, release of toxic substances, and economic losses [3,4].
One of the major strategies devised to identify the weak points in the energy infrastructure and study where the highest accident frequencies and consequences (e.g., fatalities) can be expected has been to gather consistent information on incidents, accidents, and near misses in the energy sector by storing detailed information, including their location, the type of energy chain, and infrastructure as well as the type of detrimental impacts, etc. [3,4,5,6,7]. Sovacool et al. [5] proposed a dataset of 1085 energy accidents for 11 energy systems over the period 1874–2014. These authors exclude end use from their dataset and define an energy accident as “unintentional incident or event at an energy facility that led to either one death (or more) or at least $50,000 in property damage”. The Energy-related Severe Accident Database (ENSAD) of the Paul Scherrer Institut (PSI) has been developed since the 1990s, and it covers multiple energy chains and their whole life cycle [8,9]. For the time horizon 1970–2016, ENSAD comprises 23,455 unique accident records for which 32,849 consequence records are available [10].
These databases are excellent repository sources that store consistent information on the accidents according to the life cycle stage of each energy chain. So far, they have been analyzed through statistical methods looking at frequencies of events, ranges of fatalities, releases of hazardous substances, and cost of accidents [2,4,5,9,11,12,13,14,15]. Such findings can be used by different stakeholders including industry and authorities among others, to inform the construction of the forthcoming energy policies, strategic planning, scenario development, or assessment of individual facilities. Up to now, these datasets have been screened by looking at single descriptors (e.g., country, energy chain) in relation to the absolute impacts and not correlated to, e.g., ranges of fatalities, injuries, and released amounts of toxic substances. For example, Sovacool et al. [5] looked at which energy chains performed the worst with respect to frequency, fatalities, and damage cost of energy accidents. Burgherr et al. [14] conducted a comparative assessment of oil, coal, and gas energy chains with reference to the number of fatalities according to several country groups, e.g., Organisation for Economic Co-operation and Development (OECD), Middle East and North Africa (MENA), Organization of the Petroleum Exporting Countries (OPEC), and other non-OECD. The latter research team [2] assessed the relative share of accidents and fatalities in the various stages of fossil energy chains.
The analyses of these datasets have, however, not looked at the integrated and interdependent influence and relevance of the descriptors of energy accidents on the outcome event, such as fatalities or release of hazardous materials. In addition, the added value and the relevance of the variables used to store the information on each accident has been overlooked. More specifically, research challenges of interest for the future of energy accidents prevention and management include (i) the evaluation of the ability of datasets to discern the accidents according to the various outcomes, such as fatalities, injuries, evacuees, or monetary damage; (ii) the identification of the features of the accidents that affect different ranges of outcome; and (iii) the assignment of a class of concern to future accidents. These are important knowledge gaps to be tackled as they could provide solutions to pressing issues, including the harmonization process of data gathering on energy accidents on a global scale and the refinement of energy policies, plans, and scenarios based on valuable information on past energy accidents [16,17,18]. Another interesting avenue of research would consist in analyzing the types of uncertainties that affect the development of databases for energy accidents. Following the newly proposed uncertainty categorization framework by Pelissari et al. [19], which distinguishes (i) ambiguity, (ii) stochasticity, and (iii) partial information as main categories, it would be possible to characterize the uncertainty inherent in each accident information.
Nowadays, a large share (i.e., 21%) of the world primary energy consumption is covered by natural gas [1], and this figure is projected to rise steadily in the coming decades [20]. This justifies the need for risk and resilience assessment of the current and future natural gas infrastructure in case of normal operation as well as emergency situations [21,22,23,24,25,26], which led our team to start addressing the research challenges mentioned above for this energy chain.
This paper presents an update and expansion of our previous analysis of the ENSAD dataset with the rough sets approach [27] and it provides three novel contributions. First, the ENSAD dataset for the natural gas energy chain was adapted for the analysis with the rough sets approach (a type of Multiple Criteria Decision Analysis (MCDA) method) by defining a set of descriptors (i.e., attributes), which describe how each accident happened and also a class of fatality caused by each event. Second, an initial minimal set of relevant and non-redundant descriptors of the ENSAD accidents that can be used to distinguish accidents that cause different levels of fatalities for the natural gas energy chain is proposed. Third, an original sorting model, based on decision rules of multiple typologies, was proposed for classification of energy accidents in hazard classes. It must be pointed out that this model can also support the analysts in learning about the problem under consideration and allows them to justify their choices using a transparent and systematic process. This methodology can guide the analysts to explore, interpret, and even debate about the subject [28]. The simple syntax of the decision rules (“if …, then …”) can help the analysts discussing the classifications of the accidents with the decision maker (DM) and start a dialogue that can lead to a more informed perspective on the problem.
A main objective of our research is to contribute to the generation of “lessons learned from the accidents” to provide an indication of the possible impacts of new accidents in the natural gas sector. This strategy can start complementing, from an energy management perspective, the long-standing initiative of the European Commission for the mitigation of potential consequences from incidents, accidents, and near misses [29].
Another objective of the research is to complement the resilience literature by looking at how advanced hazard assessment can contribute to natural gas performance evaluation. In fact, the natural gas energy chain is a complex system, whose performance can decrease according to the severity of each disruption. This loss of performance and need of recovery of a key service links clearly to the concept of resilience, which can be interpreted as the capacity of a system to absorb and recover from adverse events [30,31,32]. Due to the importance of natural gas in the current society, several studies started looking at the resilience of natural gas from multiple perspectives [33,34,35]. A recent framework, based on three main sets of functions, has been proposed for infrastructure resilience assessment by the Future Resilient Systems (FRS) program at the Singapore-ETH Centre (http://www.frs.ethz.ch/) [36]. Such functions include the ability of a system to resist, restabilize, rebuild, and reconfigure its functionality (biophysical functions), the potential to implement emergency responses (enabling functions), and the capabilities to monitor the state of the system and identify weak signals to prevent detrimental effects of disruptions (cognitive functions). The research presented in this paper contributes to one of the latter functions, specifically to the development of the one called “remember”. The information stored in ENSAD can, in fact, be used to tackle forthcoming accidents with more awareness of their possible impacts.
2. Materials and Methods
This section describes the structure of the dataset based on ENSAD that was created for this research (Section 2.1) and the MCDA method that was employed to analyze it and develop the classification model (Section 2.2).
2.1. The Energy-Related Severe Accidents Database (ENSAD)
ENSAD is a long-term and active initiative that started in the early 1990s by PSI and it is currently one of the most respected databases on energy accidents in the world [9]. Some of the reasons for this achievement are the verified and traceable natures of each information entry, the coverage of complete energy chains, and the adoption of consistent severity thresholds on the outcomes [9].
Each accident in ENSAD is characterized by its date, location, energy chain (e.g., natural gas, coal, oil) and chain stage (e.g., extraction, transportation, storage, commercial use), infrastructure typology (e.g., mine, refinery, dam, pipeline), and sequence of detrimental events (e.g., explosion, release, fire). The complete list of these accident descriptors is presented in Tables S1–S3 in the Supplementary Information (SI). The outcomes are the resulting fatalities, injuries, evacuees, release of toxic material, and economic loss. For this research, the natural gas chain was selected, a choice driven by the fact that this energy chain is a key asset for primary energy production worldwide and it is currently a major research focus within the ENSAD team [20,34,37]. ENSAD contains natural gas accidents data from 1970 to 2016, and an update and verification up to 2018 is under way as part of the FRS program and PSI efforts. Though, the last consolidated and validated database version for natural gas was used, including accidents from 1970 to 2016, and was employed to develop the classification model based on the decision rules. It included all the severe accidents (according to the definition adopted in ENSAD, severe accident causes, for example, at least 5 fatalities, or 10 injuries, or 200 evacuees, etc. [13]. For simplicity, the adjective “severe” will be omitted throughout the paper) that caused at least 5 fatalities, which were 250 in total. The format of the accidents stored in ENSAD resembles a standard information table for MCDA, with the rows as the alternatives and the columns as the features (attributes or criteria) describing them. There is normally also one column that characterizes the evaluation of each alternative, i.e., an aggregated measure of the individual features.
In the current case study, the alternatives are the energy accidents from ENSAD, and the attributes are eight, including country cluster (), energy chain stage (), infrastructure type (), and event chain sequence from 1 up to 5 () (see Table 1 for a sample of the information table and Tables S1–S3 in SI for a full list of attributes). These were considered as main descriptors to discern accidents according to their entity of consequences, an assumption that was tested in the analysis phase.

Table 1.
A sample of the information table for energy accidents from Energy-related Severe Accident Database (ENSAD).
The outcome of ENSAD is currently the number of fatalities that each energy accident caused, which is a primary concern for each risk and resilience analyst, decision maker (DM), and also the general public. Three classes of the 1970–2016 knowledge base datasets were defined for the ranges of fatalities with the framing of low, medium, and high impact events. This translates in = 5 to 10 fatalities (161 accidents); = between 11 and up to 20 fatalities (53 accidents); = more than 20 fatalities (36 accidents). The lower boundary for low impact was selected according to the minimum severity threshold of 5 fatalities in ENSAD [14], while the boundary for high impact was chosen based on the minimum selection criterion of 20 fatalities for man-made disasters and natural catastrophes used by SwissRe, a renowned reinsurance company in this area [38]. The medium class with fatalities between 11 and 20 was defined to examine possible differences of these accidents with respect to those with higher or lower impacts.
2.2. MCDA Method: Rough Sets
The selection of the MCDA method needs to fit with the structure of the problem [39,40], which in this case included the following requirements:
- Assess the quality of information (i.e., attributes) stored in ENSAD to distinguish accidents in relation to the range of fatalities caused;
- Discover the patterns that explain the accidents by accounting for the interrelations and interdependencies of the attributes used in ENSAD;
- Provide a class of concern for potential forthcoming accidents not part of the knowledge base dataset, while transparently justifying the sorting.
According to these constraints, the MCDA literature [40,41,42,43,44] was searched to verify if a relevant method was available, which was eventually the case. The method that appeared as suitable was the rough sets approach as it can provide all the contributions required to start filling the research gaps [45,46]. Firstly, the approach provides information about the classification ability of the selected attributes and the minimal set indispensable for the consistent classification. Secondly, a classification model composed of decision rules expressed as “if (condition), then (classification to )” is provided. The rules are transparent and easily understandable by the DMs. They are also related to specific alternatives (i.e., energy accidents), which allows tracing and improving the decision process. Thirdly, the classification model can be used to classify accidents not being part of the knowledge base to assess the concern inherent in a new and unforeseen accident or a past one. The next sections provide a detailed description of the rough sets method (Section 2.2.1), the contributions of this method when applied to ENSAD (Section 2.2.2), and the strategies used to validate the proposed model for sorting energy accidents in fatality classes (Section 2.2.3).
2.2.1. Description of the Rough Sets Method
This section describes how the rough sets method operates on the ENSAD data. Table 2 shows that the ENSAD dataset is in MCDA terms a complete information table, with an objective measure (i.e., class of fatalities) as a characteristic for every accident. This typology of information tables is suitable for patterns and trends analysis, whose methods can discover the information/knowledge “hidden” in (in)complete datasets of attributes (condition attributes) and outcomes (decision attributes) [47,48].
Table 2.
Simplified information table for energy accidents from ENSAD.
Table 2 is an example of simplified information table from ENSAD composed of S = (U, A, P), where U = set of accidents; A = set of attributes (); .
The subsets of accidents that have the same values for the attributes represent alternatives that are indiscernible (similar) in light of the available information. They actually represent elementary granules of knowledge and are defined as elementary building blocks (atoms) of our dataset. Unions of elementary concepts are called crisp, whereas any other sets are called rough (vague, imprecise). Formally, an indifference class of accident with respect to is defined as a set of accidents which have exactly the same values as on all condition attributes in .
Every set X has two types of crisp sets, called the lower and upper approximation of X. The lower approximation of X is composed of all the elements (accidents) that surely belong to X, whereas the upper approximation of X is the set of elements (accidents) that possibly belong to X. Formally, these approximations are defined as follows:
The above definitions admit that X is either a single class or a class union. Both these options are accounted for in the main paper.
The difference between lower and upper approximation is called the boundary region and a set is rough when it has a non-empty boundary region. The main characteristic of the boundary region is that its elements cannot be classified precisely using the available information. All the accidents in Table 2 have different values for all condition attributes () and outcome D. Consequently, all the accidents are discernible according to the information from the attributes. However, considering only condition attributes , , and , accidents 2 and 3 are indiscernible. Subsets of attributes enable the partition of the dataset into clusters of accidents having the same score on such attributes. As an example, attributes , and provide this clustering of accidents {1}, {2, 3}, {4}, {5}, {6}.
An important issue for the management of energy accidents is to understand which are the conditions that lead to accidents that are less severe (class corresponding to accidents with 5 to 10 fatalities) and which are more severe (class corresponding to accidents with 11 to 20 fatalities). In other words, the objective is to characterize accidents in classes and in view of the attributes .
One first feature to note is that accidents 2 and 3 are characterized by the same values for but accident 2 causes 11 to 20 fatalities, whereas accident 3 causes 5 to 10 fatalities. This implies that the current information allows to state that accidents 1 and 6 cause 5 to 10 fatalities, accidents 4 and 5 cause 11 to 20 fatalities, and for accident 2 and 3 it is not possible to know whether they cause 5 to 10 fatalities or 11 to 20 fatalities.
According to attributes , it is possible to state that accidents 1 and 6 surely cause 5 to 10 fatalities, i.e., surely belong to class , while accidents 1, 2, 3, and 6 possibly cause 5 to 10 fatalities, i.e., possibly belong to class . The set {1, 6} represents the lower approximation , whereas the set {1, 2, 3, 6} constitutes the upper approximation of class . The difference between upper and lower approximations is the set {2, 3}, which constitutes the boundary/rough set region of class .
2.2.2. The Contributions of Rough Sets Analysis When Applied to ENSAD
The first useful measure that was obtained with rough sets analysis applied to the dataset from ENSAD is the quality of classification , i.e., the ratio between the accidents that surely belong to a class (i.e., in the lower approximations) with respect to all the accidents in the dataset . expresses the ratio between the accidents-correctly classified () with respect to all the accidents in the dataset. In the previous example from Table 2, , i.e., 67% of the accidents can be correctly/surely identified according to the available information as causing 5 to 10 fatalities or 11 to 20 fatalities. It indicates how well the selected attributes allow discerning the accidents in relation to the class of fatalities.
The second contribution of rough sets analysis is the evaluation of possible superfluous information in the dataset, with respect to the selected attributes. It is possible to state that an outcome D (e.g., fatality) totally depends on the set of attributes A if all the values of the outcome are uniquely determined by the values of the attributes. In case where there is a subset of , named , such that. represents a reduct of as it allows obtaining the same quality of classification of . In other words, the reduct represents the minimal subset of attributes that is sufficient to guarantee that the highest degree of dependency between and is maintained, with the least amount of information (i.e., attributes) from the dataset. In the example from Table 2, , and , are the two reducts with respect to , meaning that either country and energy chain stage or energy chain stage and infrastructure type can be used to distinguish the range of fatalities caused and obtain the same quality of classification (i.e., 67%) as the whole set of attributes .
The dependencies that exist between attributes and outcome, expressed as , can be defined in the form of “if …, then …” decision rules (denoted by ), which is the third contribution of the rough sets method. They are logical formulas describing conditions and outcomes in the dataset. They are built up from elementary characteristics of the accidents (attribute, value) connected by means of the preposition “and”.
Some examples of certain rules from Table 2 are:
- “If the energy stage is transport, then the fatalities caused by the accident are 5 to 10 (from accidents 1 and 6);
- “If the country is non-OECD and the energy stage is extraction, then the fatalities caused by the accident are 11 to 20” (from accident 5);
- “If the energy stage is upstream, then the fatalities caused by the accident are 11 to 20” (from accident 4).
The rules induction algorithm used in this case study is the LEM2, as it is a good option for searching set of rules by selecting the minimum elementary conditions of the attributes [49]. In this paper, we add to the standard single class-based rules the rules for ordinal classification (i.e., union of classes-based rules), which look at the combined conditions of the accidents that lead to a union of classes and not a single one. A simple example of such a rule from Table 1 is “If the country is OECD and event chain 1 is fire, then the fatalities caused by the accident are either between 5 and 10 or 11 and 20”. This implies either or , which means that the union of classes can be expressed as . In this case study, the rules of interest for ordinal classification are for at least , indicated as or for at most , indicated as (note that the rules with the decision part corresponding to the class unions “at least ” and “at most ” are equivalent to the standard rules with conclusions “” and “”, respectively).
Having rules of two typologies brings the added value of providing an additional layer of information extracted from ENSAD as well as further support in the analysis of new accidents. In fact, the decision rules can be employed to classify new accidents according to the values of their attributes in order to understand their concern level from a potential fatalities perspective. Two strategies have been employed in this research, the first called standard classification and the second referring to advanced classification (see details in Błaszczyński et al. [50]). The standard classification scheme assigns the class according to what rules cover the accident. The standard scheme is very transparent in the sense that its sorting can be visualized by means of the rules that match the new accidents and shown accordingly in a figure (for an example see Cinelli et al. [27]). However, there can be cases where rules for different classes (e.g., and , and ) match the accident and consequently a contradiction in terms of suggested classification takes place. A univocal allotment can still be reached by means of an advanced classification scheme that considers the set of decision rules covering a given accident m (referred to as set R) and provides a measure expressed as , which is the result of the difference between two other scores [50]. The first one is that accounts for all the rules that support the assignment to class of interest, . The other is , which conveys the rules suggesting a class other than . results from and it provides an overall measure of strength for the assignment to a certain class. The class with the highest net score is then recommended by the advanced scheme.
Both classification schemes discussed above assume that for each accident there are one or more rules that match its values of the attributes. However, it might be the case that there is no single rule that exactly aligns with the description of a specific accident. Hence, the recommended class must be extrapolated from the rules that are “nearest” to this accident. The strategy adopted in this case is the valued closeness relation proposed in [51], which is based on the assumption that providing the DM with an indication of the classified accidents that do not excessively differ from the one under analysis can be the best compromise, instead of offering nothing. For example, an accident with the following description (country = OECD, energy stage = extraction, infrastructure type = compression station, …) matches 2 out of 3 conditions of the following rule, hence being relatively close to it: “If the country is OECD and the energy stage is extraction and the infrastructure type is platform, then the fatalities caused by the accident are more than 20”.
2.2.3. Validation of the Sorting Model
Two validations of the model were performed, one predictive based on cross-validation and one experimental using realistic future accidents [52,53]. The predictive validation did not provide satisfactory results (its detailed results are available in Section S.3 of the Electronic Supplementary Information (ESI)), while the experimental one confirmed the usefulness of the rough sets model and it is discussed in Section 3.2 and Section 4. Similarly to the experimental validation proposed by Augeri et al. [54], a realistic set of alternatives (in this case, energy accidents) was selected to test the applicability of the rules of the rough sets model and the capacity to better analyze the problem. In fact, the sorting of the accidents is driven by one or more rules that match fully or partially the conditions of the accidents and can lead the sorting challenge using objective energy accidents information stored in ENSAD.
3. Results
The results are presented in two sections, distinguishing relevance of attributes (Section 3.1), and the classification model based on the decision rules, including the classification of new energy accidents to hazard classes (Section 3.2).
The quality of the employed ENSAD for natural gas accidents is just under 60%, hence close to two thirds of the 250 accidents can be described by the selected attributes and assigned to the class of fatalities without ambiguity. The remaining accidents are part of the upper approximations, meaning that they have the same values for the attributes but caused different ranges of fatalities.
3.1. Relevance of Attributes in ENSAD for Natural Gas
There is only one reduct from this ENSAD dataset, which includes all the attributes except event chain 5 (). This means that attributes represent the minimal set of relevant attributes from the original dataset that are sufficient to characterize the decision table with the same quality of classification as all the eight attributes. The presence of one reduct only covering all expect attribute can be interpreted as the confirmation of the relevancy of the data gathering strategy adopted by the ENSAD developers since the early 1990s. In fact, the categorization of the accidents according to country cluster, energy chain stage, infrastructure type, and types of event chains are confirmed as being necessary for distinguishing between events of different fatality entities.
The influence of the attributes on the quality of classification was studied to identify the attributes that mostly affect the classification. This was conducted through a trial-and-error procedure by eliminating one attribute at a time. The quality of classification is presented in Figure 1 by accounting for the effect of the reduction of one attribute at a time on the rough sets analysis.
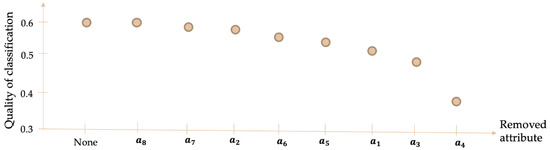
Figure 1.
Quality of classification according to removed attributes.
It is evident from Figure 1 that the attribute event chain 1 () has a key role in the quality of classification, meaning that if deleted, a large number of inconsistent accidents emerge, i.e., the same values of the attributes for the accidents, but different class assignments. Lower but still notable relevance of infrastructure type (), country cluster (), as well as event chain 2 and 3 ( and , respectively). Energy chain stage () and event chain 4 () have limited discernibility capacity, while event chain 5 () does not add any relevant type of information to the dataset.
Attributes energy chain stage () and event chain 4 () have thus limited discernibility capacity as they have limited potentials of distinguishing accidents assigned to different classes. Regarding energy chain stage (), this is due to the fact that most of the accidents with different fatalities classes have the same values. Specifically, the most common energy chains are transport and domestic or commercial premises (DOM/COM), which represent 45.6% and 38.4% of the values for this attribute in this dataset, respectively.
This can be an indication of whether their coding (i.e., values) should be re-framed (possibly for ) or the attribute not considered at all and thus dropped from the analysis (possibly for ). It must be noted that the higher the number of attributes (including their values) the higher the time required to gather the information for ENSAD (and dataset generation in general). Therefore, a trade-off is in place between the search of information on accidents and the added value this research brings to the analysis of such data. Rough sets analysis can thus be seen as a useful approach to assess the worthiness of investing in data gathering strategies for datasets generation, in this particular case for energy related accidents.
3.2. Classification Model and Sorting of New Energy Accidents to Hazard Classes
The classification model developed in this research is built upon two types of decision rules that were conveyed by rough sets analysis, single class and union of classes (rules for and are the same as those for and ). Table 3 provides a summary of these rules. The complete model composed on all the rules is available in SI S.3 and S.4.
Table 3.
Summary of decision rules obtained from the rough sets analysis of ENSAD dataset.
As far as fully certain rules are concerned, 61 for , 26 for , 16 for 66 for , 60 for 42 for , and 22 for were discovered (Table 3). This means 103 and 190 overall rules for the single class-based and union of classes-based variants, respectively.
The rules represent pieces of objective knowledge contained in ENSAD that are characteristics of the energy accidents that caused certain classes of fatalities. Standard rules contain the attributes’ values (i.e., conditions) of the energy accidents that result in a certain outcome (i.e., decision), be it having caused between 5 and 10 fatalities (, between 11 and 20 (, and above 20 (. In this manner, it is possible to perform a mapping of the patterns that characterize the accidents that surely represent each of the classes. It is important to note that the rules are an objective and succinct representation of the information “hidden” in the dataset and not an elaboration from the experts and/or analysts. In fact, they are supported by one (or more) accidents that uniquely showed certain characteristics for the attributes and resulted in a certain range of fatalities.
Some illustrative single class rules include:
- “If (country cluster, = non-OECD) and (infrastructure type, = pipeline) and (event chain 1, = release), then the class of fatalities is ”. Rule triggered by accidents n. 99 in ENSAD dataset.
- “If (country cluster, = OECD) and (infrastructure type, = pipeline) and (event chain 1, = explosion) and (event chain 2, = fire), then the class of fatalities is or ”. is triggered by accidents n. 46, 50, and 63, while is activated by accident 135 in ENSAD dataset.
- “If (country cluster, = OECD) and (infrastructure type, = compression station) and (event chain 1, = explosion), then the class of fatalities is ”. Rule triggered by accidents n. 220 in ENSAD dataset.
An additional contribution of this research is the extraction of rules for the union of classes, which in this case are represented by the accidents assigned to at most or at least to . In the first case (i.e., rules for , they refer to the accidents that contain characteristic values for the accidents classified to either or . In the other case (i.e., rules for , they include accidents belonging to either class or . This can enrich the decision support potentials of the knowledge base as explained below.
Two examples of union of classes rules are:
- “If (country cluster, = OECD) and (energy chain stage, = transport) and (infrastructure type, = pipeline) and (event chain 2, = not available), then the class of fatalities is ”. Rule triggered by accidents 1, 14, 28, 29, 64, 68, 74, 84, 100, 107, 214 belonging to , and accident 134 belonging to , in ENSAD dataset.
- “If (country cluster, = OECD) and (event chain 2, = collapse), then the class of fatalities is ”. Rule triggered by accidents 146 belonging to , and accident 134 belonging to , in ENSAD dataset.
From a risk and resilience management perspective, knowing the potential impact range of an accident is of pivotal importance to plan appropriate response strategies. Decision rules extracted from this ENSAD set can be used to estimate this potential impact in the natural gas sector. They can provide warning signs based on the country cluster, energy chain, infrastructure type, and event chain of a real or hypothetical energy accident that the expert/DM can use to make the most out of the information consistently reported in ENSAD. The decision rules can be of use to different experts and DMs who might be interested in (i) developing hazard and resilience assessments for energy technologies and scenarios by exploiting the capacity of dealing with accidents with more awareness of their possible impacts (directly linked with “remember” function in FRS resilience framework [36]), (ii) supporting the development of insurance packages according to the riskiness of the energy technology investment (e.g., insurance companies), and those (iii) looking for recommendations about energy policy development (e.g., policy makers).
Let us consider ten realistic accidents (denoted by n1–n10) as shown in Table 4, including OECD and non-OECD country clusters, energy chain stages, infrastructure types, and event chains. For these accidents, the classification results are presented in the last two columns (for details see Section S.5 in SI). The classification provided by the single class-based rules indicates that there is correspondence between the standard and advanced schemes for seven out of ten accidents, while it shows ambiguity for n6 and n7, and no solution for n9. The latter ones are thus the accidents that can be seen as more problematic from an assessment perspective, and specifically justify the use of the advanced scheme, which can assign a unique class to each of them. The added value of the advanced scheme is also emphasized in the union of classes-based rules, as most of the accidents have union of more than one type of at most classes, or at least classes or a combination of both (n4, n8), which renders the classification quite ambiguous.
Table 4.
Set of energy accidents sorted in hazard classes with the single class-based and union of classes-based classification model.
In the case of accident 3 (n3), there is only a single-class rule that leads the sorting, which states that “If country cluster = OECD, infrastructure type = building commercial, and event chain 3 = not available, then the class of fatalities is ” (supporting accidents n. 3, 25, 56, 67, 81).
The union of classes-based rules adds to this sorting the information from two rules. The first one states that “If country cluster = OECD, energy chain stage = DOM/COM, and event chain 3 = not available, then the class of fatalities is ” (supporting accidents n. 3, 11, 22, 25, 37, 38, 39, 42, 52, 54, 55, 56, 61, 67, 73, 79, 80, 81, 83, 93, 103, 106, 111, 114, 117, 189, 198 belonging to , and accidents 124, 126, 132, 146, 151, 194 belonging to ). The second rule states that “If country cluster = OECD, event chain 1 = release, event chain 2 = fire, and event chain 3 = not available, then the class of fatalities is ” (supporting accidents n. 122 and 130 belonging to ).
Another accident of particular interest is n8, whose single class rule includes only event chain information, stating that “If event chain 2 = rupture and event chain 3 = fire, then the class of fatalities is ” (supporting accidents n. 44 and 75). From a complementary perspective, the union of classes-based rules enriches the sorting with the rule stating that “If country cluster = non-OECD, event chain 1 = human error, and event chain 3 = fire, then the class of fatalities is ” (supporting accidents n. 137 and 142 for and 225 for ). The reason for the sorting disagreement between the two types of rules is apparent, with the single class-based rules using only event chains as conditions, while the union of classes ones include the country cluster too in the syntax of the rule.
These examples confirm how the information provided by the rules-based model can support a refined understanding of which accidents caused certain impacts and how closely they can be compared to the ones currently under scrutiny.
The model can also handle sorting challenges when there is not an exact match between the rules and the conditions of the accidents to classify, as the ninth accident (n9) shows. In this case, there is in fact no exact rule that matches the conditions of the accidents and no class can be provided with the standard scheme. However, the sorting model can still provide a classification with activation of the valued closed relation classification, meaning that there are rules that in this case match part of such conditions and are used to trigger the sorting. There is one rule of single class type, which states that “If country cluster = OECD, energy chain stage = transport, event chain 1 = release, event chain 2 = explosion, and event chain 3 = not available, then the class of fatalities is ” (supporting accidents n. 51, 78, 96). In this case, 4 out of the 5 conditions are matched by the accident, since the first event chain is overpressure and not a release as indicated in the rule. There is also a union of classes rules that complements the sorting, whose structure is “If country cluster = OECD, infrastructure type = pipeline, event chain 1 = other, event chain 2 = explosion, and event chain 3 = not available, then the class of fatalities is ” (supporting accident n. 201 for and 131 for , respectively). Moreover, in this case, 80% of the conditions are covered by the rule as the first event chain is overpressure and not the category “other” as indicated in the rule. This type of accidents should obviously be flagged clearly to the DM, making him/her aware that the sorting is based on partial correspondence between the rule in ENSAD and the accident under analysis. The advanced classification scheme offers a unique sorting based on the highest , which is a measure of the strength of the support for the most certain class allotment (for details of score calculation see Błaszczyński et al. [50]). The class assigned by this scheme is used to discuss the hazard of these four test accidents. In this set of accidents, the advanced scheme classification provides the same results for 8 out of 10 of the accidents, showing a high degree of consistency. The use of more than one sorting approach is a main advantage of this model, as it allows to highlight the accidents that require specific attention, in cases when there is disagreement between the assigned classes.
4. Discussion
Risk and resilience assessments are inherently dependent on reliable, credible, and consistent data, as well as on the effective use of such information. This research has demonstrated one possible use of the records on energy accidents in the natural gas sector, collected by the PSI since the 1990s, combined with an MCDA method to complement the capabilities of risk and resilience assessments in this area and beyond. The analysis of the ENSAD dataset with rough sets represents a first-stage confirmation of the objective integrated relevance of gathering energy accident data following a consistent and transparent procedure. For this purpose, the data was structured on information about where the event happened (i.e., country cluster), in which stage of the energy chain, which infrastructure was affected, the sequence of events (i.e., event chain), and the type of impact in terms of fatalities. Our analysis demonstrated that each accident attribute has a different capacity to distinguish the number of fatalities, with primary relevance for the first event chain step, followed by the type of infrastructure and then country cluster.
The main contribution of this research is the classification model for assigning energy accidents into preference-ordered classes, according to their concern level in terms of potential fatalities. The model is built upon decision rules, pieces of information that unveil the hidden objective relationships in ENSAD within the timeframe 1970–2016 that are unique for energy accidents causing a certain range of fatalities. These decision rules can be used to classify new accidents to assess their level of concern. We applied this model to a set of realistic (i.e., not part of the model development) accidents to show its decision support potentials. The structure of the rules, composed of information blocks in the form of “if (condition), then (classification to hazard class x)” makes it easy for the user to understand the reasons why a certain class is assigned, backed up by the objective accidents data consistently stored in ENSAD. Particular advantages of the proposed models are the combination of rules of different typologies (i.e., single class and union of classes) as well as classification schemes (i.e., standard and advanced). The classifications are supported by multiple facets as they analyze the ENSAD information with several algorithms, adding further credibility and stability assessment to the sorting.
The validation with the 10 energy accidents highlighted a key contribution of this rough sets model and the application of MCDA methods in general, which is to aid developing a deeper understanding of the multiple criteria-based problem, in this case by means of the activated rules for each energy accident. Rough sets models have already been tested with experimental validation in several other application areas, showing the benefit of using knowledge and information reported in the learning dataset and applied to new alternatives or to alternatives that were not part of the set. Some examples include the location selection of waste incinerator [55], budget allocation [54], location selection for waste management plants [56], and green synthesis of nanoparticles [57].
Even if the cross-validation does not prove satisfactory for this model, the experimental validation confirms the value of the model as one of its main strengths and added value is that it provides a classification of new accidents to hazard classes based on ENSAD accidents that have been consistently assigned to that fatality class. The classification scheme applied in this model computes scores of support for different hazard classes, and the one with the greatest support (i.e., number of accidents), is the one assigned by the model. It is then up to the analyst to evaluate each rule in support of a certain sorting by looking at the individual accidents that triggered it and see how applicable they are to the accident under assessment. This is the reason why rough sets is considered a decision support method that aids the analysis of a complex problem, but does not replace the analyst or the decision maker [48].
Two topics that could receive further exploration are the quality of classification and strength of the decision rules. Possible solutions include (i) increasing the discrimination potential of attributes by adding values (e.g., more refined countries grouping and not only OECD and non-OECD as proposed by [2]) and (ii) introducing additional attributes (e.g., distinction of accidents according to the typology and topography of the area the accident took place).
The main focus of our rough sets analysis has been on the explanation of the relationships hidden in the ENSAD dataset by developing a classification model that can be seen as a “glass box” in the spirit of transparency and intelligibility which are key advantages of MCDA methods [48]. This research has demonstrated that decision support systems can make efficient and effective use of information of different typology and provide risk and resilience analysts with transparent and justifiable evaluations of the alternatives under consideration. In order to advance pragmatic policy-making support, this type of integrative research is more needed than ever and interdisciplinary teams will be a necessity rather than simply an advantage in the near future.
Supplementary Materials
The following are available online at https://www.mdpi.com/1996-1073/12/21/4178/s1. S.1: ENSAD attributes for information table. S.2: ENSAD datasets used for rough sets analysis. S.3: Predictive validation based on cross-validation. S.4: Single class-based rules. S.5: Union of classes-based rules. S.6: Classification of accidents with single class-based and union of classes-based rules.
Author Contributions
Conceptualization: M.C., M.S., and P.B.; methodology: M.C. and M.K.; data curation: M.C., M.S., and P.B.; software: G.M. and M.K.; data analysis: M.C., G.M., and M.K.; writing—original draft preparation: M.C.; writing—review and editing: M.C., M.S., M.K., and P.B.; supervision: P.B.
Funding
This research was funded by the Future Resilient Systems (FRS) at the Singapore-ETH Centre (SEC), which was established collaboratively between ETH Zürich and Singapore’s National Research Foundation (FI 370074011) under its Campus for Research Excellence And Technological Enterprise (CREATE) program. Miłosz Kadziński and Grzegorz Miebs acknowledge financial support from the Iuventus Plus program (grant no. 0296/IP2/2016/74).
Acknowledgments
The authors would like to thank Felix Schumacher and Peter Lustenberger for their contribution to the development and recent update of ENSAD.
Conflicts of Interest
The authors declare no conflict of interest.
References
- IEA. Key World Energy Trends. Excerpt from World Energy Balances; International Energy Agency: Paris, France, 2016; Available online: http://www.iea.org/publications/freepublications/publication/KeyWorldEnergyTrends.pdf (accessed on 11 August 2018).
- Burgherr, P.; Hirschberg, S. Comparative risk assessment of severe accidents in the energy sector. Energy Policy 2014, 74 (Suppl. 1), S45–S56. [Google Scholar] [CrossRef]
- Burgherr, P.; Giroux, J.; Spada, M. Accidents in the Energy Sector and Energy Infrastructure Attacks in the Context of Energy Security. Eur. J. Risk Regul. 2015, 6, 271–283. [Google Scholar] [CrossRef]
- Sovacool, B.K.; Andersen, R.; Sorensen, S.; Sorensen, K.; Tienda, V.; Vainorius, A.; Schirach, O.M.; Bjørn-Thygesen, F. Balancing safety with sustainability: Assessing the risk of accidents for modern low-carbon energy systems. J. Clean. Prod. 2016, 112 Pt 5, 3952–3965. [Google Scholar] [CrossRef]
- Sovacool, B.K.; Kryman, M.; Laine, E. Profiling technological failure and disaster in the energy sector: A comparative analysis of historical energy accidents. Energy 2015, 90 Pt 2, 2016–2027. [Google Scholar] [CrossRef]
- Barceló, J. Analytics and the art of modeling. Int. Trans. Oper. Res. 2015, 22, 429–471. [Google Scholar] [CrossRef]
- Kim, K.; Kang, H.; Kim, Y. Risk Assessment for Natural Gas Hydrate Carriers: A Hazard Identification (HAZID) Study. Energies 2015, 8, 3142–3164. [Google Scholar] [CrossRef]
- Hirschberg, S.; Spiekerman, G.; Dones, R. Severe Accidents in the Energy Sector, 1st ed.; PSI Report No. 98-16; Paul Scherrer Institut: Villigen, Switzerland, 1998. [Google Scholar]
- Burgherr, P.; Spada, M.; Kalinina, A.; Hirschberg, S.; Kim, W.; Gasser, P.; Lustenberger, P. The Energy-related Severe Accident Database (ENSAD) for comparative risk assessment of accidents in the energy sector. In Proceedings of the 27th European Safety and Reliability (ESREL) Conference, Portoroz, Slovenia, 18–22 June 2017; CRC Press: Portoroz, Slovenia, 2017. [Google Scholar]
- Burgherr, P.; Spada, M.; Kalinina, A.; Vandepaer, L.; Lustenberger, P.; Kim, W. Comparative risk assessment of accidents in the energy sector within different long-term scenarios and marginal electricity supply mixes. In Proceedings of the 29th European Safety and Reliability (ESREL) Conference, Hannover, Germany, 22–26 September 2019; Research Publishing: Singapore, 2019; pp. 1525–1532. [Google Scholar]
- Sovacool, B.K. The costs of failure: A preliminary assessment of major energy accidents, 1907–2007. Energy Policy 2008, 36, 1802–1820. [Google Scholar] [CrossRef]
- Spada, M.; Burgherr, P. An aftermath analysis of the 2014 coal mine accident in Soma, Turkey: Use of risk performance indicators based on historical experience. Accid. Anal. Prev. 2016, 87, 134–140. [Google Scholar] [CrossRef] [PubMed]
- Eckle, P.; Burgherr, P. Bayesian Data Analysis of Severe Fatal Accident Risk in the Oil Chain. Risk Anal. 2013, 33, 146–160. [Google Scholar] [CrossRef]
- Burgherr, P.; Eckle, P.; Hirschberg, S. Comparative assessment of severe accident risks in the coal, oil and natural gas chains. Reliab. Eng. Syst. Saf. 2012, 105, 97–103. [Google Scholar] [CrossRef]
- Burgherr, P.; Hirschberg, S. A Comparative Analysis of Accident Risks in Fossil, Hydro, and Nuclear Energy Chains. Hum. Ecol. Risk Assess. Int. J. 2008, 14, 947–973. [Google Scholar] [CrossRef]
- Jacobsson, A.; Sales, J.; Mushtaq, F. A sequential method to identify underlying causes from industrial accidents reported to the MARS database. J. Loss Prev. Process Ind. 2009, 22, 197–203. [Google Scholar] [CrossRef]
- Aven, T. How some types of risk assessments can support resilience analysis and management. Reliab. Eng. Syst. Saf. 2017, 167, 536–543. [Google Scholar] [CrossRef]
- Brans, J.-P.; Kunsch, P.L. Ethics in operations research and sustainable development. Int. Trans. Oper. Res. 2010, 17, 427–444. [Google Scholar] [CrossRef]
- Pelissari, R.; Oliveira, M.C.; Abackerli, A.J.; Ben-Amor, S.; Assumpção, M.R.P. Techniques to model uncertain input data of multi-criteria decision-making problems: A literature review. Int. Trans. Oper. Res. 2019. [Google Scholar] [CrossRef]
- IEA. World Energy Outlook; International Energy Agency: Paris, France, 2017; Available online: https://www.iea.org/weo2017/ (accessed on 20 July 2018).
- Wang, T.-R.; Mousseau, V.; Pedroni, N.; Zio, E. An empirical classification-based framework for the safety criticality assessment of energy production systems, in presence of inconsistent data. Reliab. Eng. Syst. Saf. 2017, 157, 139–151. [Google Scholar] [CrossRef]
- Hirschberg, S.; Bauer, C.; Burgherr, P.; Cazzoli, E.; Heck, T.; Spada, M.; Treyer, K. Health effects of technologies for power generation: Contributions from normal operation, severe accidents and terrorist threat. Reliab. Eng. Syst. Saf. 2016, 145, 373–387. [Google Scholar] [CrossRef]
- Su, H.; Zio, E.; Zhang, J.; Li, X. A systematic framework of vulnerability analysis of a natural gas pipeline network. Reliab. Eng. Syst. Saf. 2018, 175, 79–91. [Google Scholar] [CrossRef]
- Zhang, P.; Qin, G.; Wang, Y. Risk Assessment System for Oil and Gas Pipelines Laid in One Ditch Based on Quantitative Risk Analysis. Energies 2019, 12, 981. [Google Scholar] [CrossRef]
- Tchórzewska-Cieślak, B.; Pietrucha-Urbanik, K. Approaches to Methods of Risk Analysis and Assessment Regarding the Gas Supply to a City. Energies 2018, 11, 3304. [Google Scholar] [CrossRef]
- Tchórzewska-Cieślak, B.; Pietrucha-Urbanik, K.; Urbanik, M.; Rak, R.J. Approaches for Safety Analysis of Gas-Pipeline Functionality in Terms of Failure Occurrence: A Case Study. Energies 2018, 11, 1589. [Google Scholar] [CrossRef]
- Cinelli, M.; Spada, M.; Miebs, G.; Kadziński, M.; Burgherr, P. Classification models for the risk assessment of energy accidents in the natural gas sector. In Proceedings of the 2nd International workshop on Modelling of Physical, Economic and Social Systems for Resilience Assessment, Ispra, Italy, 14–16 December 2017; Publications Office of the European Union: Brussels, Belgium, 2017; pp. 112–120. [Google Scholar]
- Roy, B. Two conceptions of decision aiding. Int. J. Multicriteria Decis. Mak. 2010, 1, 74–79. [Google Scholar] [CrossRef]
- JRC. Major Accident Reporting System. Available online: https://ec.europa.eu/jrc/en/scientific-tool/major-accident-reporting-system (accessed on 8 July 2019).
- Ganin, A.A.; Massaro, E.; Gutfraind, A.; Steen, N.; Keisler, J.M.; Kott, A.; Mangoubi, R.; Linkov, I. Operational resilience: Concepts, design and analysis. Sci. Rep. 2016, 6, 19540. [Google Scholar] [CrossRef] [PubMed]
- Linkov, I.; Anklam, E.; Collier, Z.; DiMase, D.; Renn, O. Risk-based standards: Integrating top–down and bottom–up approaches. Environ. Syst. Decis. 2014, 34, 134–137. [Google Scholar] [CrossRef]
- NRC. Disaster Resilience: A National Imperative; National Research Council, The National Academies Press: Washington, DC, USA, 2012. [Google Scholar] [CrossRef]
- Carvalho, R.; Buzna, L.; Bono, F.; Masera, M.; Arrowsmith, D.K.; Helbing, D. Resilience of natural gas networks during conflicts, crises and disruptions. PLoS ONE 2014, 9, e90265. [Google Scholar] [CrossRef]
- Lustenberger, P.; Sun, L.; Gasser, P.; Kim, W.; Spada, M.; Burgherr, P.; Hirschberg, S.; Stojadinović, B. Potential impacts of selected natural hazards and technical failures on the natural gas transmission network in Europe. In Proceedings of the European Safety and Reliability of Complex Engineered Systems, ESREL 2017, Portoroz, Slovenia, 18–22 June 2017; CRC Press: Portoroz, Slovenia, 2017. [Google Scholar]
- Ellison, J.F.; Corbet, T.F.; Brooks, R.E. Natural Gas Network Resiliency to a “ShakeOut Scenario” Earthquake; USDOE National Nuclear Security Administration (NNSA): Washington, DC, USA, 2013. [CrossRef]
- Heinimann, H.R.; Hatfield, K. Infrastructure Resilience Assessment, Management and Governance—State and Perspectives. In Resilience and Risk: Methods and Application in Environment, Cyber and Social Domains; Linkov, I., Palma-Oliveira, J.M., Eds.; Springer: Dordrecht, The Netherlands, 2017; pp. 147–187. [Google Scholar] [CrossRef]
- Kyriakidis, M.; Lustenberger, P.; Burgherr, P.; Dang, V.; Hirschberg, S. Quantifying energy systems resilience—A simulation approach to assess recovery. Energy Technol. 2018, 6, 1700–1706. [Google Scholar] [CrossRef]
- Swiss Re Institute. Natural Catastrophes and Man-Made Disasters in 2017: A Year of Record-Breaking Losses; Sigma: Zurich, Switzerland, 2018; Available online: http://media.swissre.com/documents/sigma1_2018_en.pdf (accessed on 27 August 2018).
- Cinelli, M. The Art of Supporting Decision-Making. Exch. Warwick Res. J. 2017, 4, 298–308. [Google Scholar] [CrossRef]
- Cinelli, M.; Coles, S.R.; Kirwan, K. Analysis of the Potentials of Multi Criteria Decision Analysis Methods to Conduct Sustainability Assessment. Ecol. Indic. 2014, 46, 138–148. [Google Scholar] [CrossRef]
- Roy, B.; Słowiński, R. Questions guiding the choice of a multicriteria decision aiding method. EURO J. Decis. Process. 2013, 1, 69–97. [Google Scholar] [CrossRef]
- Rowley, H.V.; Peters, G.M.; Lundie, S.; Moore, S.J. Aggregating sustainability indicators: Beyond the weighted sum. J. Environ. Manag. 2012, 111, 24–33. [Google Scholar] [CrossRef]
- Cegan, J.C.; Filion, A.M.; Keisler, J.M.; Linkov, I. Trends and applications of multi-criteria decision analysis in environmental sciences: Literature review. Environ. Syst. Decis. 2017, 37, 123–133. [Google Scholar] [CrossRef]
- Diaz-Balteiro, L.; González-Pachón, J.; Romero, C. Measuring systems sustainability with multi-criteria methods: A critical review. Eur. J. Oper. Res. 2017, 258, 607–616. [Google Scholar] [CrossRef]
- Pawlak, Z.; Grzymala-Busse, J.; Słowiński, R.; Ziarko, W. Rough sets. Commun. ACM 1995, 38, 89–97. [Google Scholar] [CrossRef]
- Krysiński, J. Rough sets in the analysis of the structure-activity relationships of antifungal imidazolium compounds. J. Pharm. Sci. 1995, 84, 243–248. [Google Scholar] [CrossRef] [PubMed]
- Kadziński, M.; Ciomek, K. Integrated framework for preference modeling and robustness analysis for outranking-based multiple criteria sorting with ELECTRE and PROMETHEE. Inf. Sci. 2016, 352–353, 167–187. [Google Scholar] [CrossRef]
- Greco, S.; Matarazzo, B.; Słowiński, R. Decision Rule Approach. In Multiple Criteria Decision Analysis: State of the Art Surveys; Greco, S., Ehrgott, M., Figueira, J.R., Eds.; Springer: New York, NY, USA, 2016; pp. 497–552. [Google Scholar] [CrossRef]
- Słowiński, R.; Greco, S.; Matarazzo, B. Rough-Set-Based Decision Support. In Search Methodologies; Burke, E.K., Kendall, G., Eds.; Springer: Boston, MA, USA, 2014; pp. 557–609. [Google Scholar] [CrossRef]
- Błaszczyński, J.; Greco, S.; Słowiński, R. Multi-criteria classification—A new scheme for application of dominance-based decision rules. Eur. J. Oper. Res. 2007, 181, 1030–1044. [Google Scholar] [CrossRef]
- Słowiński, R.; Stefanowski, J. Rough Classification with Valued Closeness Relation. In New Approaches in Classification and Data Analysis; Diday, E., Lechevallier, Y., Schader, M., Bertrand, P., Burtschy, B., Eds.; Springer: Berlin/Heidelberg, Germany, 1994; pp. 482–489. [Google Scholar] [CrossRef]
- Landry, M.; Malouin, J.-L.; Oral, M. Model validation in operations research. Eur. J. Oper. Res. 1983, 14, 207–220. [Google Scholar] [CrossRef]
- Tsoukiàs, A. From decision theory to decision aiding methodology. Eur. J. Oper. Res. 2008, 187, 138–161. [Google Scholar] [CrossRef]
- Augeri, M.G.; Colombrita, R.; Greco, S.; Lo Certo, A.; Matarazzo, B.; Słowiński, R. Dominance-Based Rough Set Approach to Budget Allocation in Highway Maintenance Activities. J. Infrastruct. Syst. 2011, 17, 75–85. [Google Scholar] [CrossRef]
- Abastante, F.; Bottero, M.; Greco, S.; Lami, I. Addressing the Location of Undesirable Facilities through the Dominance-based Rough Set Approach. J. Multi-Criteria Decis. Anal. 2013, 21, 3–23. [Google Scholar] [CrossRef]
- Abastante, F.; Bottero, M.; Greco, S.; Lami, I.M. A Dominance-based Rough Set Approach Model for Selecting the Location for a Municipal Solid Waste Plant. GEAM Geoing. Ambient. E Min. 2012, 137, 43–54. [Google Scholar]
- Cinelli, M.; Coles, S.R.; Nadagouda, M.N.; Błaszczyński, J.; Słowiński, R.; Varma, R.S.; Kirwan, K. A green chemistry-based classification model for the synthesis of silver nanoparticles. Green Chem. 2015, 17, 2825–2839. [Google Scholar] [CrossRef]

© 2019 by the authors. Licensee MDPI, Basel, Switzerland. This article is an open access article distributed under the terms and conditions of the Creative Commons Attribution (CC BY) license (http://creativecommons.org/licenses/by/4.0/).