1. Introduction
Household appliances became extremely popular during the last century thanks to mass production and the consequent affordable prices [
1]. Efficiency and usability of such appliances have dramatically improved during the years; however, there are still many challenges for manufacturers, especially in the context of sustainability and user experience of such products. In recent years, embedding smart capabilities (e.g., speech recognition and automatic decision making) into household devices is becoming more and more popular [
2] and essential to be competitive on the market, a trend that has the potential to revolutionize the way we use and interact with such products. On the other hand, strict environmental laws push manufacturers to develop innovative solutions to limit the impact of their product on the environment. Both in the European and American markets, it is mandatory to apply an Energy Label/Energy Star sticker on every product that indicates its energy efficiency so that customers can make an informed choice of the products their are buying. Of course, Energy Label/Energy Star influences consumer choice in making a purchase [
3], making it extremely important for the manufacturers to get high scores on such rankings.
In fabric-care appliances—washing machines (WM), tumble dryers (TD), and washer dryers (WD)—the impact on the environment is mainly determined by energy and water consumption; hence, manufacturers put considerable effort into optimizing washing/drying cycles. In this regards, the type of laundry (e.g., cotton, synthetic, etc.) that the user loads in WMs and WDs plays a fundamental role in determining the optimal washing cycle configuration due to the different water absorption properties and resistance of the fabric that, in a worst-case scenario, may be even damaged when washed incorrectly (e.g., high temperature). We remark that the main source of variability in drying and washing processes is represented by the laundry inserted in the appliance. Most of the WMs and WDs available on the market require this information to be provided by the user through a physical selector that is often left on the most general settings in order to avoid this manual operation with undesirable consequences on the washing performance. For this reason, automating the process of load detection would have considerable impact on the product efficiency and usability, making it more appealing on the market. However, load typology is a quality that cannot be measured by a physical sensor; it is thus necessary to exploit indirect measures that provide information on physical properties of the laundry related to its typology (e.g., water absorption). A Soft Sensor (SS) [
4] is a technology that allows for the estimation of the value of a quantity that is too costly or even impossible to measure from indirect sensor measurements, making it well suited for the typology detection task at hand. In literature, SSs are typically divided into two categories [
5]:
Model driven—SSs that exploit the physical model of the process to perform the prediction.
Data driven—SSs that build a statistical model of the process by leveraging historical data. Here Machine Learning (ML) methodologies are often exploited.
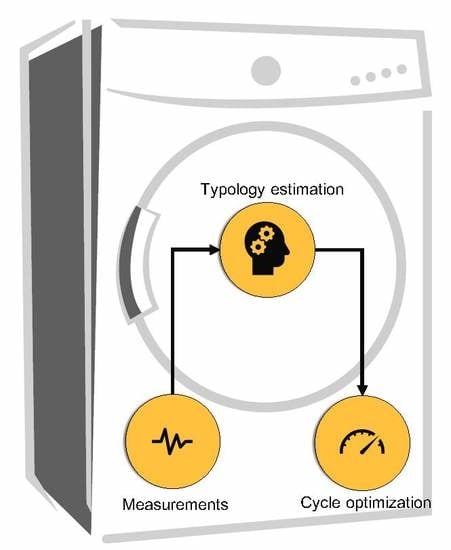
In this paper, due to the complexity of the physical process at hand, we propose a data-driven SS for laundry typology detection. As a reference-use case, we have developed such SS for a Vertical Axis WM (VA-WM), the typical WM of the American market. The SS exploits measurements already available on-board a commercial VA-WM, in particular, speed and torque from the electric engine, without the need to equip the machine with other physical sensors that would be unfeasible in terms of production costs. The proposed SS is based on supervised-learning [
6] methods where a set of input data (sensors measurements) with the associated correct output (laundry typology) is available; a predictive function is then fit to such data by minimizing the opportune loss function on a training set. In our work, a set of laboratory tests have been performed with known load in order to collect the required data.
Due to the limited resources available in the VA-WM firmware, our approach relies on simple regularization techniques. We also propose a more advanced solution based on hierarchical classification methods that, even if computationally unfeasible for our application, can be of interest with future hardware configurations.
Data-driven SS are common in industrial environments such as semiconductor manufacturing [
7,
8], chemical [
9,
10,
11], and automotive [
12,
13]. The methodologies employed in the literature usually vary from simple regression/classification techniques such as linear regression [
14] and Bayesian Networks [
11] to more complex neural-network-based algorithms [
7]. However, in fabric-care home appliances, the application of SSs is limited to load quantity [
15,
16,
17,
18] and humidity estimation [
19,
20] and the resource constrained environment makes the problem challenging and the possible solution limited to simple ones.
The most discriminative property of different laundry typologies is the quantity of water absorbed during the washing cycle; however, this is affected also by the quantity of clothes inserted in the WM. For this reason, in Reference [
18], we proposed a SS for load-weight estimation that provided accurate predictions exploiting on-board sensor measurements. In this work, we assume the weight to either be known or estimated through another load-weight SS.
The reminder of this paper is organized as follows: In
Section 2, we describe the methodologies employed in the development of our SS; in
Section 3, we briefly introduce VA-WM and their washing cycle; in
Section 4, we detail the proposed algorithm; and we show the results in
Section 5. In
Section 6, we draw the conclusions and discuss future works.
All the data employed in the development of this work have been provided by Electrolux Italia S.p.A. and cannot be shared for confidentiality reasons.
2. Methodologies
Supervised-learning techniques have been extensively studied in the past thanks to their straightforward applicability to many prediction problems where a “labeled” dataset is available [
21]. Given a set of input data
, where
p is the number of features or predictors and
n is the number of available observations, with the associated correct output label
that can either be real
or categorical
(respectively if the output is continuous or belongs to a finite set of classes, as in the case of load typology), the goal of supervised learning is to find a function
parametrized by
that approximates the real input–output relation of the data, providing an estimation model that can be used to estimate the output for previously unseen input values. Typically, in simple supervised methods, the data are organized in a design matrix
where each row corresponds to an observation; this allows to express optimization algorithms in a convenient vectorial form. The simplest classification algorithm for binary output values
is called logistic regression and is at the foundation of the proposed soft sensor.
2.1. Logistic Regression and Regularization
Logistic regression models the input–output relation by means of the so-called logistic function
that assumes values in the open interval
and, hence, provides a probabilistic interpretation of the model that can be viewed as an estimate of the conditional probability
. Typically, the classification is performed by placing a threshold on the output value in order to assign every element to either class 0 or 1. Training the model requires finding the value for the parameters vector that minimizes the cross entropy loss [
6] defined as follows:
Here,
and
are respectively the real and predicted output. Minimization is usually achieved through iterative algorithms such as Gradient Descent [
22].
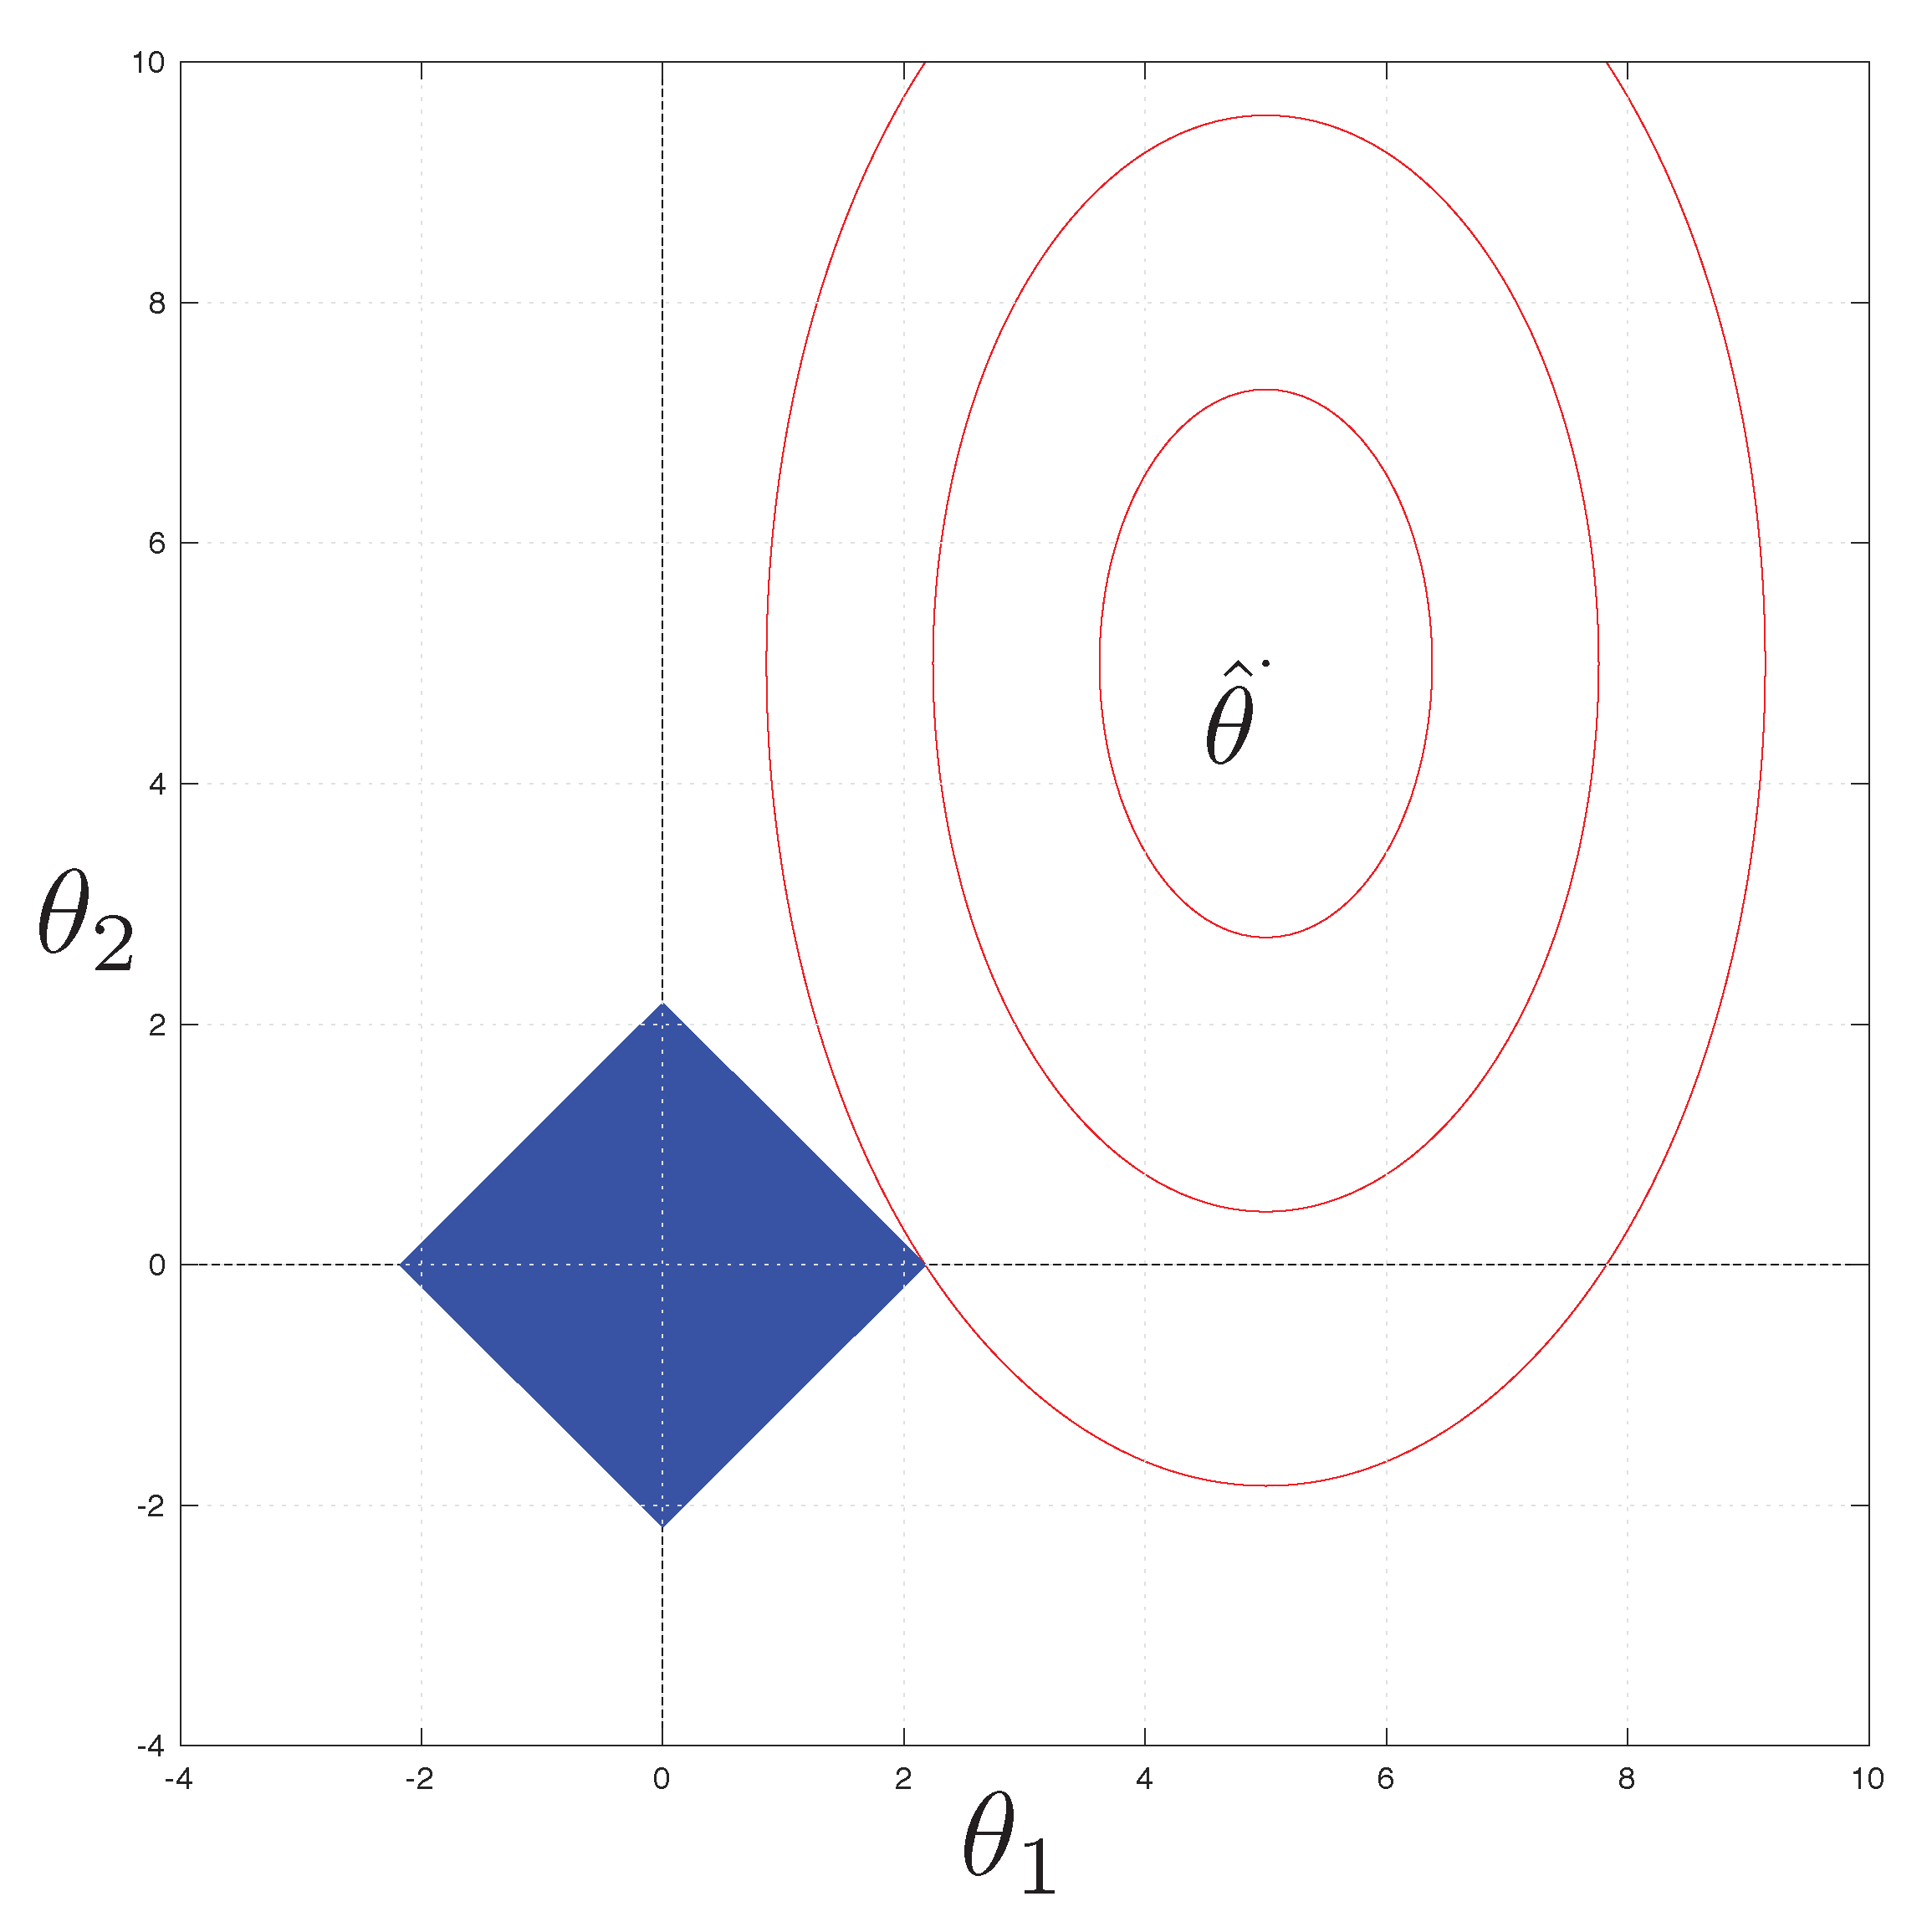
The simple logistic regression algorithm as explained above suffers from high variance whenever the number of features is higher than the number of data available or substantial collinearity is present in the data. This phenomena is often referred to as overfitting and happens whenever the model fits very well the training set but fails at predicting accurately previously unseen data, making it useless for any real application. To mitigate this phenomenon, regularization techniques that encourage the model towards simpler but more general functions are employed in the optimization procedure. This is achieved by adding a regularization term that penalizes the norm of the parameters vector. The most common regularization techniques are as follows:
Ridge [
23], that penalizes the
norm of the parameters vector
;
Least Absolute Shrinkage and Selection Operator (LASSO) [
24], that penalized the
norm of the parameters vector
Typically, the penalty is weighted by a hyperparamenter
that allows to tune the amount of regularization in order to find the best trade off between prediction error on the training set and prediction capabilities on unseen data. The optimization problem solved in this case is
While both the methods are effective at reducing overfitting, they present substantial differences, the most relevant being that LASSO introduces sparsity in the solution, meaning that a lot of parameters are equal to 0 (see
Figure 1 for a graphical explanation of this phenomenon) and, hence, they can be removed from the model with the associated predictor. This is desirable in a resource-constrained environment since inference becomes much faster and the model needs less memory to be stored. Minimizing the LASSO-regularized loss presents some challenges due to the non-differentiability of the
norm. Instead of applying sub-gradient descent methods, the Alternating Direction Method of Multipliers (ADMM) [
25] algorithm has proven to be very effective and is employed in most commercial tools. The idea of ADMM is to express the problem in Equation (
2) in the following form:
The optimization is then performed in an alternating fashion by minimizing with respect to
,
, and the dual variables
the following scaled augmented Lagrangian (for more details, see Reference [
25]):
The iterative algorithm then becomes
An interesting property of this methods is that, using subdifferential calculus [
25], we can find a closed form solution for the minimization
:
Here,
is the soft thresholding operator defined as
It is now clear how sparsity is obtained; in fact, the soft thresholding operator assigns value 0 to elements in absolute value less than the threshold . Note the soft thresholding is applied element wise on vectors .
2.2. Multiclass Extensions of Logistic Regression
Logistic regression provides a simple method to perform binary classification; however, in the presence of more than 2 classes, the method cannot be applied. For this reason, various extensions have been proposed that either exploit multiple binary classifiers or define a different function that is able to handle multiple classes. The most common approaches are i) One vs All and ii) softmax regression.
(i) One vs All can be used to extend any binary classifier to a multiclass setting; K different binary classifiers are trained on the available data such that the kth classifier distinguishes the kth class from all the other together. The classification is then performed by assigning every element to the class of which the predictor has the higher value, i.e., . Unfortunately, this approach loses the probabilistic interpretation that was previously available in the binary set up.
(ii) Softmax regression defines the softmax function to model the multinomial probability distribution of the multiclass problem (note that with the softmax function is equal to the logistic one). As before, the model is trained by minimizing the cross entropy loss through iterative optimization methods. Remarkably, the probabilistic interpretation here is still valid since .
2.3. Multilevel LASSO
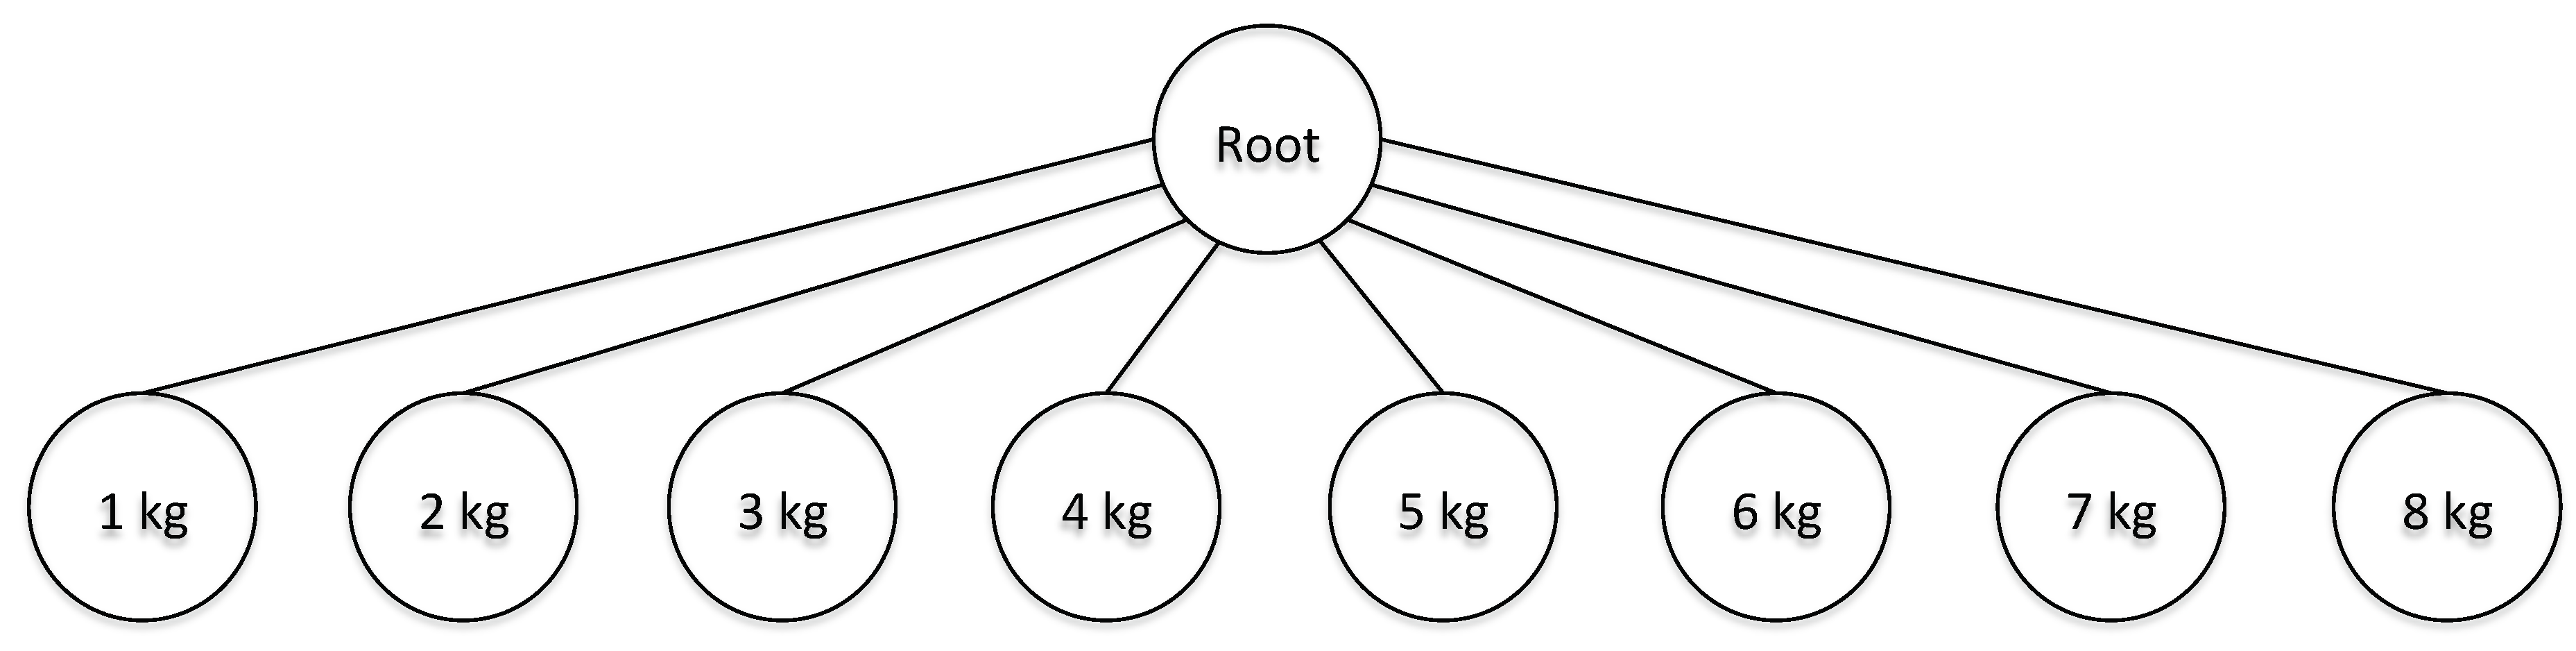
It is common in industrial contexts that the processes involved exhibit a hierarchical structure that reflects the behavior of the data and the modeling strategies [
26,
27,
28]. For example, in our case, the load weight (from 1 kg to 8 kg) is an important discriminator that highly impacts the amount of water absorbed by the laundry and imposes a hierarchical structure to our problem (
Figure 2), where we have 8 different leaves associated with different load-weight classes. In order to take into account this structure, one could decide to build a single model for each leaf-node in the hierarchy at the cost of reducing the amount of data available for training. Alternatively, multilevel approaches have been exploited as an intermediate solution where some weights are shared between leaf nodes while others are node specific. Multilevel LASSO [
29] belongs to this category. More in detail, a set of features
with relative parameters
are associated to each node of the hierarchy. A path
is then defined as the set of nodes traversed by an input
in the hierarchy, and the prediction for
is obtained by the following equation:
where
f can be any classification function such as logit or softmax. This model can be trained as before by minimizing the cross entropy; moreover, it provides the flexibility to assign different values of the hyperparameter
to different nodes of the hierarchy in order to tune the model thoroughly.
3. Case Study
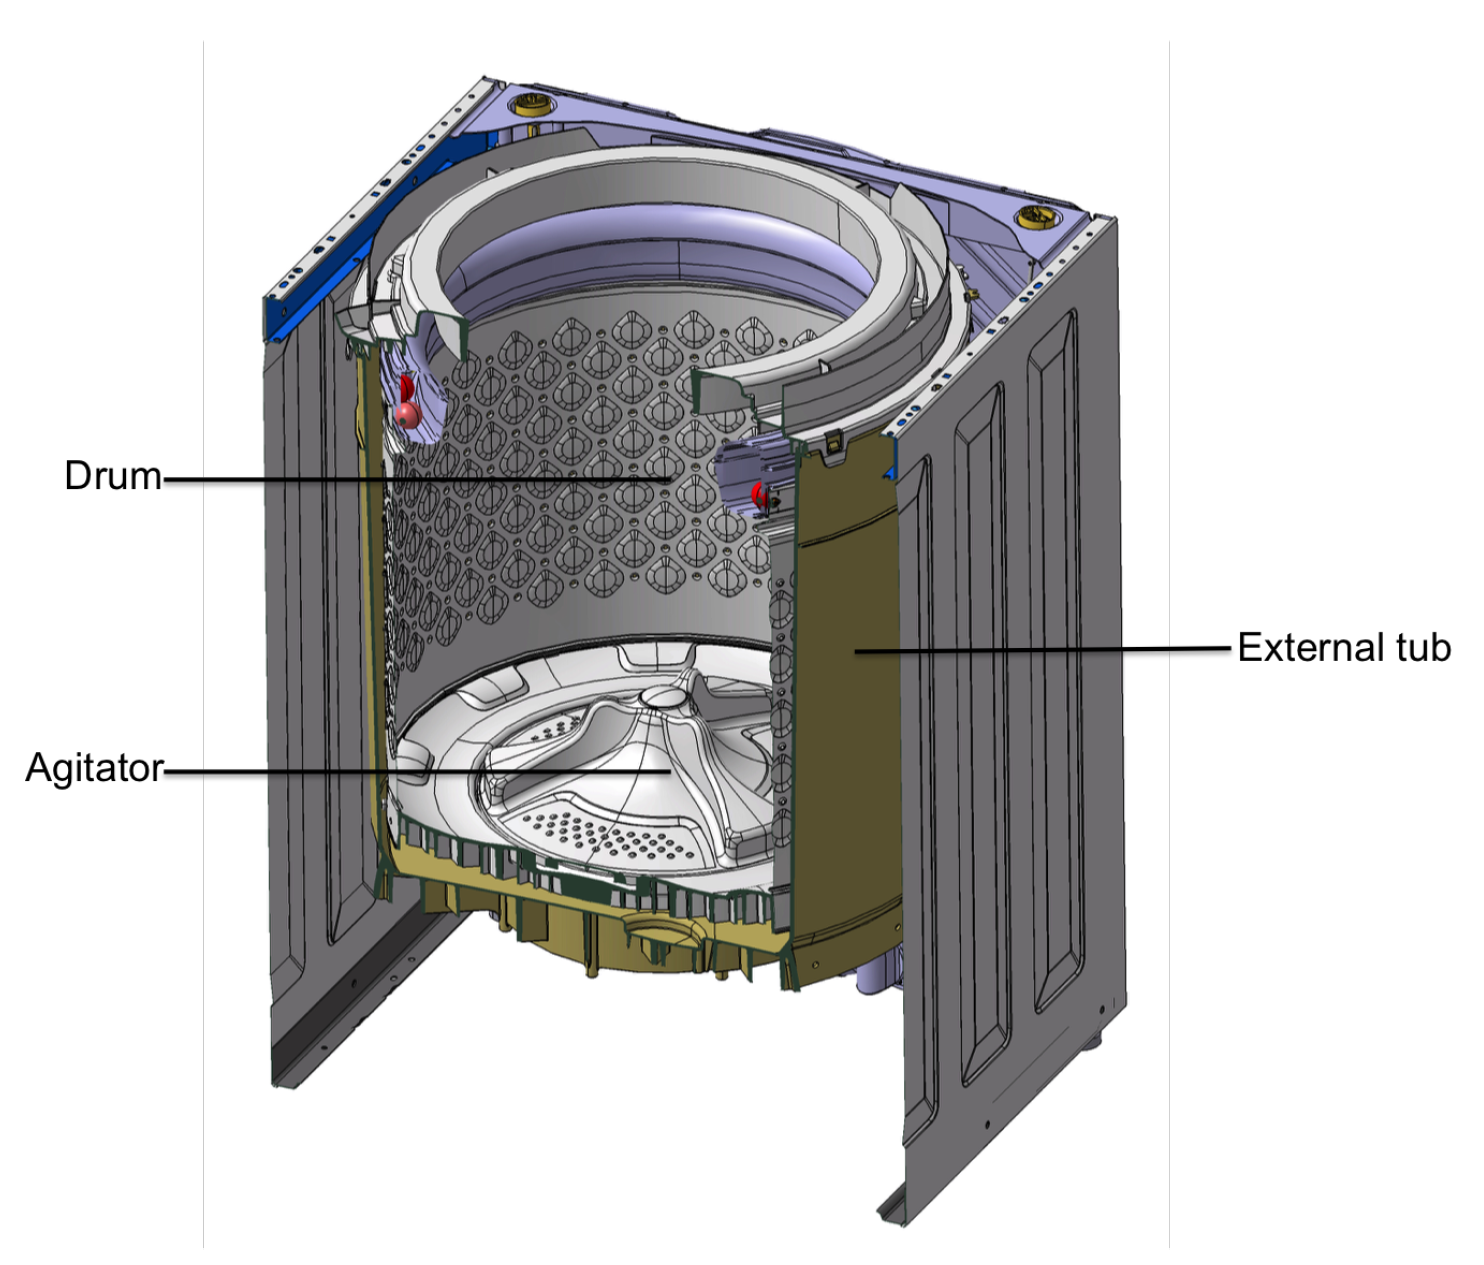
WMs are extremely common in developed countries, both in domestic and professional environments. It is possible to distinguish two different categories of WMs: vertical axis (
Figure 3) and horizontal axis. The first one is characterized by the vertical orientation of the drum rotational axis and is usually popular in the American, Asian, and Australian markets. The second one, instead, is common in the European market and has the drum oriented horizontally. The washing behavior has very distinct characteristics due to the different effects that gravity has on the moving parts of the machines. In particular, when the axis is oriented horizontally, the load moves inside the basket thanks to the combined action of the rotating drum and gravity. The same does not apply in VA-WM, where gravity simply keeps the load at the bottom on the basket and there is the need for an
agitator that provides the forces necessary for the load to move inside the drum by rapidly rotating clockwise and counterclockwise. The agitator can assume two different shapes (
Figure 4): the traditional agitator extends over the entire height of the drum, and the Low Profile Agitator (LPA) instead has a limited height and it requires a smaller amount of water to obtain the same washing performances. For this reason, the producers usually adopt the second technology. Both the agitator and the drum are able to rotate; however, only the agitator is used to wash the clothes while drum movements are used to balance the load and to drain the water at the end of the cycle. Our soft sensor has been developed for a VA-WM equipped with an LPA.
VA-WM Washing Cycle
The washing cycle of the VA-WM at hand is composed of three different consecutive phases:
Warm-Up (WU): During this phase, slow rotations of the drum are performed in order to balance the load. The agitator is locked and does not move.
Water loading (WL): During this phase, the water is loaded inside the drum.
Agitation (AG): Here, the actual washing is performed. The drum remains locked, and the agitator rapidly moves the water and, consequently, the clothes, causing the dirt to be removed by friction. The soap is typically added directly inside the drum by the user at the beginning of the cycle.
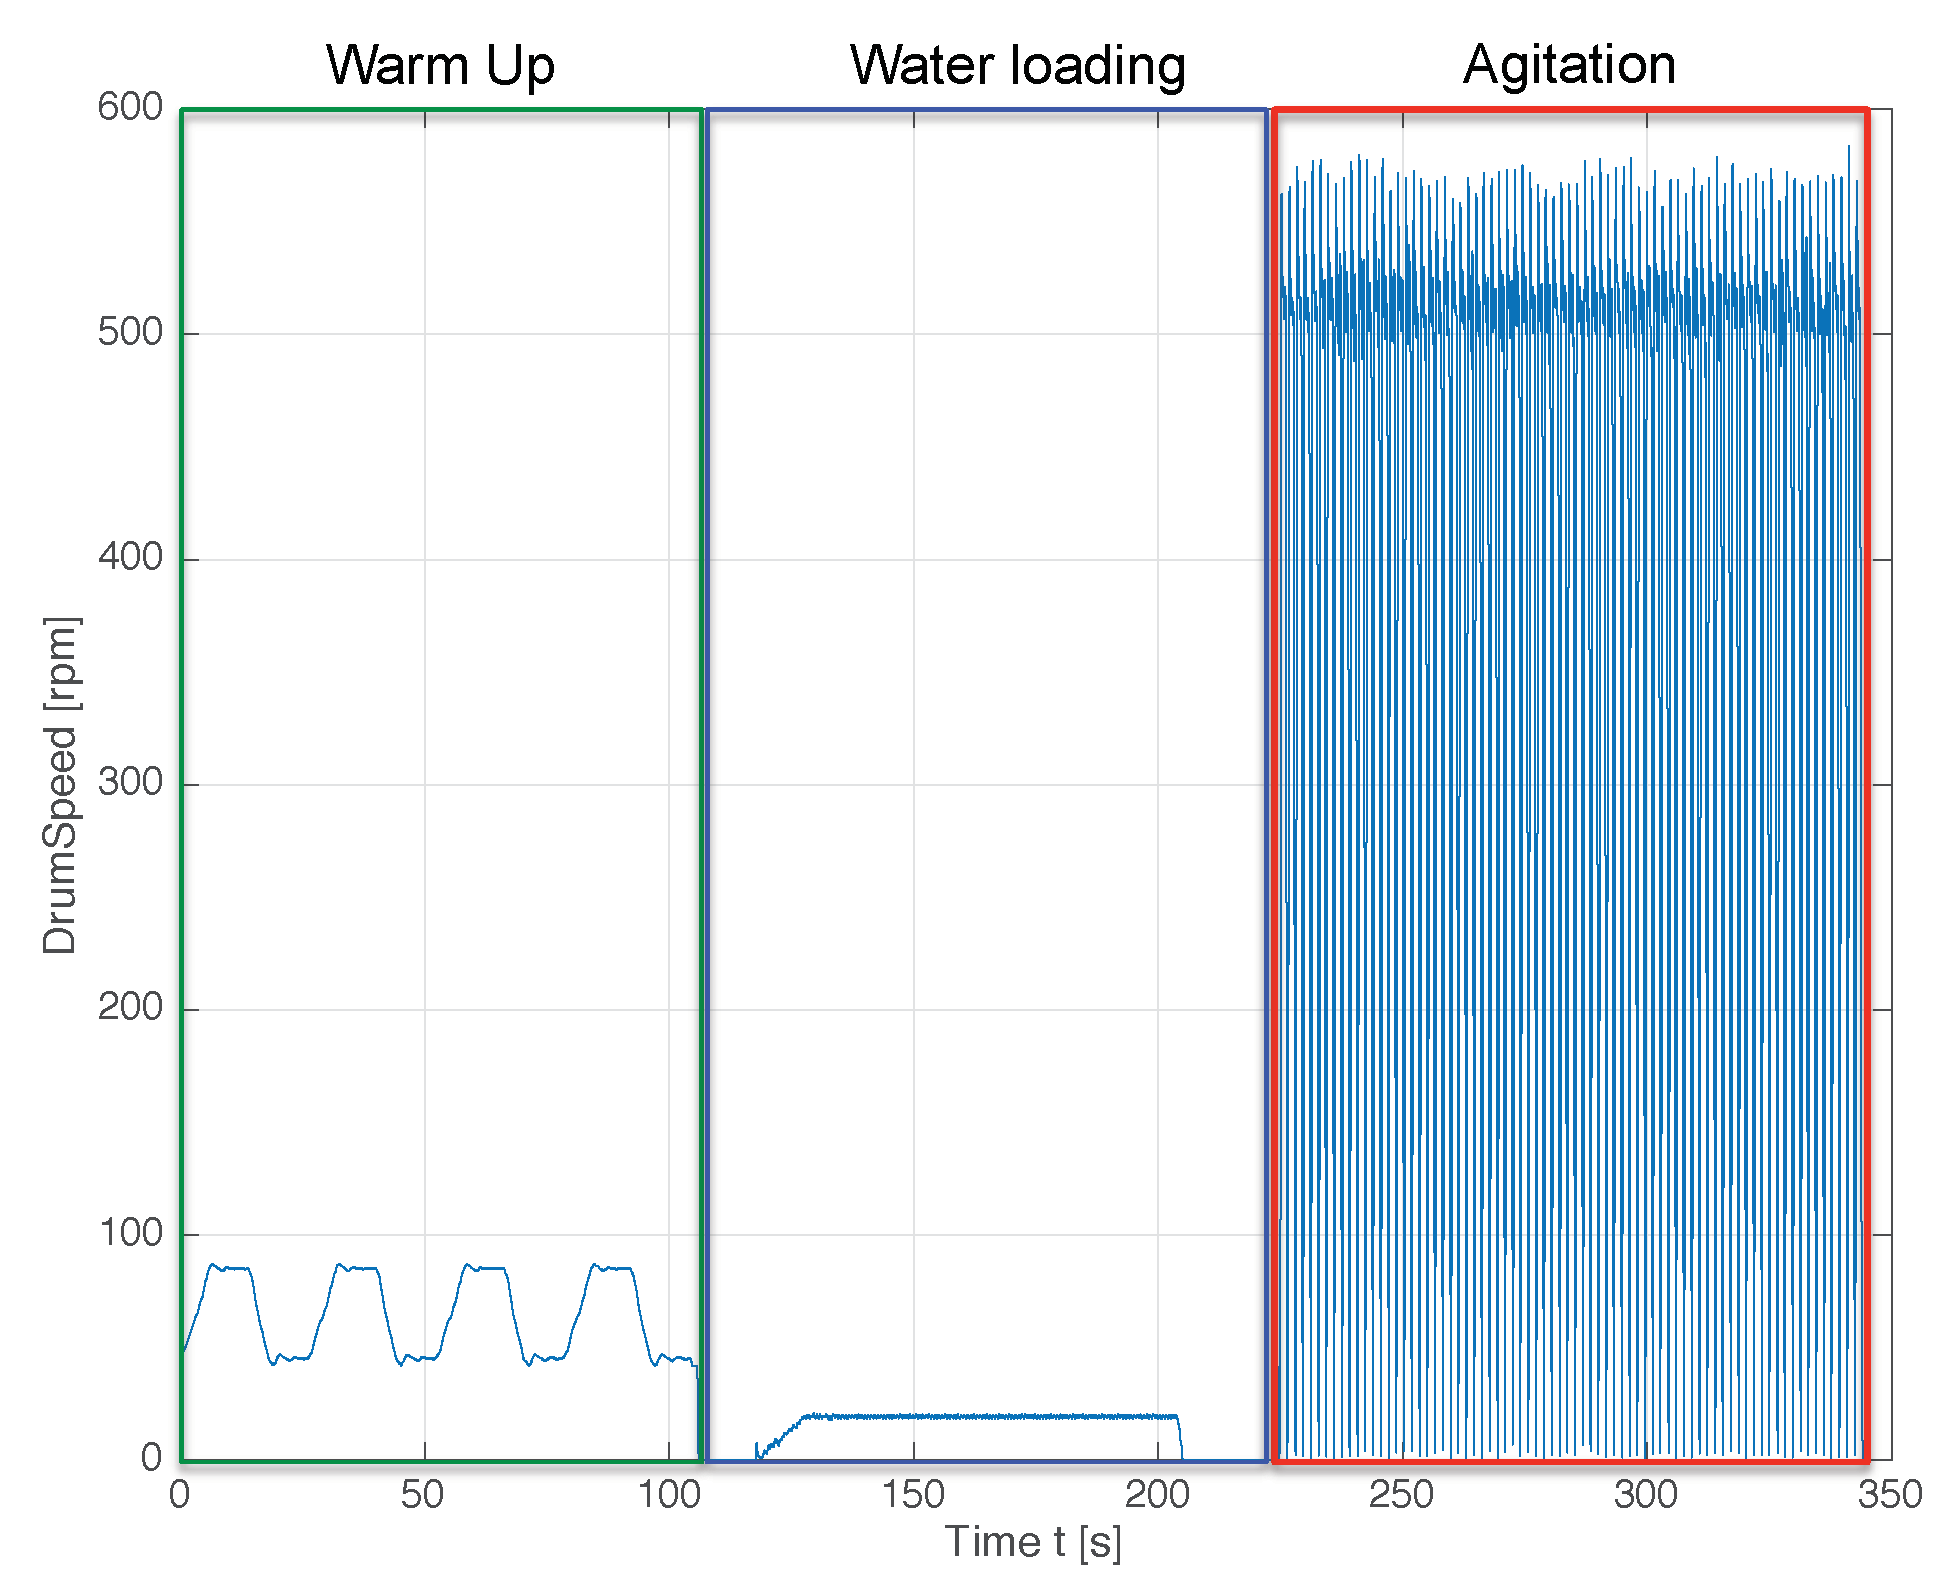
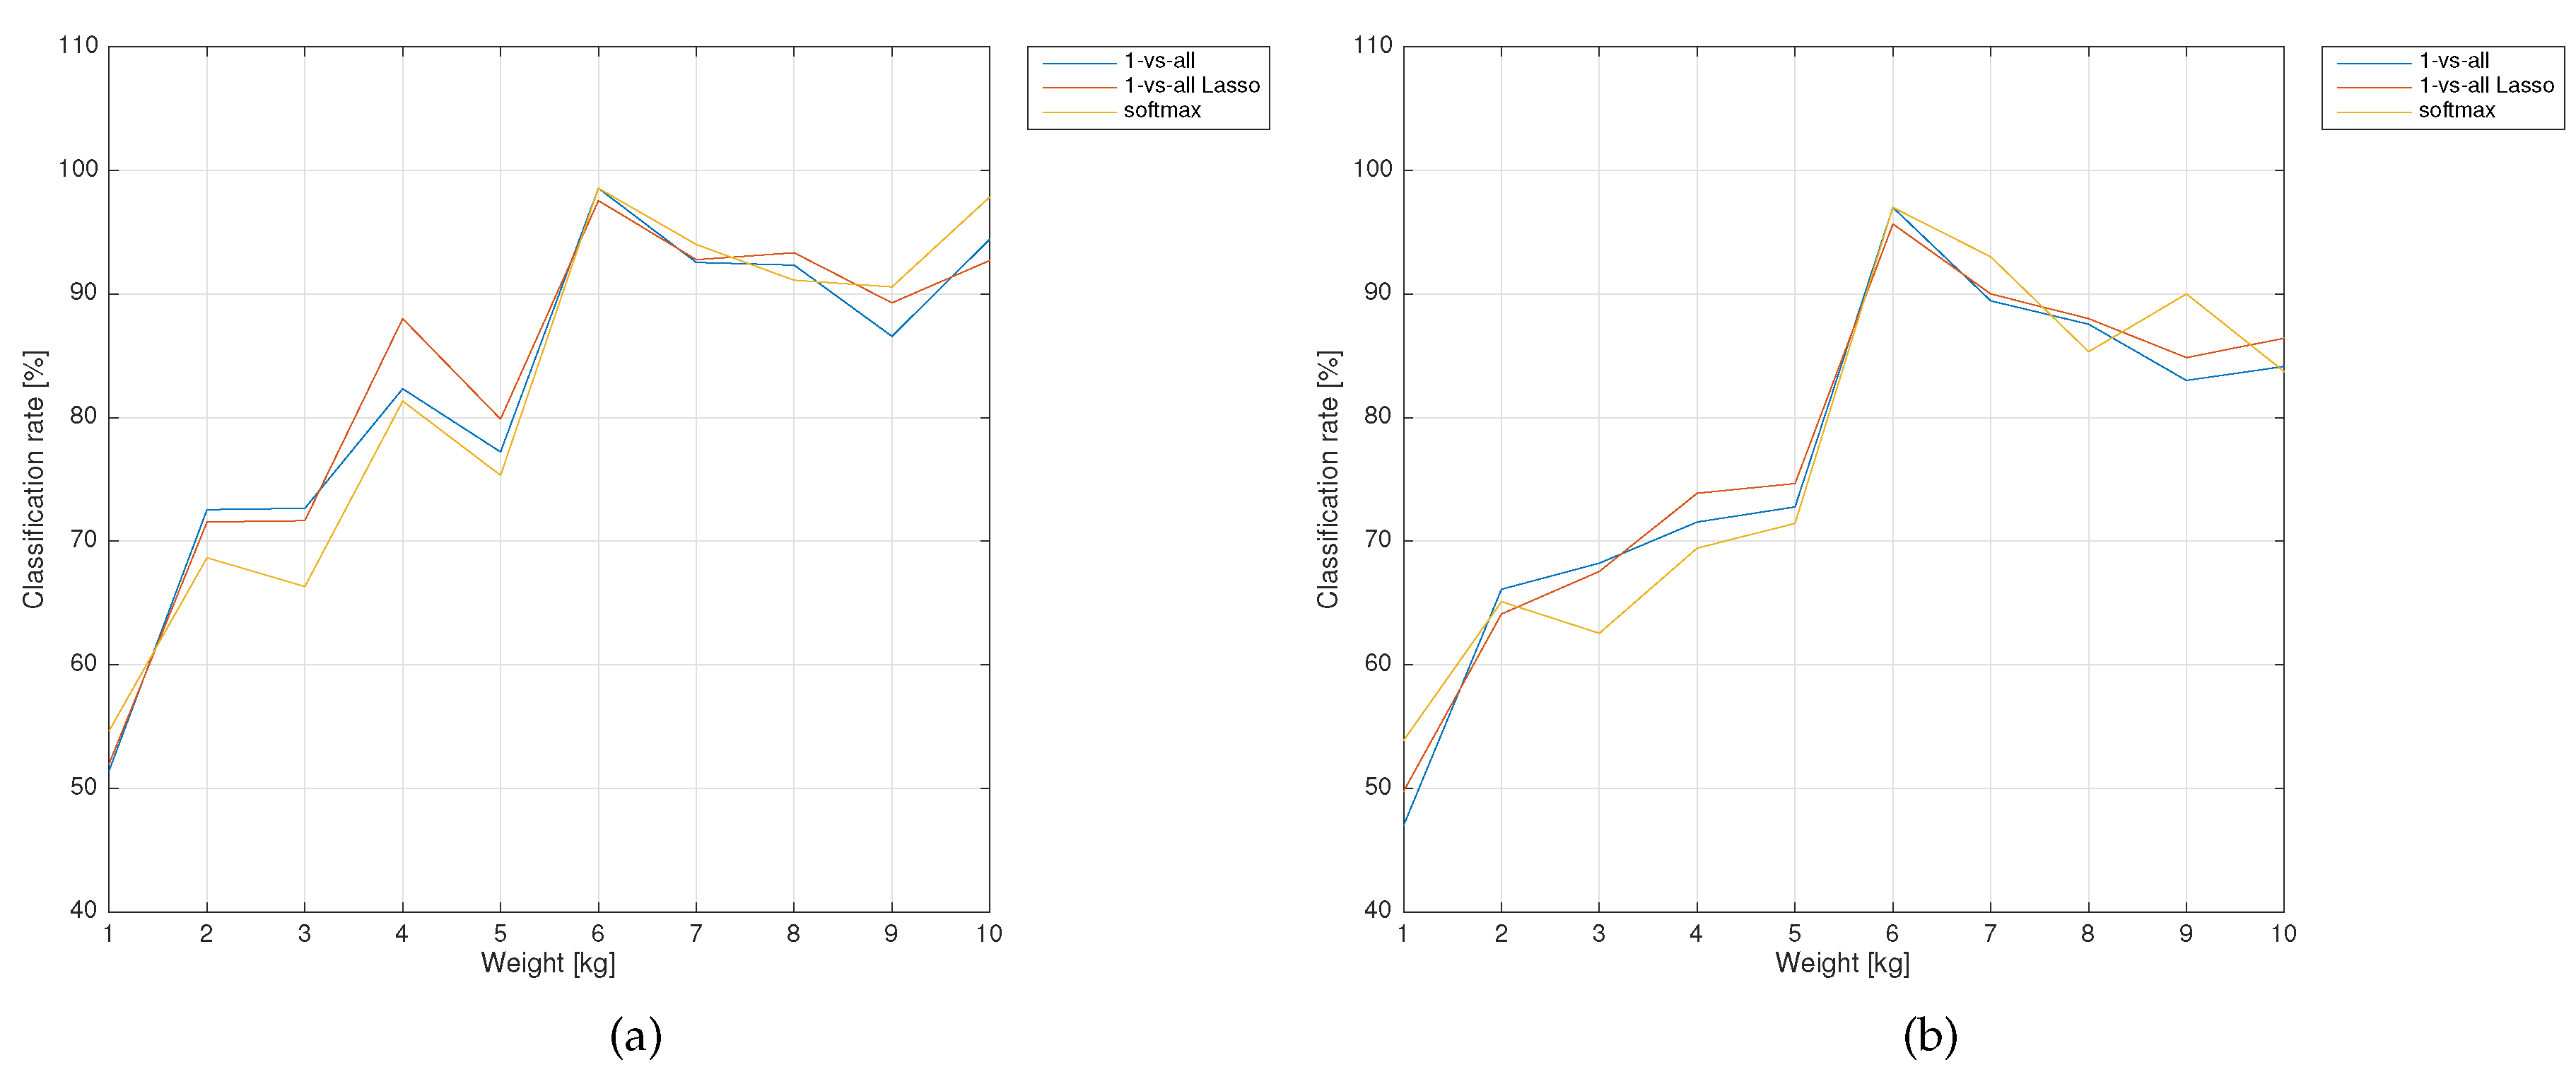
Our dataset was composed of various laboratory tests performed with different load typologies and weights, where measurements from the Motor Control Board has been acquired during the entire duration of the cycle. Of particular interest is the drum torque and drum speed that reflect the inertial properties of the load and are very informative about its typology. In total, tests have been performed with four load typologies that, for confidentiality reasons, we will call in an anonymized way types A, B, C, and D. Such tests were performed with laundry weights in . The size of the available dataset is limited by the time-consuming laboratory tests that require an entire washing cycle to be performed with known weight and typology of the laundry. However, the number of predictors is less than number of samples per class available, which makes our method feasible when combined with regularization methods. In particular, each class has at least 50 tests and the number of predictors in our problem is 50. Hence, the total dataset size is 5 times the number of features used in the model.
In
Figure 5, we report an example of time evolution of the drum speed variable. The three washing phases are clearly distinguishable and easily separable by automatic algorithms.
4. Load Fabric Detection Method
In this Section, we detail the proposed prediction algorithm with the preliminary feature engineering and extraction phases. As noticeable in
Figure 5, the acquired data exhibit a complex dynamical structure that cannot be directly handled by simple classification algorithms. For this reason, a feature extraction is required where a set of meaningful quantities are extracted from such complex data in order to obtain a set of predictors that can be organized in a design matrix and fed to the ML algorithms. After the feature extraction, we built two prediction models, a simple one (called
Parsimonious Model) suitable for deployment in the VM firmware and a hierarchical (
Hierarchical Model) one that is more resource demanding.
4.1. Feature Extraction and Analysis
During the feature extraction phase, we determined by visual inspection of the signals some meaningful quantities that allows to discern the different typology classes; typically, these are related to properties of the signals or filtered versions of them such as peaks, transient times, temporal averages, etc. During this process, the water-loading phase has been removed from the data because it depends on the plumbing system and presents substantial variability from home to home and does not provide consistent information.
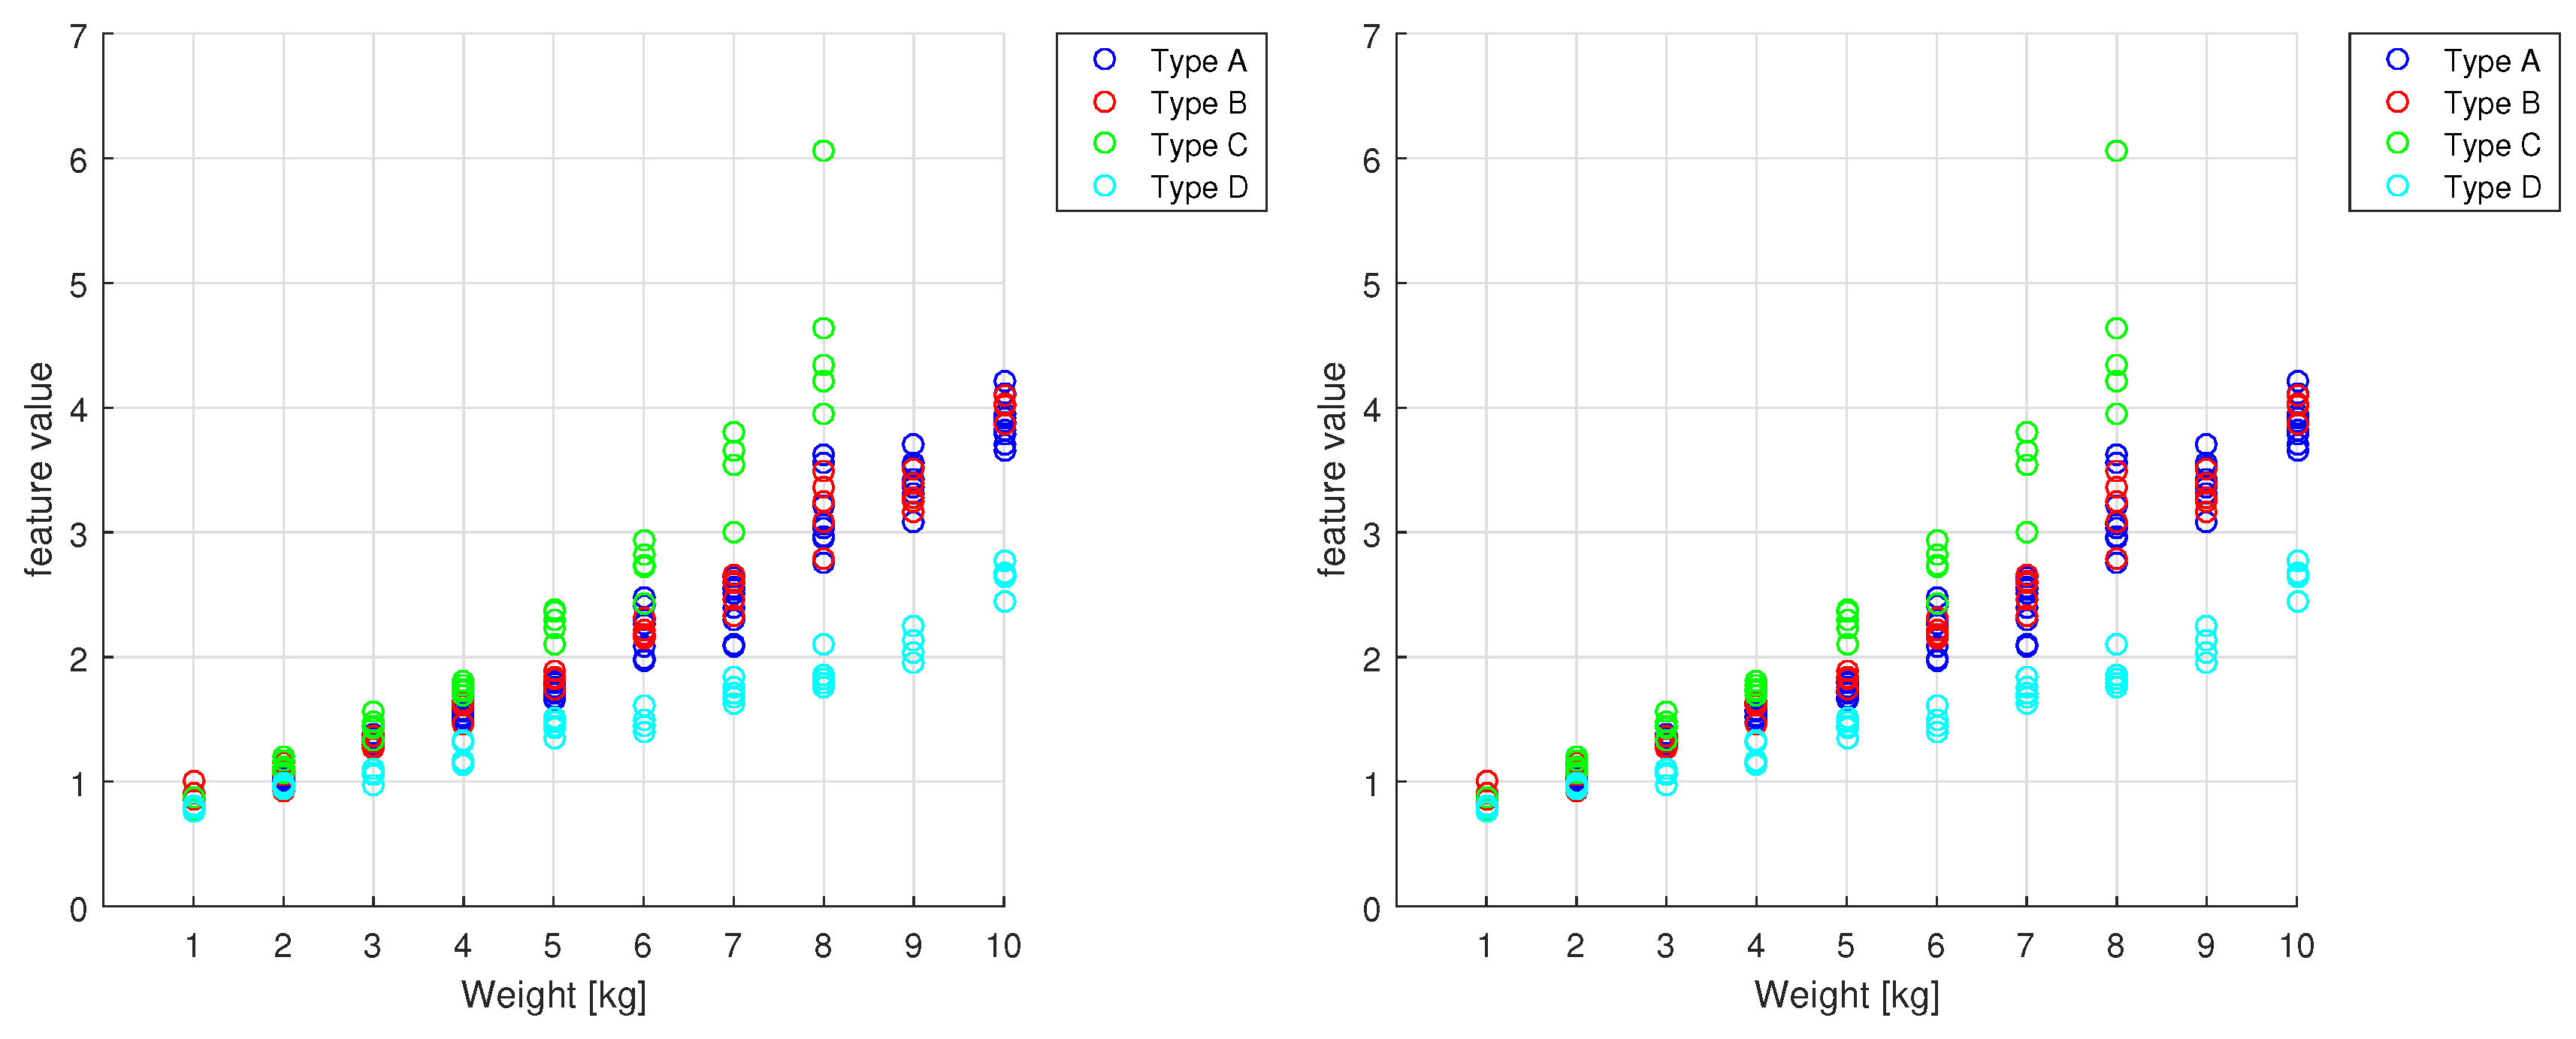
Due to the extremely different behavior between the WU and the AG phases, we treated them separately. In particular, in the WU phase 4, repeated commutations have analogous dynamics; we thus extracted the same features from each of these commutation. Also, the AG phase is composed of repeated movements with a much faster dynamic called “strokes”; here, we decided to extract some features related to the single strokes and some related to the entire series. In the first case, statistics over the entire series are then computed to obtain a single value for the total phase. At the end of the procedure, a total of 50 features has been extracted from the two phases. It is worth remarking that, only during the AG phase, there is water inside the drum, so we expect this part to be most informative about the water absorption properties of the load and, hence, for our task of typology estimation. In
Figure 6, we report two examples of features extracted from the AG phase on the drum torque signal as a function of the weight. It is clearly noticeable the difference between typologies, especially with high weights. However, types A and B show very similar behaviors; this has been justified by domain experts who suggested that the two loads have very similar absorption properties. We thus decided to group together types A and B in a single class called type AB.
4.2. Modeling
As stated above, the 4 WU commutations provide multiple observations of the same features; hence, it is possible to either employ them on a single model by computing a set of statistics over such features or by building separate models in a bagging fashion [
30] and by performing the classification by voting. Preliminary results showed that the former solution presents better performance [
18]; hence, we adopted it in all our models.
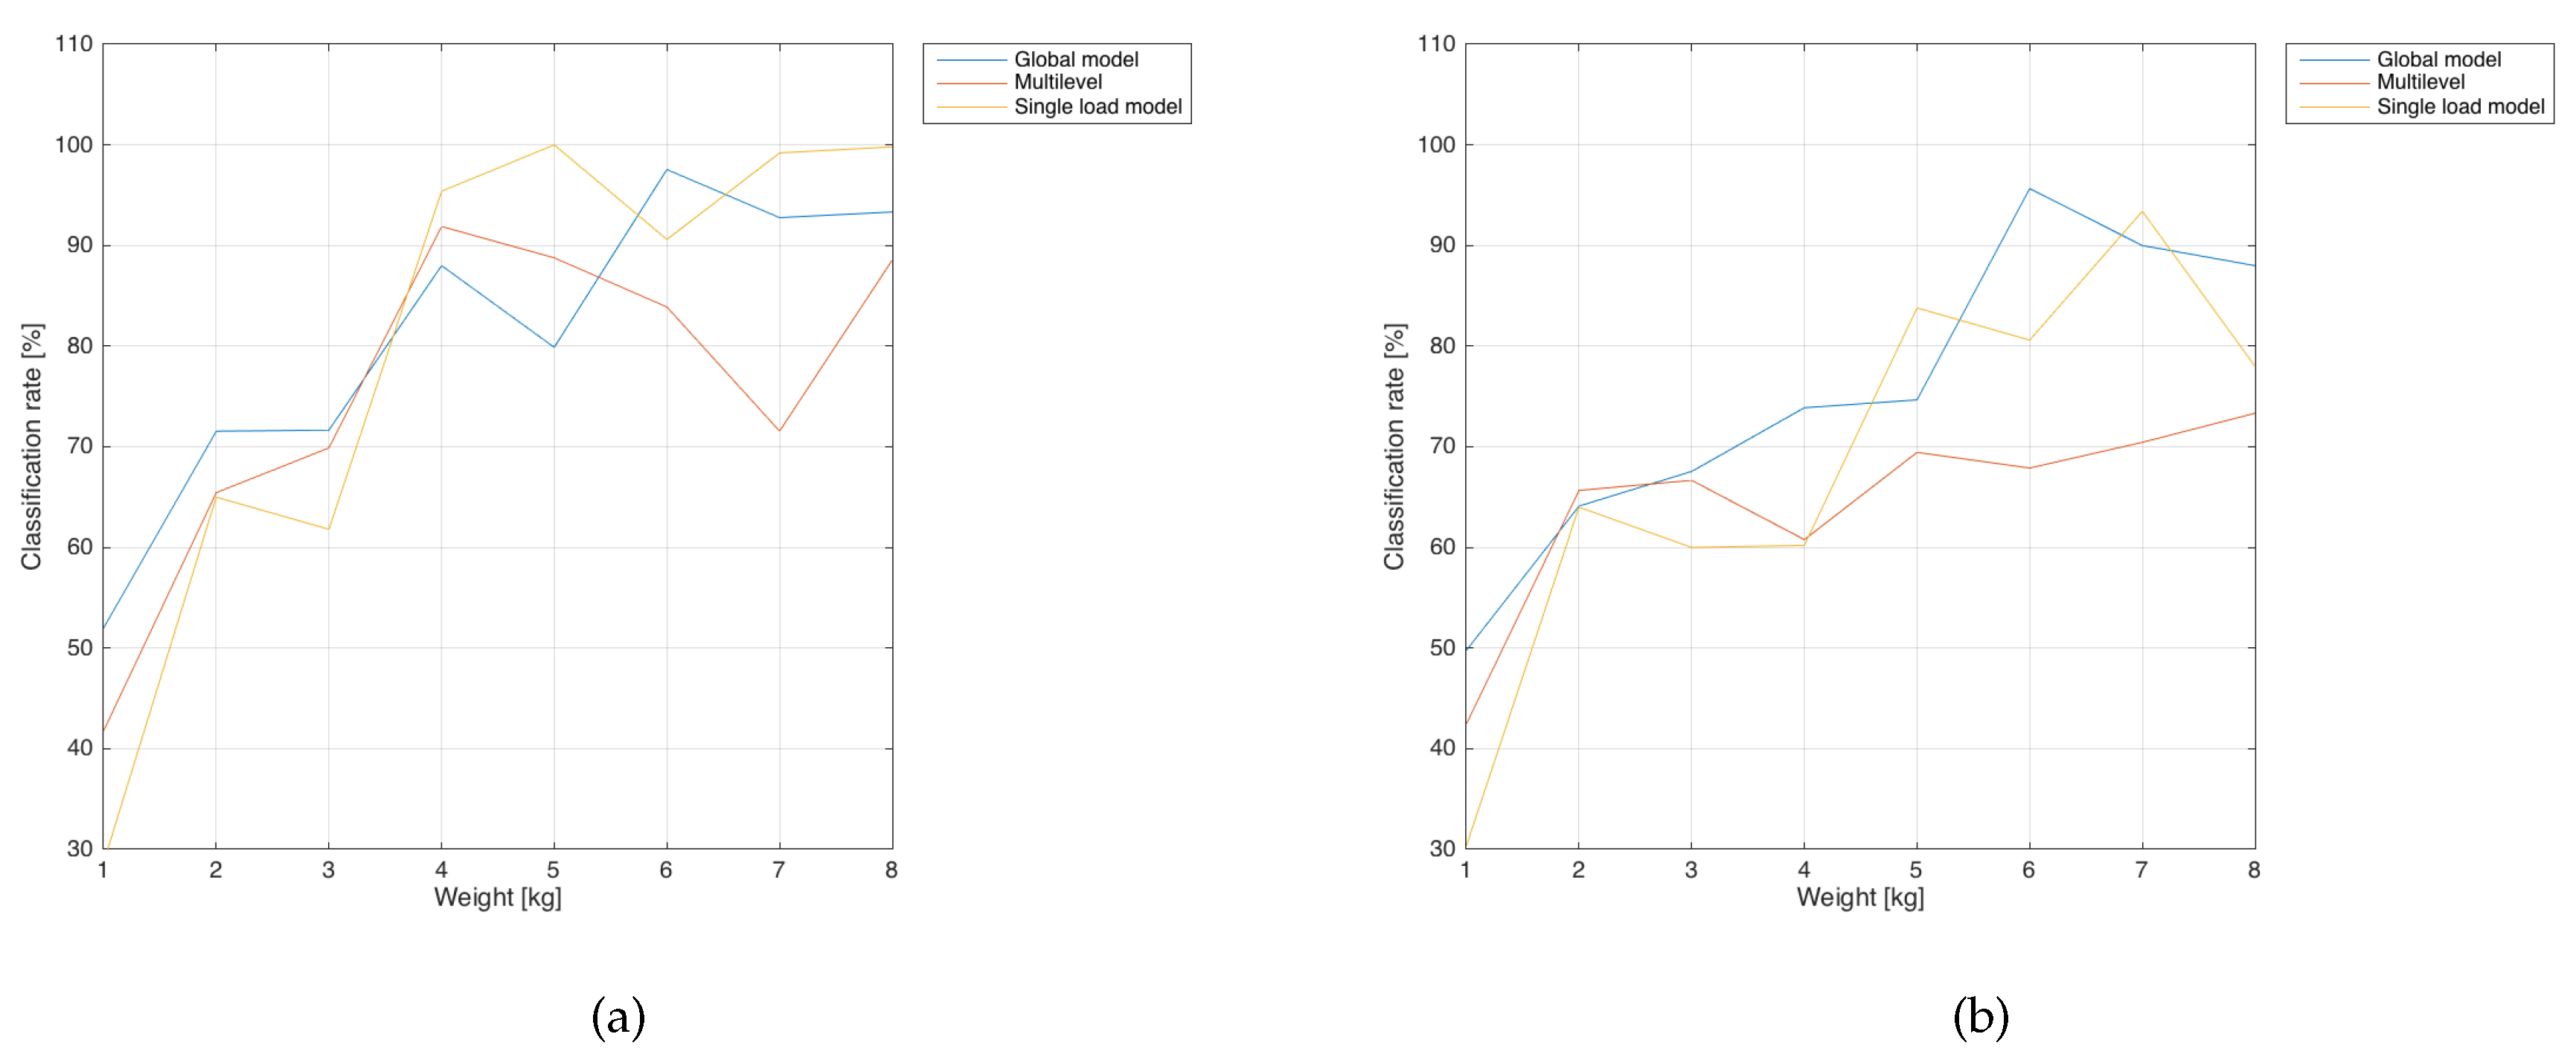
(i) The Parsimonious Model (denoted also as "global” model in the following) was built by employing logistic regression extended with the One vs All method to deal with the multiclass classification problem. The approach has been combined with LASSO regularization, providing a sparse solution feasible for deployment in the firmware.
(ii) The
Hierarchical Model has been created with the following procedure: since no explicit hierarchical structure was present in the features, we decided to assign to the root node (
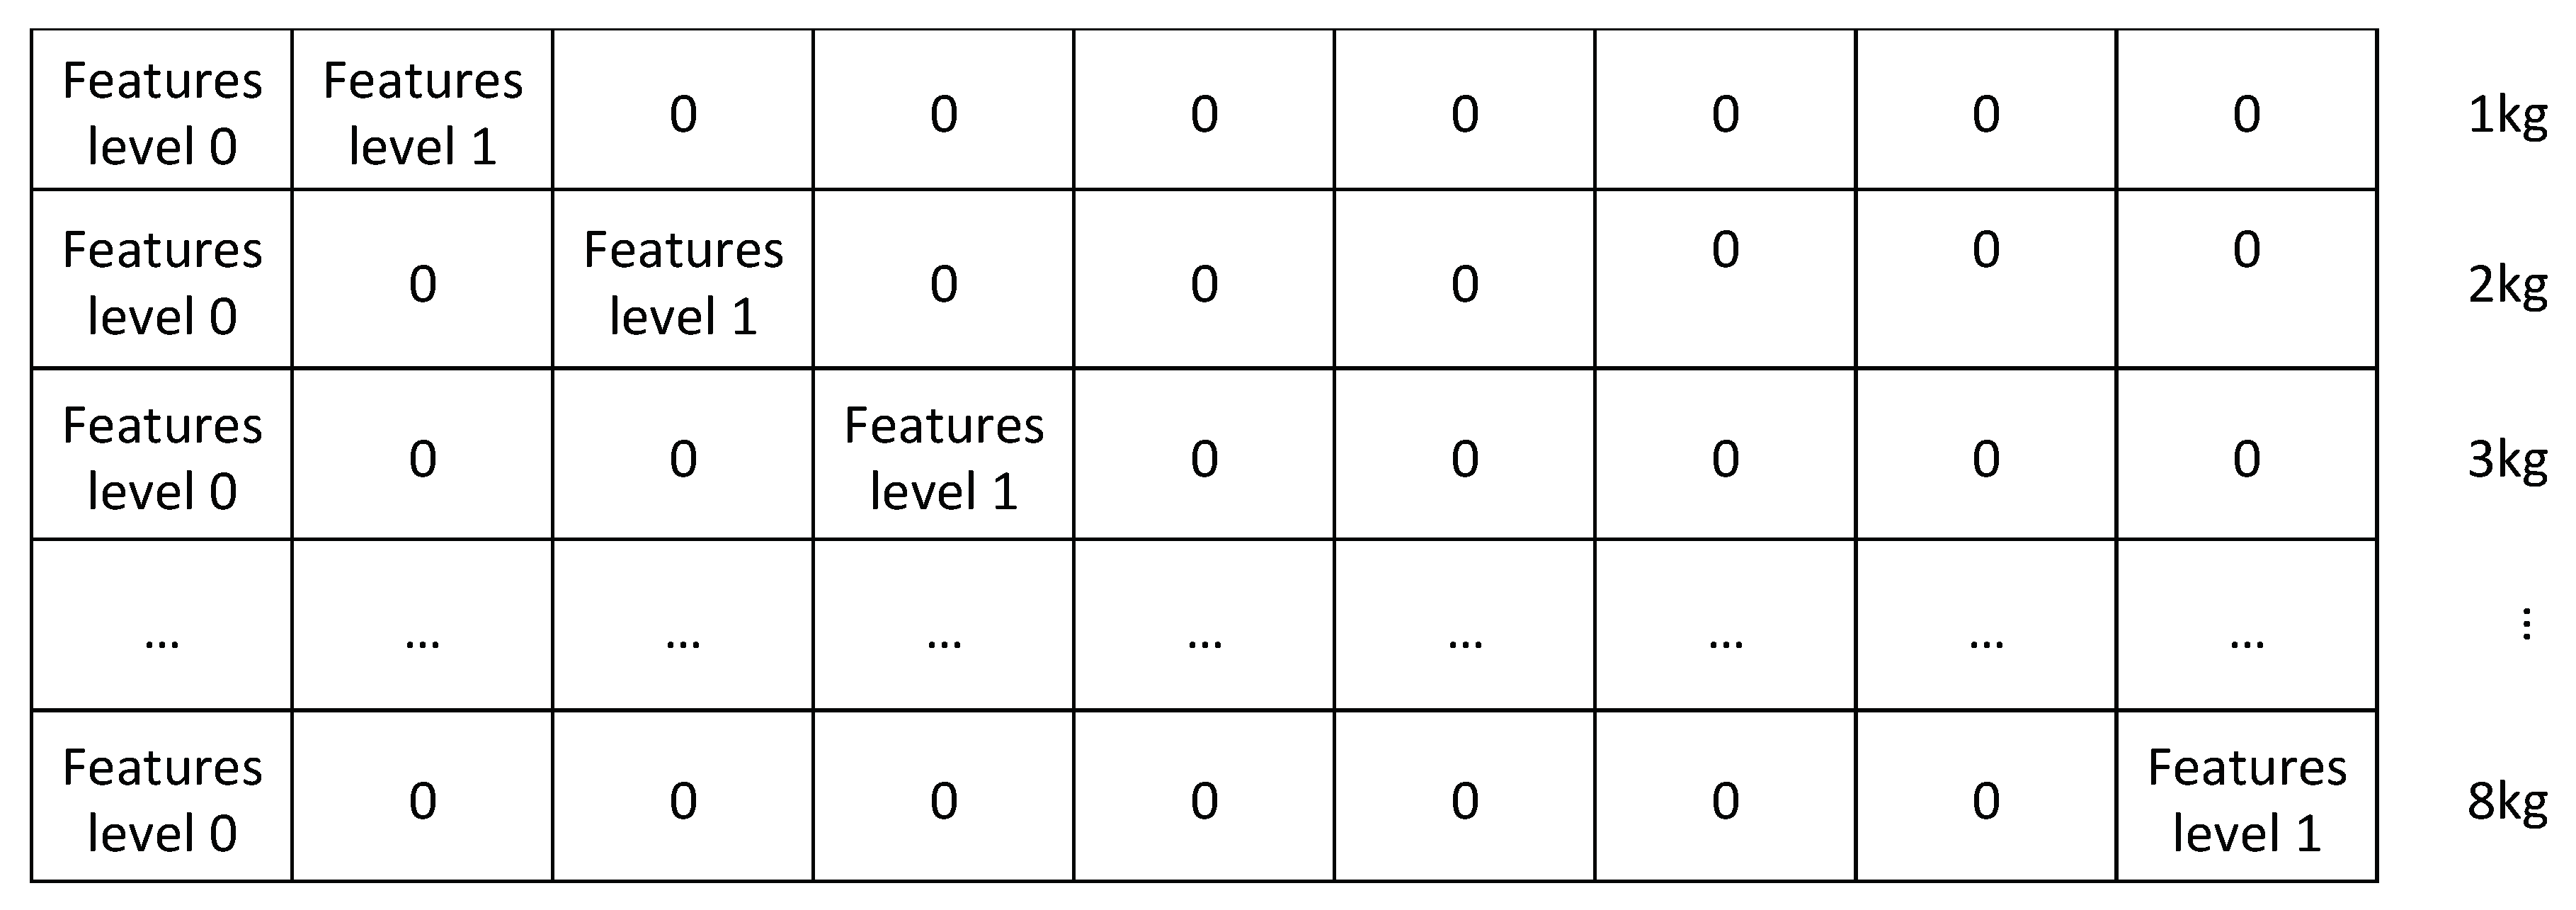
Figure 2) the 6 features most correlated with the output while the remaining 44 have been assigned to each of the leaf nodes. In this way, the features in the root share the weights with all the leaf nodes and provide most of the information related to the class that can then be refined using the contribution from the remaining predictors. Moreover, the root model should help the classification in the cases where it is more challenging (e.g., low weight). To summarize, the features are organized as follows:
Each row of the design matrix
is then defined as follows:
where
For a graphical explanation of the design matrix creation see
Figure 7.
Since no data for the type C class was available for 9/10 kg loads, we removed them from the dataset in the multilevel approach.


