1. Introduction
Currently, within the electrical sector there is an infinity of simulation programs that allow to know in detail all the characteristics of a distribution system; however, the electricity market at professional and educational level, does not have an intelligent decision tool which allows to implement a design solution for the layout of that distribution network. It is for this reason that, due to the lack of a tool that covers a network design necessity, the decision has been made to create an adaptable and scalable program which allows an optimal future distibution network layout in any georeferenced scenario. It is evident that, as a consequence of the exponential advance of the economy, there is a parallel growth in the number of users that are connected to the electricity grid, which in turn leads to a considerable increase in the system’s installed load. Thus, the importance of having suitable planning that allows an expansion of the electrical system is mandatory [
1,
2]. Expansion and planning of electrical networks involve the first and most important topic, which is distribution system. This system could become one of the most complex and important, mainly because it is related to the connection of the electrical system with the end users [
3,
4,
5,
6].
The planning of electrical networks is facing new and more complicated challenges due to evolution of demand, insertion of unbalanced demands and change of direction of the electric flow due to the presence of distributed generation. It is for this reason that the planning and selection of an appropriate topology is extremely important for the proper operation of the system, as well as for the contribution to improve the performance and user experience [
7,
8]. An efficient distribution system needs to be provided with the best possible topological configuration in order to provide and supply the increase in power and demand and in order to ensure minimum requirements demanded by the local distribution company, such as the voltage drop [
1,
3,
9]. In the same way, considering the expansion of the system is as important as planning, because in this way the optimum levels of service can be maintained and can ensure that the coverage area of the distribution network will include all desired users and thus provide them with electrical service [
10,
11].
The work presented below is structured in detail as follows: In
Section 2, a theoretical review is presented where general features of the distribution system will be explained, as well as the current regulations used to prepare this document.
Section 3 explains in detail the development of the decision tool that will allow a quick and simple estimate to provide a basic design of an electrical network, minimising the amount of distribution transformers.
Section 4 focuses on the expected results and the comparison of these with the results obtained. Finally, the conclusions, recommendations and future work are presented.
Distribution Network Models
Electricity distribution utilities are private or government-owned, however both have the same responsibilities, challenges and opportunities. Duties and tasks are focused to provide electricity to customers, considering technical requirements such as quality of supply, reliability and safety, whilst challenges and opportunities include cost-effective planning and the construction of distribution grids considering advanced devices in protection, control and communication technologies which facilitate a grid’s operation, increasing efficiency and security.
In recent years, some studies have been carried out on electricity distribution network planning, for example, [
12] a complete analysis of a variety of papers, which deal with perspectives, models and methodologies applied to design power distribution networks in recent years. Both, Kazmi et al. [
13] and Li et al. [
1] provide an extensive and comprehensive report about planning problems of distribution networks; both reviews deal with optimization techniques, models and methods and also they propose concepts relates with future/smart grids. On the other hand, some researchers propose an elemental idea of how the decision tool could be developed; that is to say, they propose several optimization methods that could be useful for the implementation of the design, but they do not execute it [
14,
15]. Other authors even describe several decision algorithms for the optimal location of some elements along the distribution system, but the location of those components is based on a previously established or designed distribution systems made by a person [
16]. Moreover, there is additional information where optimal planning tools are mentioned, but here the fundamental considerations for a design of distribution lines are carried out by the use of simulator programs [
17,
18,
19]. Related with power distribution systems, some studies have focused on how to improve resilience in distribution grids by graph theory or integrating distributed generation to the main grid [
10,
11], using georeferenced information as the initial stage.
In contrast, the presented work integrates all the basic considerations used by utilities to obtain the optimal deployment of a distribution network; as is known, medium-voltage (MV) grid extension is one of the most performed activities that a distribution utility implements daily; consequently, power grid construction projects need an extensive amount of budget to face labor costs and material cost. Set in this context, and as can be seen in
Figure 1, the proposed algorithm has been implemented to display the best distribution of the electrical components such as optimal allocation of technical resources such as power cables, distribution transformers and switching equipment, which are evaluated based on effectiveness cost analysis considering the minimal investment on construction projects supplying to the maximum number of customers and considering technical constraints like voltage drops and commercial ratings for cables and transformers on georeferenced planes. Additionally, the proposed tool in this paper can be used in any real situations and not only as a theoretical simulation; consequently, the decision-making tool could be used for academic and field purposes.
2. Design of an Electrical Distribution System
To start the design process, there are several considerations that must be taken into account to have an optimal and adequate design, which will define and identify minimum and maximum values, and the capacities and locations of equipment, among other things. Depending on the considerations described above, a final decision may be taken to have an adequate arrangement of the distribution network, as well as the characteristics of all the elements that are part of that network [
20,
21]. Furthermore, basic criteria and elements will be described based on the local electricity company standards; those conditions are considered by the design tool in order to plan the distribution electricity networks. Those conditions are: Consumer classification, factors for the calculation of the maximum diversified demand, design demand, acceptable voltage drops, circuit configuration, connection schemes and the location and nominal capacity of the equipment and cable selection [
22].
The implementation of policies in the energy sector to be able to deliver a product that is sustainable and has the best quality; this has been possible thanks to the fact that users have been segmented into two groups based on their consumption; these are residential and commercial or industrial. This paper only considers residential clients; however, for future consideration, the tool could be modified for a case study that contemplates commercial and industrial clients; as it was mentioned before, this type of segment has different needs and considerations than residential clients.
In this case, residential customers in turn are classified into six different consumption segments, as shown in
Table 1. This table allows to know the needs of each of these sectors and to meet their requirements in detail [
21,
22].
As can be seen in
Table 1, consumers are segmented according to the level of energy consumption that each of them has per month. For the present case study, a residential area of type B will be considered, since this is one of the most common along an urban area. It is important to emphasize that, for these energy consumption values, the additional consumption that the insertion of electric cookers included in the government implementation plan causes are not taken into account since this is focused only on categories C, D and E.
The second parameter that must be analyzed, for an accurate design of a distribution network, is a determination of the maximum diversified demand, which could be specified as the maximum load connected to the distribution system.
As can be seen in Equation (1), the maximum diversified demand is directly proportional to the value obtained by the multiplication of the M and N factors, which are known as the coincidence factor and the consumption factor, respectively. The first one focuses on the number of customers that can be connected to the system at the same time, while the second one relates to the maximum amount of energy the customer can consume in a period of one month. Both values are already specified in tables within the regulations of the local electricity company.
The preparation of an electrical demand study considering the incidence of demographic, technical and technological variables will allow performing an adequate expansion planning of the distribution network in order to ensure the supply of electrical energy. The study of the planning of an electricity distribution network must be based on the evolution of the users and their behavior of electricity consumption, based on the fact that, if there is an error in the projection of demand, a generation deficit could occur. The assessment of the demand is essential in order to obtain a decision of the possible routing alternatives of the distribution line and therefore the proper path to reach each user with the electricity supply. Likewise, it could be understood that appropriate planning according to demand can be very useful for the preparation of an optimal budget, to carry out a study that allows the reduction of losses in the system and especially for sizing and proper location of the equipment to be used.
The design demand and the maximum design demand are closely related, since the first one is calculated from the second one, as indicated in the following equation.
where:
DD: Design demand,
DMD: Maximum design demand,
DAP: Public lighting demand,
DPT: Demand for resistive technical losses,
FP: Power Factor.
It should be clarified that the demand for street lighting is particular for each project; also in many cases the demand for lighting is minimal compared to the total maximum demand of the circuit; for this reason, for this particular case, the demand for street lighting is negligible. In addition to this, the demand for resistive technical losses is calculated by multiplying the DMD by a percentage of technical losses commonly established at 3.6%. This value already includes 1% of the technical losses that appear in the feeder which connect the transformer and the electrical control board of the final consumer. Finally, a power factor of 0.95 has been established for the whole system. The table below describes in detail the maximum demand and the installed load for different types of residential users. The values presented are in kW and kVA.
The values presented in
Table 2, can provide a wide overview of the relationship between demand and installed load, always keeping in mind that these values are not affected by the use of electric cookers.
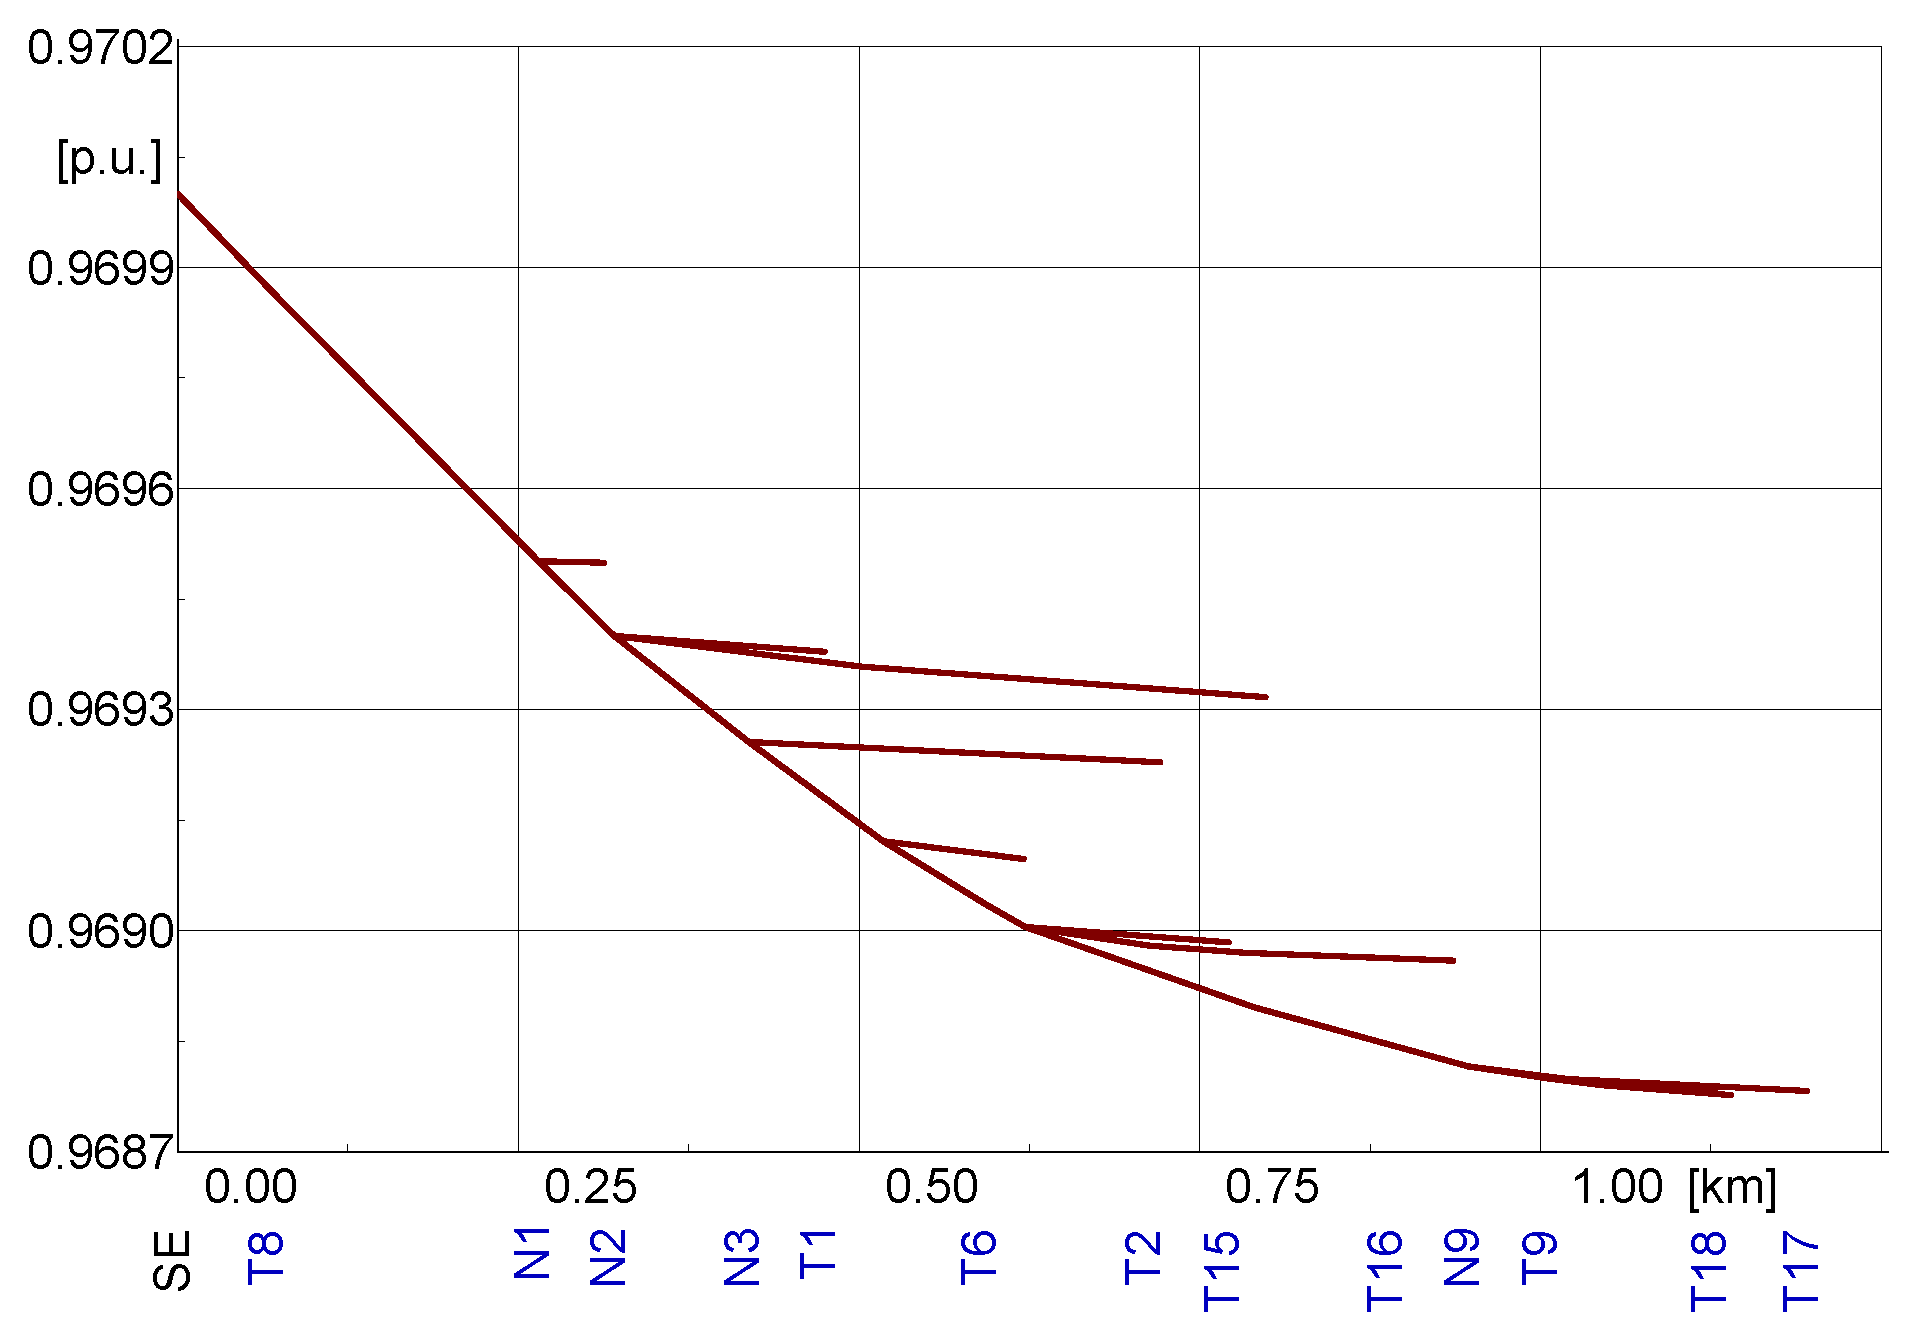
There are several considerations that must be taken into account for the design of distribution networks, but there is no doubt that voltage drop is one of the most important technical parameters. Consequently, the distribution networks must be designed in such a way that the farthest point of the power supply network, with the design demand already established and expressed as a percentage of the system’s nominal voltage (phase–ground), should not exceed the recommended values for urban areas of 3.0% and 3.5% for rural areas. However, it is important to note that the consumer who is connected to the network and whose location is the closest to the source does not exceed the maximum tolerable voltage values, but at the same time this must not compromise that the furthest consumer of the electrical source has voltage ranges below the minimum percentage allowed.
The characteristics and type of installation which is planned to be implemented must be based on the standards previously established by the local electricity company and the corresponding regulatory organization; all this depending on the location of the project and the characteristics of the area to be interfered in. There are several alternatives depending on the type of installation (overhead or underground cable) and the configuration of the distribution networks (radial, loop or mesh). All possible options mentioned previously will directly influence the location of the transformer and the type of conductor used [
22,
23]. Overhead installations in distribution systems have the characteristic that all their elements are located on mechanical support structures over the ground and the wiring system is through conductors without insulation cover (aluminum or copper cables). The underground distribution system has the characteristic that the elements that are part of the system are below ground level; that is to say, that transformation chambers and conductors, which must have an adequate insulation, are below ground level. While the underground system differs in several technical and constructive aspects of overhead lines, the design tool presented in this paper can work in any of these two cases. This feature allows the tool to be more useful and adaptive compared with others ones; this is because it bases its operation on the consideration that all the connections in the distribution system have similar routings that follow the street distribution previously established in the georeferenced map [
8,
24]. It is important to mention that the system of the network is a three-phase system with a radial configuration, because this arrangement is the most common one for this type of system. A radial distribution system is characterized by having a single path between the substation and the end user. While this type of system is not the most appropriate, mainly for the reason that any interruption in its layout would result in a total loss of energy at users’ places, it is the most used due to its simplicity and predictive operation [
10,
25].
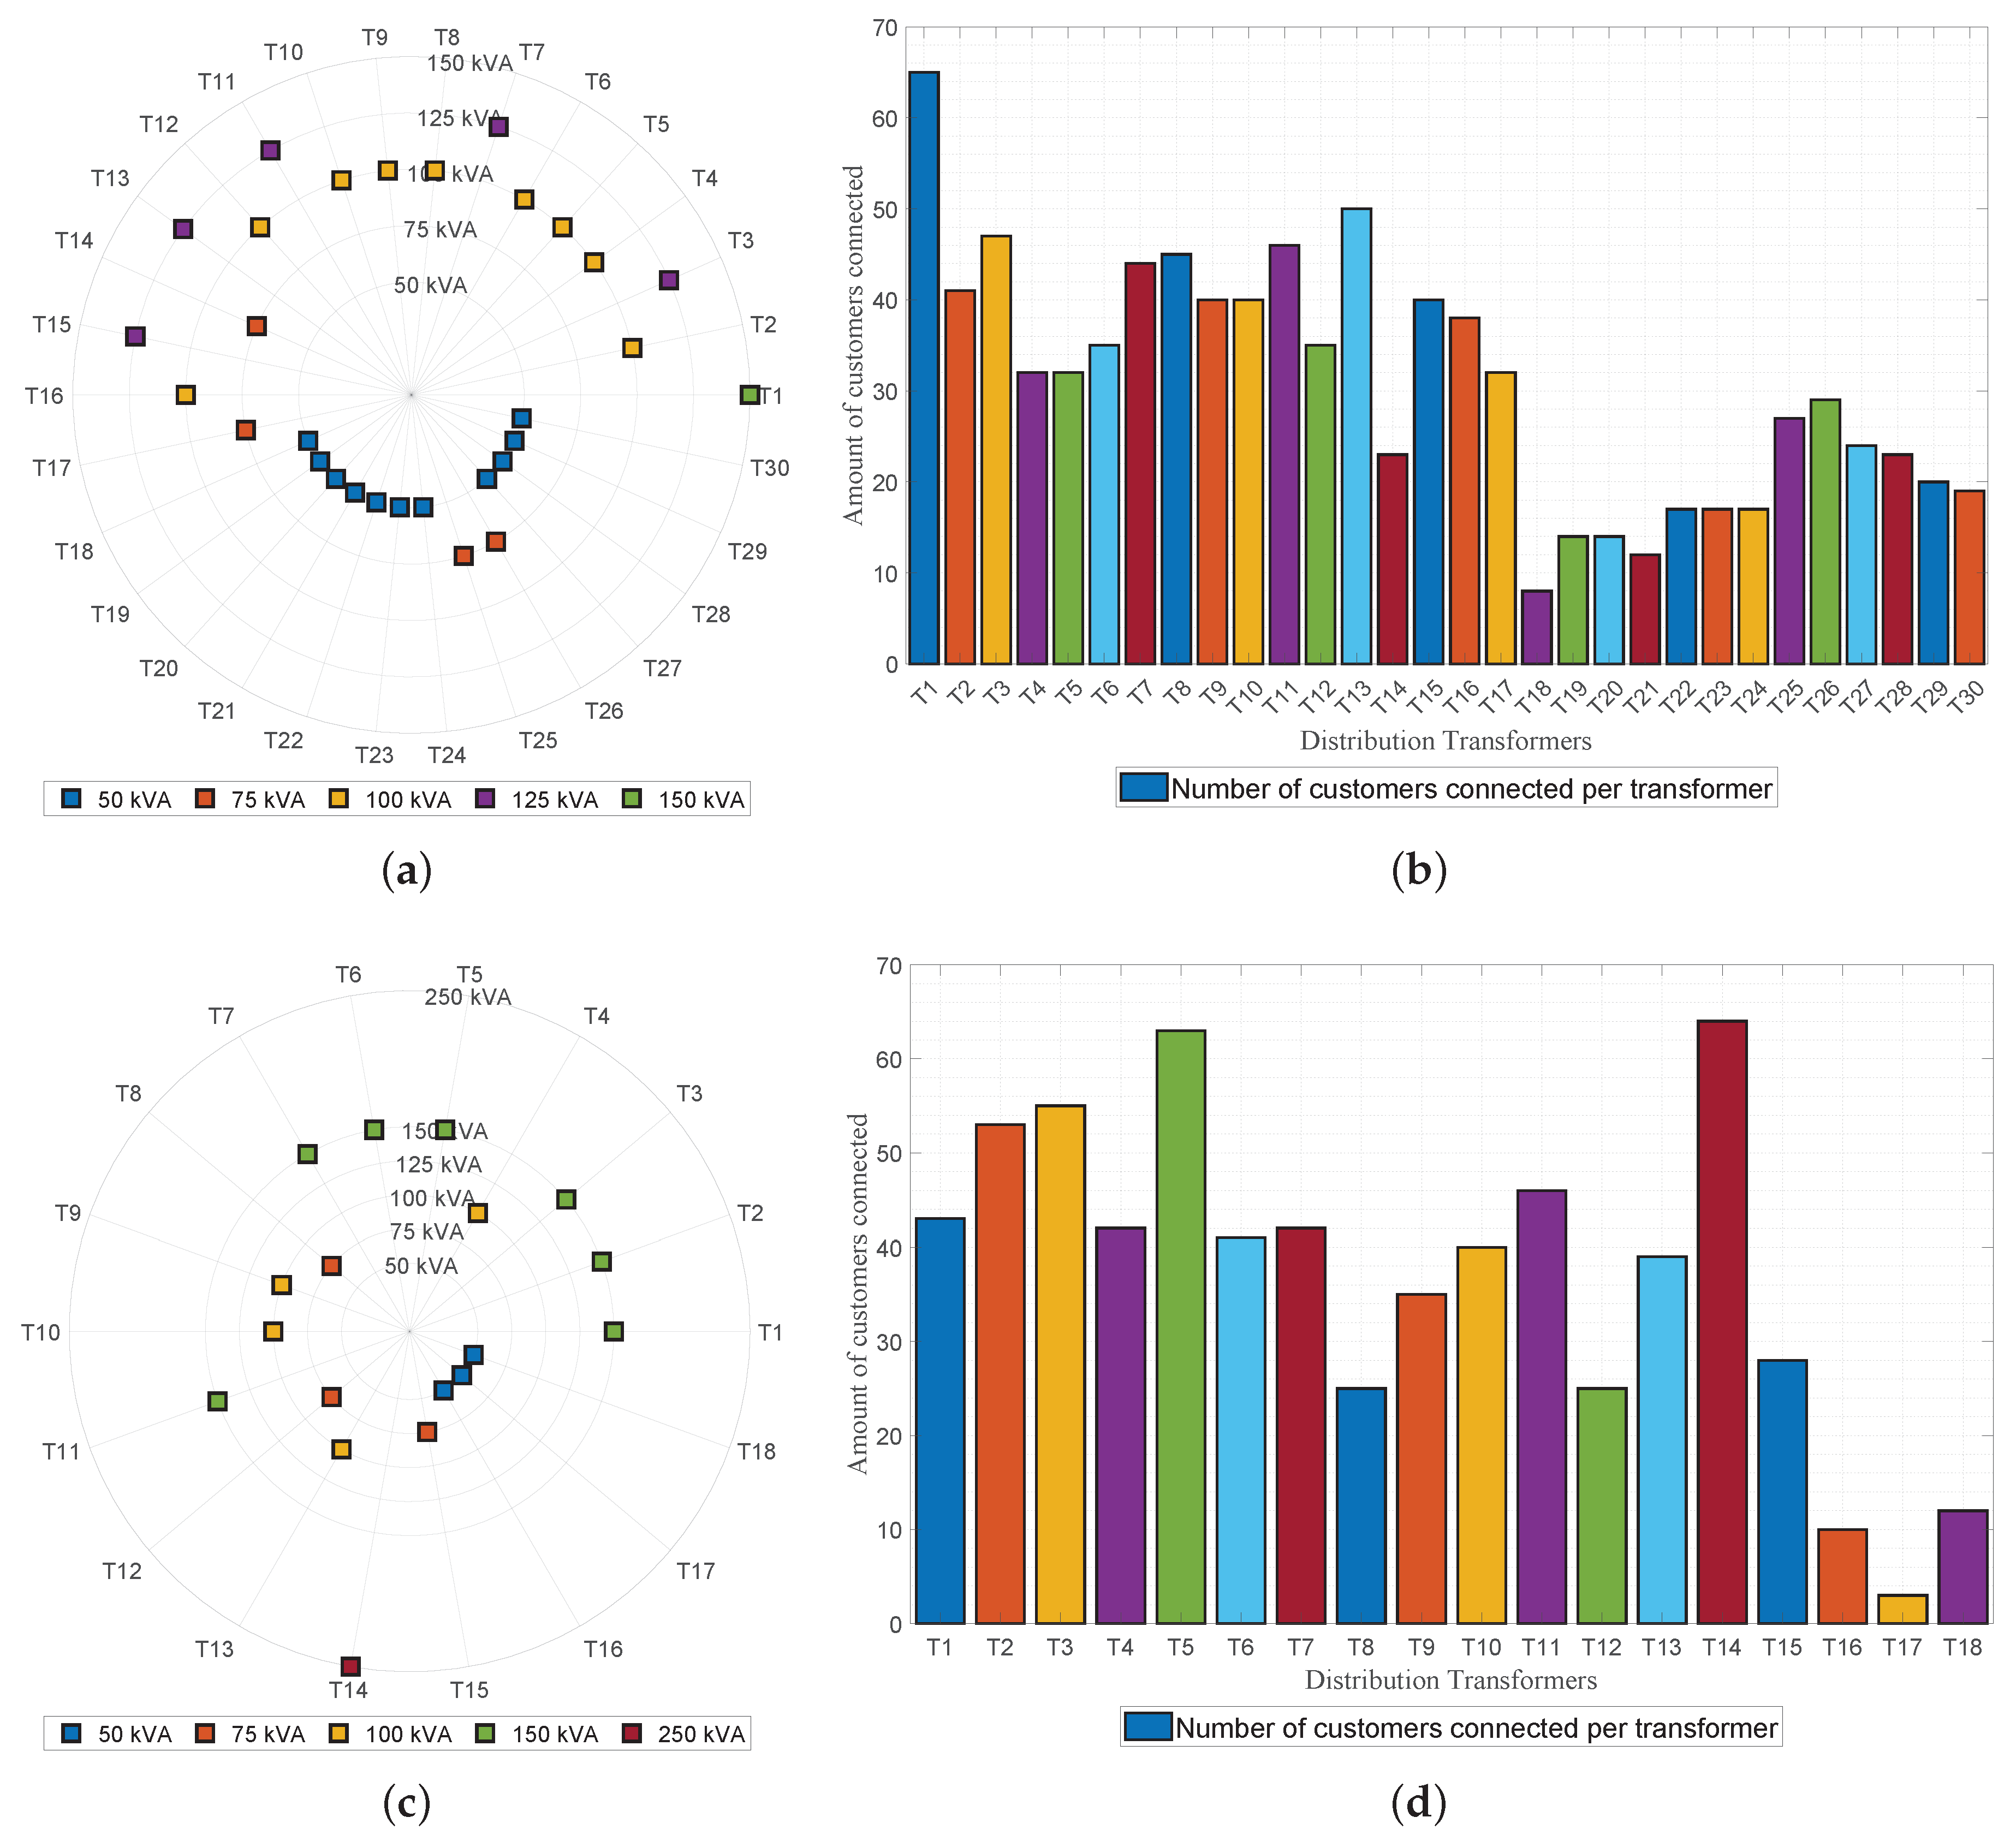
Now that all the basic requirements needed for the planning of an electrical distribution network have been analyzed in detail, the next step is sizing the elements that are part of the system; here the most important element is the transformer. Sizing the transformer properly is extremely important in order to avoid future problems related to energy efficiency, such as system losses. It is for this reason that, knowing the voltage in the Primary and secondary side, the type of transformer, the type of assembly and in particular the nominal capacity of the transformer are decisive when a design is taking place. For the present case study, powers of 50, 75, 100, 125 and 150 kVA will be taken into account, which are the nominal powers of the most used transformers at distribution level to supply energy to several users in residential areas [
22].
3. Network Planning Based on Graph Theory
Graph theory is a widely used study technique not only to deal with engineering-related problems but it can also be applied to multiple aspects and problems of several fields of study [
26,
27,
28]. Graph theory bases its operation on mathematical principles in which can be found several elements commonly known as vertices, nodes or points and a set of edges, lines or sides which can be oriented as a result of the restrictions adopted. Therefore, a direct relationship between electric distribution lines and graph theory can be made due to its combinatorial nature. Thus the nodes or points mentioned previously can be observed as coordinates that indicate the location of a substation and the transformation or a user, while the set of edges and lines are the conductors that physically connect substations with the transformers and these in turn with the users [
29,
30].
Most design methods and tools use mathematical models based on heuristics as the base for solving planning problems, since this allows finding a first approach that is very close to the optimal solution. In the present case study, these mathematical models focusing on a heuristic were used in order to reduce the number of distribution transformers using voltage drops as a constraint by implementing a controlled process that allows the growth of the distribution network. This controlled growth is carried out based on previously established values and data, which were explained previously in this paper, such as design demand, nominal power of transformers, locations of sources and energy consumers and characteristics of cables [
27]. The distribution network planning is related to the tree topology, where it is intended to find the shortest path from the source to all users who are included in the projected electricity system. Algorithms that are frequently used in graph theory are Kruskal or Prim; both are focused on optimizing a process by minimizing the distances between the nodes. In addition, Prim’s algorithm finds a minimum spanning tree for weighted undirected graphs, where the spanning tree is connected one vertex at time; consequently, at each step the nearest vertex is added to the tree [
30,
31,
32,
33].
The decision-making tool was designed based on a modified Prim algorithm, which uses the basis of a Prim algorithm. Nevertheless, changes and modifications are thought to find the minimal path between distribution transformers and the service point in less time. The proposed modified Prim requires a graph G = (V,E) of order
n and size
m; consequently, the vertex set V with exactly
edges, which belongs to the edge set E, permits to construct a spanning tree T of G joining all the vertices without loop or mesh topologies [
10,
31,
32,
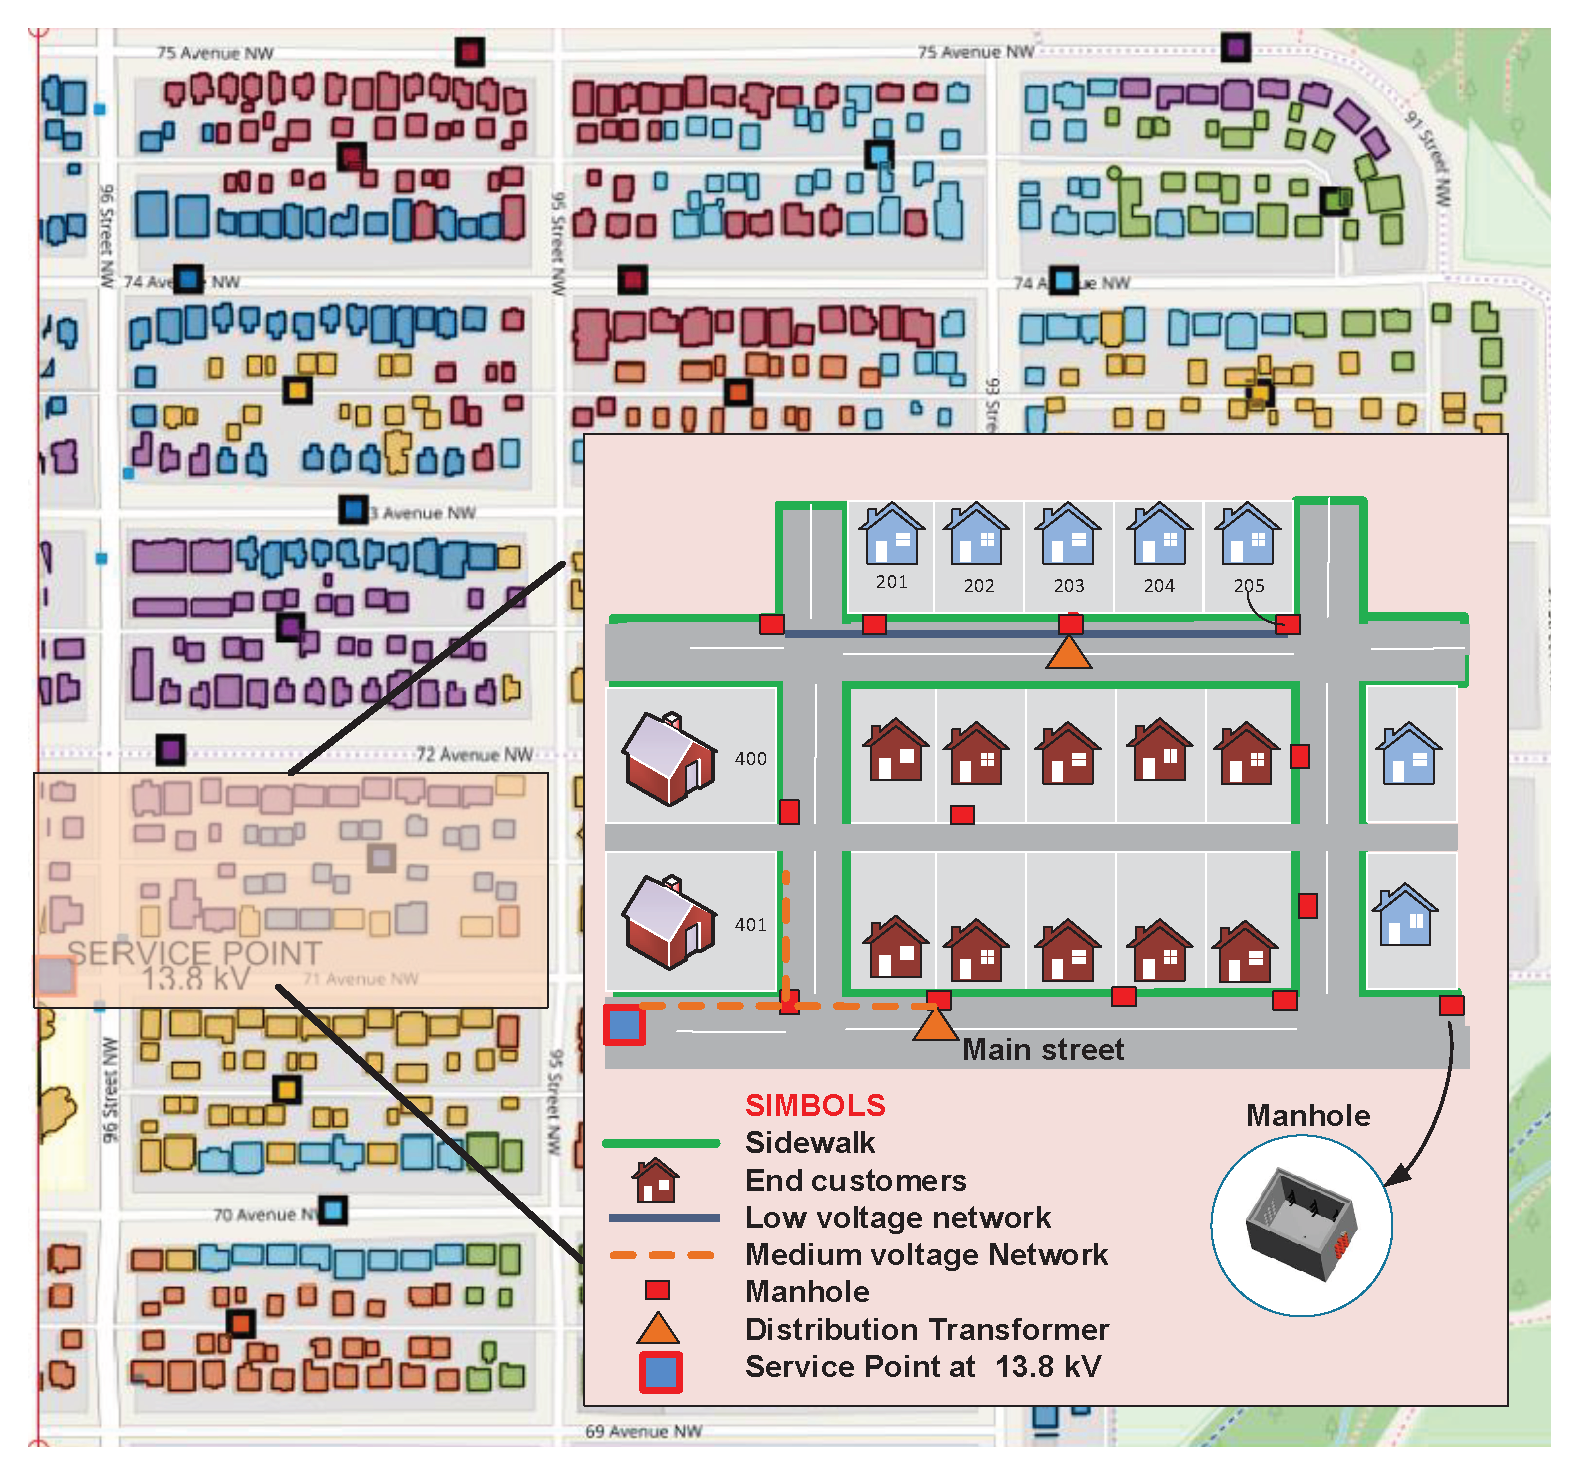
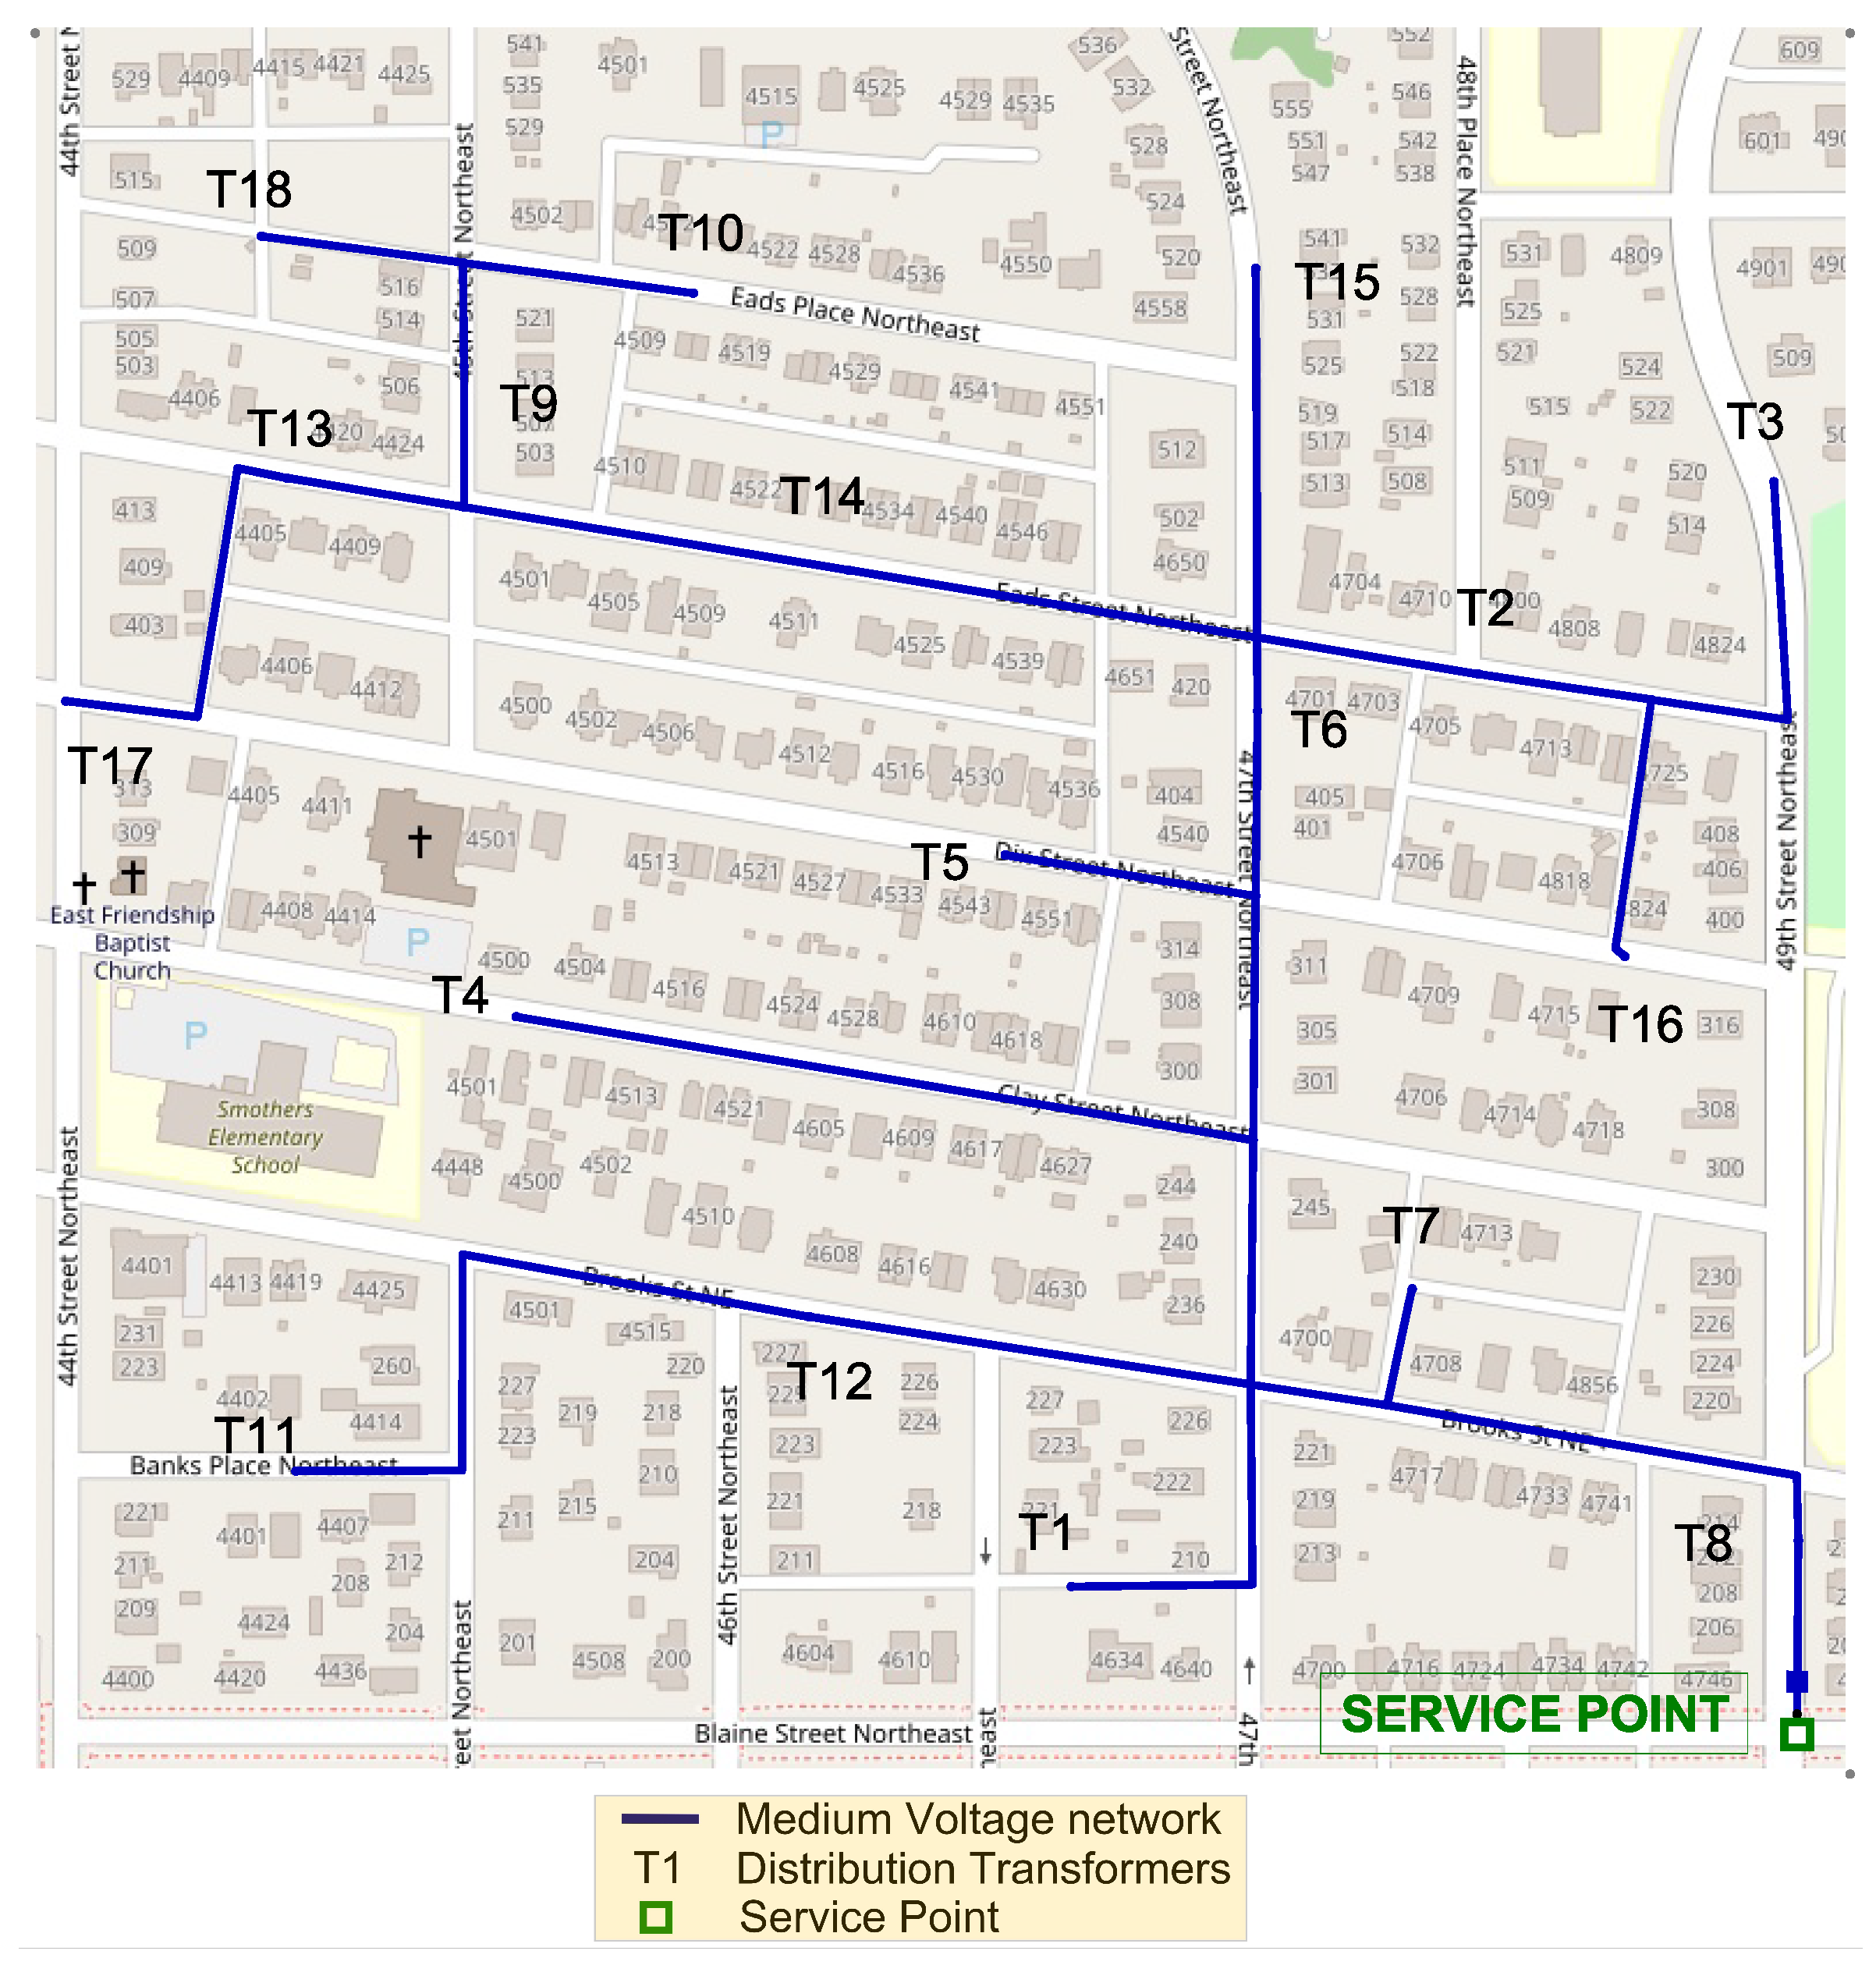
34]. Based on what precedes, not only the medium voltage network but also the location of distribution transformers were determined based on the modified Prim algorithm, due to the fact that the minimal tree ensures the minimal cost of the total grid. The decision-making tool uses geographic information, which is gathered from OSM files that normally contain data of highways and buildings. The geographical coordinates (latitude and longitude) are shown as points used to represent closed and non-closed features such as buildings and highways, respectively. Both closed and non-closed features are the basis for the decision-making process, where closed features permit to determine the amount of end users available in a specific area, whereas street topology and its geographical location are used to determine the best routing of medium voltage (MV) and low voltage (LV) networks joining manholes and distribution transformers. Distribution transformers are located under sidewalks on main streets and they are placed using the equivalent loading gravity center shown in following equations. The aforementioned process ensures the lowest voltages drops, since transformers are located near the most loaded manholes [
35].
where
represent the load demand associated to each manhole
i at the location expressed in longitude and latitude (
,
). Consequently, the coordinates of each transformer are calculated as
and
.
4. Problem Formulation
Underground network projects involve two main components: Medium and low voltage distribution grids. Both of them are complex systems, which are defined as combinatorial problems defined as NP complete, which are mainly dealt with by minimum spanning tree techniques based on the minimal path of the power grid extension. Parameters and variables are depicted in
Table 3 for the proposed methodology.
As was mentioned before, the reduction of labor costs and materials is a paramount task for engineers during the planning and execution of an underground project, where the objective function is to maximize the number of customers connected to the grid which is subjected to several technical constraints such as voltage drops, rating of transformers and cable size considering the most economical budget. For the present, the distribution network design is based on local electrical company standards, where distribution transformers are located using a modified Prim algorithm considering the maximum amount of customers, which can be connected to the grid using an adequate underground cable that meets with a technical constraint that allows a permissible voltage drop up to 3%. The objective function and its constraints are presented in Equations (
5)–(
7).
subject to:
As a consequence, a minimal amount of the distribution of the transformers is located on the greenfield, reducing the amount of investment in transformer acquisition. The other important component of underground projects is related with medium voltage grid extension, which is dealt by a Prim-modified algorithm to find the minimal path between distribution transformers and the point of connection (POC) to the electricity distribution system.
The present decision-making tool for underground distribution expansions can be explained in Algorithm 1, which can be divided into two decisive parts. The first part of the algorithm uses georeferenced information to allocate manholes or cable chambers along streets, which are placed in range the of 30 to 40 m. Then, residential customers, who are identified as buildings in georeferenced data, are connected to the nearest manhole reducing service entrance drops. Distribution transformers are allocated based on the size of the low voltage grid; consequently, the optimal size of the LV network is calculated by an iterative method, which maximizes the number of manholes connected by a feasible and commercial underground cable that meets with a voltage drop constraint. Finally, transformer ratings are determined based on local electrical company standards, considering the number of customers connected to the low voltage grid.
The second part is focused on establishing the minimal path of the medium voltage grid that links the totality of distribution transformers with the point of connection of the main system. A MV network is routed based on the street topology and the manhole’s location; as a consequence, the minimal construction cost and reduction of a utility’s budget is achieved. The decision-making tool applied for planning and routing of underground distribution networks is performed in Matlab and is contrasted with simulations in PowerFactory 2018 to test the functionality of algorithms.
| Algorithm 1 Decision-making criteria for expansion on distribution networks |
| 1: procedure |
| 2: Step: 1 Variables |
| 3: |
| 4: Step: 2 Manhole Allocation |
| 5: |
| 6: |
| 7: |
| 8: |
| 9: Step: 3 Network Operator’s Cable Allocation |
| 10: |
| 11: |
| 12: for do |
| 13: for do |
| 14: |
| 15: |
| 16: |
| 17: |
| 18: |
| 19: |
| 20: |
| 21: Step: 4 Manhole Associated by distances |
| 22: |
| 23: |
| 24: for do |
| 25: |
| 26: |
| 27: |
| 28: |
| 29: |
| 30: Step: 5 Calculation of Voltage Drop |
| 31: |
| 32: |
| 33: for do |
| 34: for do |
| 35: |
| 36: if then |
| 37: |
| 38: |
| 39: for do |
| 40: |
| 41: if then |
| 42: |
| 43: else |
| 44: |
| 45: |
| 46: |
| 47: else |
| 48: |
| 49: |
| 50: |
| 51: |
| 52: Step: 6 Routing of MV network |
| 53: |
| 54: |
| 55: for do |
| 56: |
| 57: |
| 58: |
| 59: |
| 60: End procedure |
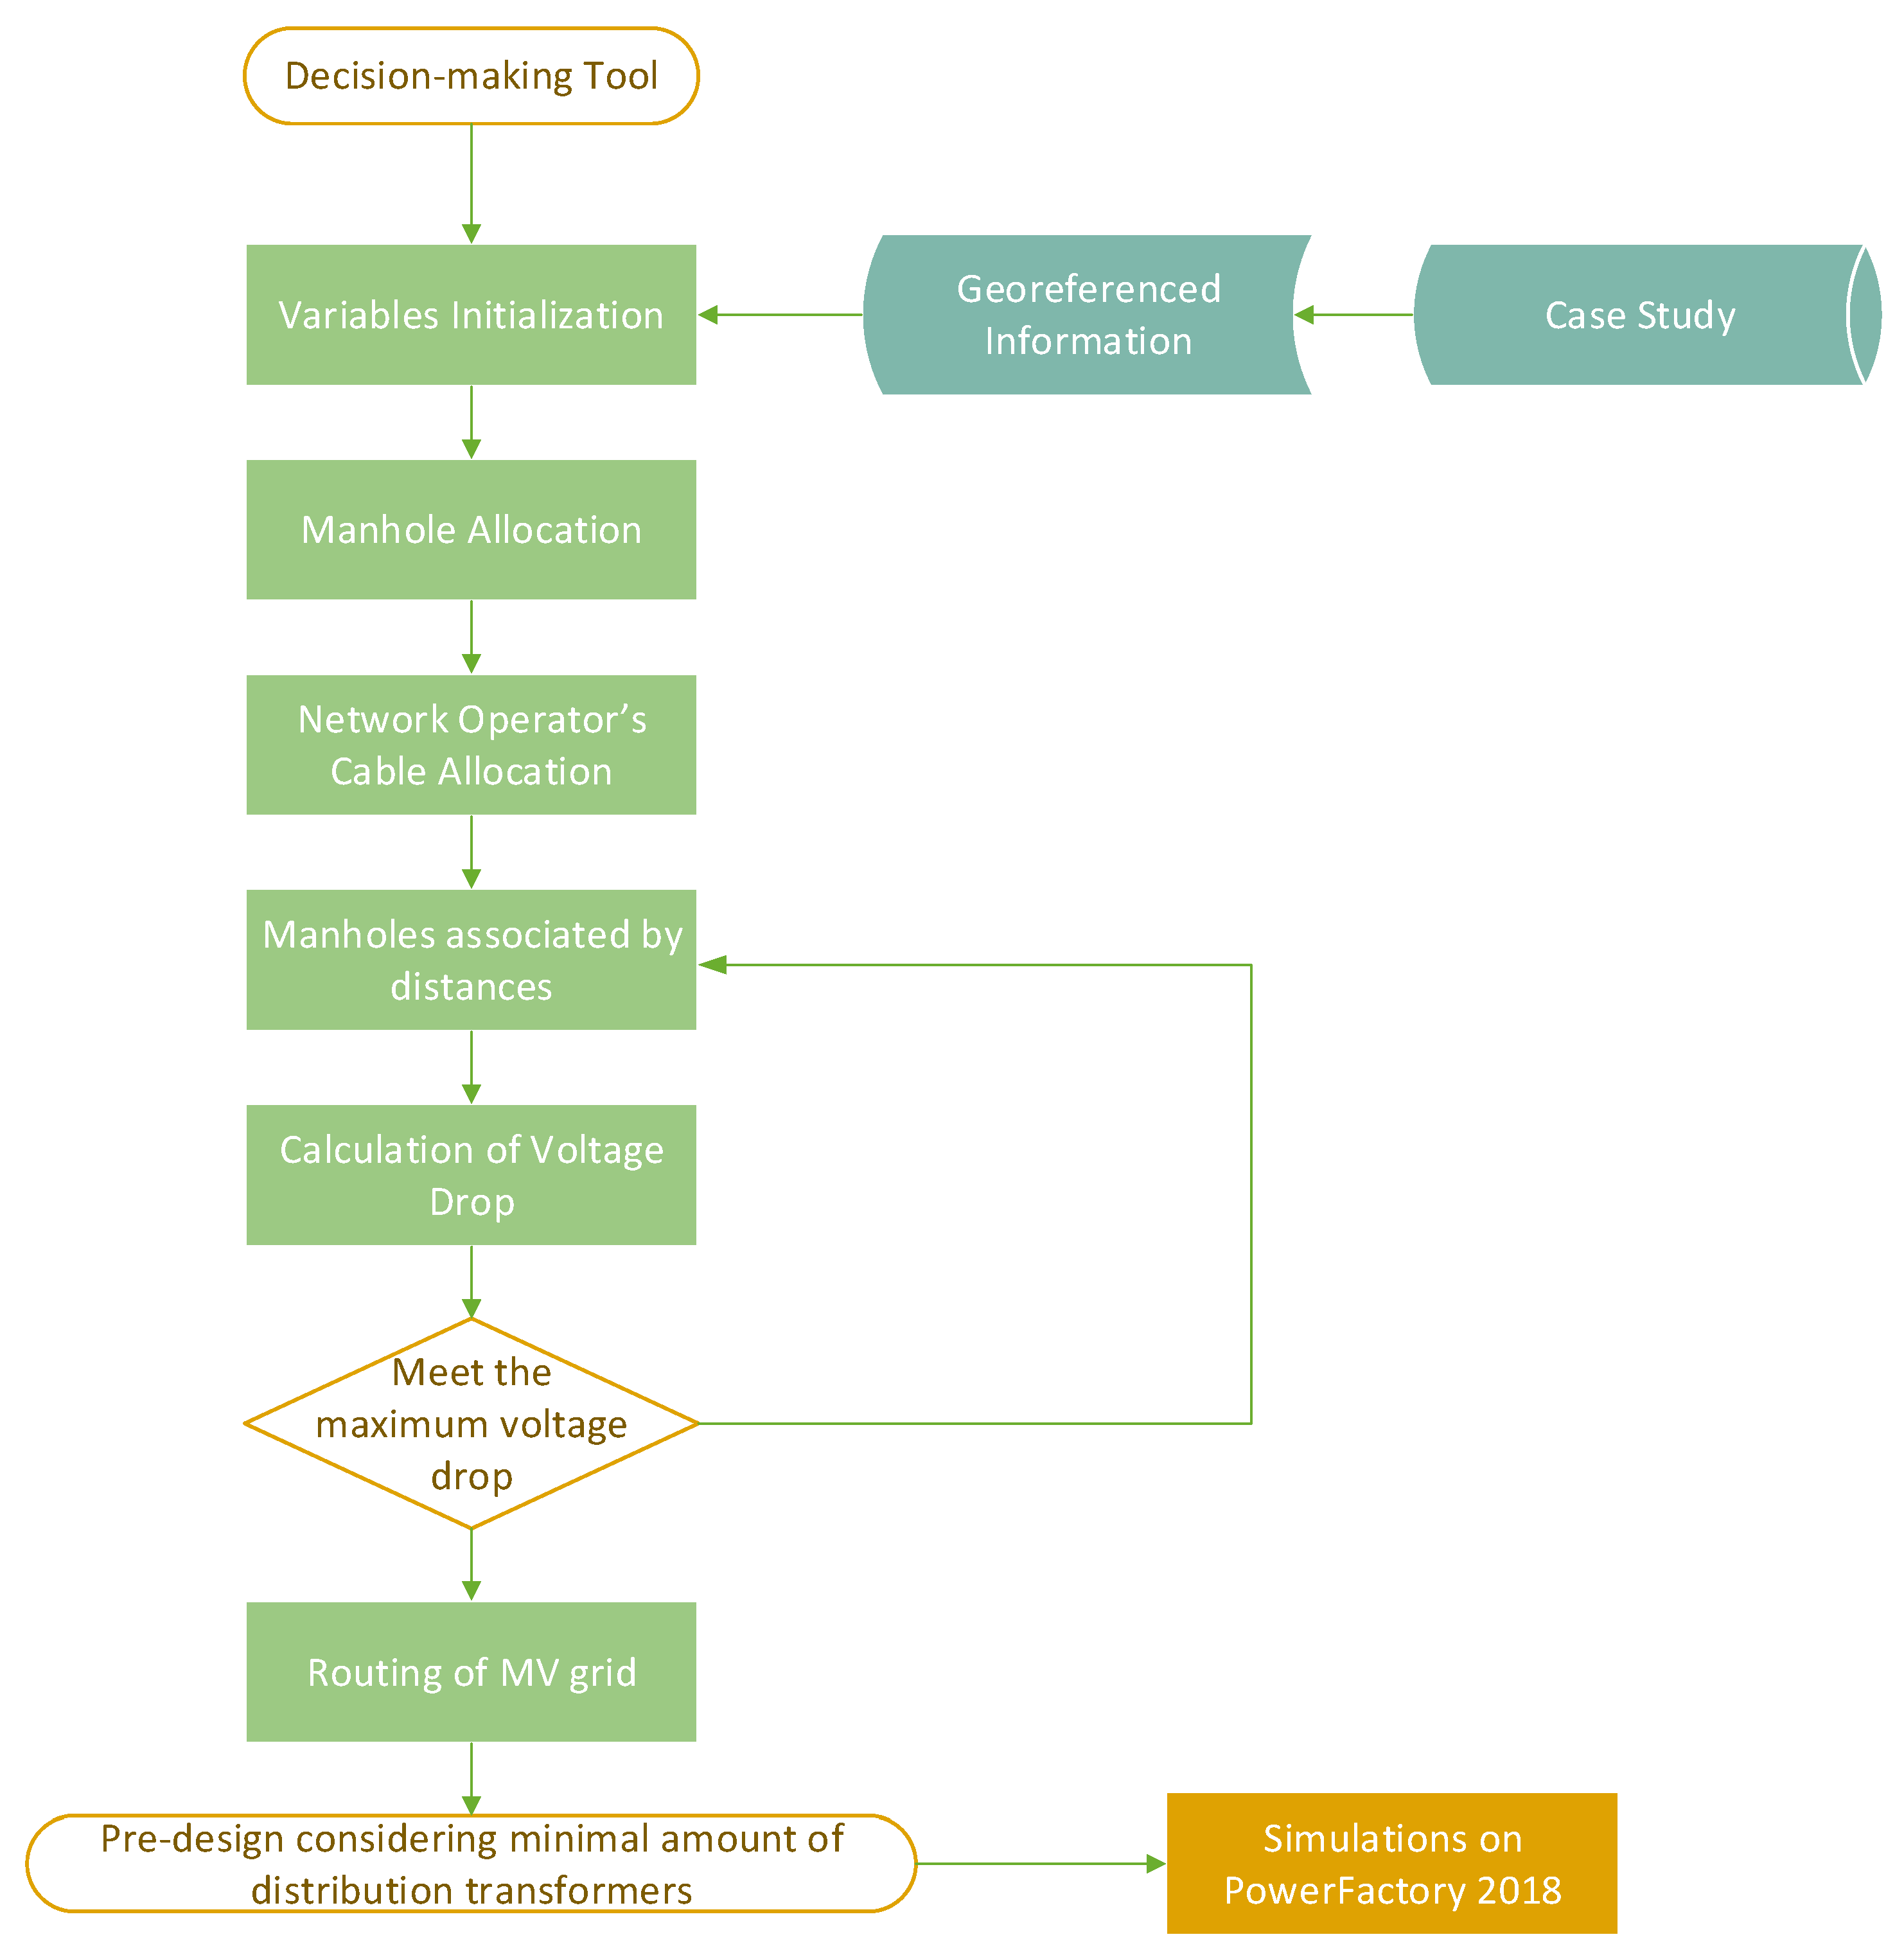
The aforementioned algorithm can be depicted on an explanatory flowchart in
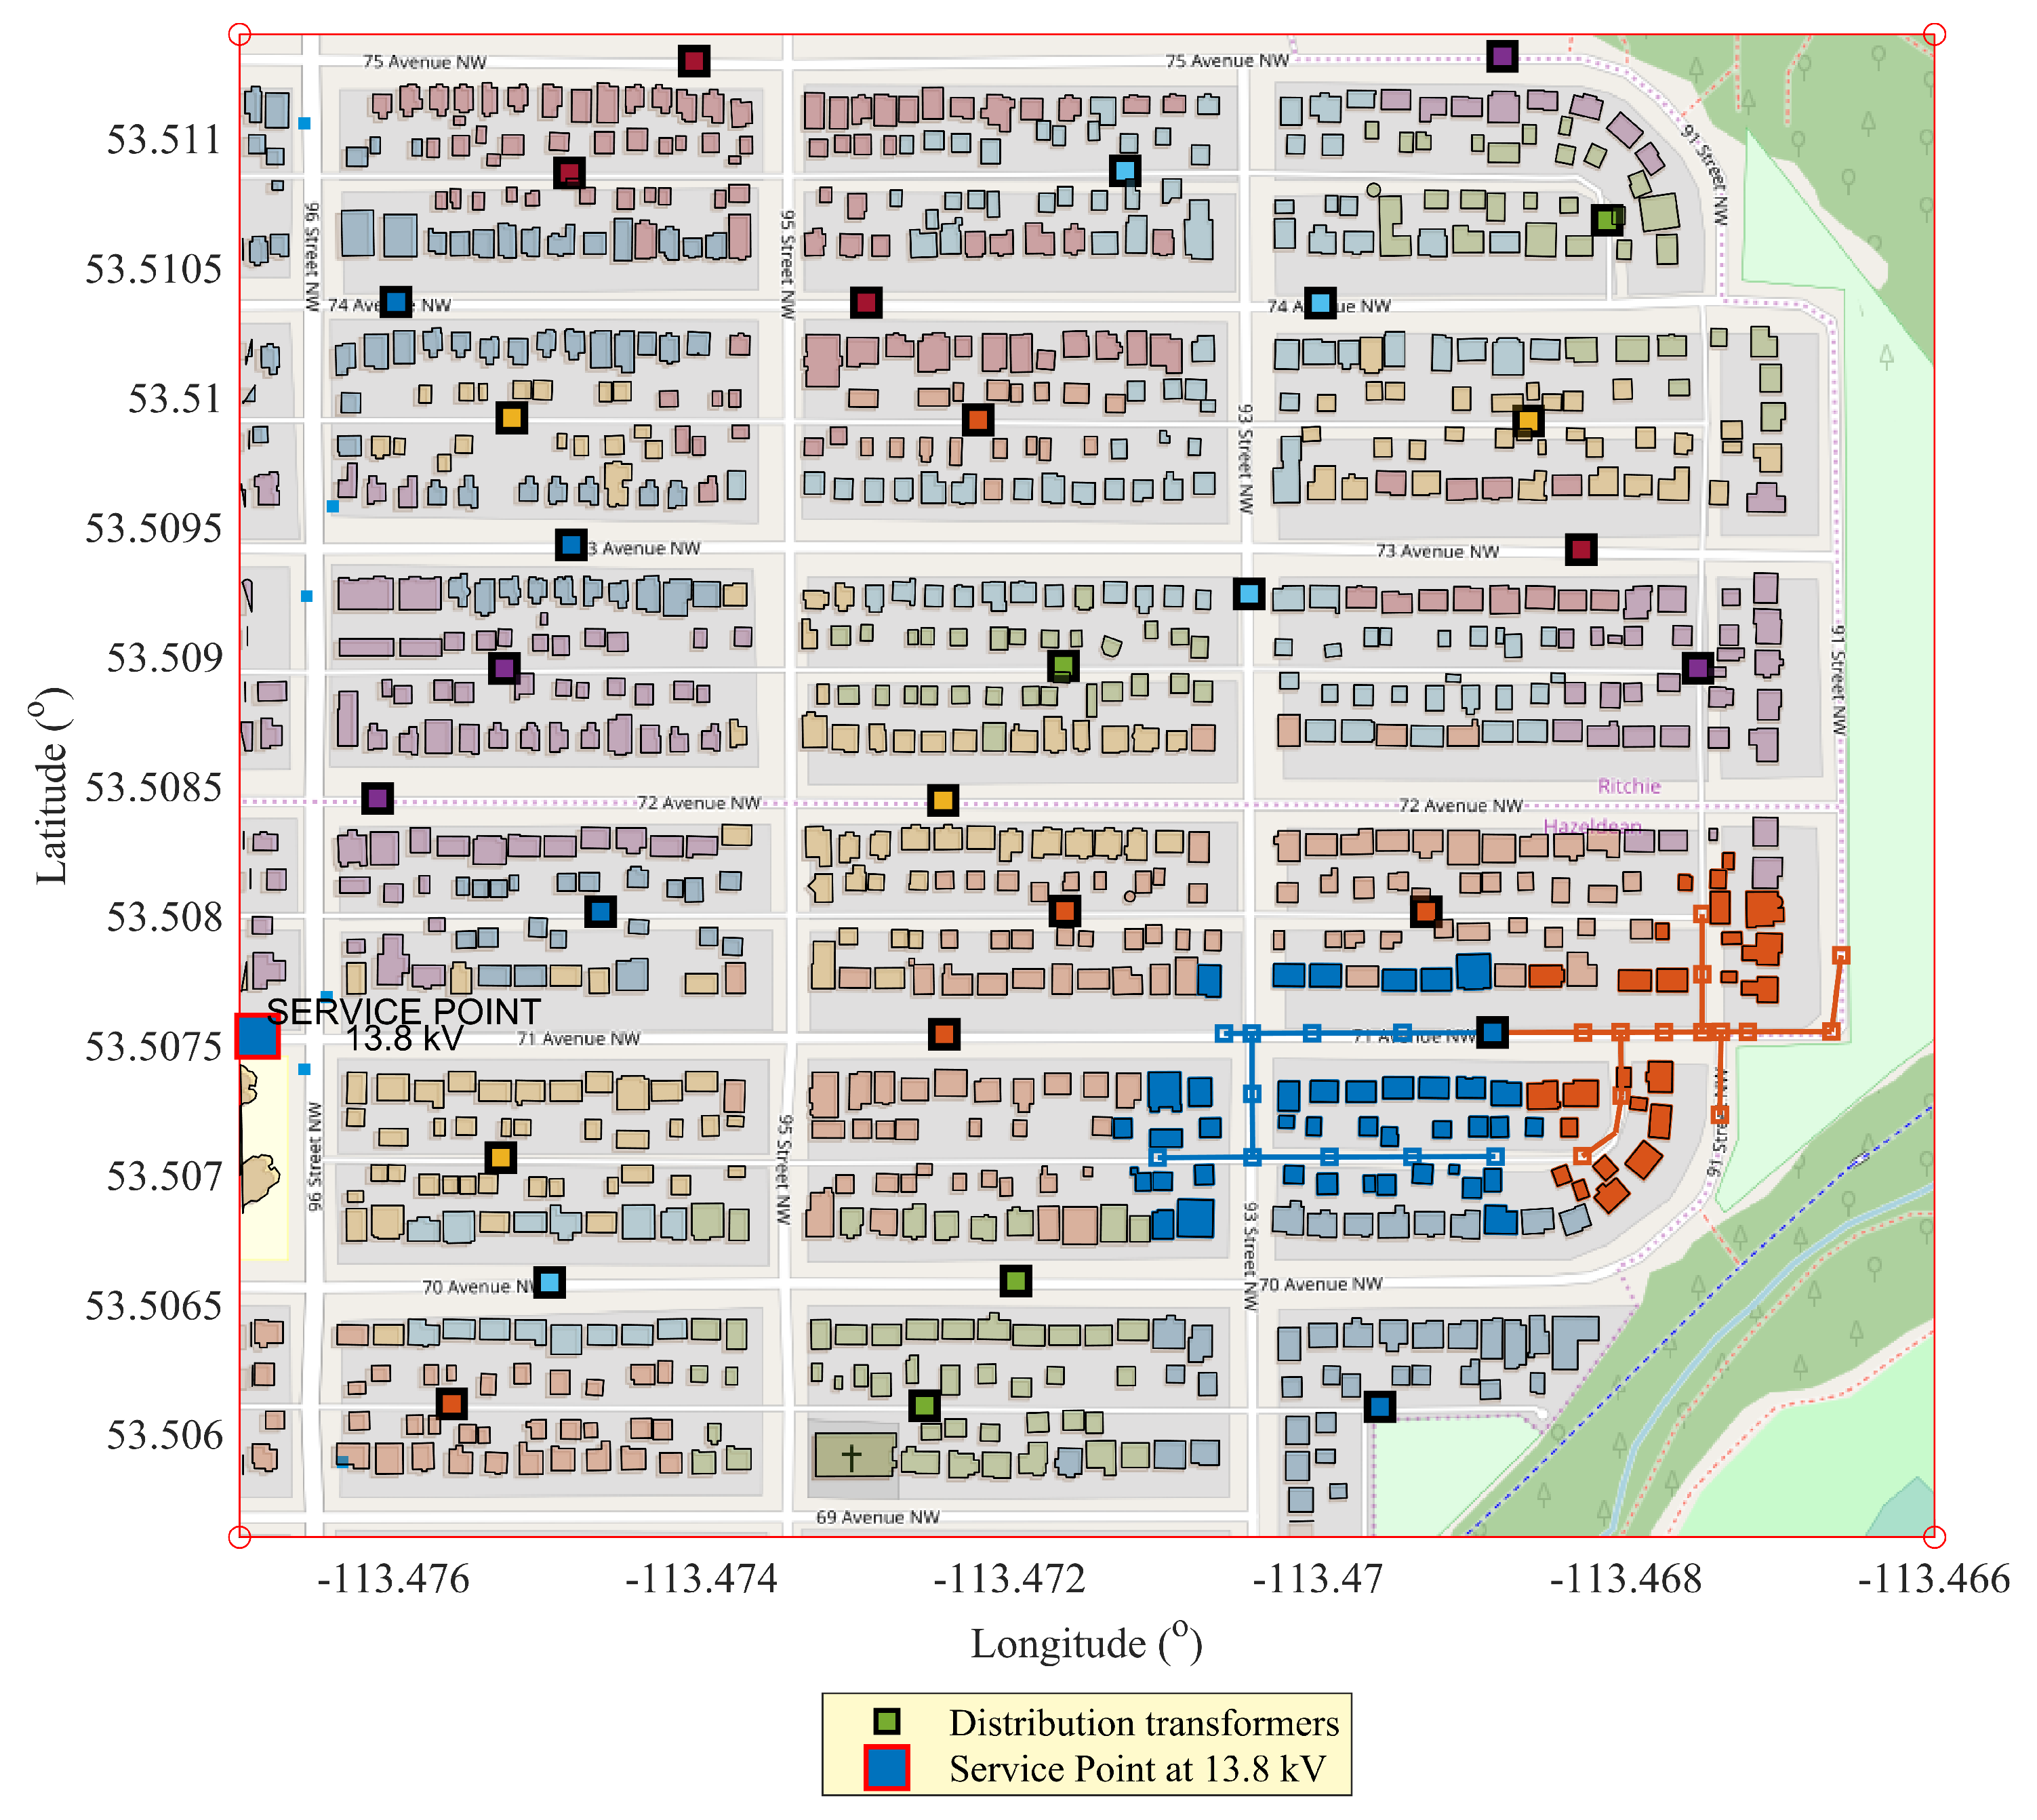
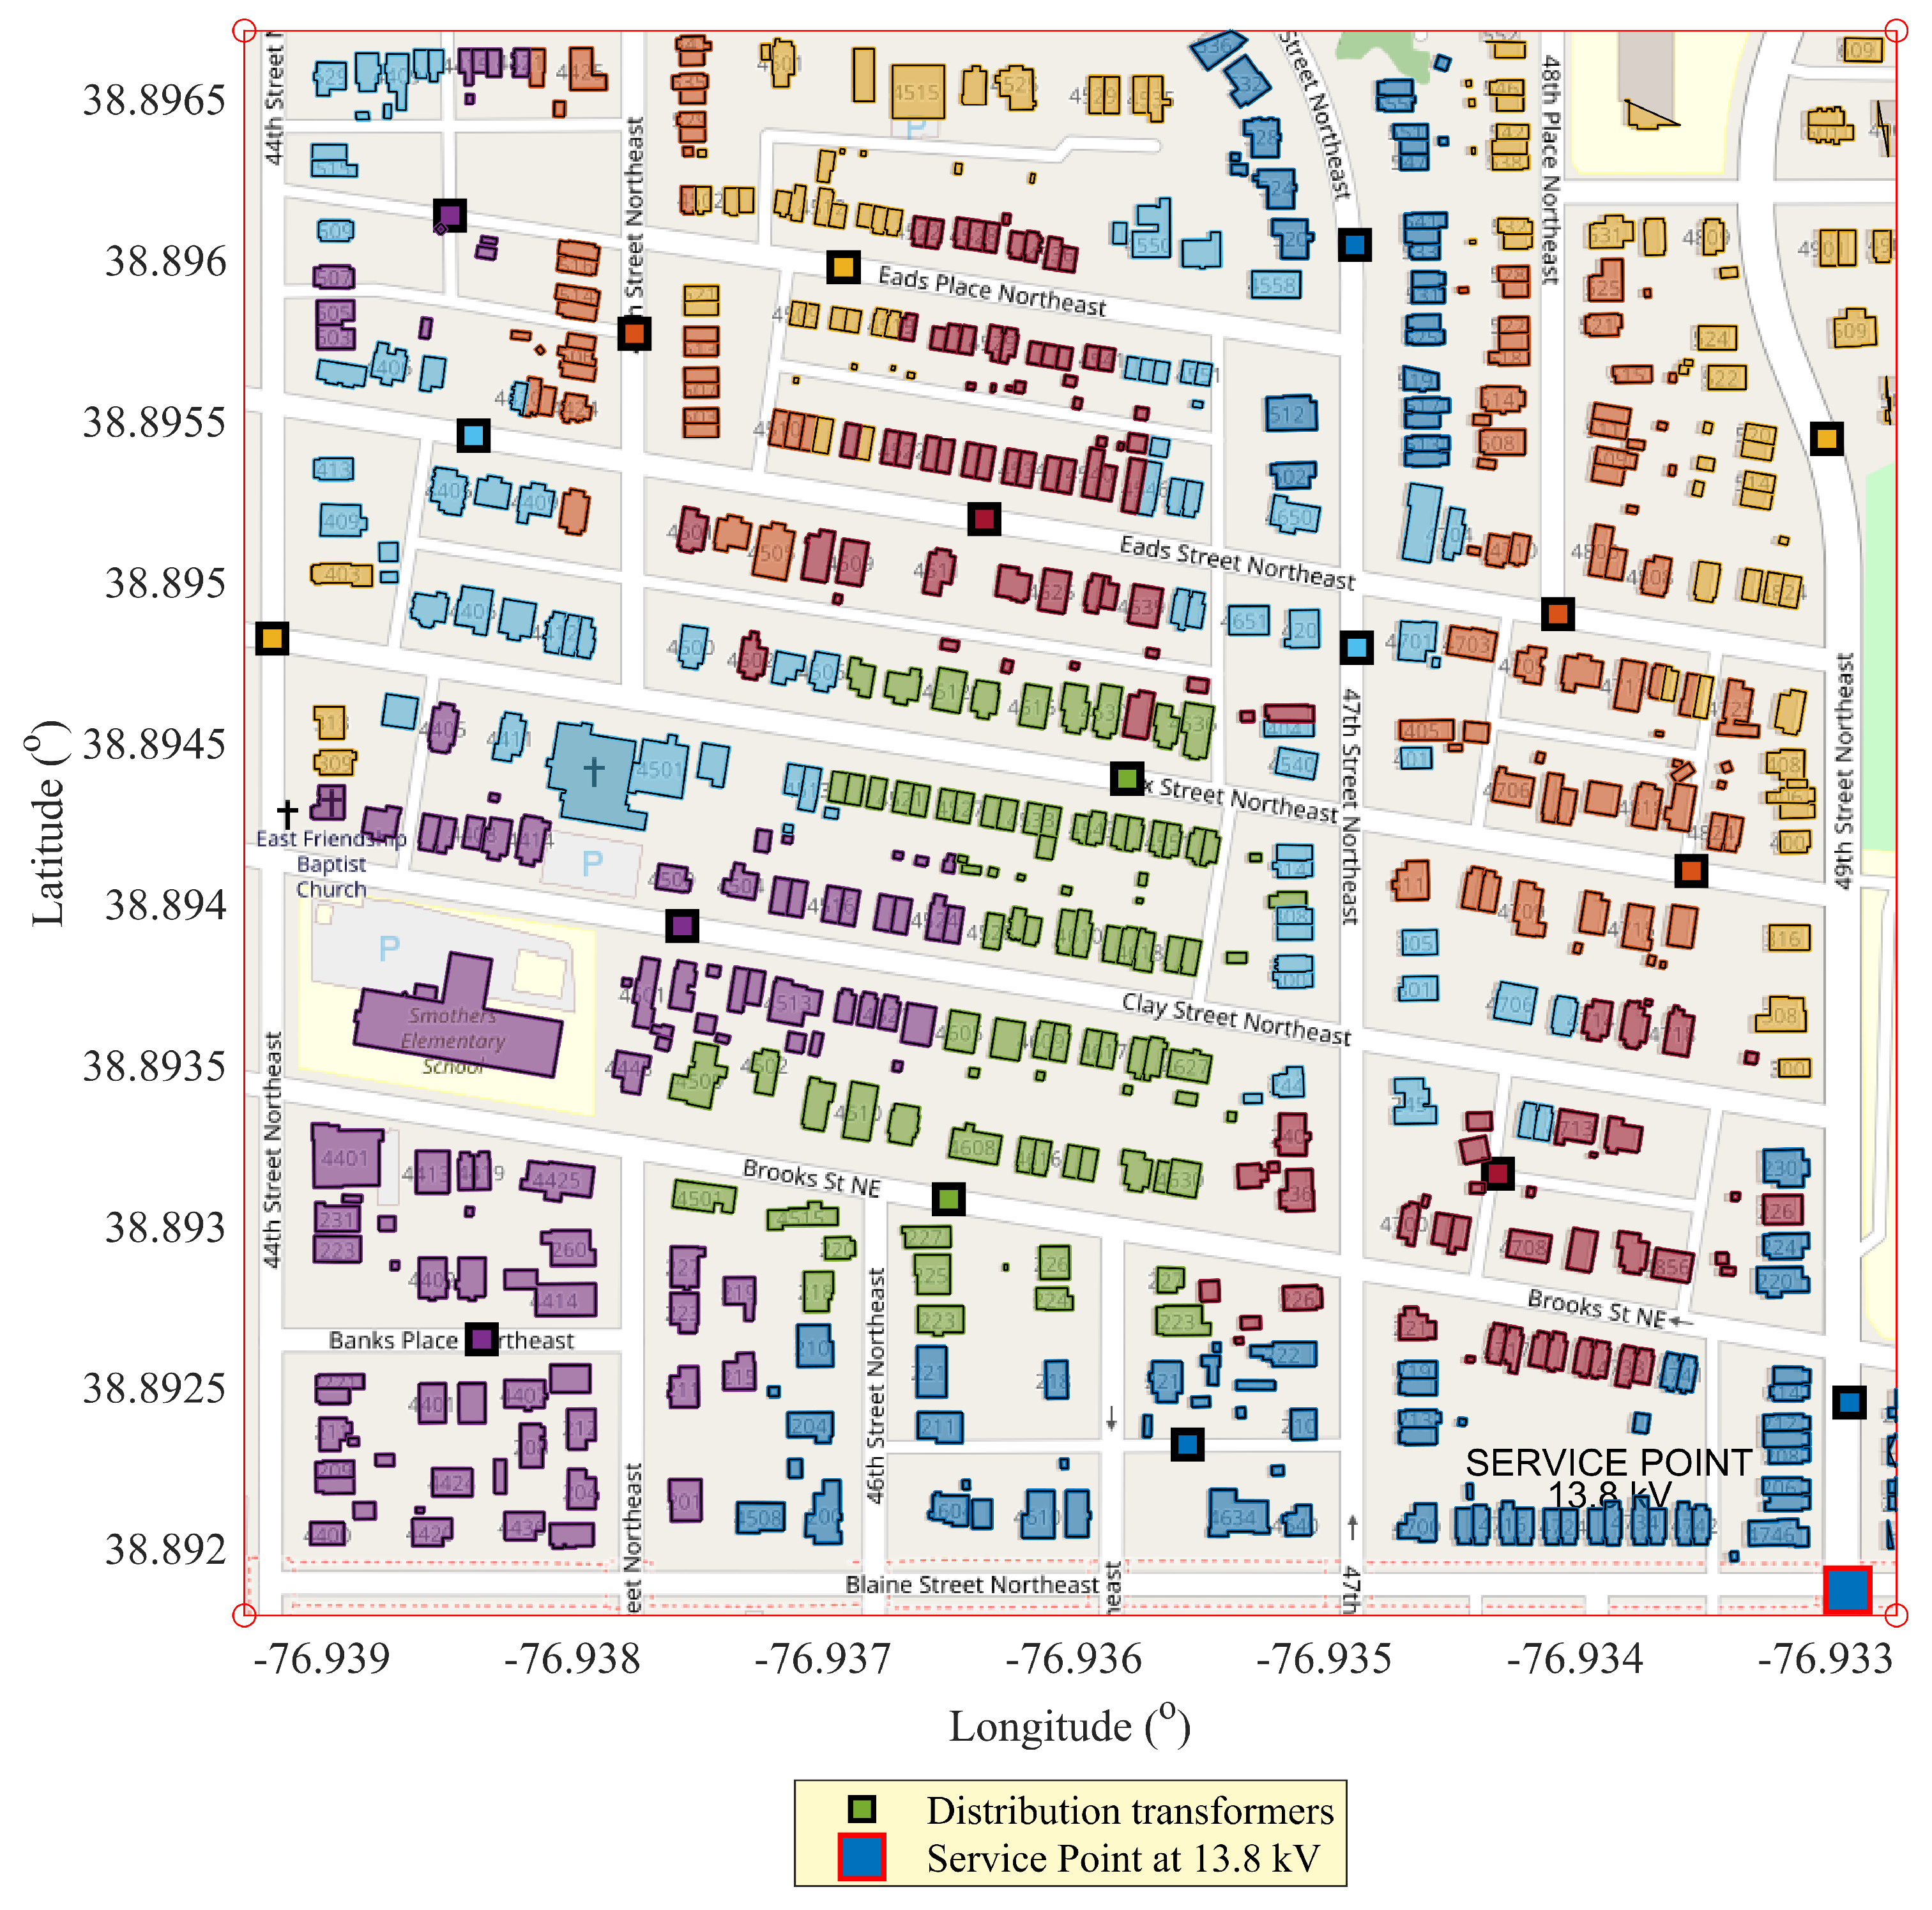
Figure 2, which shows the most decisive steps to determine a pre-design of distribution networks considering the connection of the minimal amount of distribution transformers which feed to the totality of end customers. Finally, simulations are executed in PowerFactory 2018 to evaluate and verify the proposed methodology in two different case studies based on the georeferenced information and electrical parameters.
6. Conclusions
This paper proposes a powerful and innovative methodology based on a Prim-modified algorithm to determine a feasible distribution network extension, adequately locating distribution transformers and medium voltage and low voltage power cables. Consequently, the proposed methodology can be seen as a decision-making tool to be used by utilities’ engineers during planning and design tasks due to the fact that the proposed model permits to obtain a pre-design based on geographical parameters (latitude and longitude) that meets with all technical requirements with a high time response. A suitable pre-design is obtained considering the minimal amount of distribution transformers, which feed to 100% of end users, by the maximization of manholes connected by a commercial low voltage cable that meets with a drop voltage constraint of 3%.
The medium voltage network, which faces the connection between all distribution transformers with the point of connection to the main grid, is addressed throughout MST methods. The distance between equipment is closely associated with construction cost; as a consequence, the decision-making criteria are focused on defining the minimal path between transformers along sidewalks; consequently, it is possible to reduce excavation, installation and material costs, improving financial management.
The proposed methodology was performed based on local utility guidelines for the planning of distribution networks. However, the decision-making criteria could be adapted to different utility guidelines and also could be applied to different scenarios around the world based on georeferenced information. The unique requirement is associated with available georeferenced parameters, which permit the execution of the aforementioned algorithm; subsequently, any outdated, erroneous or incomplete gathered geographical information could lead erroneous grid extension.
Two case studies were proposed to determine the applicability and versatility of decision-making for distribution network extensions, where satisfactory results have been achieved because electrical parameters do not pass above statutory limits associated with loading or voltage drops along the medium and low voltage grid. Additionally, simulations on PowerFactory 2018 were carried out as a complementary analysis to evaluate the proposed model.


