Article

Influence of T-Shape Tip Clearance on Energy Performance and Broadband Noise for a NACA0009 Hydrofoil

1
State Key Laboratory of Hydroscience and Engineering, Tsinghua University, Beijing 100084, China
2
College of Marine Power Engineering, Naval University of Engineering, Wuhan 430033, China
*
Authors to whom correspondence should be addressed.
Energies 2019, 12(21), 4066; https://doi.org/10.3390/en12214066
Submission received: 28 September 2019 / Revised: 22 October 2019 / Accepted: 24 October 2019 / Published: 25 October 2019

Abstract

:
In the present paper, the effect of the proposed T-shape tip on the energy performance, flow patterns and broadband noise sources of a NACA0009 hydrofoil with tip clearance is investigated. The vortex induced by the gap is simulated by means of the SST k-ω turbulence model, and then, the noise generated by dipoles and quadrupoles are analyzed by using the Curle acoustic analogy and Proudman acoustic analogy, respectively. The numerical simulation results agree well with the experimental measurements. Results indicate that three tip shapes, including the half pressure side T-shape model (MPT), the half suction side T-shape model (MST) and the T-shape model (MT), have complex influence on energy performance of the foil. Only the MST model can promote the energy performance of the hydrofoil at all inlet velocities, with the maximum ratio of lift coefficient to drag coefficient increasing by 4.26%. In addition, the ratio of lift coefficient to drag coefficient for MT obviously increases when the inlet velocity is 7.5 m/s, 10 m/s, 12.5 m/s and 15 m/s, and the maximum promotion is 15.21% at 7.5 m/s. The T-shape tip can effectively suppress the tip clearance leakage vortex, which makes the vortex area decrease with a maximum drop of 5.02%. Furthermore, the MPT and MT have good suppression effect on the hydrofoil dipole noise, and reduce the maximum Curle Acoustic Power (AP) of the foil with 2.64% and 3.03%, respectively. The MST model obviously reduces the isosurface area of the Proudman AP by 6.55% for 55 dB.

1. Introduction

Hydraulic machineries are widely used in modern submarines and warships, such as pumps, duct propulsors and waterjet propulsors, which have attracted the attention of researchers on a worldwide scale [1,2,3,4,5]. However, due to the limitation of the impeller structure, there is inevitably a gap between the rotating blades and the fixed impeller chamber [6,7]. The tip leakage flow (TLF) and tip leakage vortex (TLV) is induced by the existence of the gap, which results in pressure drop and energy loss, and then leads to cavitation, erosion, vibration and noise [8,9,10,11,12]. The radiated noise from these hydraulic machineries will harm the worker health and can be easily detected by the enemy sonar systems. Therefore, the internal mechanism among TLF, energy loss and radiated noise is waiting to be explored.
In the past decades, considerable experimental investigations have been conducted on the tip leakage flow, cavitation and noise mechanism. Wu et al. [13,14] experimentally investigated the cavitation within the gap of a waterjet pump. The results indicated that the TLF along the aft side of the blade was strong enough to cause sheet cavitation in the gap starting from the pressure side corner. Moreover, Zhang et al. [15,16] carried out an experimental investigation in an axial flow pump; the results on TLV cloud cavitation revealed that it keeps a stable triangular flow structure from the leading edge to 80% of the length of the chord, while the cavitation shape becomes unstable near the trailing edge. For the fundamental research, Dreyer et al. [17] experimentally studied the influence of the tip size on the TLV formation and cavitation of a NACA0009 hydrofoil. This work is a classic example that is often used to verify the validation of the Computational Fluid Dynamics (CFD) computation of the tip clearance. Recently, Gopalan et al. [18] conducted experimental work upon the impact of gap width on internal flow mechanism, cavitation formation, corresponding bubble dynamics and induced noise. The results showed that the bubbles will grow up in the vortex core, and deform and break into multiple bubbles, which resulted in a noise peak value. By changing the shape and size of bubbles, its cavitation radiation noise can be effectively suppressed.
In addition to experimental measurements, the numerical method is of great significance for the study of TLF and its induced cavitation. Liu et al. [19] analyzed the vortex features and pressure fluctuation within a mixed flow pump; results showed that the TLV can be divided into the primary TLV, secondary TLV, entangled TLV and dispersed TLV. Hao et al. [20] compared the impact of unsymmetrical and symmetrical gaps on the changes of radial force and cavitation within the mixed flow pump. Results indicated that the unsymmetrical tip clearance is inapplicable for reducing cavitation performance, and its existence influenced the magnitude and direction of the radial force as cavitation developed. Liu et al. [21] investigated the TLV evolution with time in a mixed flow pump, and the TLV split, developed and merged under different stages. Results showed that the varied pressure at blade junction aggravated TLV fluctuation. Guo et al. [22] studied the impact of foil tip shape and size on the flow characteristics and energy performance for a NACA0009 hydrofoil. Results showed that the sharp tip mitigated the TLV loss, and the separation of the boundary layer increased the velocity gradient. Okita et al. [23] focused on the cavitation evolution induced by the tip clearance of an inducer; the flow detail was captured by adopting a detached eddy simulation model. Zhang et al. [24] concentrated on energy performance and flow features within multiphase pump; results showed that the pressure maximum and the area of vortex were enhanced as the gap size increased. Decaix et al. [25,26] simulated the TLV between blade tip and the wall of water tunnel; results revealed that the vortex trajectory approached the suction side, which would aggravated the wall erosion.
The above references show that despite the fact that tip clearance is small, the interaction between TLV and main flow in the blade passage, the boundary layer near the wall and the wake near blade will form a complex vortex structure. Additionally, it will cause cavitation, vibration and noise, which seriously affect the operation stability of hydraulic machineries. Consequently, it is necessary to put forward some effective control measures.
To suppress the TLF and cavitation, many scholars have studied the influence of tip shape and size on TLV or cavitation. Gearhart et al. [27] experimentally studied the effects of the gap width, boundary layer near the wall and blade load on TLF. Moreover, Laborde et al. [28] revealed that the tip geometry was of great significance on the cavitation and flow patterns. As the clearance edge becomes round on the pressure side, the optimal tip scheme can eliminate cavitation. Recently, Liu et al. [29] presented interesting work: the C groove method can reduce the TLV formation and enhance energy performance within a NACA0009 hydrofoil. Under all conditions, the C groove method exhibited the ability of promoting energy performance and suppressing TLV. As for the 0.2 and 0.4 tip clearance, the maximum of vortex area was decreased by 66.55% and 67.94%, respectively. In summary, several effective methods suppressing TLV and improving the energy performance have been proposed. However, there is not yet a reliable and effective method on suppressing broadband noise.
The objective of the present work is to examine the influence of the proposed T-shape tip on the energy performance, flow patterns and broadband noise sources in a NACA0009 hydrofoil. The main content of the present paper is as follows. Firstly, the research background is introduced and a new designed T-shape tip is proposed. Then the comparison between computational results and experimental data is conducted in order to establish the foundation of the subsequent simulation work. Finally, the energy performance, the detailed flow features in T-shape tip and the broadband noise characteristics are systemically analyzed.

2. Research Object and T-Shape Tip

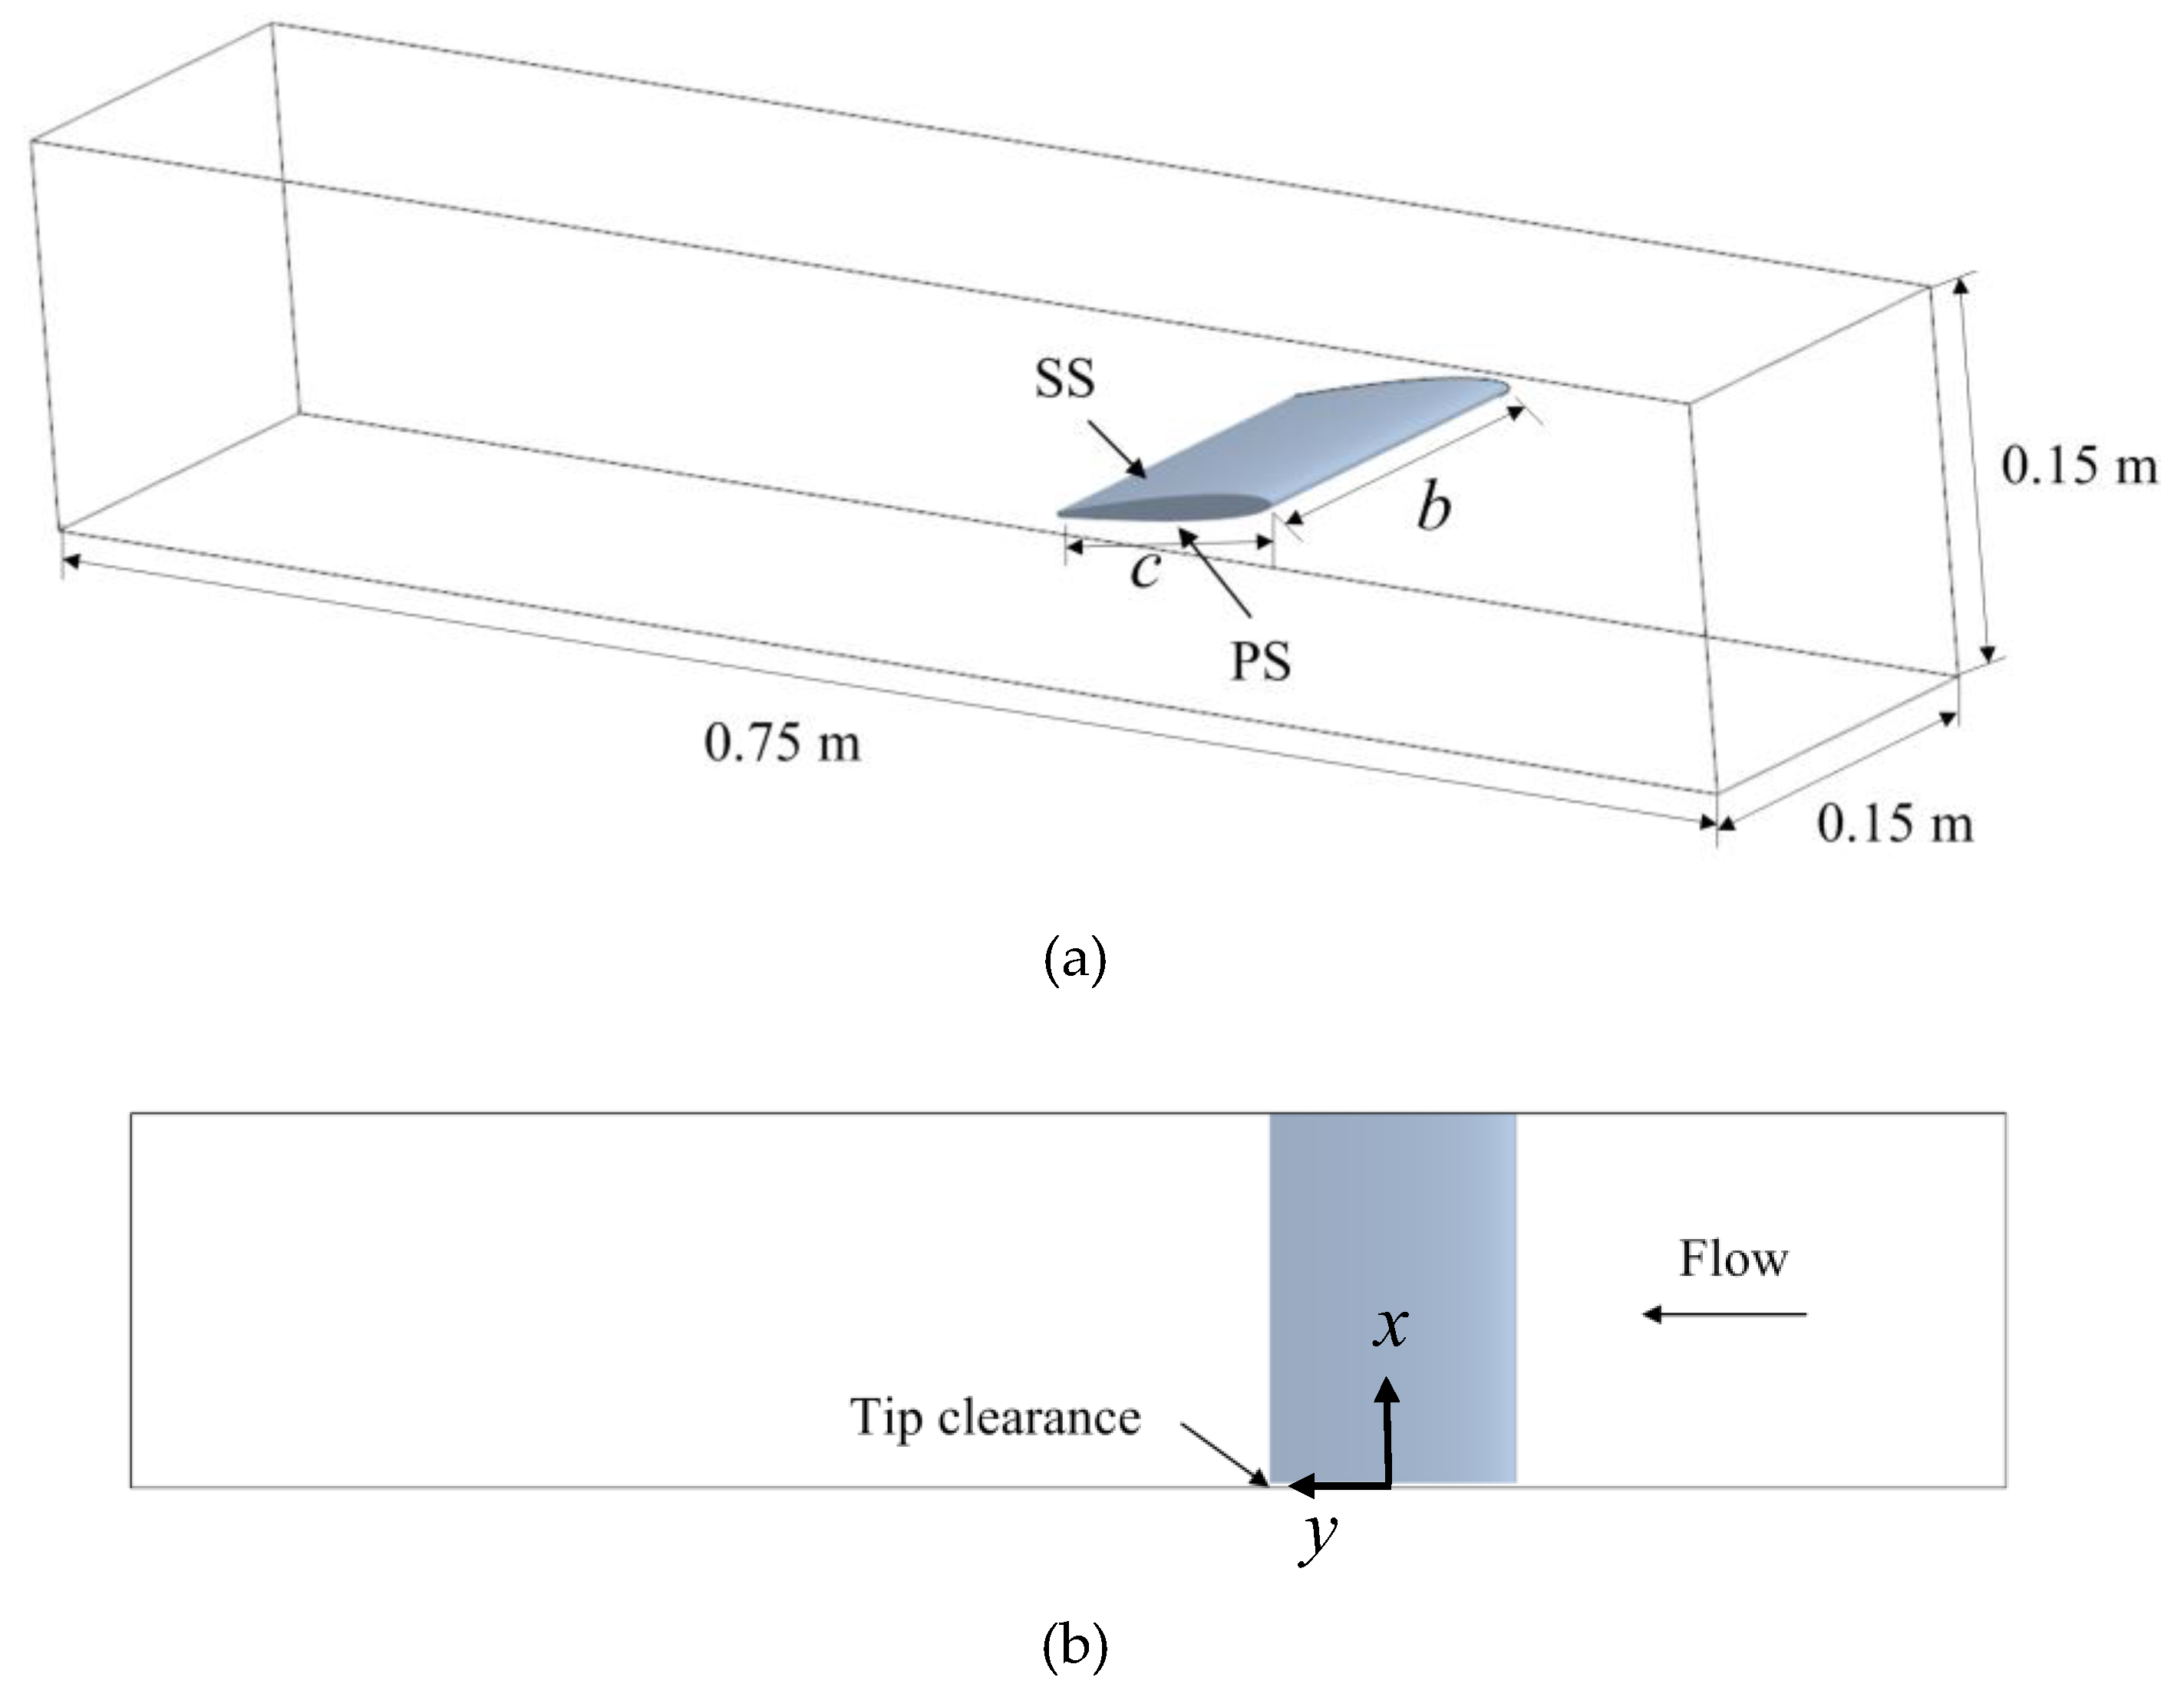
2.1. Physical Model of NACA0009 Hydrofoil
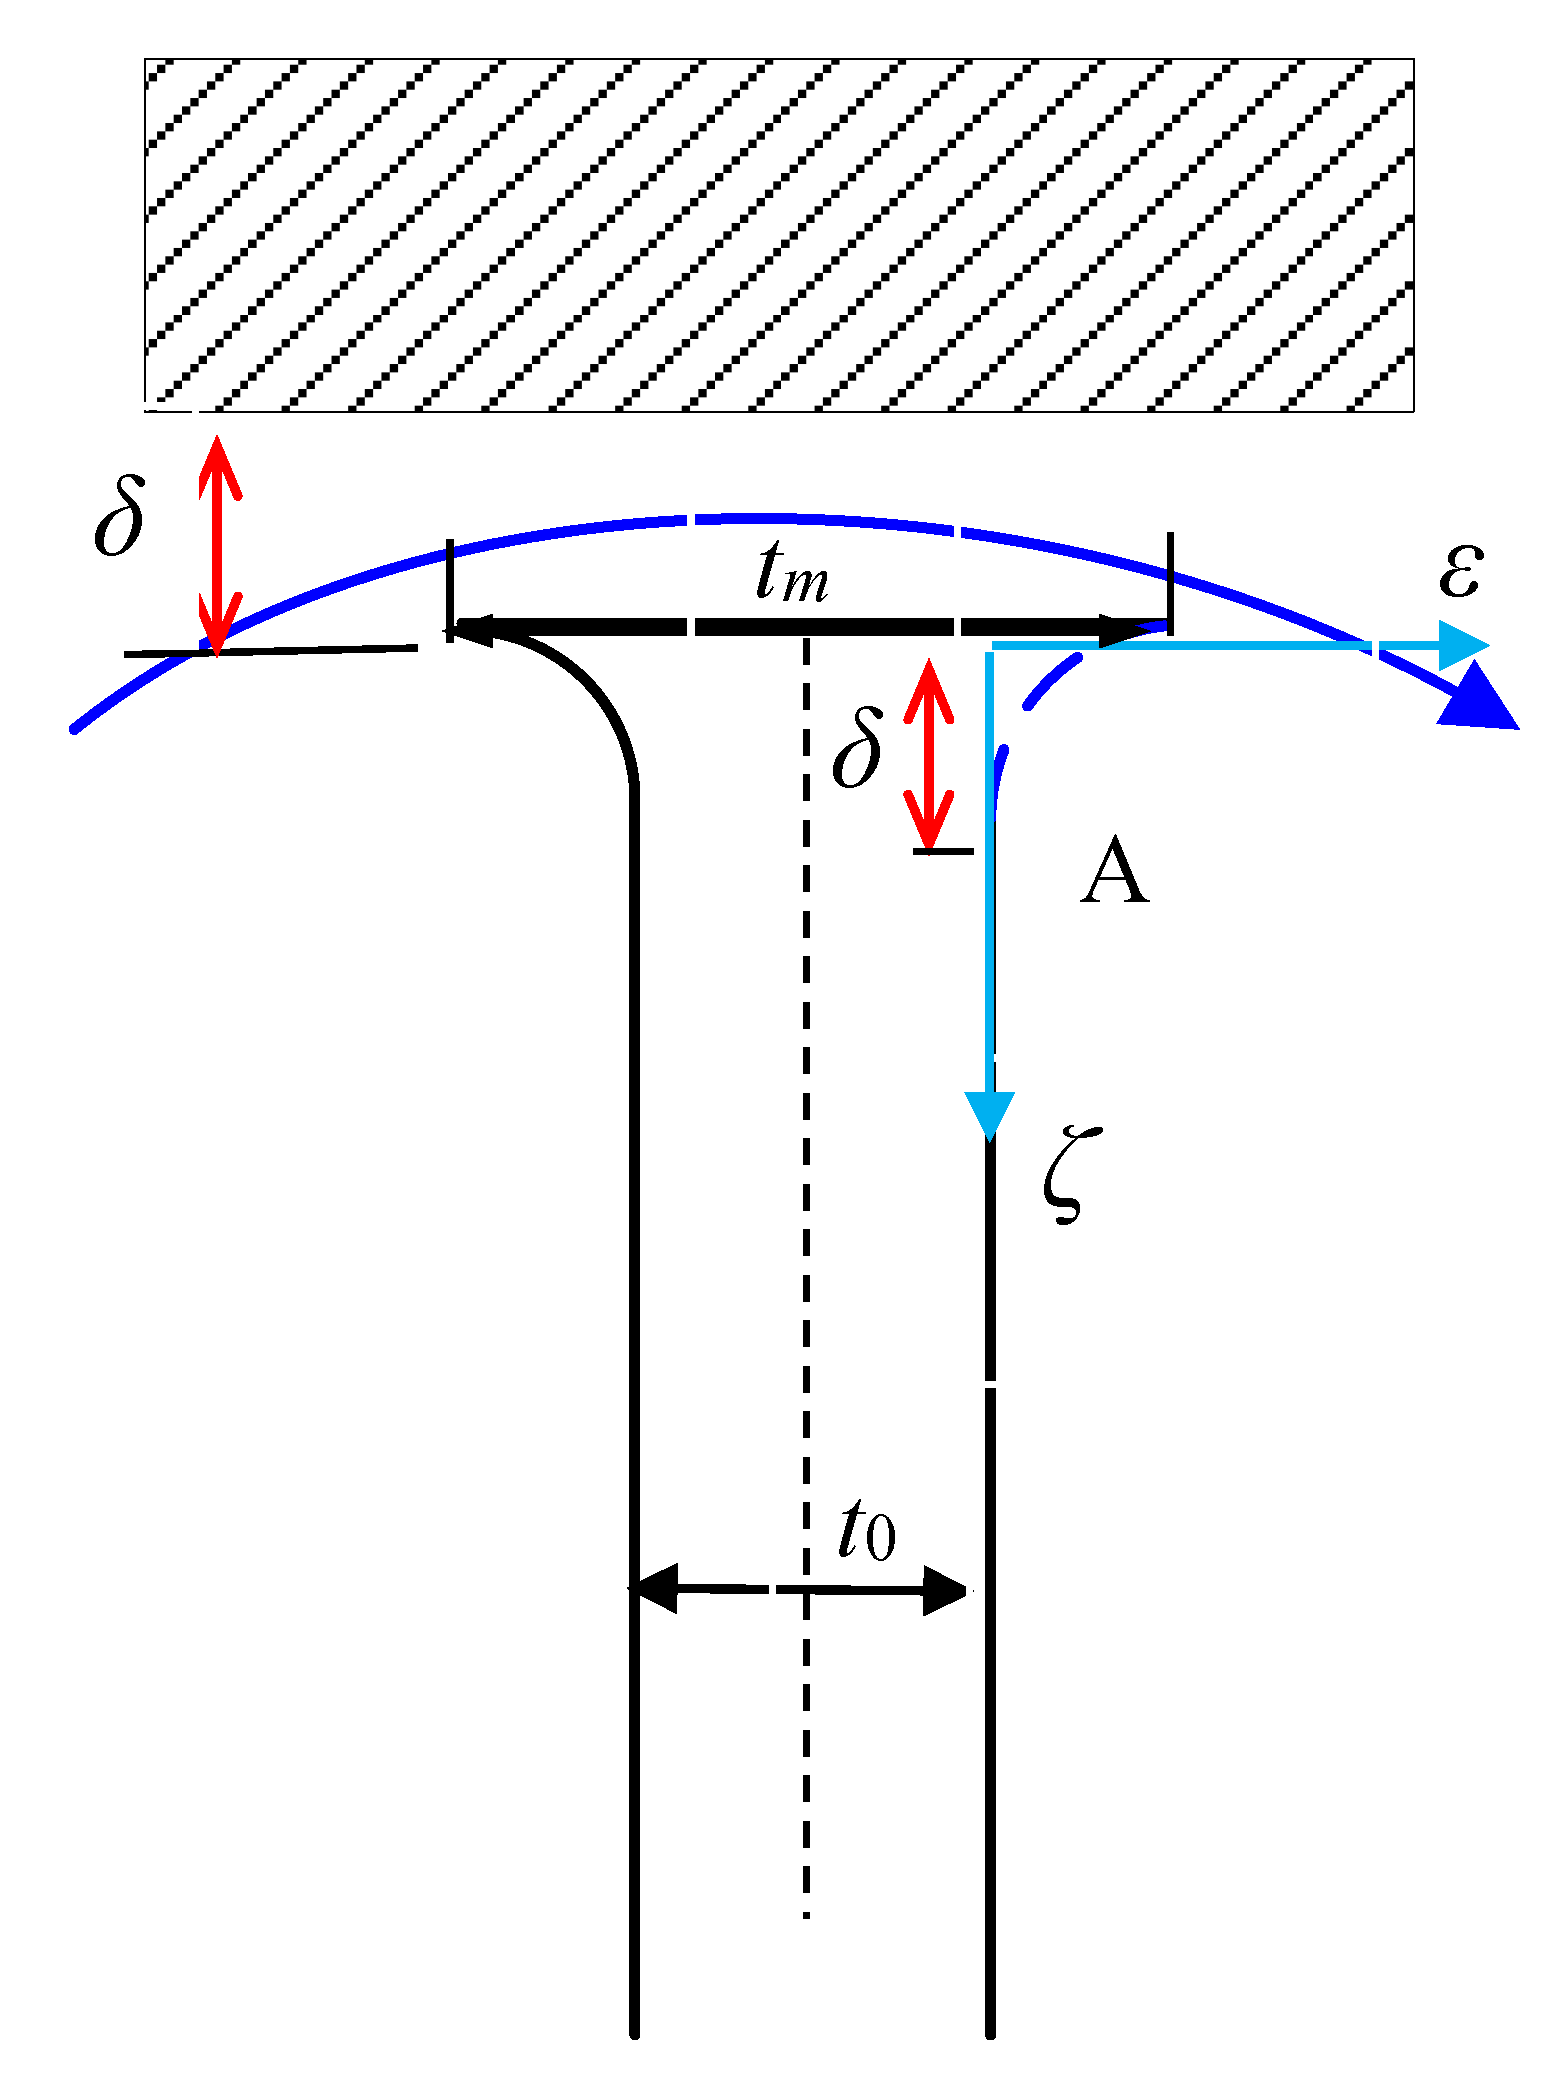
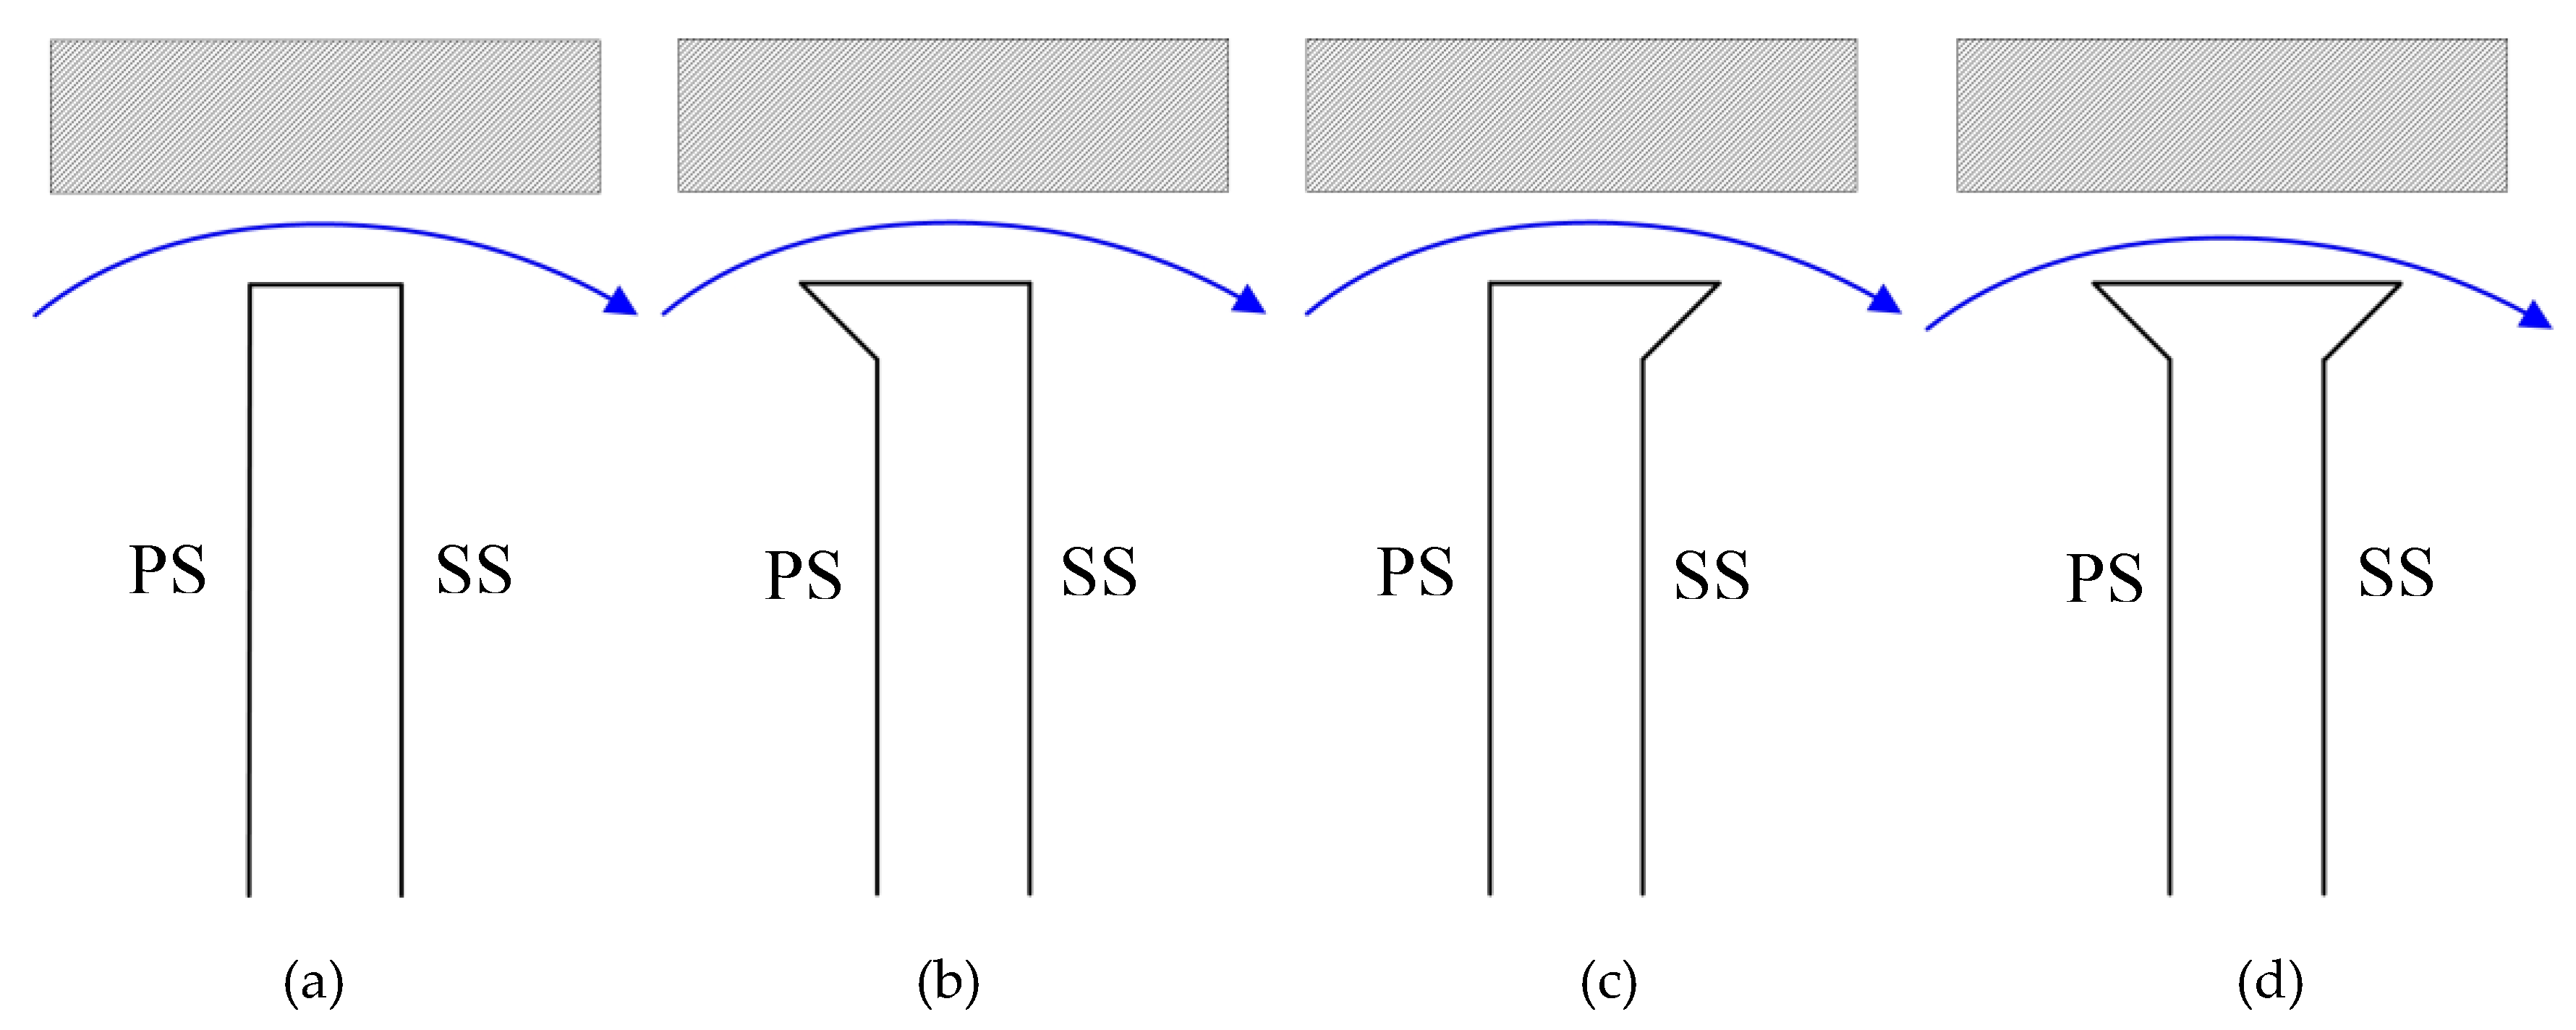
A NACA0009 hydrofoil [17] with tip clearance (Figure 1) is assumed to have a truncated chord of c = 0.1 m, maximum thickness of h = 0.0099 m and span of b = 0.15 m. The gap size δ, normalized by the maximum thickness h, is 0.2, and the incidence angle is 10°. The fluid density is 997 kg/m3 and the inlet pressure is 1 bar.

2.2. T-Shape Tips

As shown in Figure 2, the new proposed T-shaped tip is formed by gradually increasing the thickness from point A to the tip, and the foil profile is symmetrical. The distance between A and the foil end is the tip clearance δ. At point A, the foil thickness equals the original blade thickness t0, and the maximum thickness of the foil end is tm increasing by 0.3t0. Figure 3 illustrates the original tip and three types of T-shape tips, including half pressure side T-shape (MPT), half suction side T-shape (MST) and T-shape (MT). The control curves of the MPT, MST and MT are straight lines.

3. Numerical Setting and Validation

3.1. Numerical Method

In the present paper, a steady-state Reynolds averaged Navier-Stokes (RANS) equation and the SST k-ω turbulence model [22,29,30] with all y+ wall treatment were used to calculate the flow field within the gap; then, the acoustics models available in STAR_CCM+ 13.02, including the Curle and Proudman broadband noise models, were adopted to investigate the broadband noise sources. The Segregated flow model was used to compute each of the momentum equations in turn. Moreover, the second-order upwind convection scheme was adopted for the advection scheme. For the boundary conditions, a normal velocity with low turbulence intensity imposed at the inlet and a static pressure was applied at the outlet. The no-slip wall conditions were set at the hydrofoil surface and the tunnel wall.
It should be noted that the SST k-ω turbulence model has its own limitations, errors and uncertainties [31]. However, the SST k-ω turbulence model is widely used to investigate the detail flow field in tip clearance for a NACA0009 hydrofoil [22,29]. Consequently, the SST k-ω turbulence model with all y+ wall treatment is employed to evaluate the effect of T-shape tips on energy performance and flow patterns in the gap.

3.2. Mesh Indepedence

ICEM 17.0 was adopted to obtain the structured hexahedral element for the whole computational region. As indicated in Figure 4, both the O-type topology and local mesh refinement were used.
Three sets of meshes were employed to examine the effect of element size in numerical calculation. The drag coefficient CD and lift coefficient CL were adopted to check the impact of mesh size and they are expressed as:
C D = D 0.5 ρ W 2 S D ,   C L = L 0.5 ρ W 2 S L
where D and L denote the drag and lift forces parallel and normal to the inflow, which are the forces in Y and Z axial directions in present simulation. SD and SL represent the projected area of the foil in Y and Z axial directions, respectively.
Table 1 is the mesh independence results (inlet velocity is 10 m/s). It can be seen that the drag coefficient CD and lift coefficient CL keep the same when the number of elements becomes 5500833. Therefore, the configuration of mesh 2 is employed in the following investigation. The grids on the foil surface are arranged with 150 nodes along chord direction, 80 nodes along span direction and 20 nodes along thickness direction. Furthermore, there are 20 nodes along the span direction in the gap to capture flow details. The average value of y+ on the foil surface is about 10–40.

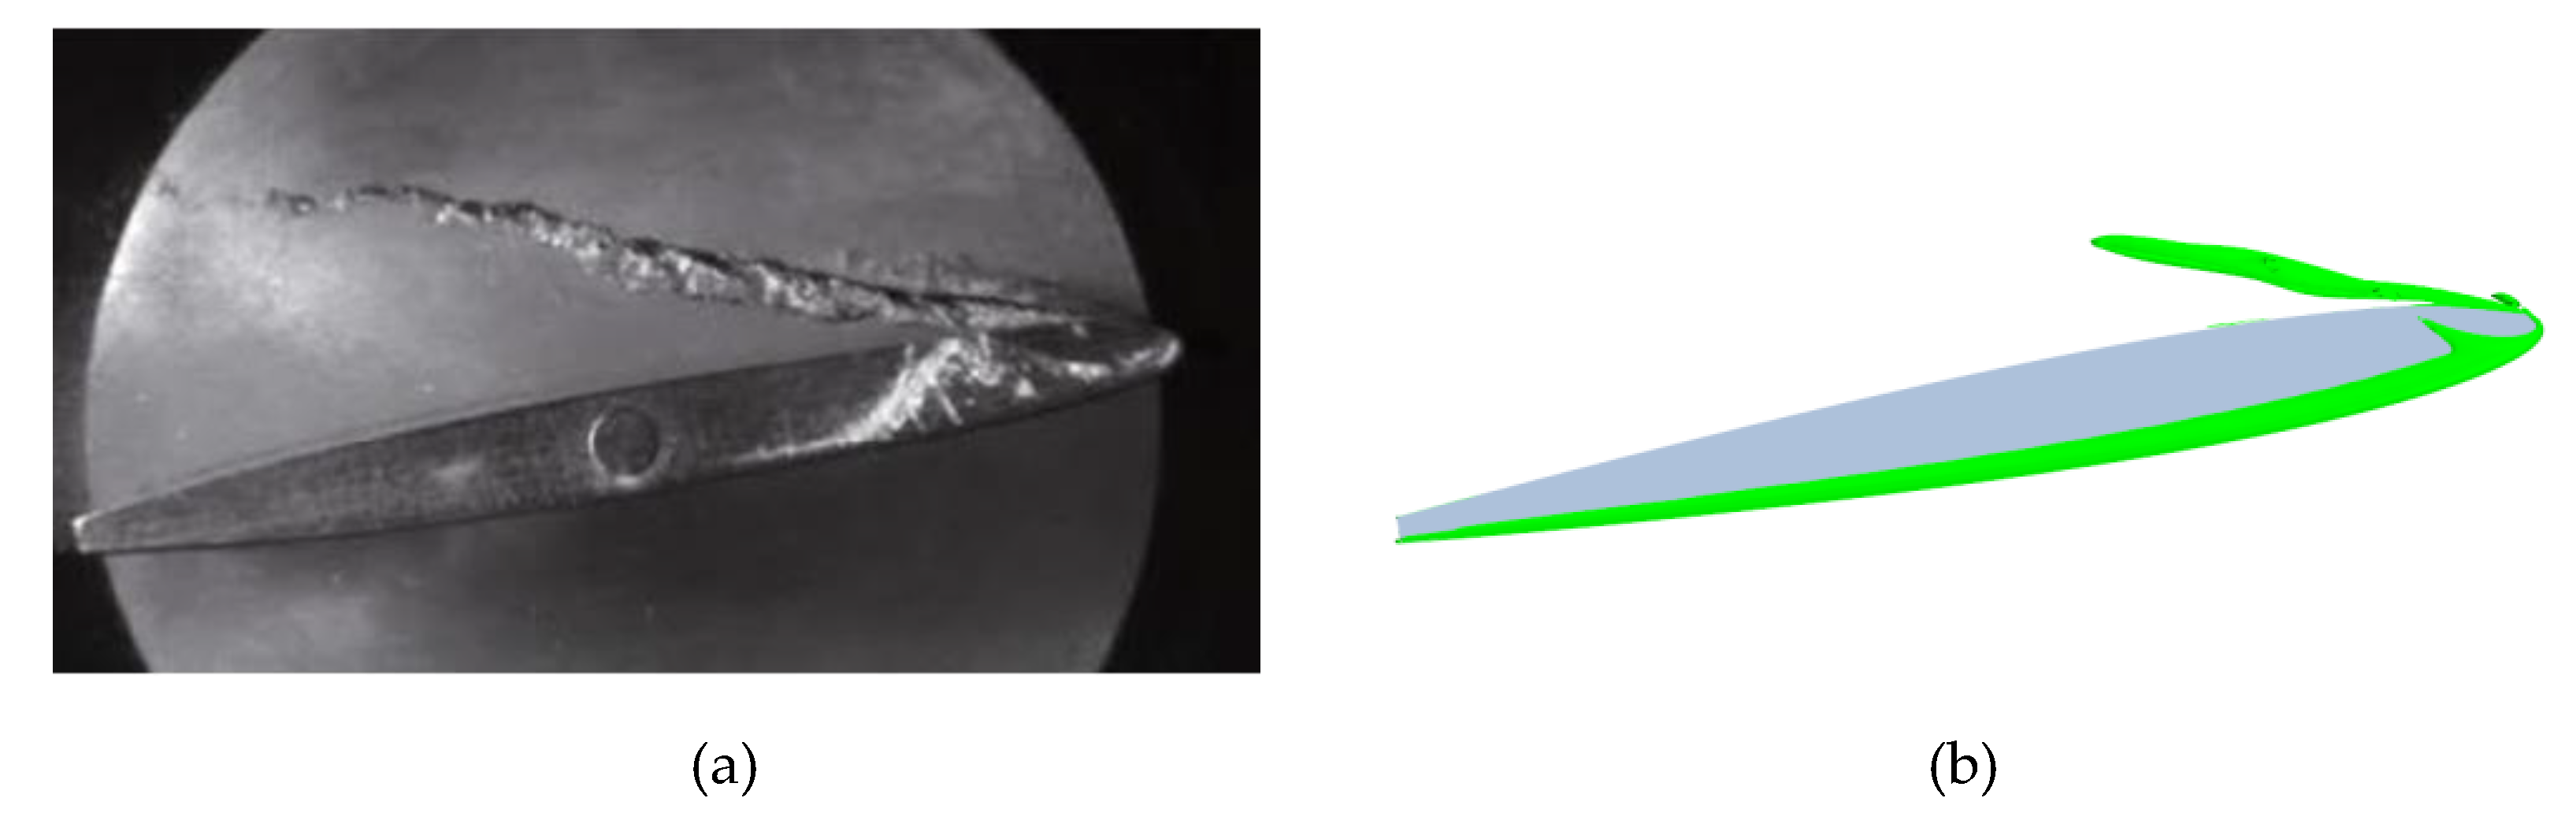
3.3. Validation of Numerical Results

As illustrated in Figure 5 (inlet velocity is 10 m/s), there is a good agreement between the experimental TLV trajectory [17] and calculated vortex expressed by Q criterion (Q = 2 × 10⁷ s−2). Moreover, Figure 6 examines the axial velocity contour on the cut-plane of y/c = 1, the numerical simulations agree well with the experiment measurements. The above analysis shows that the mesh and numerical method adopted in the present paper are reasonable.

4. Result and Discussion

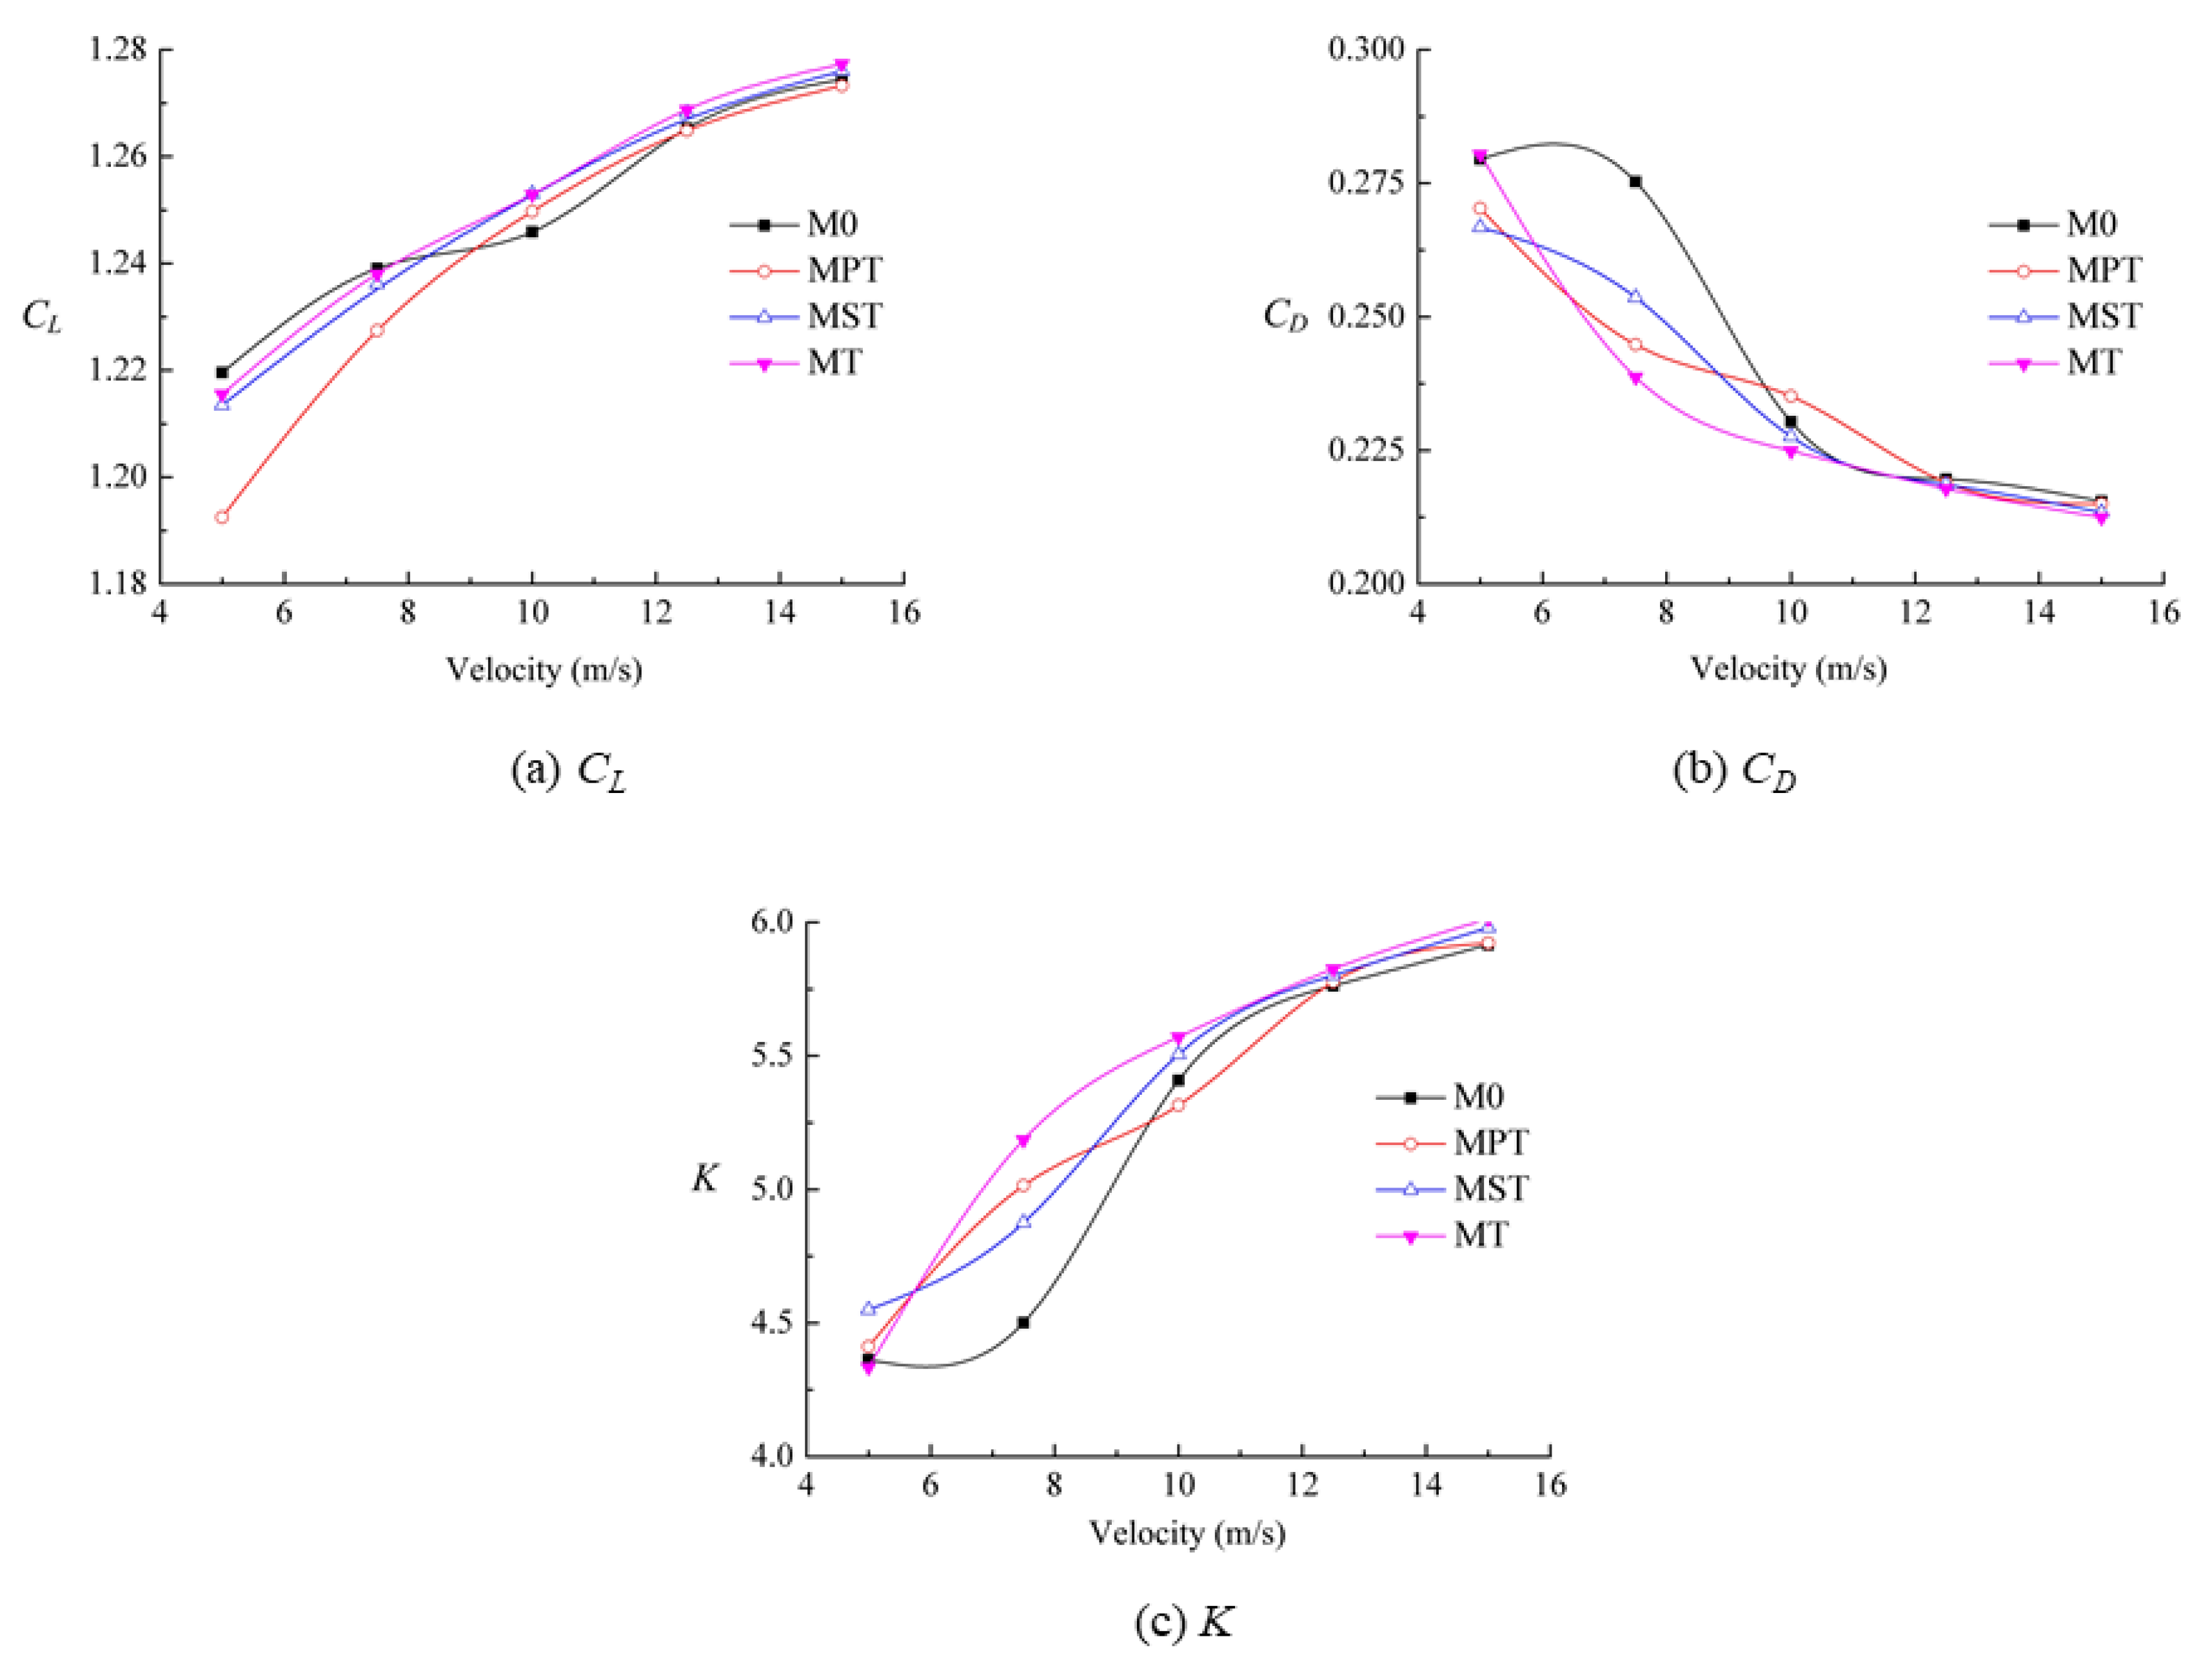
4.1. Energy Performance

T-shape tip geometry will affect the hydrofoil lift force and drag force, which can be analyzed by the drag coefficient (CD) and lift coefficient (CL) defined in Equation (1). Figure 7 shows the lift coefficient, drag coefficient and ratio K of lift coefficient to drag coefficient for different cases. Results show that the lift coefficient gradually increases, the drag coefficient decreases and the lift-drag ratio rises with increase of inlet velocity. Moreover, the impact of the three optimization configurations on the lift coefficient, drag coefficient and K is complex. Firstly, the lift coefficient of the MPT, MST and MT are smaller than that of M0 when the inlet velocity is 5 m/s and 7.5 m/s. As the inlet velocity rises to 10 m/s, the lift coefficient of MST and MT are larger than that of M0. However, for MPT, the lift coefficient is larger than that of M0 only at 10 m/s. Secondly, the drag coefficient of MPT and MST is obviously smaller than that of M0 with the velocity 5 m/s and 7.5 m/s. Finally, the ratio K of MST is larger than that of M0 under all inlet velocities. Moreover, compared with M0, the ratio K of MT is obviously increased when the inlet velocity is 7.5 m/s, 10 m/s, 12.5 m/s and 15 m/s, and the maximum promotion of K is 15.21% at 7.5 m/s. The ratio K of MPT promotes significantly only at 7.5m/s with the maximum promotion of 11.40%.

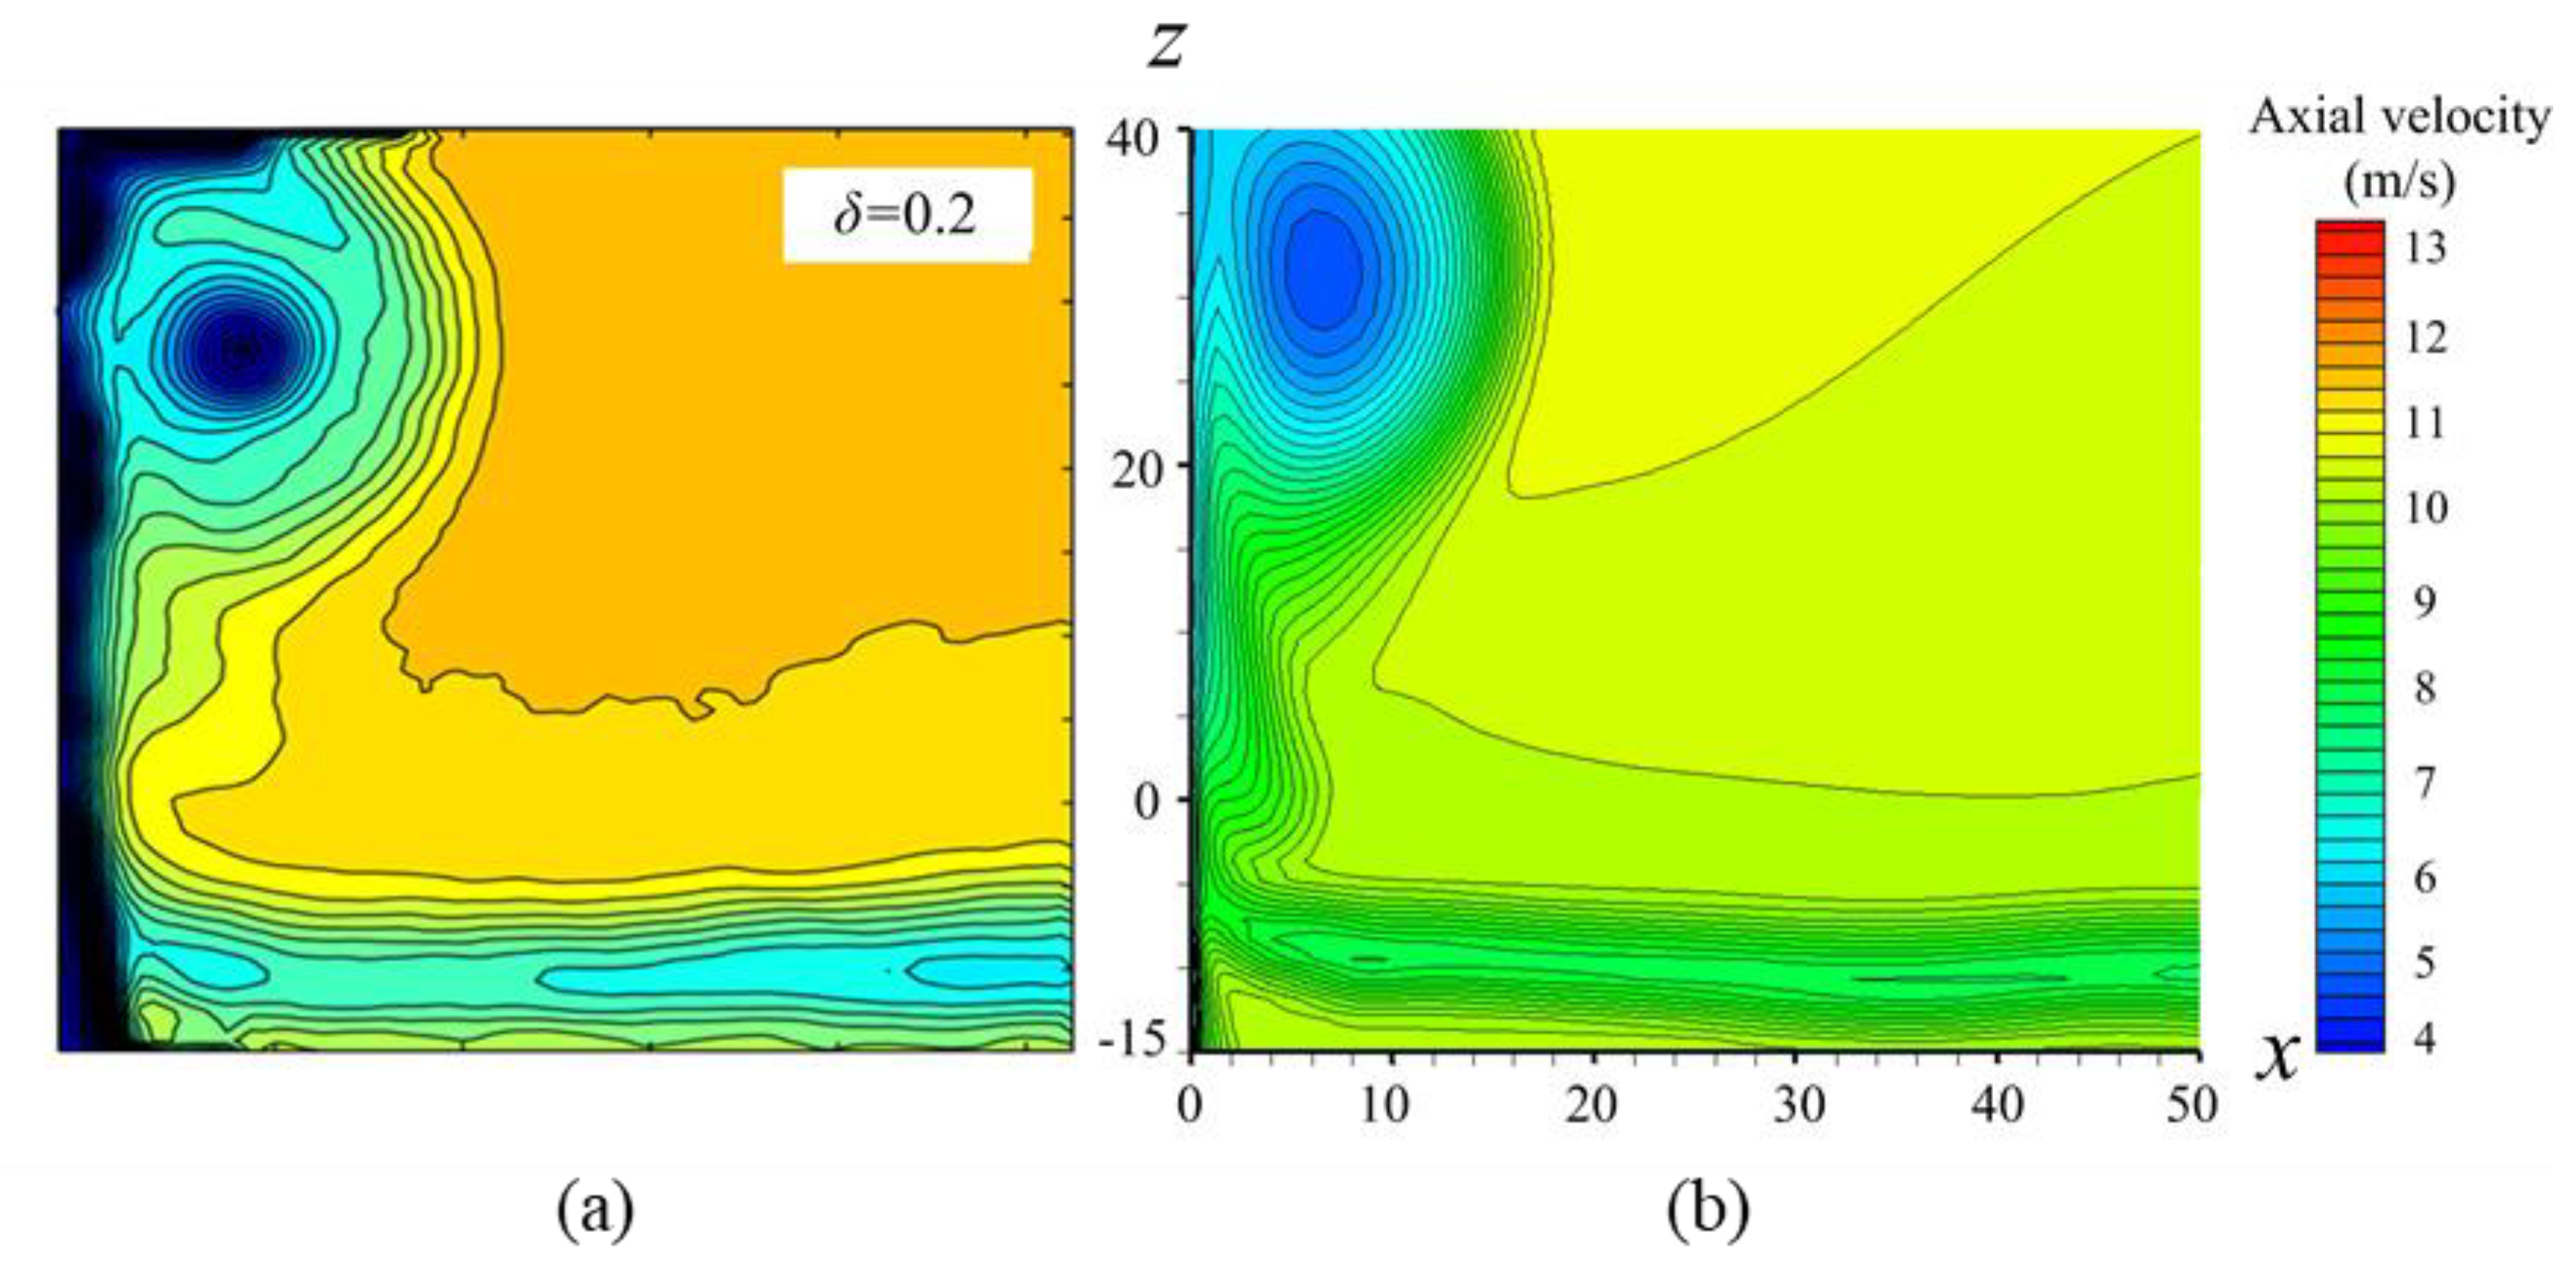
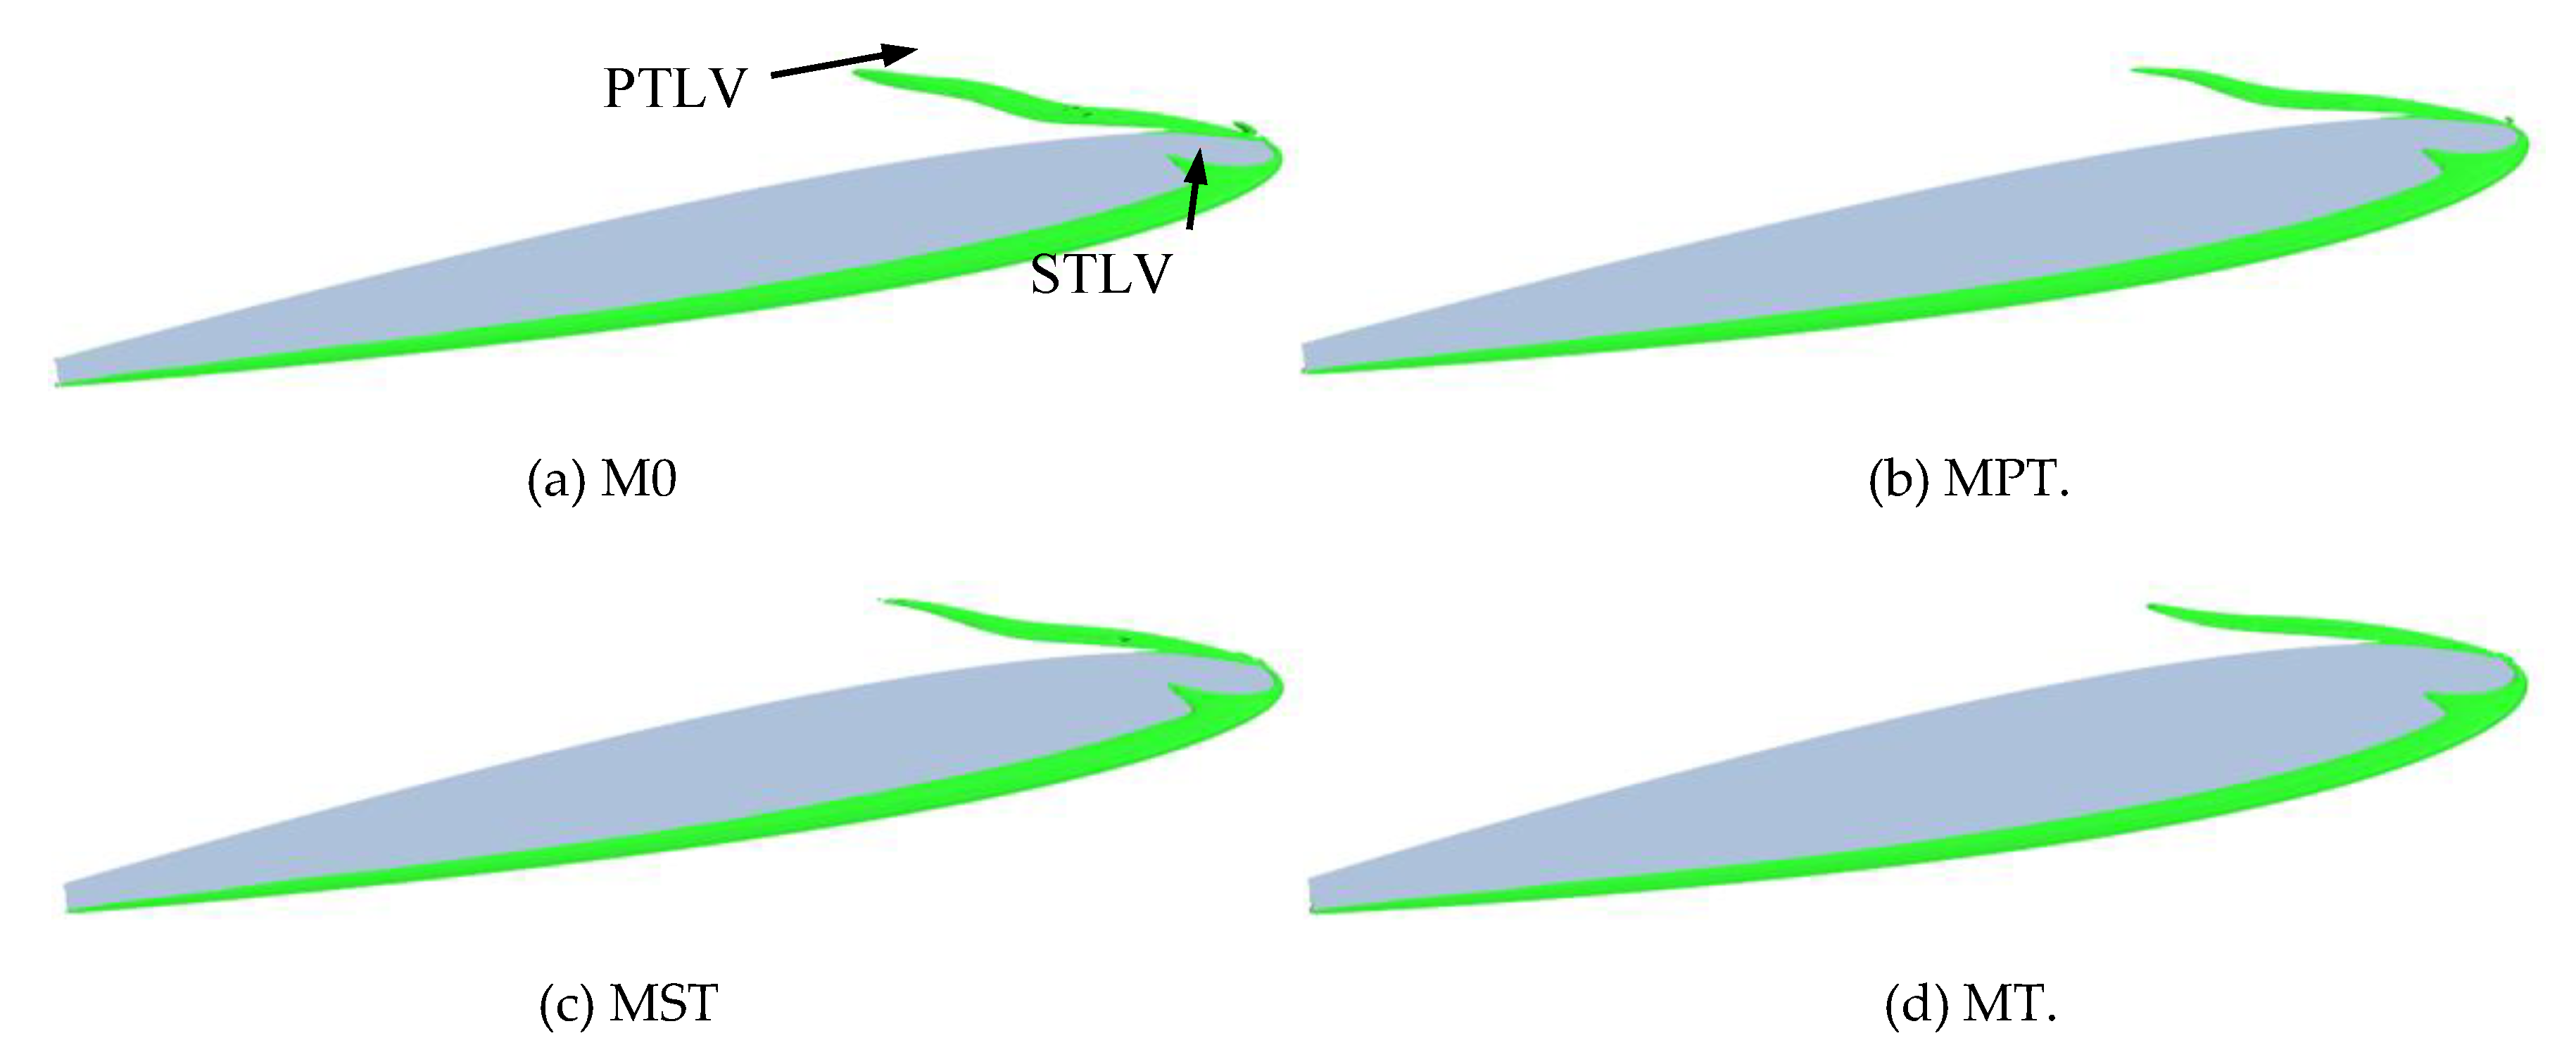
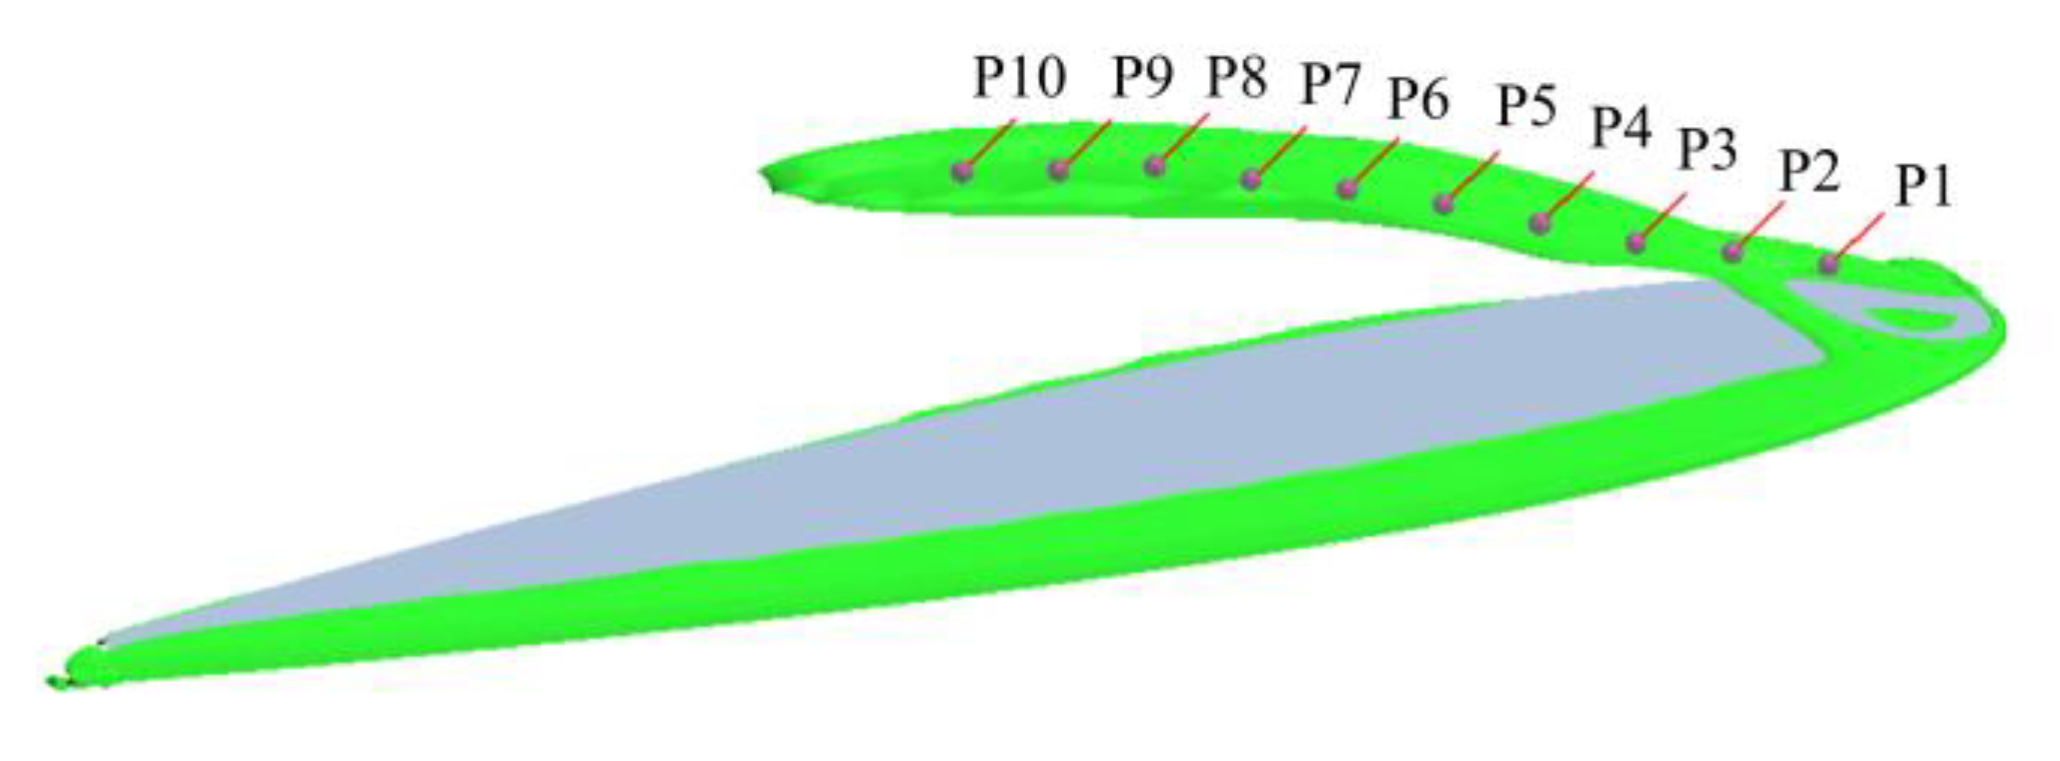
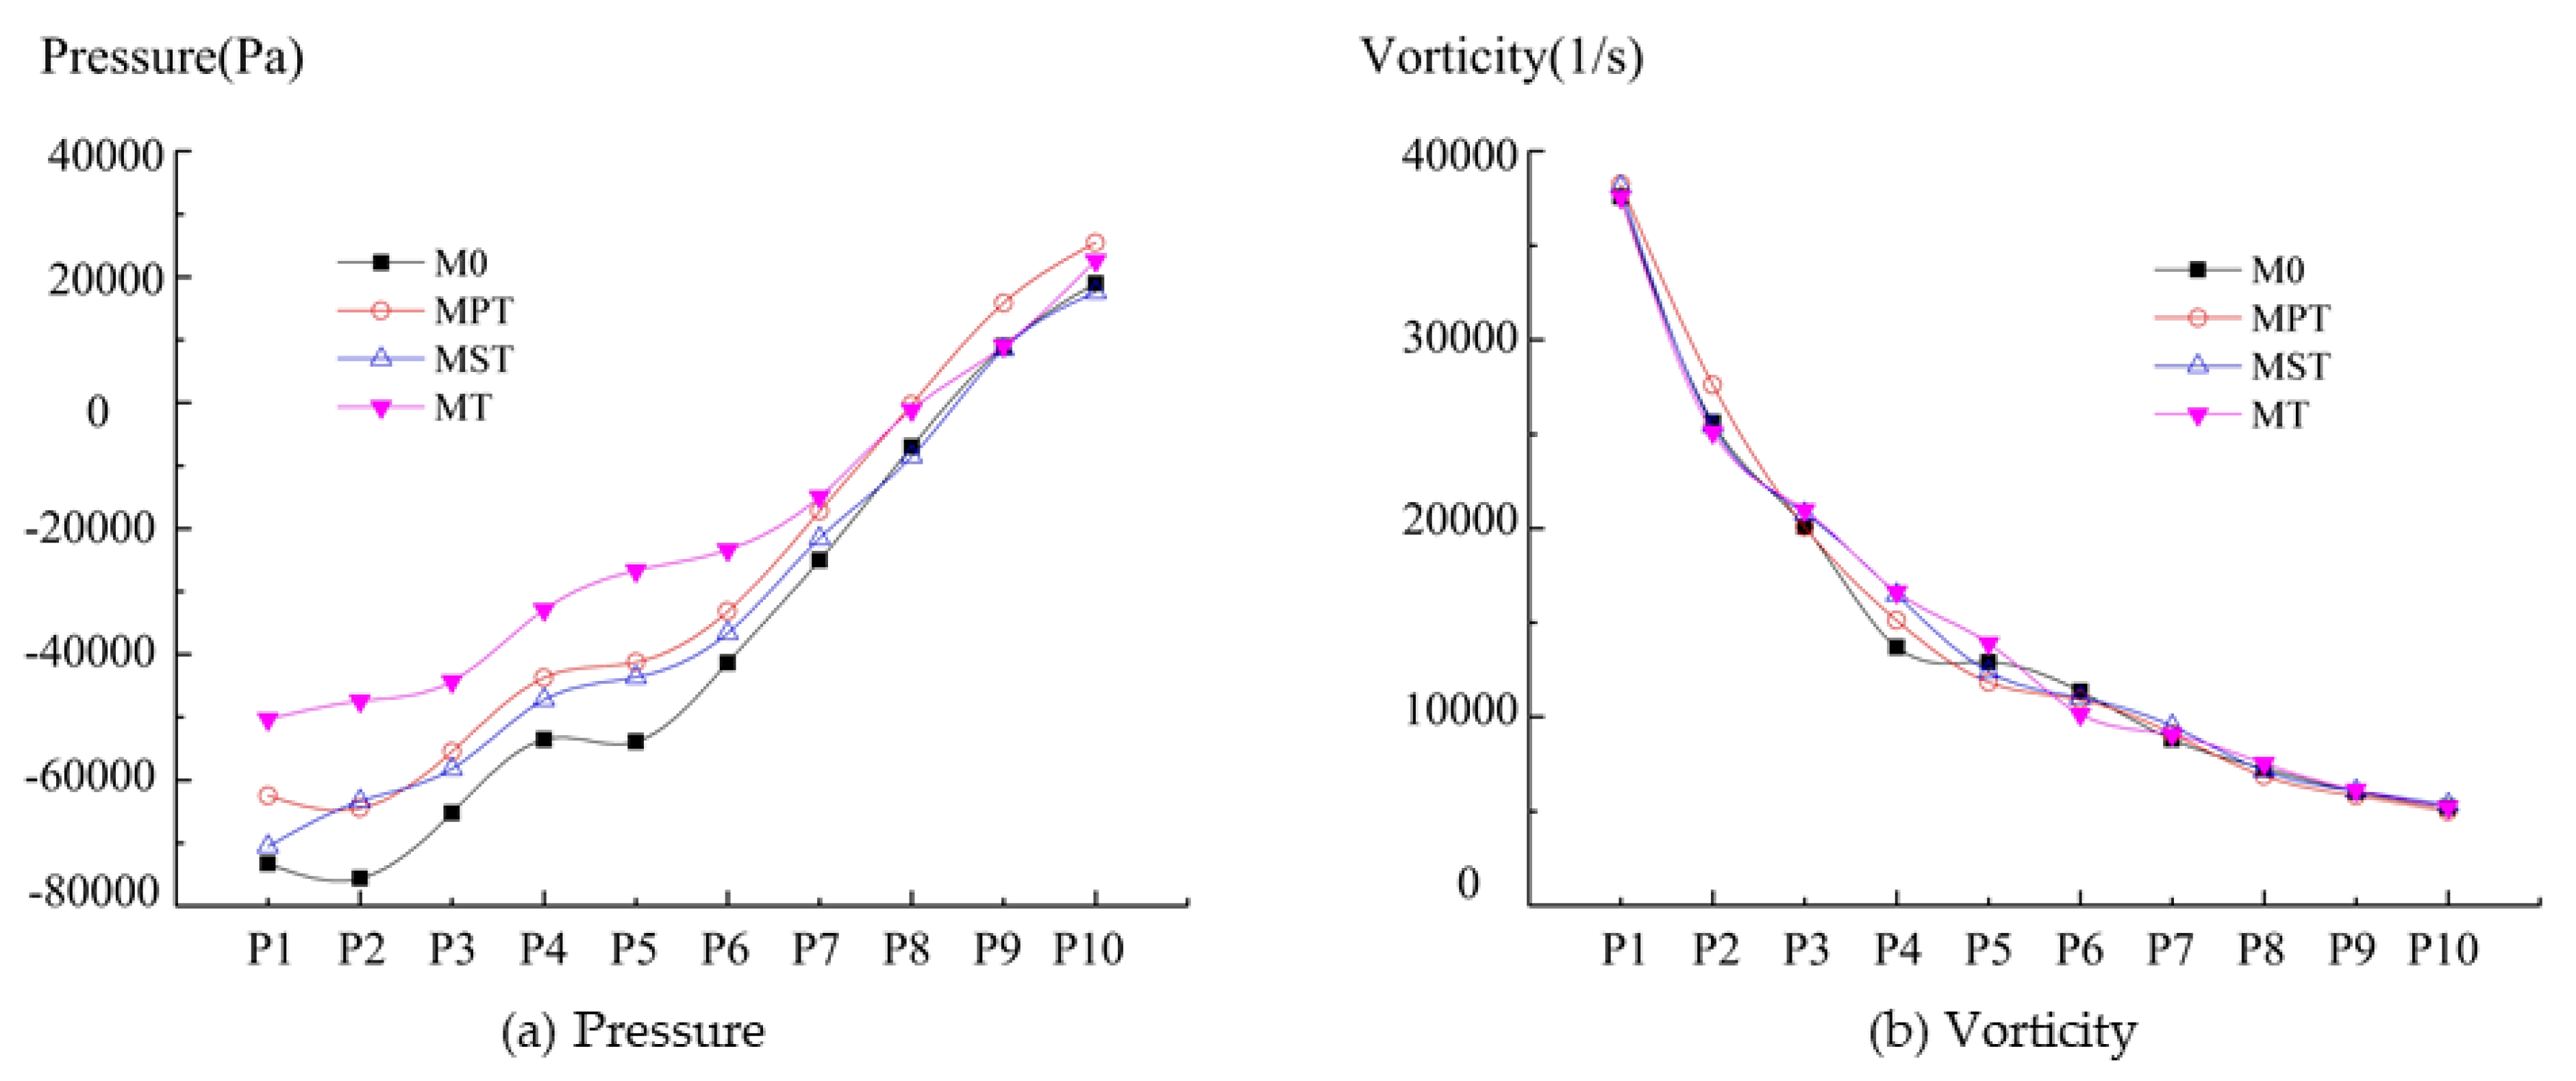
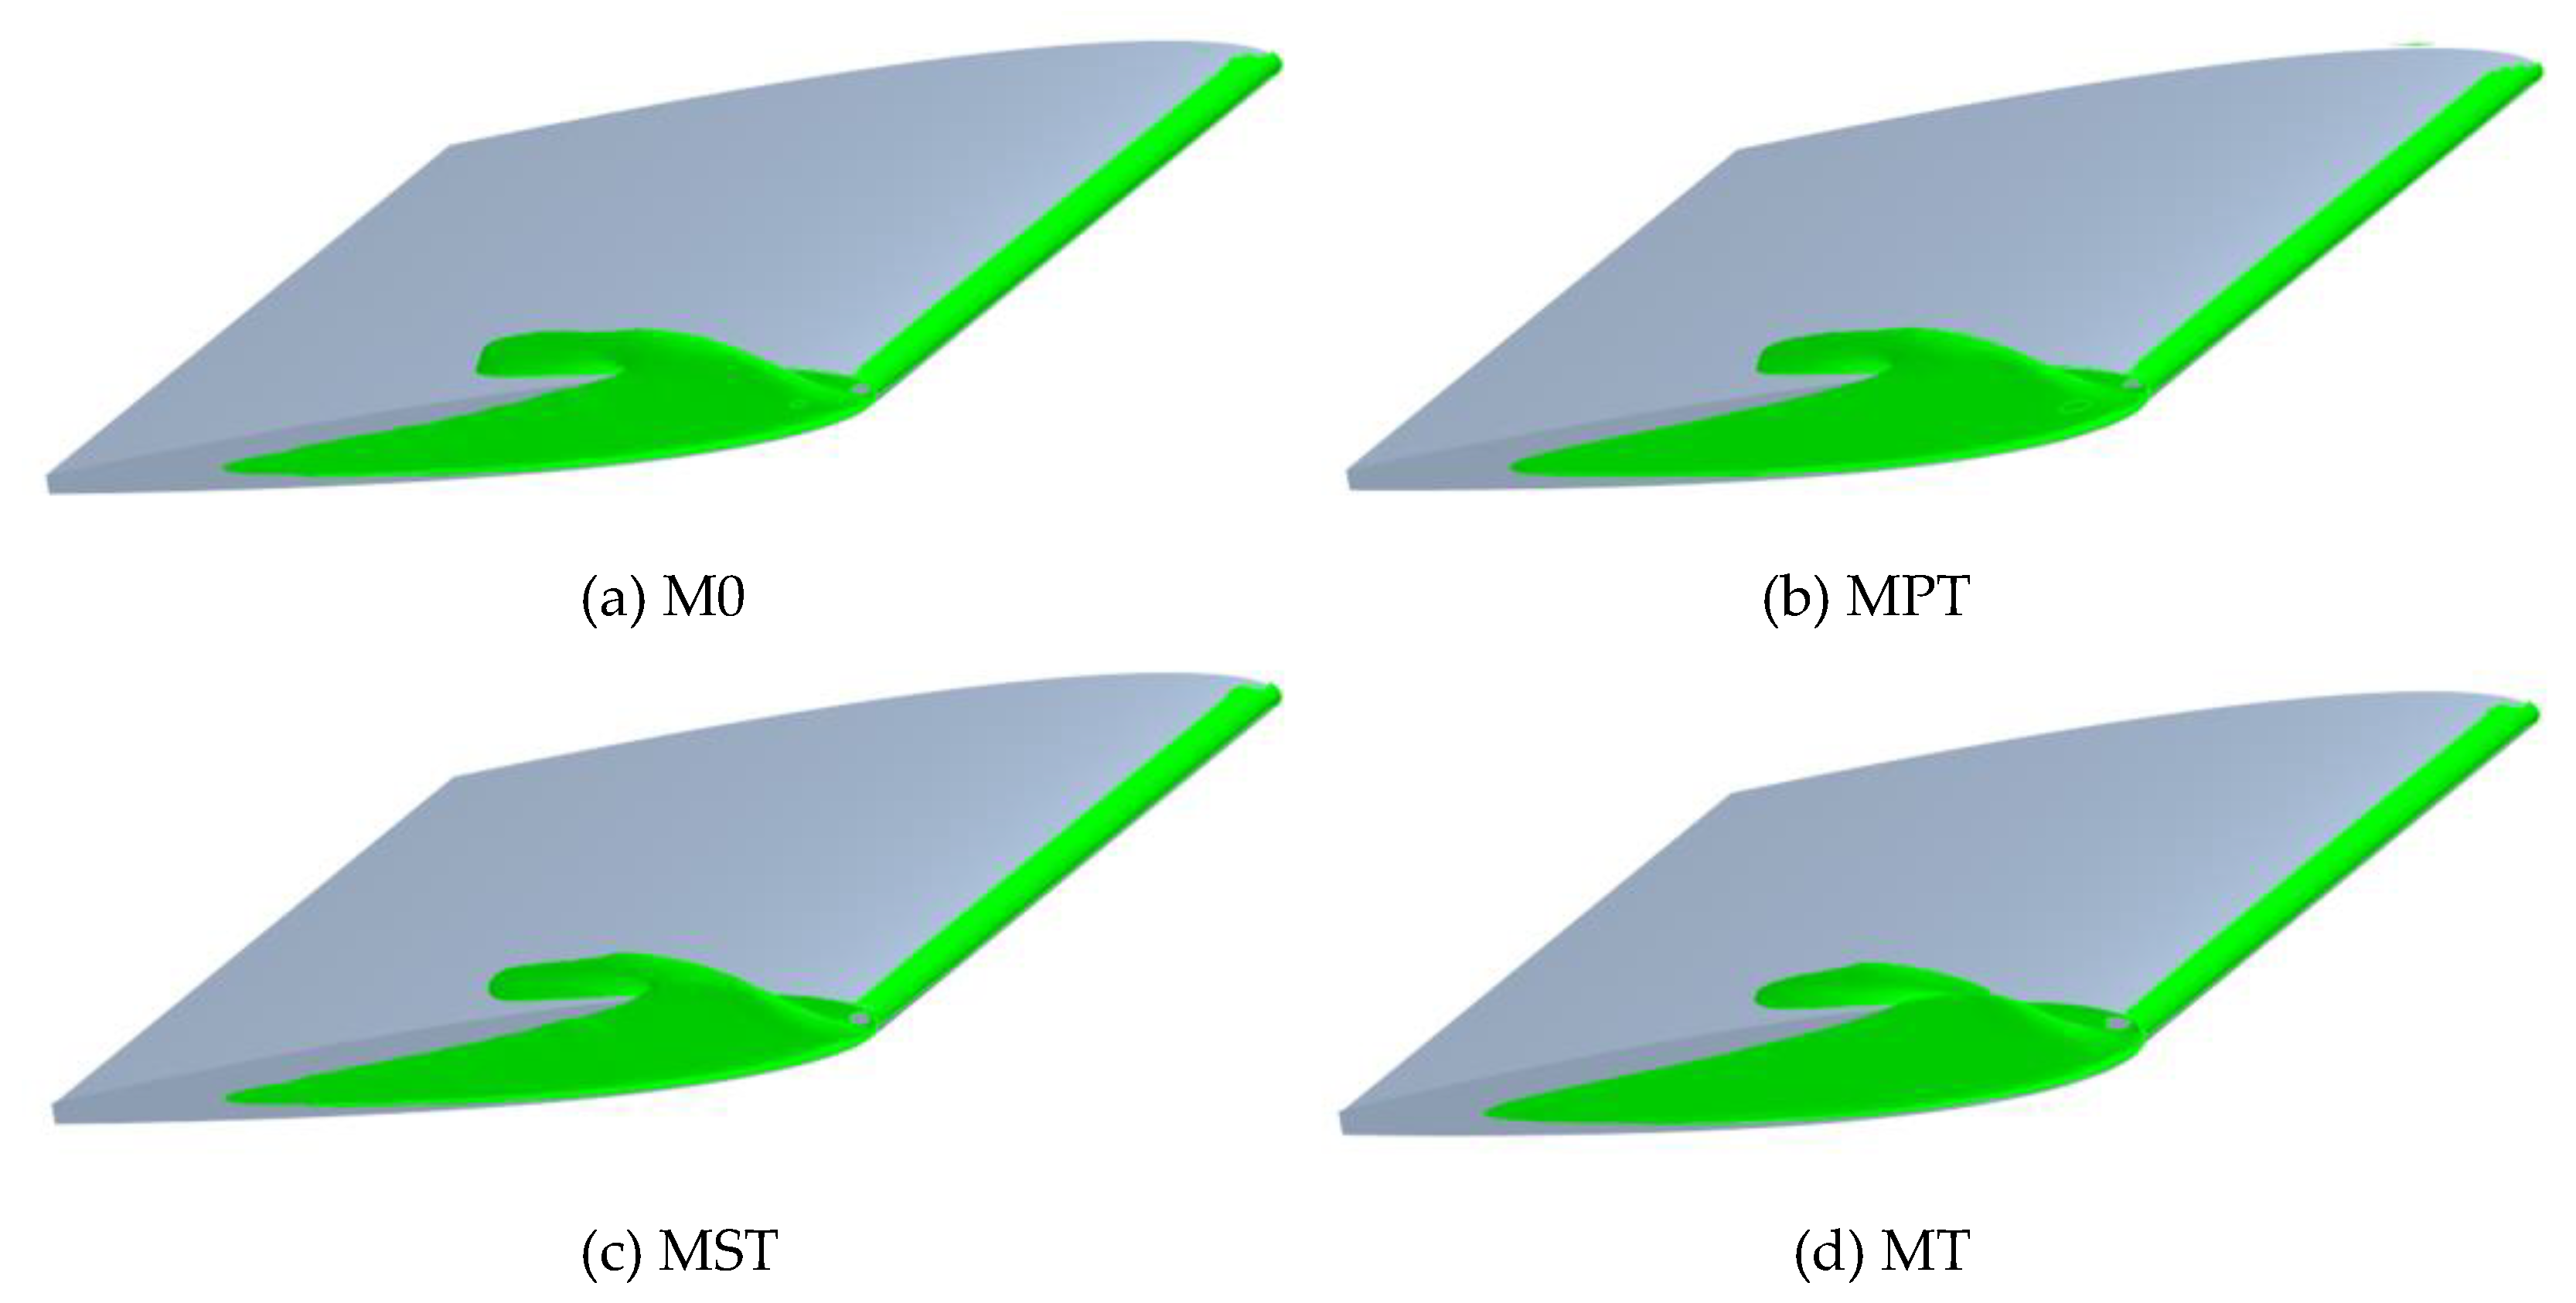
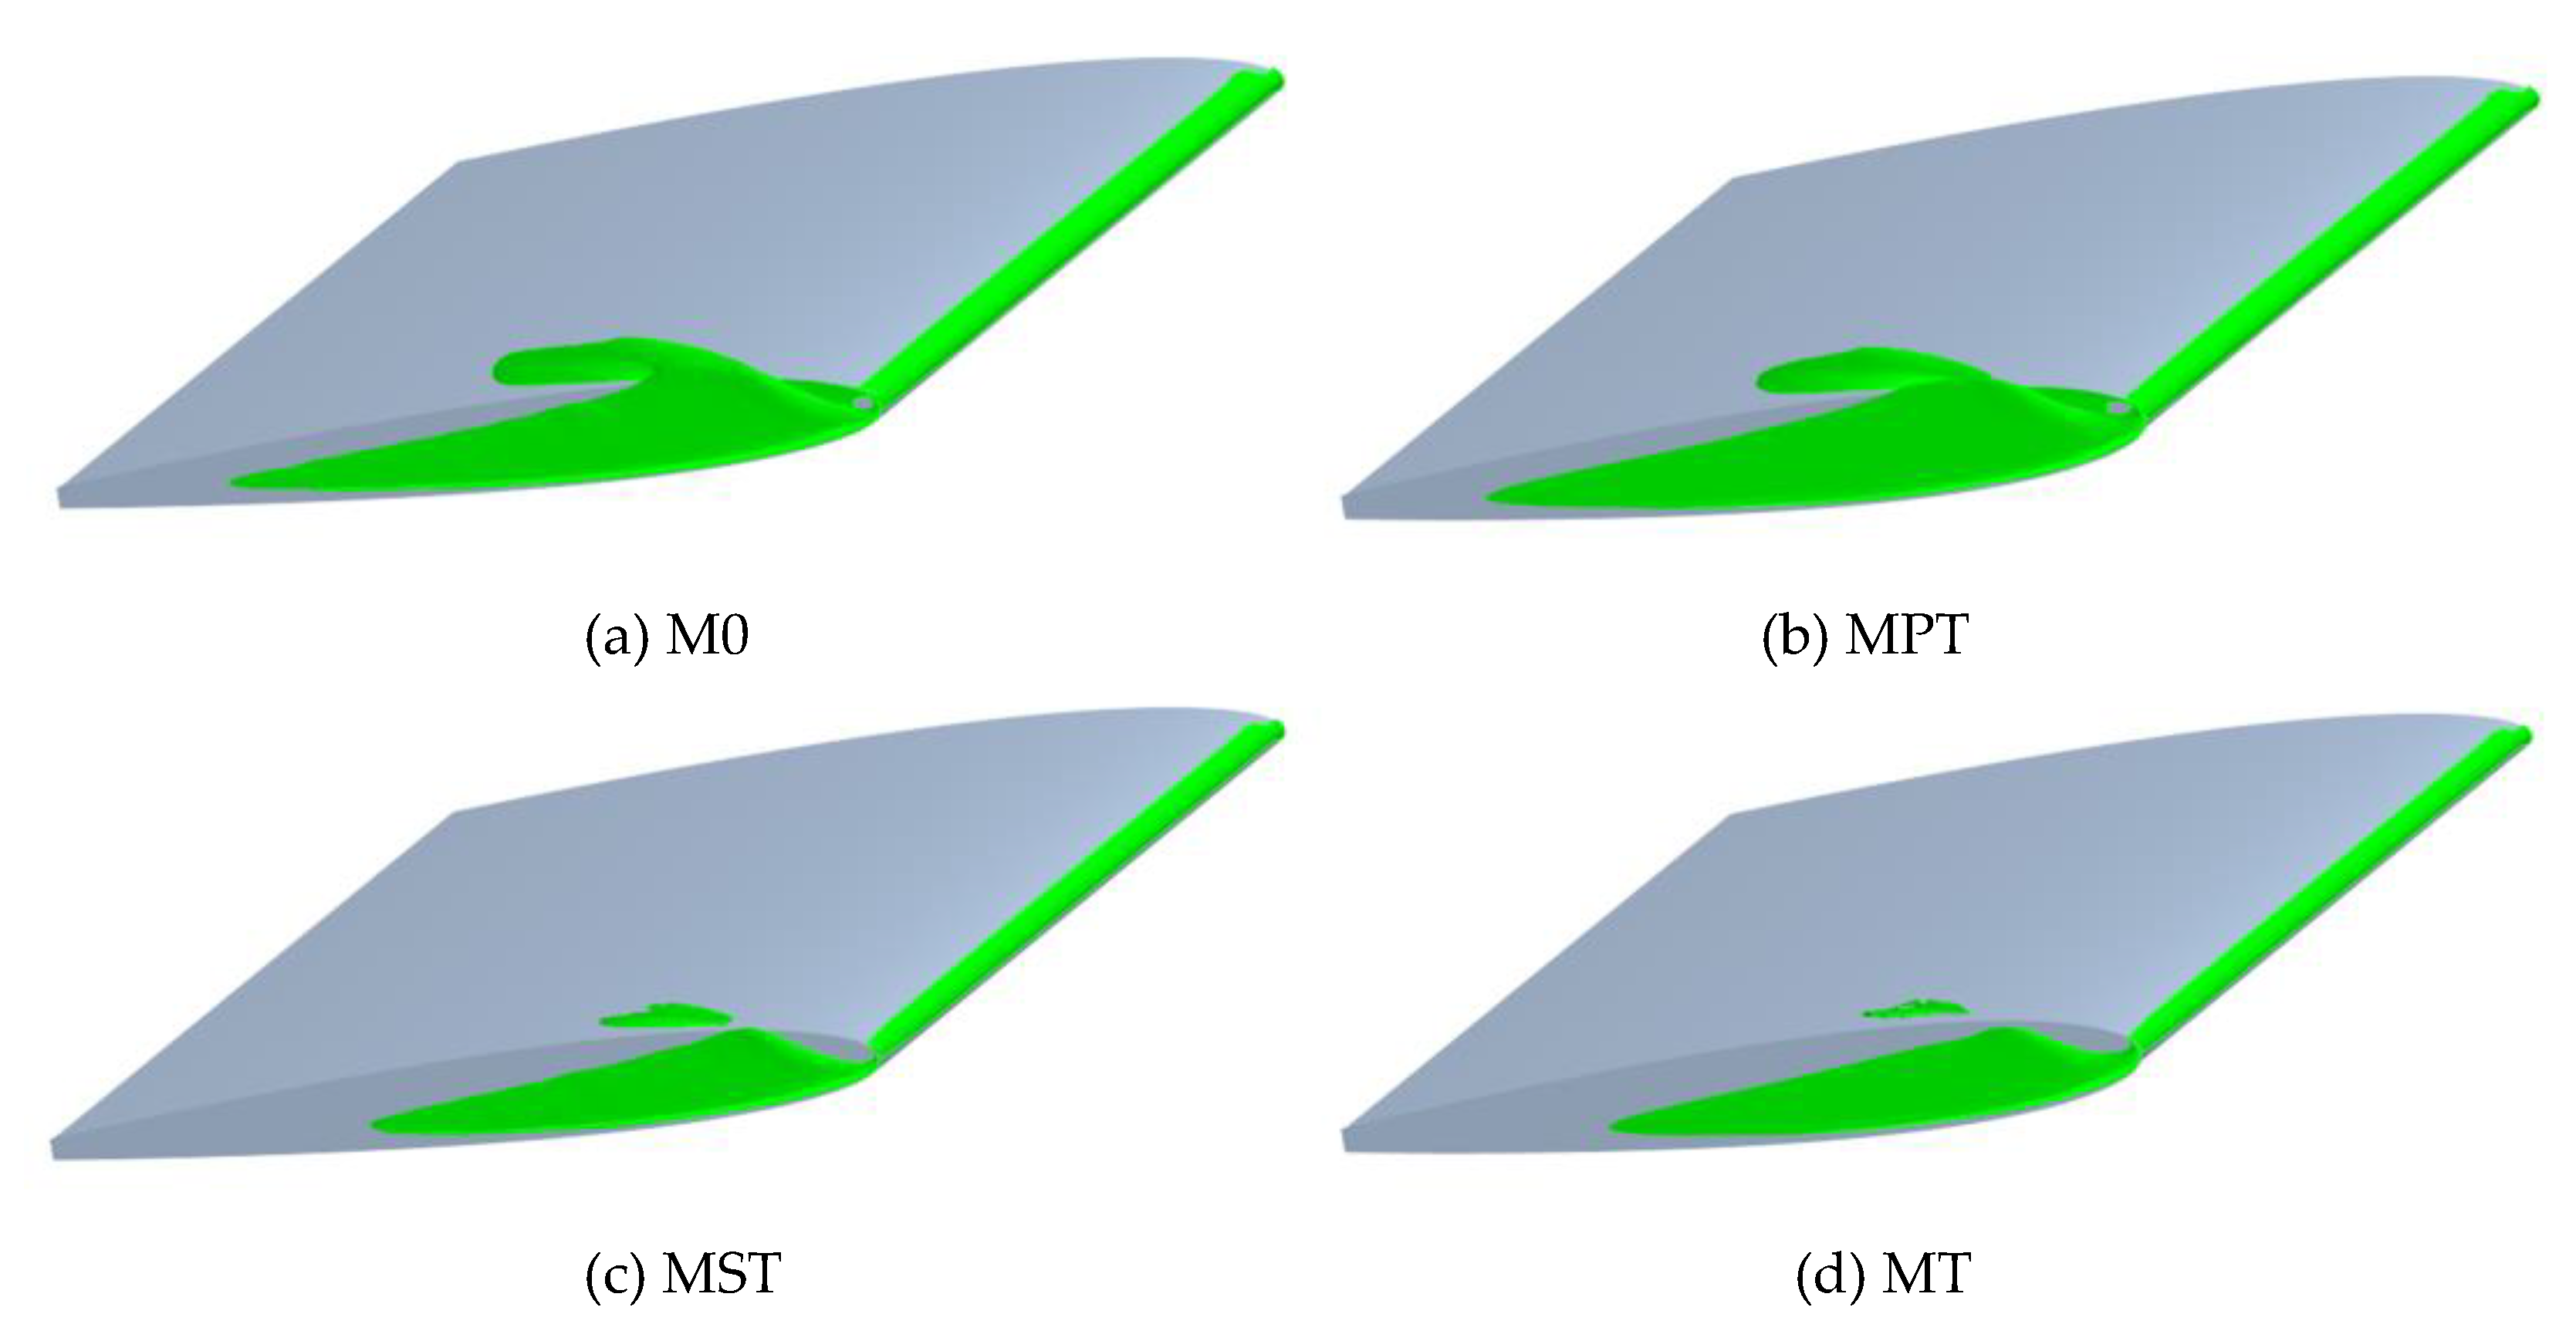
4.2. Flow Patterns in the Gap

The flow patterns in the gap are investigated with the inlet velocity of 10 m/s in this section. As shown in Figure 8, the TLV can be divided into the primary tip leakage vortex (PTLV) and the secondary tip leakage vortex (STLV). In STAR_CMM+ software, the iso-surface of the vortex can be frontal projected to the water tunnel wall near the tip, which can be used to examine the effect of the T-shape tips on suppressing the TLV. Compared with the original foil M0, the MPT, MST and MT obviously reduce the TLV area by 4.01%, 5.02% and 4.91%, respectively.
As indicated in Figure 9, in order to investigate the pressure and vorticity along the PTLV trajectory (Q = 3 × 10⁶ s−2), 10 monitoring points of P1-P10 were chosen along the PTLV trajectory from 5%c to 50%c with an interval of 5%c.
Figure 10 shows the vorticity and pressure curve along the PTLV trajectory. The vorticity sharply declines and then slowly decreases along the PTLV trajectory. The variation of pressure along the PTLV trajectory is almost opposite to that of vorticity. The pressure curves of four cases vary along the PTLV trajectory, and it is obvious that T-shape tip can increase the pressure along the PTLV trajectory, especially near the leading edge. The MT has the best effect on pressure improvement, which is corresponded to the best energy performance at 10 m/s. The vorticity along the PTLV trajectory is nearly the same for different cases.

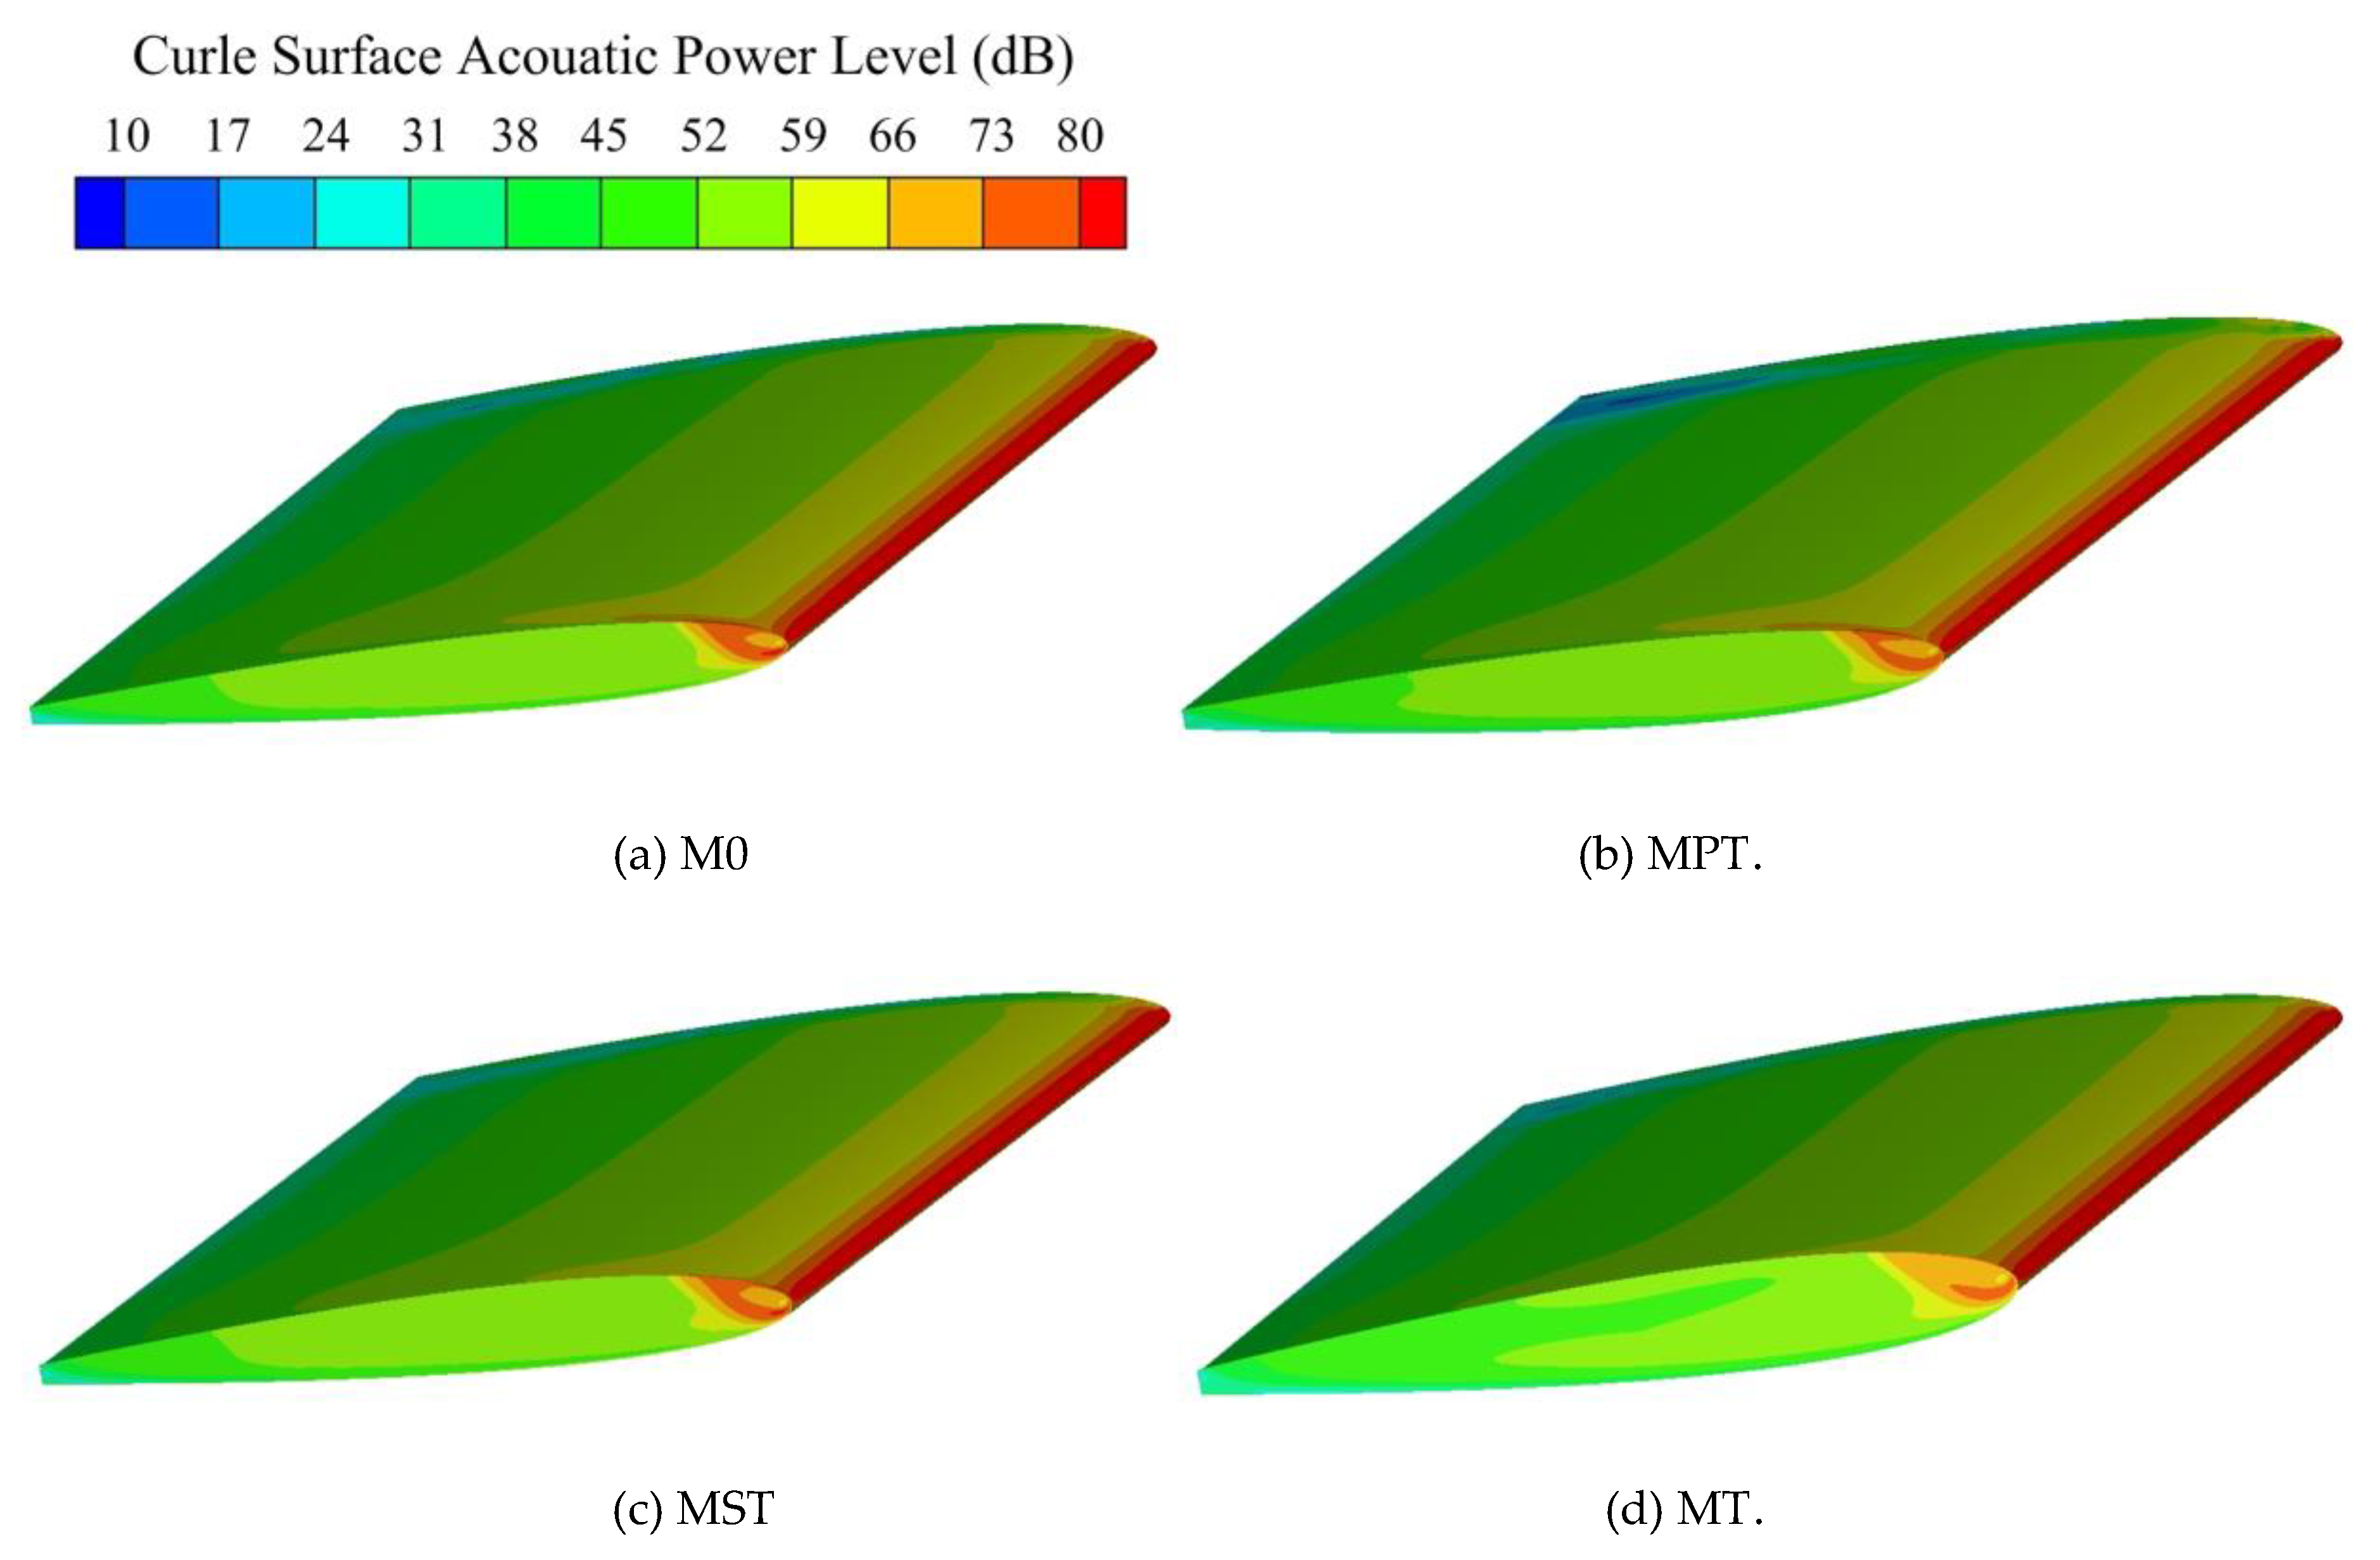
4.3. Curle Surface Acoustic Power Characteristic

The Curle noise source model is adopted to compute the dipole noise of the turbulent boundary layer flow on the solid surface. The surface acoustic power (SAP) can be written as:
SAP = S A c ( y ) ( 12 ρ 0 π c 0 3 ) ( p t ) 2 ¯ d S ( y )
where c0 is the sound speed in the far field, and Ac(y) denotes the correlation area. The steady-state RANS turbulence models can be employed to obtain the turbulence length scale, turbulence time scale and wall shear stress, and further calculate ( p / t ) 2 ¯ .
The SAP can be expressed in dB:
S A P ( dB ) = 10 log S A P P r e f
where Pref = 1 × 10⁻¹² W/m2 is the reference acoustic power.
For the condition of inlet velocity 10 m/s, the Curle SAP characteristic is studied in this section. Figure 11 shows the Curle SAP on the hydrofoil for different T-shape tips. The areas with higher decibel values of dipole noise are mainly on foil leading edge and foil tip near the leading edge. The main reason is that the vortex is close to the foil surface and has obvious interaction with the foil surface. The decibel values of dipole noise on the foil surface along the downstream direction gradually decrease, and the area of high decibel values (red color) on the tip for MPT and MT is small than that of M0.
The effect of T-shape tips on Curle SAP of hydrofoil with tip clearance is demonstrated in Table 2. The relative change is defined as ΔSAP = (SAP − SAP0)/SAP0, where SAP0 is the value of M0, and the average SAP denotes the surface average value of the Curle SAP. It can be concluded that the maximum SAP for MPT and MT decreases by 2.64% and 3.03%, respectively, and the average SAP for MPT, MST and MT decreases by 0.50%, 0.04% and 0.97%, respectively. For the foil end surface, the MT model can effectively suppress the dipole noise, the maximum SAP and the average SAP decrease 4.75% and 1.74%, respectively. In order to evaluate the impact of the TLV on the dipole noise of the side wall near tip surface, the data of the side wall is listed in Table 2. The average SAP of the side wall for MPT, MST and MT decreases by 0.12%, 0.01% and 0.12%, respectively. In addition, the maximum SAP for MT decreases by 0.43%.

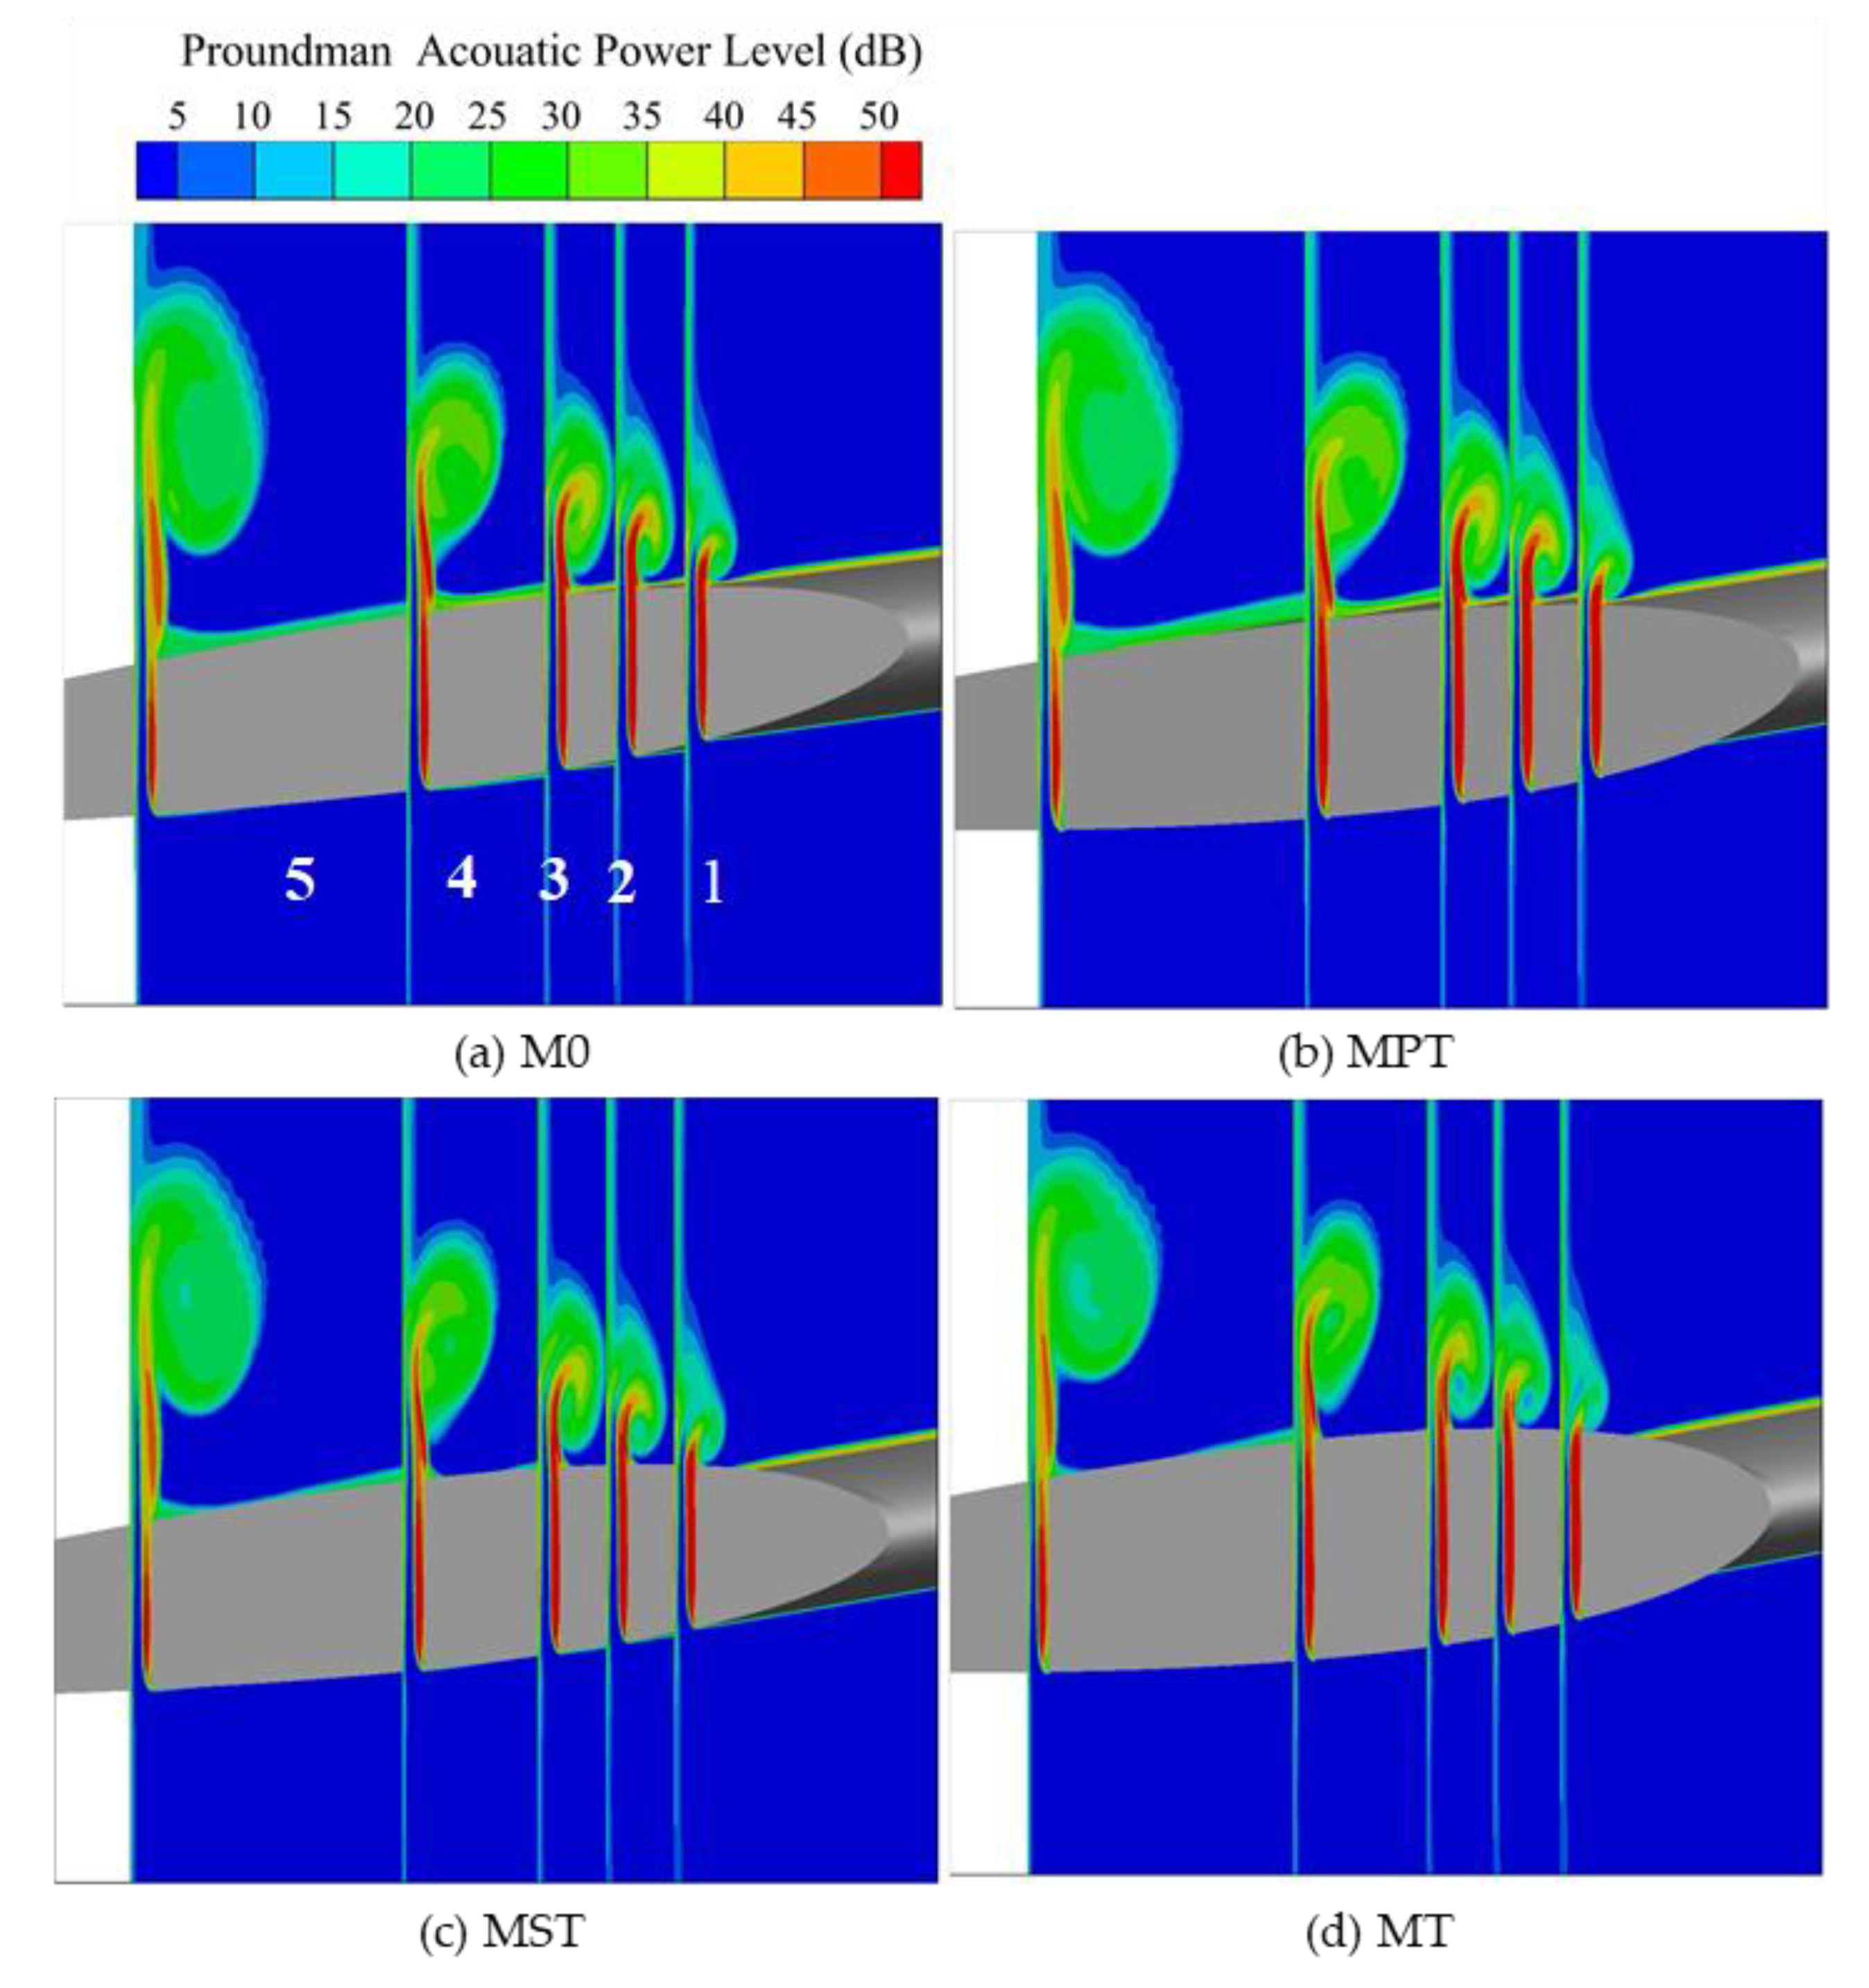
4.4. Proudman Acoustic Power Characteristic

The Proudman noise source model can be employed for steady-state RANS turbulence models, and visualizes the acoustic power per unit volume which is generated by the quadrupole sound sources of the flow. The total acoustic power can be described as:
A P = a c ρ U 3 L t U 5 c 0 5
U = L t T
A P ( dB ) = 10 log A P P r e f
where αc = 0.629 denotes a constant value, U represents the turbulence velocity, Lt is the turbulence length scale and T denotes the turbulence time scale.
The Proudman acoustic power characteristic was studied under the inlet velocity of 10 m/s. To reveal the quadrupole noise around the foil, five cut-planes 1–5 were chosen at 10%c, 15%c, 20%c, 30%c and 50%c, respectively. Figure 12 shows the Proudman AP on these five cut-planes. The quadrupole noise mainly concentrated near the PTLV and STLV in the tip clearance, and the larger decibel value of the quadrupole noise mainly appeared near the STLV and the area where the STLV flow interacts with the PTLV. In addition, the MT model had a slight suppression effect on the quadrupole noise in planes 1–3.
Some comparisons were made at the power levels of 50 dB and 55 dB. As shown in Figure 13, the isosurfaces represent the value of noise at 50 dB. The main noise was located at the tip clearance leakage vortex and the leading edge. In comparison with M0, the area of noise for the three T-shape cases was not significantly reduced. As shown in Figure 14, the noise at the PTLV of the MST and MT was smaller than that of the original model M0. In STAR_CMM+ software, the iso-surface of the Proudman AP can be frontal projected to the water tunnel wall near the tip, which can be adopted to evaluate the impact of the T-shape tips on suppressing the Proudman AP. In comparison with original foil M0, the MST model obviously reduced the area of Proudman AP by 6.55% for 55 dB. However, the other two optimization configurations of MPT and MT could not effectively reduce the total area of the Proudman AP.
Note that although T-shaped tips can reduce the area of TLV, this does not mean that the intensity of quadrupole noise sources can be effectively suppressed. For example, compared with original foil M0, the TLV area of the MPT was reduced by 4.01%, but the area of Proudman AP was not significantly reduced. This is because in the sound source region, quadrupole noise mainly depends on Reynolds stress [32], not the size of vortex.

5. Conclusions

The effect of T-shaped tip on the energy performance, flow patterns and broadband noise sources for a NACA0009 hydrofoil with tip clearance was carried out in the present paper. The numerical calculation was verified by comparing the flow experimental measurements with the numerical simulation results. The conclusions are summarized as follows:
(1)
The impact of the T-shape tip on lift coefficient, drag coefficient and ratio of lift coefficient to drag coefficient is complex. Under all inlet velocities, the MST model effectively improves ratio of lift coefficient to drag coefficient with maximum promotion of 4.26%. In addition, the ratio of lift coefficient to drag coefficient for the MT model obviously increases when the inlet velocity is 7.5 m/s, 10 m/s, 12.5 m/s and 15 m/s, and the maximum promotion is 15.21% at 7.5 m/s.
(2)
The T-shape tip can suppress the TLV, which makes the vortex area decrease with a maximum drop of 5.02%. The three optimization configurations improve the pressure along the PTLV trajectory near the leading edge.
(3)
The MPT and MT have good suppression effect on the hydrofoil dipole noise, and reduce the maximum Curle AP of the foil with 2.64% and 3.03%, respectively.
(4)
Compared with the original foil M0, the MST model obviously reduces the area of the Proudman AP by 6.55% for 55 dB. However, the optimization models of the MPT and MT cannot effectively reduce the total area of the Proudman AP.

Author Contributions

Z.H., L.T. and C.H. proposed the T-shape method, Z.H. and Y.H. completed the numerical simulations, Z.H. and Y.H. analyzed the data, Z.H., Y.H., L.T. and C.H. wrote the paper.

Funding

This research was funded by the National Natural Science Foundation of China [grant number 51809148], the Beijing Natural Science Foundation [grant number 3192015], the Open Research Fund Program of State Key Laboratory of Hydroscience and Engineering [grant number sklhse-2018-E-01], the State Key Laboratory of Hydroscience and Engineering [grant number 2018-KY-02].

Conflicts of Interest

The authors declare no conflicts of interest.

References

  1. Li, X.; Jiang, Z.; Zhu, Z.; Si, Q.; Li, Y. Entropy generation analysis for the cavitating head-drop characteristic of a centrifugal pump. Proc. Inst. Mech. Eng. Part C J. Mech. Eng. Sci. 2018, 232, 4637–4646. [Google Scholar] [CrossRef]
  2. Li, X.; Gao, P.; Zhu, Z.; Li, Y. Effect of the blade loading distribution on hydrodynamic performance of a centrifugal pump with cylindrical blades. J. Mech. Sci. Technol. 2018, 32, 1161–1170. [Google Scholar] [CrossRef]
  3. Liu, M.; Tan, L.; Cao, S. Theoretical model of energy performance prediction and BEP determination for centrifugal pump as turbine. Energy 2019, 172, 712–732. [Google Scholar] [CrossRef]
  4. Tan, L.; Zhu, B.; Cao, S.; Wang, Y.; Wang, B. Numerical simulation of unsteady cavitation flow in a centrifugal pump at off-design conditions. Proc. Inst. Mech. Eng. Part C J. Mech. Eng. Sci. 2014, 228, 1994–2006. [Google Scholar]
  5. Tan, L.; Zhu, B.; Wang, Y.; Cao, S.; Gui, S. Numerical study on characteristics of unsteady flow in a centrifugal pump volute at partial load condition. Eng. Comput. 2015, 32, 1549–1566. [Google Scholar] [CrossRef]
  6. Zhang, W.; Yu, Z.; Li, Y. Application of a non-uniform bubble model in a multiphase rotodynamic pump. J. Pet. Sci. Eng. 2019, 173, 1316–1322. [Google Scholar] [CrossRef]
  7. Zhang, W.; Yu, Z.; Li, Y.; Yang, J.; Ye, Q. Numerical analysis of pressure fluctuation in a multiphase rotodynamic pump with air–water two-phase flow. Oil Gas Sci. Technol. 2019, 74, 18. [Google Scholar] [CrossRef]
  8. Li, X.-S.; Song, Y.; Hao, Z.-R.; Gu, C.-W. Cavitation Mechanism of Oil-Film Bearing and Development of a New Gaseous Cavitation Model Based on Air Solubility. J. Tribol. 2012, 134, 031701. [Google Scholar] [CrossRef]
  9. Wang, Y.; Ren, X.; Li, X.; Gu, C. Numerical investigation of air-oil-thermal coupling mechanism in floating ring. J. Tribol. 2018, 140, 031701. [Google Scholar]
  10. Liu, M.; Tan, L.; Cao, S. Cavitation-vortex-turbulence interaction and one-dimensional model prediction of pressure for hydrofoil ALE15 by large eddy simulation. ASME J. Fluids Eng. 2019, 141, 021103. [Google Scholar] [CrossRef]
  11. Cheng, H.Y.; Bai, X.R.; Long, X.P.; Ji, B.; Peng, X.X.; Farhat, M. Large eddy simulation of the tip-leakage cavitating flow with an insight on how cavitation influences vorticity and turbulence. Appl. Math. Model. 2020, 77, 788–809. [Google Scholar] [CrossRef]
  12. Liu, Y.; Tan, L.; Wang, B. A Review of Tip Clearance in Propeller, Pump and Turbine. Energies 2018, 11, 2202. [Google Scholar] [CrossRef]
  13. Wu, H.; Miorini, R.L.; Katz, J. Measurements of the tip leakage vortex structures and turbulence in the meridional plane of an axial water-jet pump. Exp. Fluids 2011, 50, 989–1003. [Google Scholar] [CrossRef]
  14. Wu, H.; Tan, D.; Miorini, R.L.; Katz, J. Three-dimensional flow structures and associated turbulence in the tip region of a waterjet pump rotor blade. Exp. Fluids 2011, 51, 1721–1737. [Google Scholar] [CrossRef]
  15. Zhang, D.; Shi, W.; Pan, D.; Dubuisson, M. Numerical and Experimental Investigation of Tip Leakage Vortex Cavitation Patterns and Mechanisms in an Axial Flow Pump. J. Fluids Eng. 2015, 137, 121103. [Google Scholar] [CrossRef]
  16. Zhang, D.; Shi, W.; Van Esch, B.B.; Shi, L.; Dubuisson, M. Numerical and experimental investigation of tip leakage vortex trajectory and dynamics in an axial flow pump. Comput. Fluids 2015, 112, 61–71. [Google Scholar] [CrossRef]
  17. Dreyer, M.; Decaix, J.; Münch-Alligné, C.; Farhat, M. Mind the gap: A new insight into the tip leakage vortex using stereo-PIV. Exp. Fluids 2014, 55, 1–13. [Google Scholar] [CrossRef]
  18. Gopalan, S.; Katz, J.; Liu, H.L. Effect of Gap Size on Tip Leakage Cavitation Inception, Associated Noise and Flow Structure. J. Fluids Eng. 2002, 124, 994–1004. [Google Scholar] [CrossRef]
  19. Liu, Y.; Tan, L. Tip clearance on pressure fluctuation intensity and vortex characteristic of a mixed flow pump as turbine at pump mode. Renew. Energy 2018, 129, 606–615. [Google Scholar] [CrossRef]
  20. Hao, Y.; Tan, L.; Yue, H.; Lei, T. Symmetrical and unsymmetrical tip clearances on cavitation performance and radial force of a mixed flow pump as turbine at pump mode. Renew. Energy 2018, 127, 368–376. [Google Scholar] [CrossRef]
  21. Liu, Y.; Tan, L. Spatial–Temporal Evolution of Tip Leakage Vortex in a Mixed-Flow Pump with Tip Clearance. J. Fluids Eng. 2019, 141, 081302. [Google Scholar] [CrossRef]
  22. Guo, Q.; Zhou, L.; Wang, Z. Numerical evaluation of the clearance geometries effect on the flow field and performance of a hydrofoil. Renew. Energy 2016, 99, 390–397. [Google Scholar] [CrossRef]
  23. Okita, K.; Ugajin, H.; Matsumoto, Y. Numerical Analysis of the Influence of the Tip Clearance Flows on the Unsteady Cavitating Flows in a Three-Dimensional Inducer. J. Hydrodyn. 2009, 21, 34–40. [Google Scholar] [CrossRef]
  24. Zhang, J.; Fan, H.; Zhang, W.; Xie, Z. Energy performance and flow characteristics of a multiphase pump with different tip clearance sizes. Adv. Mech. Eng. 2019, 11, 1–14. [Google Scholar] [CrossRef]
  25. Decaix, J.; Balarac, G.; Dreyer, M.; Farhat, M.; Munch, C. RANS and LES computations of the tip-leakage vortex for different gap widths. J. Turbul. 2015, 16, 309–341. [Google Scholar] [CrossRef]
  26. Decaix, J.; Dreyer, M.; Balarac, G.; Farhat, M.; Münch, C. RANS computations of a confined cavitating tip-leakage vortex. Eur. J. Mech.-B/Fluids 2018, 67, 198–210. [Google Scholar] [CrossRef] [Green Version]
  27. Gearhart, W.S. Tip clearance cavitation in shrouded underwater propulsors. J. Aircr. 1966, 3, 185–192. [Google Scholar] [CrossRef]
  28. Laborde, R.; Chantrel, P.; Mory, M. Tip Clearance and Tip Vortex Cavitation in an Axial Flow Pump. J. Fluids Eng. 1997, 119, 680–685. [Google Scholar] [CrossRef]
  29. Liu, Y.; Tan, L. Method of C groove on vortex suppression and energy performance improvement for a NACA0009 hydrofoil with tip clearance in tidal energy. Energy 2018, 155, 448–461. [Google Scholar] [CrossRef]
  30. Menter, F.R. Two-equation eddy-viscosity turbulence models for engineering applications. AIAA J. 1994, 32, 1598–1605. [Google Scholar] [CrossRef] [Green Version]
  31. Mishra, A.A.; Mukhopadhaya, J.; Iaccarino, G.; Alonso, J. Uncertainty estimation module for turbulence model predictions in SU2. AIAA J. 2018, 57, 1066–1077. [Google Scholar] [CrossRef]
  32. Ringwall, E. Aeroacoustic Sound Sources around the Wheels of a Passenger Car-A Computational Fluid Dynamics Study Using Steady State Models to Evaluate Main Sources of Flow Noise. Master’s Thesis, Department of Applied Mechanics Chalmers University of Technology, Gothenburg, Sweden, 2017. [Google Scholar]
Figure 1. Physical model of NACA0009 hydrofoil. (a) Isometric view. (b) The gap.
Energies 12 04066 g001
Figure 2. Sketch map of T-shape tip.
Energies 12 04066 g002
Figure 3. Proposed T-shape tips. (a) M0; (b) MPT; (c) MST; (d) MT.
Energies 12 04066 g003
Figure 4. Mesh arrangement. (a) Grids on hydrofoil; (b) Local mesh refinement.
Energies 12 04066 g004
Figure 5. Comparison of experimental TLV trajectory [17] and numerical simulations. (a) Experimental results [17]; (b) Numerical results.
Energies 12 04066 g005
Figure 6. Comparison of the axial velocity contour at cut-plane of y/c = 1 between experiment [17] and numerical simulations. (a) Experimental results [17]; (b) Numerical results.
Energies 12 04066 g006
Figure 7. Energy performance of foil for different configurations.
Energies 12 04066 g007
Figure 8. Iso-surface showing TLV at Q = 3 × 10⁷ s−2.
Energies 12 04066 g008
Figure 9. The TLV pattern and trajectory of the case MST (Q = 3 × 10⁶ s−2).
Energies 12 04066 g009
Figure 10. Pressure and vorticity distribution on planes 1–5 with different tip shapes.
Energies 12 04066 g010
Figure 11. Curle surface acoustic power (SAP) of the hydrofoil for different T-shape tips.
Energies 12 04066 g011
Figure 12. Proudman AP on five cut-planes.
Energies 12 04066 g012
Figure 13. Isosurfaces showing Proudman AP sound sources at 50 dB.
Energies 12 04066 g013
Figure 14. Isosurfaces showing Proudman AP sound sources at 55 dB.
Energies 12 04066 g014
Table 1. Mesh independence.
ItemsElementsCDCL
Mesh 127152860.3071.233
Mesh 255008330.231.246
Mesh 368995380.231.246
Table 2. Curle SAP for different schemes.
Scheme ItemMPTMSTMT
ΔSAP% (Hydrofoil)Maximum SAP−2.640.03−3.03
Average SAP−0.50−0.04−0.97
ΔSAP% (Tip)Maximum SAP−2.11−0.81−4.75
Average SAP−1.920.33−1.74
ΔSAP% (Side wall)Maximum SAP0.20−0.39−0.43
Average SAP−0.12−0.01−0.12

