Wave-to-Wire Model Development and Validation for Two OWC Type Wave Energy Converters


Abstract
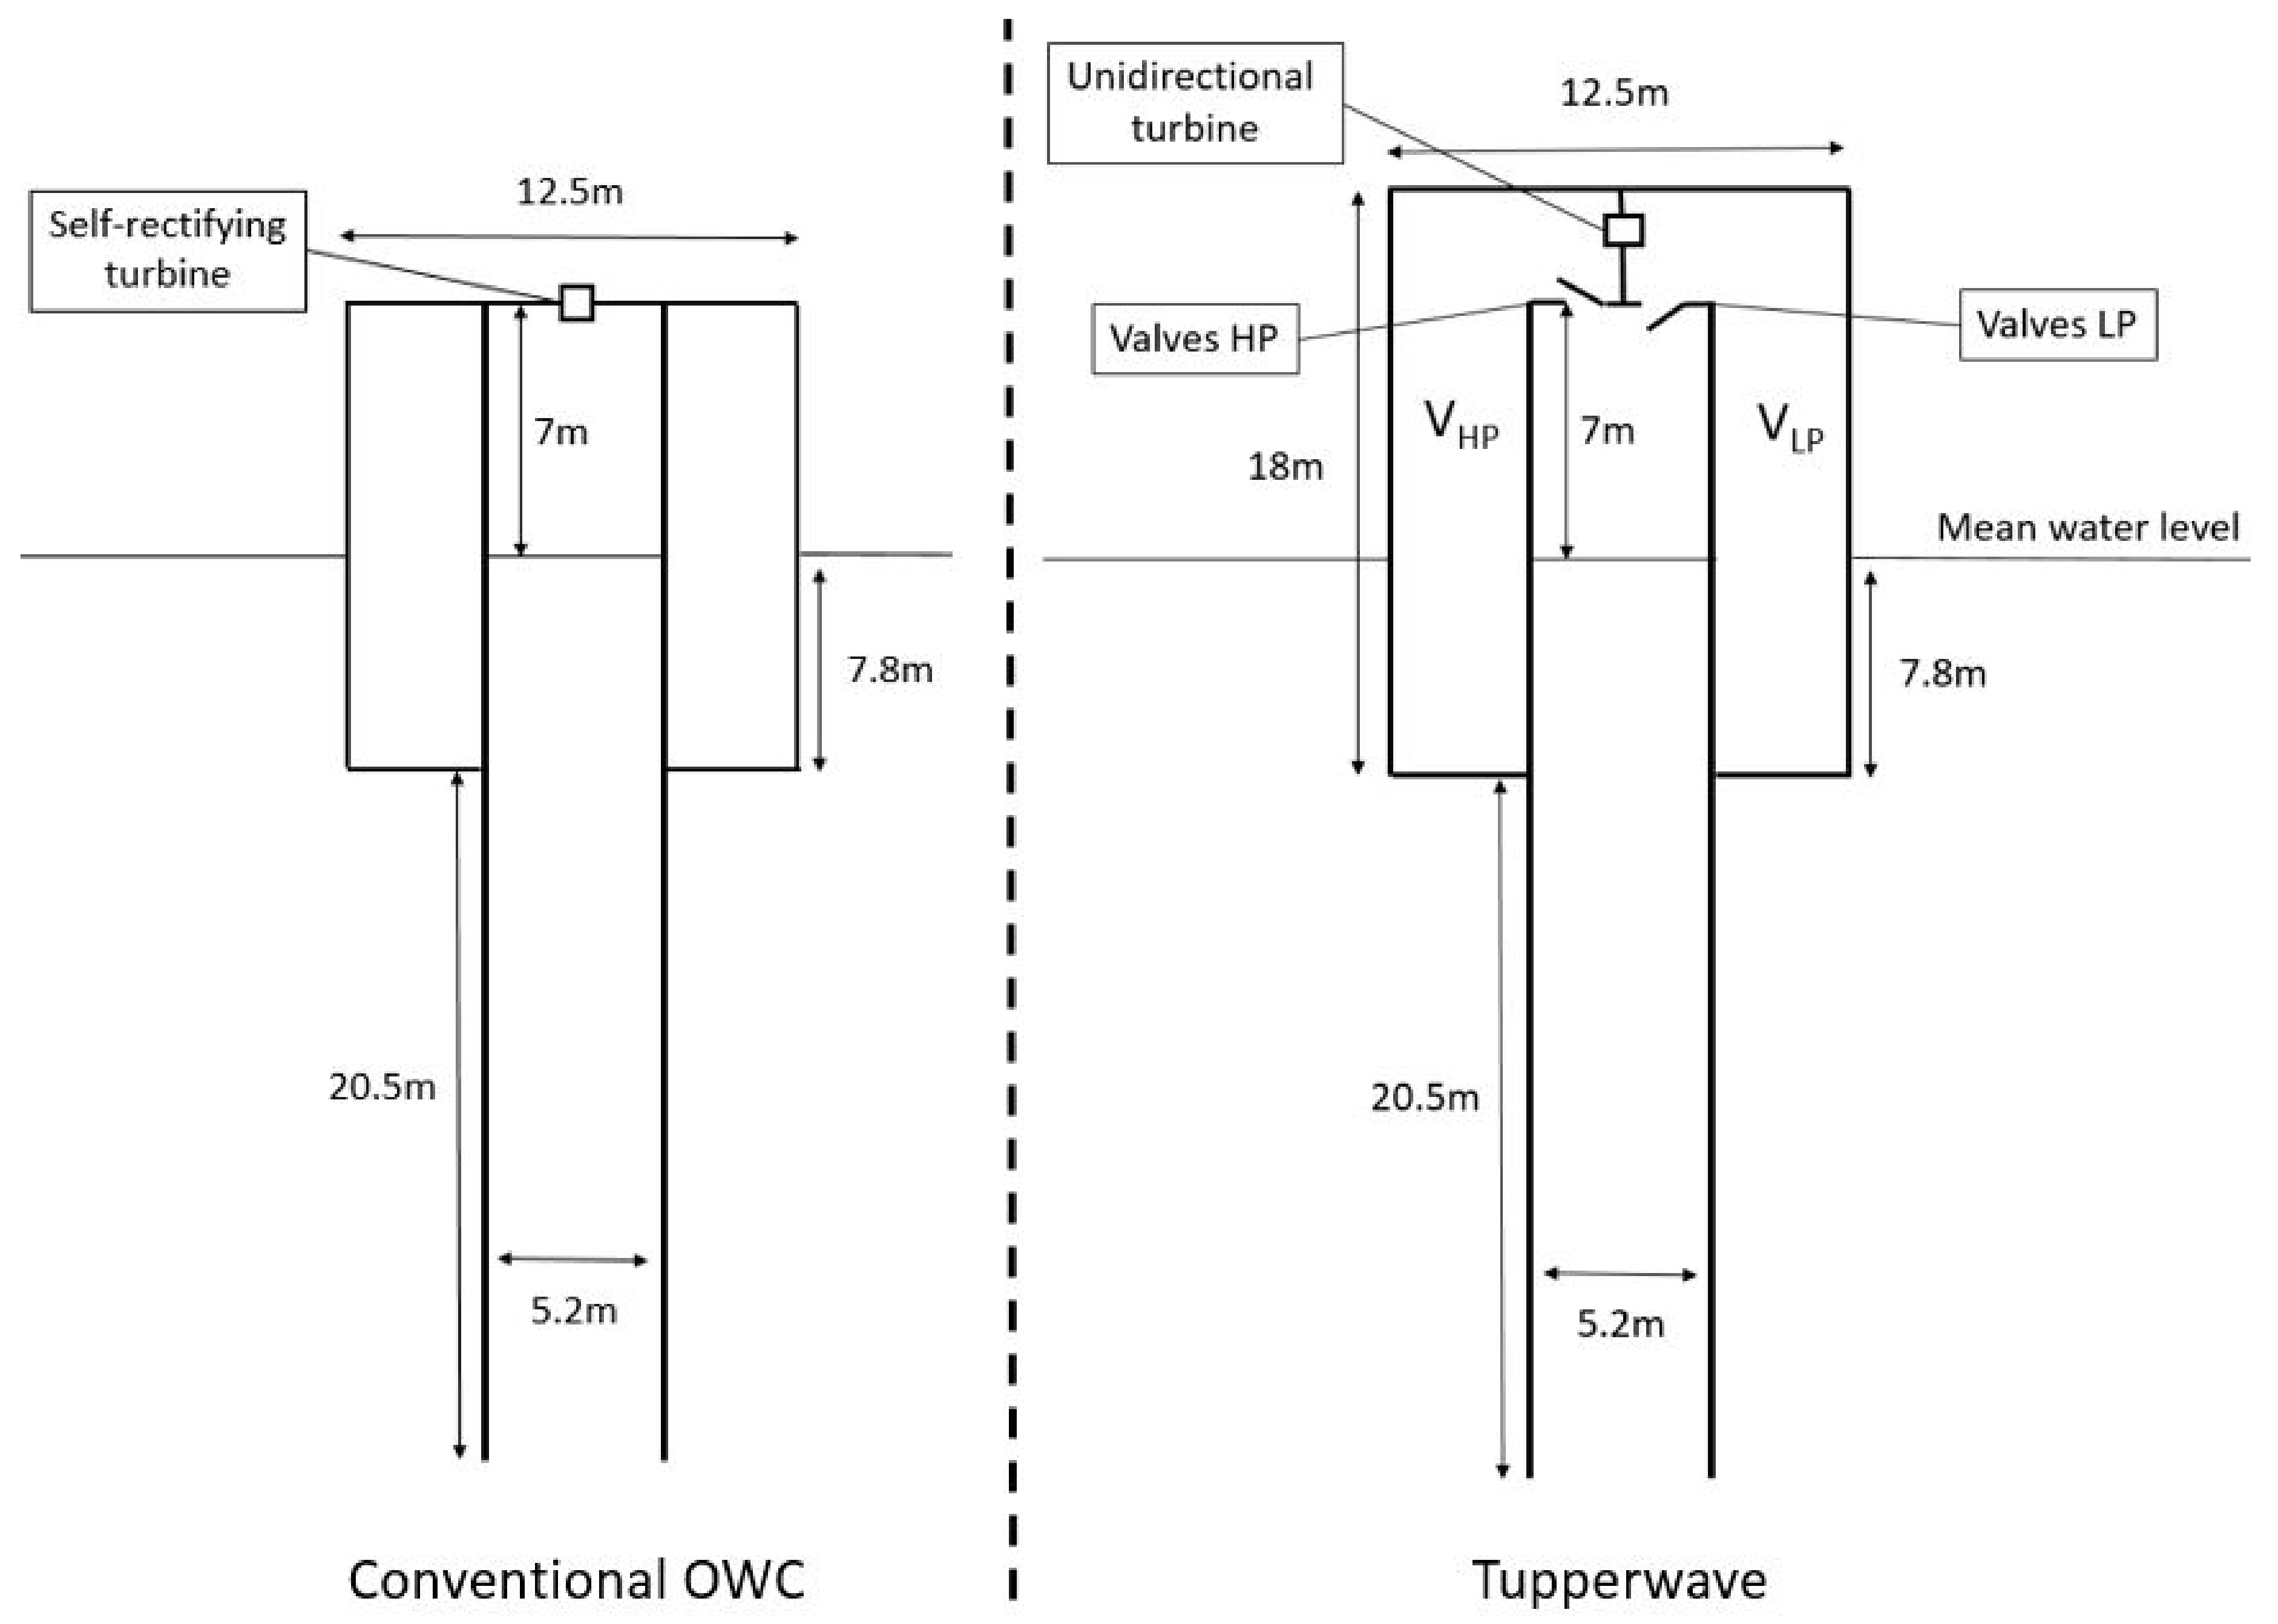
1. Introduction
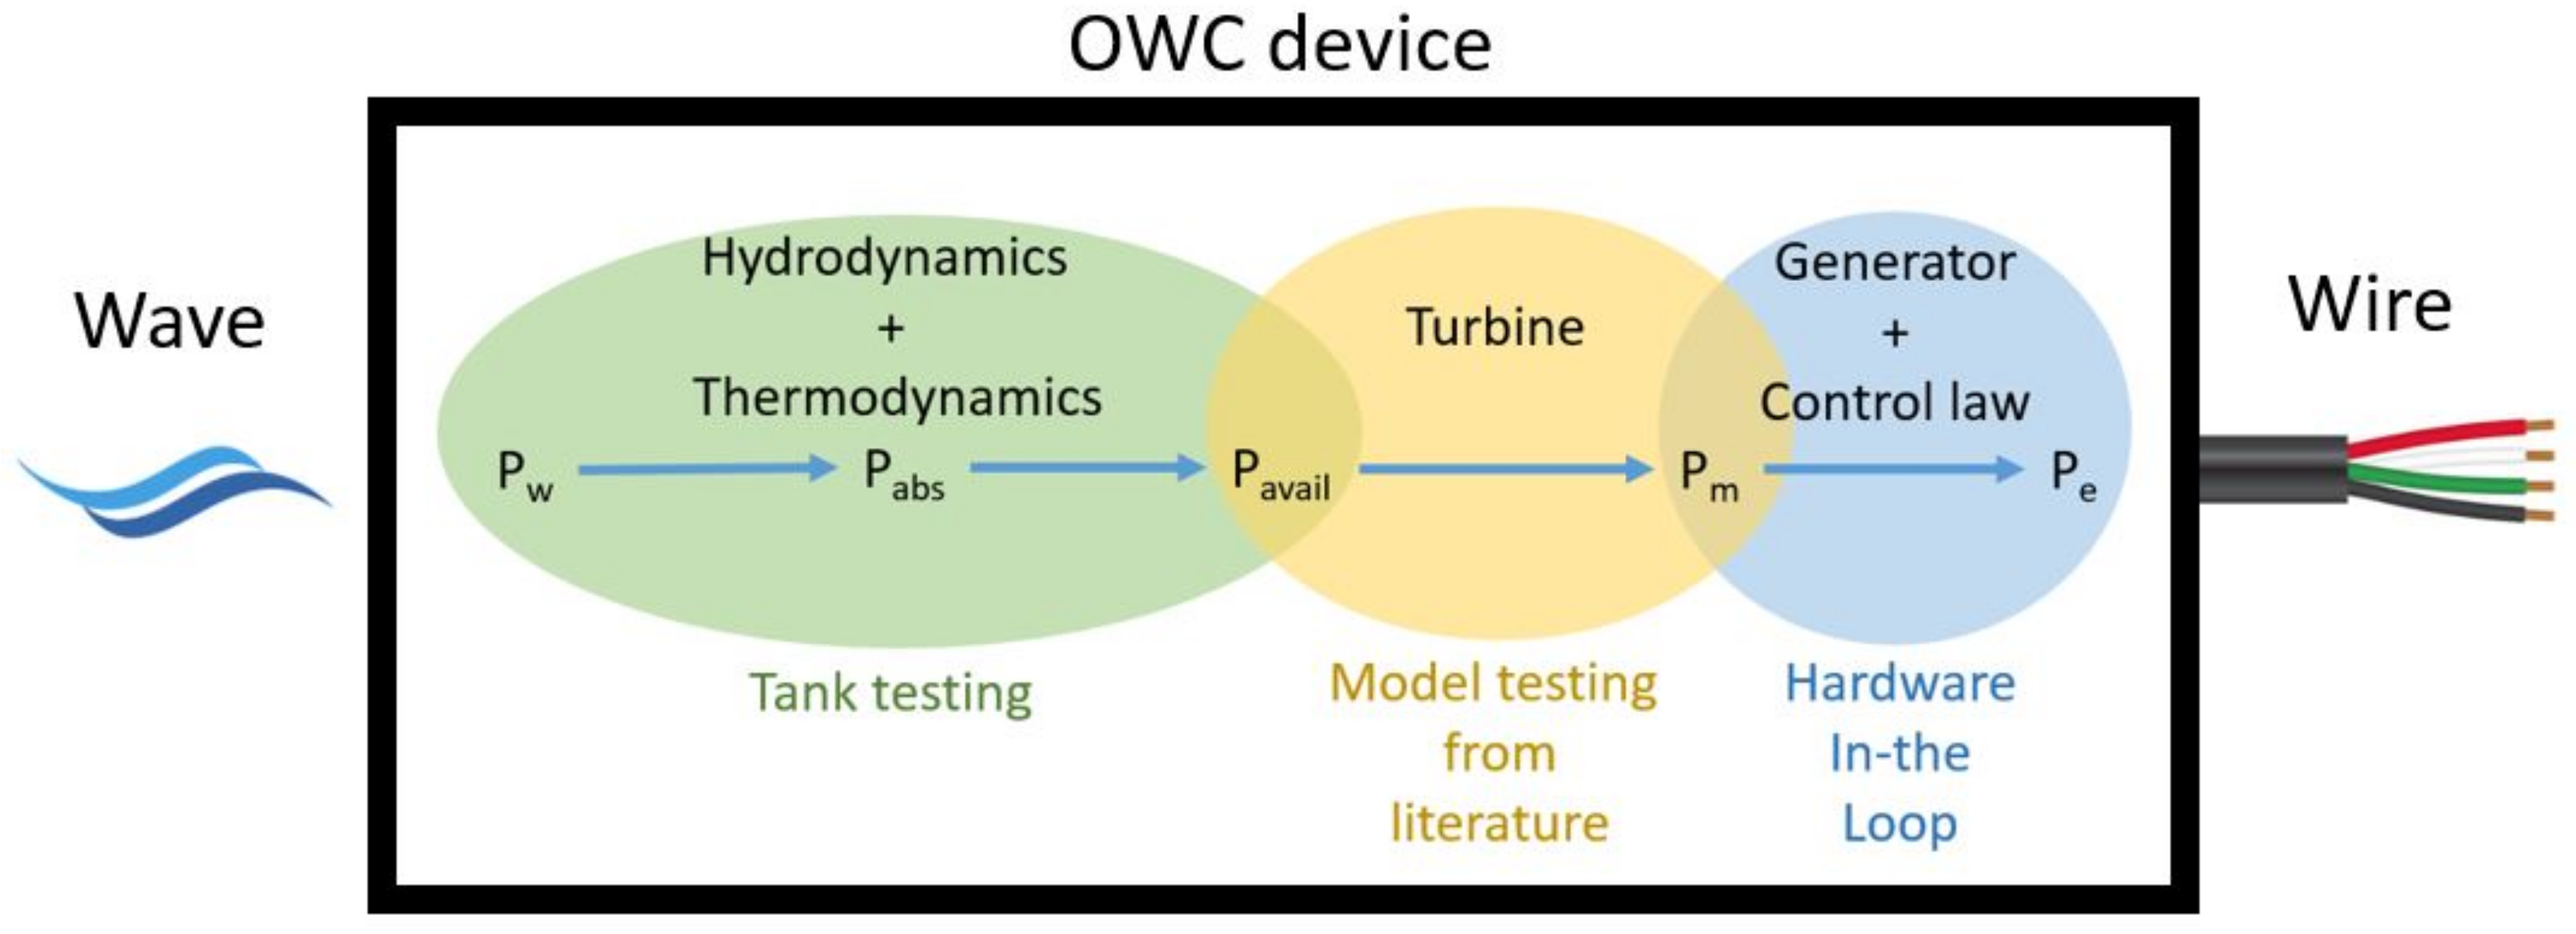
2. Wave-to-Wire Models
2.1. Hydrodynamics
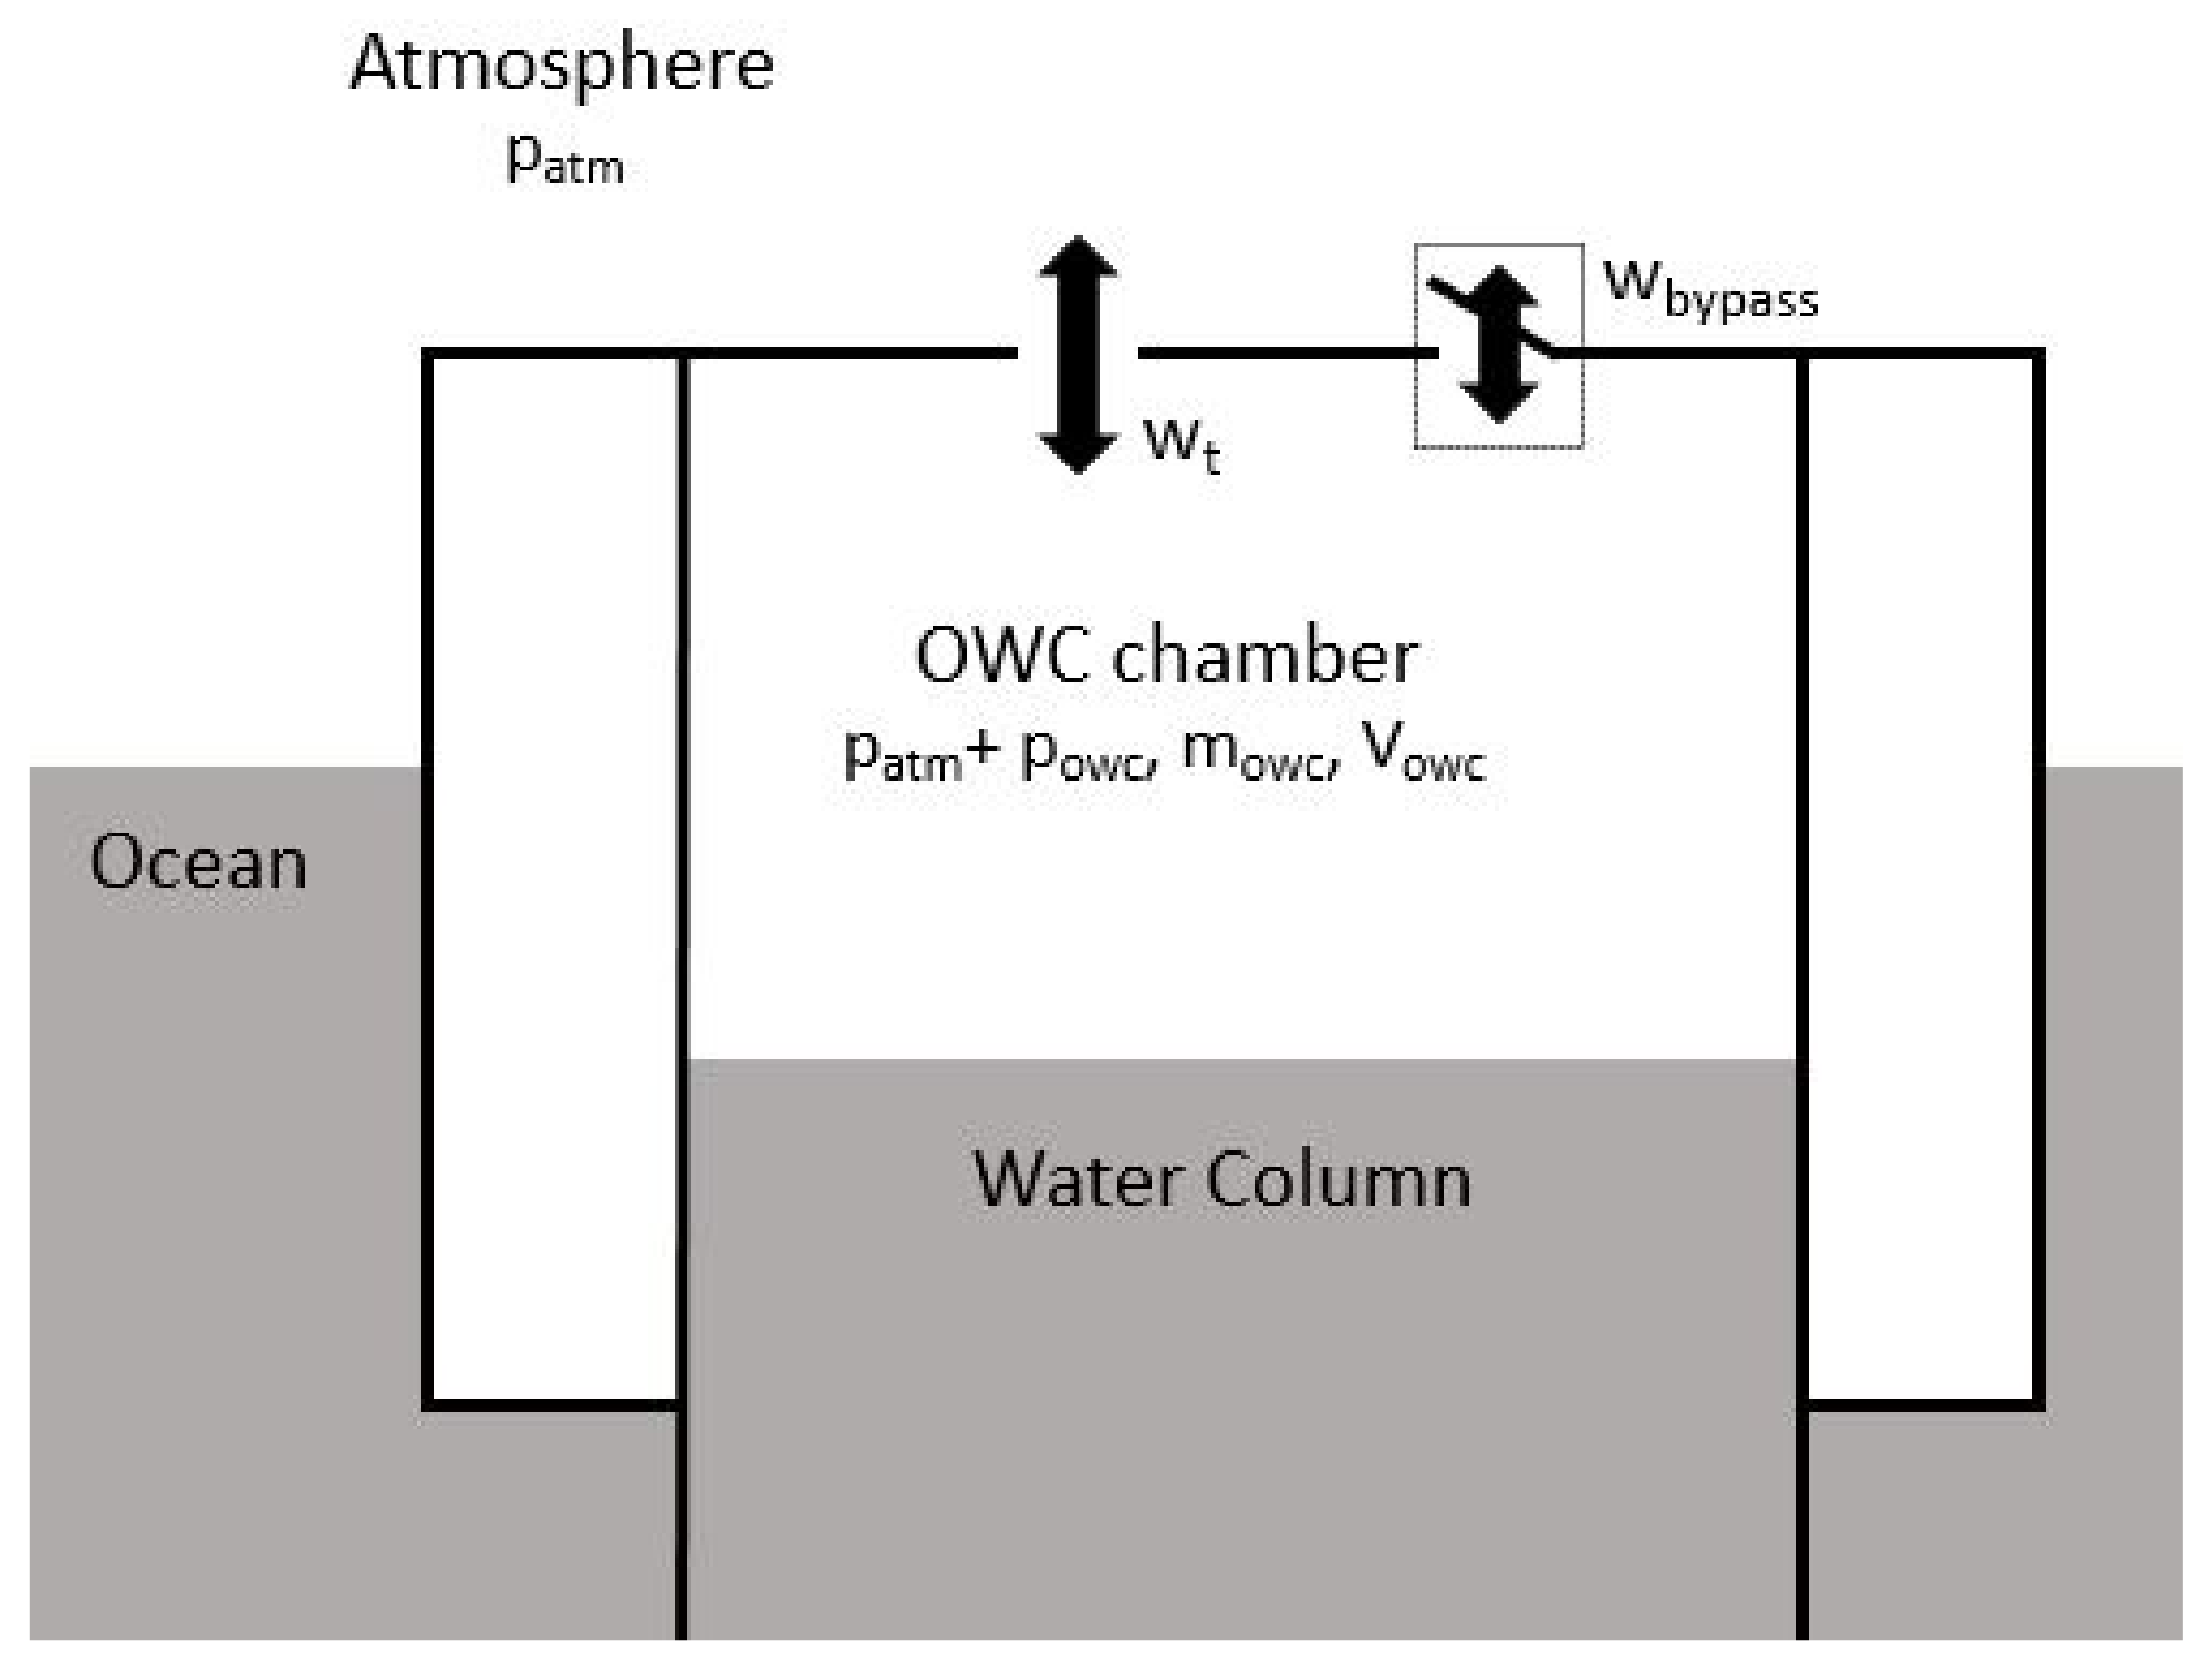
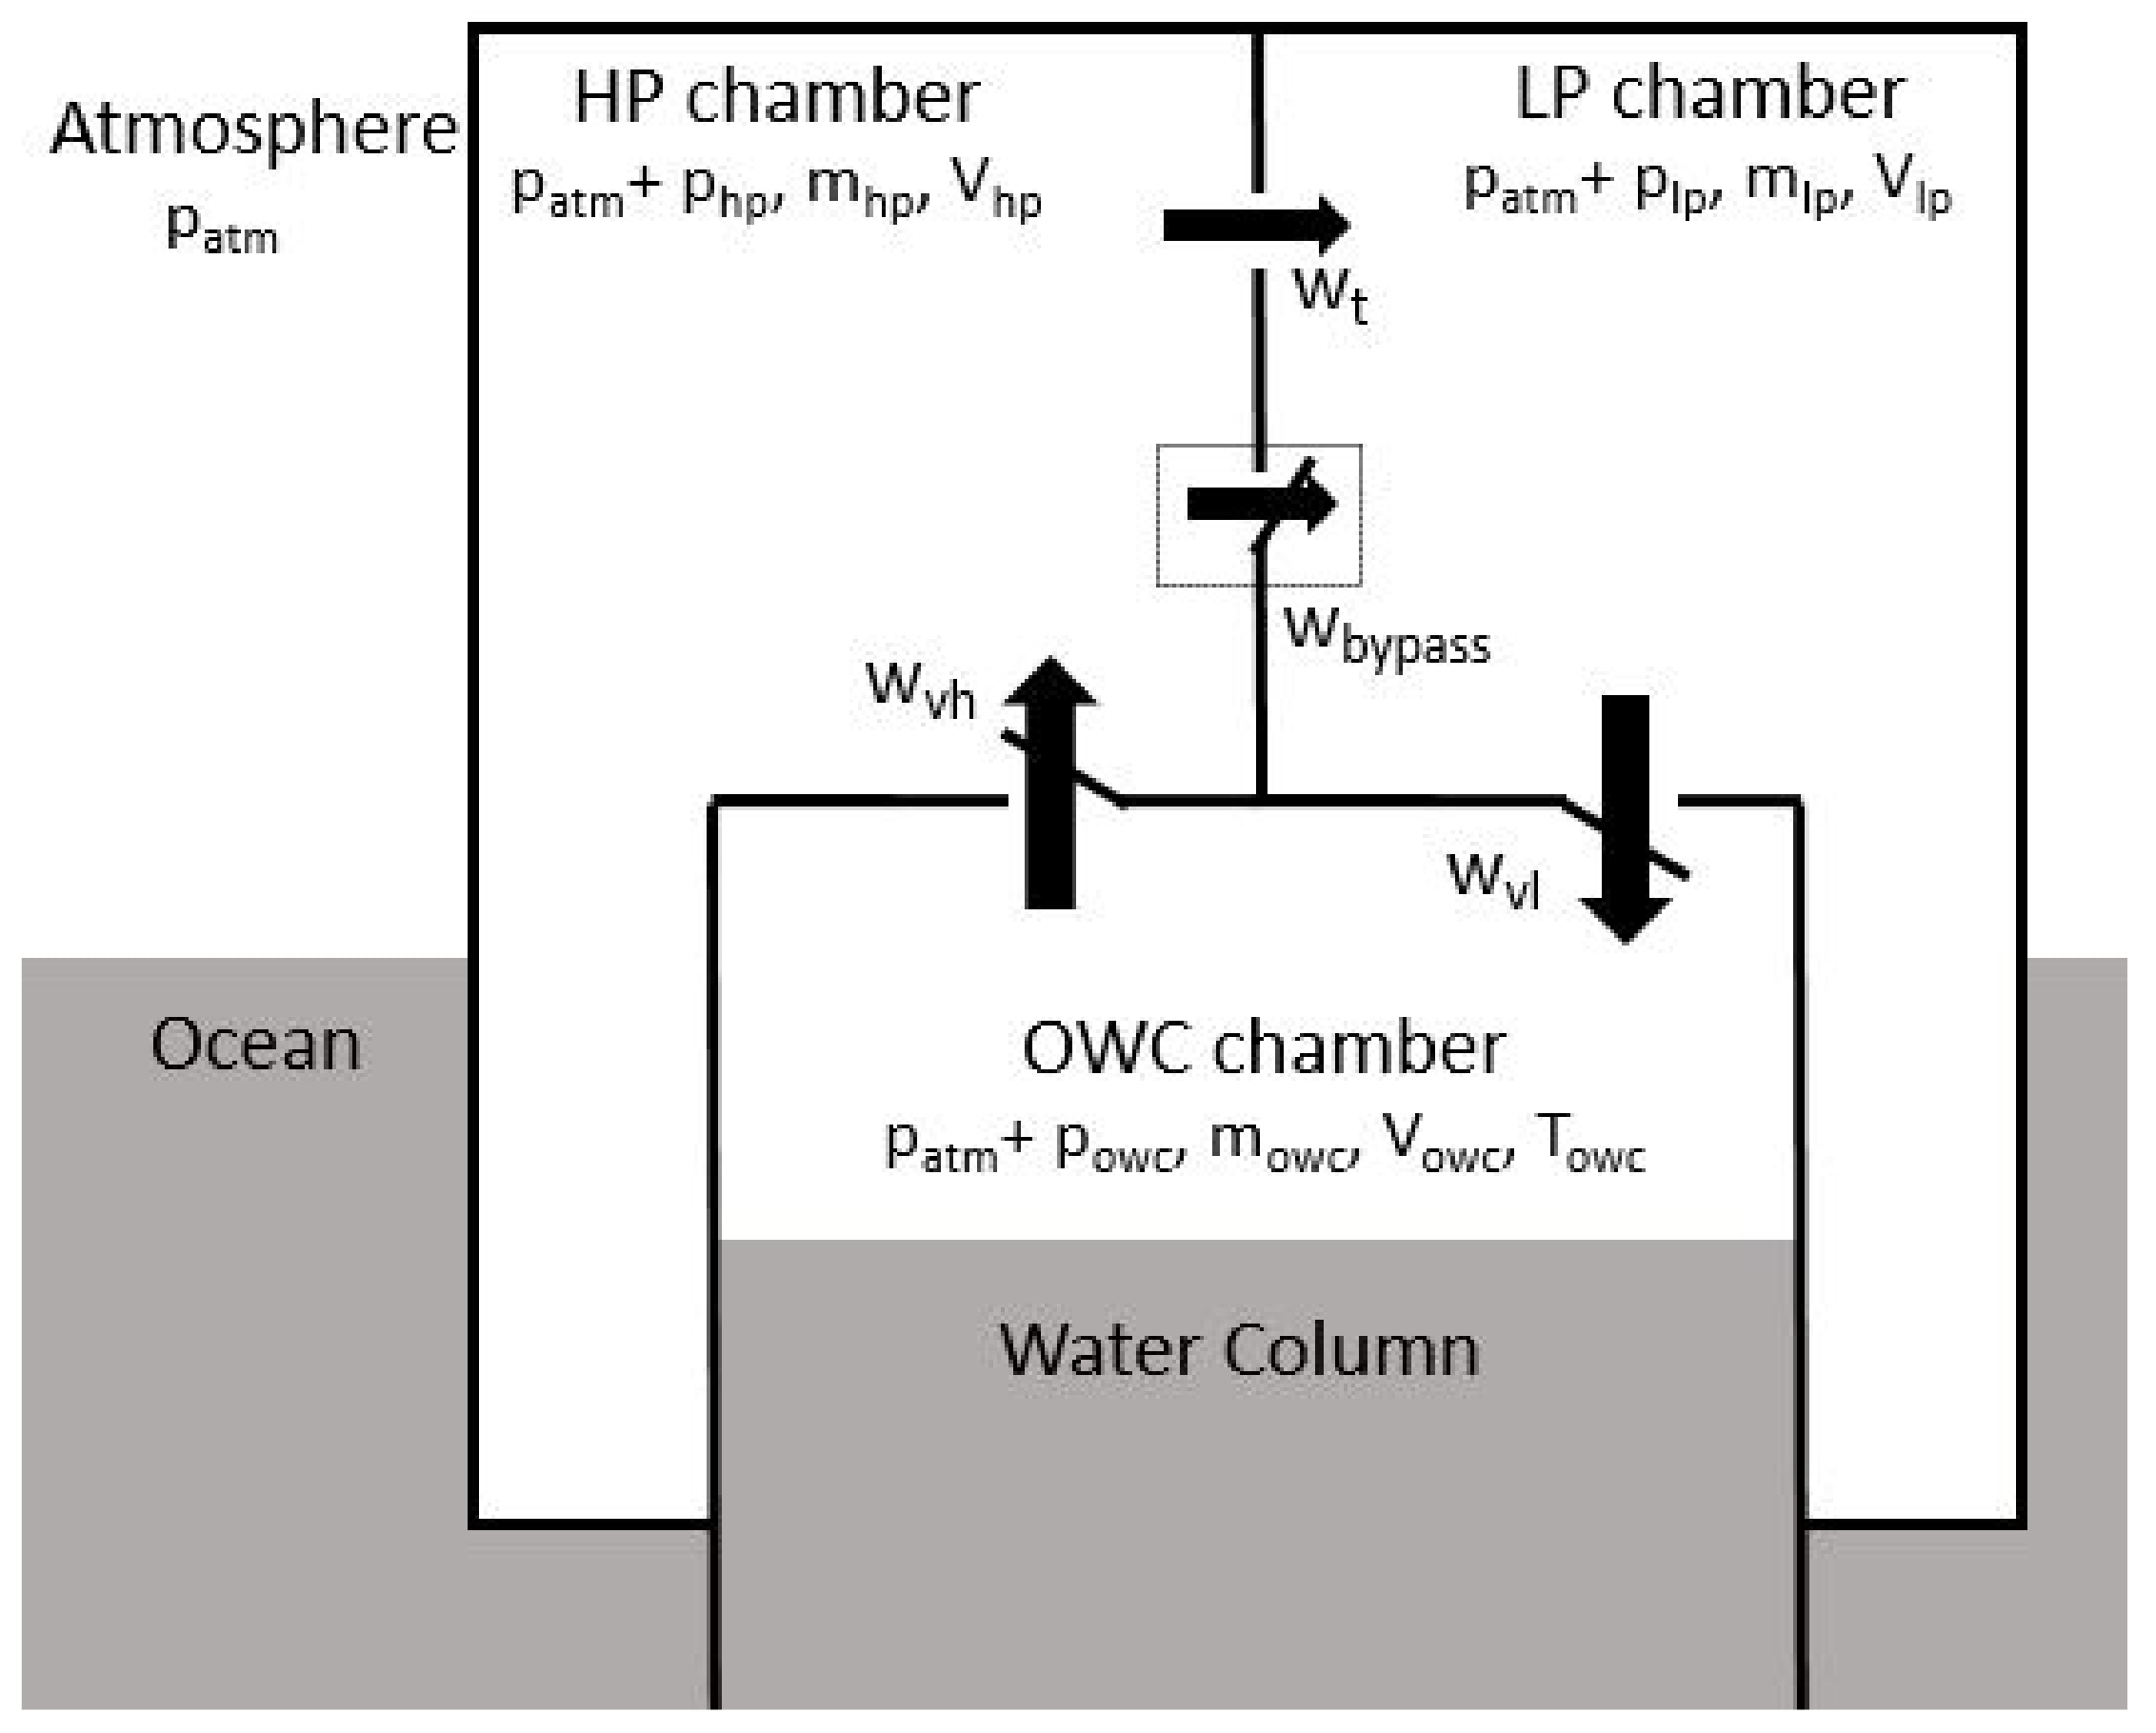
2.2. Thermodynamics
2.3. Tupperwave Non-Return Valves
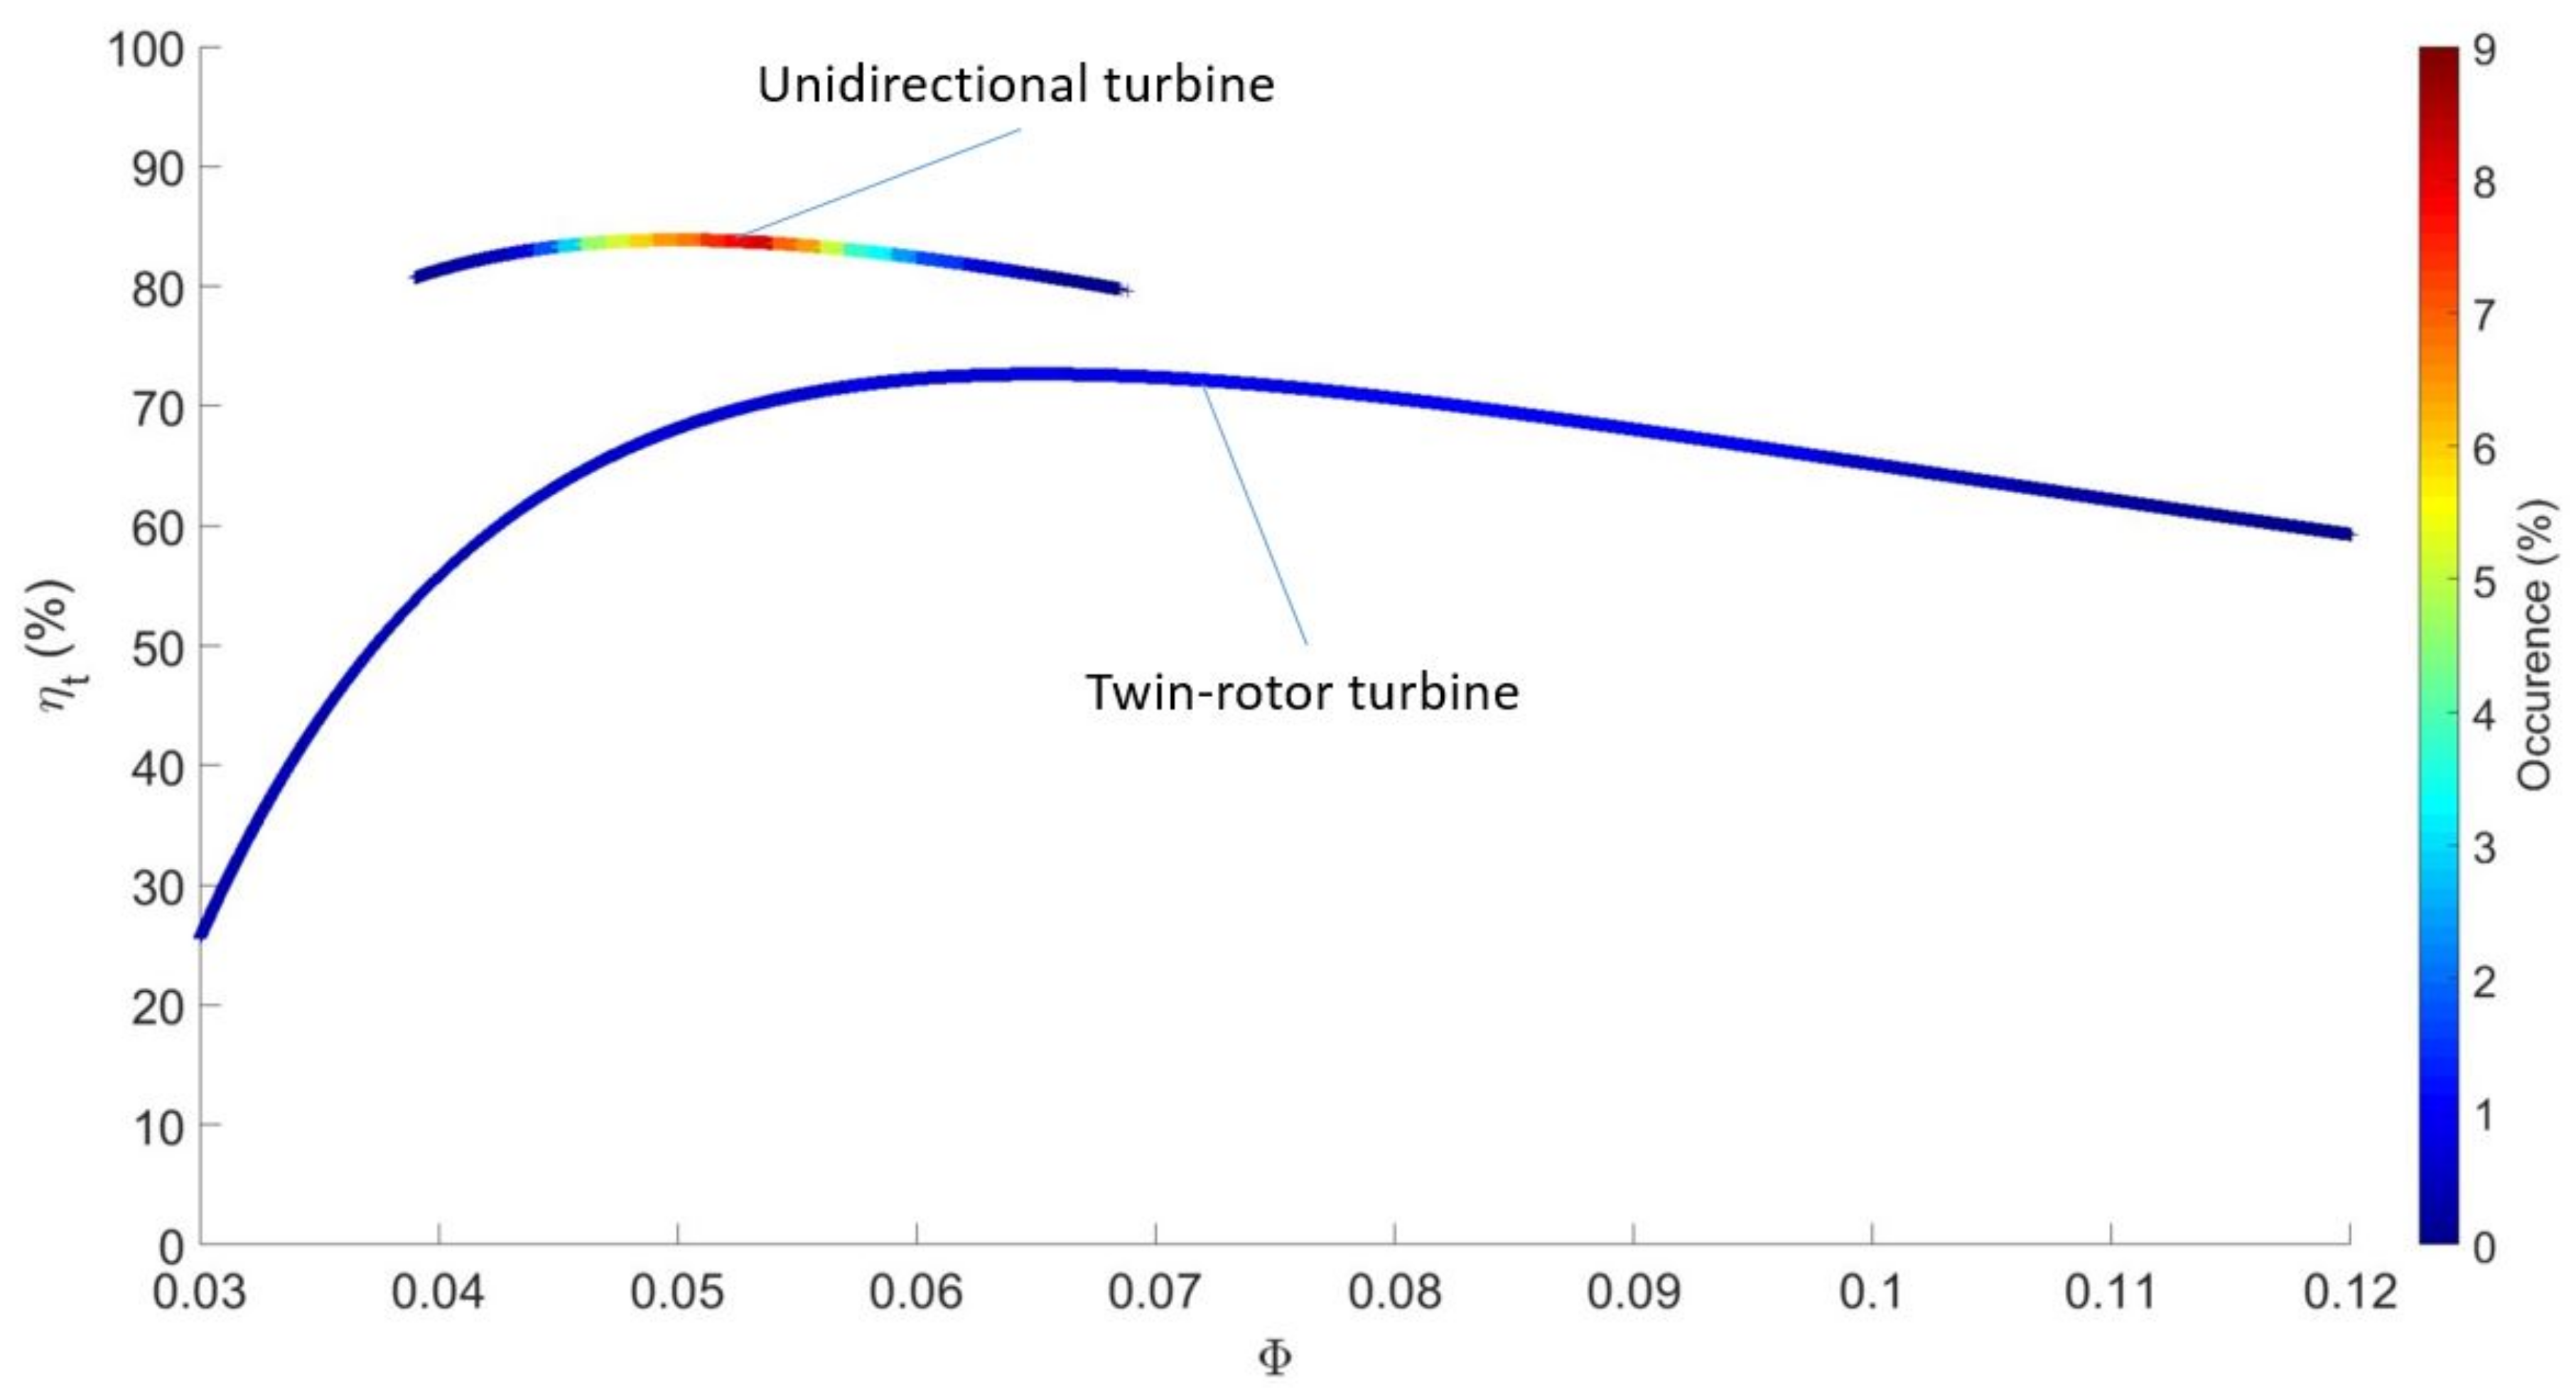
2.4. Turbine Model
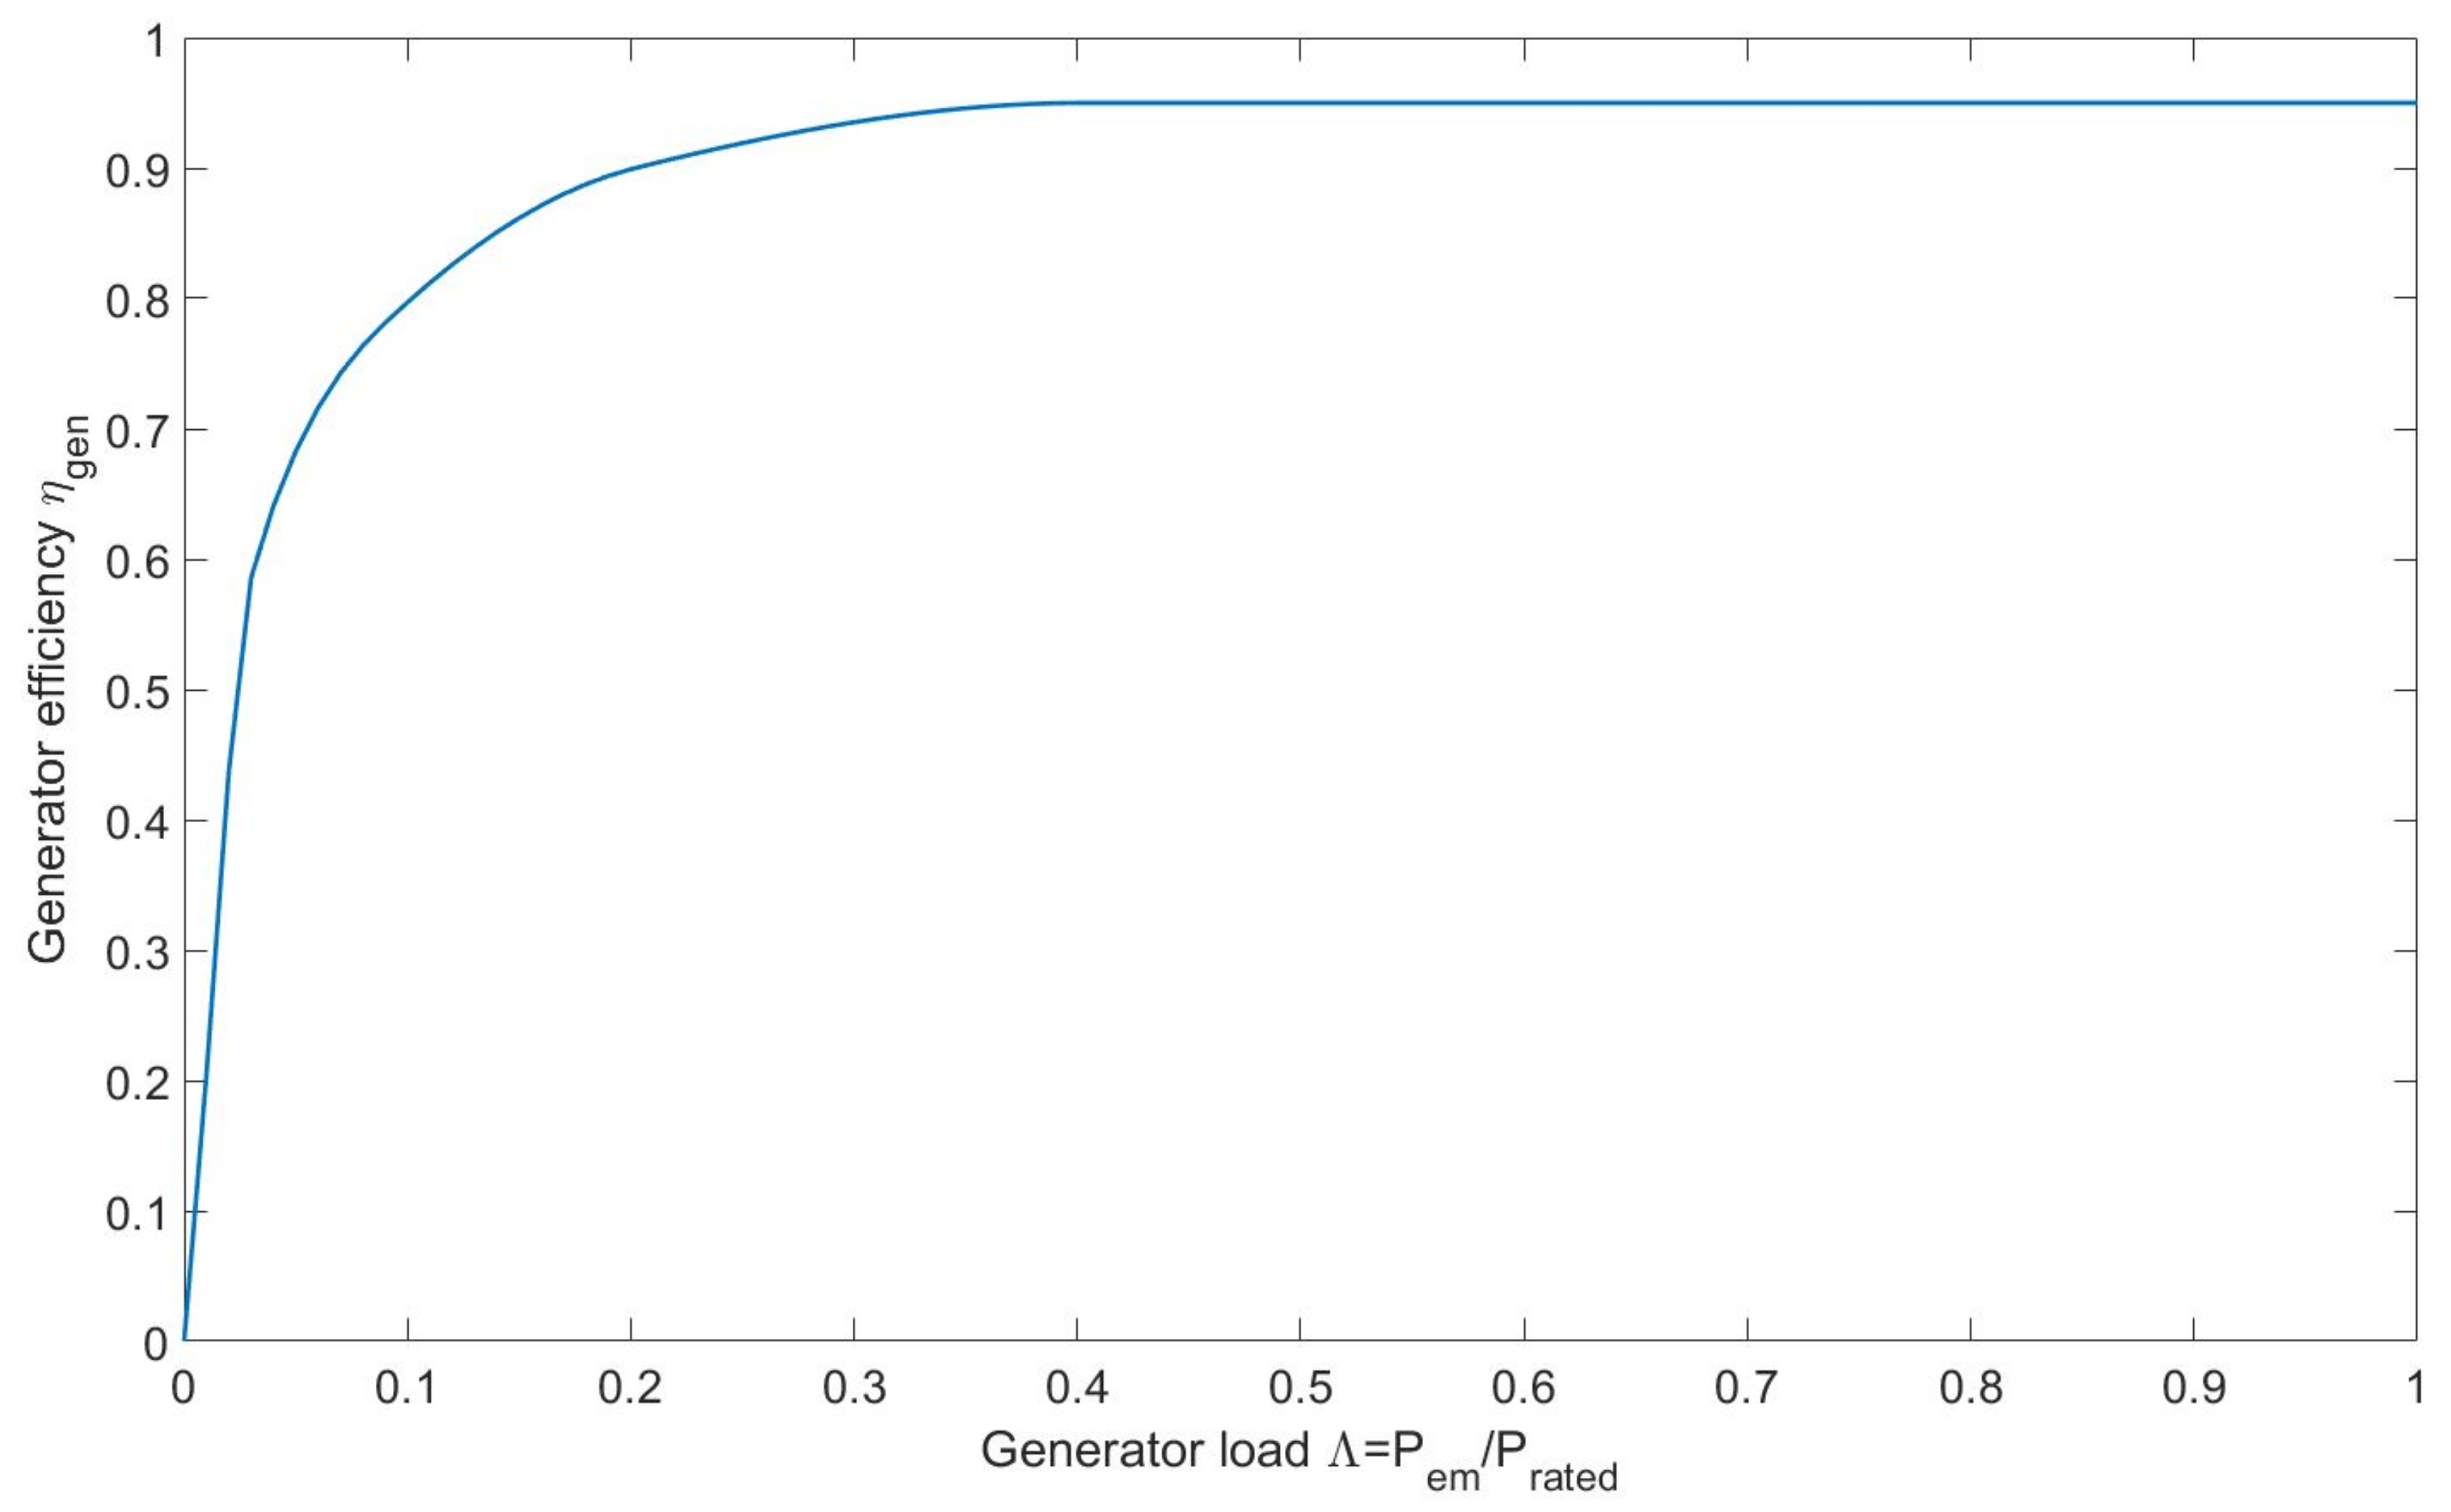
2.5. Generator Model, Bypass Valve and Control Law
2.6. Numerical Integration
3. Turbine-Generator Systems Dimensioning
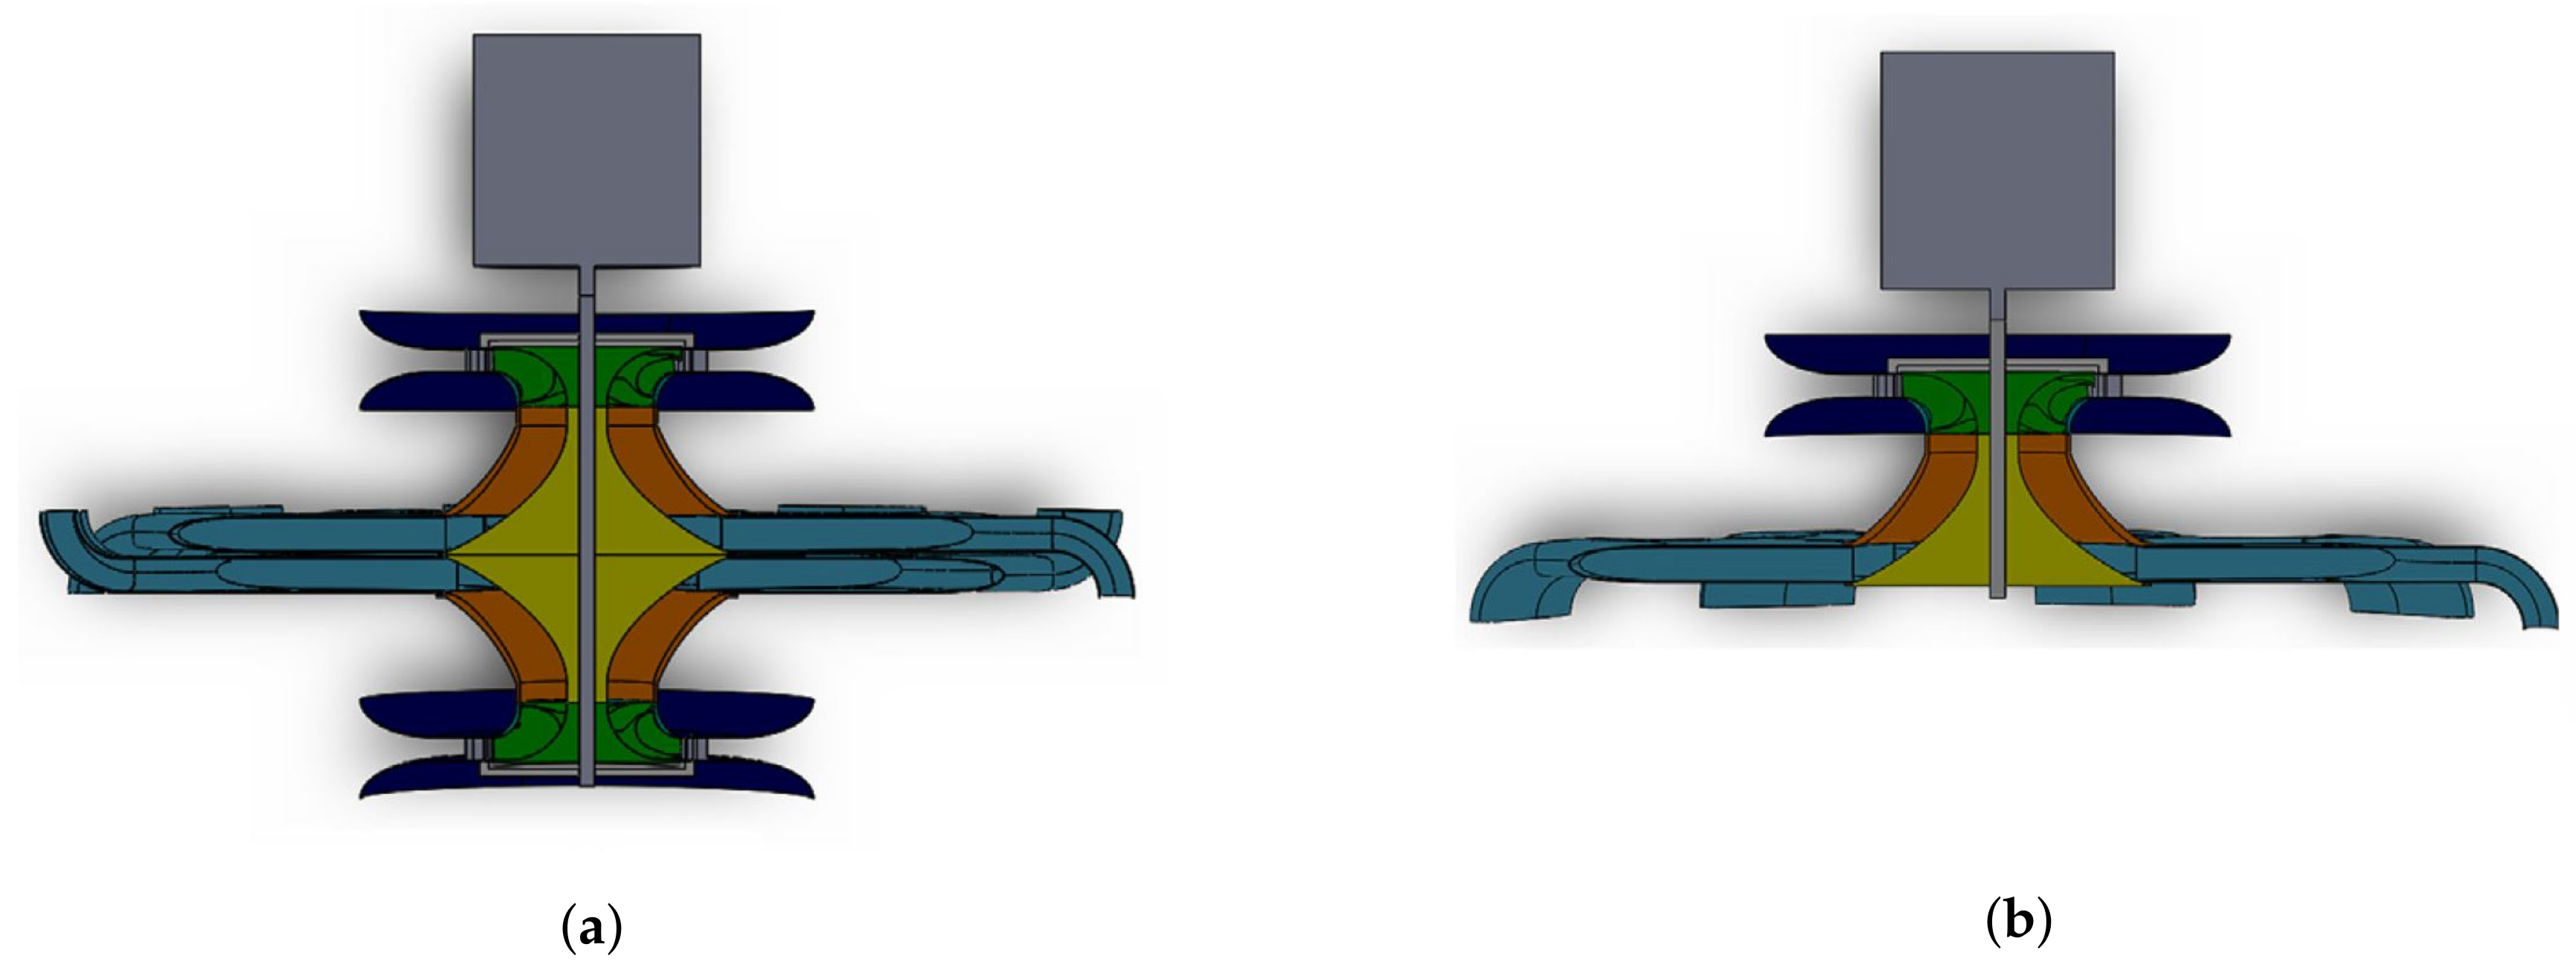
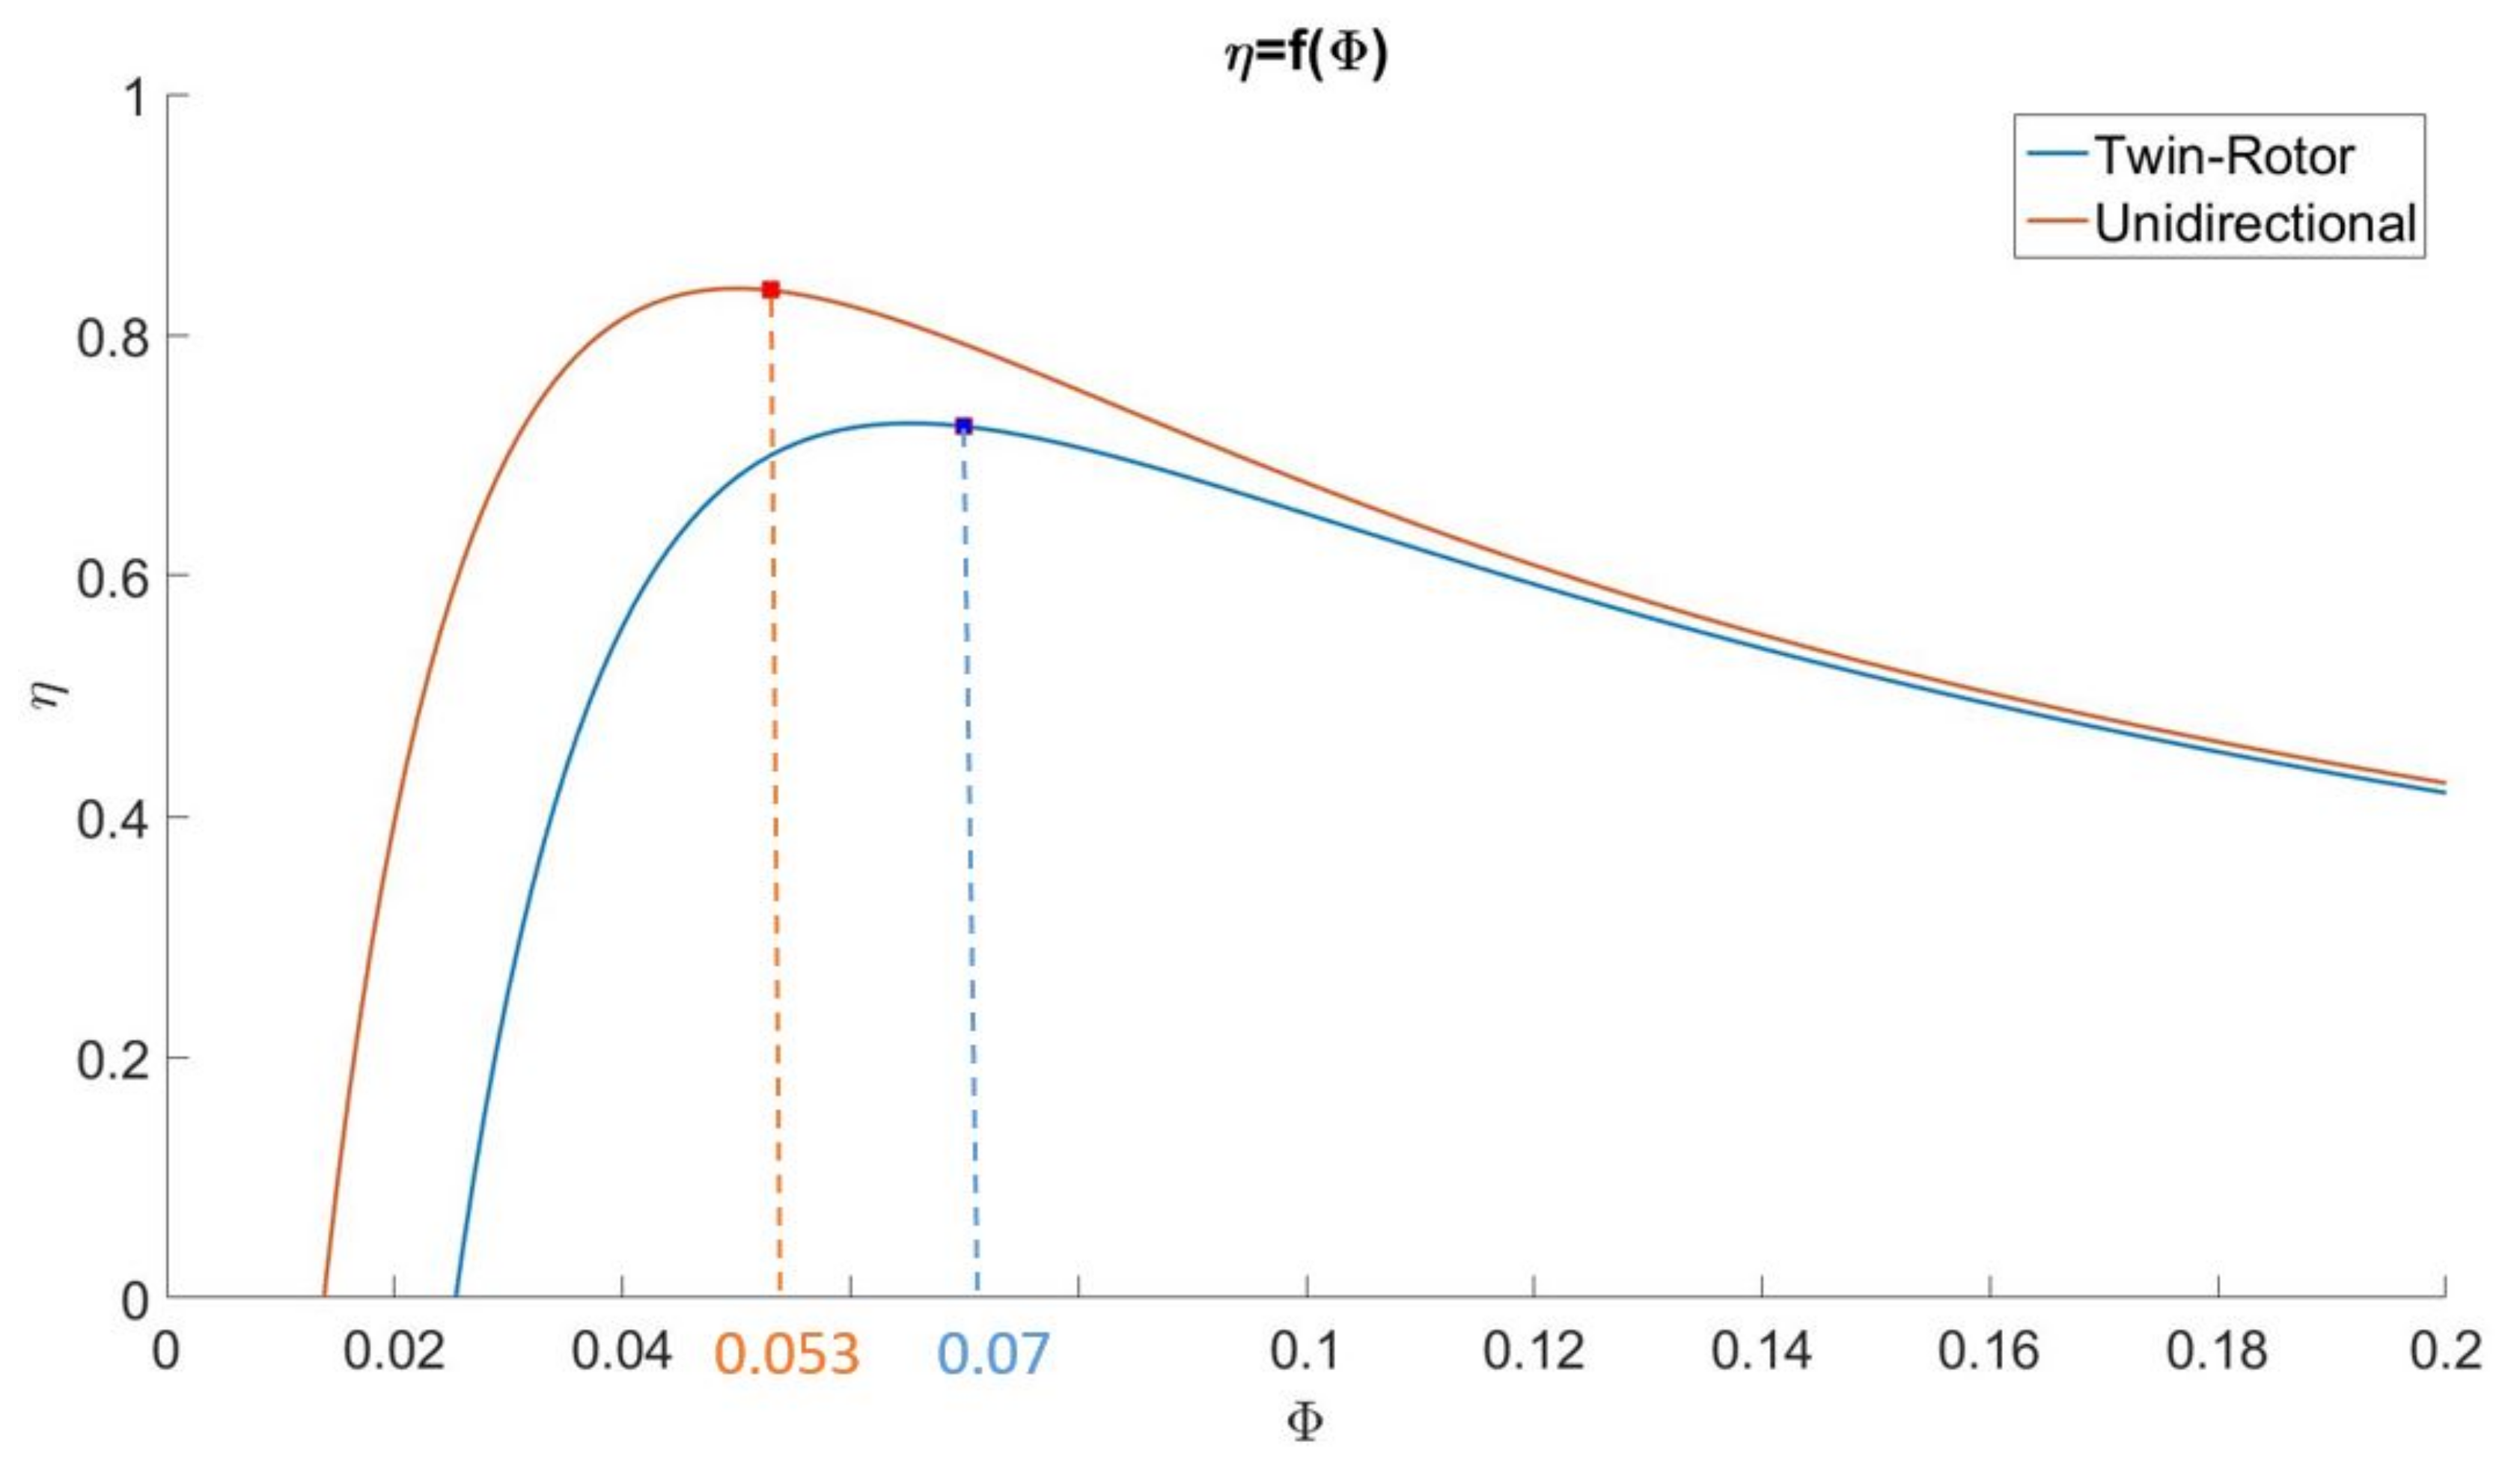
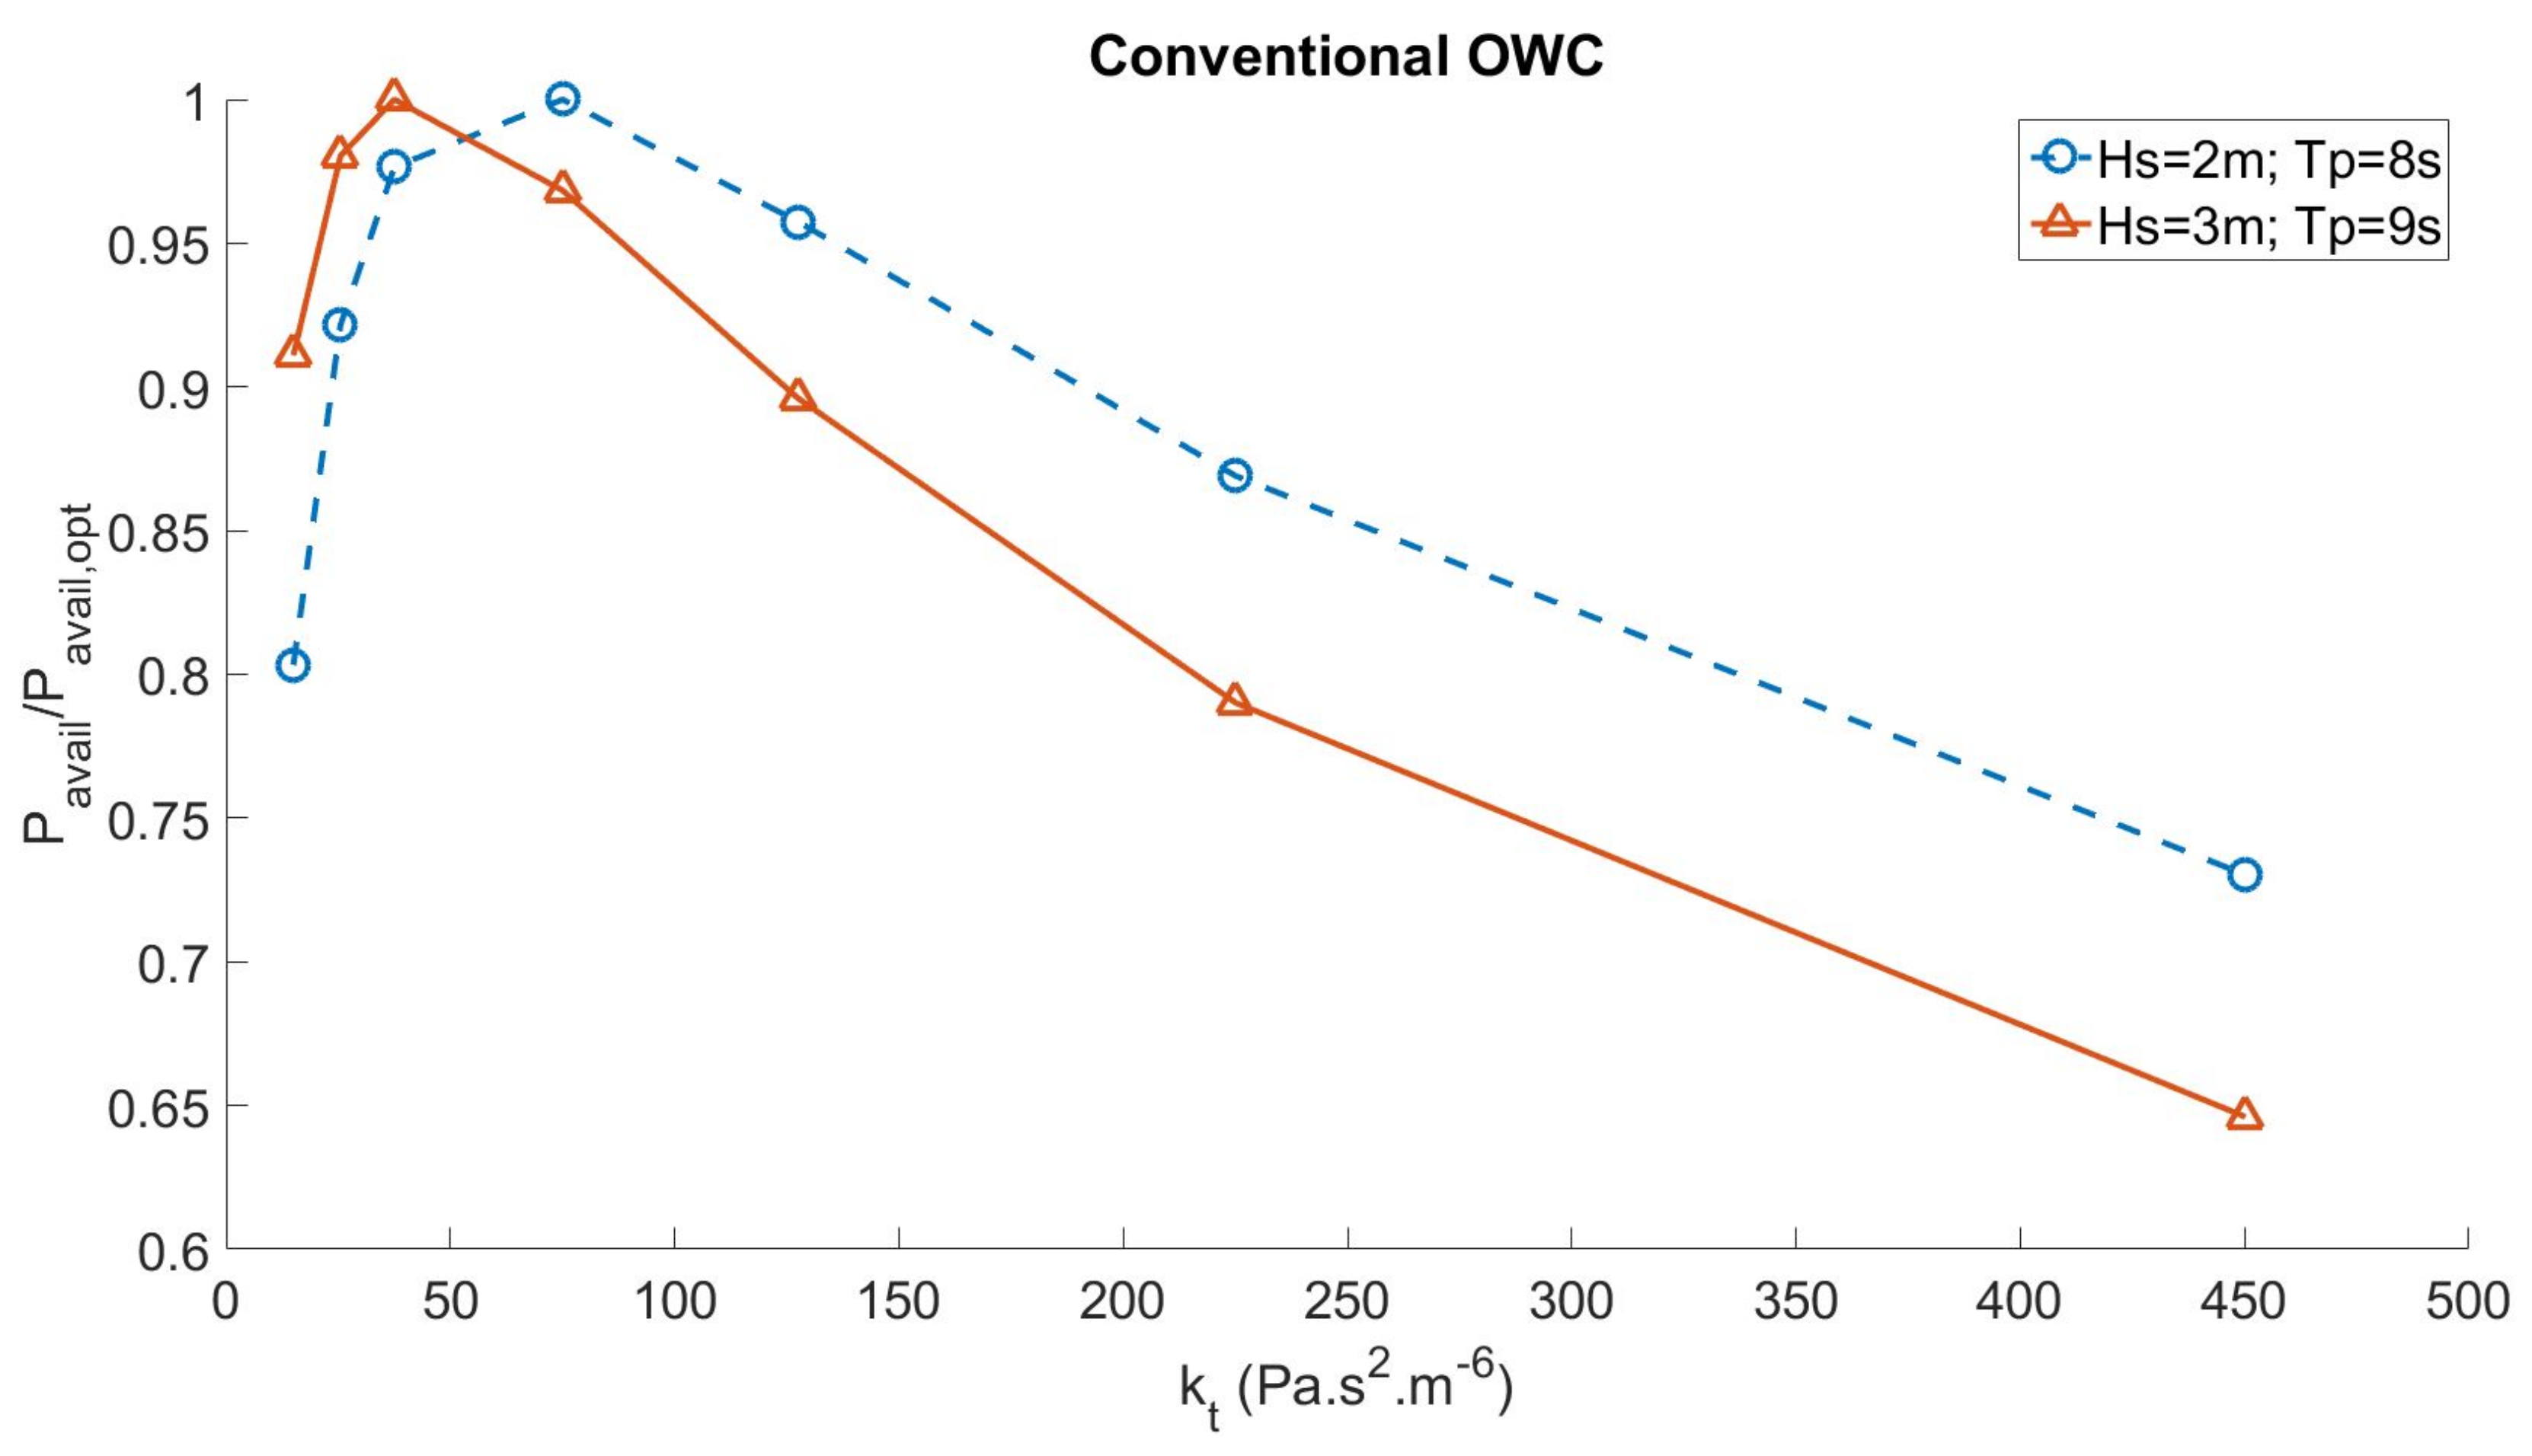
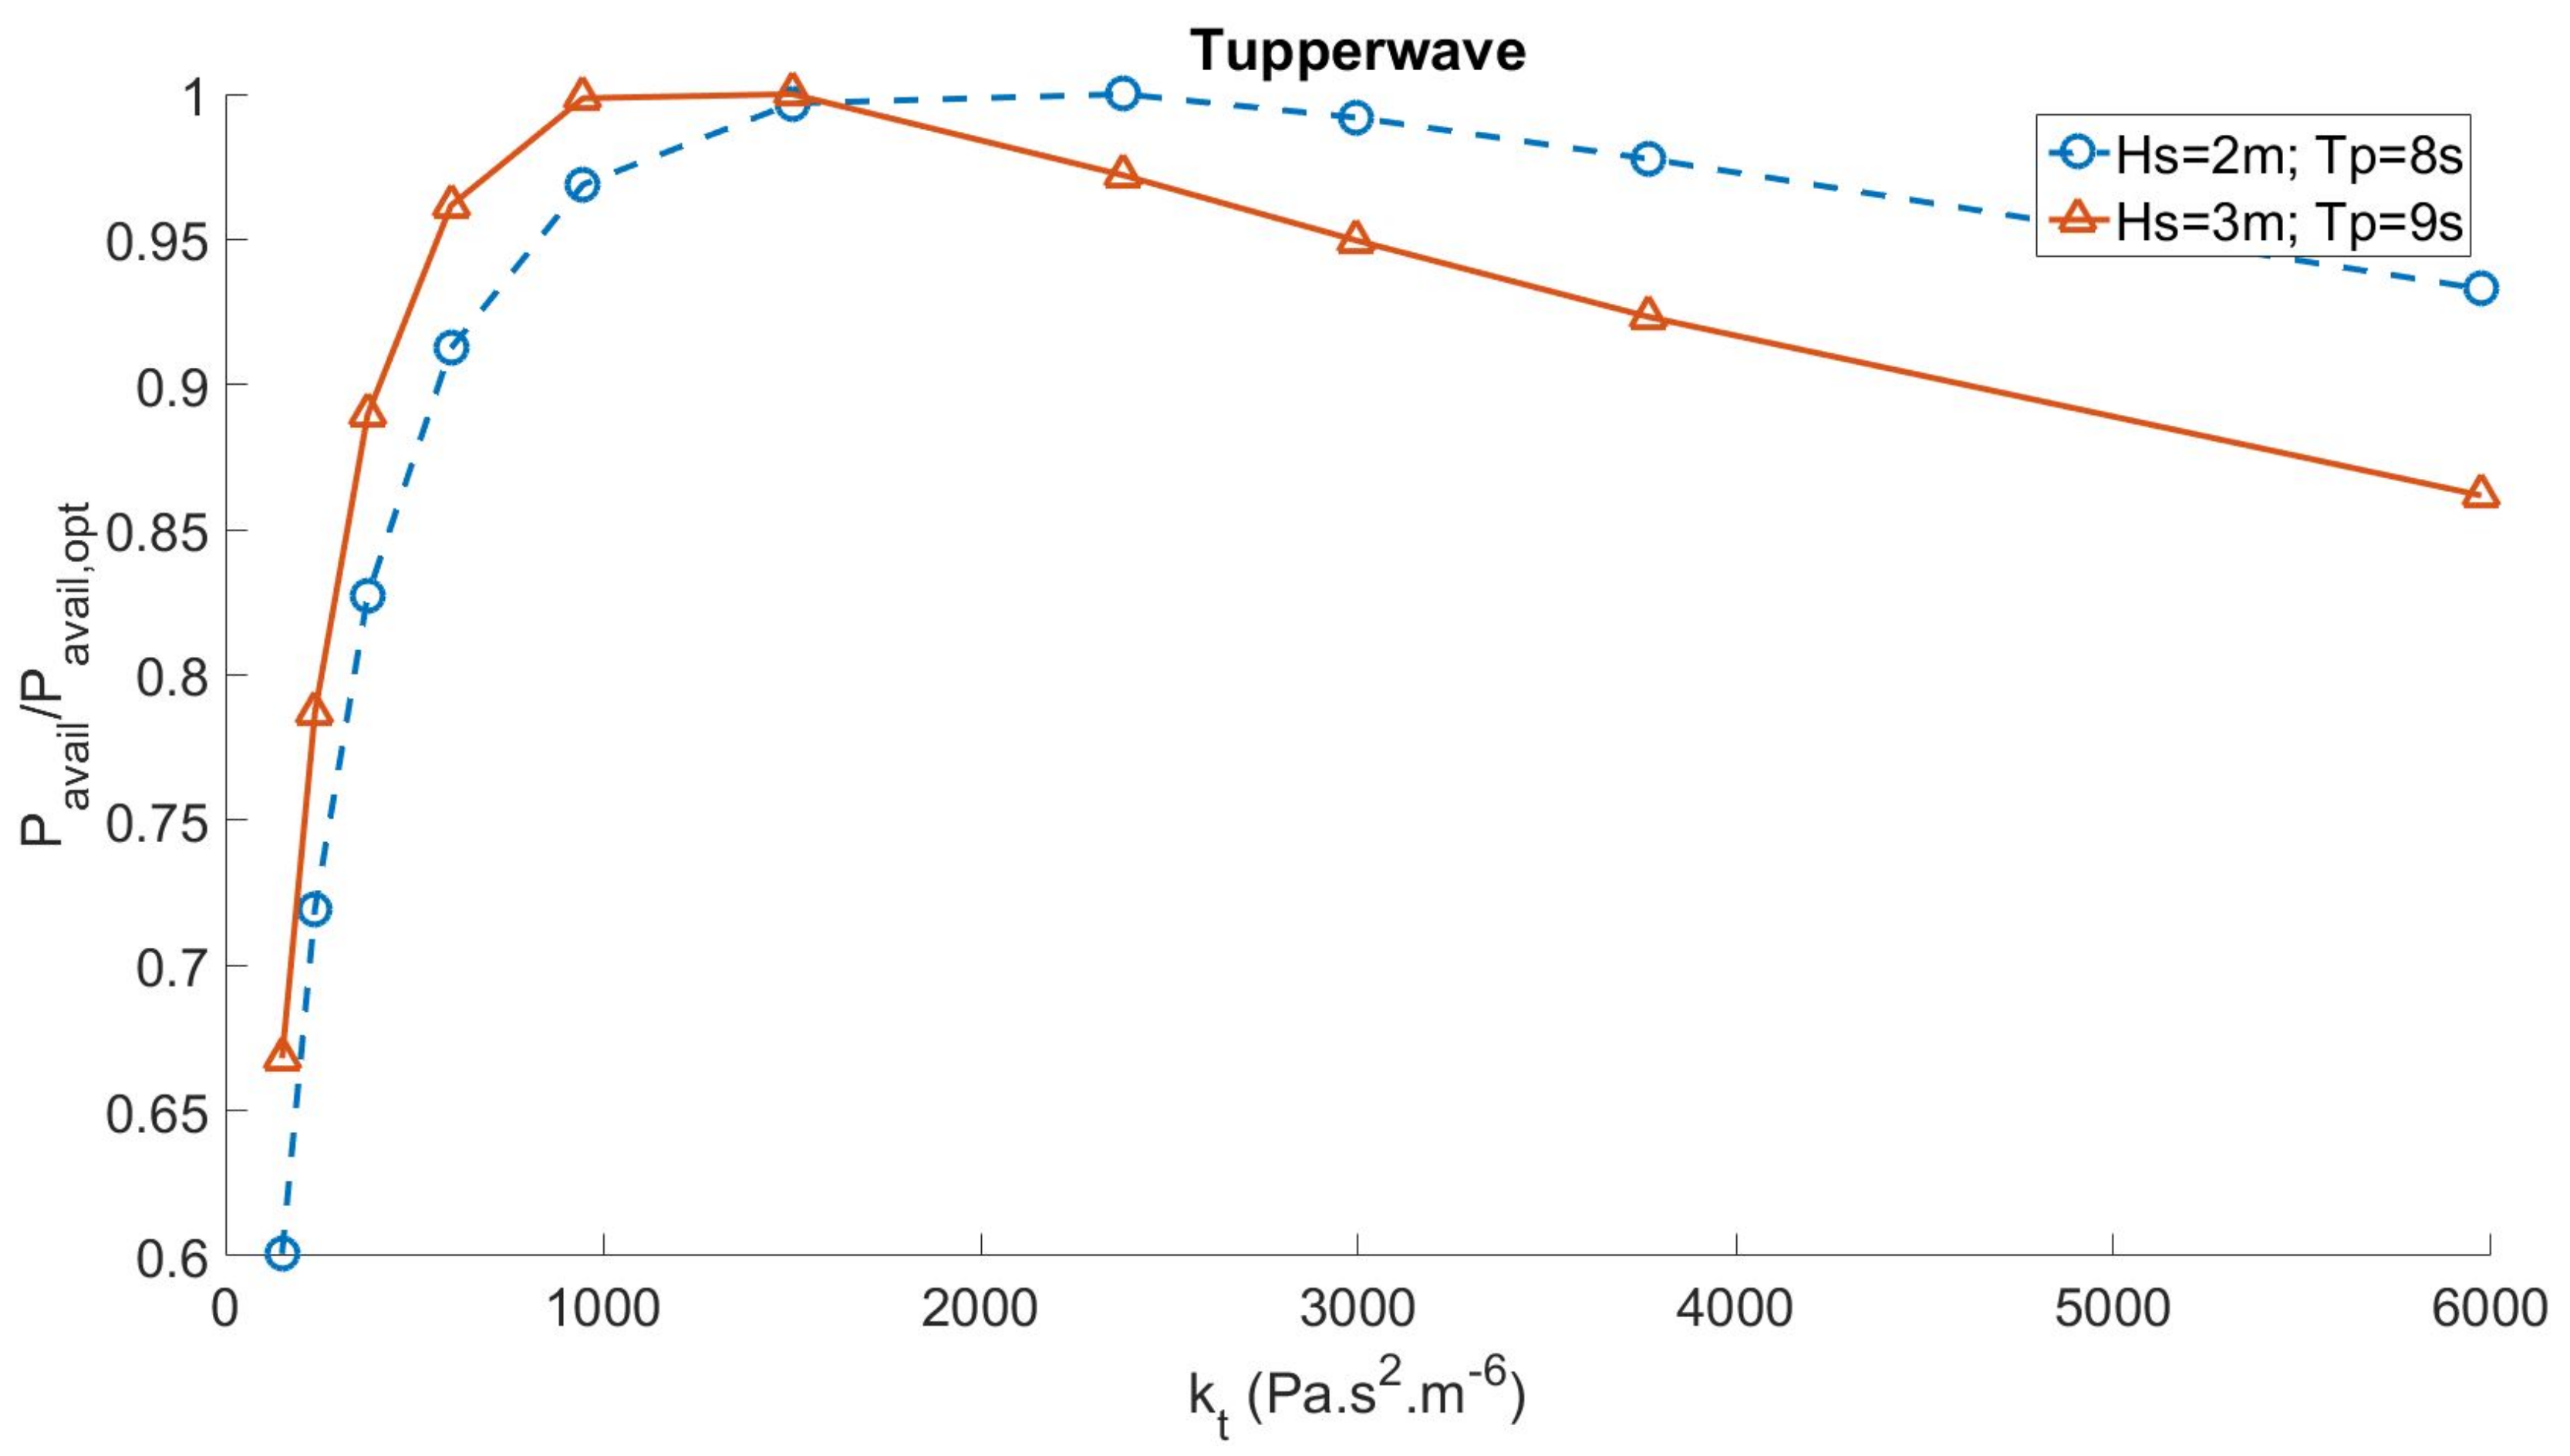
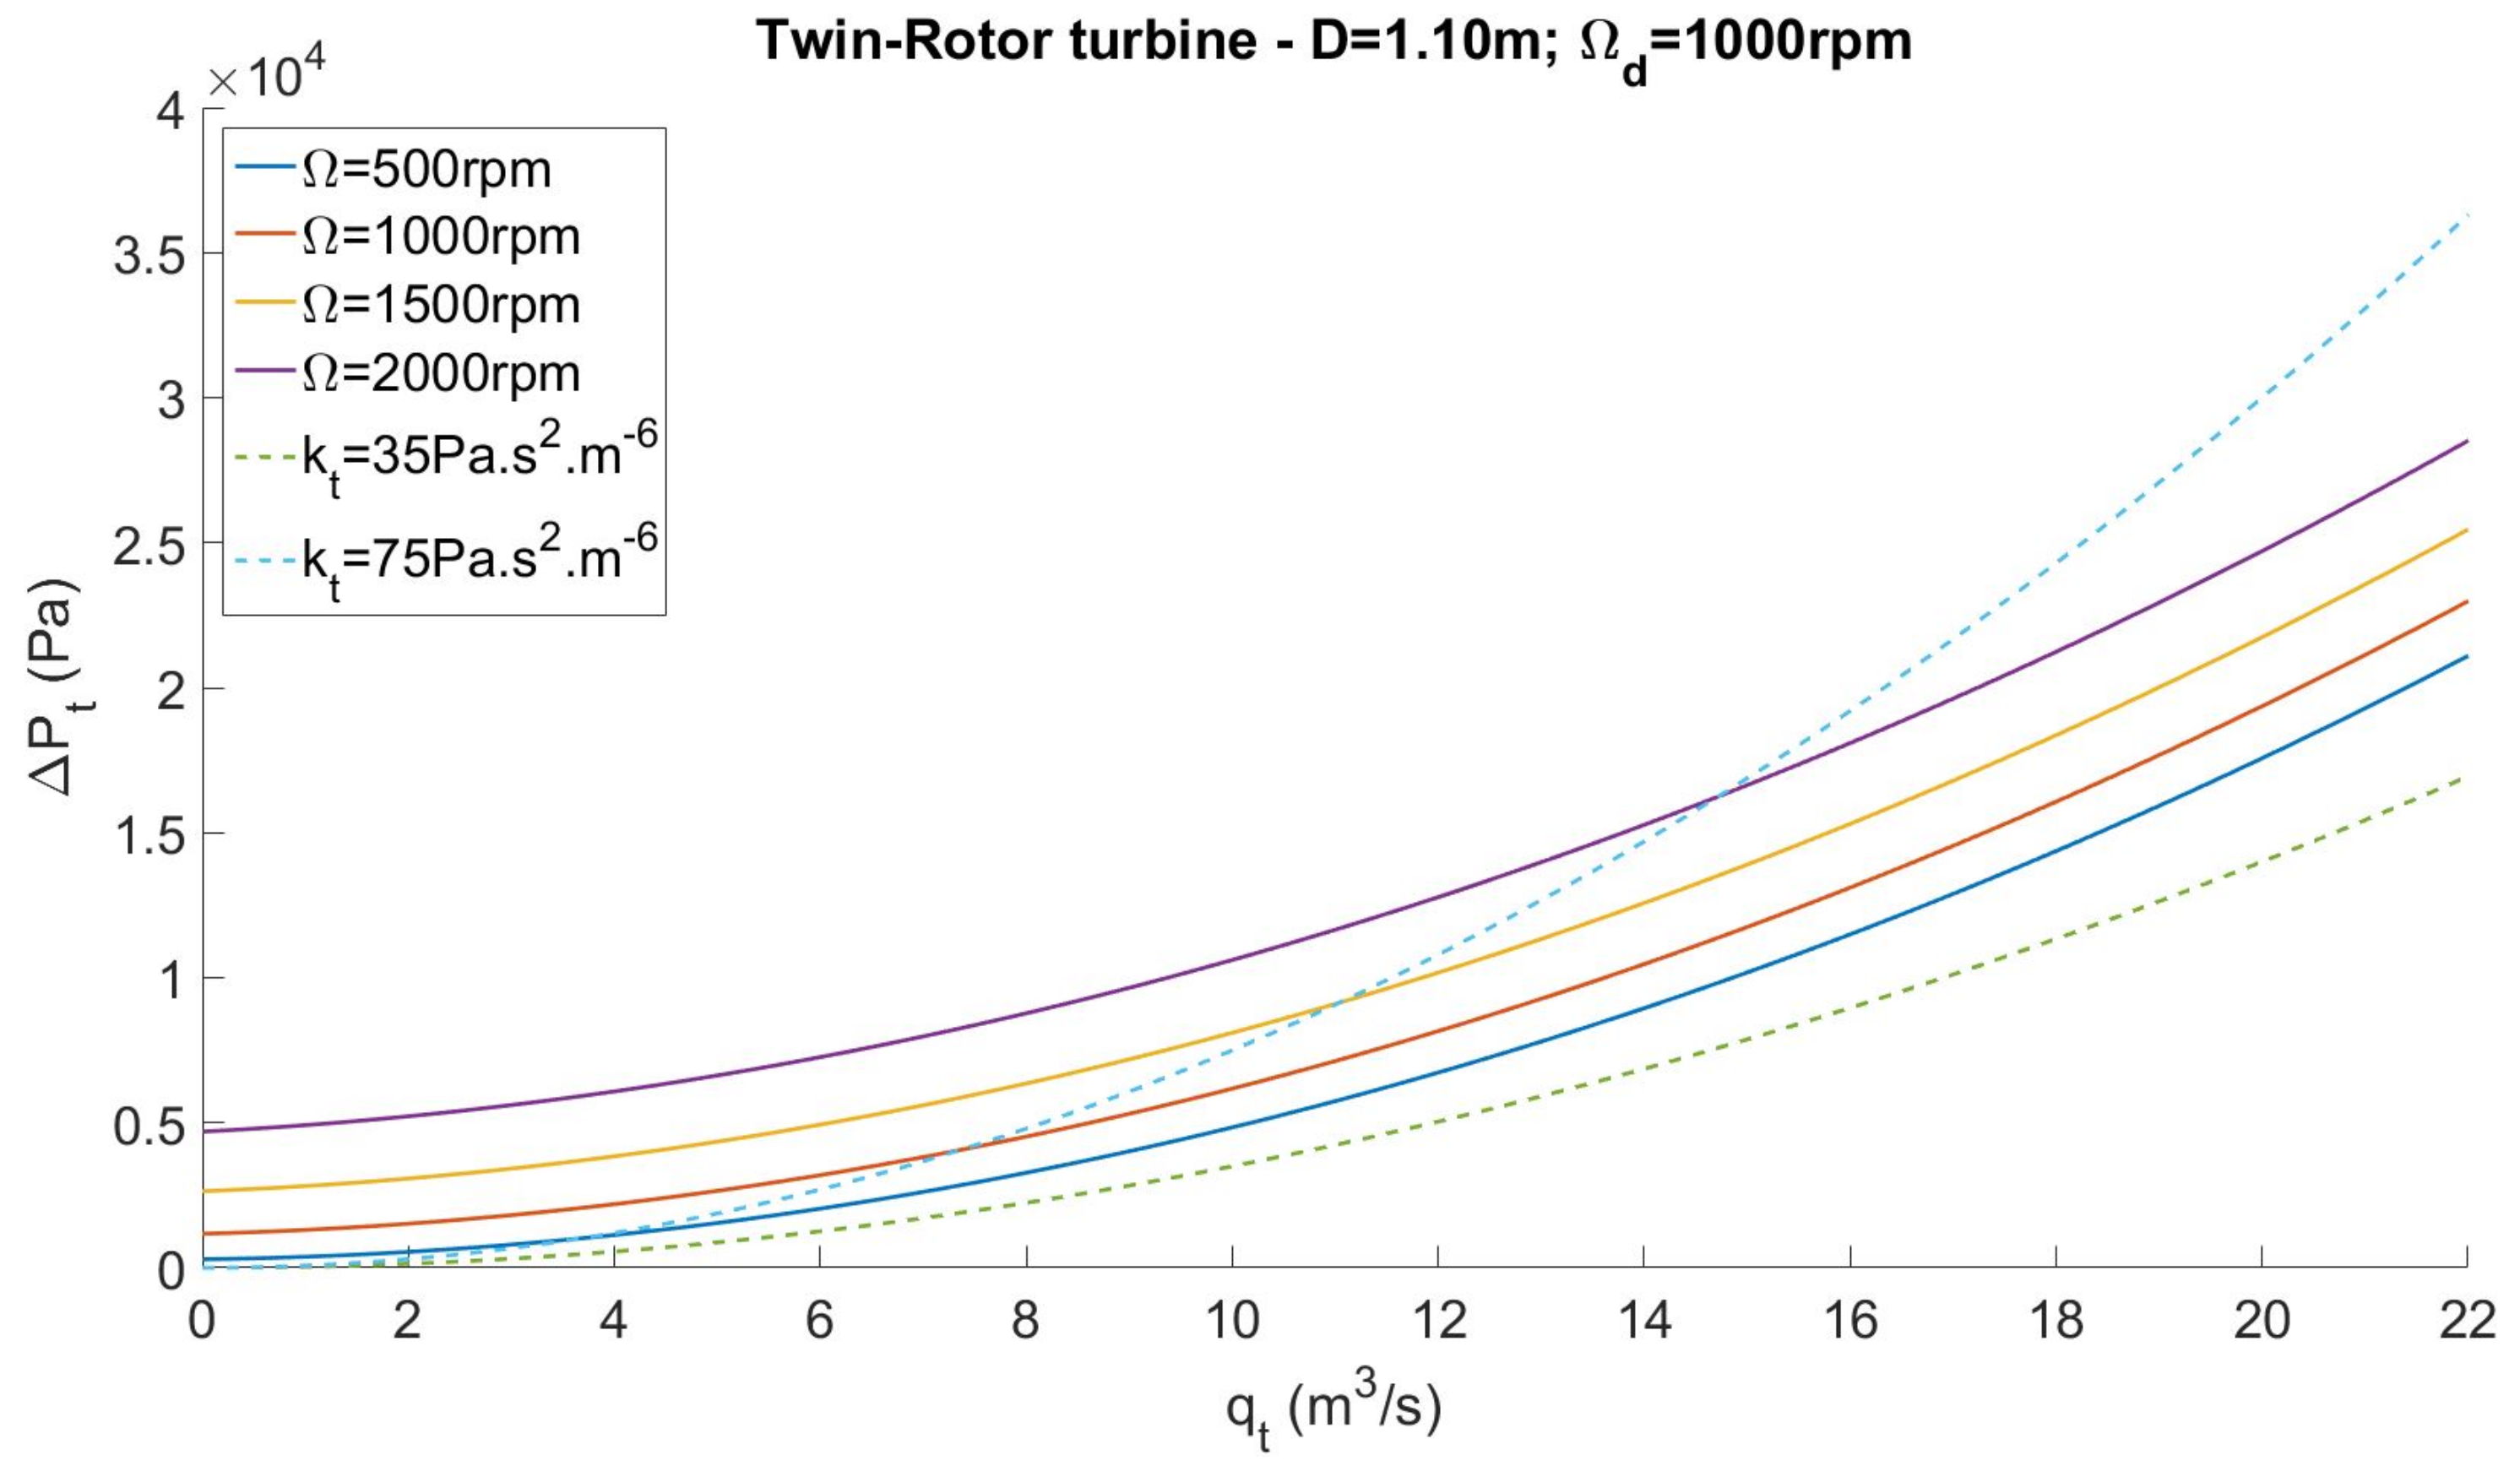
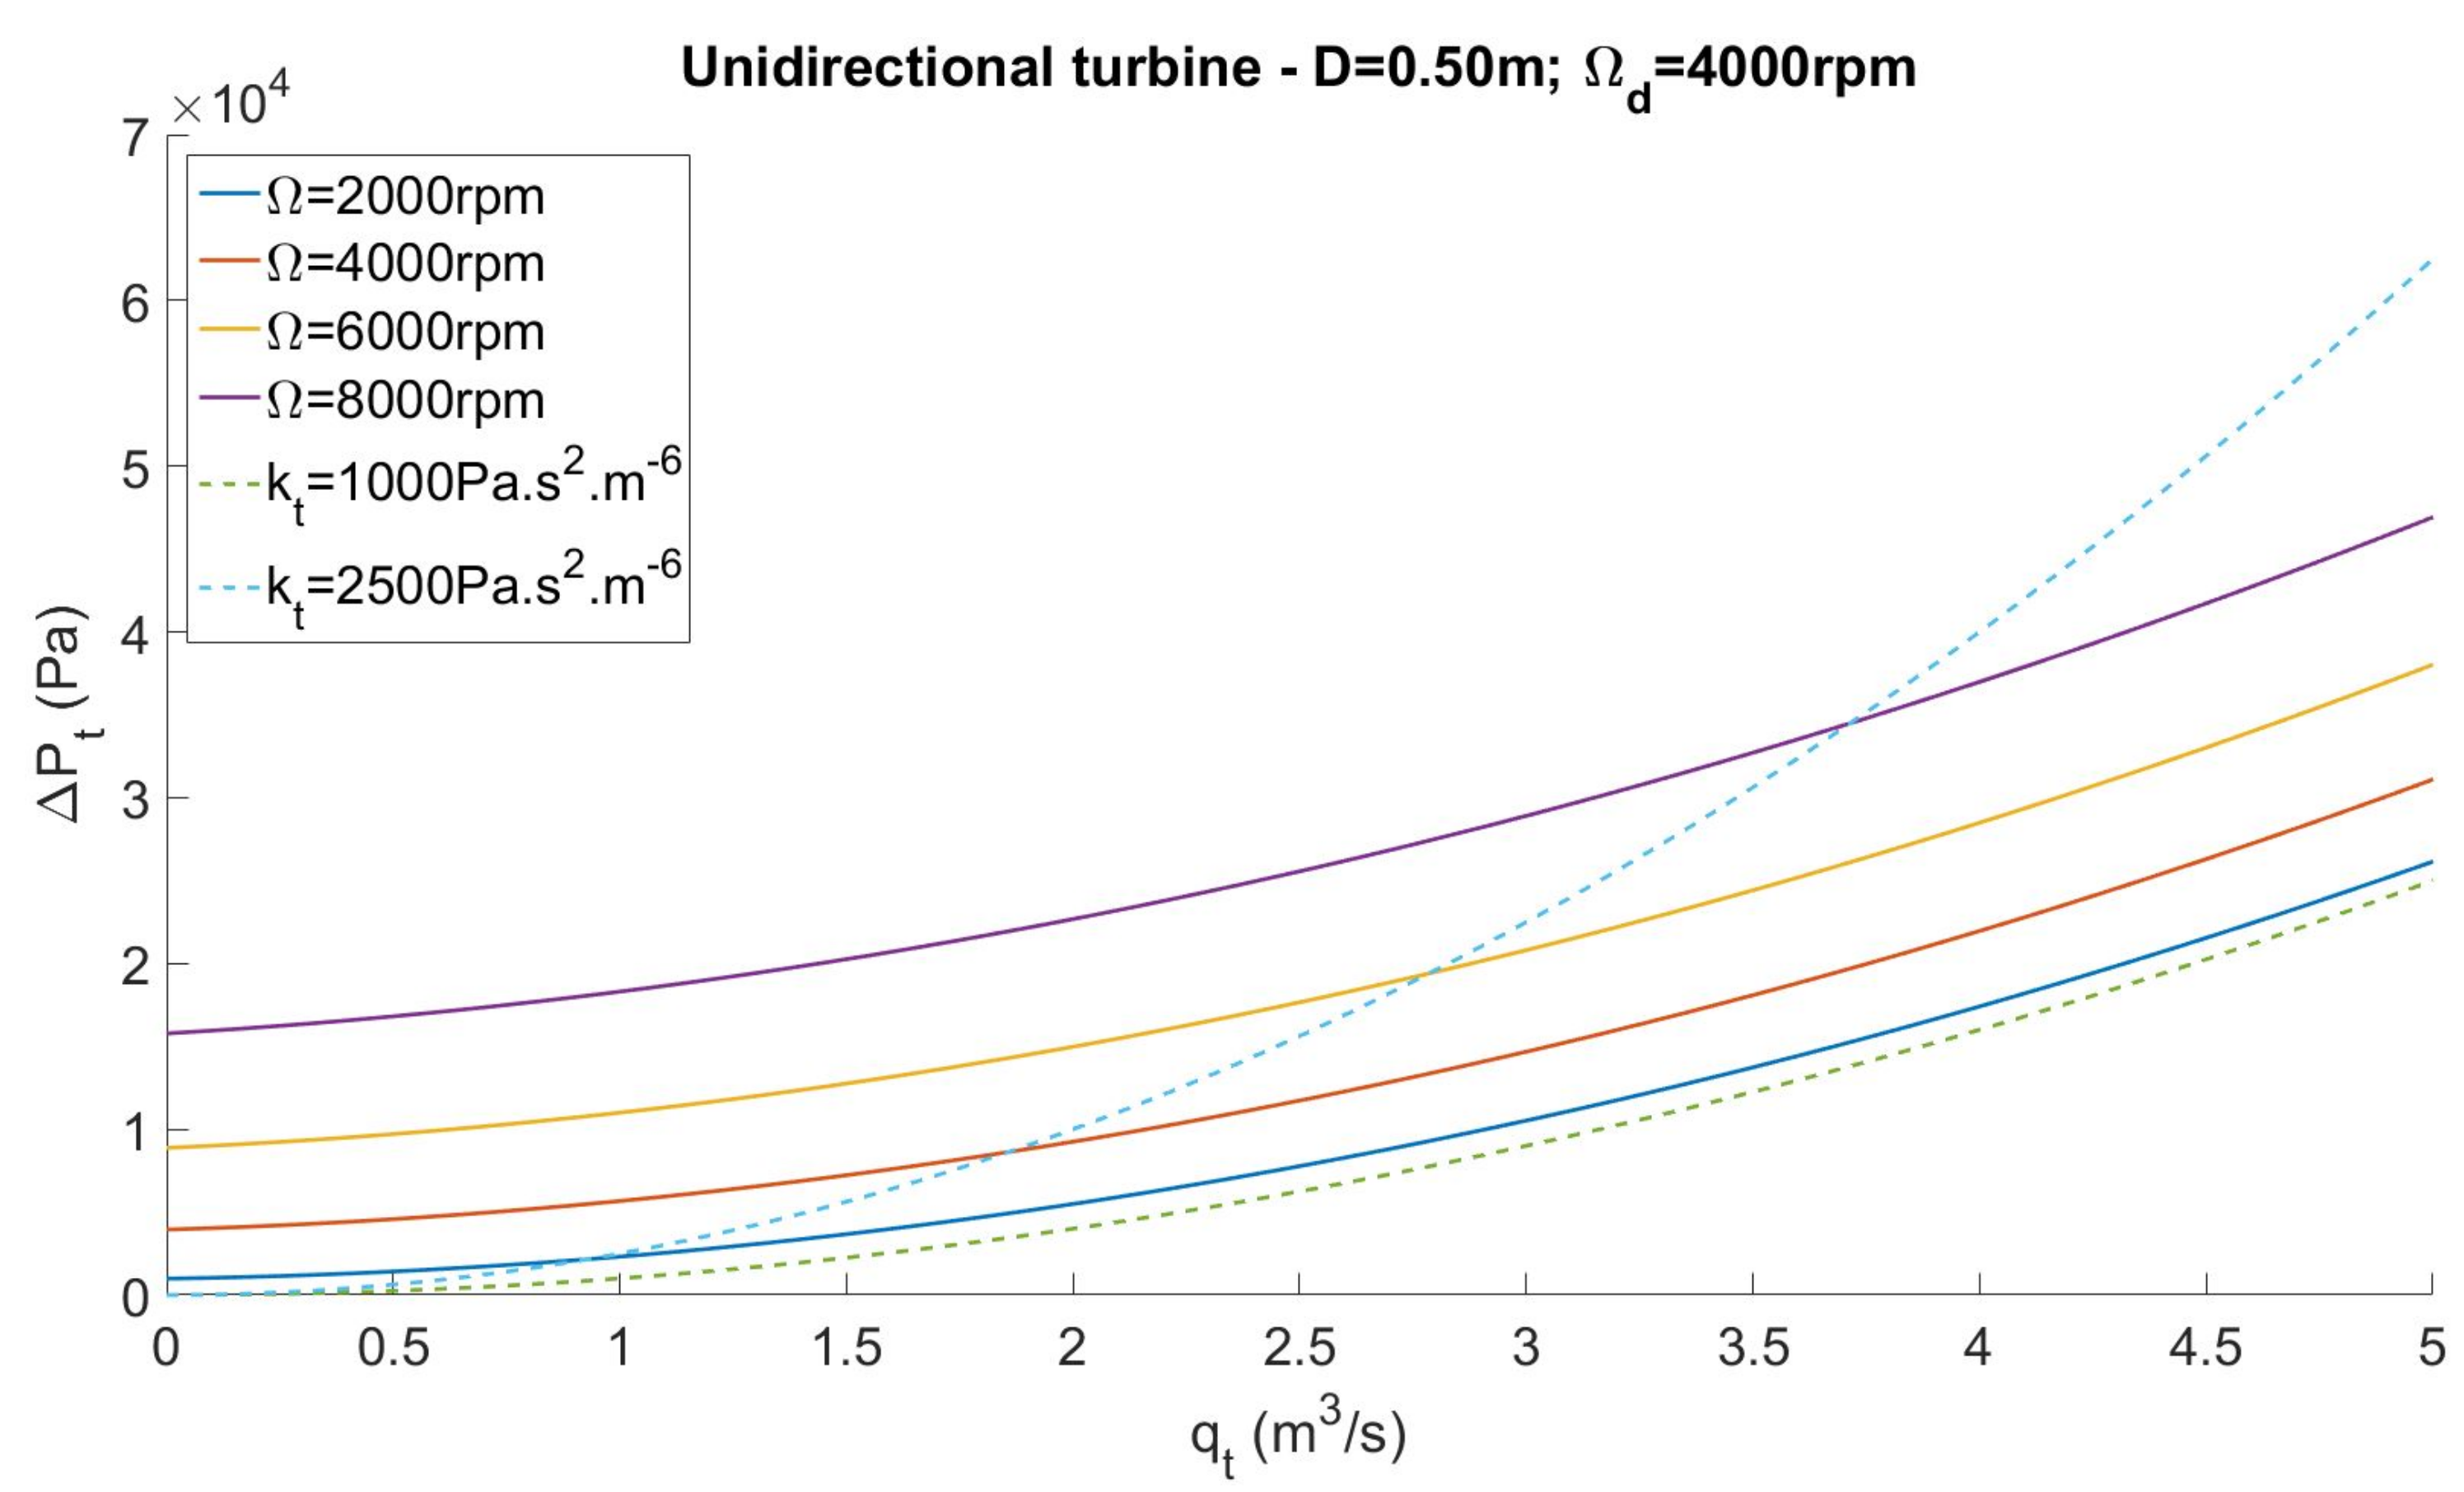
3.1. Turbines
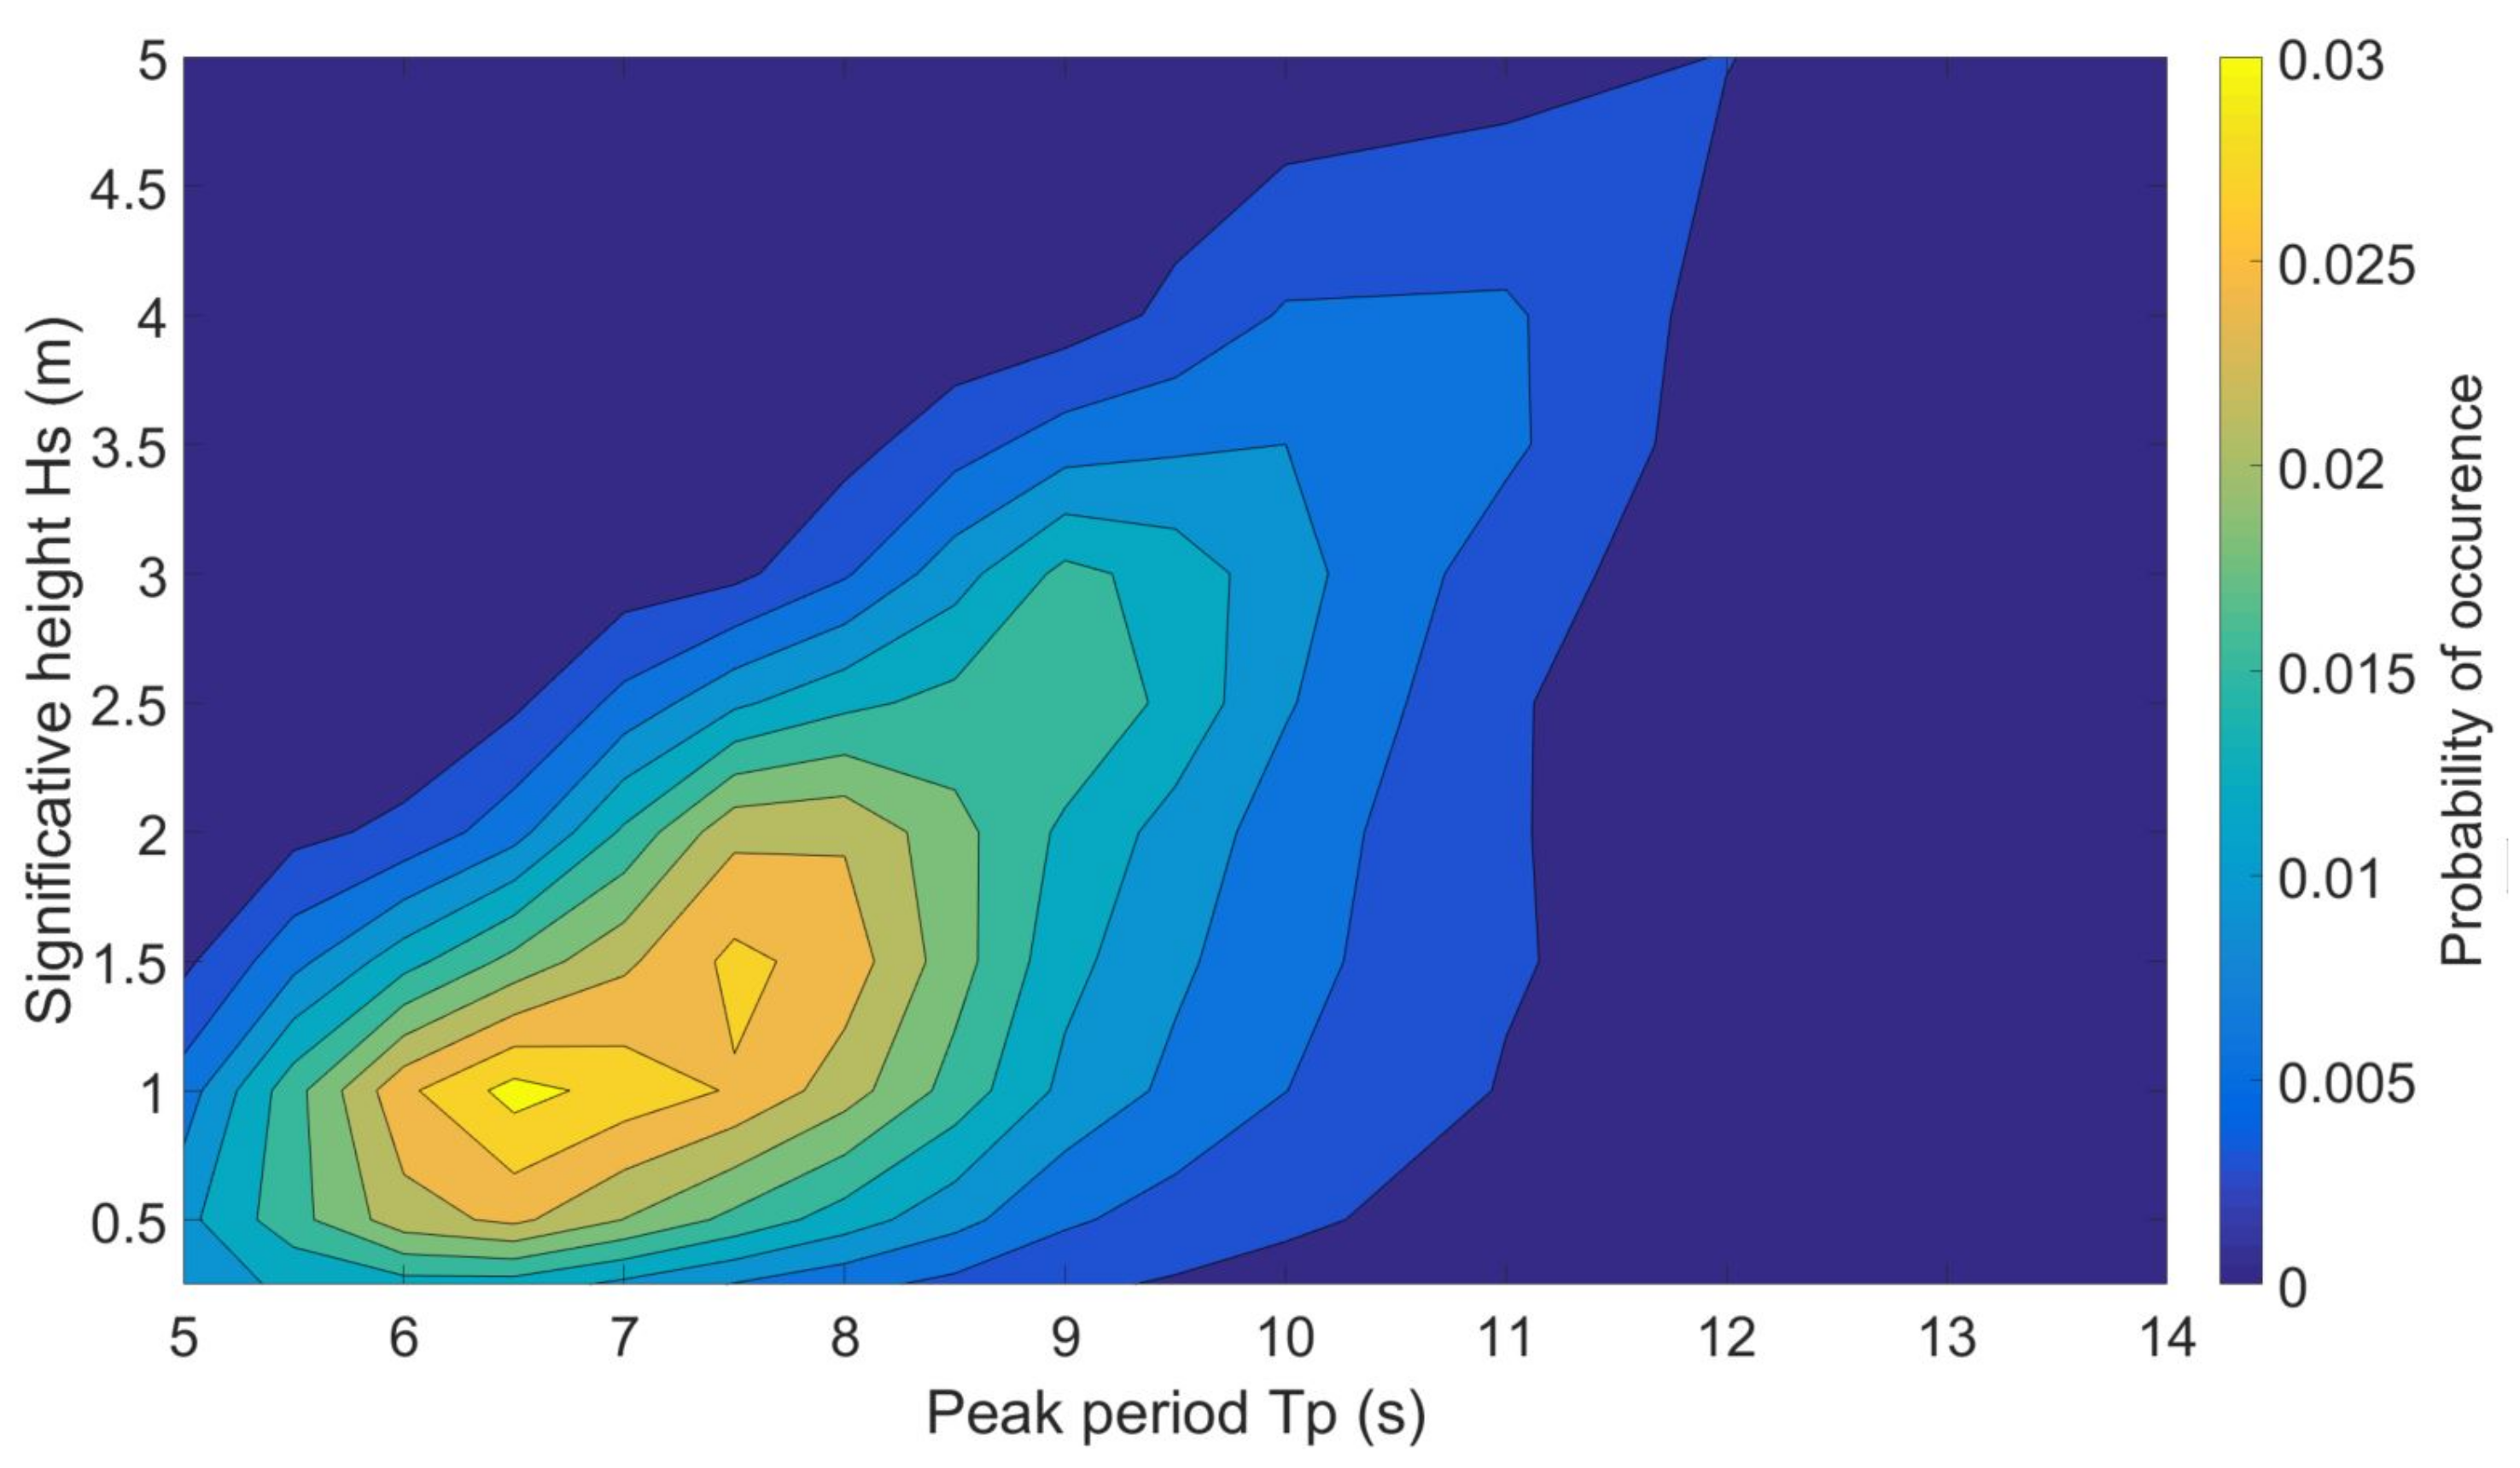
- Identification of the sea states for which the devices are the most productive over the year.
- Assessment of optimal damping coefficients for the most productive sea states.
- Assessment of turbine diameter and rotational speed to achieve optimal damping.
- Verification that the damping achieved by the chosen turbine is close to optimal.
3.2. Generator
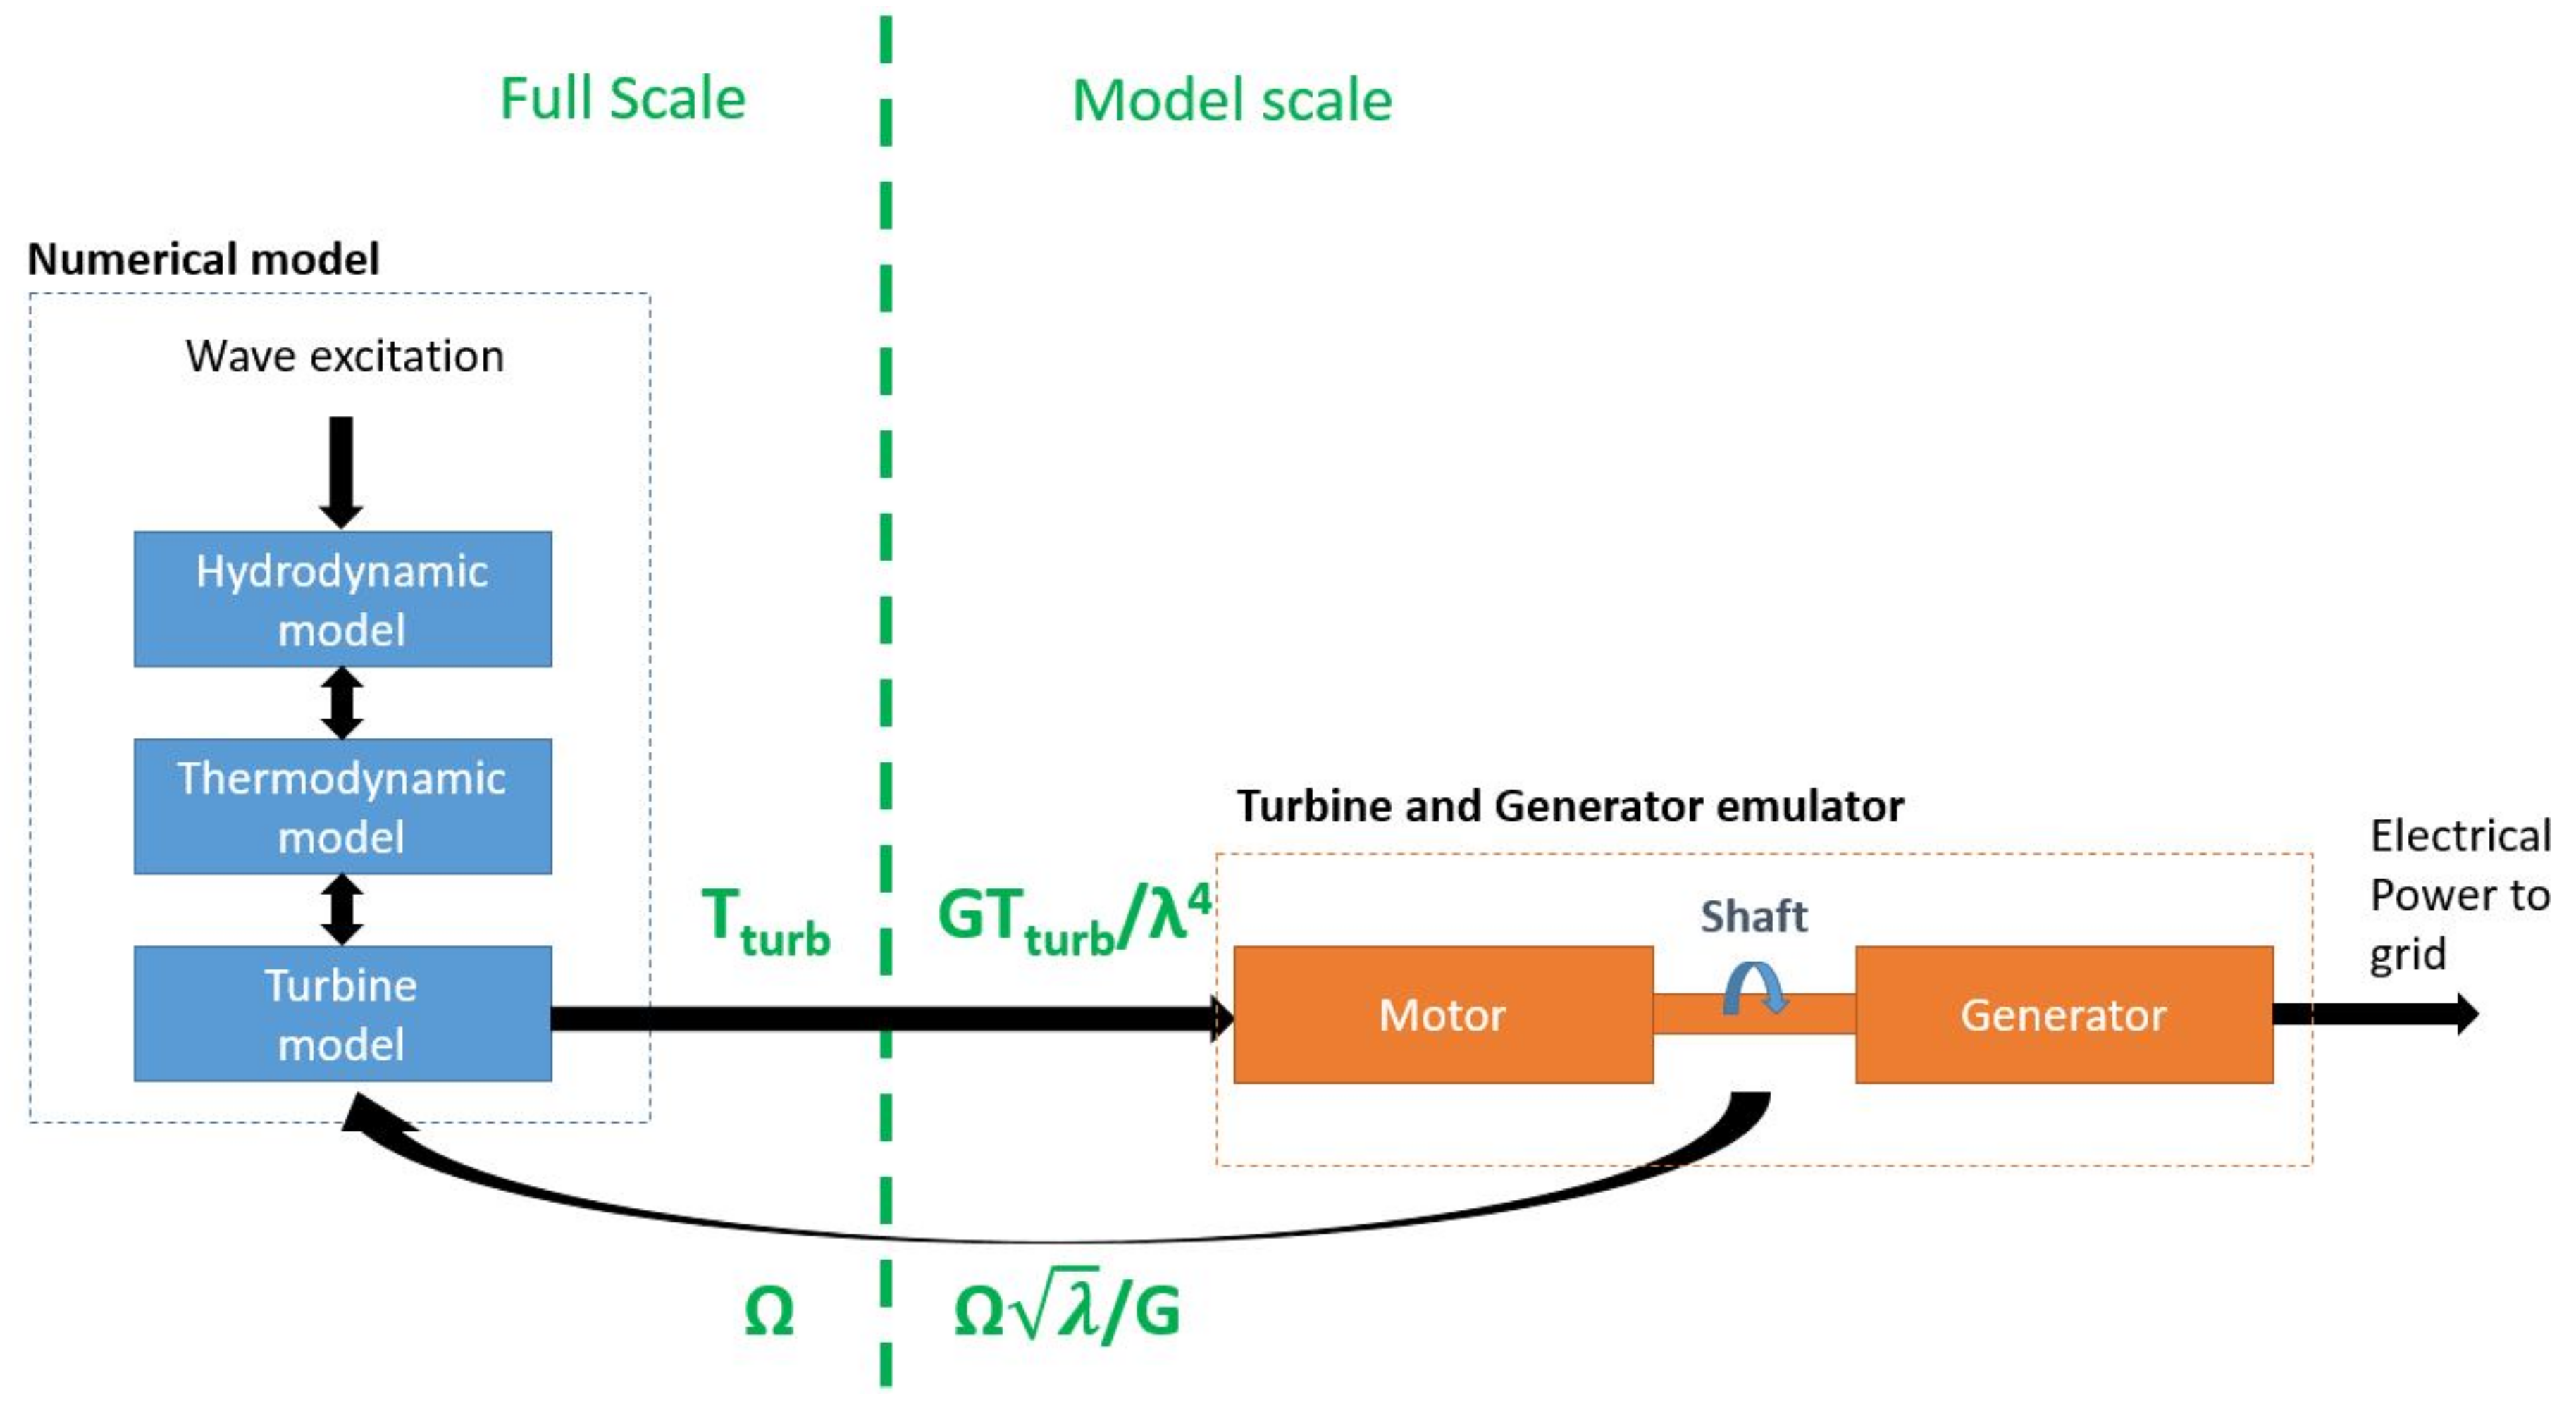
4. Numerical Model Validation
4.1. Objective and Method
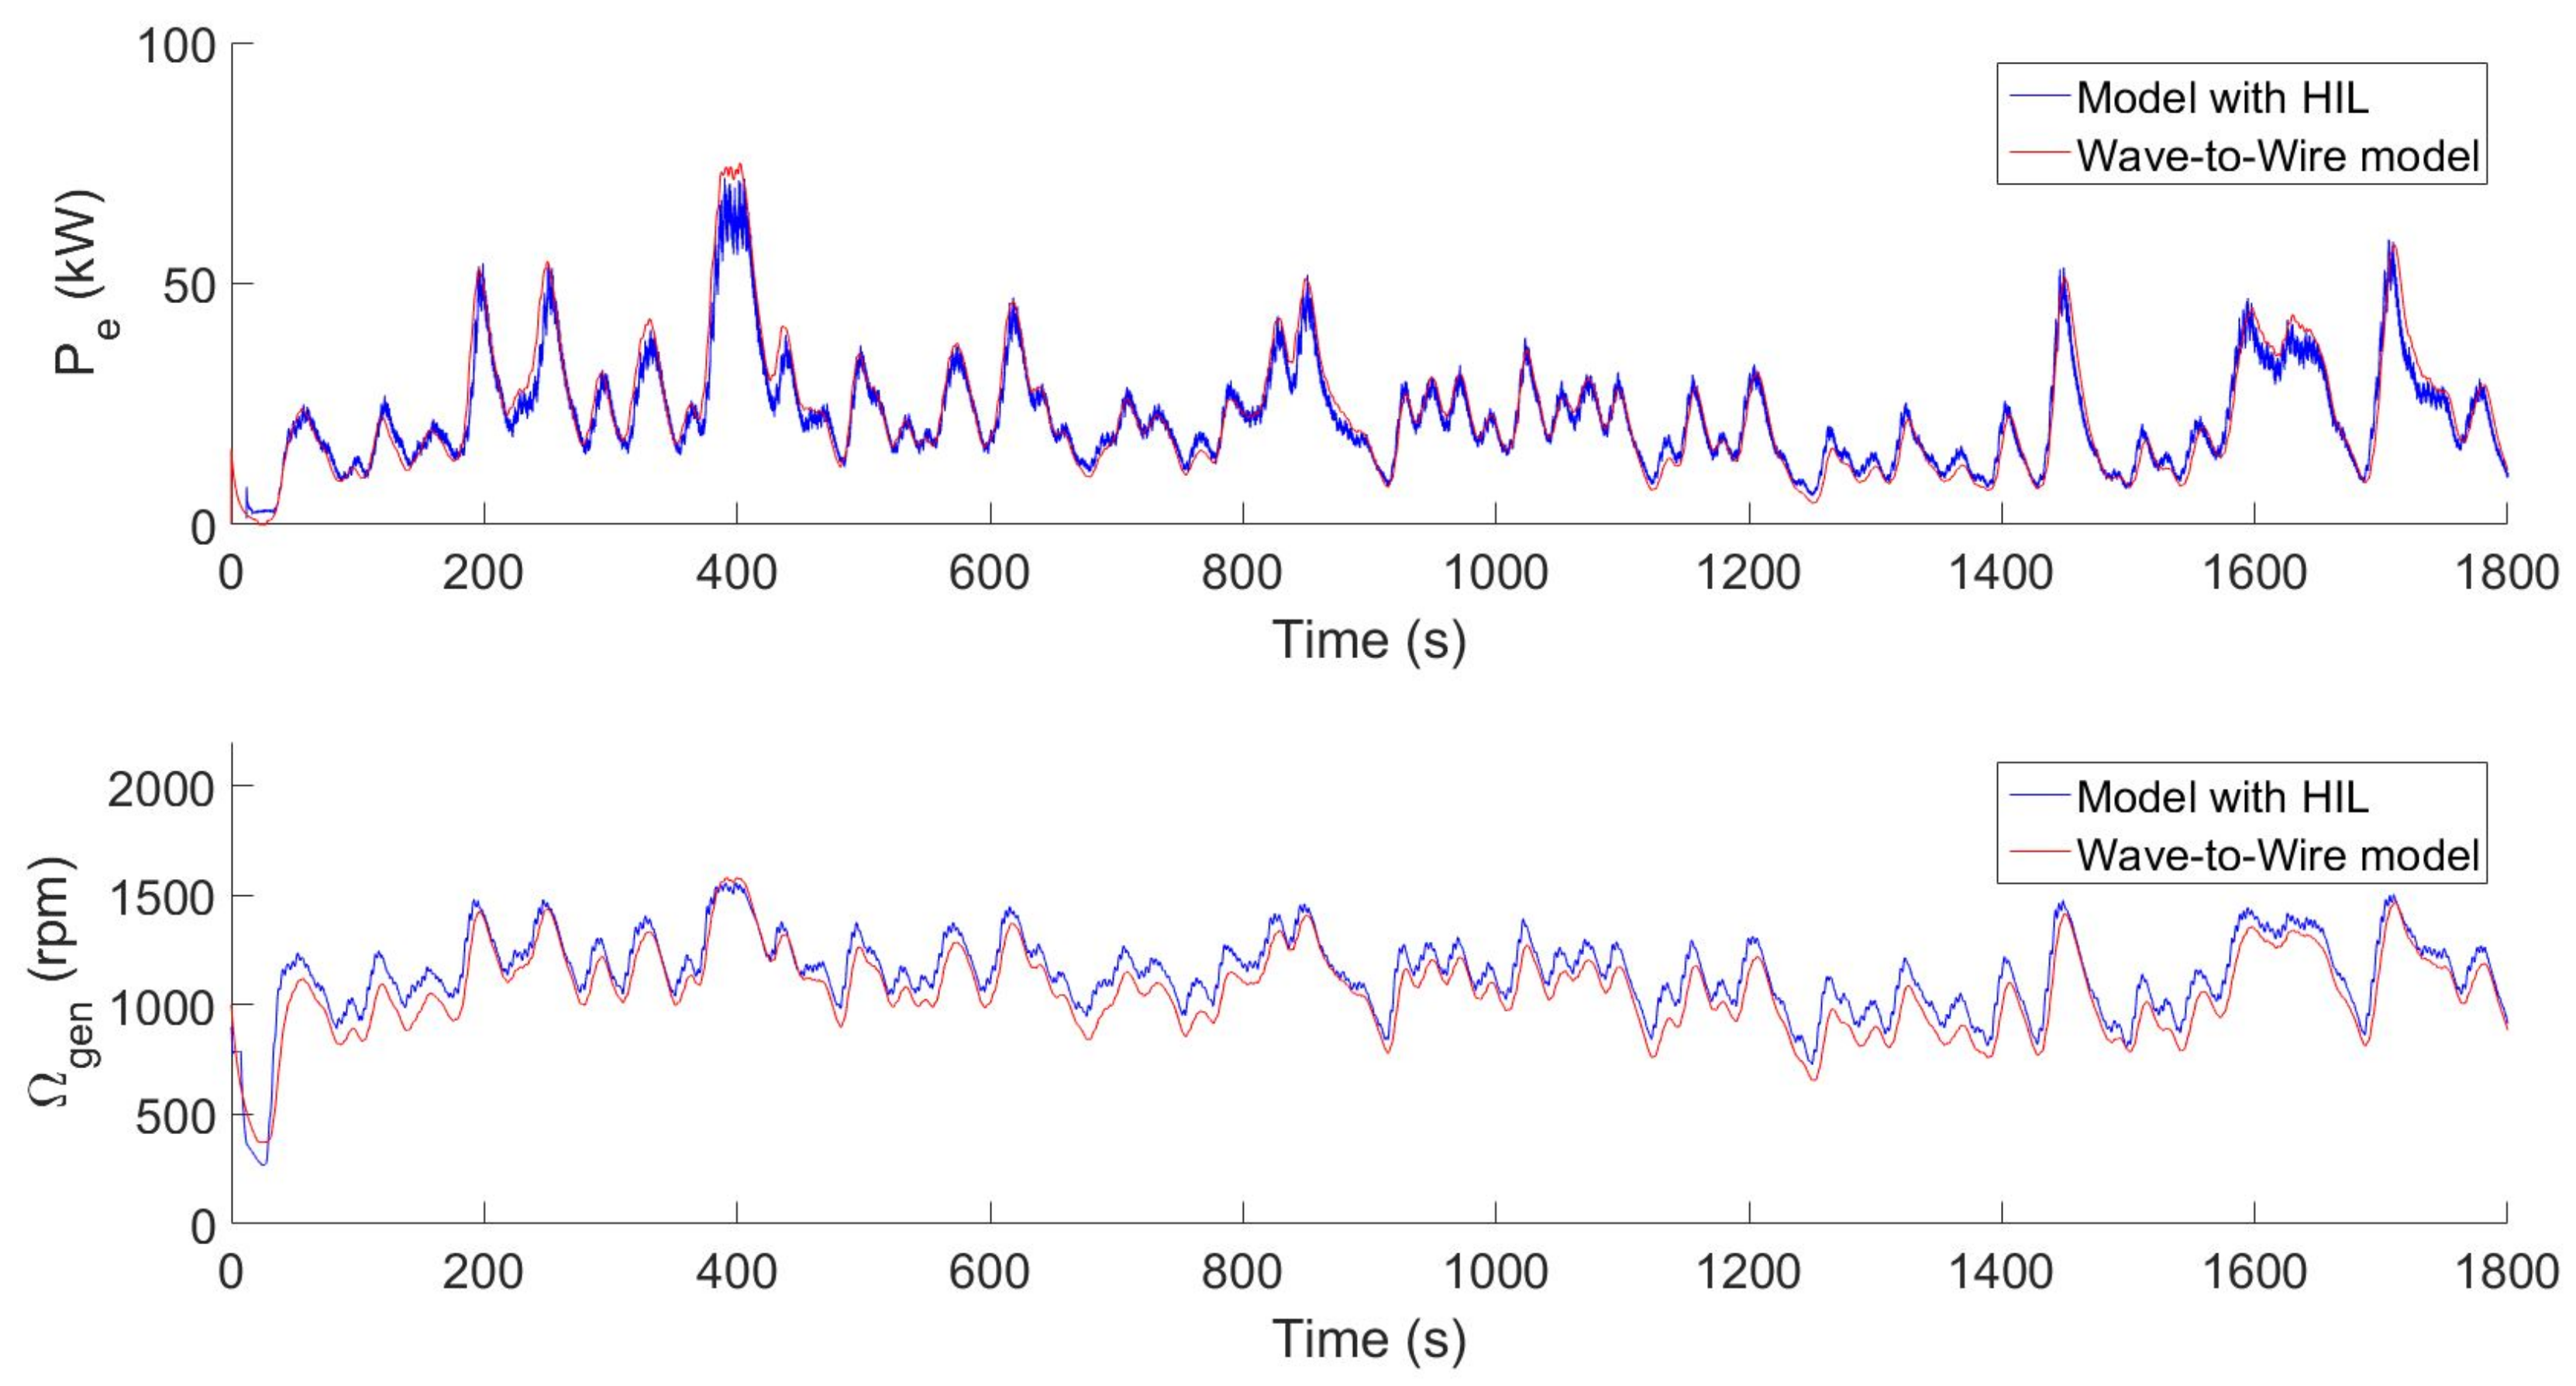
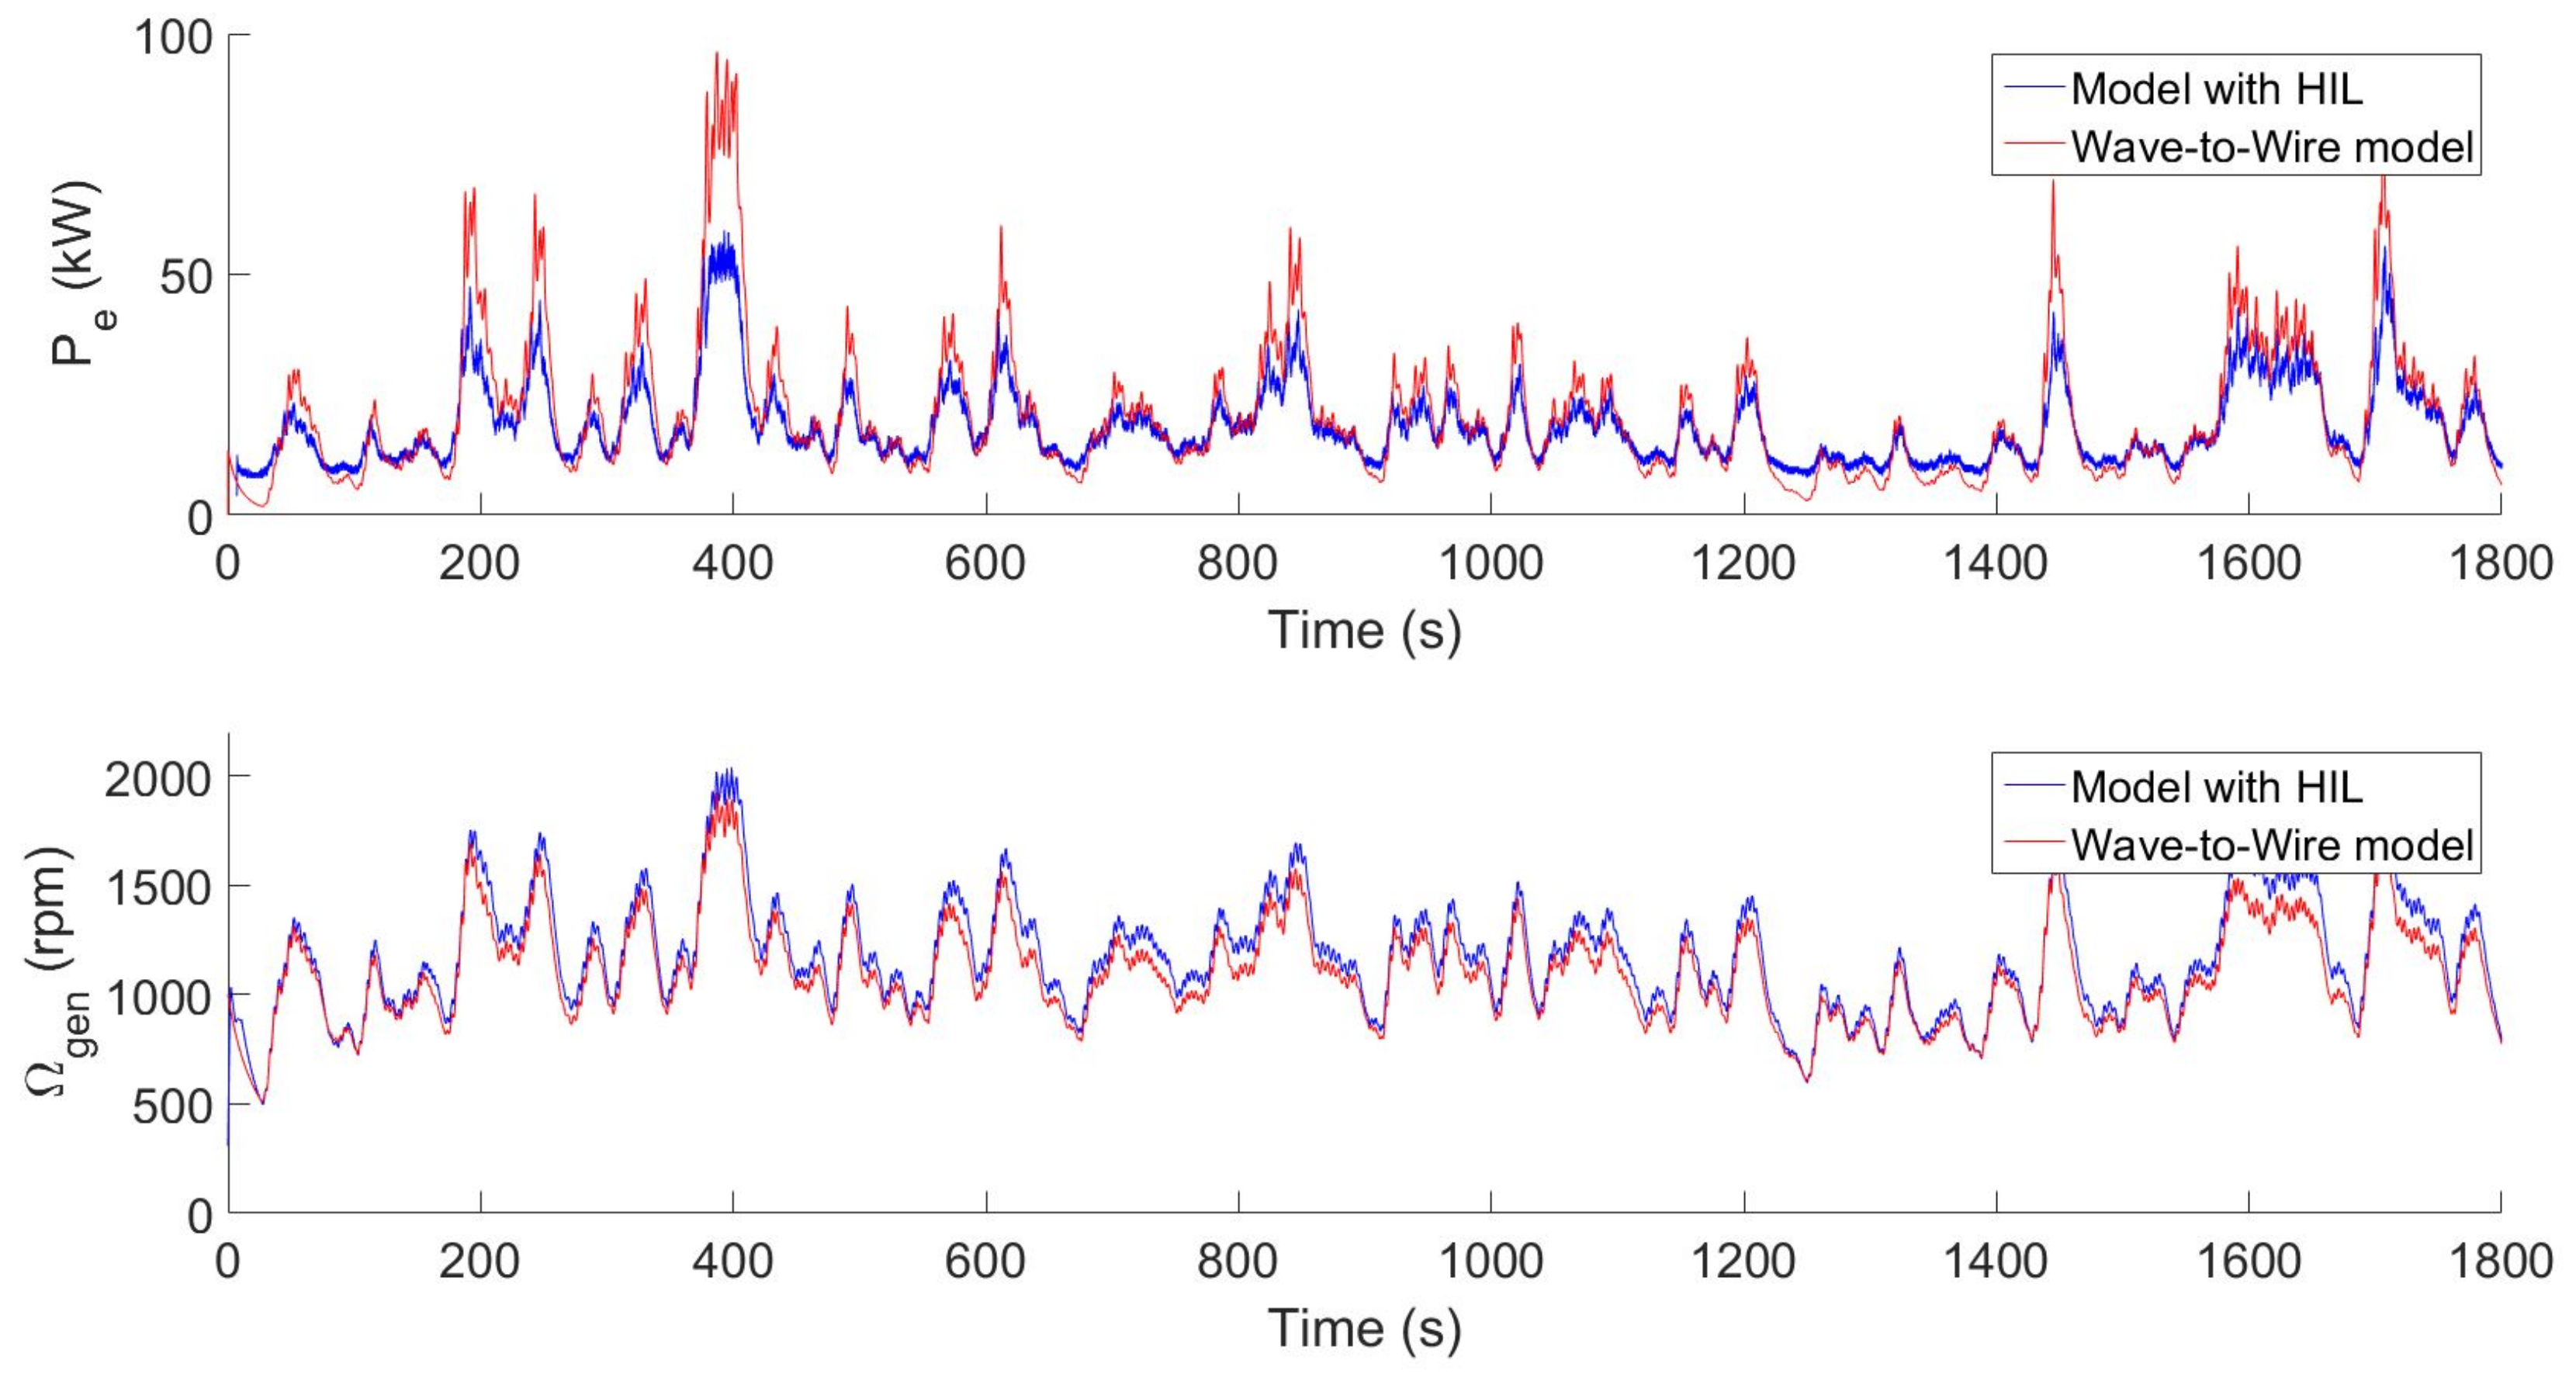
4.2. Hardware-in-the-Loop Results
5. Wave-to-Wire Models Results
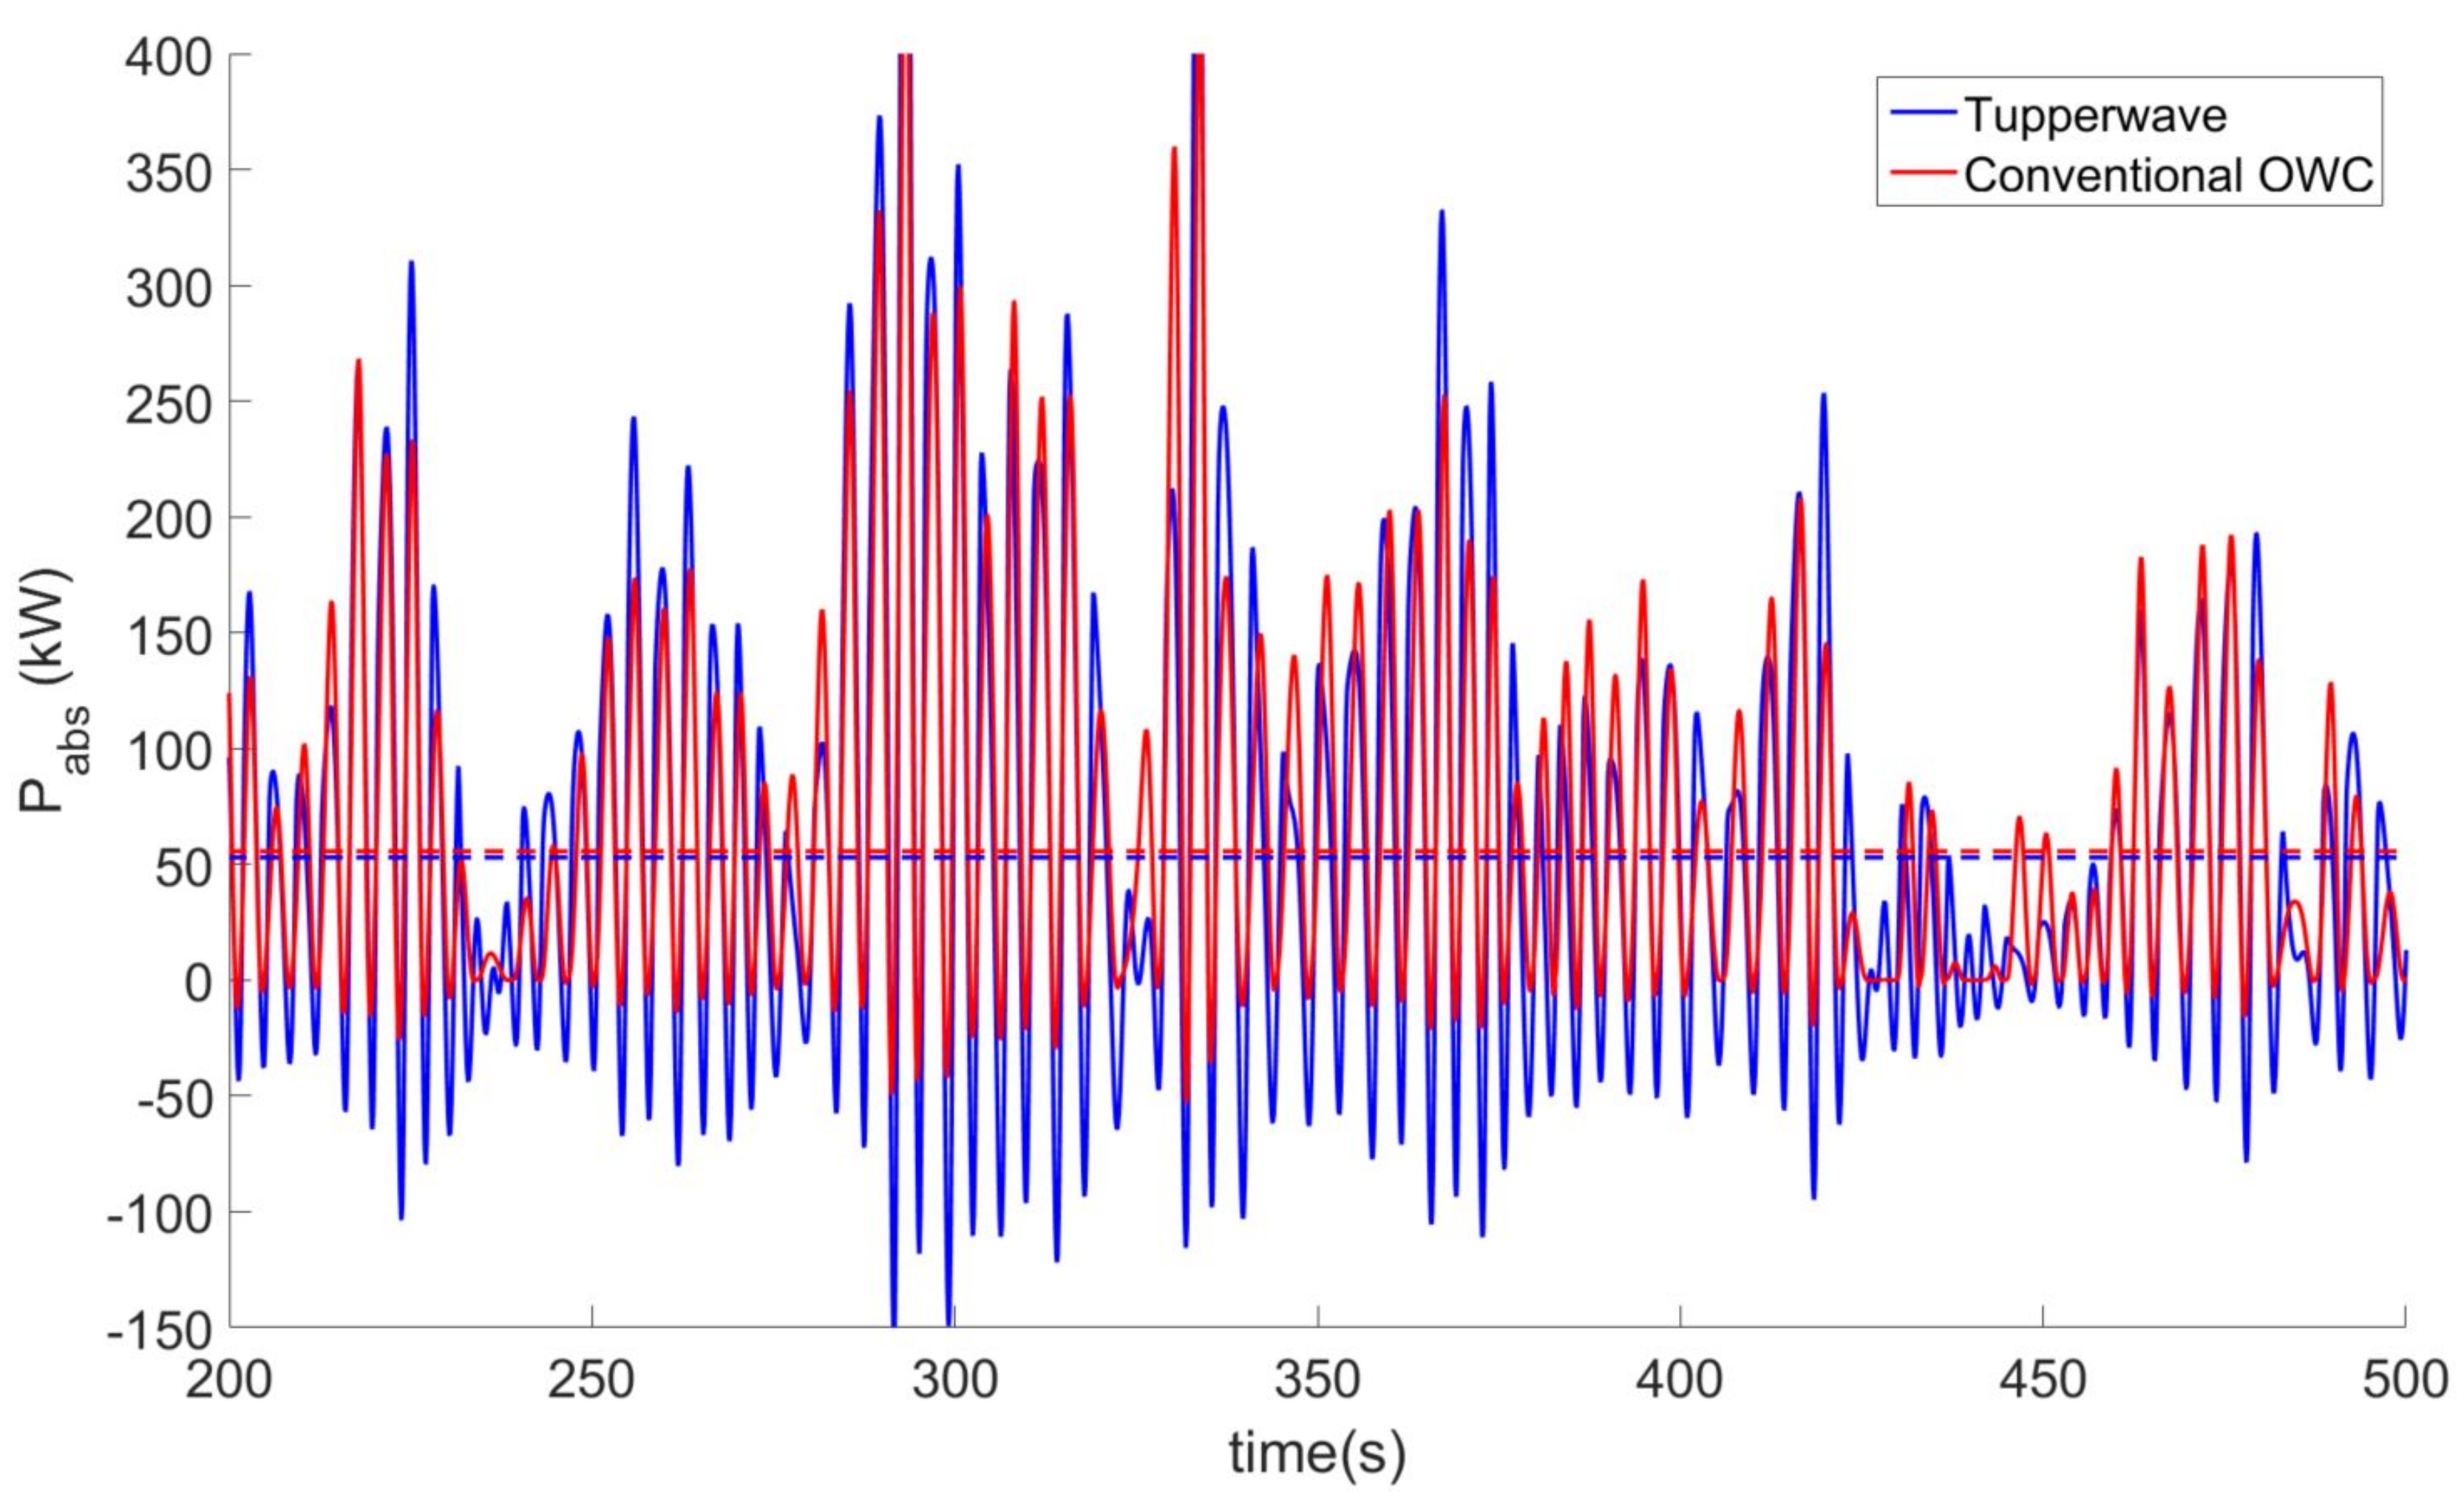
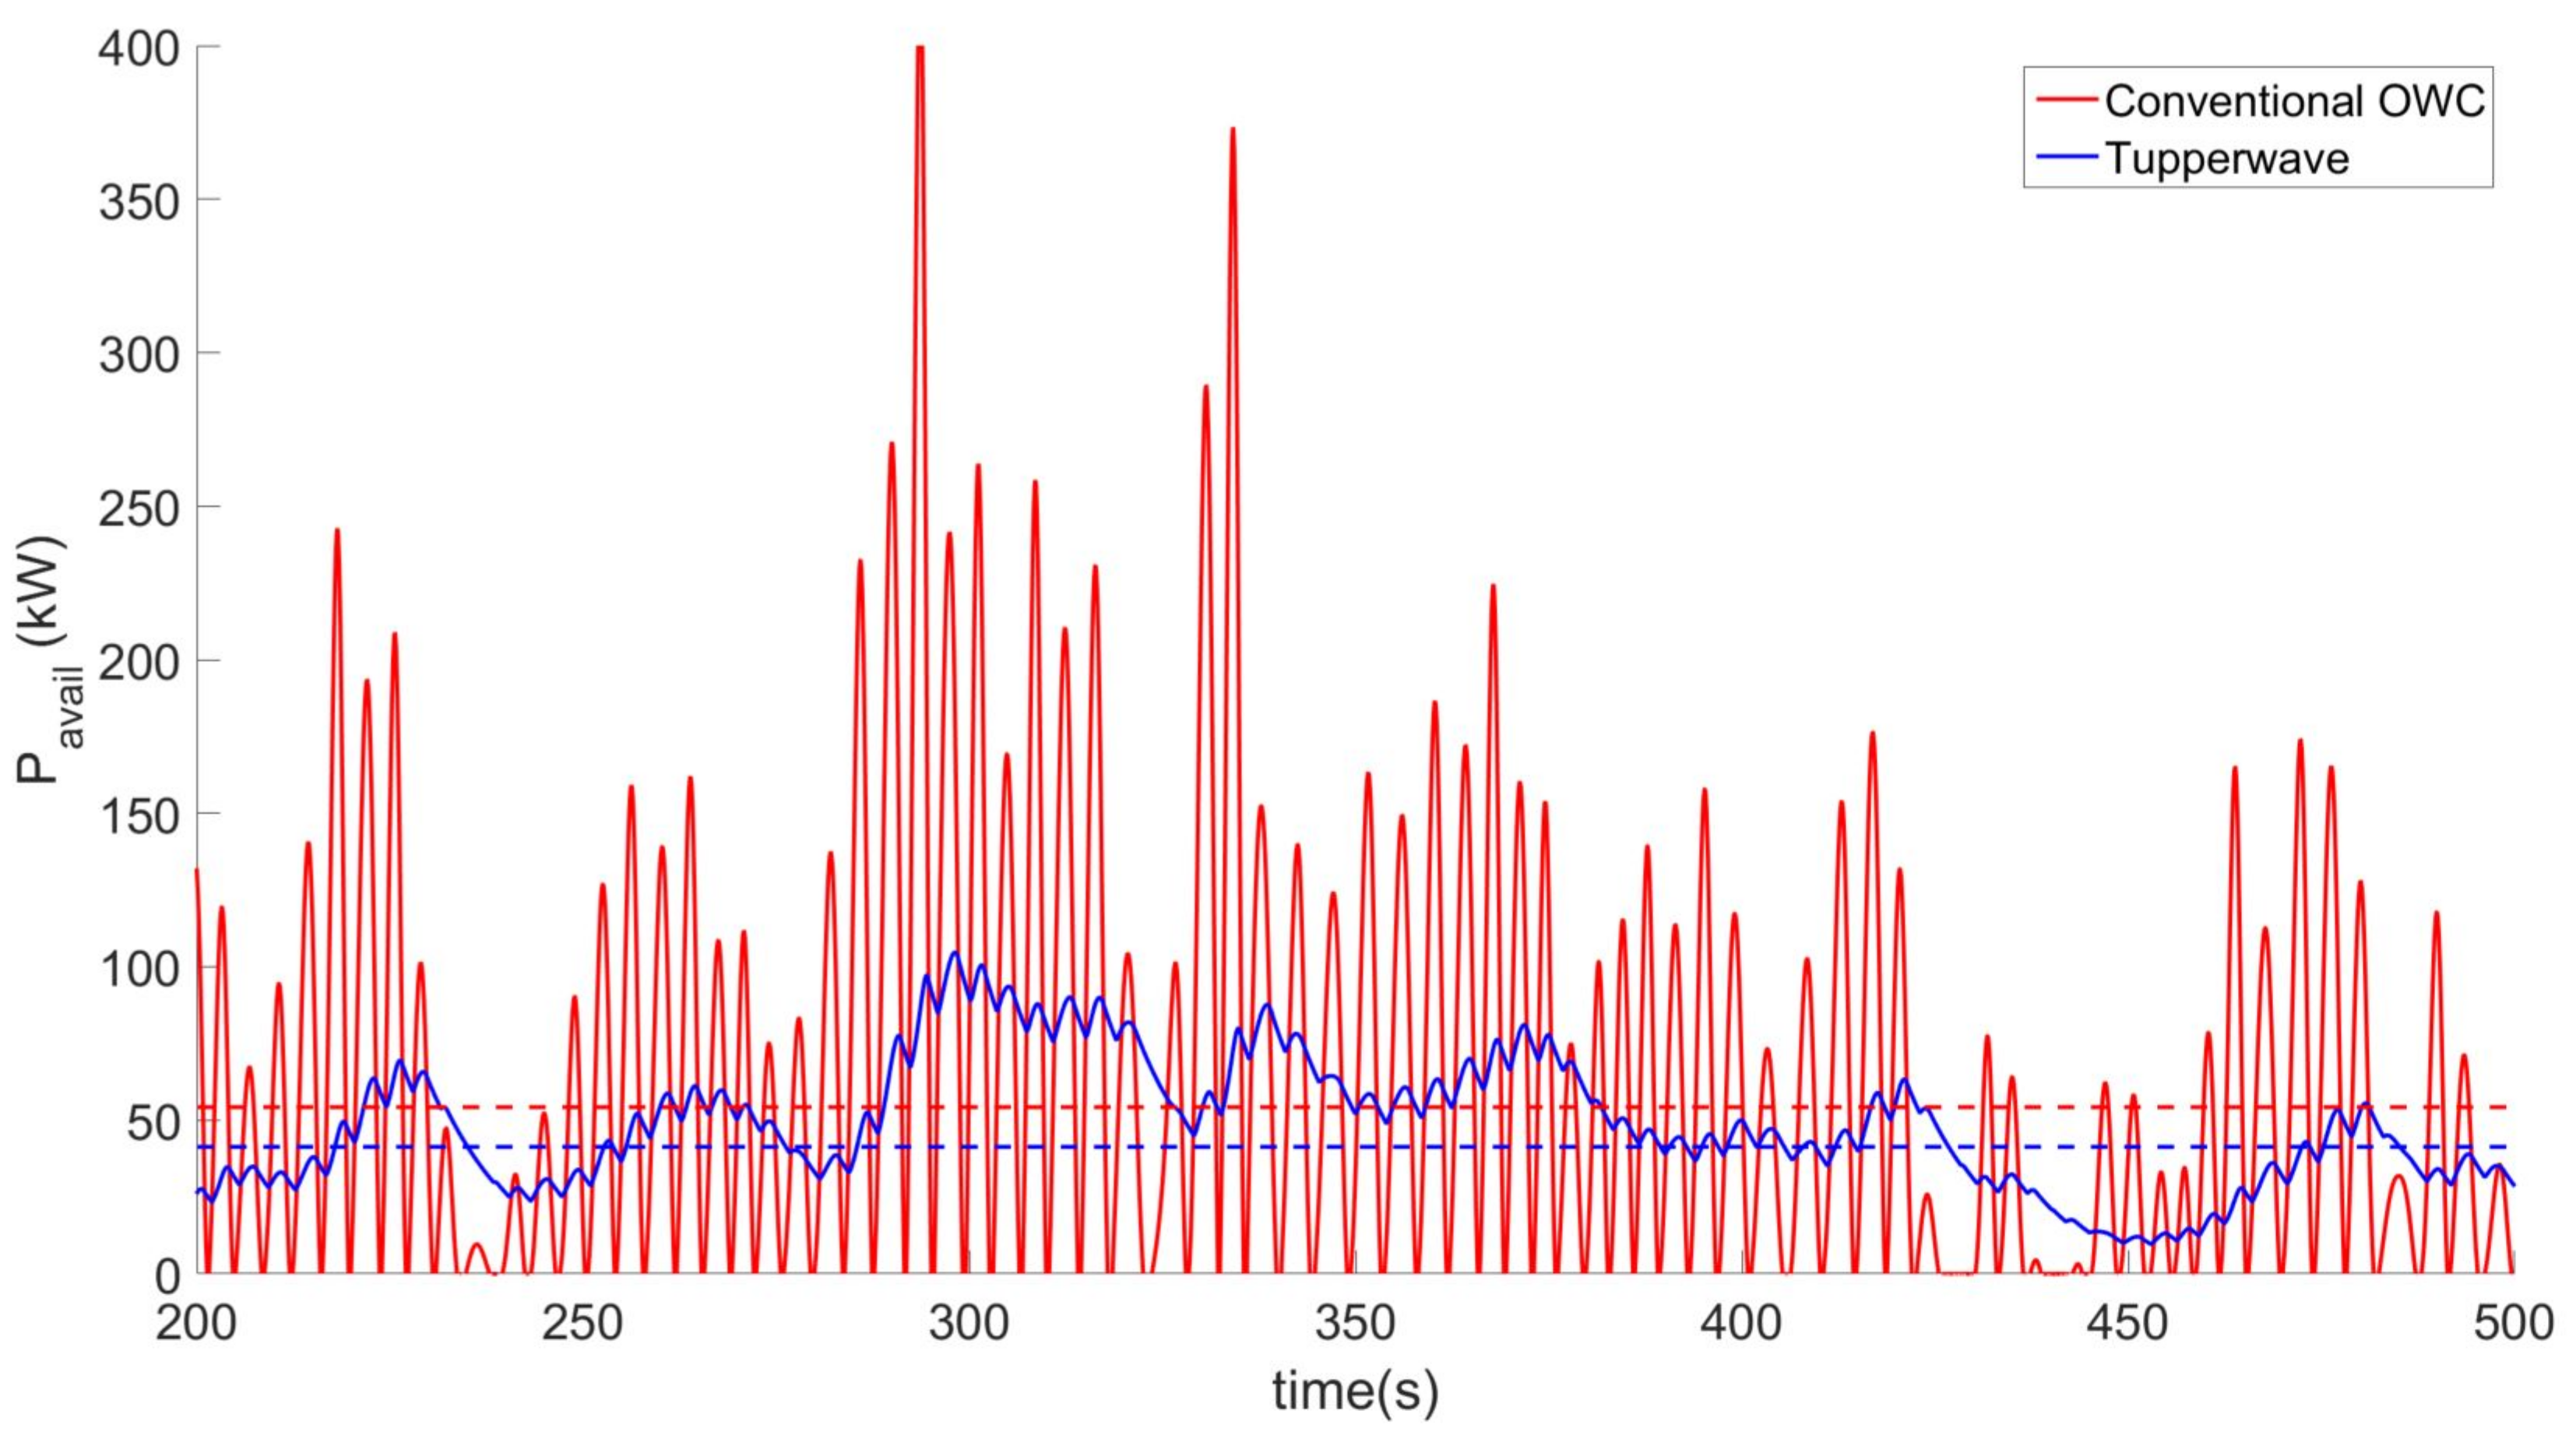
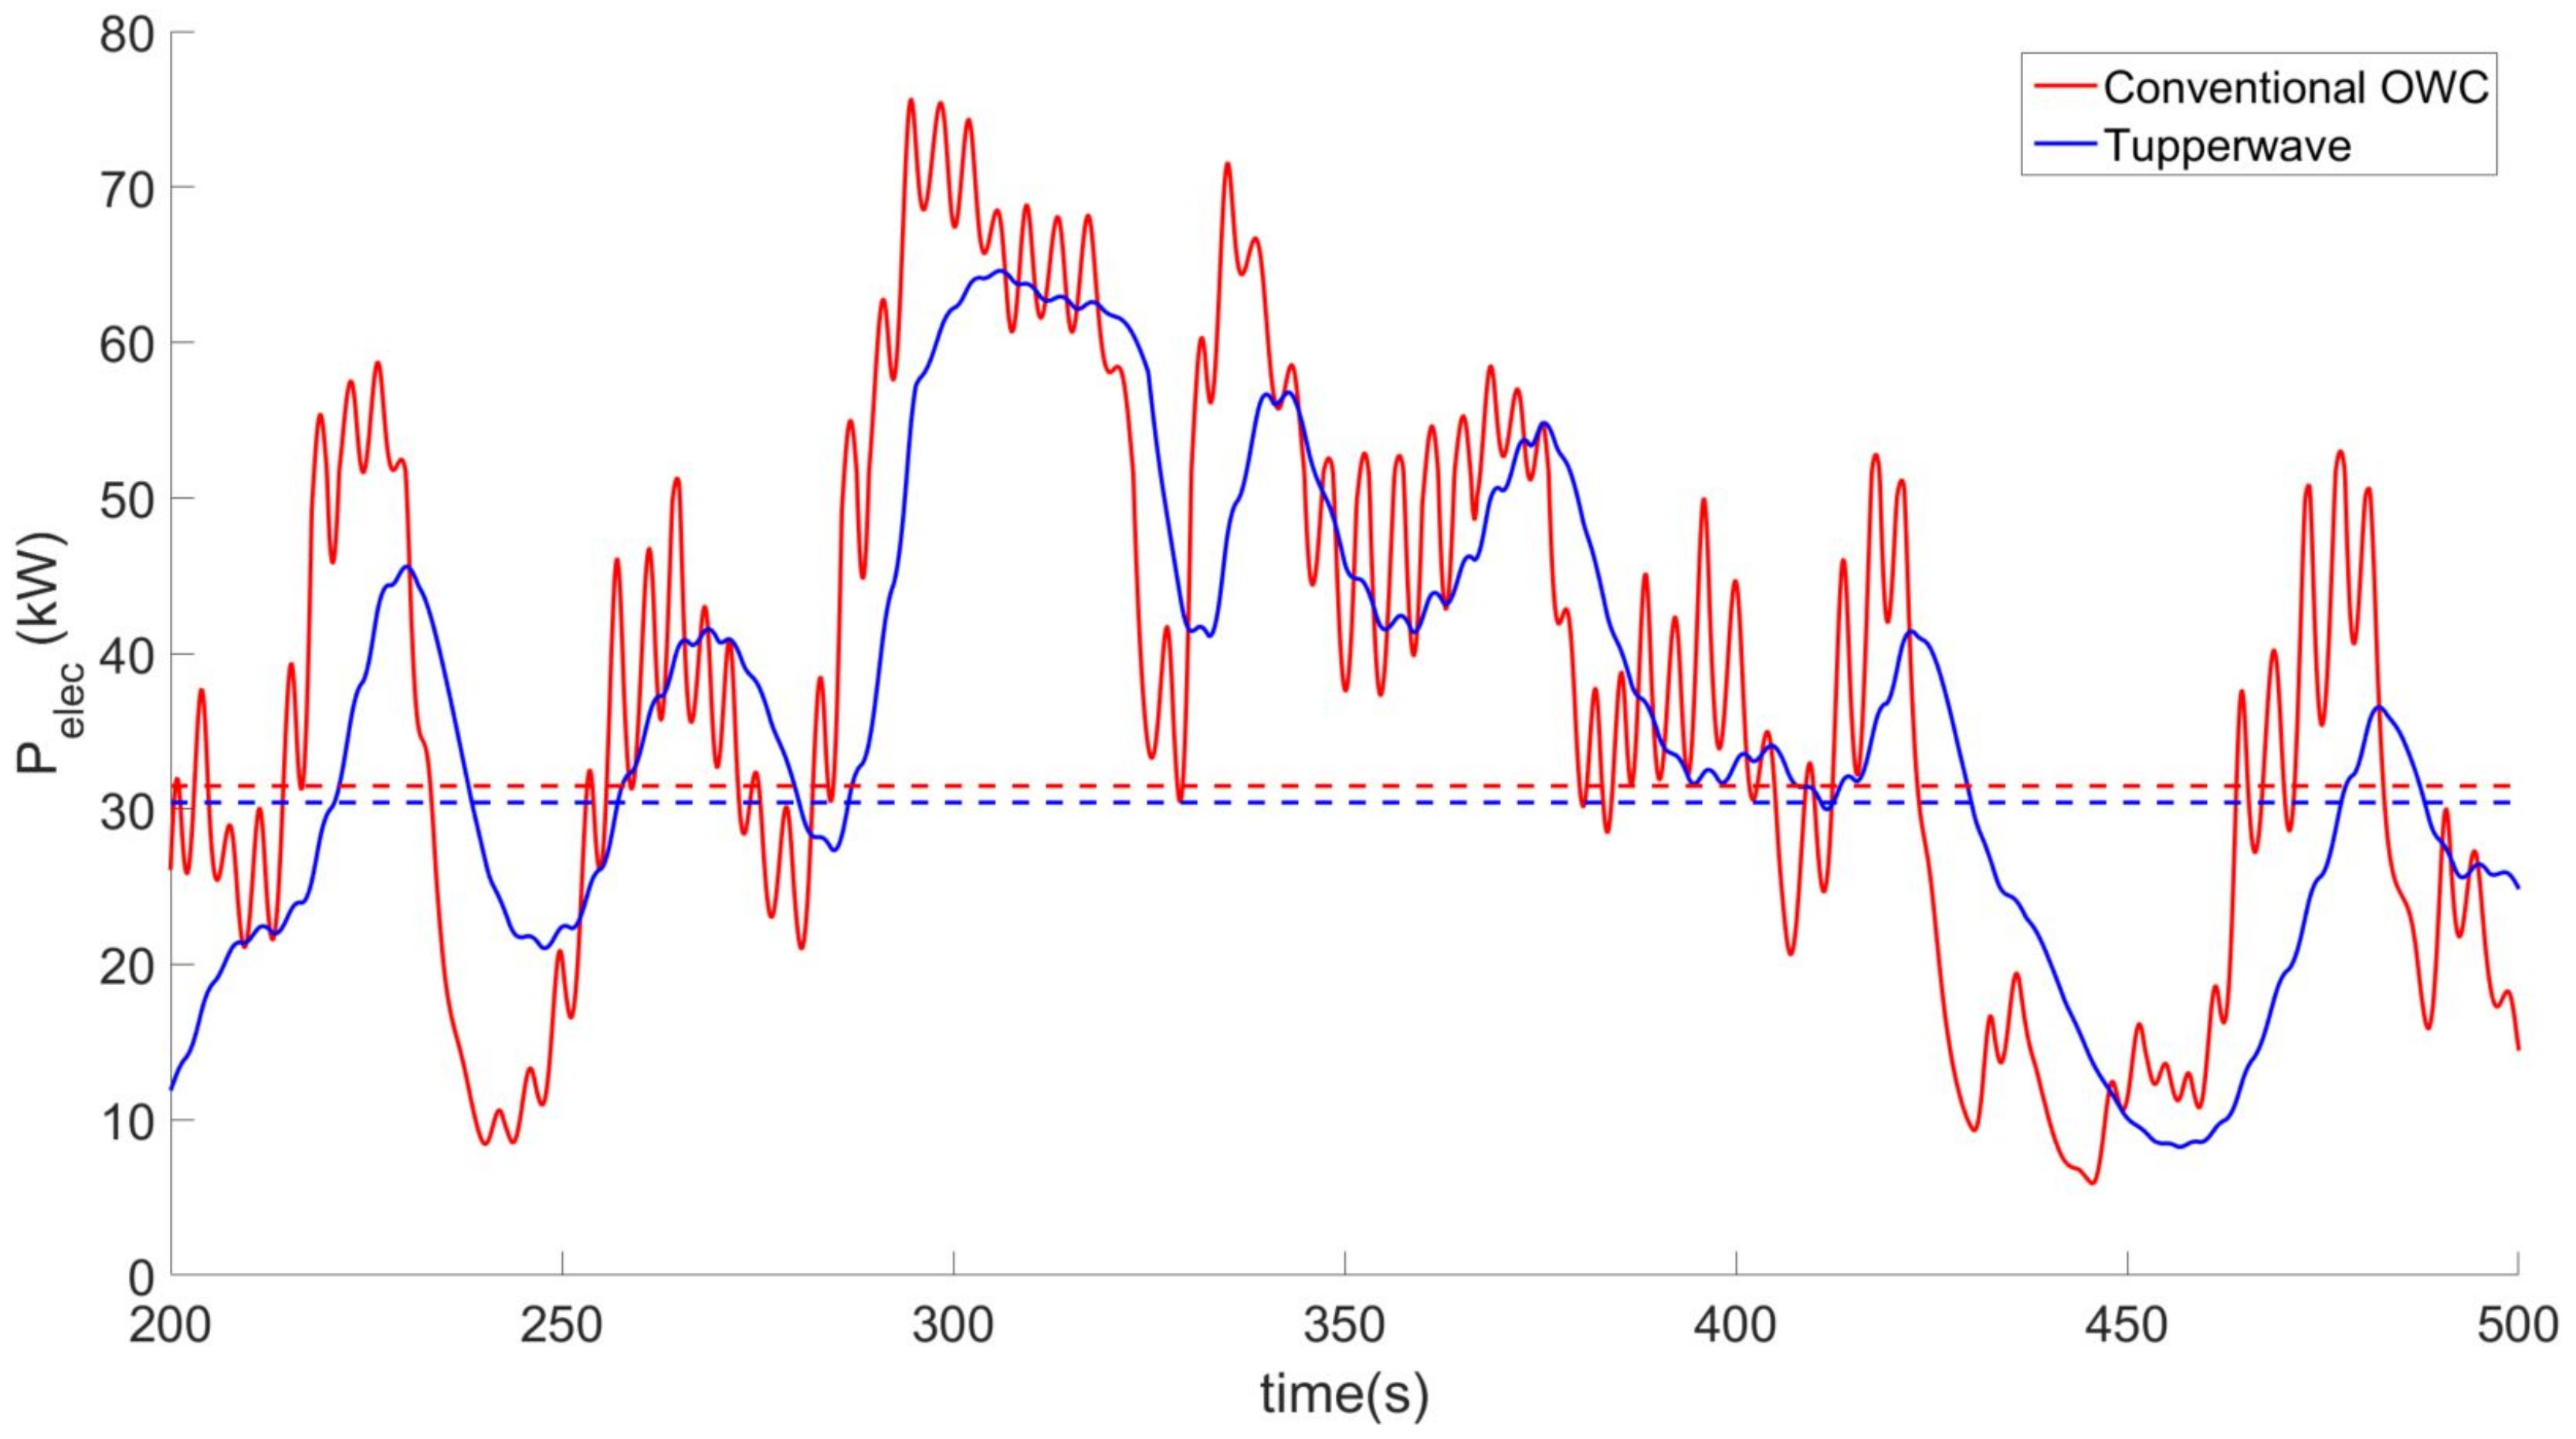
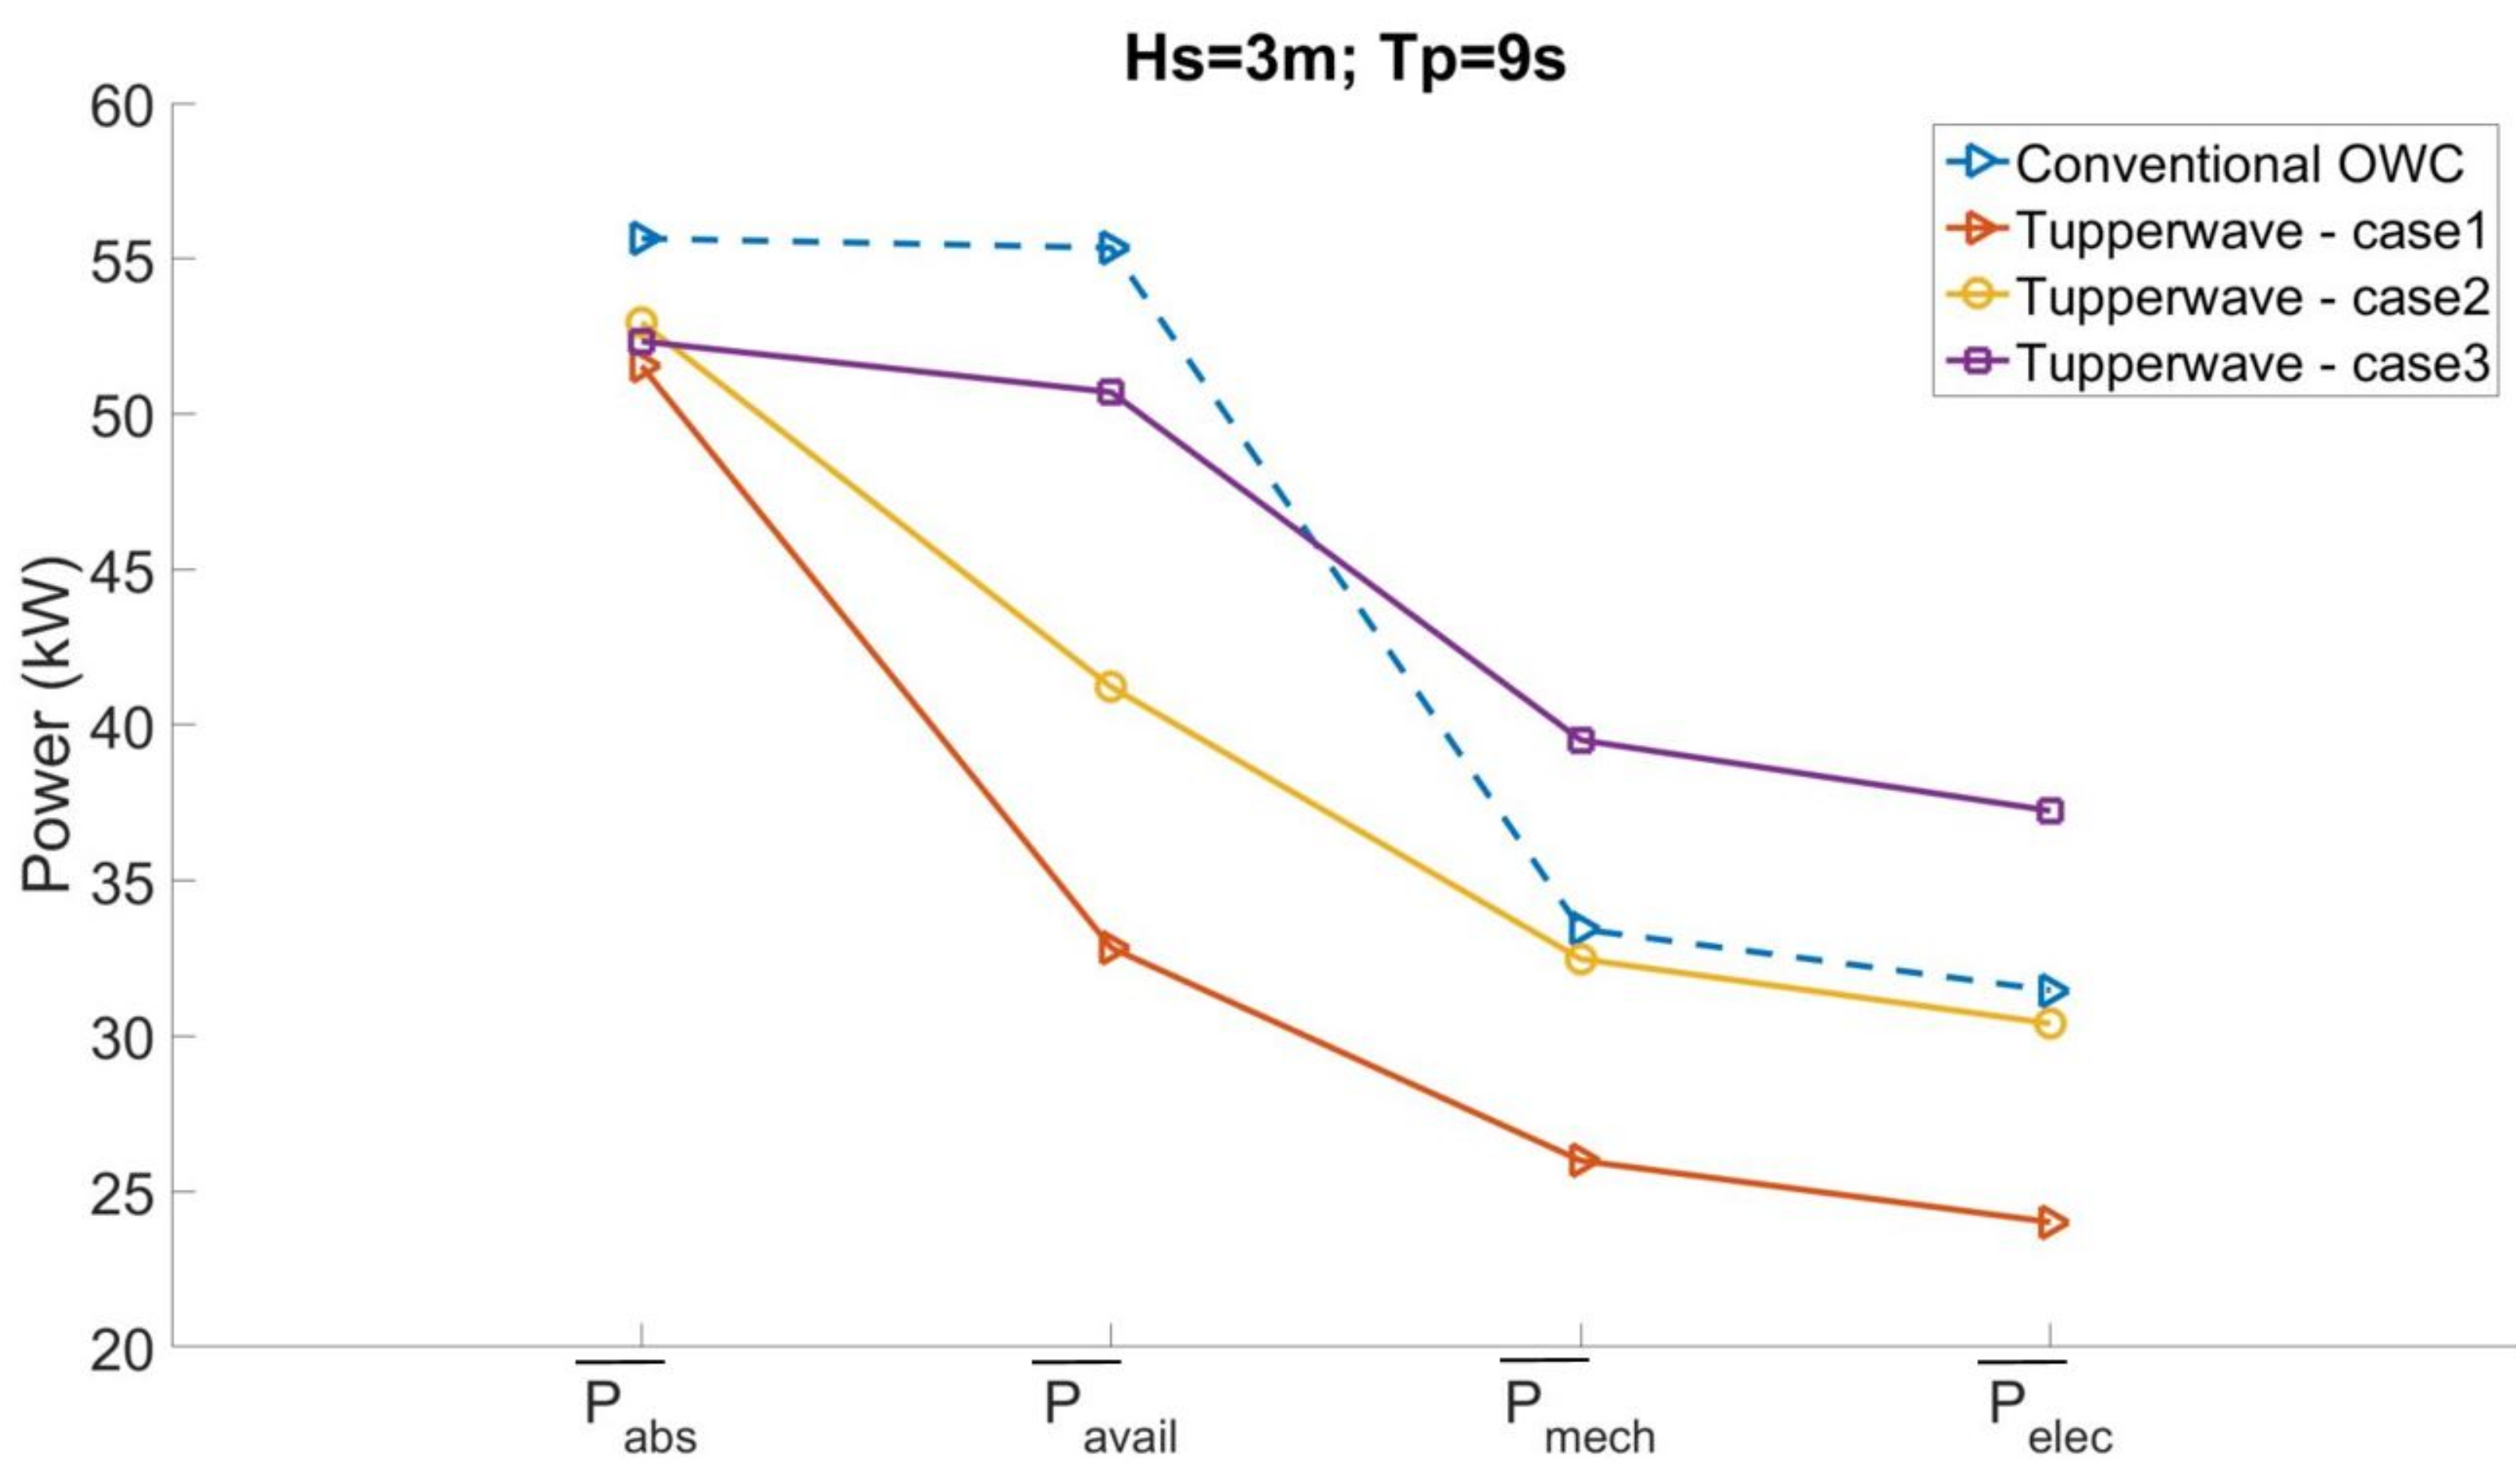
5.1. Along the Power Conversion Chain
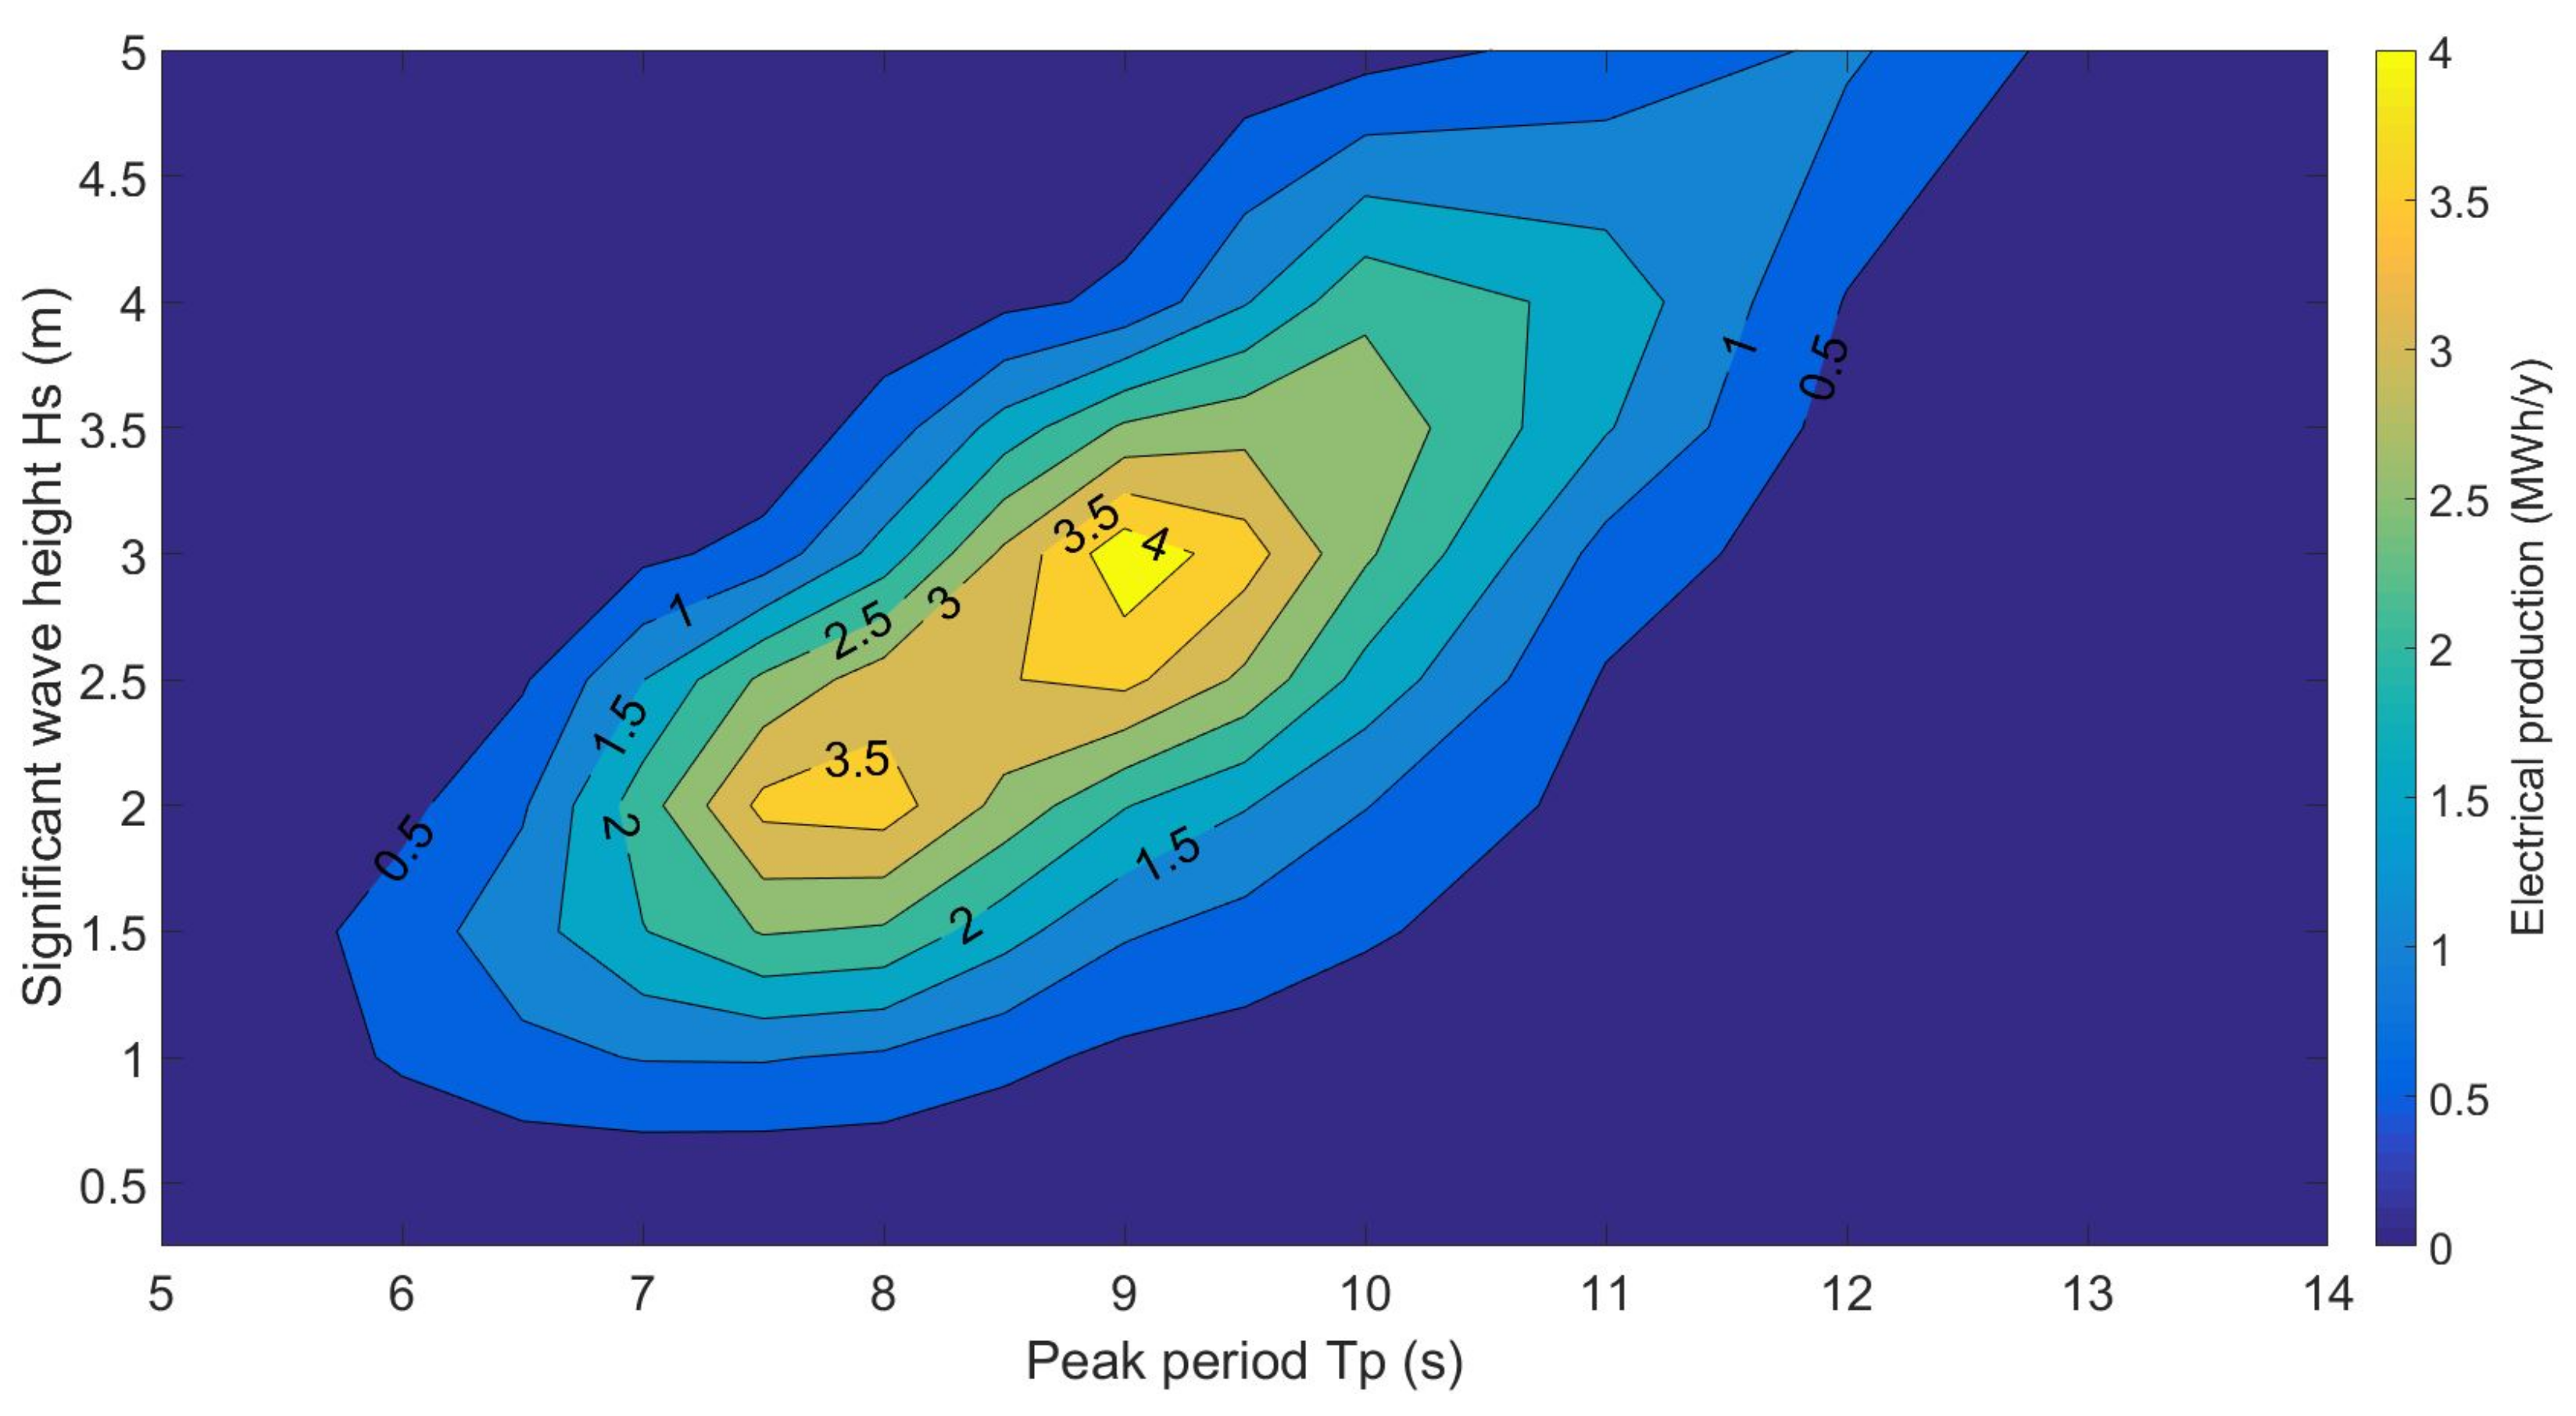
5.2. Yearly Power Performance Comparison
- Annual electrical power production.
- Electrical power fluctuation.
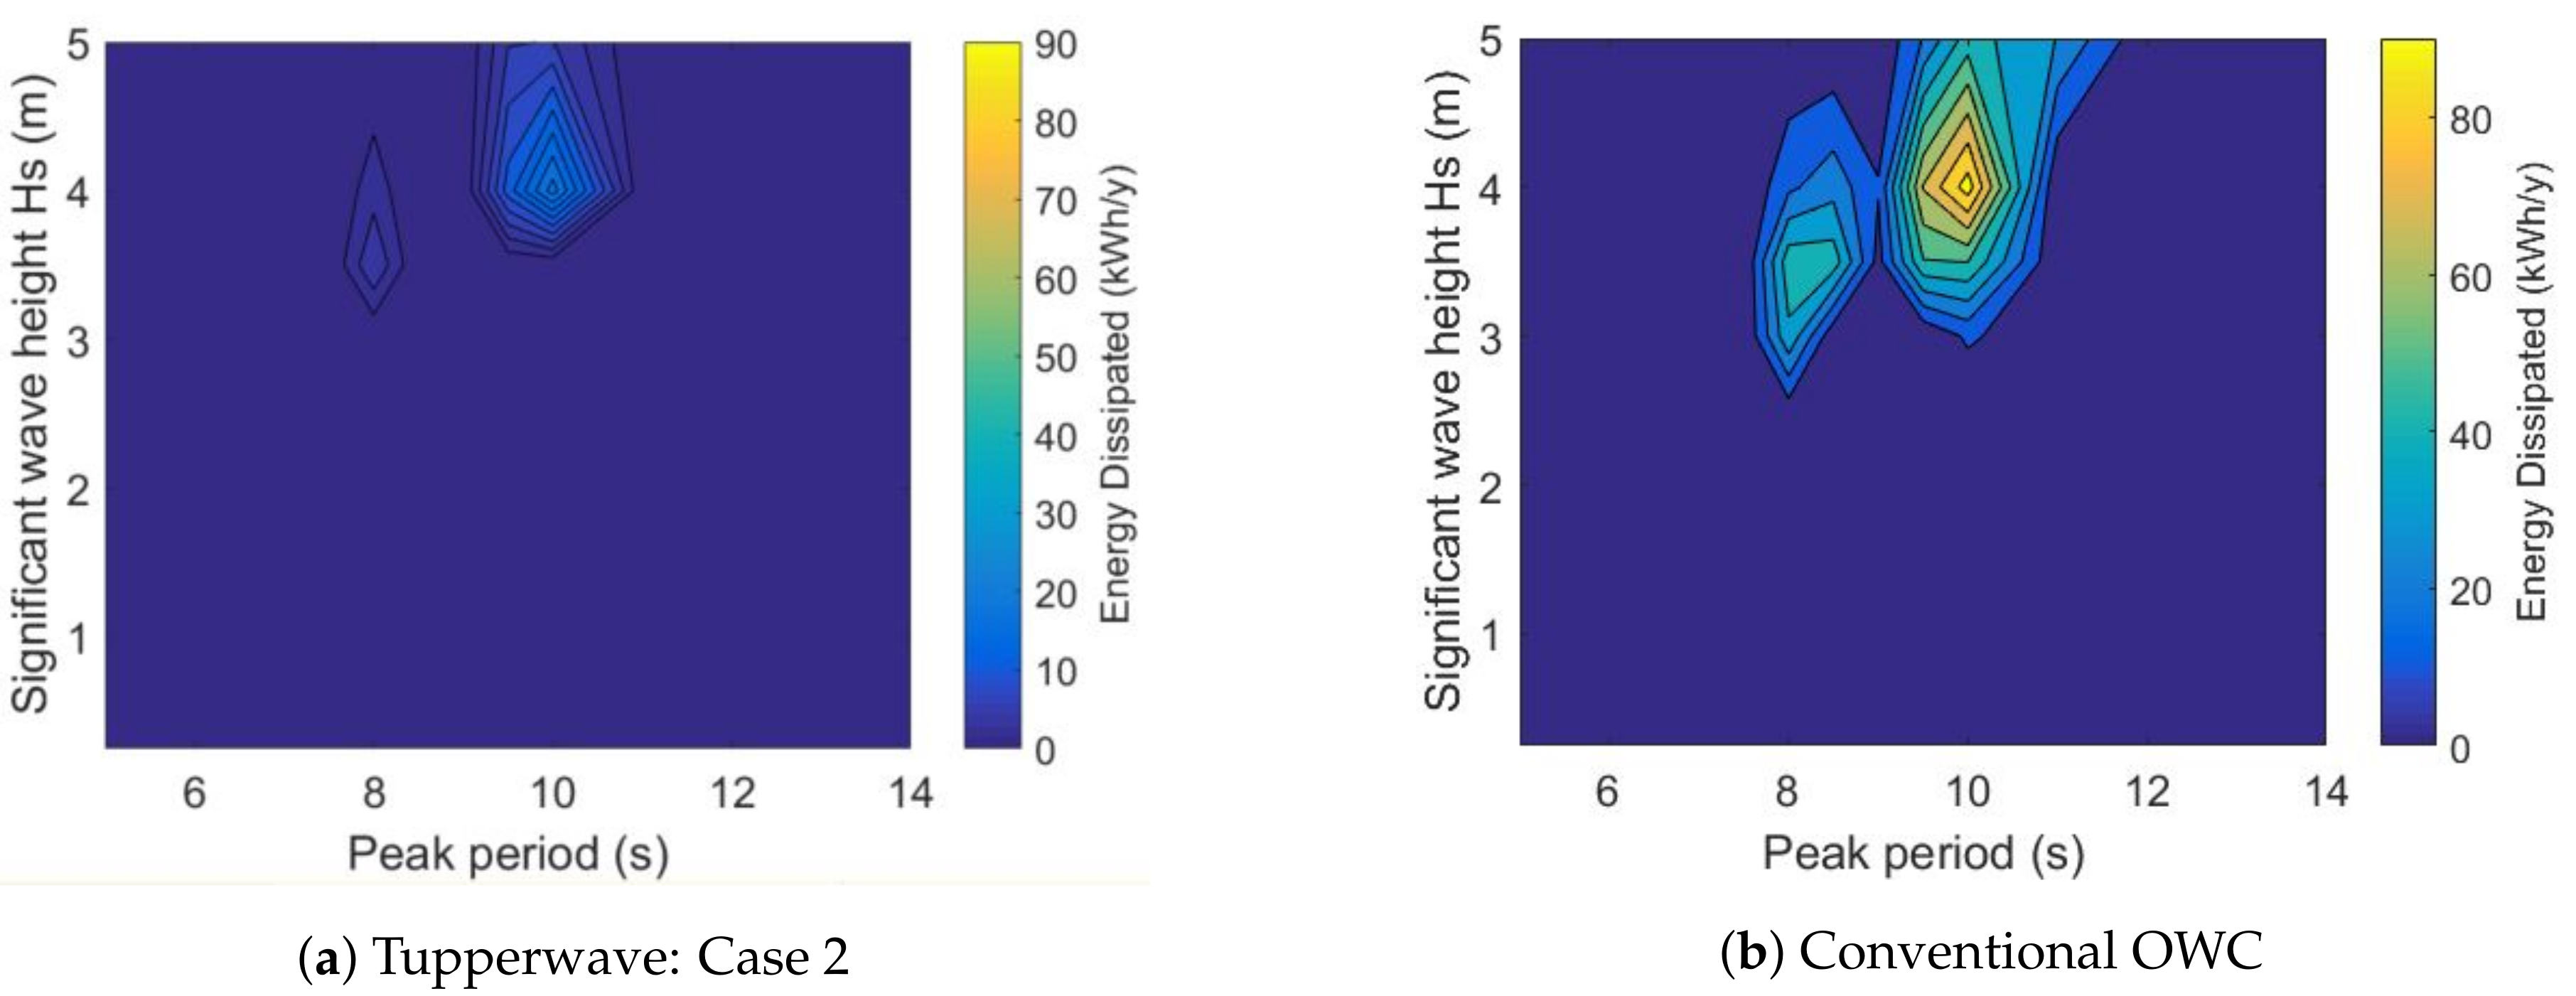
- Use of the security system (bypass valve).
6. Conclusions
Author Contributions
Funding
Acknowledgments
Conflicts of Interest
Abbreviations
| OWC | Oscillating Water Column |
| HP | High Pressure |
| LP | Low Pressure |
References
- Czech, B.; Bauer, P. Wave energy converter concepts: Design challenges and classification. IEEE Ind. Electron. Mag. 2012, 6, 4–16. [Google Scholar] [CrossRef]
- Falcão, A.F.O.; Henriques, J.C.C. Oscillating-water-column wave energy converters and air turbines: A review. Renew. Energy 2016, 85, 1391–1424. [Google Scholar] [CrossRef]
- Falcão, A.F.O.; Henriques, J.C.C.; Gato, L.M.C. Self-rectifying air turbines for wave energy conversion: A comparative analysis. Renew. Sustain. Energy Rev. 2018, 91, 1231–1241. [Google Scholar]
- Falcão, A.F.O.; Gato, L.; Nunes, E. A novel radial self-rectifying air turbine for use in wave energy converters. Part 2. Results from model testing. Renew. Energy 2013, 53, 159–164. [Google Scholar] [CrossRef]
- Lopes, B.S.; Gato, L.M.; Falcão, A.F.O.; Henriques, J.C.C. Test results of a novel twin-rotor radial inflow self-rectifying air turbine for OWC wave energy converters. Energy 2019, 170, 869–879. [Google Scholar] [CrossRef]
- Lopes, B. Construction and Testing of a Double Rotor Self-Rectifying Air Turbine Model for Wave Energy Recovery Systems. Language of Reference: Portuguese. Master’s Thesis, Tecnico Lisboa, Lisbon, Portugal, 2017. [Google Scholar]
- Borges, J.E. A Three-Dimensional Inverse Method for Turbomachinery: Part II—Experimental Verification. J. Turbomach. 1990, 112, 355–361. [Google Scholar] [CrossRef]
- Masuda, Y.; McCormick, M.E. Experiences in pneumatic wave energy conversion in Japan. In Utilization of Ocean Waves—Wave to Energy Conversion; American Society of Civil Engineers: New York, NY, USA, 1986; pp. 1–33. [Google Scholar]
- Kofoed, J.P.; Frigaard, P. Hydraulic Evaluation of the LEANCON Wave Energy Converter; DCE Techinal Reports; Department of Civil Engineering, Aalborg University: Aalborg, Denmark, 2008. [Google Scholar]
- Fleming, A.; MacFarlane, G.; Hunter, S.; Denniss, T. Power performance prediction for a vented oscillating water column wave energy converter with a unidirectional air turbine power take-off. In Proceedings of the 12th European Wave and Tidal Energy Conference. EWTEC, Cork, Ireland, 27 August–1 September 2017; p. 1204-1. [Google Scholar]
- Benreguig, P.; Murphy, J.; Sheng, W. Model scale testing of the Tupperwave device with comparison to a conventional OWC. In Proceedings of the ASME 2018 37th International Conference on Ocean, Offshore and Arctic Engineering OMAE2018, Madrid, Spain, 17–22 June 2018; American Society of Mechanical Engineers (ASME): New York, NY, USA, 2018. [Google Scholar]
- Benreguig, P.; Vicente, M.; Dunne, A.; Murphy, J. Modelling approaches of a closed-circuit OWC wave energy converter. J. Mar. Sci. Eng. 2019, 7, 23. [Google Scholar] [CrossRef]
- Vicente, M.; Benreguig, P.; Crowley, S.; Murphy, J. Tupperwave-preliminary numerical modelling of a floating OWC equipped with a unidirectional turbine. In Proceedings of the 12th European Wave and Tidal Energy Conference (EWTEC), Cork, Ireland, 27 August–1 September 2017. [Google Scholar]
- Kelly, J.F.; Wright, W.M.; Sheng, W.; O’Sullivan, K. Implementation and verification of a wave-to-wire model of an oscillating water column with impulse turbine. IEEE Trans. Sustain. Energy 2016, 7, 546–553. [Google Scholar] [CrossRef]
- Benreguig, P.; Pakrashi, V.; Murphy, J. Assessment of Primary Energy Conversion of a Closed-Circuit OWC Wave Energy Converter. Energies 2019, 12, 1962. [Google Scholar] [CrossRef]
- Sheng, W.; Alcorn, R.; Lewis, A. Assessment of primary energy conversions of oscillating water columns. I. Hydrodynamic analysis. J. Renew. Sustain. Energy 2014, 6, 053113. [Google Scholar] [CrossRef]
- Giorgi, G.; Ringwood, J.V. Consistency of viscous drag identification tests for wave energy applications. In Proceedings of the 12th European Wave and Tidal Energy Conference (EWTEC), Cork, Ireland, 27 August–1 September 2017. [Google Scholar]
- Falcao, A.F.; Justino, P.A.P. OWC wave energy devices with air flow control. Ocean Eng. 1999, 26, 1275–1295. [Google Scholar] [CrossRef]
- Rajput, R. A Textbook of Engineering Thermodynamics; Firewall Media/Laxmi Publications (P) Ltd.: New Delhi, India, 2010. [Google Scholar]
- Abdullah, M.A.; Yatim, A.H.M.; Tan, C.W.; Saidur, R. A review of maximum power point tracking algorithms for wind energy systems. Renew. Sustain. Energy Rev. 2012, 16, 3220–3227. [Google Scholar] [CrossRef]
- Faÿ, F.X.; Henriques, J.C.; Kelly, J.; Mueller, M.; Abusara, M.; Sheng, W.; Marcos, M. Comparative assessment of control strategies for the biradial turbine in the Mutriku OWC plant. Renew. Energy 2019, 146, 2766–2784. [Google Scholar] [CrossRef]
- Tedeschi, E.; Carraro, M.; Molinas, M.; Mattavelli, P. Effect of control strategies and power take-off efficiency on the power capture from sea waves. IEEE Trans. Energy Convers. 2011, 26, 1088–1098. [Google Scholar] [CrossRef]
- Penalba, M.; Ringwood, J.V. A reduced wave-to-wire model for controller design and power assessment of wave energy converters. In Advances in Renewable Energies Offshore, Proceedings of the 3rd International Conference on Renewable Energies Offshore (RENEW 2018), Lisbon, Portugal, 8–10 October 2018; CRC Press: Boca Raton, FL, USA, 2018; p. 379. [Google Scholar]
- Sheng, W.; Alcorn, R.; Lewis, A. A new method for radiation forces for floating platforms in waves. Ocean Eng. 2015, 105, 43–53. [Google Scholar] [CrossRef]
- Duclos, G.; Clément, A.H.; Chatry, G. Absorption of outgoing waves in a numerical wave tank using a self-adaptive boundary condition. Int. J. Offshore Polar Eng. 2001, 11. [Google Scholar]
- MATLAB, version 7.10.0 (R2010a); The MathWorks Inc.: Natick, MA, USA, 2010.
- Falcão, A.F.O.; Gato, L.M.C.; Henriques, J.C.; Borges, J.E.; Pereiras, B.; Castro, F. A novel twin-rotor radial-inflow air turbine for oscillating water column wave energy converters. Energy 2015, 93, 2116–2125. [Google Scholar] [CrossRef]
- Dick, E. Fundamentals of Turbomachines; Springer: Berlin/Heidelberg, Germany, 2015; Volume 109. [Google Scholar]
- Rea, J.A.; Kelly, J.F.; Alcorn, R.; O’Sullivan, D. Development and operation of a power take off rig for ocean energy research and testing. In Proceedings of the Ninth European Wave and Tidal Energy Conference EWTEC 2011, Southampton, UK, 5–9 September 2011. [Google Scholar]
- Kelly, J.F.; Christie, R. Applying Hardware-in-the-Loop capabilities to an ocean renewable energy device emulator. In Proceedings of the Twelfth IEEE International Conference on Ecological Vehicles and Renewable Energies (EVER), Monte Carlo, Monaco, 11–13 April 2017; pp. 1–7. [Google Scholar]
- O’Sullivan, D.L.; Lewis, A.W. Generator selection and comparative performance in offshore oscillating water column ocean wave energy converters. IEEE Trans. Energy Convers. 2011, 26, 603–614. [Google Scholar] [CrossRef]
- Falcão, A.F.; Henriques, J.C. The spring-like air compressibility effect in OWC wave energy converters: Hydro-, thermo- and aerodynamic analyses. In Proceedings of the ASME 2018 37th International Conference on Ocean, Offshore and Arctic Engineering, Madrid, Spain, 17–22 June 2018. [Google Scholar]
- Blavette, A.; O’Sullivan, D.L.; Lewis, A.W.; Egan, M.G. Impact of a wave farm on its local grid: Voltage limits, flicker level and power fluctuations. In Proceedings of the 2012 IEEE Oceans-Yeosu, Yeosu, Korea, 21–24 May 2012; pp. 1–9. [Google Scholar]
- O’Sullivan, D.; Salcedo, F.; Blavette, A.; Santos, M.; Lewis, A. Case studies on the benefits of energy storage for power quality enhancement: Oscillating water column arrays. In Proceedings of the 4th International Conference on Ocean Energy (ICOE2012), Dublin, Ireland, 17–19 October 2012; Volume 1719. [Google Scholar]


| Unidirectional | Twin-Rotor | |
|---|---|---|
| 0.053 | 0.07 | |
| (rpm) | 4000 | 1000 |
| 2.8 | 9.8 | |
| D (m) | 0.5 | 1.10 |
| Tupperwave | Conventional OWC | ||
|---|---|---|---|
| Turbine | Type | Unidirectional radial inflow turbine | Self-rectifying radial inflow twin-rotor turbine |
| Diameter (m) | 0.50 | 1.10 | |
| Inertia (kg·m) | 1.7 | 38 | |
| Max. efficiency (%) | 86.6 | 73.9 | |
| Gearbox | Gearing Ratio | 4 | 1 |
| Generator | Rated power (kW) | 100 | |
| Inertia () | 3.6 | ||
| Design speed (rpm) | 1000 | ||
| Max. speed (rpm) | 2000 | ||
| Min. speed (rpm) | 400 | ||
| Tupperwave | Conventional OWC | |||
|---|---|---|---|---|
| = 1.5 m; = 7.5 s | 0.954 | 0.956 | 0.953 | 0.990 |
| = 2 m; = 8 s | 0.978 | 0.958 | 0.959 | 0.990 |
| = 3 m; = 9 s | 0.974 | 0.961 | 0.944 | 0.985 |
| Tupperwave Valves | (Pa) | |
|---|---|---|
| Case 1 | 1700 | 0.286 |
| Case 2 | 150 | 0.286 |
| Case 3 | 150 | 1.3 |
| Tupperwave | Conventional OWC | ||||
|---|---|---|---|---|---|
| Valve characteristics | case 1 | case 2 | case 3 | case 2 | - |
| Flywheel inertia (N·m) | - | - | - | 36.3 | - |
| Annual electrical production (MWh) | 70.6 | 97.6 | 119.5 | 99.3 | 99.9 |
| Average power fluctuation (%) | 64.9 | 55.0 | 55.1 | 23.2 | 70.2 |
| Annual pneumatic energy dissipated in bypass valves (MWh) | 0.009 | 0.051 | 0.619 | 0.012 | 0.582 |
| Bypass valve opening per year | 44 | 287 | 3209 | 65 | 8537 |
© 2019 by the authors. Licensee MDPI, Basel, Switzerland. This article is an open access article distributed under the terms and conditions of the Creative Commons Attribution (CC BY) license (http://creativecommons.org/licenses/by/4.0/).
Share and Cite
Benreguig, P.; Kelly, J.; Pakrashi, V.; Murphy, J. Wave-to-Wire Model Development and Validation for Two OWC Type Wave Energy Converters. Energies 2019, 12, 3977. https://doi.org/10.3390/en12203977
Benreguig P, Kelly J, Pakrashi V, Murphy J. Wave-to-Wire Model Development and Validation for Two OWC Type Wave Energy Converters. Energies. 2019; 12(20):3977. https://doi.org/10.3390/en12203977
Chicago/Turabian StyleBenreguig, Pierre, James Kelly, Vikram Pakrashi, and Jimmy Murphy. 2019. "Wave-to-Wire Model Development and Validation for Two OWC Type Wave Energy Converters" Energies 12, no. 20: 3977. https://doi.org/10.3390/en12203977
APA StyleBenreguig, P., Kelly, J., Pakrashi, V., & Murphy, J. (2019). Wave-to-Wire Model Development and Validation for Two OWC Type Wave Energy Converters. Energies, 12(20), 3977. https://doi.org/10.3390/en12203977