Abstract
The global greenhouse effect makes carbon dioxide (CO2) emission reduction an important task for the world, however, CO2 can be used as injected fluid to develop shale oil reservoirs. Conventional water injection and gas injection methods cannot achieve desired development results for shale oil reservoirs. Poor injection capacity exists in water injection development, while the time of gas breakthrough is early and gas channeling is serious for gas injection development. These problems will lead to insufficient formation energy supplement, rapid energy depletion, and low ultimate recovery. Gas injection huff and puff (huff-n-puff), as another improved method, is applied to develop shale oil reservoirs. However, the shortcomings of huff-n-puff are the low sweep efficiency and poor performance for the late development of oilfields. Therefore, this paper adopts firstly the method of Allied In-Situ Injection and Production (AIIP) combined with CO2 huff-n-puff to develop shale oil reservoirs. Based on the data of Shengli Oilfield, a dual-porosity and dual-permeability model in reservoir-scale is established. Compared with traditional CO2 huff-n-puff and depletion method, the cumulative oil production of AIIP combined with CO2 huff-n-puff increases by 13,077 and 17,450 m3 respectively, indicating that this method has a good application prospect. Sensitivity analyses are further conducted, including injection volume, injection rate, soaking time, fracture half-length, and fracture spacing. The results indicate that injection volume, not injection rate, is the important factor affecting the performance. With the increment of fracture half-length and the decrement of fracture spacing, the cumulative oil production of the single well increases, but the incremental rate slows down gradually. With the increment of soaking time, cumulative oil production increases first and then decreases. These parameters have a relatively suitable value, which makes the performance better. This new method can not only enhance shale oil recovery, but also can be used for CO2 emission control.
1. Introduction
The global greenhouse effect makes CO2 emission reduction an important task for the world, however, CO2 can be applied to develop shale oil reservoirs. Shale oil reservoirs are related to high total organic carbon (TOC), with an estimated reserve that is equal to 345 billion barrels of oil worldwide [1,2]. Although shale oil is a potential unconventional energy resource with huge reserves, it is difficult to exploit efficiently due to its small pore throats and ultra-low permeability of micro to nano Darcy [3]. At present, long horizontal wells and multi-stage hydraulic fracturing technology are used to develop shale oil reservoirs [4], which makes economic development of shale oil reservoirs possible. However, the primary oil recovery factor is usually less than 8% due to the ultra-low matrix permeability [5], leading to large amounts of crude oil remaining in the shale formation. Horizontal well depletion development begins with a high production rate, then quickly declines and stabilizes at the low production rate [6]. Therefore, it is extremely important to inject fluid into the formation, supplementing formation energy. Nevertheless, in shale oil reservoirs, water is hard to inject into the formation due to extremely low porosity and permeability, leading to high injection pressure and low injection rate [7]. The existence of natural and hydraulic fractures aggravates the heterogeneity of shale reservoirs, which makes injected water tend to inflow high permeability channels, resulting in much limited sweep efficiency and incremental water cut [8].
For shale oil reservoirs, gas injection is easier to inject into the formation than water injection or other fluids. Commonly injected gases include carbon dioxide, hydrocarbon gases, nitrogen, and gas mixtures [9]. Cheng studied the effect of different gas injection on oil recovery through experiments. Experimental results show that under the same conditions, the oil recovery of CO2 is the highest, CH4 is the second, and N2 is the lowest. Similar results are obtained from numerical simulation [10]. Therefore, it is generally believed that carbon dioxide is a more suitable gas type for gas injection [11]. CO2 injection is currently used in 65% of the world’s gas-injection projects [12]. The main mechanism of CO2 flooding is that CO2 is miscible with crude oil through multiple contacts. When carbon dioxide flows in porous media, it can cause the change of components between carbon dioxide and crude oil then generate miscible fluid. This multi-contact miscible process is a phase equilibrium process with the change of reservoir temperature, pressure, and crude oil composition [13]. Immiscible CO2 flooding also produces oil based on the principle of phase equilibrium. The mechanism of CO2 injection for enhancing recovery chiefly includes the following aspects [14]: (1) increasing formation pressure; (2) reducing oil viscosity; (3) inflating crude oil; (4) extracting the light component of crude oil; and (5) reducing interfacial tension.
The low sweep efficiency caused by gas channeling leads to the insufficient effect of CO2 injection [15], hence some experts put forward the method of gas injection huff-n-puff to improve the effect of gas injection. Song used experimental techniques to estimate the performance of the CO2 huff-n-puff process in Bakken tight oil reservoir [16]. A string of displacement experiments was conducted with Bakken tight core samples to compare water flooding, immiscible CO2 huff-n-puff, near-miscible CO2 huff-n-puff, and miscible CO2 huff-n-puff. Compared with water flooding, immiscible CO2 huff-n-puff has a higher recovery of 51.5%, while near-miscible and miscible CO2 huff-n-puff have a higher recovery of 61% and 63%, respectively. Pu investigated CO2 huff-n-puff process through core experiments, indicating that CO2 huff-n-puff is a viable technique to enhance oil recovery (EOR) [17]. Janiga Damian conducted laboratory core experiments to obtain valuable information. At the same time, experiments were combined with the numerical representation of core samples to generate a reliable model for process optimization [18]. By matching experimental data, Song further evaluated the performance of oilfield-scale CO2 huff-n-puff through numerical simulation [16]. Based on the historical matching model, the development parameters such as gas injection volume, soaking time, and production pressure are optimized in the CO2 huff-n-puff process. Pavel Zuloaga simulated and analyzed the effect of the CO2 huff-n-puff process on enhanced oil recovery by using a numerical model with oilfield-scale [19]. The sensitivity analyses of four parameters, such as well number, well pattern, matrix permeability, and half-length of fracture, were studied through simulation design. The results showed that the influence of matrix permeability is the largest, followed by the influence of well pattern, half-length of fracture and well number. Zhang Yuan studied the effects of matrix permeability, CO2 injection rate, and stress-dependent deformation mechanism on the CO2 huff-n-puff process by numerical simulation [20]. It is concluded that the effects of CO2 diffusion and nano-pore constraints on enhanced oil recovery should be considered into the reservoir simulation model. The CO2 huff-n-puff process is notably affected by CO2 injection rate, matrix permeability, and stress-related deformation mechanism. Besides, Daniel Sanchez-Rivera also optimized the huff-and-puff process in the Bakken shale through numerical reservoir simulation [21]. It is found that the final recovery factor will be reduced if the huff-n-puff is carried out too early, while shorter soaking time is preferable to longer soaking time. Natural fracture networks make huff-n-puff better, allowing the injection fluid to penetrate the formation and come into contact with more fluids.
Although gas injection huff-n-puff improves development efficiency, its coverage is limited, only around horizontal wells [22]. Chen et al. put forward the method of multi-stage injection-production between fractures in the same fractured horizontal well [23]. The injection-production separation device and injection-production valve are used to achieve the injection-production between fractures. Odd hydraulic fractures inject fluid and even hydraulic fractures produce fluid, which turns inter-well displacement into inter-fracture displacement. The new technology has a higher oil production than the CO2 huff-n-puff, with longer stable production period, smaller decline rate, and better performance. Based on the principle of inter-fracture injection and production in the same well, Yu et al. proposed the technology of asynchronous injection alternating production for different wells [24]. Two horizontal wells, as an injection-production unit, can be designed as symmetrical distribution of injection fracture and dislocation distribution of injection fracture according to the location of injection fracture. At the same time, the working system of synchronous or asynchronous injection-production can be adopted. This method further expands the sweep range.
Although other experts have proposed some innovative exploit methods with great theoretical value, it is difficult to implement them in oil fields because of the complex technology and high production cost [25]. This paper firstly proposes to use Allied In-Situ Injection and Production (AIIP) technology combined with CO2 huff-n-puff to develop shale oil reservoirs, which can not only improve shale oil recovery, but also be used for CO2 emission control.
2. Allied In-Situ Injection and Production Technology
2.1. Principles of AIIP
In previous work, our research team proposed a method for improving oil recovery in tight oil reservoirs, Cumulative In-situ Injection and Production (CIIP) or inter-fracture injection and production (IFIP) [23,25]. The CIIP method divides a multi-stage hydraulic fracturing horizontal well into several parts. As shown in Figure 1, some of the fractures inject fluids (water or gas) into the formation and the neighboring fractures produce oil. There are three periods for CIIP process: (1) injection period: production fractures are closed and gas is injected through injection fractures; (2) soaking period: both production and injection fractures are closed and soak for several days; (3) production period: production segments are opened to produce oil while injection segments remain closed. In previous simulation work, we studied the feasibility of CIIP for improving oil recovery in tight oil reservoirs. CIIP has better EOR performance than traditional CO2 huff-n-puff due to higher displacement efficiency among hydraulic fractures. Although CIIP can significantly improve the performance of gas injection, there are several disadvantages: first, CIIP can improve oil recovery in the stimulated reservoir volume (SRV) area, but CIIP has limited displacement efficiency for the area far from the SRV (NSRV) zone; second, the implementation for CIIP is complicated and expensive, it requires high level quality for modification; third, with the existence of complex natural fractures and micro hydraulic fractures in SRV area, gas breakthrough might easily occur during CIIP process, resulting in limited sweep efficiency [26].
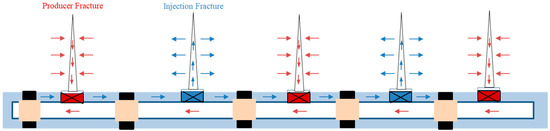
Figure 1.
Sketch of Cumulative In-situ Injection and Production (CIIP).
In order to improve the limitation of CIIP and make an easier way to modify the horizontal well, Allied In-Situ Injection and Production Technology (AIIP) is proposed. AIIP is a novel approach, conducting fluid injection and oil production in different segments of the same well. Figure 2 illustrates the design of AIIP graphically. Instead of dividing horizontal wells into several parts, AIIP divides hydraulic fractures in a horizontal well into three parts: the adjacent wellhead part as the production section (Red segment), the far wellhead part as the fluid injection section (Blue segment), and the middle part as the packer section between the production section and the injection section (Grey segment). AIIP needs to design special strings and devices for injection and production in the same well. The packer section needs to inject gelling agent to seal the formation and prevent mutual interference of injection and production in the same well. Figure 3 illustrates the well pattern and schedule of AIIP. The production section accounts for about two-thirds of the total length of the horizontal section and is suitable for the use of long hydraulic fractures. The injection section accounts for about one-third of the total length of the horizontal section and is suitable for the use of short hydraulic fractures. There are three periods for AIIP process: (1) injection period: the production segments are closed and gas is injected through injection segment; (2) soaking period: both of the production and injection segments are closed and soak for several days, like huff-n-puff; (3) production period: the production segments are opened to produce oil while the injection segments remain closed. Compared with the CIIP method, AIIP method has an easier implementation procedure and cheaper cost than CIIP. Additionally, AIIP can not only enhance oil recovery in the NSRV area, but ignore the potential possibility of gas breakthrough among hydraulic fractures. These advantages remedy the shortcoming of CIIP. Therefore, AIIP is a promising and more practical method to improve oil recovery in tight oil reservoirs than CIIP.
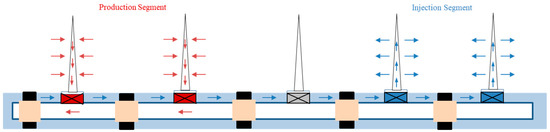
Figure 2.
Sketch of Allied In-Situ Injection and Production Technology (AIIP).
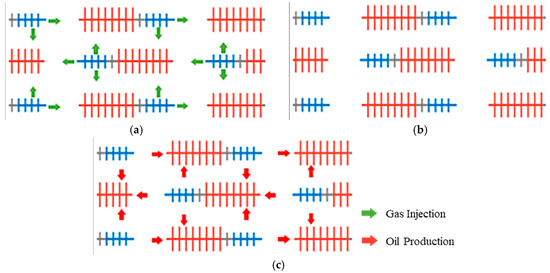
Figure 3.
Design schematic diagram of AIIP. (a) Injection period; (b) soaking period; (c) production period.
2.2. Implementation Procedure
AIIP can be used for displacement or huff-n-puff, as well as for different injection fluids. Therefore, it is feasible to develop shale oil reservoirs by combining AIIP with CO2 huff-n-puff. In order to meet the requirements of injection and production in the same well, the packer device enables the tubing to be used for production and the tubing-casing annulus to be used for fluid injection. The electric valves control well injection volume and production volume to meet the production requirements of tight and shale oil reservoirs. Besides, the flowmeter can monitor the injection rate in real time, and then technicians can optimize the injection and production on the ground. For example, when gas channeling occurs, the injection rate can be reduced or the valve can be closed for some time. The explicit implementation process of AIIP can follow the steps below.
- (1)
- Select an appropriate block for drilling a series of horizontal wells where no fault exists nearby.
- (2)
- Horizontal wells use the multi-stage hydraulic fracturing technique, and well logging or micro-seismic monitoring is used for obtaining fracture conditions.
- (3)
- The reservoir undergoes depletion until the pressure drops bubble point pressure.
- (4)
- Insert special pipe string and device, then select appropriate fractures as production section and injection section respectively.
- (5)
- Select a section between the production section and the injection section as the packer section and inject the gelling agent into it to isolate the formation.
- (6)
- First, open the electric injection valve to inject a certain amount of carbon dioxide. Then close the injection valve and soak the well for some time. In the end, open the production valve and begin oil production.
For ensuring the performance of AIIP, it is necessary to identify the distribution of faults and fractures through micro-seismic monitoring, so as to prevent horizontal wells from being arranged in areas with faults or dense fractures. As a novel technology, AIIP has higher well completion requirements than conventional horizontal wells. First of all, it is necessary to put down tubing and packers to ensure the injection and production of fluid in the same well. At the same time, the electric injection valve is an important component, which must ensure that the valve can work durably and steadily in the underground.
3. Numerical Simulation
3.1. Reservoir Characteristics
In order to evaluate the performance of AIIP combined with CO2 huff-n-puff in shale oil reservoirs, this paper chooses the shale oil reservoir in Z Sag of Shengli Oilfield as the target block and establishes a numerical simulation model. Z Sag belongs to a third-level tectonic unit in Bohai Bay Basin and is located in the northeast of J depression with an area of about 2800 km2 [27]. The whole is distributed in a trumpet-like shape from southwest to northeast, and the depression can be subdivided into several secondary tectonic units. The reservoir depth is about 3025–3075 m and the pay thickness is 20–30 m. The lithology is mainly argillaceous limestone with a high brittle mineral content of 81.6% on average. The average pore volume of the reservoir is 4.1 μL/g, and the pore connectivity is good. The average proportion of centrifugal movable shale oil is as high as 38.80%. Other reservoir parameters are listed in Table 1, including effective reservoir thickness, porosity, permeability, oil saturation, formation pressure, formation temperature, etc. In summary, this reservoir is a favorable section for shale oil exploration in this area [28].

Table 1.
Reservoir properties.
The shale oil density of 0.79–0.954 g/cm3, the gas-oil ratio of 5–350.1 m3/m3, is medium crude oil. The viscosity of crude oil is 0.4–40 mPa·s (at the temperature of 20 °C and the pressure of 0.1 MPa). The bubble point pressure of the crude oil is 17 MPa. Formation fluids are difficult to flow due to the poor reservoir physical properties, but formation overpressure can provide energy for flowing. Initial oil saturation averages 60%. The immovable oil mainly exists in the small pore, while the movable oil mainly exists in the large pore [29]. The salinity of formation water is 10,000–20,000 mg/L and the formation water is a CaCl2 type.
3.2. Model Description
This work uses CMG simulation software. The compositional model was built by CMG GEM model. The CMG-WINPROP module was used for oil component lumping, according to the fluid properties of the target reservoir. In order to speed up the numerical simulation and ensure the accuracy of the calculation results, we divided the crude oil components into seven pseudo-components by analyzing the data of crude oil components in the study area. The data of seven pseudo-components are listed in Table 2 and Figure 4 shows the pressure-temperature (P-T) phase diagram of crude oil. Based on the above reservoir characteristics and properties, a model using the number of 258 × 49 × 1 grid blocks with dimensions of 15 × 15 × 20 m was built (Table 3). Considering the characteristics of natural fractures reservoir, according to reservoir parameters in the study area and referring to the commonly used methods for numerical simulation of shale oil reservoirs in the United States [30,31], a dual-porosity and dual-permeability model with reservoir-scale was established to simulate and evaluate the performance of AIIP combined with CO2 huff-n-puff in shale oil reservoirs. According to the development experience of shale reservoirs at home and abroad, the study area adopted a long horizontal well row for development (Figure 5a) [32]. For simulating AIIP’s process, two additional horizontal wells were arranged in the same location of one horizontal well. Producer with whole horizontal length (e.g., Well-5 in Figure 5b) was used for simulating oil production during primary stage. Producer with around 2/3 of horizontal length (e.g., Producer-5 in Figure 5b) was used for simulating oil production through production segment during AIIP stage. Injector with around 1/3 of horizontal length (e.g., Injector-5 in Figure 5b) was used for simulating gas injection through the injection segment during AIIP stage. Hydraulic fractures were simulated by using the Log Grid Refinement (LGR) method (Table 4). At the initial stage, the method of depletion development was adopted. After the production declines, the AIIP development was adopted.
Table 2.
Data of seven pseudo-components.
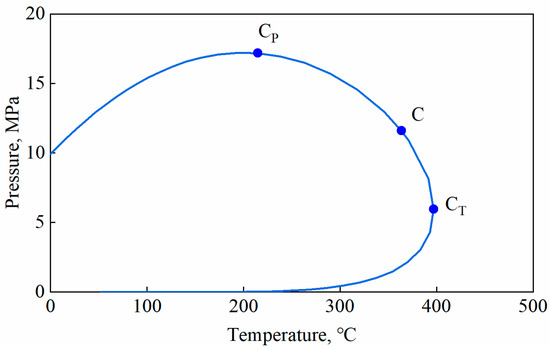
Figure 4.
P-T phase diagram of crude oil.
Table 3.
Numerical simulation model parameters.
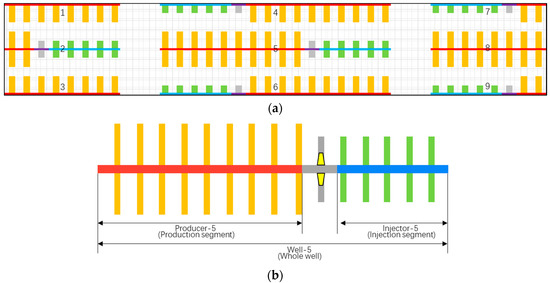
Figure 5.
Diagram of simulation model. (a) Injection-production well pattern in the study area; (b) sketch for three horizontal wells in the same location in the model.
Table 4.
Parameters for the Log Grid Refinement (LGR) method.
3.3. Case Comparison
In order to compare the performance of depletion, CO2 huff-n-puff, and AIIP, we set up three cases for comparison.
- (1)
- Case A: Depletion for 12 years.
- (2)
- Case B: Depletion for 3 years, CO2 huff-n-puff development for 4 years, depletion development for 5 years.
- (3)
- Case C: Depletion for 3 years, AIIP development for 4 years, depletion for 5 years.
Depletion produces, with the minimum bottom-hole flowing, a pressure of 25 MPa and the maximum liquid production of 30 m3/d. The difference of schedule is that AIIP and CO2 huff-n-puff require cyclic gas injection and huff-n-puff. The schedule of CO2 huff-n-puff and AIIP development is shown in Table 5. Finally, the injection and production parameters are optimized through sensitivity analysis, including injection rate, injection volume, soaking time, hydraulic fracture half-length, and hydraulic fracture spacing.
Table 5.
Schedule of CO2 huff-n-puff and AIIP development.
4. Results and Discussion
4.1. EOR Performance of AIIP
Figure 6 compares the performances of AIIP, CO2 huff-n-puff, and depletion development. The cumulative oil production of depleted development in the single well is 30,510 m3, that of CO2 huff-n-puff development in the single well is 34,883 m3, and that of AIIP development in the single well is 47,960 m3. The cumulative oil production of AIIP in the single well is the highest. Under the same CO2 injection volume in the single well, the AIIP method has a better formation energy supplement effect and higher cumulative oil production in the single well because of short injection horizontal section length and high injection pressure (Figure 7). With the increment of huff-n-puff cycles, the oil production of the traditional horizontal well using gas injection huff-n-puff method decreases in each cycle, but the oil production of the AIIP method increases first and then decreases, and the oil production of each cycle is greater than that of the traditional huff-n-puff method (Figure 8). Through the above comprehensive comparison, the performance of AIIP method is the best.
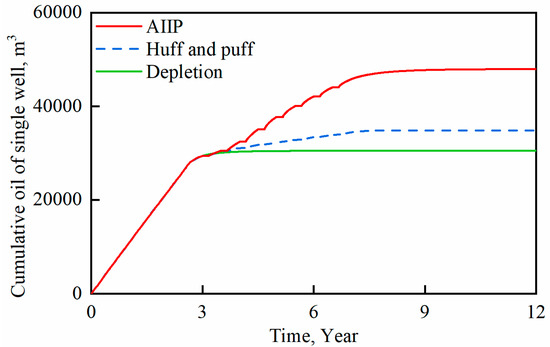
Figure 6.
Comparisons of cumulative oil production in different development modes.
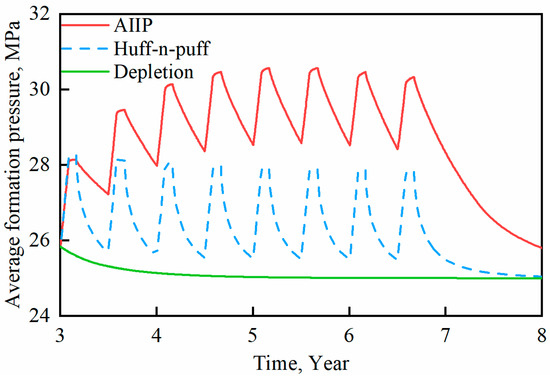
Figure 7.
Average formation pressure variation in the production process.
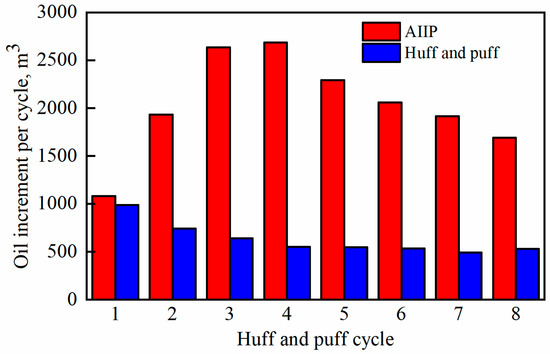
Figure 8.
Comparisons of oil increment in different huff-n-puff cycles.
4.2. Sensitivity Analysis
The feasibility analysis shows that AIIP combined with CO2 huff-n-puff has a good application prospect for the development of shale oil reservoirs. In this part, the influence of different parameters on the performance of AIIP will be studied through sensitivity analyses. The major influential parameters include gas injection rate, gas injection volume, soaking time, hydraulic fracture length, and hydraulic fracture spacing.
4.2.1. Effect of CO2 Injection Rate
With the same CO2 injection volume, the difference of injection rate will also exert certain influence on the performance of AIIP theoretically. A higher injection rate can inject the set CO2 volume within a shorter time with higher injection pressure. A lower injection rate can extend the duration of the injection stage, allowing more CO2 to dissolve into the oil for a longer time. Hence, it is necessary to study the effect of injection rate on AIIP.
For sensitivity analyses of this parameter, a total of four groups of different injection rate are designed, as shown in Table 6. In the four groups of schemes, injection rate and duration of the injection stage are different in each cycle. In order to ensure comparability of each scheme, the injection volume, duration of soaking stage, and duration of production stage were set to be the same within each cycle of each scheme, so as to compare the influence of gas injection rate on the performance of AIIP. As shown in Figure 9 and Table 7, with the increment of gas injection rate, the cumulative oil production of the single well increases in turn within 5 years of development. In a certain period of time, the higher injection rate can shorten the time required for one cycle, and the total production period is longer in a certain period, but the cumulative oil production in one cycle is slightly lower than that in the lower injection rate. However, the influence of injection rate is relatively small for the cumulative oil production of the single well over a given period time, so the injection rate is not the main factor affecting the performance of AIIP (Figure 10).
Table 6.
CO2 injection rate in different schemes.
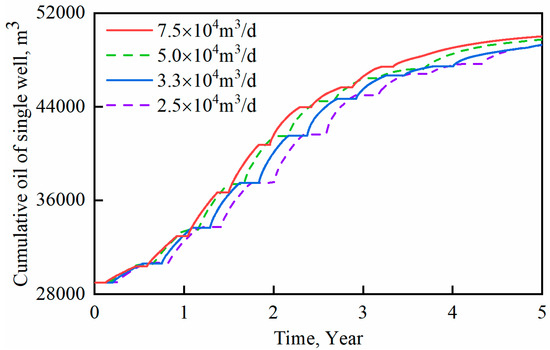
Figure 9.
Comparison of cumulative oil production of the single well in each scheme under different CO2 injection rates.
Table 7.
Calculation results of different injection rates.
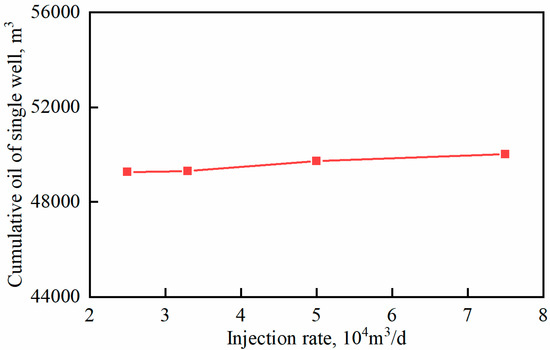
Figure 10.
The relationship between cumulative oil production and CO2 injection rate in the single well.
4.2.2. Effect of CO2 Injection Volume
The CO2 injection volume is one of the important factors that affect the performance of AIIP. With the increment of CO2 injection volume, formation energy can be fully supplemented, and better development results can be achieved. On the other hand, excessive CO2 injection volume will lead to the high bottom-hole pressure rise in the injection section. Limited by the capacity of gas injection equipment, there is a maximum CO2 injection pressure, beyond which, it is impossible to continuously inject CO2 into the formation. Therefore, it is an important task to determine a reasonable CO2 injection volume for the target block.
For sensitivity analyses of this parameter, a total of five groups of different injection volume were designed, as shown in Table 8. In the five groups of schemes, the volume of CO2 injected into the single well is different during each cycle. To ensure the comparability between schemes, different CO2 injection rates and the same injection stage time were set for each scheme, so as to compare the influence of CO2 injection volume on the performance of AIIP. As shown in Figure 11 and Table 9, with the increment of CO2 injection volume, the injection pressure at the end of the injection stage increases in turn, and the cumulative oil production of AIIP also increases in turn, but the incremental rate gradually slows down (Figure 12). In addition, when the injection volume is 1.5 × 10⁶ m3, the highest bottom-hole pressure in the injection section can reach 43.4 MPa, which is close to the maximum injection pressure of the injection equipment. Therefore, CO2 injection volume has a great impact on the performance of the AIIP method.
Table 8.
CO2 injection volume in different schemes.
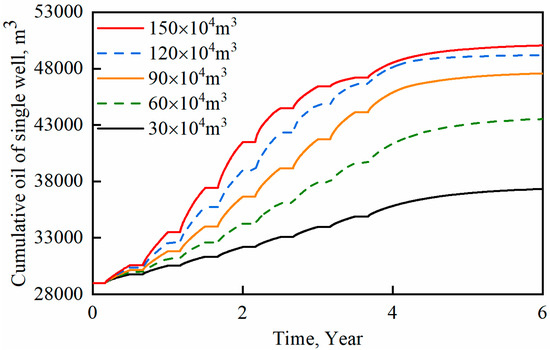
Figure 11.
Comparison of cumulative oil production of the single well in each scheme under different CO2 injection volumes.
Table 9.
Calculation results of different injection volumes.
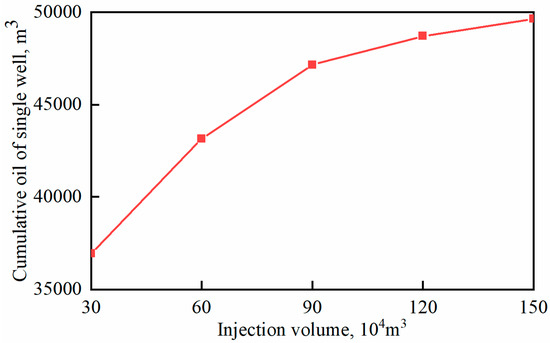
Figure 12.
The relationship between cumulative oil production and CO2 injection volume in the single well.
4.2.3. Effect of CO2 Soaking Time
For the CO2 huff-n-puff process, the soaking stage is of great significance to the performance of CO2 huff-n-puff. During the soaking stage, injected CO2 will gradually dissolve into the crude oil and bring about oil expansion, viscosity reduction, and other oil-increment effects, thereby promoting pressure propagation. Similarly, soaking time also has a certain impact on the performance of the AIIP method. If the soaking time is too short, CO2 cannot be fully dissolved, and pressure cannot be fully propagated. Excessive soaking time will lead to a large pressure propagation range and poor formation energy supplement effect. At the same time, a longer shut-in period will lead to lower cumulative oil production in a certain amount of time. Hence, the reasonable soaking time of AIIP method should be determined.
For sensitivity analyses of this parameter, a total of five groups of different soaking time were designed, as shown in Table 10. In the five groups of schemes, the soaking time is different during each cycle. In order to ensure the comparability of each scheme, the duration of injection stage, duration of production stage and gas injection volume were set to be the same within each cycle of each scheme, so as to compare the impact of soaking time on the performance of AIIP. As shown in Figure 13 and Table 11, with the increment of soaking time, the cumulative oil production of the single well within 5 years of development increases first and then decreases. In a certain period, shorter soaking time can shorten the time required for one cycle, and thus the AIIP with more cycles can be carried out. Although longer soaking time can improve AIIP in one cycle, excessive soaking time leads to fewer cycles of AIIP, shorter total production period, and lower oil production. Compared with different schemes, the 30-day soaking time is shorter, and the cumulative oil production of the single well is the highest (Figure 14).
Table 10.
Soaking time in different schemes.
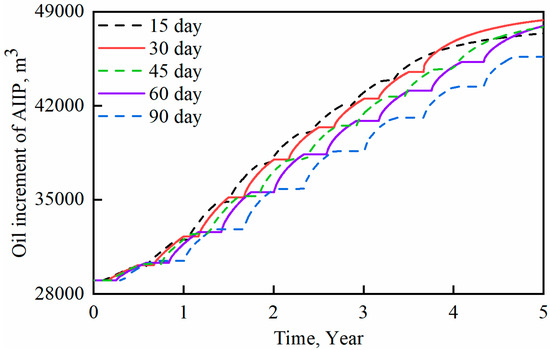
Figure 13.
Comparison of oil increment of AIIP in each scheme under different soaking times.
Table 11.
Calculation results of different soaking times.
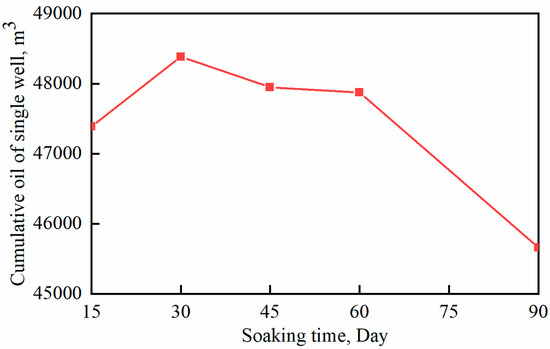
Figure 14.
The relationship between cumulative oil production and soaking time in the single well.
4.2.4. Effect of Fracture Half-Length
Fracture length has a great influence on shale oil reservoir development. Effective fracturing can facilitate fluid flow in the shale reservoir and increase oil production of the horizontal well. For CO2 huff-n-puff or AIIP, on the one hand, the increment of fracture length can facilitate the flow of injected gas, expand the contact area between injected gas and matrix, and promote the effect of oil increment. On the other hand, the excessively long length of some fractures will lead to the rapid flow of injected gas along with the fractures, forming gas channeling, and pressure leakage during the soaking stage, resulting in poor pressure level. Therefore, it is necessary to determine the effect of fracture length on the performance of the AIIP method.
For sensitivity analyses of this parameter, a total of four groups of different fracture lengths were designed, as shown in Table 12. Among the four groups of schemes, three groups of horizontal wells have different hydraulic fracture half-lengths, comparing the influence of different fracture half-length on the effect of AIIP. In another scheme, a small number of hydraulic fracture lengths were set to be relatively long to simulate the pressure leakage caused by excessively long hydraulic fractures. As shown in Figure 15 and Table 13, the cumulative oil production of the single well increases in turn with the increment of fracture half-length, and the long fracture scheme produces more oil in the first three cycles of AIIP. With the increment of huff-n-puff cycles, the oil production of the long-fracture scheme in a single cycle is gradually lower than that of the short-fracture scheme after three cycles. Figure 16 and Figure 17 compare the cumulative oil production and daily oil production between the ideal model and the model with fracture connectivity. When there is fracture connectivity between wells, the existence of long fractures can achieve a better effect in the first two cycles, but the oil production gradually decreases in the subsequent cycles. The connection of fractures leads to gas channeling, resulting in a poor pressure maintenance effect in the soaking period (Figure 18). Therefore, if the hydraulic fracture is connected, the performance of AIIP will become worse.
Table 12.
Fracture half-length in different schemes.
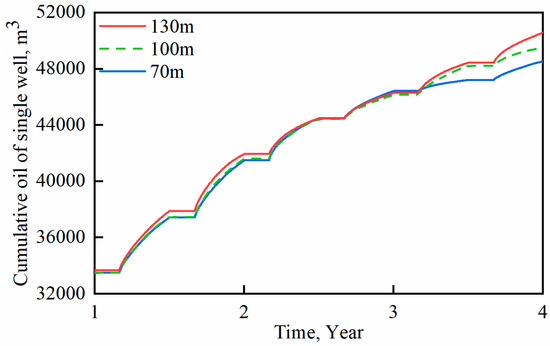
Figure 15.
Comparison of cumulative oil production of the single well in each scheme under different fracture lengths.
Table 13.
Calculation results of different fracture half-lengths.
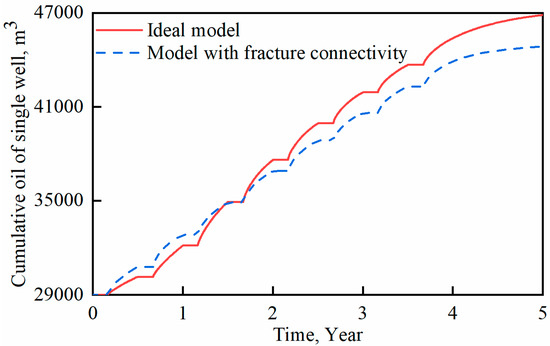
Figure 16.
Comparison of cumulative oil production of the single well between the ideal model and the model with fracture connectivity.
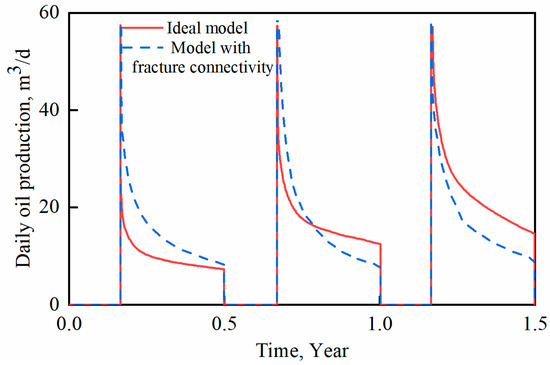
Figure 17.
Comparison of daily oil production of the single well between the ideal model and the model with fracture connectivity.
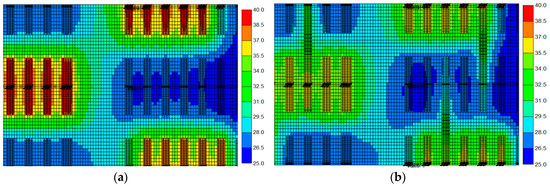
Figure 18.
Comparison of formation pressure at the end of gas injection period between the ideal model and the model with fracture connectivity (unit: MPa). (a) Ideal model; (b) model with fracture connectivity.
4.2.5. Effect of Fracture Spacing
The hydraulic fracture spacing is also one of the important factors affecting the oil production of the shale oil reservoir. The smaller the spacing between hydraulic fractures is, the larger the contact area between fracture and matrix is, which is beneficial to the flow of fluid in the shale oil reservoir and increases oil production of horizontal wells. For CO2 huff-n-puff or AIIP, the decrease of fracture spacing can also facilitate the flow of injected gas, expand the contact area between injected gas and matrix, and promote the effect of oil increment. However, too small fracture spacing will greatly increase the difficulty and cost of hydraulic fracturing, and when the fracture spacing reaches a certain value, the increment of oil production is also limited. Therefore, it is necessary to determine the effect of fracture spacing on the performance of AIIP method.
For sensitivity analyses of this parameter, four groups of different fracture spacing were designed to compare the influence of fracture spacing on the effect of AIIP, as shown in Table 14. As shown in Figure 19 and Table 15, the cumulative oil production of the single well increases in turn with the shortening of fracture spacing, but when the fracture spacing is less than 30 m, the cumulative oil production growth of the single well slows down gradually (Figure 20). Considering the fracturing technology and economy, there may be a suitable fracture spacing, which can give full play to the performance of AIIP and have a better economy at the same time.
Table 14.
Fracture spacing in different schemes.
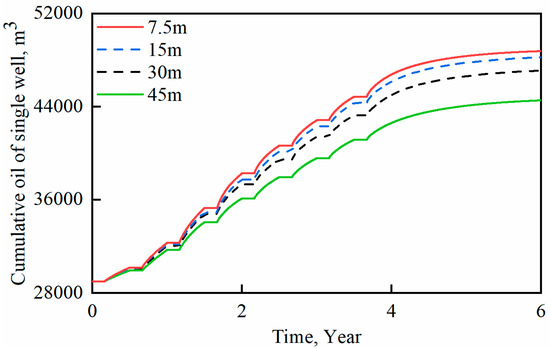
Figure 19.
Comparison of cumulative oil production of the single well in each scheme under different fracture spacing.
Table 15.
Calculation results of different fracture spacing.
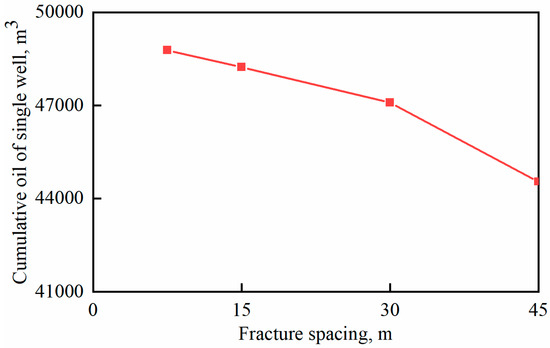
Figure 20.
The relationship between cumulative oil production and fracture spacing in the single well.
5. Conclusions
This paper first proposes to use AIIP combined with CO2 huff-n-puff to develop shale oil reservoirs and reduce CO2 emissions. Compared with depletion and conventional CO2 huff-n-puff, the AIIP method has higher cumulative oil production and maintains higher formation pressure. Therefore, AIIP combined with CO2 huff-n-puff has a good prospect for the development of shale oil reservoirs. In the end, the effect of several parameters on AIIP development was studied through sensitivity analyses. The following conclusions can be obtained from this study:
- (1)
- Compared with horizontal well depletion and CO2 huff-n-puff, cumulative oil production of AIIP increases by 17,450 and 13,077 m3 respectively in the 20 years of development prediction. The oil production of AIIP first increases, and then decreases, and is higher than that of conventional huff-n-puff in each cycle. It shows that AIIP combined with CO2 huff-n-puff is an effective technique to improve shale oil recovery.
- (2)
- The performance improves with the increment of gas injection volume. When the injection volume is 1.5 million cubic meters, the oil increment slows down significantly, and the injection pressure is 43.4 MPa, which is close to the maximum injection pressure of the gas injection equipment. Injection rate has little impact on performance, but the injection volume exerts a great influence.
- (3)
- Shorter soaking time can increase more oil production in the process of huff-n-puff, but the oil production improves with the increment of soaking time after huff-n-puff. Increasing the soaking time can make the pressure wave spread more widely, and make more gas dissolve into oil, leading to a better performance. However, oil cannot be produced during the soaking period, and oil production is low in the short term.
- (4)
- The longer the fractures are, the higher the oil production is in each cycle of AIIP. With the increment of huff-n-puff cycles, the difference of oil production gradually decreases in different fracture length schemes. If some hydraulic fractures are too long and connected, the effect of AIIP will be affected. With the shortening of fracture spacing, the cumulative oil production of the single well increases in turn, but when the fracture spacing is less than 30 m, the cumulative oil production of the single well gradually slows down. Considering the fracturing technology and economy, there is a suitable fracture length and fracture spacing.
Author Contributions
Conceptualization, H.Y. and S.C.; Formal analysis, Q.X. and X.Q.; Methodology, H.Y. and S.C.; Software, S.Q. and Z.C.; Supervision, H.Y.; Visualization, S.Q; Writing—original draft, S.Q.; Writing—review and editing, H.Y. and Z.C.
Funding
This research was funded by National Natural Science Foundation of China (U1762101) and National Science and Technology Major Projects (2017ZX05009-004).
Acknowledgments
The authors appreciate the Computer Modeling Group for offering CMG software. Special thanks for the help from Shengli Oilfield.
Conflicts of Interest
The authors declare no conflict of interest.
References
- Wang, Q.; Ma, Y.; Li, S.; Qian, J. Global oil shale research, development and utilization today—Two international oil shale symposiums held in 2016. Sino-Global Energy 2017, 22, 23–29. [Google Scholar]
- Zhou, Q.; Jin, Z.; Yang, G.; Dong, N.; Shang, Z. Shale oil exploration and production in the US: Status and outlook. Oil Gas Geol. 2019, 40, 469–477. [Google Scholar]
- Wang, X.; Sheng, J. Effect of low-velocity non-Darcy flow on well production performance in shale and tight oil reservoirs. Fuel 2017, 190, 41–46. [Google Scholar] [CrossRef]
- Lv, X.; Wu, W.; Li, G.; Ben, C.; Lin, L.; Yang, Q. Key technologies for shale gas development in North America. Pet. Geol. Oilfield Dev. Daqing 2015, 34, 158–162. [Google Scholar]
- Sorensen, J.; Braunberger, J.; Liu, G.; Smith, S.; Hawthorne, S.; Steadman, E. Characterization and evaluation of the Bakken petroleum system for CO2 enhanced oil recovery. In Proceedings of the Unconventional Resources Technology Conference, San Antonio, TX, USA, 20–22 July 2015. [Google Scholar]
- Zeng, F.; Peng, F.; Guo, J.; Xiang, J.; Wang, Q.; Zhen, J. A transient productivity model of fractured wells in shale reservoirs based on the succession pseudo-steady state method. Energies 2018, 11, 2335. [Google Scholar] [CrossRef]
- Yang, L.; Kang, H.; Lu, X. Experimental investigation of CO2 flooding in tight oil reservoirs using CT scanning method. In Proceedings of the 4th ISRM Young Scholars Symposium on Rock Mechanics, Jeju, Korea, 10–13 May 2017. [Google Scholar]
- Wang, Y.; Cheng, S.; Zhang, K. Case studies: Pressure-transient analysis for water injector with the influence of waterflood-induced fractures in tight reservoir. In Proceedings of the SPE Improved Oil Recovery Conference, Tulsa, OK, USA, 14–18 April 2018. [Google Scholar]
- Sheng, J.J. Enhanced oil recovery in shale reservoirs by gas injection. J. Nat. Gas Sci. Eng. 2015, 22, 252–259. [Google Scholar] [CrossRef]
- Cheng, J. Laboratory Experimental Study on Oil Displacement Effects of Different Gases. Ph.D. Thesis, Northeast Petroleum University, Daqing, China, 2014. [Google Scholar]
- Yu, Q. Study on Gas Injection Development Mode of Low Permeability Tight Reservoir in Block L3. Ph.D. Thesis, Southwest Petroleum University, Chengdu, China, 2015. [Google Scholar]
- Shyeh-Yung, J.G. Mechanisms of miscible oil recovery effects of pressure on miscible and displacements of oil by carbon dioxide. In Proceedings of the SPE Annual Technical Conference and Exhibition, Dallas, TX, USA, 6–9 October 1991. [Google Scholar]
- Wahaibi, A.; Yahya, M. First-contact-miscible and multicontact-miscible gas injection within a channeling heterogeneity system. Energy Fuels 2010, 24, 1813–1821. [Google Scholar] [CrossRef]
- Ampomah, W.; Balch, R.; Cather, M. Evaluation of CO2 storage mechanisms in CO2 enhanced oil recovery sites: Application tomorrow sandstone reservoir. Energy Fuels 2016, 30, 8545–8555. [Google Scholar] [CrossRef]
- Gao, Y.; Zhao, M.; Wang, J. Performance and gas breakthrough during CO2 immiscible flooding in ultra-low permeability reservoirs. Pet. Explor. Dev. 2014, 41, 88–95. [Google Scholar] [CrossRef]
- Song, C.; Yang, D. Experimental and numerical evaluation of CO2 huff-n-puff processes in Bakken formation. Fuel 2017, 190, 145–162. [Google Scholar] [CrossRef]
- Pu, W.; Wei, B.; Jin, F. Experimental investigation of CO2 huff-n-puff process for enhancing oil recovery in tight reservoirs. Chem. Eng. Res. Des. 2016, 111, 269–276. [Google Scholar] [CrossRef]
- Janiga, D.; Czarnota, R.; Stopa, J. Huff and puff process optimization in micro scale by coupling laboratory experiment and numerical simulation. Fuel 2018, 224, 289–301. [Google Scholar] [CrossRef]
- Zuloaga, P.; Yu, W.; Xu, Y. Simulation study of CO2-EOR in tight oil reservoirs with complex fracture geometries. Sci. Rep. 2016, 6, 33445. [Google Scholar] [CrossRef] [PubMed]
- Zhang, Y.; Yu, W.; Li, Z.; Sepehrnoori, K. Simulation study of factors affecting CO2 Huff-n-Puff process in tight oil reservoirs. J. Pet. Sci. Eng. 2018, 163, 264–269. [Google Scholar] [CrossRef]
- Sanchez-Rivera, D.; Mohanty, K.; Balhoff, M. Reservoir simulation and optimization of huff-and-puff operations in the Bakken Shale. Fuel 2015, 147, 82–94. [Google Scholar] [CrossRef]
- Sun, J.; Zou, A.; Sotelo, E.; Schechter, D. Numerical simulation of CO2 huff-n-puff in complex fracture networks of unconventional liquid reservoirs. J. Nat. Gas Sci. Eng. 2016, 31, 481–492. [Google Scholar] [CrossRef]
- Cheng, S.; Wang, Y.; Lang, H.; Yu, H. Feasibility of inter-fracture injection and production in the same well for multistage fractured horizontal wells in tight reservoir. Acta Pet. Sin. 2017, 38, 1411–1419. [Google Scholar]
- Yu, H.; Yang, Z.; Ma, T.; Lei, Z.; Cheng, S.; Chen, H. The feasibility of asynchronous injection alternating production for multistage fractured horizontal wells in a tight oil reservoir. Pet. Sci. Bull. 2018, 1, 32–44. [Google Scholar]
- Yu, H.; Yang, Z.; Luo, L.; Liu, J.; Cheng, S. Application of cumulative-in-situ-injection-production technology to supplement hydrocarbon recovery among fractured tight oil reservoirs: A case study in Changqing Oilfield, China. Fuel 2019, 242, 804–818. [Google Scholar] [CrossRef]
- Yu, H.; Rui, Z.; Chen, Z.; Lu, X.; Yang, Z.; Liu, J.; Qu, X.; Patil, S.; Ling, K.; Lu, J. Feasibility study of improved unconventional reservoir performance with carbonated water and surfactant. Energy 2019, 182, 135–147. [Google Scholar] [CrossRef]
- Dong, D.; Qiu, L.; Ma, Y.; Yang, Y.; Zou, Y.; Dai, L.; Teng, B.; Zhang, Z. Control of tectonics on sedimentation of sandstone and process of sediment filling in multi-fault lacustrine basins: A case study on the Eocene in eastern Zhanhua Sag, Jiyang Depression in Bohai Bay Basin. Oil Gas Geol. 2008, 39, 653–663. [Google Scholar]
- Chen, G.; Lu, S.; Zhang, J.; Wang, M. Estimation of enriched shale oil resource potential in E2s4L of Damintun Sag in Bohai Bay Basin, China. Energy Fuels 2017, 31, 3635–3642. [Google Scholar] [CrossRef]
- Zhu, G.; Yao, J.; Li, A.; Sun, H.; Lei, Z. Pore-scale investigation of carbon dioxide-enhanced oil recovery. Energy Fuels 2017, 31, 5324–5332. [Google Scholar] [CrossRef]
- Sun, R.; Yu, W.; Xu, F.; Pu, H.; Miao, J. Compositional simulation of CO2 huff-n-puff process in middle bakken tight oil reservoirs with hydraulic fractures. Fuel 2019, 236, 1446–1457. [Google Scholar] [CrossRef]
- Shen, Z.; Sheng, J.J. Experimental study of permeability reduction and pore size distribution change due to asphaltene deposition during CO2 huff and puff injection in Eagle Ford shale. Asia Pac. J. Chem. Eng. 2017, 12, 381–390. [Google Scholar] [CrossRef]
- Chen, P. Field application of the horizontal well sectional fracturing technology in shale oi of well Jinye-1HF. Reserv. Eval. Dev. 2012, 2, 73–77. [Google Scholar]
© 2019 by the authors. Licensee MDPI, Basel, Switzerland. This article is an open access article distributed under the terms and conditions of the Creative Commons Attribution (CC BY) license (http://creativecommons.org/licenses/by/4.0/).