Effect of Rotor Thrust on the Average Tower Drag of Downwind Turbines


Abstract
:1. Introduction
2. Methodology
- (1)
- Wind speed distribution by CFD
- (2)
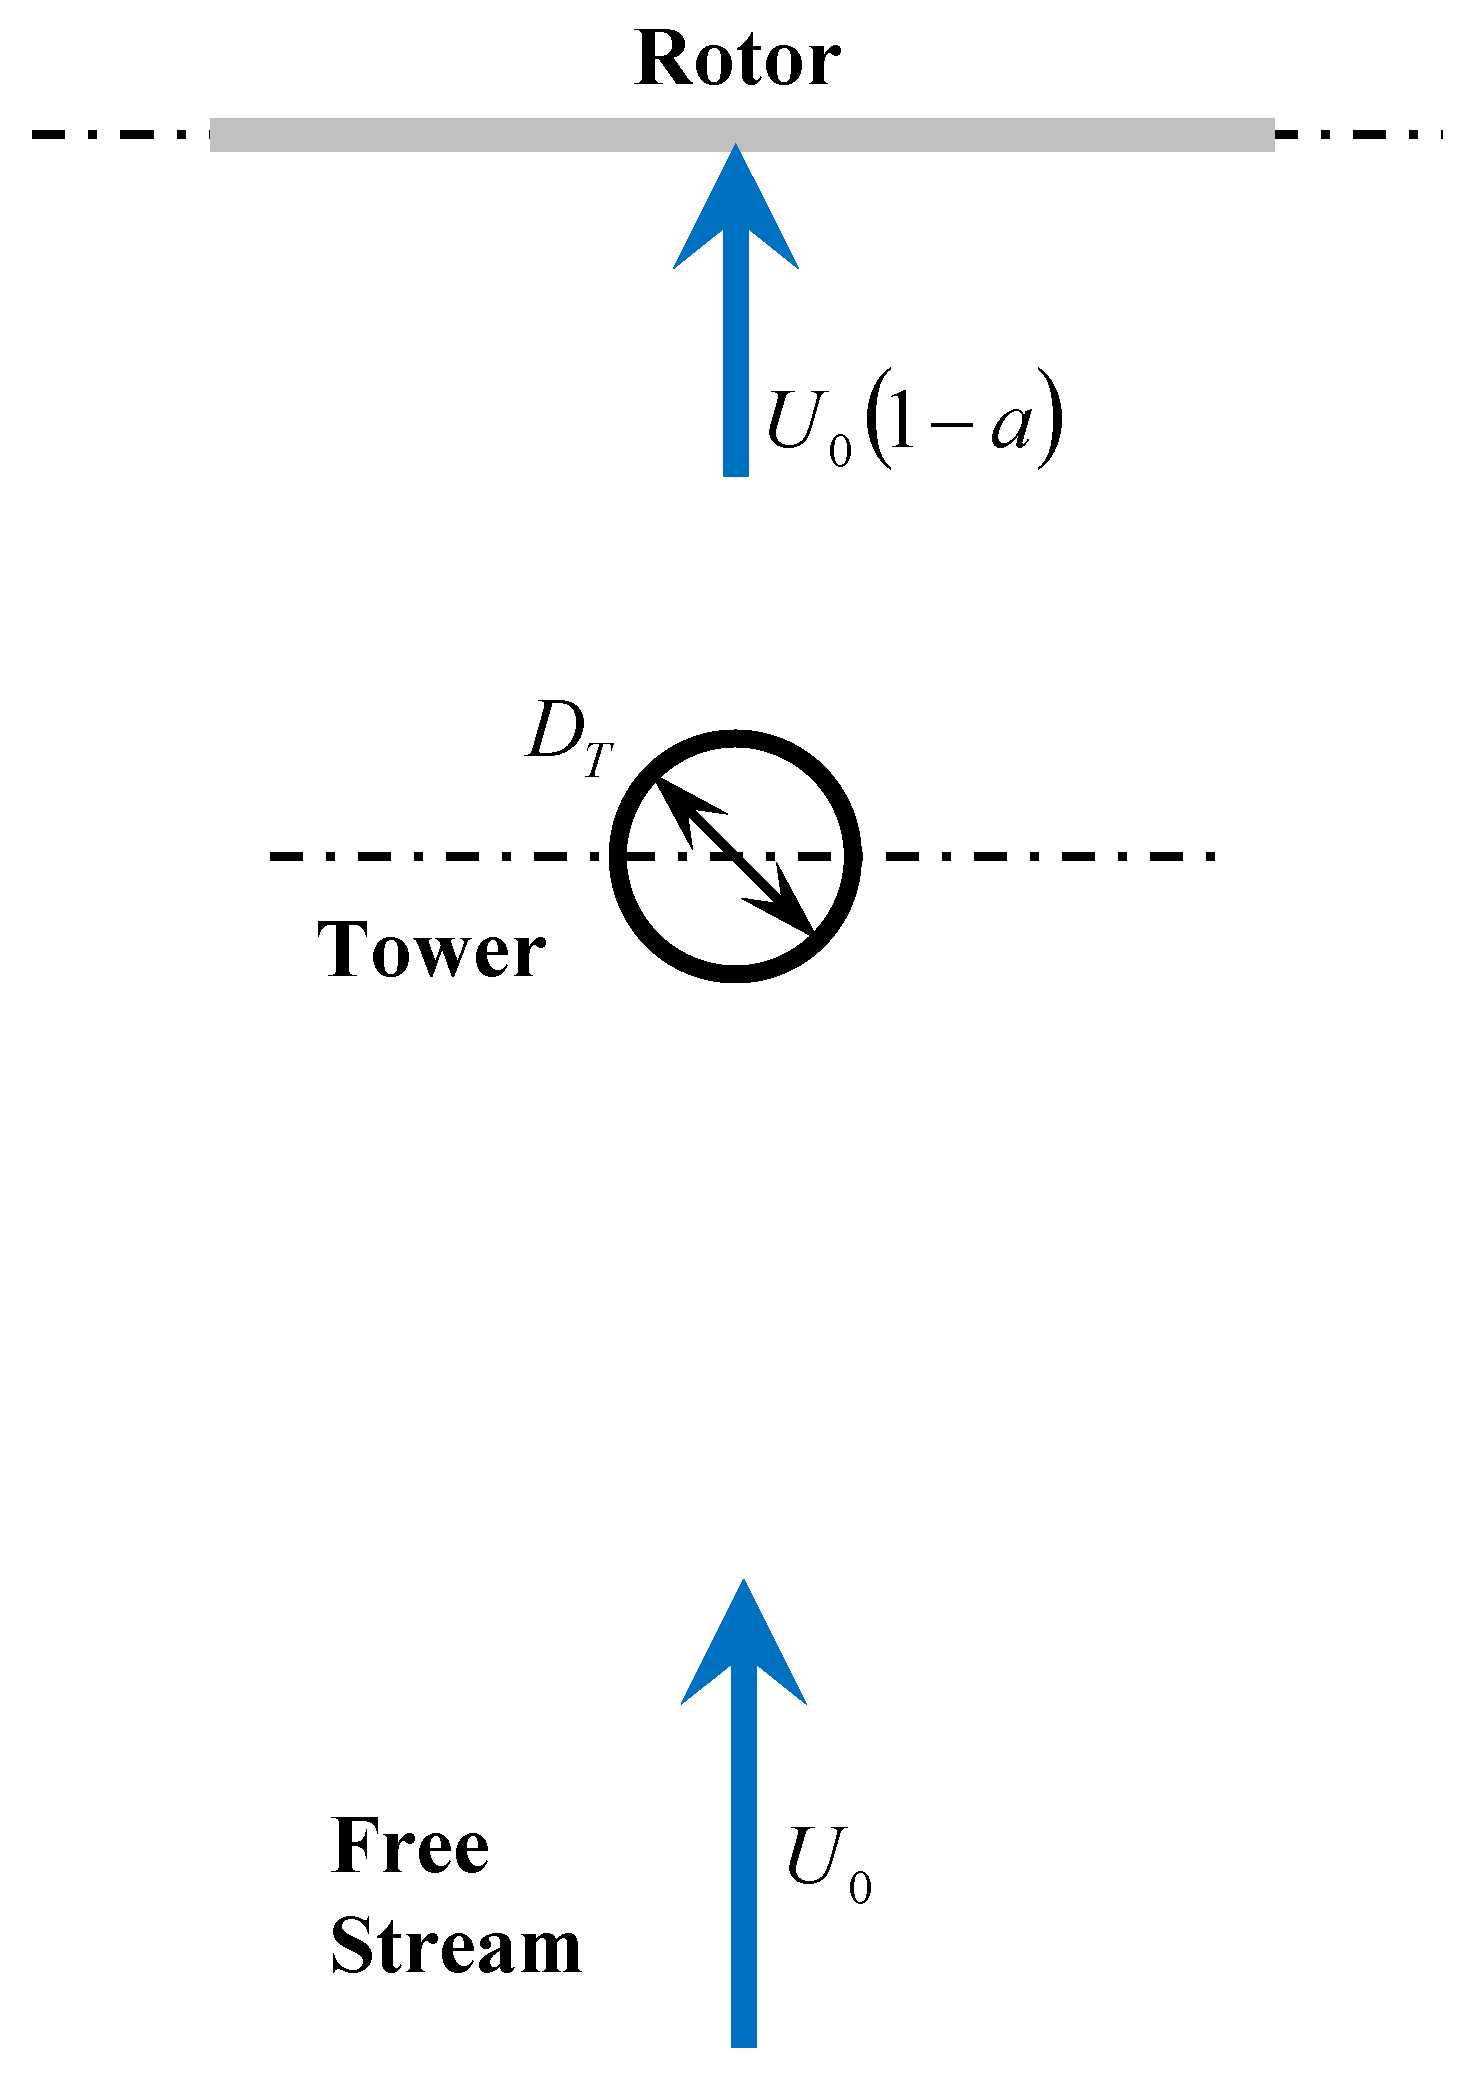
- Rotor thrust-induced tower average drag
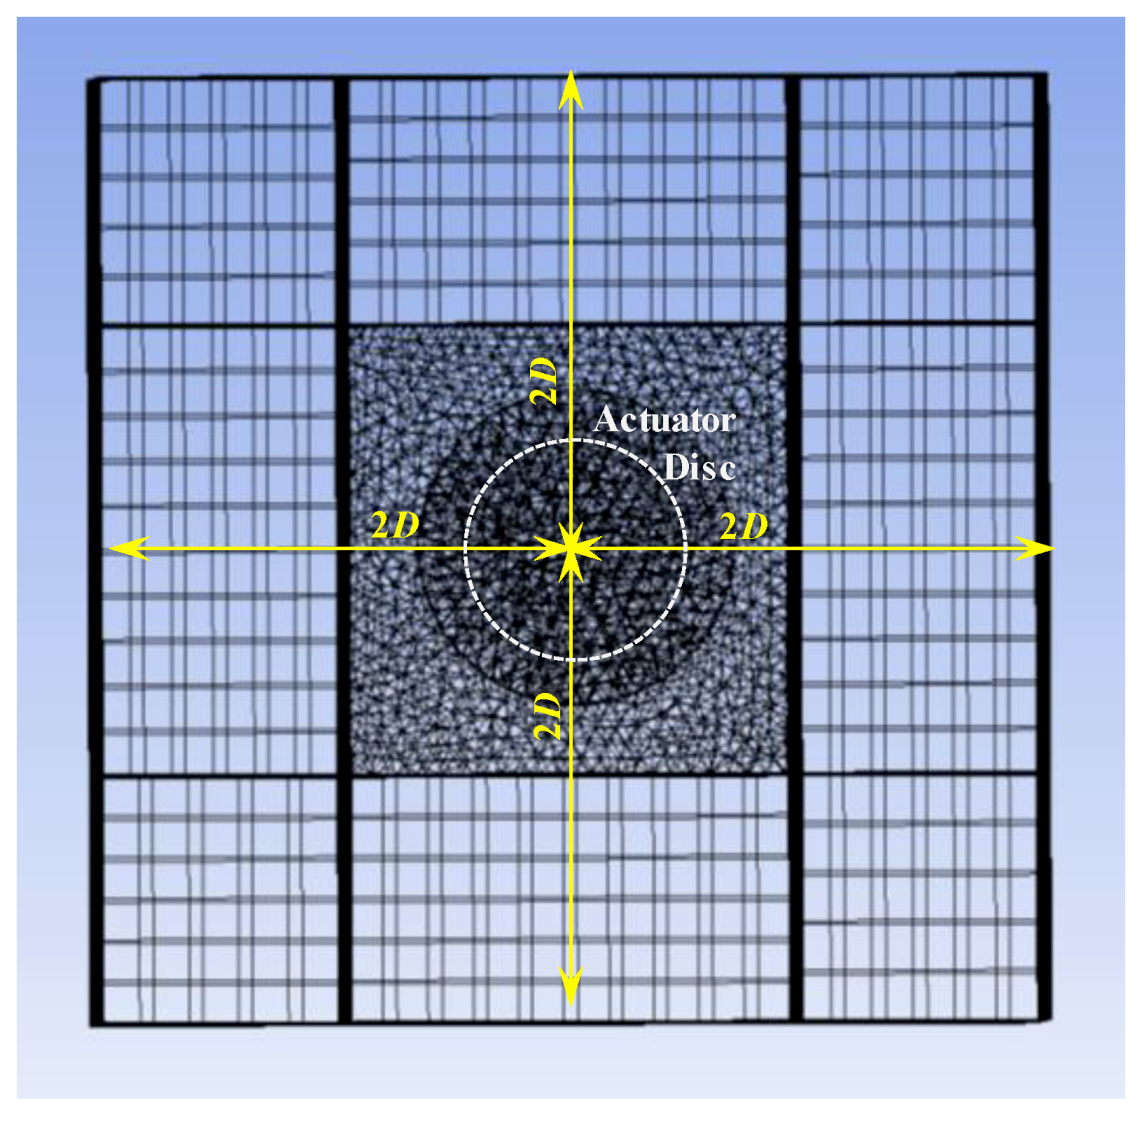
2.1. Wind Speed Distribution by CFD
2.2. Rotor Thrust-Induced Tower Average Drag
3. Wind Tunnel Test
3.1. Outline
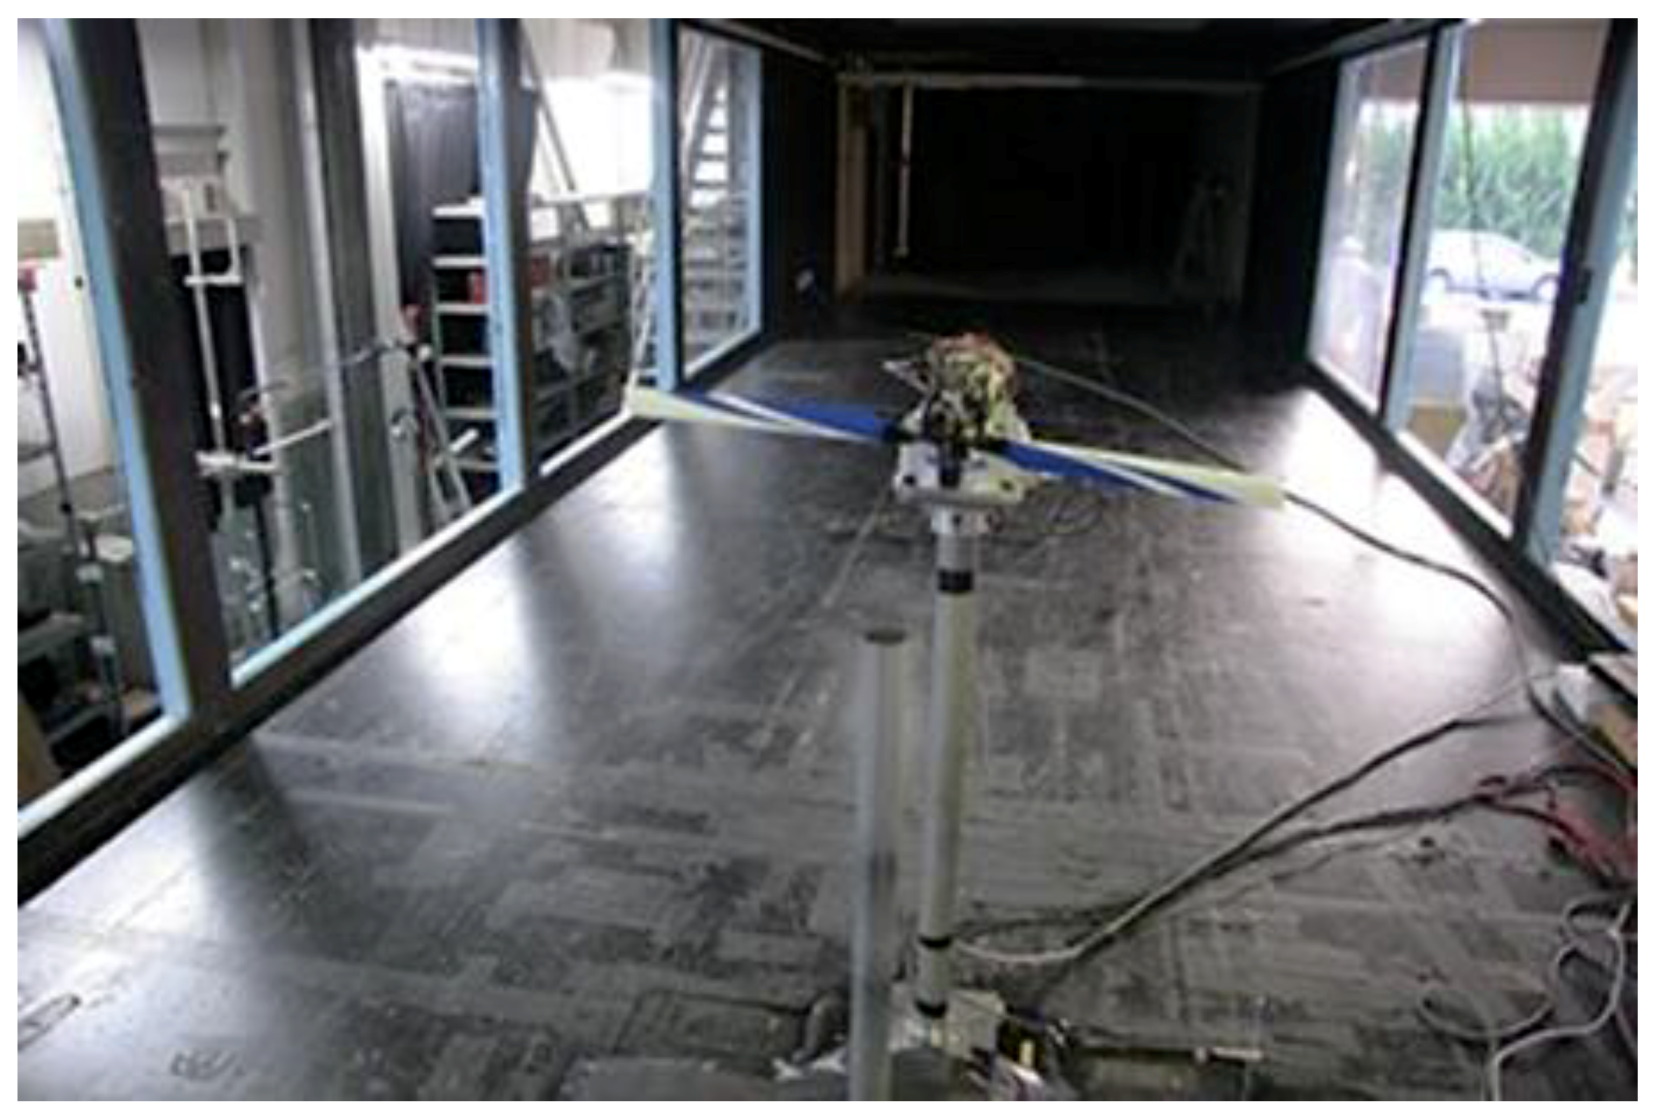
3.2. Facility
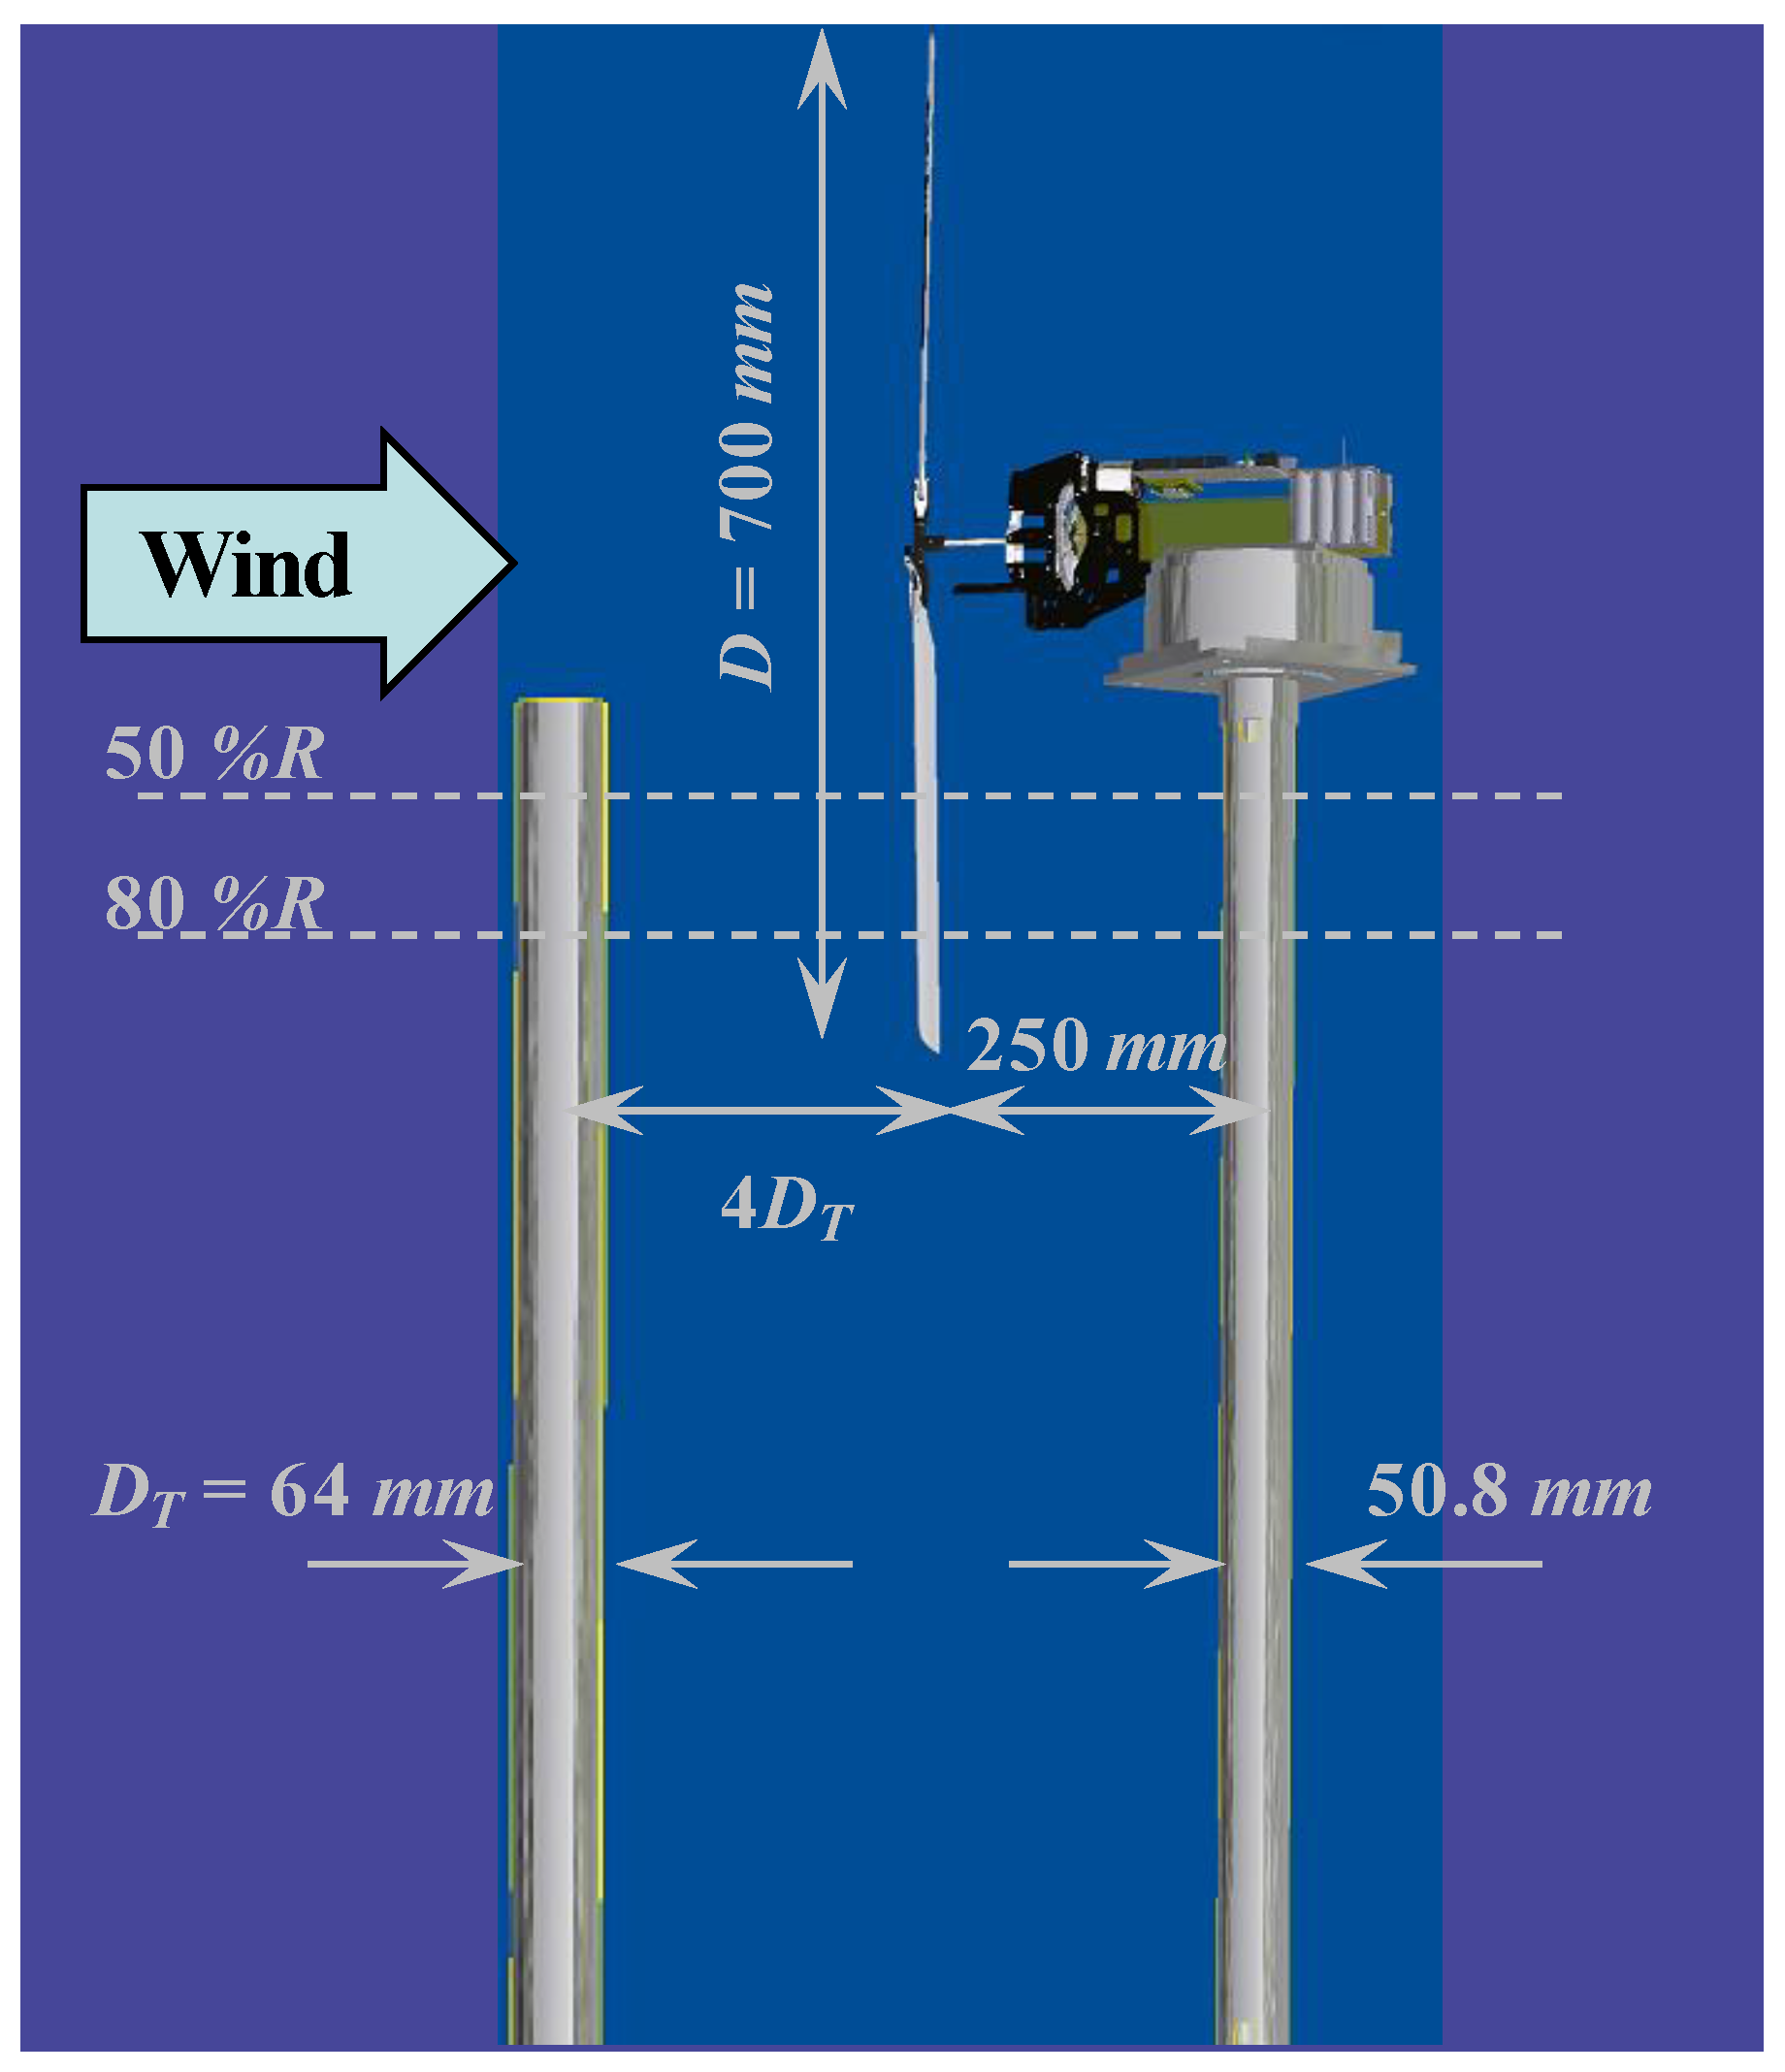
3.3. Test Model
3.4. Measurement
- -
- Rotor speed: Magnetic encoder
- -
- Load (top of the tower): 6-axis Load Cell (Nissho)
- -
- Pressure on the dummy tower (50%R, 80%R, 8 points each): Pressure sensor (Otegiken)
3.5. Test Conditions
- -
- Wind speed (U0): 6 m/s (uniform, steady)
- -
- Yaw angle: 0 deg
- -
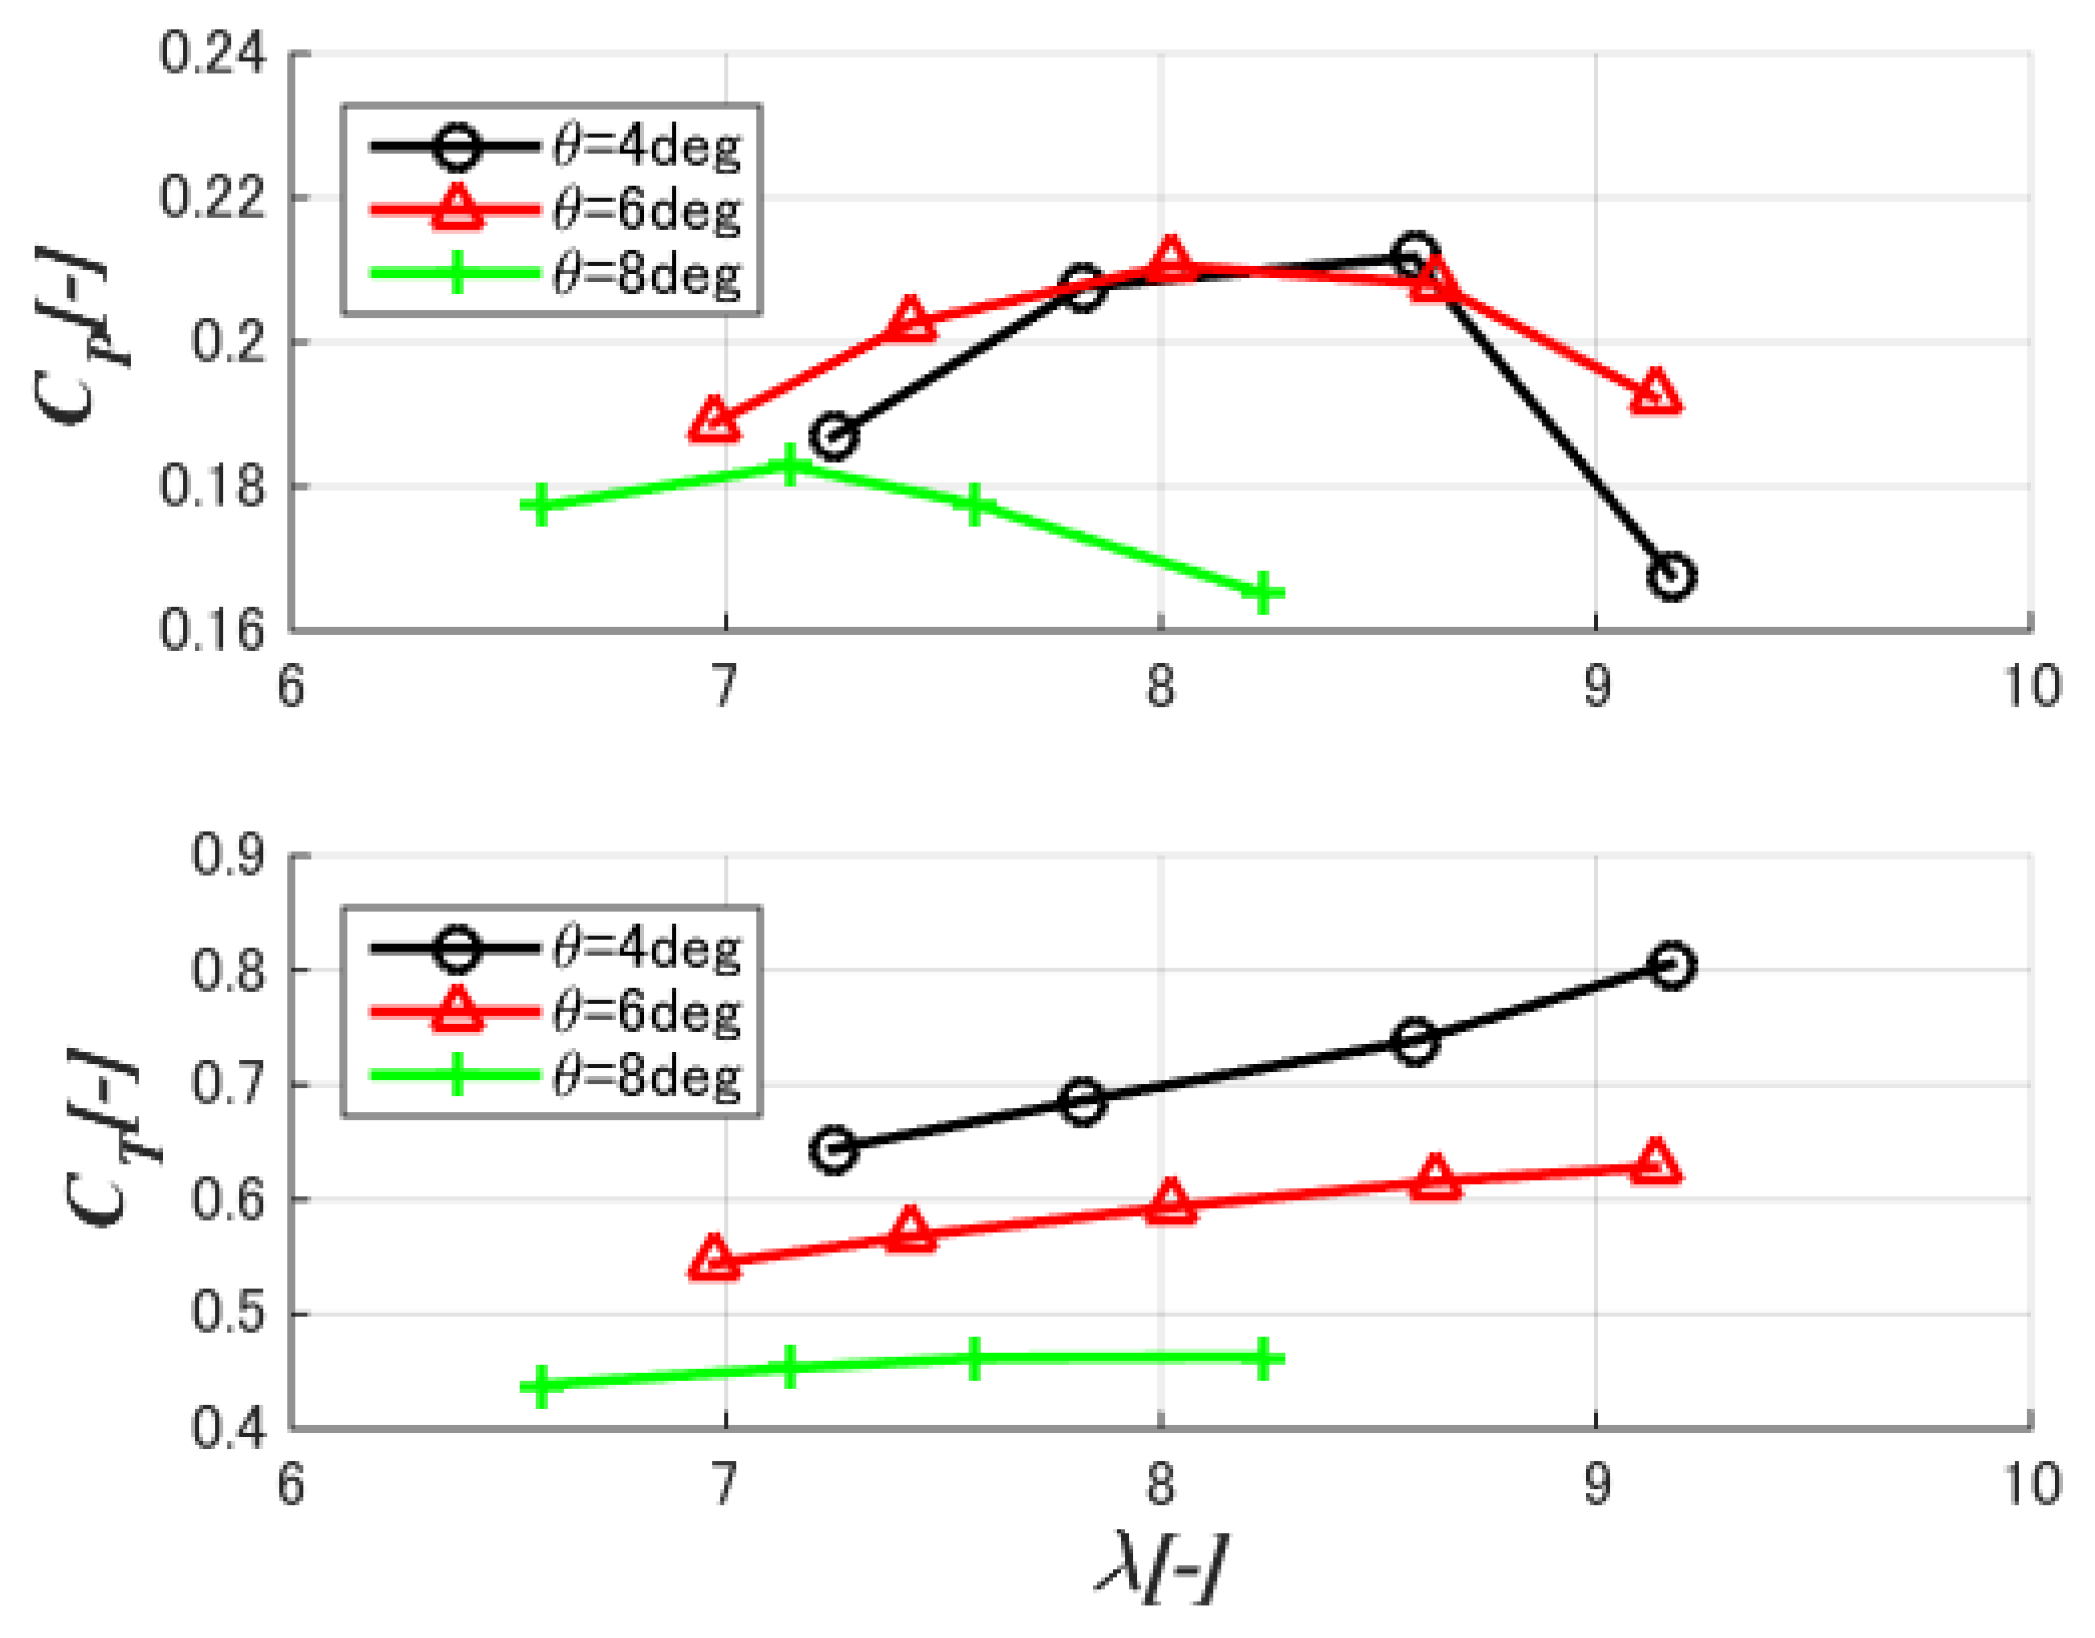
- Blade pitch angle (θ): 4, 6, 8 deg
- -
- Tip speed ratio (λ): 6.6–9.2
3.6. Test Results
4. Analysis
4.1. Outline
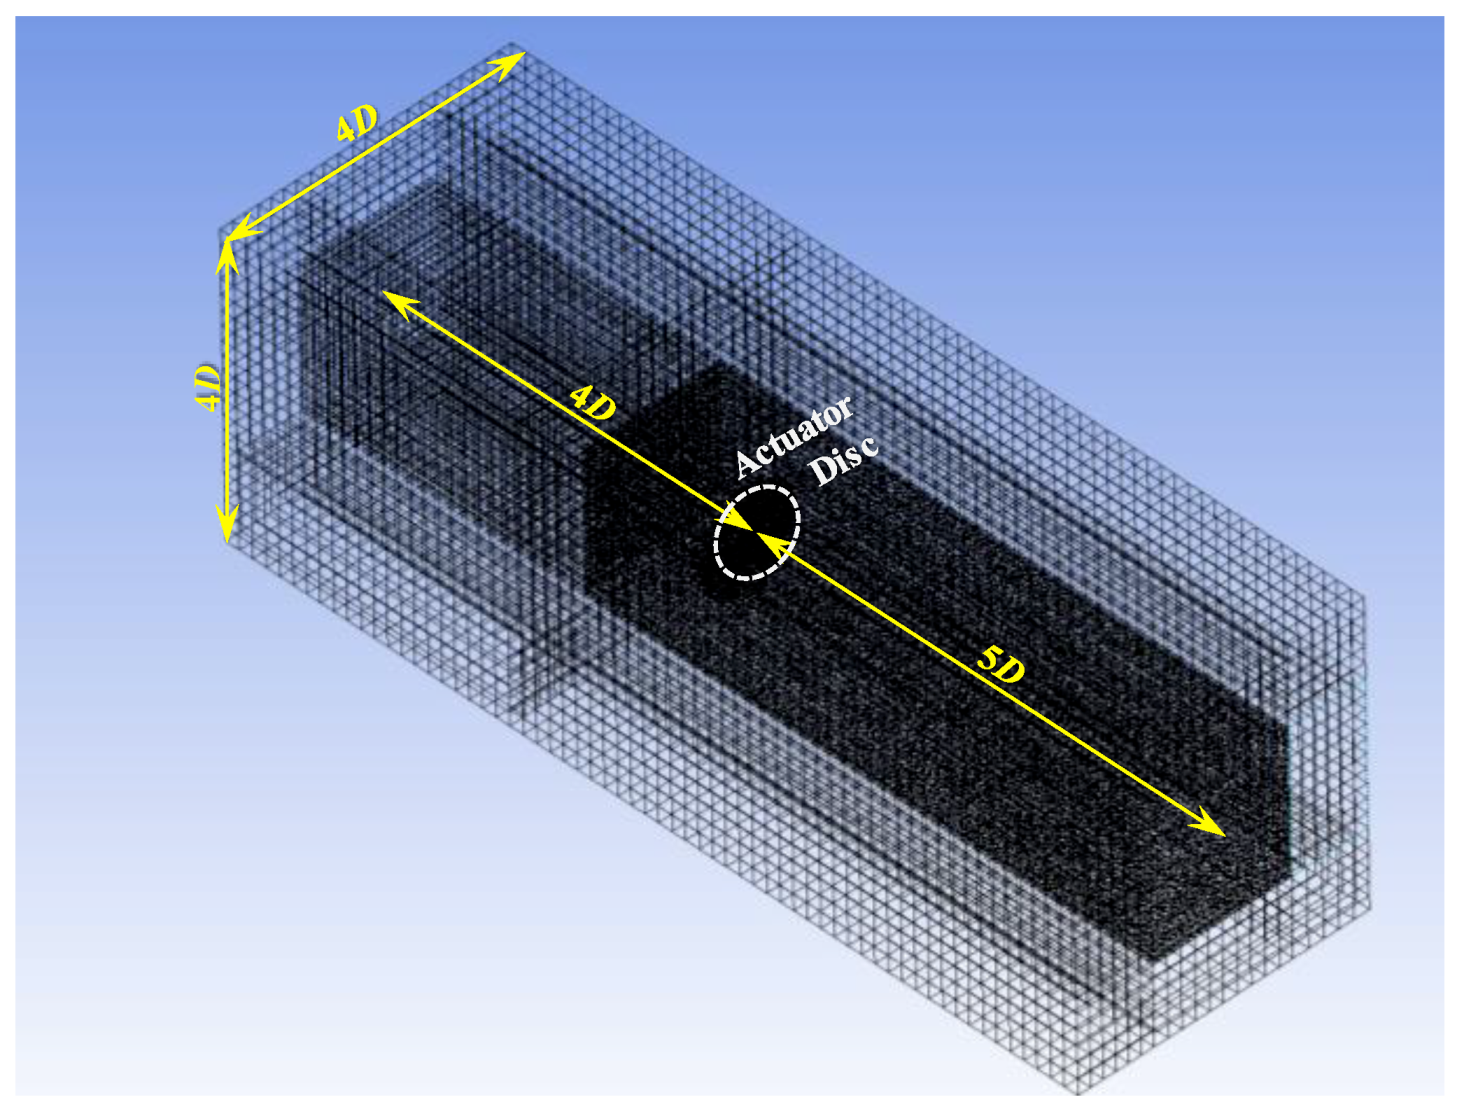
4.2. CFD Outline
4.3. Analysis Conditions
- -
- Wind speed (U0): 6 m/s (uniform, steady)
- -
- Yaw angle: 0 deg
- -
- Thrust coefficient (CT): 0.4–0.9 (each 1.0)
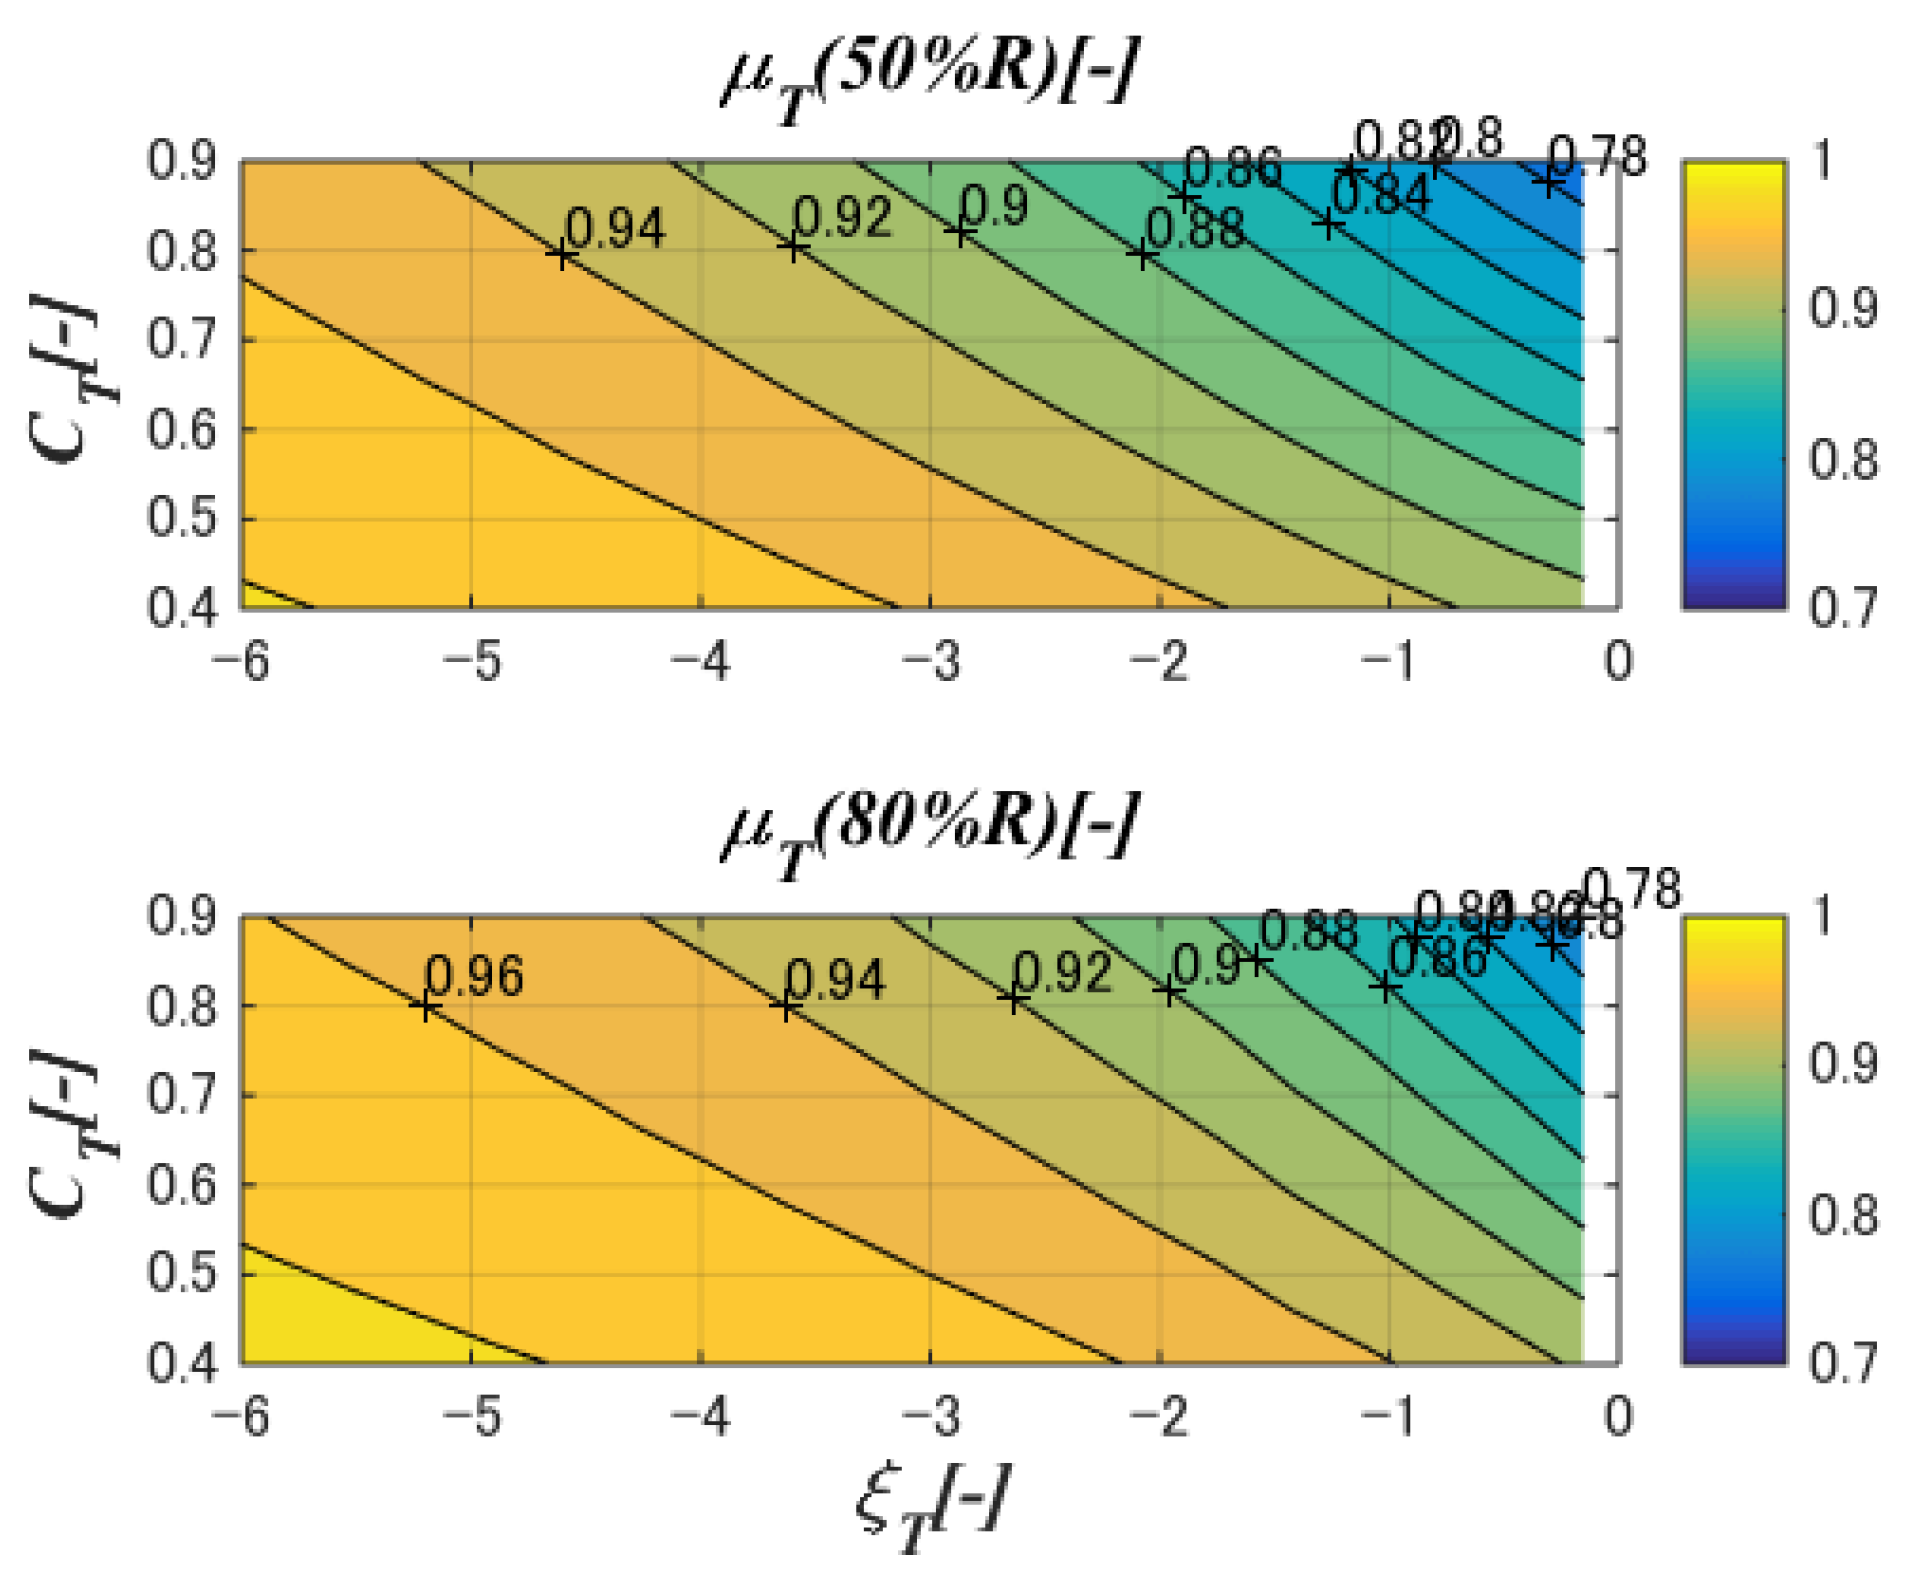
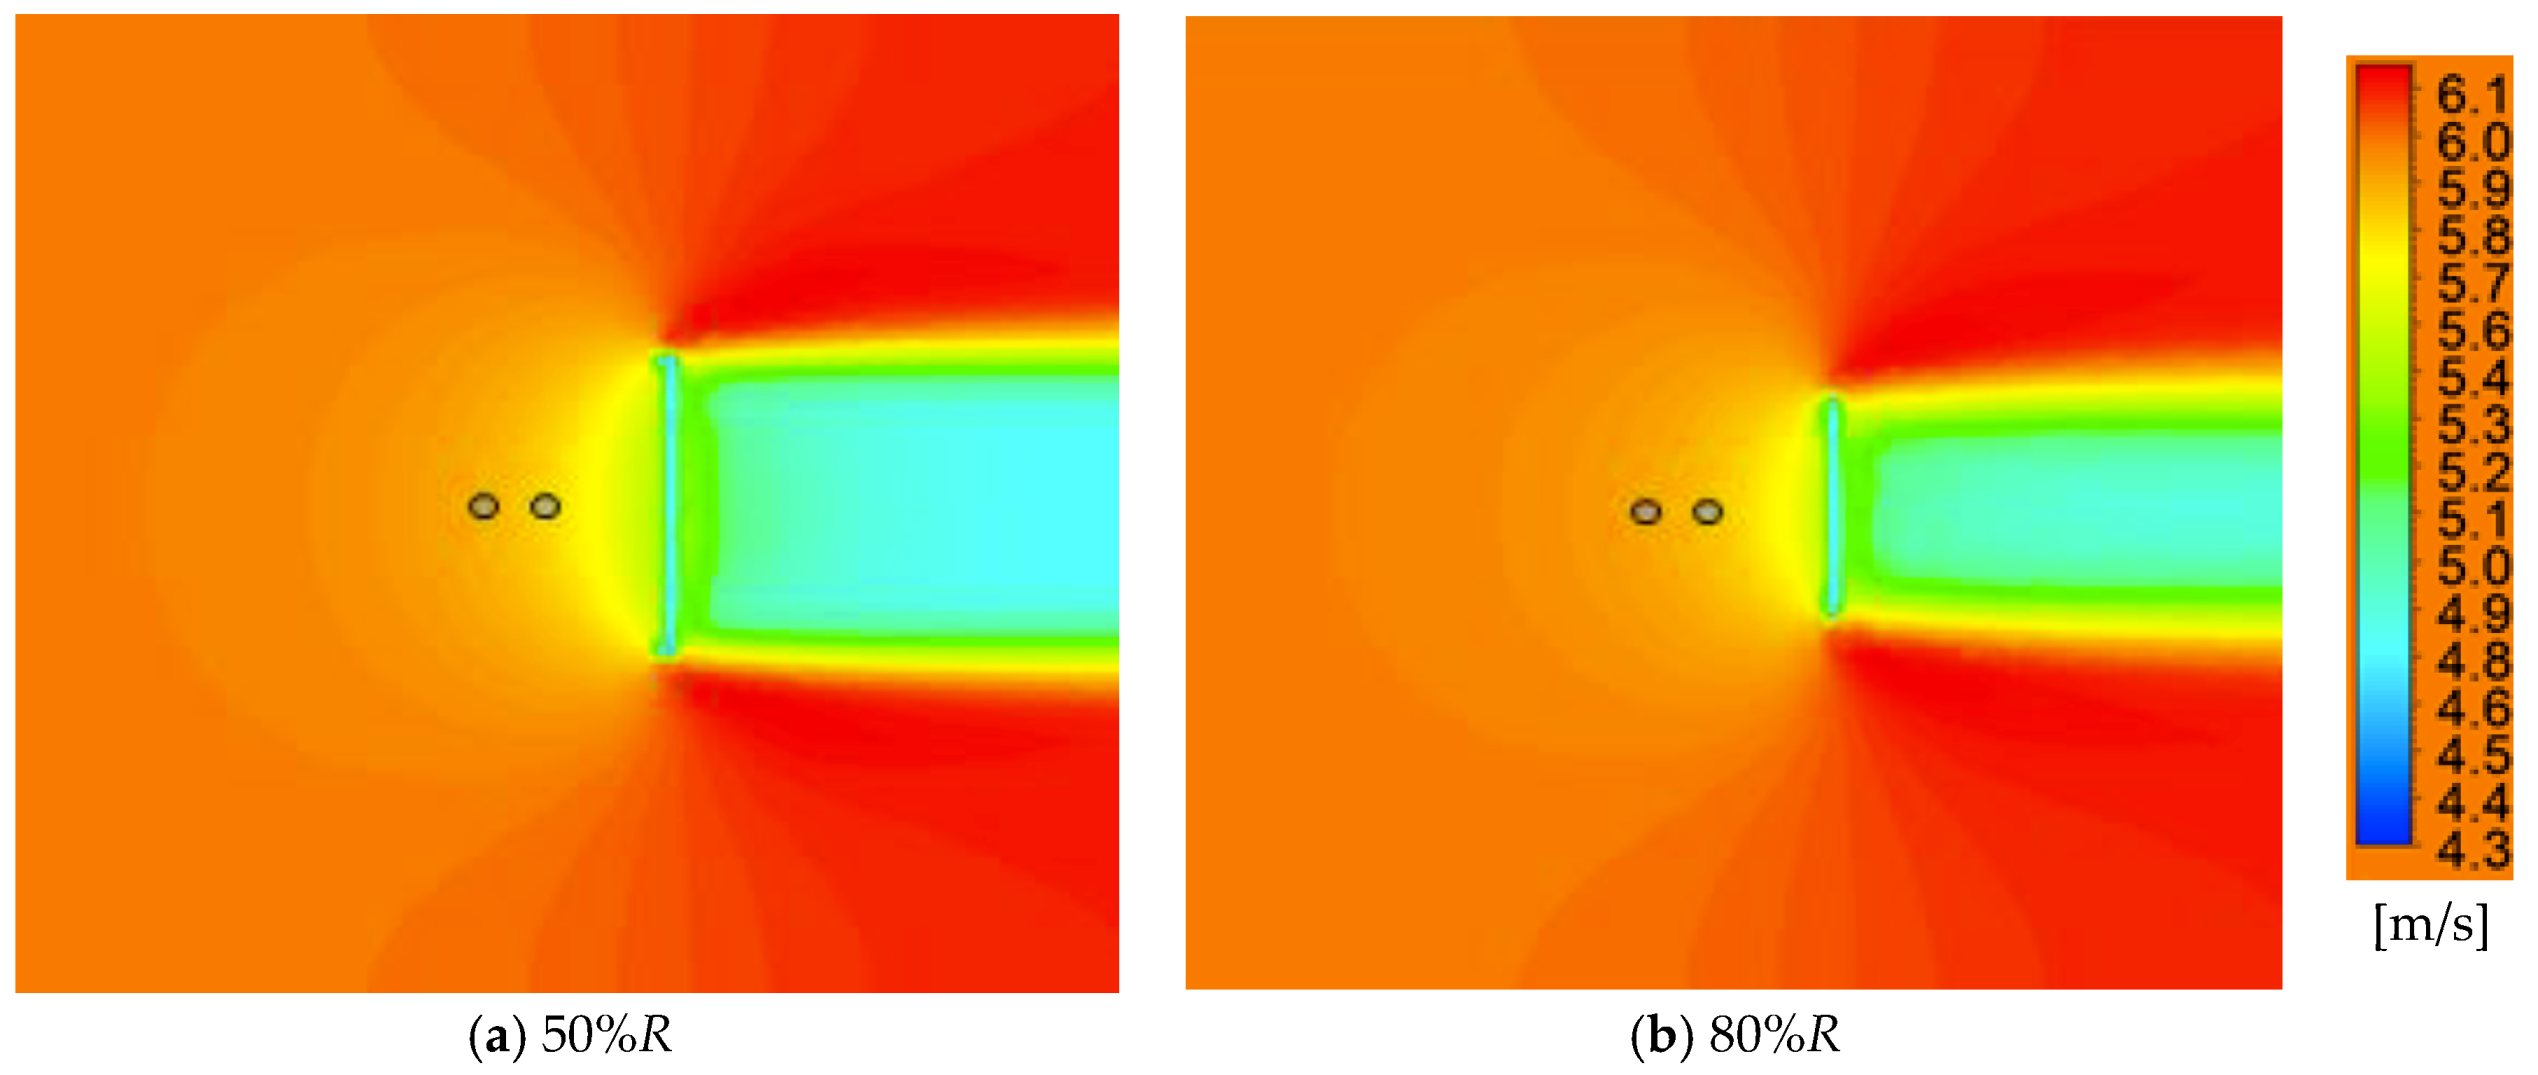
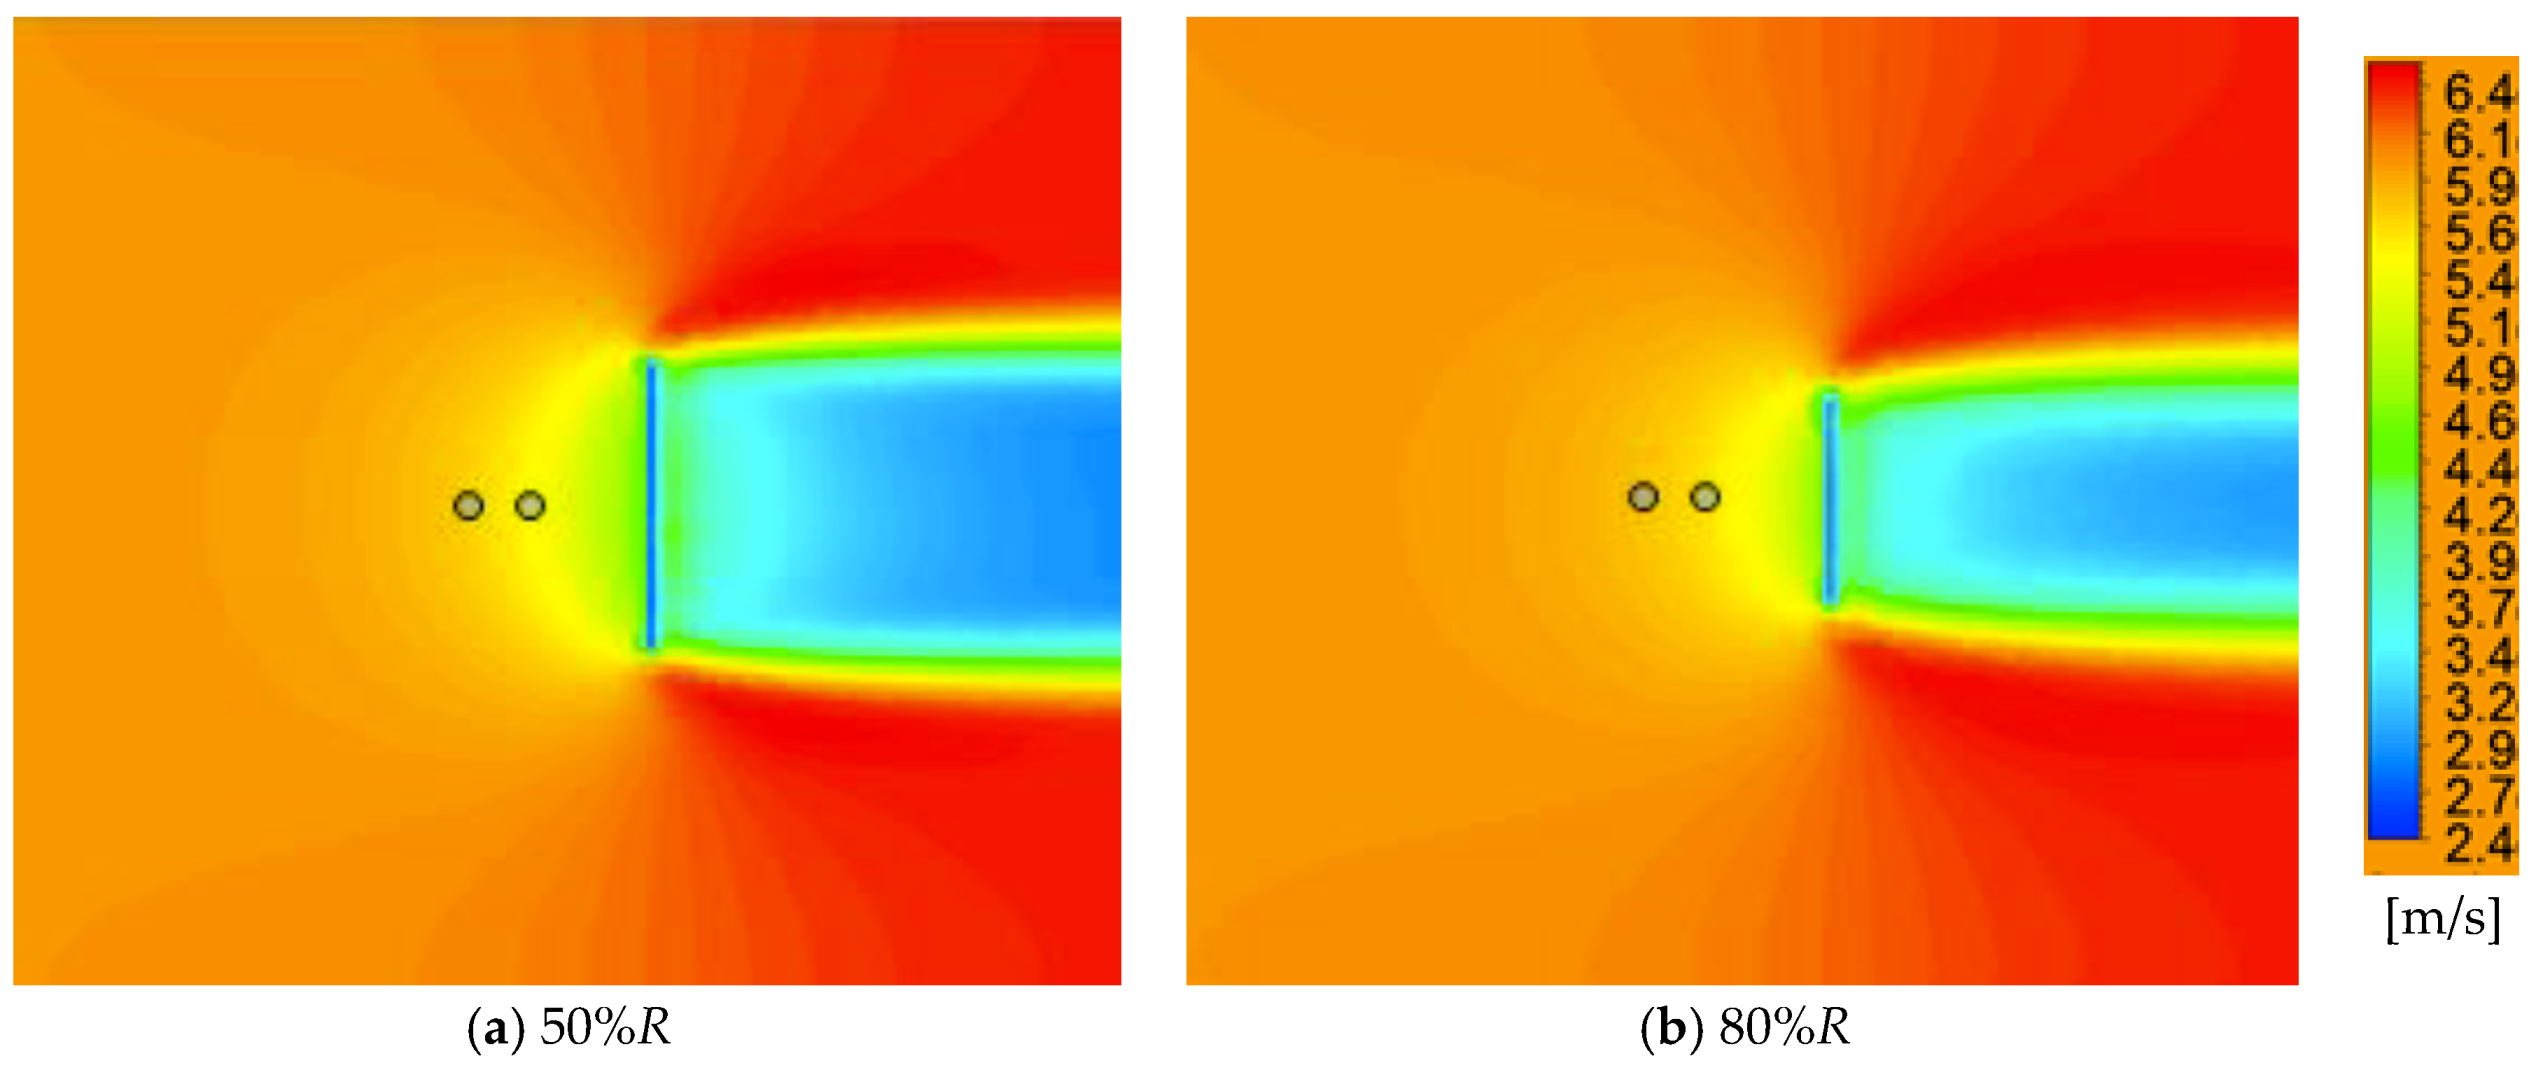
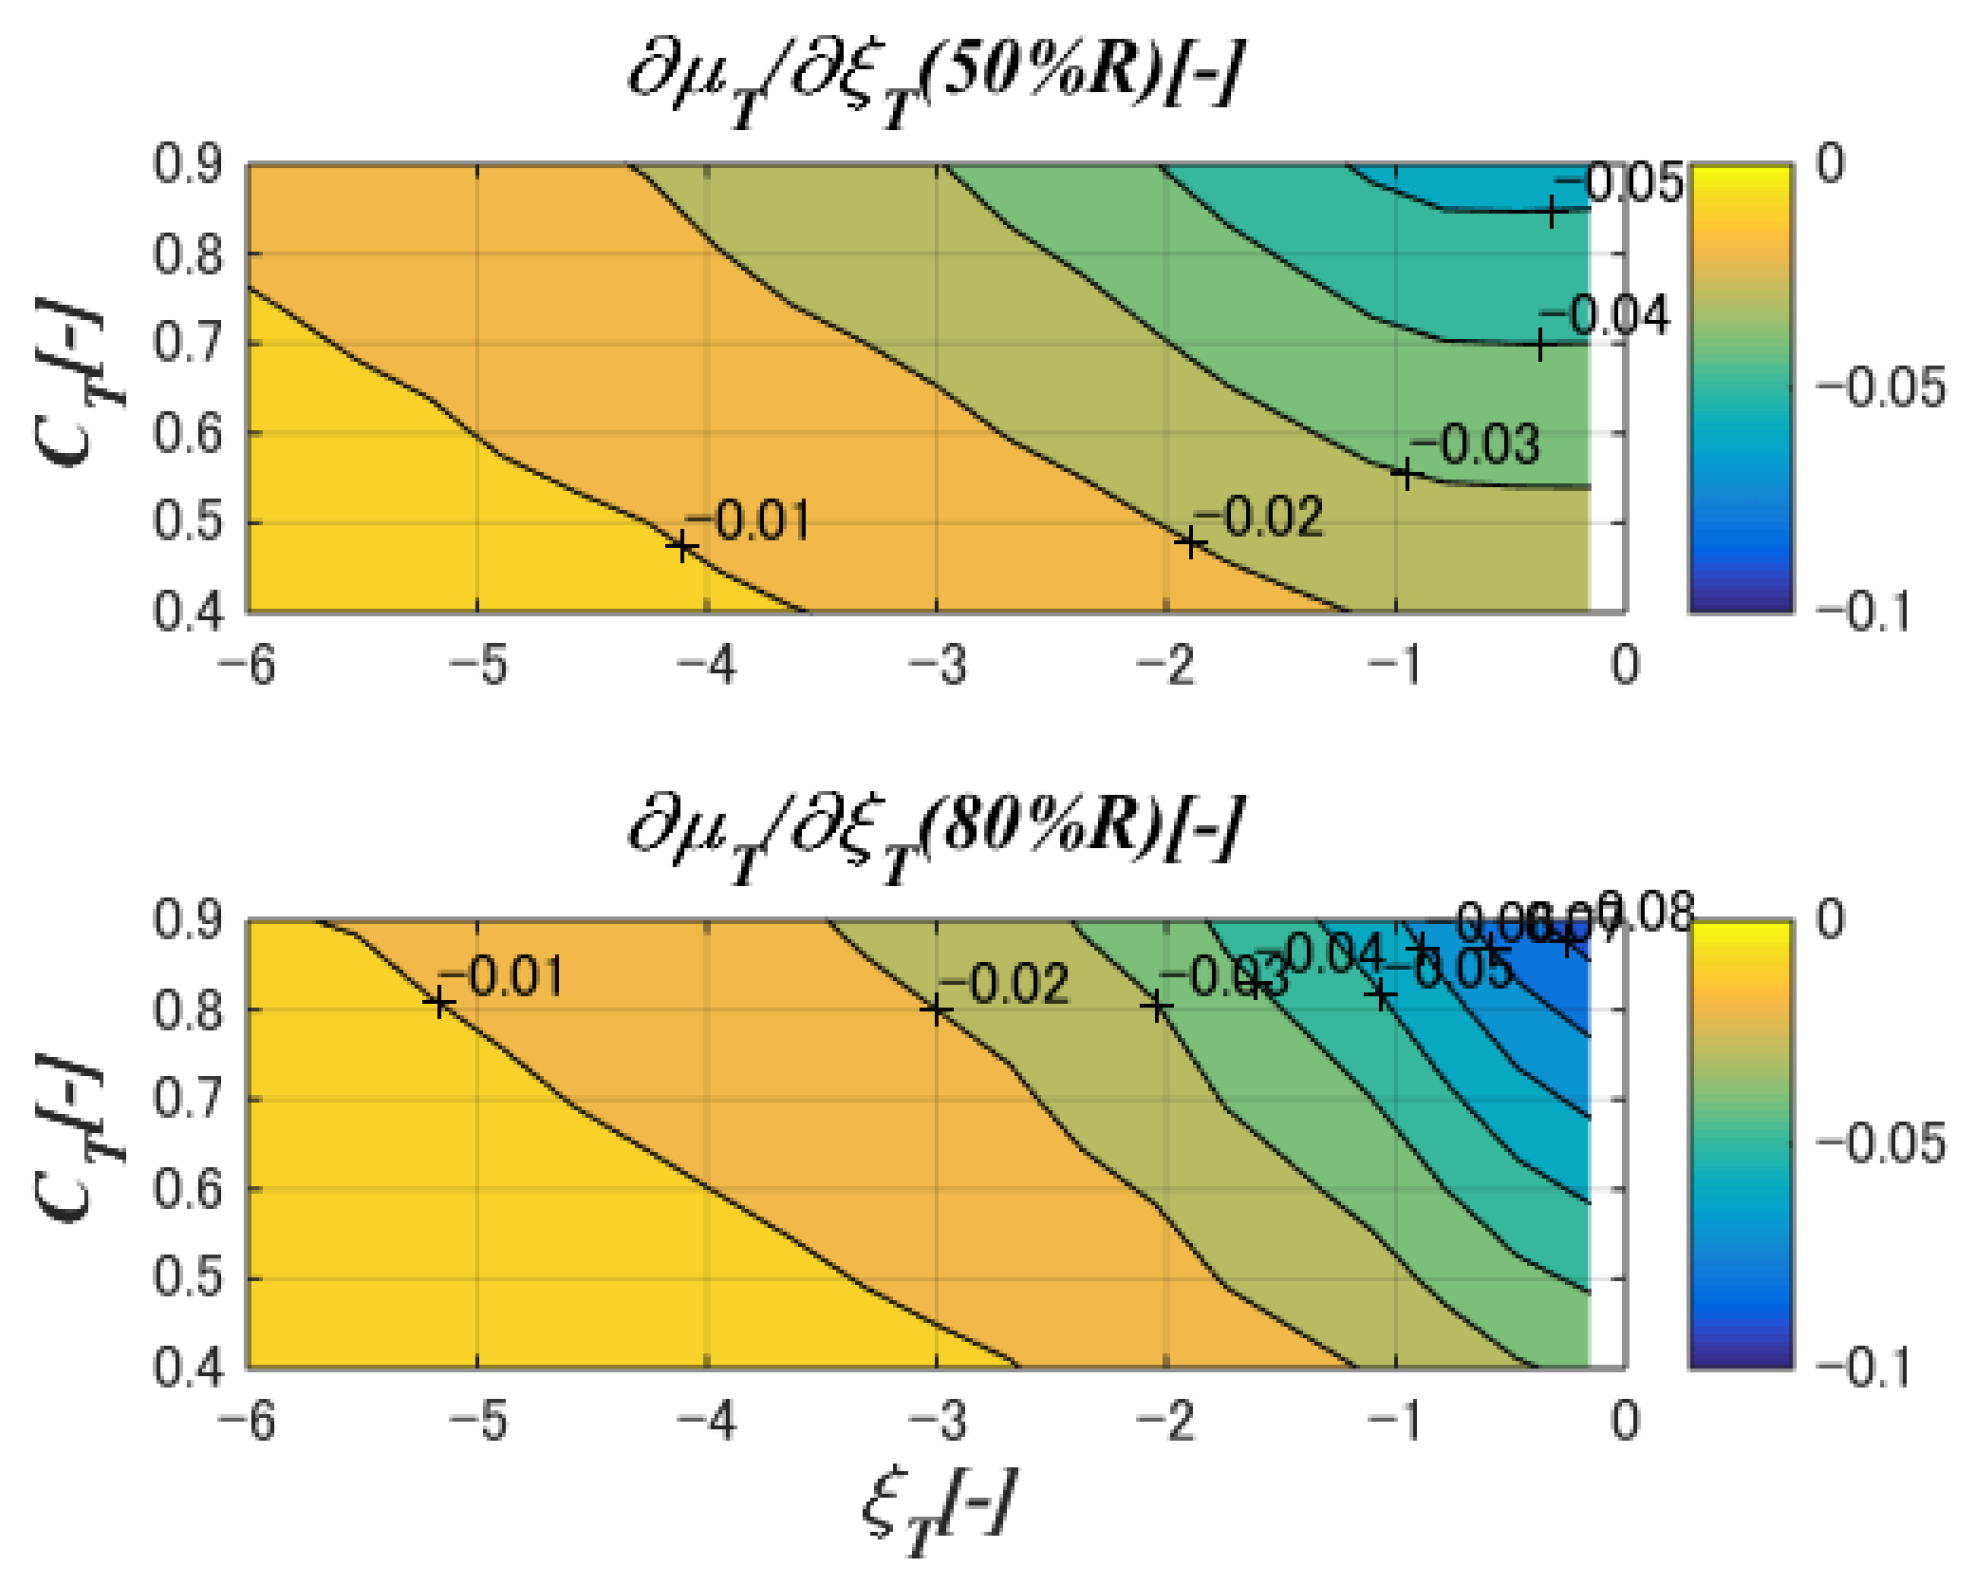
4.4. Wind Speed Distributions in Front of the Rotor
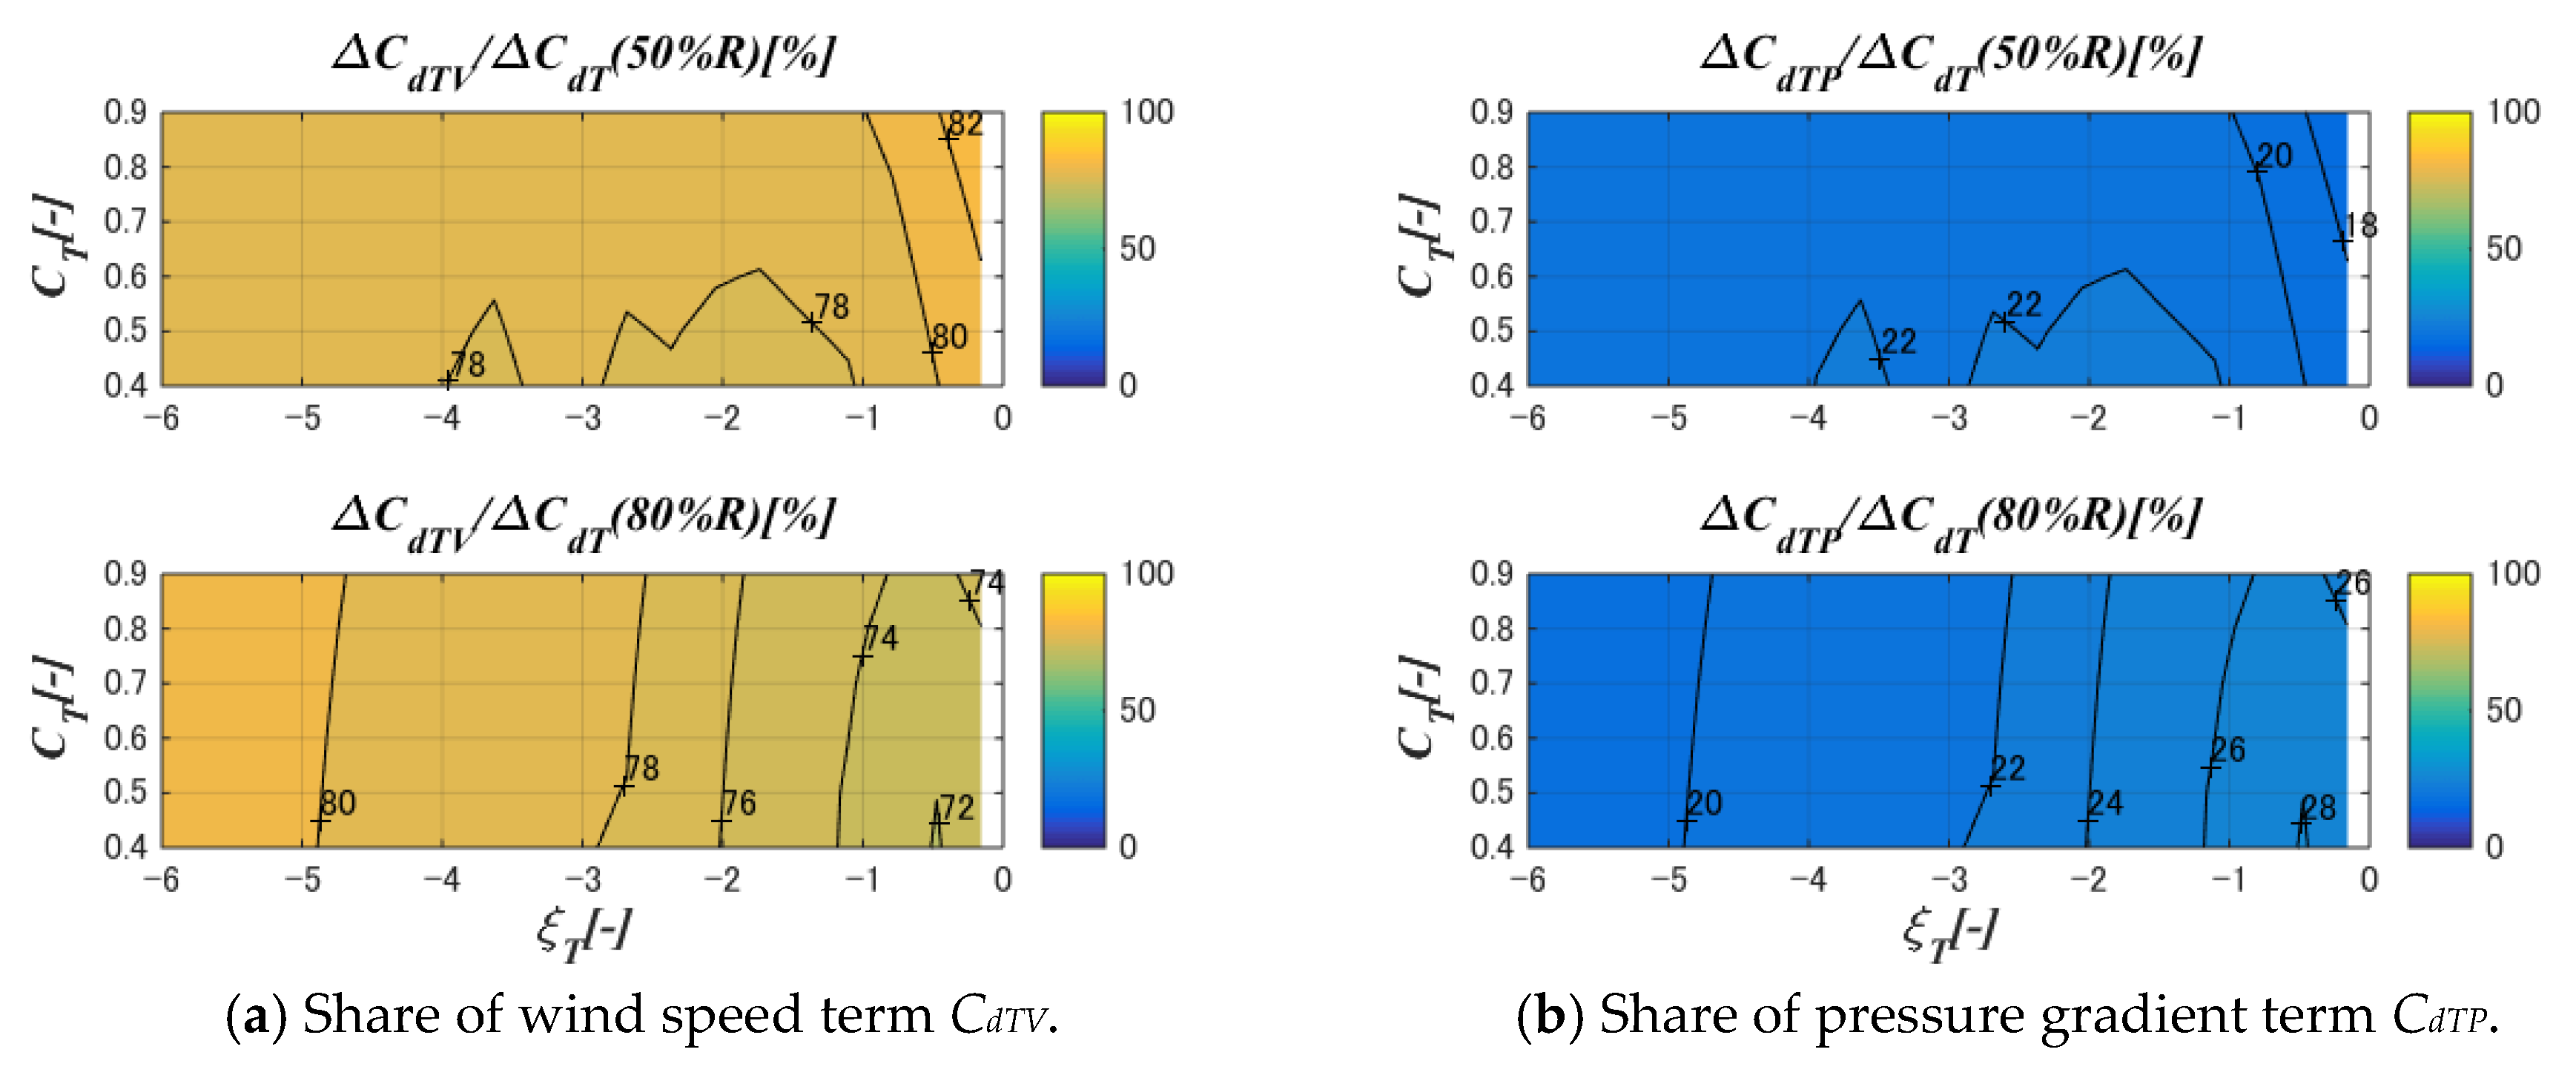
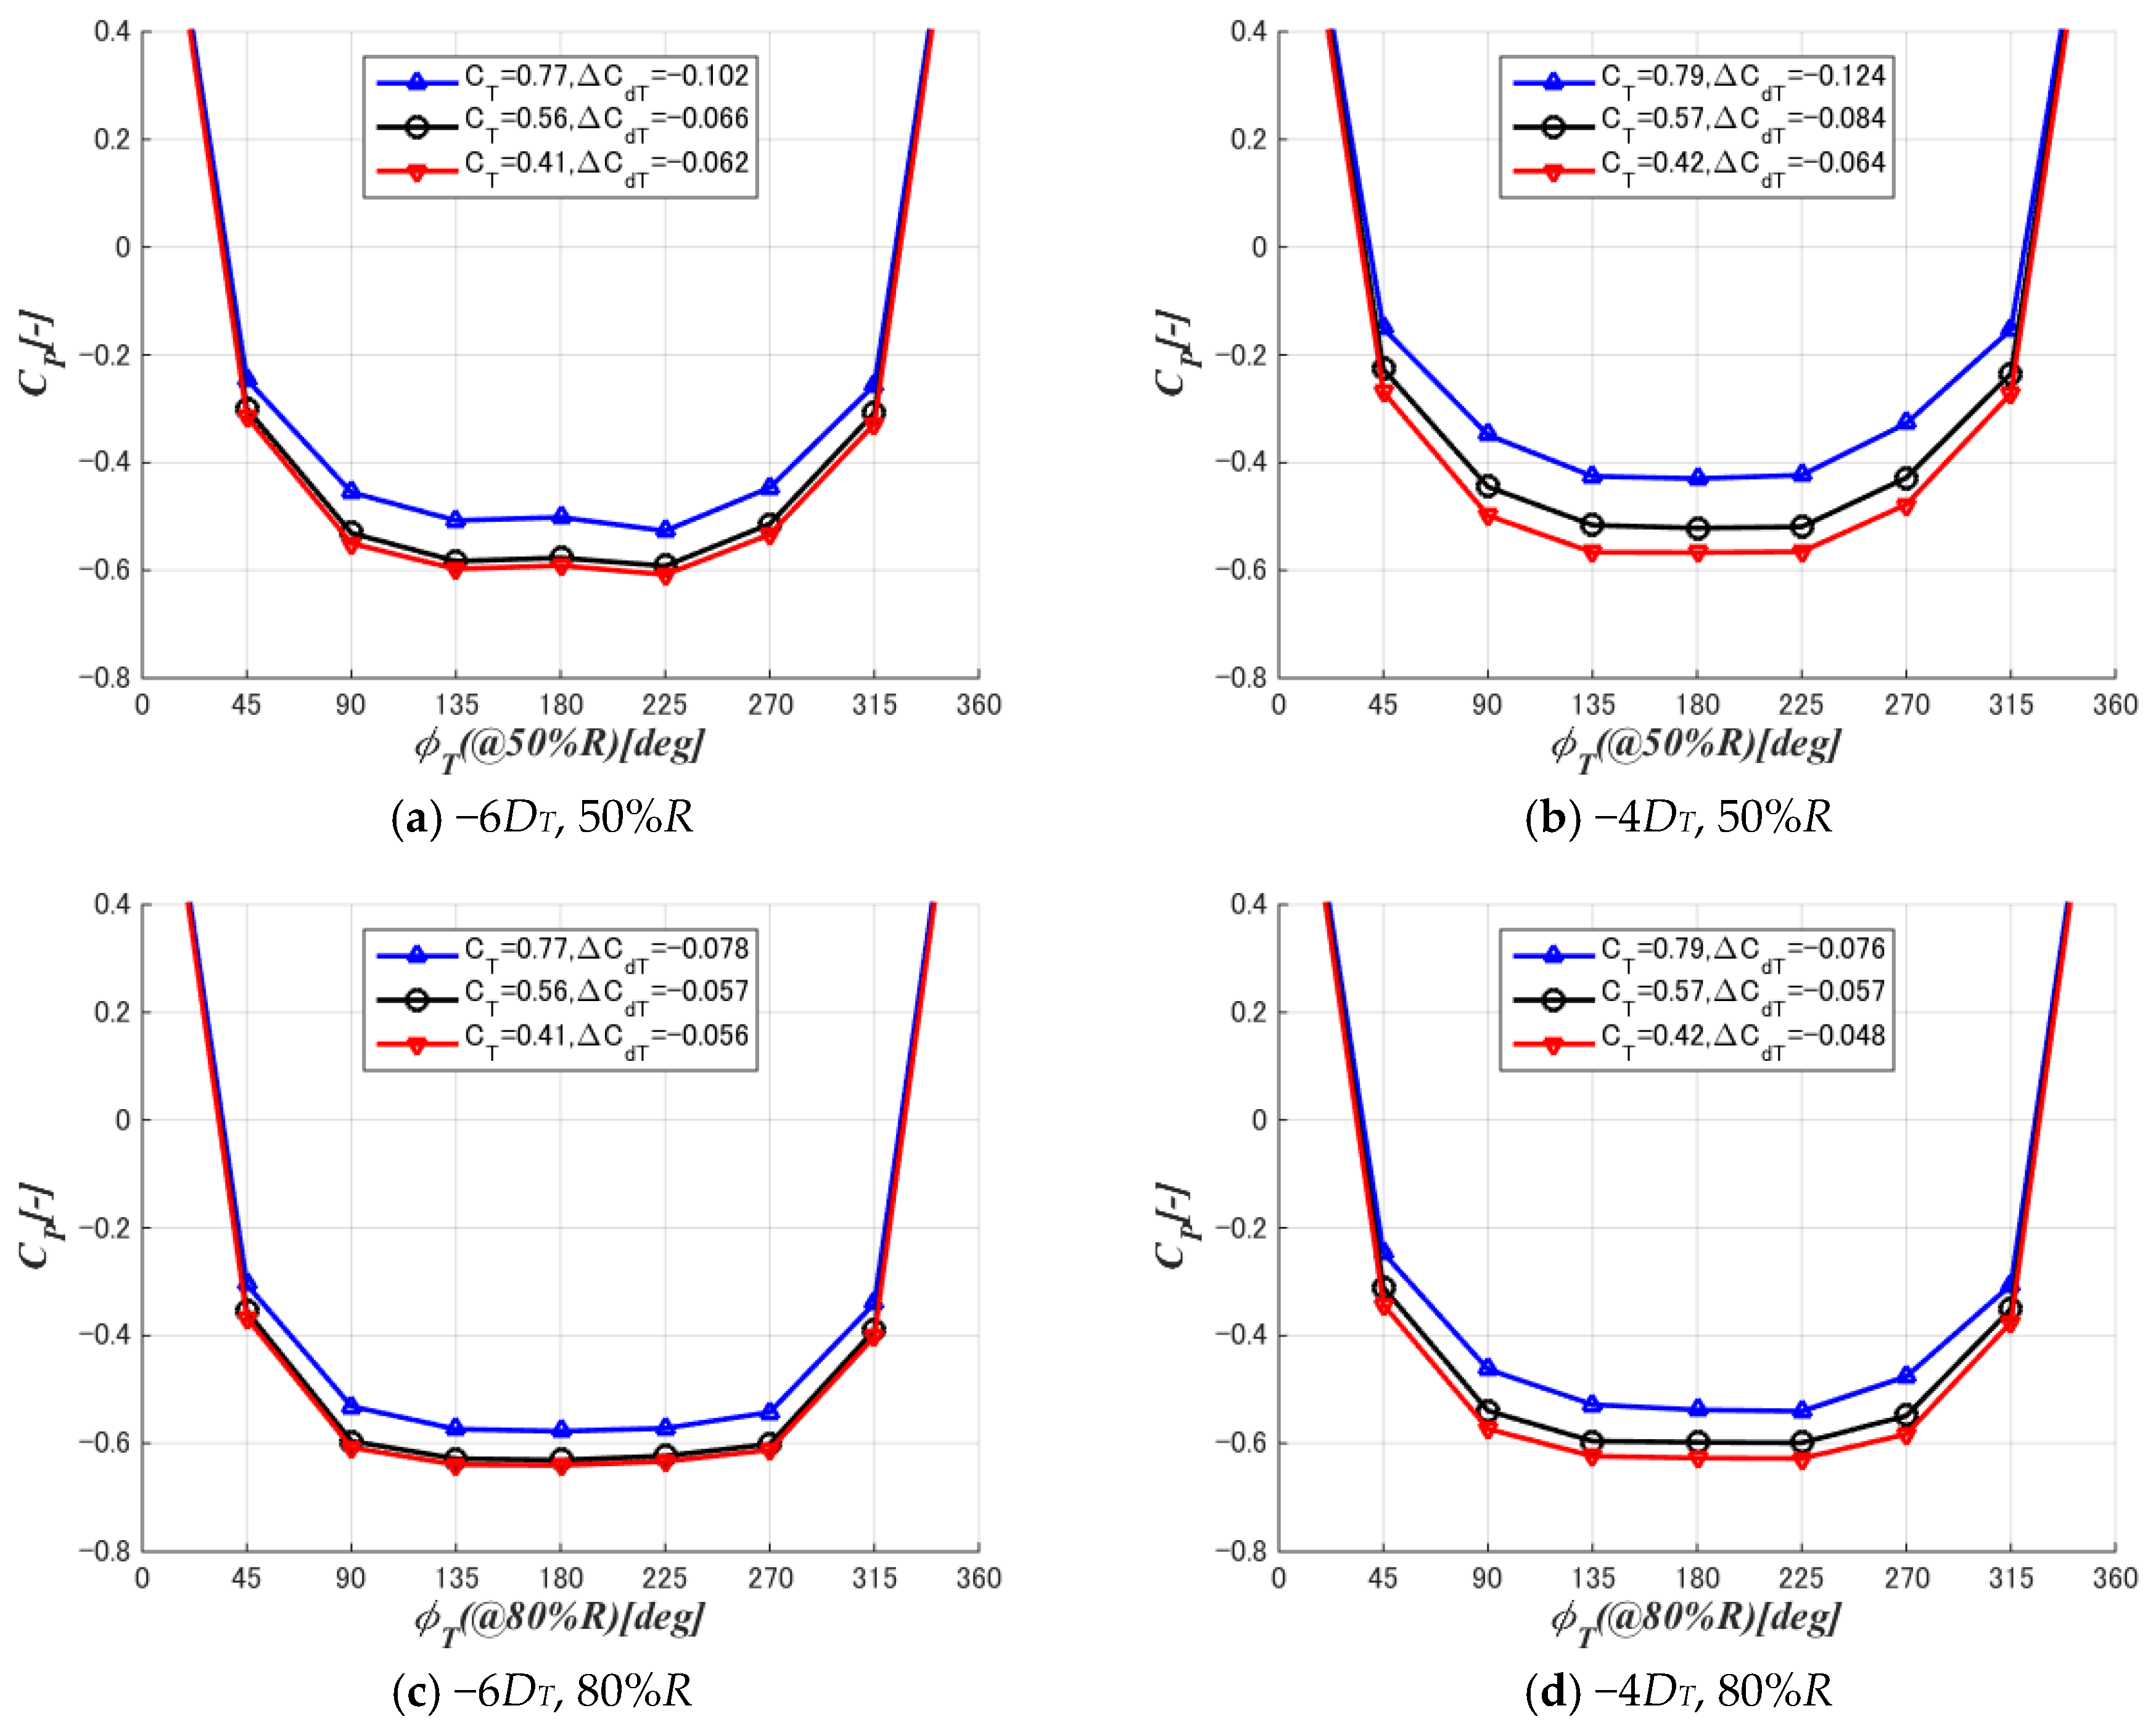
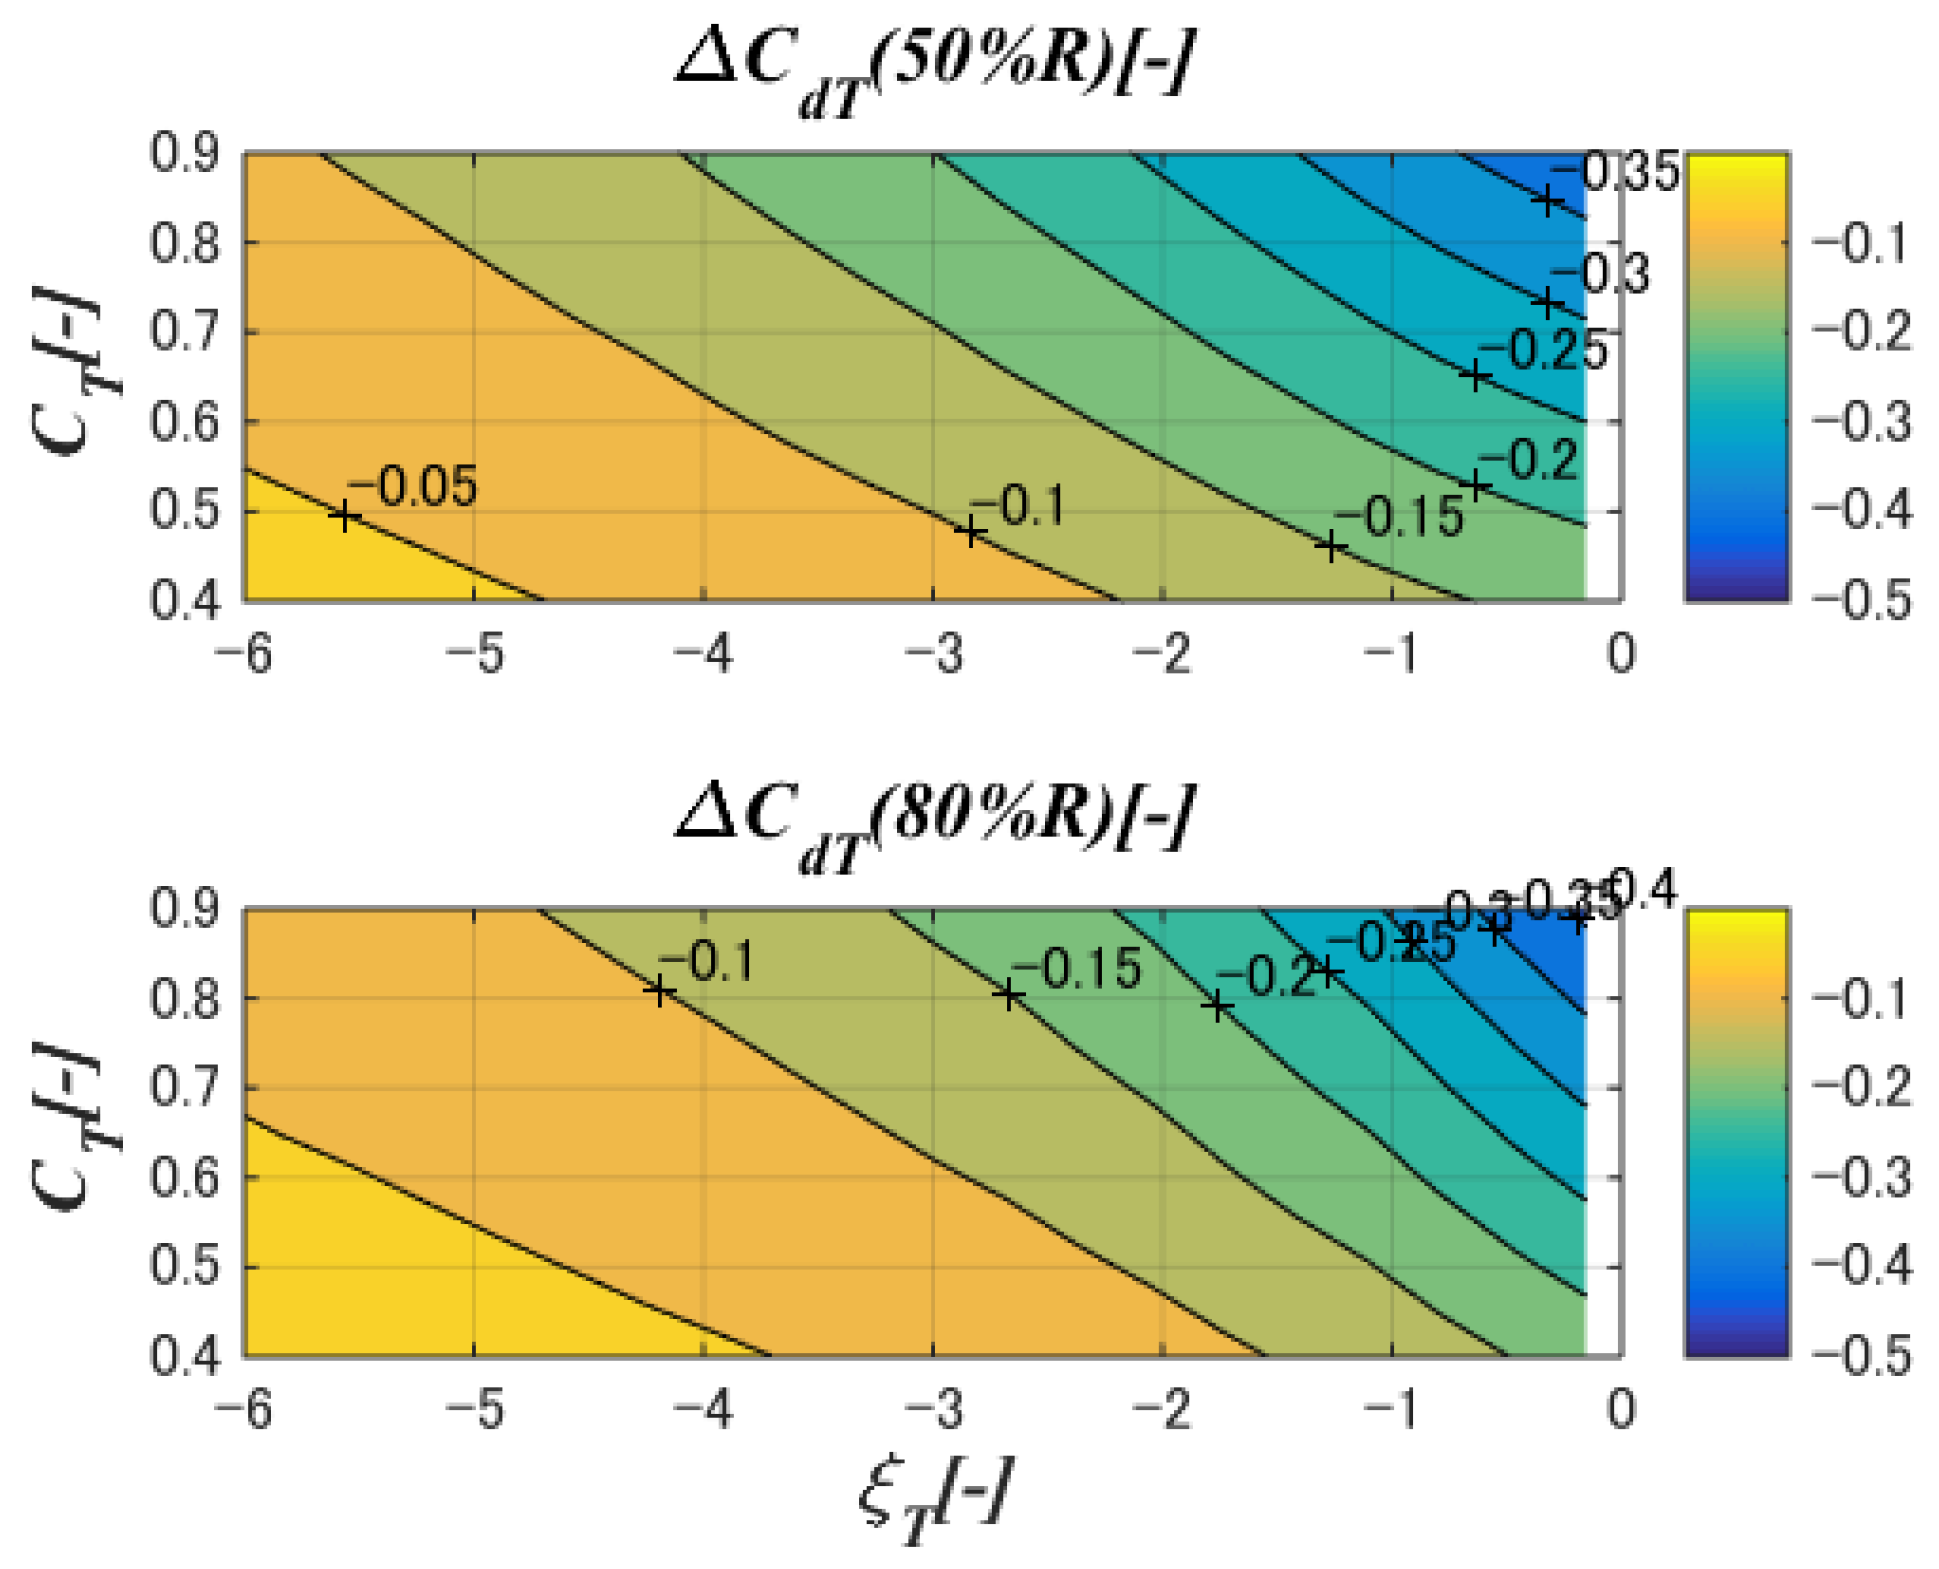
4.5. Drag Coefficients of the Virtual Tower
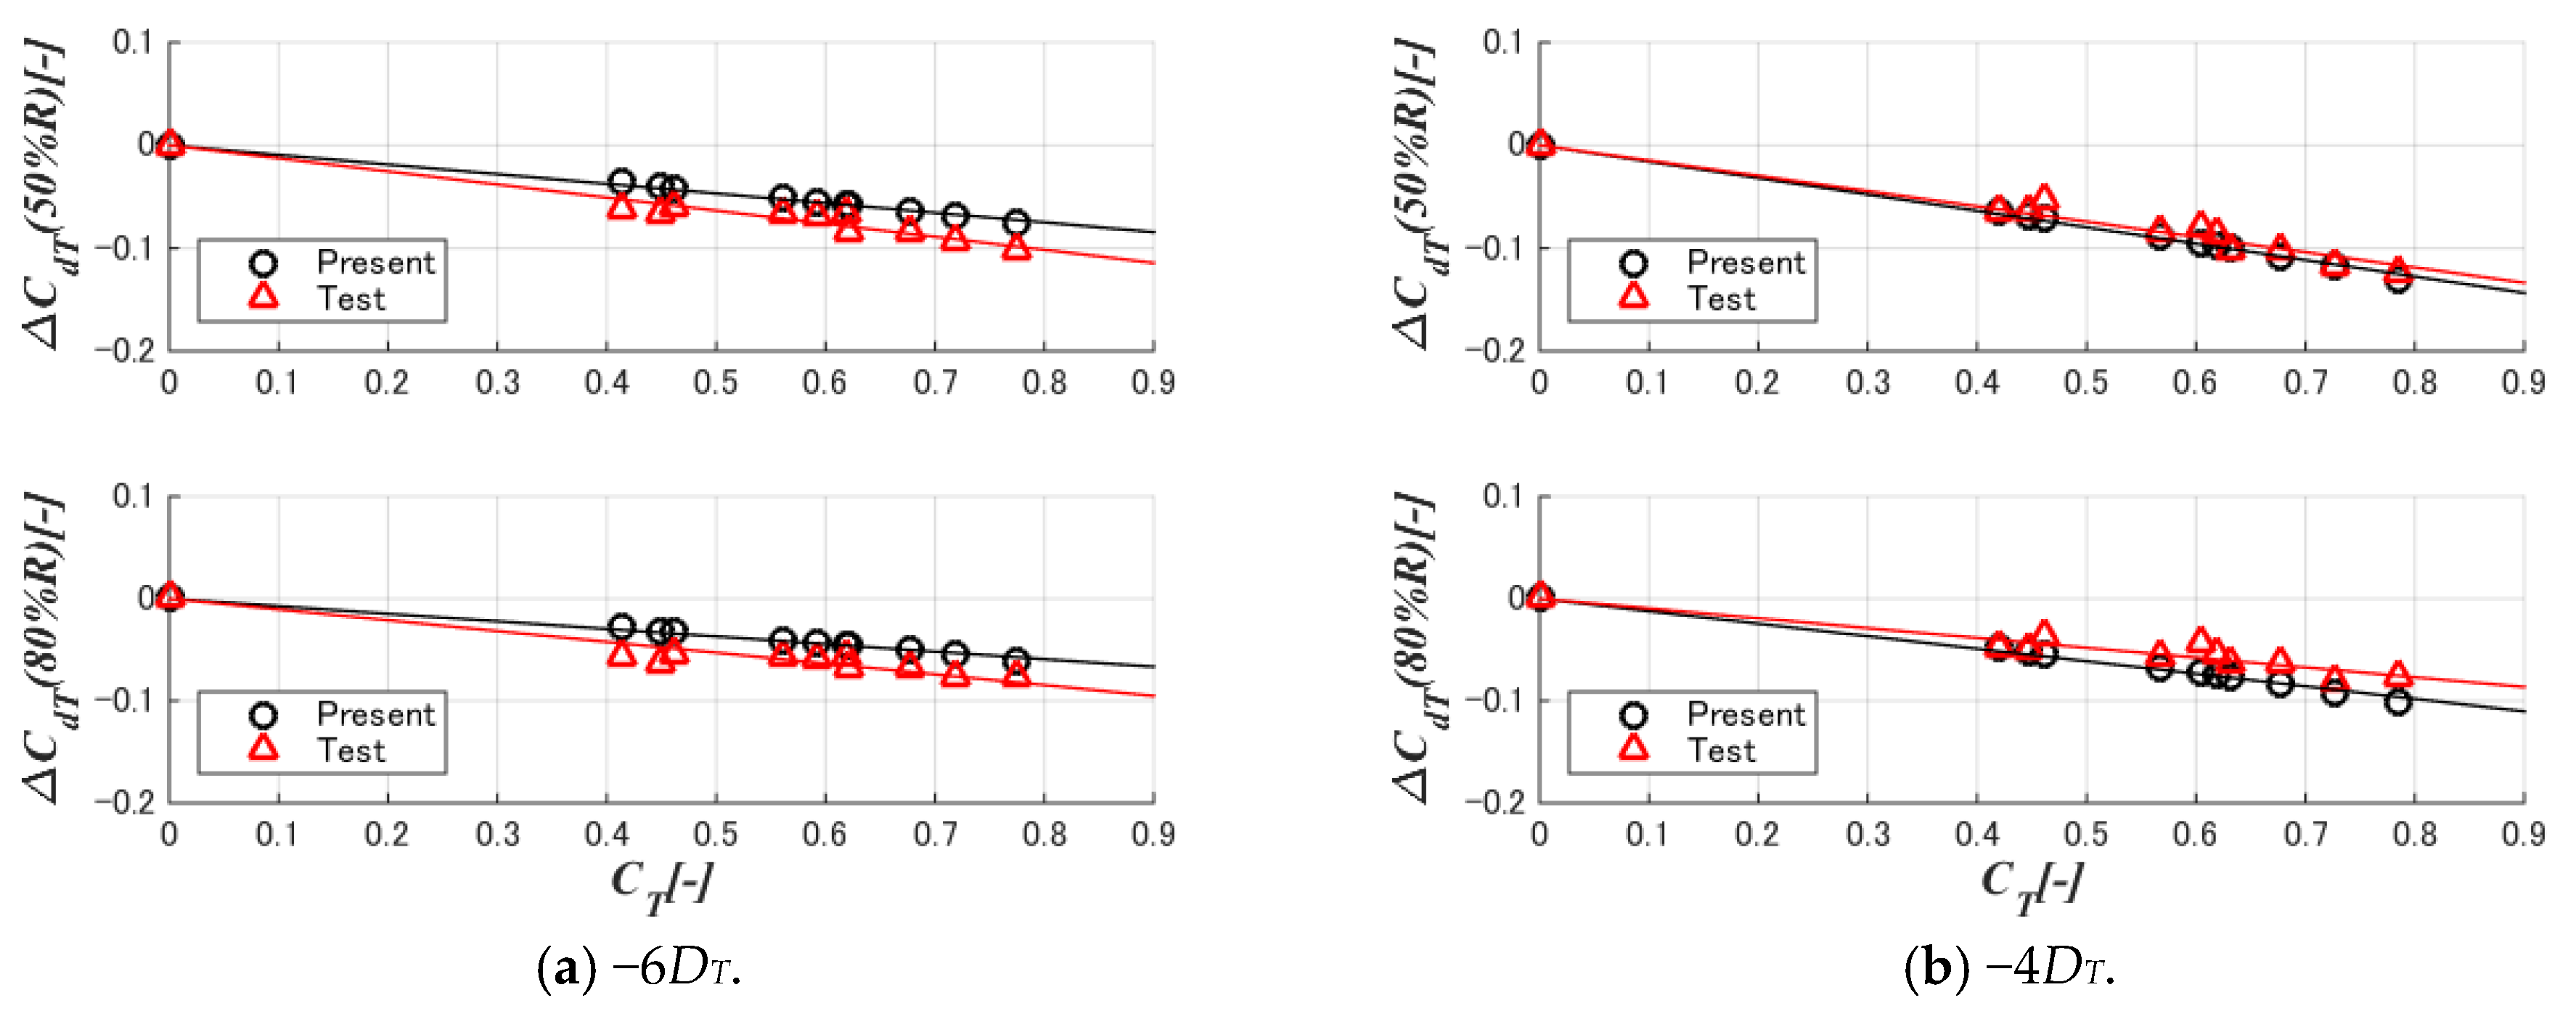
5. Validation
6. Conclusions
- -
- The drag coefficient was larger in the inboard section (50%R) than in the outboard section (80%R).
- -
- The drag coefficient decreased as the tower was positioned closer to the rotor.
- -
- Of the two terms influencing the deviation of the tower section drag, the effect of the decrease in wind speed was more dominant in leading to the decrease in the tower section drag.
Author Contributions
Funding
Acknowledgments
Conflicts of Interest
Nomenclature
| CdT | Tower drag coefficient |
| CdT0 | Tower drag coefficient with no rotor thrust |
| CP | Power coefficient |
| Cp | Pressure coefficient of the tower |
| CT | Thrust coefficient |
| D | Rotor diameter |
| DT | Tower diameter |
| fXT | Tower section drag |
| fXT0 | Tower section drag with no rotor thrust |
| p0 | Free stream pressure |
| pT | Pressure at the tower position |
| R | Rotor radius |
| r | Station radius of the blade element |
| T | Rotor thrust |
| U0 | Free stream wind speed |
| uT | Wind speed at the tower position |
| w | Thickness of the actuator disc |
| T | Longitudinal (or windward) position |
| CdT | Deviation of the tower drag coefficient from that of the isolated tower |
| ΔCdTP | Deviation of the tower drag coefficient by the effect of the pressure gradient |
| ΔCdTV | Deviation of the tower drag coefficient by the wind speed |
| ΔfXT | Deviation of the tower section drag from that of the isolated tower |
| ΔfXTP | Deviation of the tower section drag by the effect of the pressure gradient |
| ΔfXTV | Deviation of the tower section drag by the wind speed |
| θ | Blade pitch angle |
| λ | Tip speed ratio |
| μT | Normalized wind speed at the tower position |
| ξT | Position normalized by the tower diameter |
| ρ | Air density |
| ϕT | Azimuth position around the tower (0 deg in front, clockwise around the vertical axis) |
| ADM | Actuator disc model |
| ALM | Actuator line model |
| BEM | Blade element momentum (method) |
| CFD | Computational fluid dynamics |
References
- Gipe, P. Wind Energy Comes of Age; John Wiley and Sons: Chichester, UK, 1995. [Google Scholar]
- Wind Turbines—Part 1: Design Requirements; IEC61400-1, Ed. 3; International Electrotechnical Commission: Geneva, Switzerland, 2005.
- Germanischer Lloyd. Guidelines for the Certifications of Wind Turbines, Edition 2010; Germanischer Lloyd: Hamburg, Germany, 2010. [Google Scholar]
- Burton, T.; Jenkins, N.; Srpe, D.; Bossanyi, E. Wind Energy Handbook, 2nd ed.; John Wiley and Sons: Chichester, UK, 2011. [Google Scholar]
- Jonkman, J.M.; Buhl, M.L., Jr. FAST User’s Guide; NREL/TP-500-38230; NREL: Golden CO, USA, 2005.
- DNV GL. Bladed, Version 4.7; DNV GL: Bristol, UK, 2016. [Google Scholar]
- Zhao, Q.; Sheng, C.; Afjeh, A. Computational aerodynamic analysis of offshore upwind and downwind turbines. J. Aerodyn. 2014, 2014, 860637. [Google Scholar] [CrossRef]
- Zahle, F.; Madsen, H.A.; Sorensen, N.N. Evaluation of Tower Shadow Effects on Various Wind Turbine Concepts. Available online: http://orbit.dtu.dk/files/3550506/ris-r-1698.pdf (accessed on 19 July 2018).
- Matiz-Chicacausa, A.; Lopez, O.D. Full downwind turbine simulations using actuator line method. Model. Simul. Eng. 2018, 2018, 2536897. [Google Scholar] [CrossRef]
- Wang, T.; Coton, F.N. A high resolution tower shadow model for downwind wind turbines. J. Wind Eng. Ind. Aerodyn. 2001, 89, 873–892. [Google Scholar] [CrossRef]
- Yoshida, S.; Kiyoki, S. Load equivalent tower shadow modeling for downwind turbines. J. JSME 2007, 37, 1273–1279. [Google Scholar] [CrossRef]
- Yoshida, S.; Kiyoki, S. Load equivalent tower shadow modeling. In Proceedings of the European Wind Energy Conference 2007, Milano, Italy, 7–10 May 2007. [Google Scholar]
- Nagao, T.; Kato, T.; Shiraishi, T.; Yoshida, S.; Sugino, J. Development of advanced wind turbine systems for remote islands. Wind Eng. 2006, 28, 729–740. [Google Scholar] [CrossRef]
- Yoshida, S. Performance of downwind turbines in complex terrains. Wind Eng. 2006, 30, 487–501. [Google Scholar] [CrossRef]
- Yoshida, S. Nacelle Yaw Measurement of Downwind Turbines in Complex Terrains; Windtech International: Groningen, The Netherlands, 2008. [Google Scholar]
- Saeki, M.; Sano, T.; Kato, H.; Owada, M.; Yoshida, S. Concept of the HITACHI 5MW offshore downwind turbine. In Proceedings of the European Wind Energy Conference 2014, Barcelona, Spain, 10–13 March 2014. [Google Scholar]
- Yoshida, S. Combined blade-element momentum—Lifting line model for variable loads of downwind turbine towers. Energies 2018, 11, 2521. [Google Scholar] [CrossRef]
- Research Institute of Applied Mechanics, Kyushu University, Boundary Layer Wind Tunnel. Available online: https://www.riam.kyushu-u.ac.jp/windeng/en_equipment.html (accessed on 10 November 2018).
- ANSYS. ANSYS CFX; ANSYS: Canonsburg, PA, USA, 2006. [Google Scholar]


| Item | Specification |
|---|---|
| Number of blades | 2 |
| Rotor diameter D | 700 mm |
| Rotor radius R | 350 mm |
| Tilt angle | 0 deg |
| Coning angles | 0 deg |
| Airfoil | NACA0013 |
| Blade chord length | 32 mm |
| Twist angle | 0 deg |
| Tower diameter DT | 64 mm |
| Tower position | −338 mm (−6DT) −225 mm (−4DT) |
| Boundary | Distance from the Rotor Center | Boundary Condition |
|---|---|---|
| Rotor | −D/140~+D/140 | ADM |
| Tower | Not available | Not available |
| Inlet | −4D | Wind speed (uniform) |
| Outlet | +5D | Ambient pressure |
| Bottom | −2D | Slip |
| Top | +2D | Slip |
| Side | −2D, +2D | Slip |
| Dummy Tower Position | Tower Section | Test | Present | |
|---|---|---|---|---|
| ΔCdT/CT [-] | ΔCdT/CT [-] | Deviation from the Test | ||
| −6DT | 50%R | −0.1270 | −0.0937 | −26.2% |
| 80%R | −0.1058 | −0.0741 | −30.0% | |
| −4DT | 50%R | −0.1484 | −0.1594 | +7.4% |
| 80%R | −0.0961 | −0.1225 | +27.5% | |
© 2019 by the authors. Licensee MDPI, Basel, Switzerland. This article is an open access article distributed under the terms and conditions of the Creative Commons Attribution (CC BY) license (http://creativecommons.org/licenses/by/4.0/).
Share and Cite
Yoshida, S.; Fujii, K.; Hamasaki, M.; Takada, A. Effect of Rotor Thrust on the Average Tower Drag of Downwind Turbines. Energies 2019, 12, 227. https://doi.org/10.3390/en12020227
Yoshida S, Fujii K, Hamasaki M, Takada A. Effect of Rotor Thrust on the Average Tower Drag of Downwind Turbines. Energies. 2019; 12(2):227. https://doi.org/10.3390/en12020227
Chicago/Turabian StyleYoshida, Shigeo, Kazuyuki Fujii, Masahiro Hamasaki, and Ao Takada. 2019. "Effect of Rotor Thrust on the Average Tower Drag of Downwind Turbines" Energies 12, no. 2: 227. https://doi.org/10.3390/en12020227
APA StyleYoshida, S., Fujii, K., Hamasaki, M., & Takada, A. (2019). Effect of Rotor Thrust on the Average Tower Drag of Downwind Turbines. Energies, 12(2), 227. https://doi.org/10.3390/en12020227