Article

Towards the Development of Syngas/Biomethane Electrolytic Production, Using Liquefied Biomass and Heterogeneous Catalyst

1
Área Departamental de Engenharia Química, Instituto Superior de Engenharia de Lisboa, Instituto Politécnico de Lisboa, R, Conselheiro Emídio Navarro, 1, 1959-007 Lisboa, Portugal
2
CERENA—Centro de Recursos Naturais e Ambiente, Instituto Superior Técnico, Universidade de Lisboa, Av. Rovisco Pais, 1, 1049-001 Lisboa, Portugal
3
GSyF, Pol. Ind. Alto do Ameal, Pavilhão C-13, 2565-641 Torres Vedras, Portugal
*
Author to whom correspondence should be addressed.
Energies 2019, 12(19), 3787; https://doi.org/10.3390/en12193787
Submission received: 27 August 2019 / Revised: 30 September 2019 / Accepted: 1 October 2019 / Published: 6 October 2019

Abstract

:
This paper presents results on the research currently being carried out with the objective of developing new electrochemistry-based processes to produce renewable synthetic fuels from liquefied biomass. In the current research line, the gas mixtures obtained from the typical electrolysis are not separated into their components but rather are introduced into a reactor together with liquefied biomass, at atmospheric pressure and different temperatures, under acidified zeolite Y catalyst, to obtain synthesis gas. This gaseous mixture has several applications, like the production of synthetic 2nd generation biofuel (e. g., biomethane, biomethanol, bio-dimethyl ether, formic acid, etc.). The behaviour of operational parameters such as biomass content, temperature and the use of different amounts of acidified zeolite HY catalyst were investigated. In the performed tests, it was found that, in addition to the synthesis gas (hydrogen, oxygen, carbon monoxide and carbon dioxide), methane was also obtained. Therefore, this research is quite promising, and the most favourable results were obtained by carrying out the biomass test at 300 °C, together with 4% of acidified zeolite Y catalyst, which gives a methane volumetric concentration equal to 35%.

1. Introduction

Oil-derived fuels are essential for complying with the World’s energy needs, accounting for the majority (more than 80%) of the global primary energy consumption, and recent forecast studies, developed by the IEA (2017) [1] and BP (2018) [2], show a continuing growth in fossil fuel demand [3], in the near future, considering a wide range of factors such as demand, technology development, assumptions of policy agreements in order to reduce greenhouse gas emissions (GHG), as well, as changes in the regional production capacity [4]. In spite of this dependence, recent concerns over climate change have driven society to seek for alternatives in order to reduce GHG emissions. This resulted in a continuous search for a shift in energy production from fossil fuels toward renewables [5].
Consequently, the use of biomass as a source of renewable energy has recently been increasing. When compared to fossil fuels, biomass energy has several advantages which includes its renewable nature, carbon neutral ability, low sulfur emission during combustion, relative abundance and its easy transportation and storage. Therefore, biomasses are, potentially, one of the more important available resources to produce new liquid biofuels, synthesis gas (syngas), biohydrogen, solid biofuels, and, valuable chemicals [6]. Liquefaction is a relatively novel process capable of converting biomass into bio-oil products [7]. In general, the liquefaction of biomass consists of three main steps: depolymerization followed by decomposition, and, recombination at high temperatures [8]. Normally, the biomass liquefaction processes use a specific solvent, such as water or organic ones, such as, methanol, ethanol, phenol, acetone, etc., to interact strongly with the biomass components [9]. More recently, cork by-products, have been reported as interesting raw materials for liquefaction, by conventional, microwave induced, as well as ultrasounds-assisted methods [6]. The main components of these solid biomass, like cork and eucalyptus bark are, lignin, cellulose and hemi-cellulose [9].
The bio-oil obtained from the liquefaction processes of these solid biomass components, performed at 160 °C and 90 min, such as described by Mateus et al. [6], has several advantages, like its utilization as fuel, in engines and, in other combustion units, such as, boilers, furnaces, etc., as auxiliary fuel or, can be converted into high quality chemical products, through several processes, like, catalytic cracking, hydrogenation or steam reforming [10].
Regarding electrolysis process, the main four technologies developed are, alkaline electrolysis, Proton-exchange membrane (PEM), Solid Oxide Electrolysis (SOE) [11,12] and, finally, Polymeric Anion Exchange Membrane (AEM) processes [13].
The syngas applications are several, not only related with synthetic biofuels production, but also, in the added-value chemical products, such as, formic acid, ethylene, but also, methyl acetate, acetic acid, formaldehyde and polyolefins (these last four produced from biomethanol) [14]. In the field of synthetic biofuels production, syngas can be converted into biomethanol [15,16], bio-DME [17], biomethane (synthetic natural gas) through the Sabatier process [18,19], but also, into biodiesel, bio-gasoline, bio-naphtha, etc., through the Fischer-Tropsch process [20,21].
This paper describes a further new approach on a new technology, previously reported by the authors [22] capable of producing syngas in a single step, without separation of the elementary gases, produced during the water alkaline electrolysis. It is called co-electrolysis of water, under the alkaline process, using a carbon source to directly produce the syngas mixture, at low temperatures and pressures, thus requiring significatively less amounts of energy inputs [11,23]. This previous approach, uses graphite electrodes, as a source of carbon, that is further oxidized, during the electrolysis process, to carbon monoxide and carbon dioxide which are present in the generated gas mixture (syngas), and, efficiently converts electricity from renewable sources (mainly wind or solar, or when this electricity is in excess in the electrical grid, or in off peak hours). Thus, this new technology is able to convert electricity into syngas, which is an intermediate for the generation of synthetic 2nd G biofuels, which was already demonstrated [24]. The main drawback is the (small) consumption of the graphite electrodes and its relatively high cost, which could be avoided if steel electrodes are used together with an additional carbon source, such as, liquefied biomass, to be added in the electrolyser. Concerning the use of liquefied biomass, some results from preliminary trials have been recently published elsewhere [25], and points out that, the process needs enhancement, such as, the use of solid catalysts. In this new process, the gas obtained from electrolysis is not separated into its components and, it’s introduced into a reactor together with a specific content of a previous mixture of cork/eucalyptus bark liquefied biomass, at normal pressure and different temperatures. The gas is released upon contact with the biomass, thus resulting into syngas, which is a mixture consisting essentially of carbon monoxide, hydrogen, carbon dioxide and some unreacted oxygen. In this work, the behaviour of operational parameters such as biomass content and type, temperature and the use of different amounts of acidified zeolite (z.) HY catalyst were investigated. In the performed tests, it was found that, in addition to the syngas, methane was also produced, with significant content. The purpose of use samples of different kinds of liquified biomass (described in Section 2.1) of cork and/or eucalyptus bark, with and without the correspondent sugars solubilized in aqueous solvent, was to investigate if, there was significant influence in the output syngas/methane produced, at the methanation reactor, as well, the influence of temperature and catalyst content in this process. The temperatures range choose for this study must be significantly lower than the typical temperatures used in the gasification process (700–800 °C). The advantage of this technology is located, precisely, in the utilization of lower/medium temperatures, when compared with the coal/biomass gasification and steam reforming processes, which produces, also, syngas. The utilization of lower temperatures will lead to significant input energy savings to the process and, as consequence, lower operating costs. On the other hand, the influence of using lower catalyst contents in the methanation process in this study, is to see if the methane concentration will increase in these temperatures, with and without catalyst.

2. Materials and Methods

2.1. Chemicals

The chemicals used in this research work were, sodium hydroxide (pellets) from VWR Chemicals Prolabo (Fontenay-sous-Bois, France), Y powdered zeolite in the basic form (NaY), from Sigma-Aldrich (Darmstad, Germany) and ammonium nitrate from Merck (Darmstad, Germany). The biomass liquified samples employed were four, one was a mixture of cork and eucalyptus bark with the correspondent sugars (A1), other obtained from the liquefaction process of only cork biomass, with the correspondent sugars (A2), other obtained from the liquefaction process of only eucalyptus bark, without the correspondent sugars and solvents previously removed (A3), and, finally, the last one, similar to A3 but with the correspondent sugars and a significant quantity of solvent (A4). These liquified biomass samples were obtained through a hydro-liquefaction process, with an organic solvent and, also, with an acid homogeneous catalyst, in a range of temperatures between 160–200 °C.

2.2. Syngas and Methane Production Equipment

The production of syngas was carried out on a laboratory apparatus, schematically shown in Figure 1, consisting of: (i) a cylindrical storage tank feeding electrolyte to the solution; (ii) a second storage for the electrolyte solution; (iii) a column containing molecular sieve, in order to adsorb the humidity of the produced gas, and finally, (iv) an electrolyser, where the various electrochemical reactions take place to produce synthesis gas. The electrolyser has a total of seven steel electrodes, each one with a diameter of 5 cm and, a thickness of 0.2 cm, thus resulting an area of 20 cm2 by electrode, forming disks with two holes each, thus creating electrolyte circulation channels. One channel is connected to the electrolyser input, while the other is connected to its output, thus allowing the out flow of produced gases. The electrodes are spaced from each other 0.3 cm, thus creating in the electrolyser, 8 electrolytic cells. The body of the vessel is made of methyl methacrylate polymer, with a basis of stainless steel, to withstand pressure. To prevent heat losses from the electrolyser and the electrolyte circulation tank, the components are insulated with rockwool. The methanation reactor (v) used is made of glass and consists of an inlet pipe that extends into the reactor where the gas will bubble and an outlet pipe for the produced gas (syngas) that goes to a condenser (vi) with a coupled tank where the resulting condensation and the final gas for analysis are collected. This reactor has approximately 7.6 cm of diameter and 5.7 cm of high (Figure 2). During operation, the electrolyte is admitted through the inlet valves, thus filling up the electrolyser. Then, electric terminals connect the electrodes to the power supply source and the electrolysis process takes place. The produced gas composition is measured by specific sensors (CLEVER CY-12C oxygen analyser from CLEVER, Beijing, China, carbon dioxide and carbon monoxide analysers, both from KELISAIKE (Beijing, China), and a methane analyser from Exibd R (Beijing, China), previously calibrated and validated by gas chromatography and, the total flow rate of gases were measured by a volume displacement device. In this study, liquefied biomass from cork wastes was used, obtained as described elsewhere [6]. In order to improve the composition of the produced syngas, a solid catalyst was used, which was prepared from a powdered Y zeolite in basic form, that was acidified using ammonium nitrate, by a traditional technique [26]. Figure 3, shows, on the left, the electrolyser unit and, on the right, the used steel electrodes prepared, like described above.
The measures of pH and conductivity of the electrolyte solutions in the electrolyser in the beginning and the end of each experiment, were conducted, respectively, with a HANNA Instruments (Woonsocket, RI, USA) portable device and, with a GLP32 conductimeter (Crison. Barcelona, Spain). A PB 3002 balance (Mettler Toledo, Columbus, OH, USA) with a precision of 0.01 mg was also used to weigh the solid samples and, also, an oven and a furnace, from Nabertherm (Lilienthal, Germany), were used to dry and calcinate, respectively, the solid catalytic samples.

2.3. Solid and Liquid Samples Characterization

Regarding catalyst characterisation, zeolite Y acidified was characterised by Scanning Electronic Microscopy with Electron Diffraction Spectroscopy (SEM-EDS) and, liquid samples obtained (condensate and liquified biomass) were analysed through Fourier Transformed InfraRed Spectroscopy (FTIR). The SEM microscope used was a model JSM-7001F (JEOL, Tokyo, Japan), where the solid samples were previously conducted through an gold alloy and, the FTIR spectrometer used was one from Agilent Technologies (Santa Clara, CA, USA), where the correspondent spectra were acquired in a range of wavenumber between 650 cm−1 and 4000 cm−1, with a resolution of 32 scans.min−1.

2.4. Preparation of the Different Electrolytes (NaOH Concentration and Biomass Content)

Several electrolytes were prepared with two different concentrations of sodium hydroxide (0.4 and 1.2 M) in demineralized aqueous solution, without any liquified biomass content. After that, four electrolytes were prepared, all of them with 1.2 M of sodium hydroxide concentration, but with different liquified biomass weight contents (5, 10, 12 and 15%), for a total volume of water and biomass in each experiment, equal to 100 mL. For all of these experiments, the different electrolytes were placed in the electrolyte admission tank and it was open the valve with connects the tank to the electrolyser, to filling it. Then, it was plugged the terminals of the electric feed supply to the electrolyser. All of these experiments were conducted for 2 hours, measuring in each 15 minutes, the electrolyte temperature (T), voltage applied (V), current intensity (I), gas volumetric flow and, its volumetric composition. In the beginning and in the end of each experiment, it was measured the pH and conductivity of the correspondent electrolyte.

2.5. Preparation of Acidified Heterogeneous Catalyst

Since the Y zeolite catalyst was supplied in basic form (NaY), it was necessary to convert it in acidic form (HY), using ionic exchange with a 2 M aqueous solution of ammonium nitrate, for 6 h in an oil heating bath, with stirring, at 80 °C, to convert first, into the ammonium form (NH4Y). After this time, the final solution was filtered under vacuum filtration and the collected solid was dried in an oven, overnight (14 hours approximately), at 90 °C. In the next day, the dried solid was placed in a furnace oven, at 500 °C for 8 hours, with a gradient heat of 5 °C·min−1 releasing ammonia gas and adsorbed water, converting the zeolite from the ammonium form (NH4Y) to the acidic form (HY).

2.6. Experiments in the Syngas/Methane Reactor

First, in order to estimate the liquified biomass apparent density or bulk density, which is a property of powders, granules, and other “divided” solids, or any other masses of corpuscular or particulate matter. It is defined as the mass of many particles of the material divided by the total volume they occupy. The total volume includes particle volume, inter-particle void volume, and internal pore volume [27]. This bulk density was quantified in the liquified biomass sample (A2) collected after the liquefaction process, supplied by one of our research partners. It was placed it in the reactor, 100 mL, and then, sealed the reactor inlet and placed it in an oil heating bath with magnetic stirring, for 4 hours, at different temperatures. The outlet reactor was connected to a condenser in order to collect the release condensate at liquid state, which was collected in a cylindrical tank. After 4 h, the liquified biomass was then weighted, to compare with its initial mass, before the correspondent experience.
The characterization and quantification of the syngas composition was conducted in a second round of experiences, namely the methane gas produced and the oxygen content after the reaction with the liquified biomass, with and without HY zeolite solid catalyst. In all of these experiments, it was used 100 mL of liquified biomass in the reactor, and also, it was used in the electrolyser, 0.4 M of sodium hydroxide aqueous solution. In the experiments, different weight percentages of catalyst were used, together with the liquified biomass, in the methane reactor. 1 g, 2 g and 4 g of HY zeolite were weighted and then mixed with the 100 mL of liquified biomass in this reactor, which corresponds, respectively, to, approximately, 0.9%, 1.8% and 3.6% of mass catalyst concentration, at four different temperatures (150, 200, 250 and 300 °C). All these experiments were carried out at 4 hours, measuring several parameters each 30 minutes, such as, temperature in the electrolyser, (T), voltage applied (V), current intensity (I), gas produced volumetric flow and its volumetric composition, at the outlet reactor, quantifying also, the condensate volume produced and, in the end of each experiment, the volume of liquified biomass, to compare it with the initial one.

3. Results and Discussion

3.1. Characterisation of the Supplied Different Biomass Samples

The solid biomass used as raw-material in the liquefaction process, supplied by a pulp industry Portuguese Company was cork and eucalyptus bark, with a typical elemental composition show in Table 1. It’s possible to see that, those values are in accordance with similar ones published elsewhere [28].
After the liquefaction process of these biomass samples, they were analyzed, through the quantification of its elemental composition, water content, the low heating value (LHV) and the high heating value (HHV). This analysis was performed in one of our research partners, a cement kiln producer and, the correspondent results are shown in Table 2.
Table 2 shows elemental composition of liquified cork/eucalyptus bark biomass samples, after the hydro liquefaction process performed, in our research partner, as well, the final humidity content and the heating values (HHV and LHV).
As reported in several references, biomass solid samples shows higher H/C and O/C ratios then fossil fuels, like coal [28], which enhances hydrogen composition in the syngas production, in thermochemical process, like gasification [28]. In this electrochemical process, the increase in the hydrogen composition of syngas produced will enhance the production of biofuels, like in the methanation processes. Besides that, less carbon contents will decrease carbon dioxide emissions (GHG) to the atmosphere [28].

3.2. Preparation of the Different Electrolytes (NaOH Concentration and Biomass Content)

Table 3 shows the experimental results achieved regarding the first round of experiences in the electrolyser, with and without different liquified biomass contents, for two sodium hydroxide electrolyte concentrations. The parameters measured for each experiment were, the electrolyte temperature in the electrolyser (T), the input voltage (V), the current intensity (I), the final volumetric flow of gas produced, the initial and final pH (pHi and pHf), as well, the initial and final conductivity (Ki and Kf). All the values pointed in the table are averages values calculated from 4–5 experiences performed for each case, at the end of 120 min.
This table also shows the calculated correspondent relative variations of pH (ΔpH) and conductivity (ΔK). Through these results, it is possible to conclude that, with the exception of the 15% (w/w) of biomass content experiment, the increase in the liquified biomass in the electrolyte decreases the final temperature in the electrolyser and, also, the current intensity, as well, the produced gas volumetric flow, since, both parameters are related. The justification is directly related with the electrolysis conversion and the gas flow observed, which are proportional to the current intensity and, also, to the heat produced in the electrolyser, through Joule’s effect. For the same electrolyte quantity, less current intensity will decrease the heat released and the electrolyser temperature. It’s possible to see, also, that, the presence of organic compounds, such as, the liquified biomass, mixed in the electrolyte, decreases significantly the conductivity values. It’s well known that, organic compounds have very low electrical conductivity values, thus affecting negatively the electrolysis conversion process, decreasing the electrolyte final conductivity, when compared with the sodium hydroxide conductivity values. This is confirmed by these results, which affected also, the final pH of the electrolyte, decreasing it.
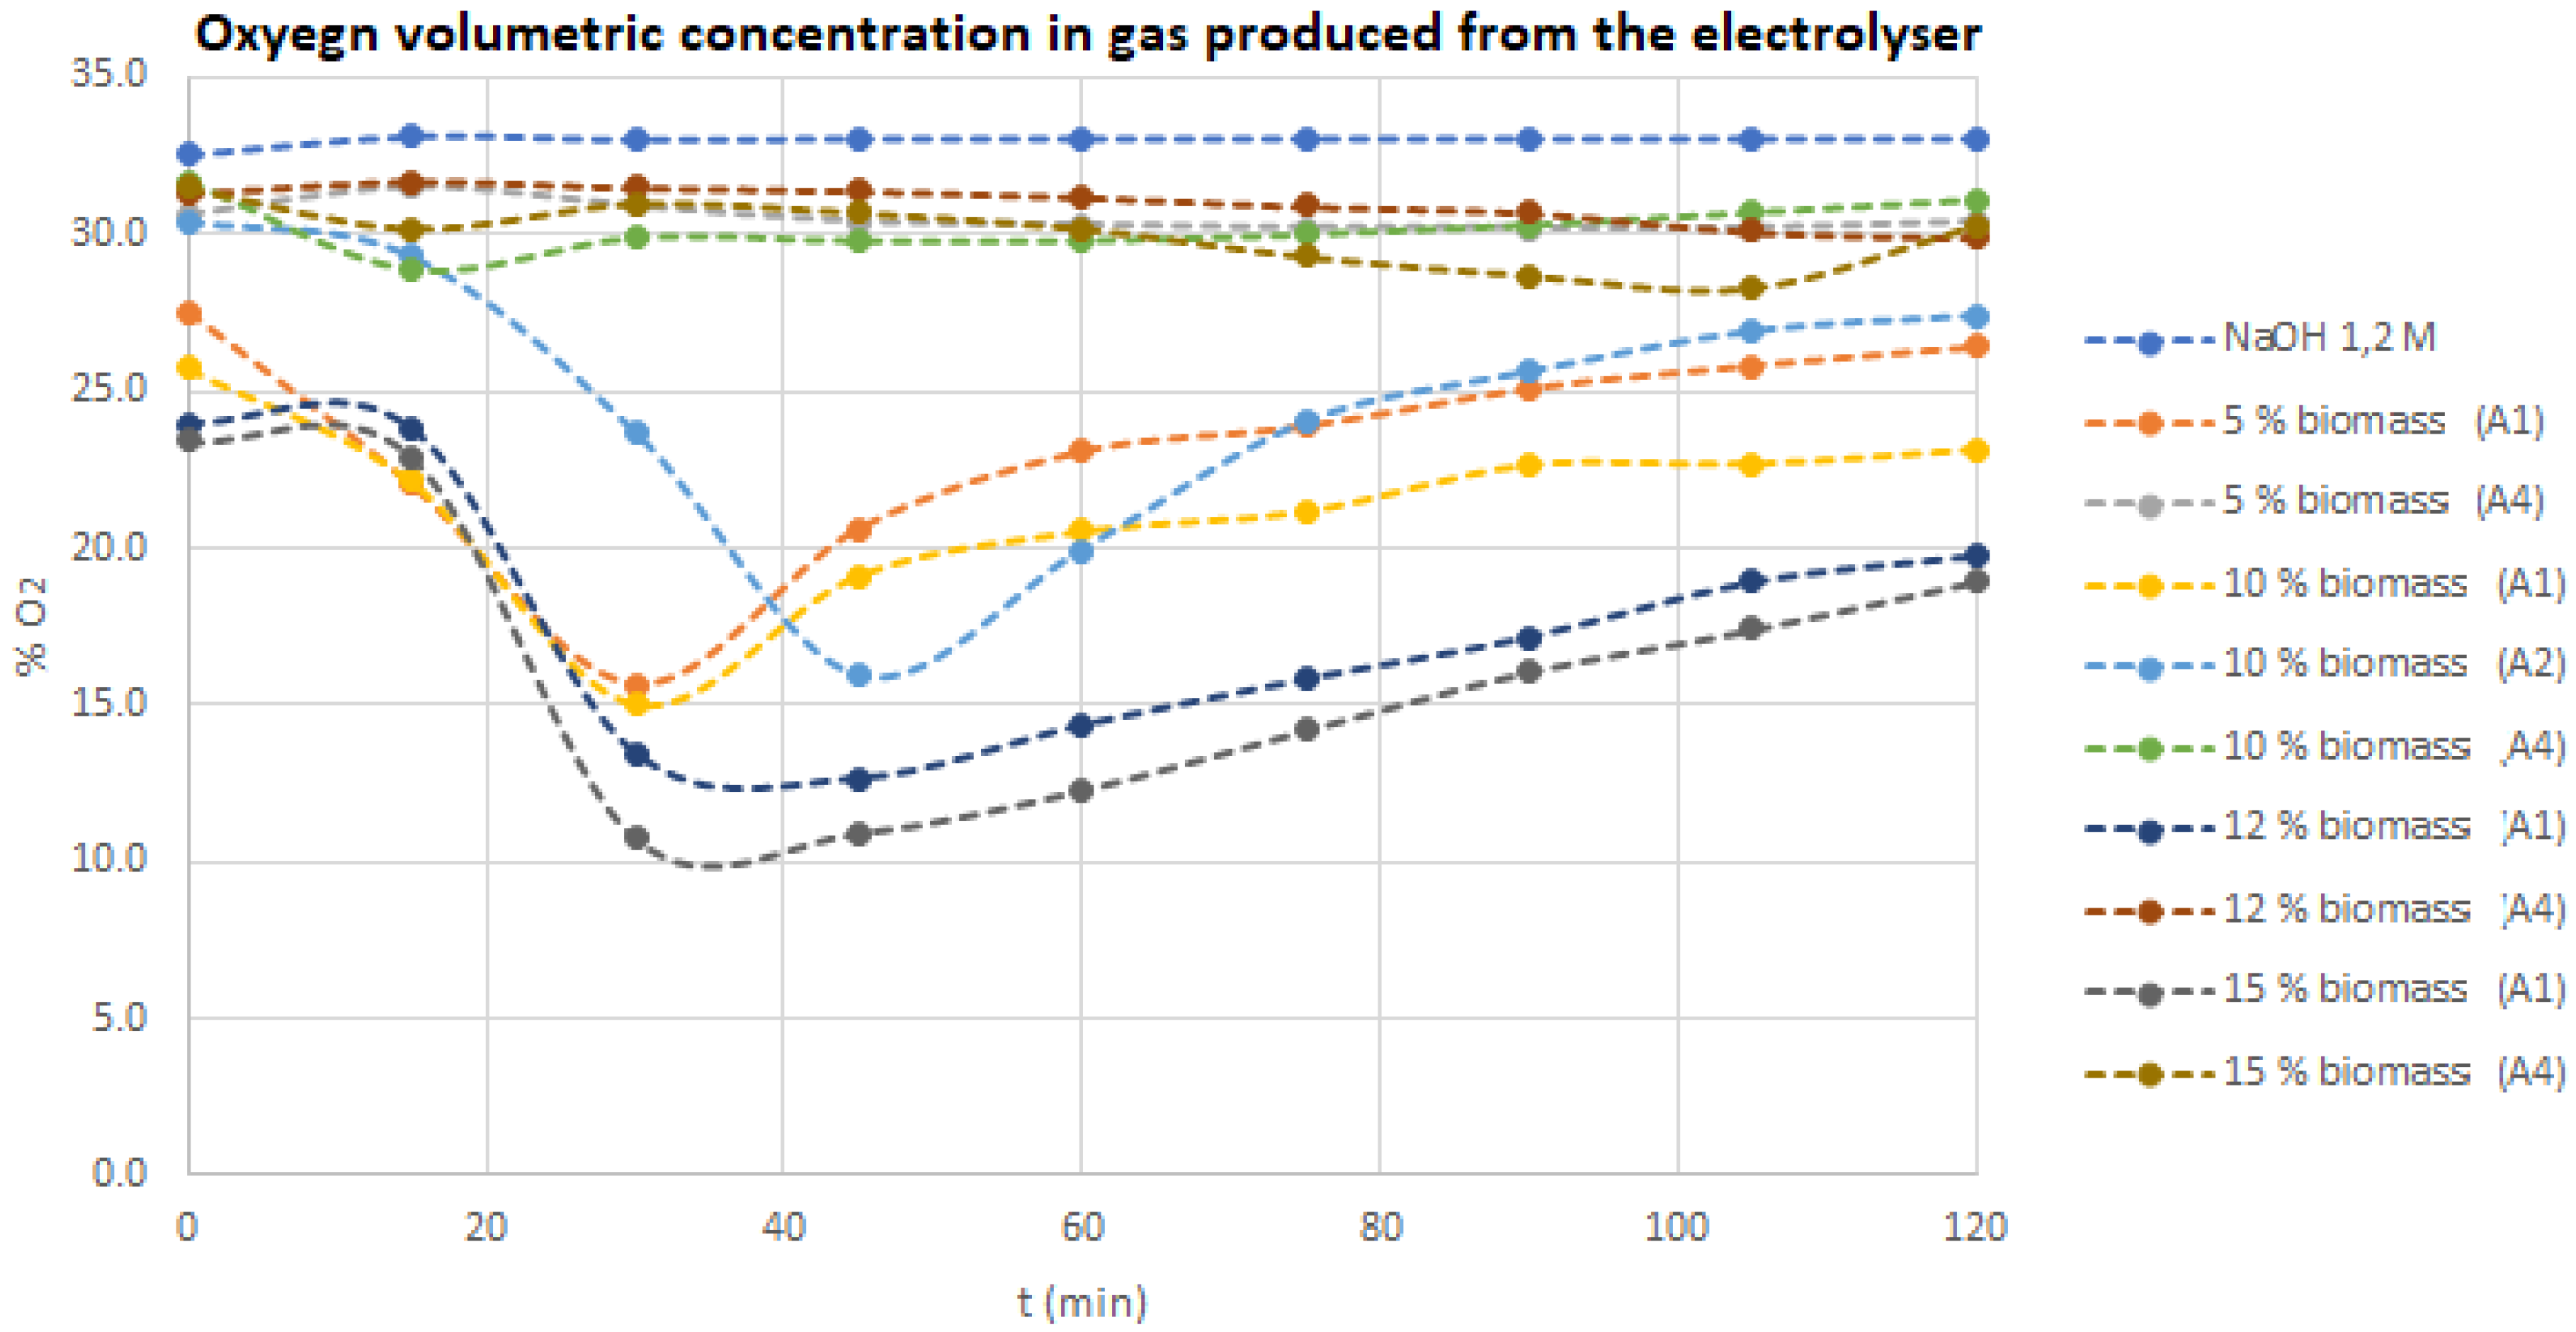
In order to understand the evolution of the oxygen concentration in the electrolyser, over time, for different tested electrolytes (with and without liquified biomass), Figure 4 shows those evolutions. It is possible to notice that, higher biomass content mixed with the 1.2 M NaOH electrolyte will increase the oxygen consumption, due to its reaction with the carbon from biomass, thus producing CO and CO2. It is the co-electrolysis processes, like reported elsewhere, by Guerra et al. [24,25]. It is, also, interesting to see that, A4 liquified biomass samples shows the same behavior as the 1.2 M NaOH aqueous electrolyte without any biomass content. This is due to the presence in this sample A4, of a large amount of solvent, mainly, water, ascribable to the high solubilization of the sugars compounds. On the contrary, the remaining biomass samples tested (A2) shows a strong oxygen conversion, because this sample only has a little portion of solvent, since it was previously removed in the liquefaction process.
For A2 experiments, it was also observed, a maximum oxygen conversion between 30 and 45 min, although the final oxygen content in the gas produced from the electrolyser, at 120 min, is higher, when compared with the observed at 30–45 min. This difference is due to the non-steady state process, which occurs until it finishes, 10–15 min after the 2 h of each experience performed.

3.3. Experiments in the Syngas/Methane Reactor

Regarding the production of syngas, Table 4 shows the results obtained with complementary experiences in the methane glass reactor, where this gaseous mixture is produced, with the methane generation, through the reaction between the electrolysis gas and, the liquified biomass. The results achieved and calculated were: the volumetric yields production of solid, liquid and gas phases, respectively, the remaining biomass collected in the reactor (Yield(liq.biom.)) after the time experience considered, at different temperatures, the condensate (Yield(cond.)) and, also, the gas mixture produced (Yield(gas)).
The apparent density of the liquid condensate (ρap. (cond.)) was also calculated. The apparent density of the liquified biomass sample (A2) was previously calculated, giving an average value of 1.14 g·cm−3. From these data, it is possible to conclude that, as expected, the increase of temperature will increase, at shorter times, the volume of produced condensate, thus decreasing the volumetric yield in the remaining liquified biomass. The calculated apparent density of the condensate is decreasing with the increase of the reactor temperature and, those values are similar with the water density, although, as explain more ahead, this condensate has, also, organic compounds, at minor concentrations.
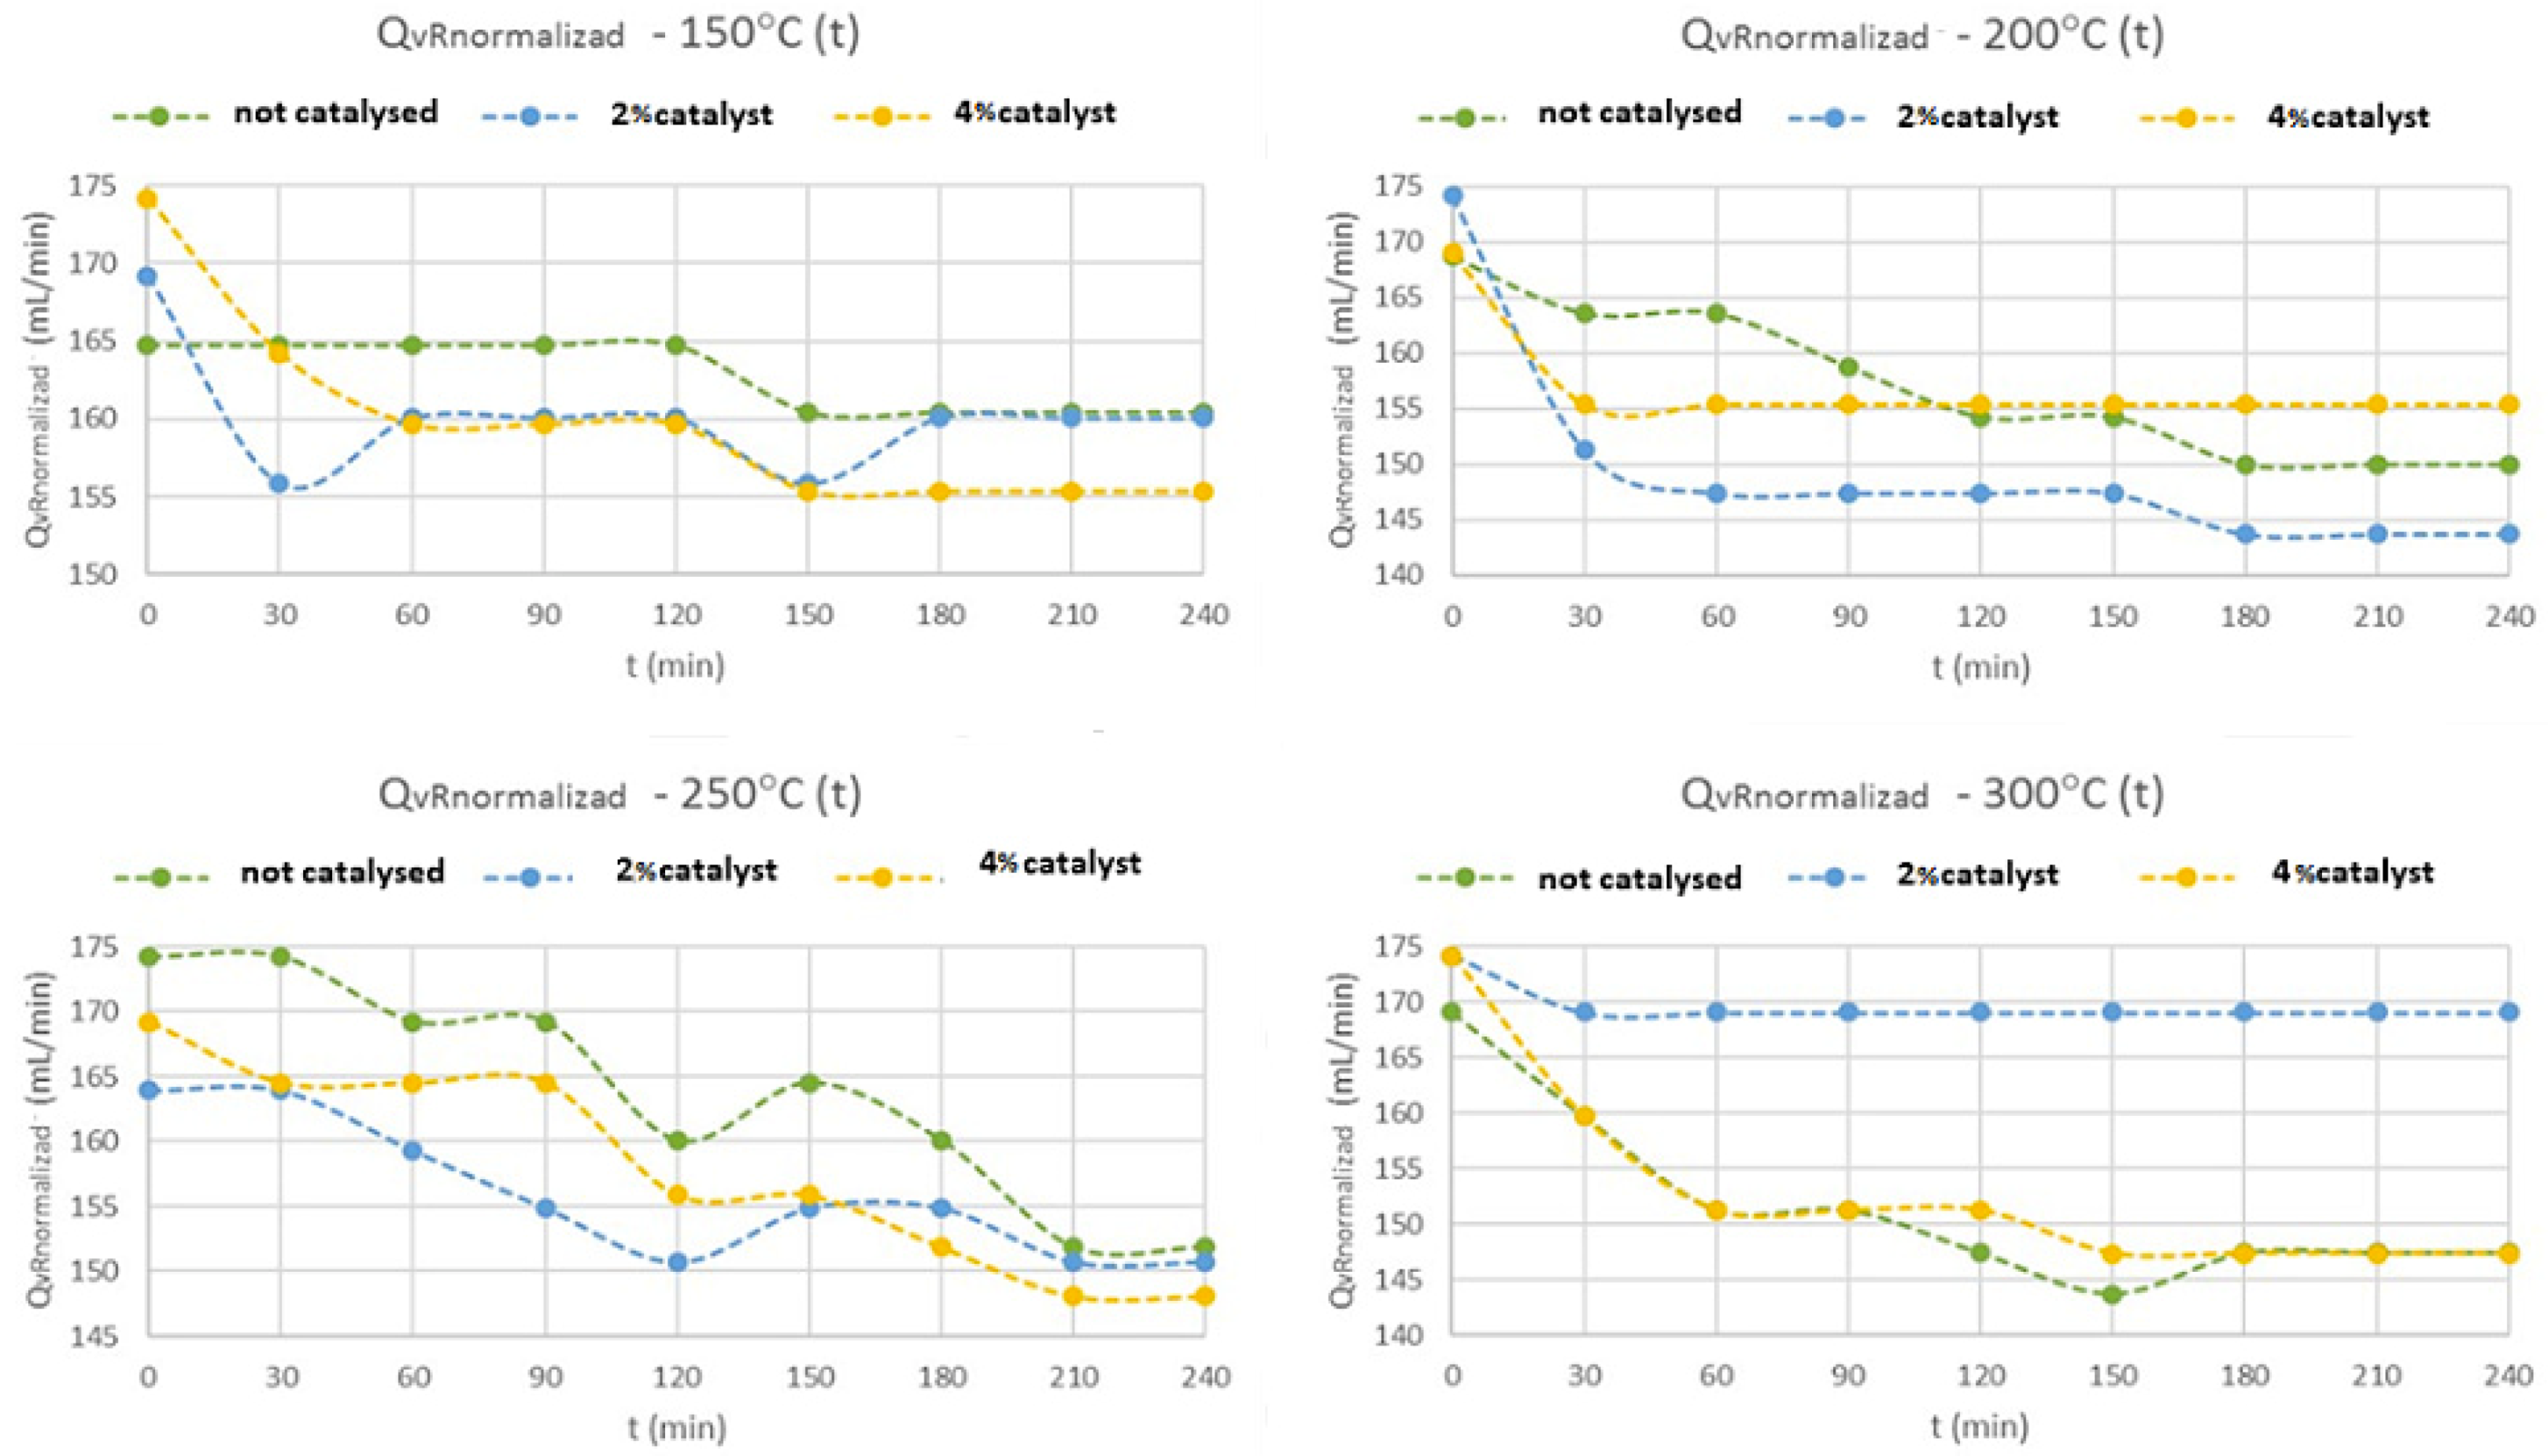
Different operational parameters were studied in the syngas/methane reactor, such as the volumetric flow rate of gas produced over time (QvRnormalized), the volumetric percentage of oxygen produced (%O2) and reacted over time (QvRO2consum) and, the volumetric percentage of methane produced (%CH4). These tests were carried out with different weight contents of zeolite HY catalyst and different temperatures, like described in Section 2.6. The obtained results are presented in Figure 5, Figure 6, Figure 7 and Figure 8. All these experimental rounds took place with the following fixed experimental conditions in the electrolyser: 22.4 V of applied voltage, 2.5 A of current intensity, 160 mL/min of electrolyser gas produced (H2 + O2), electrolyte of NaOH 0.4 M aqueous solution and, with 4 h in each experience. Table 5 shows, at the end of 4 hours experience, the correspondent final output values of the gas volumetric flow, as well, the oxygen and methane volumetric contents in the produced gas mixture, for different reaction temperatures and different weight content (z. HY catalyst). To compare with another Y zeolite already prepared, ultra-stabilized with nickel (z. USY), it were also performed, two more experiments with this catalyst, which was supplied from another Portuguese university. The results achieved with USY zeolite doesn’t show any significant improvement, mainly in the %CH4 content, when compared with the acidified HY zeolite catalyst.

3.3.1. Flow of Produced Gases

Analyzing Figure 5, the observed flows exhibit the same general behavior. An exception is the flow rate for the test with 2% of HY catalyst at 300 °C, which was constant, due to a leak in the system. This leak did not affect the test at all, but only the flow measurement.
Nevertheless, the final gas flow measurements are basically constant, in all experiments, after 120–150 min of reaction time, when it was reached the steady state, with little differences (<10 mL·min−1) between them, when it was reached the 4 hours of reaction time.

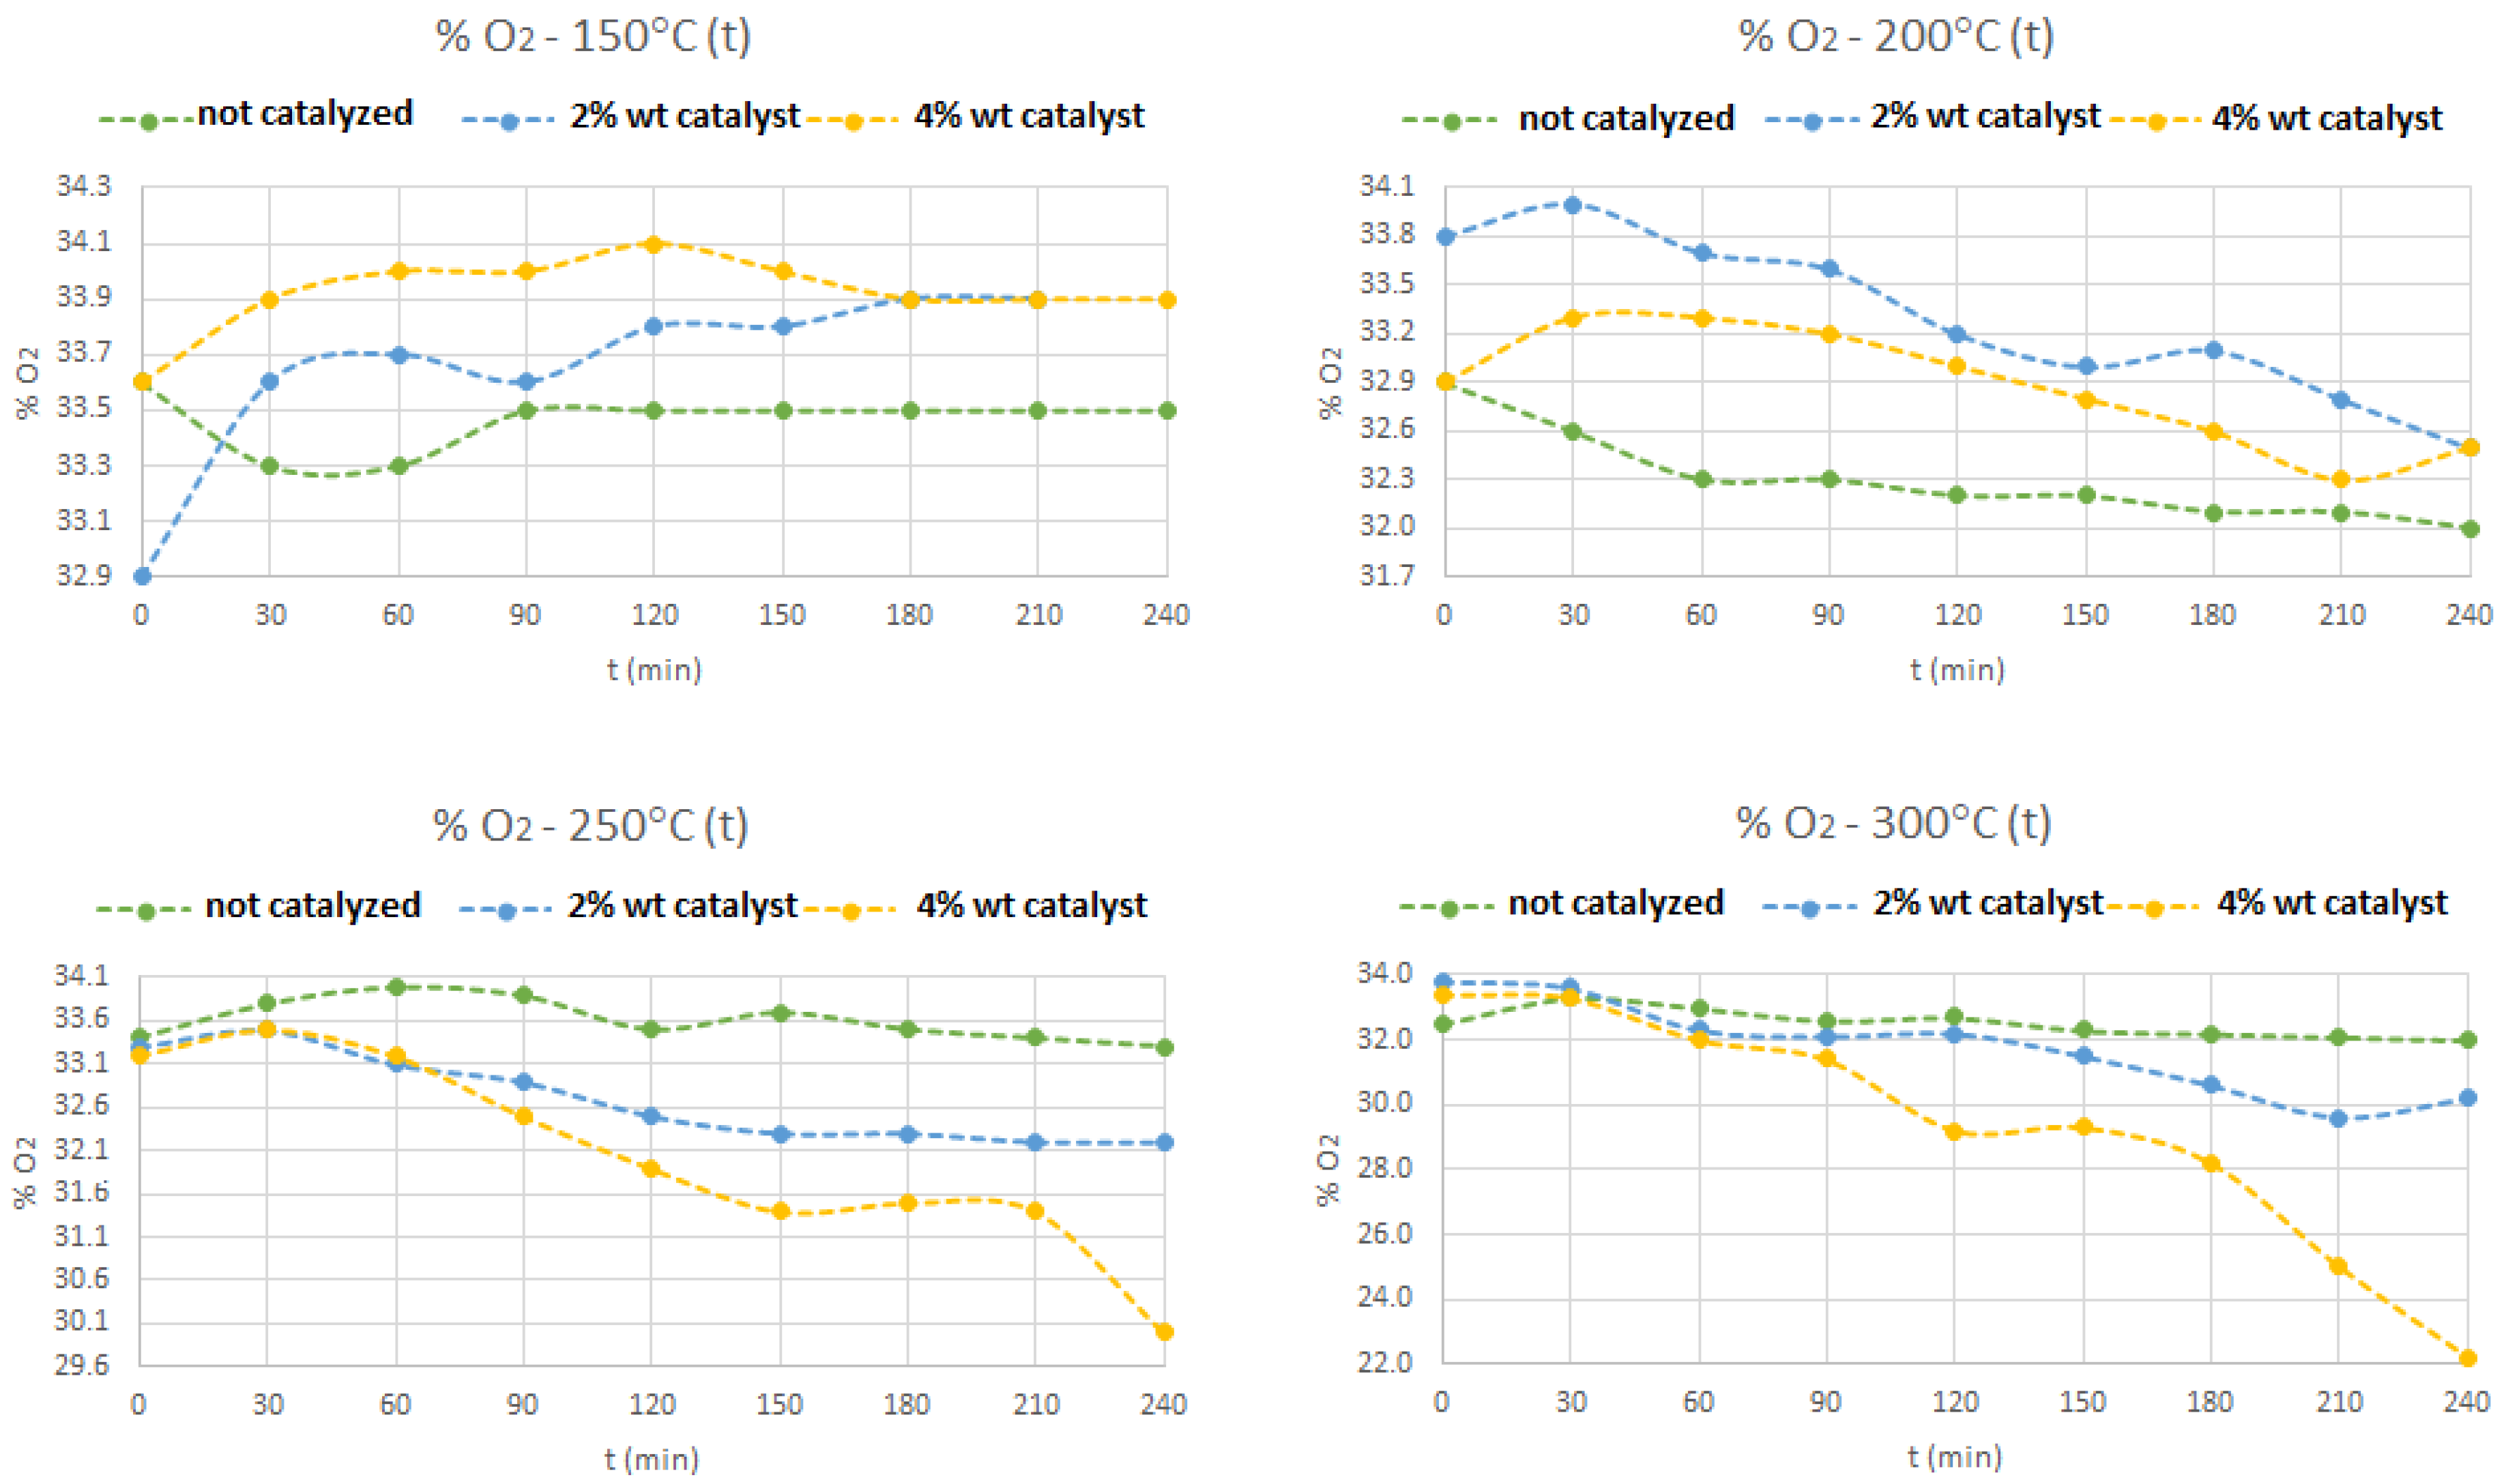
3.3.2. Oxygen Concentration in the Outlet Gas Mixture

In Figure 6, it can be seen that, the increase in temperature and the increase in the catalyst weight content affect the percentage of oxygen, i.e., for the temperatures of 250 and 300 °C and with 4% (Wcatalyst/Wliq.biom.) of catalyst, it is possible to notice an appreciable decreasing on the oxygen concentration, in the syngas mixture, is more noticeable, after 210 min of reaction time.
At lower temperatures of 150 and 200 °C, the oxygen content only shows slight variations between 32.5 and 33.8% (v/v). It seems that, for temperatures above 250 °C and, with 4% of zeolite HY heterogeneous catalyst, the production of methane gas is enhanced, in the syngas mixture, because the activation energy boundary is being decreased. In all these experiments, slightly concentrations of CO and CO2 were detected, which means that, the gas compound with more and significant concentration is the hydrogen.

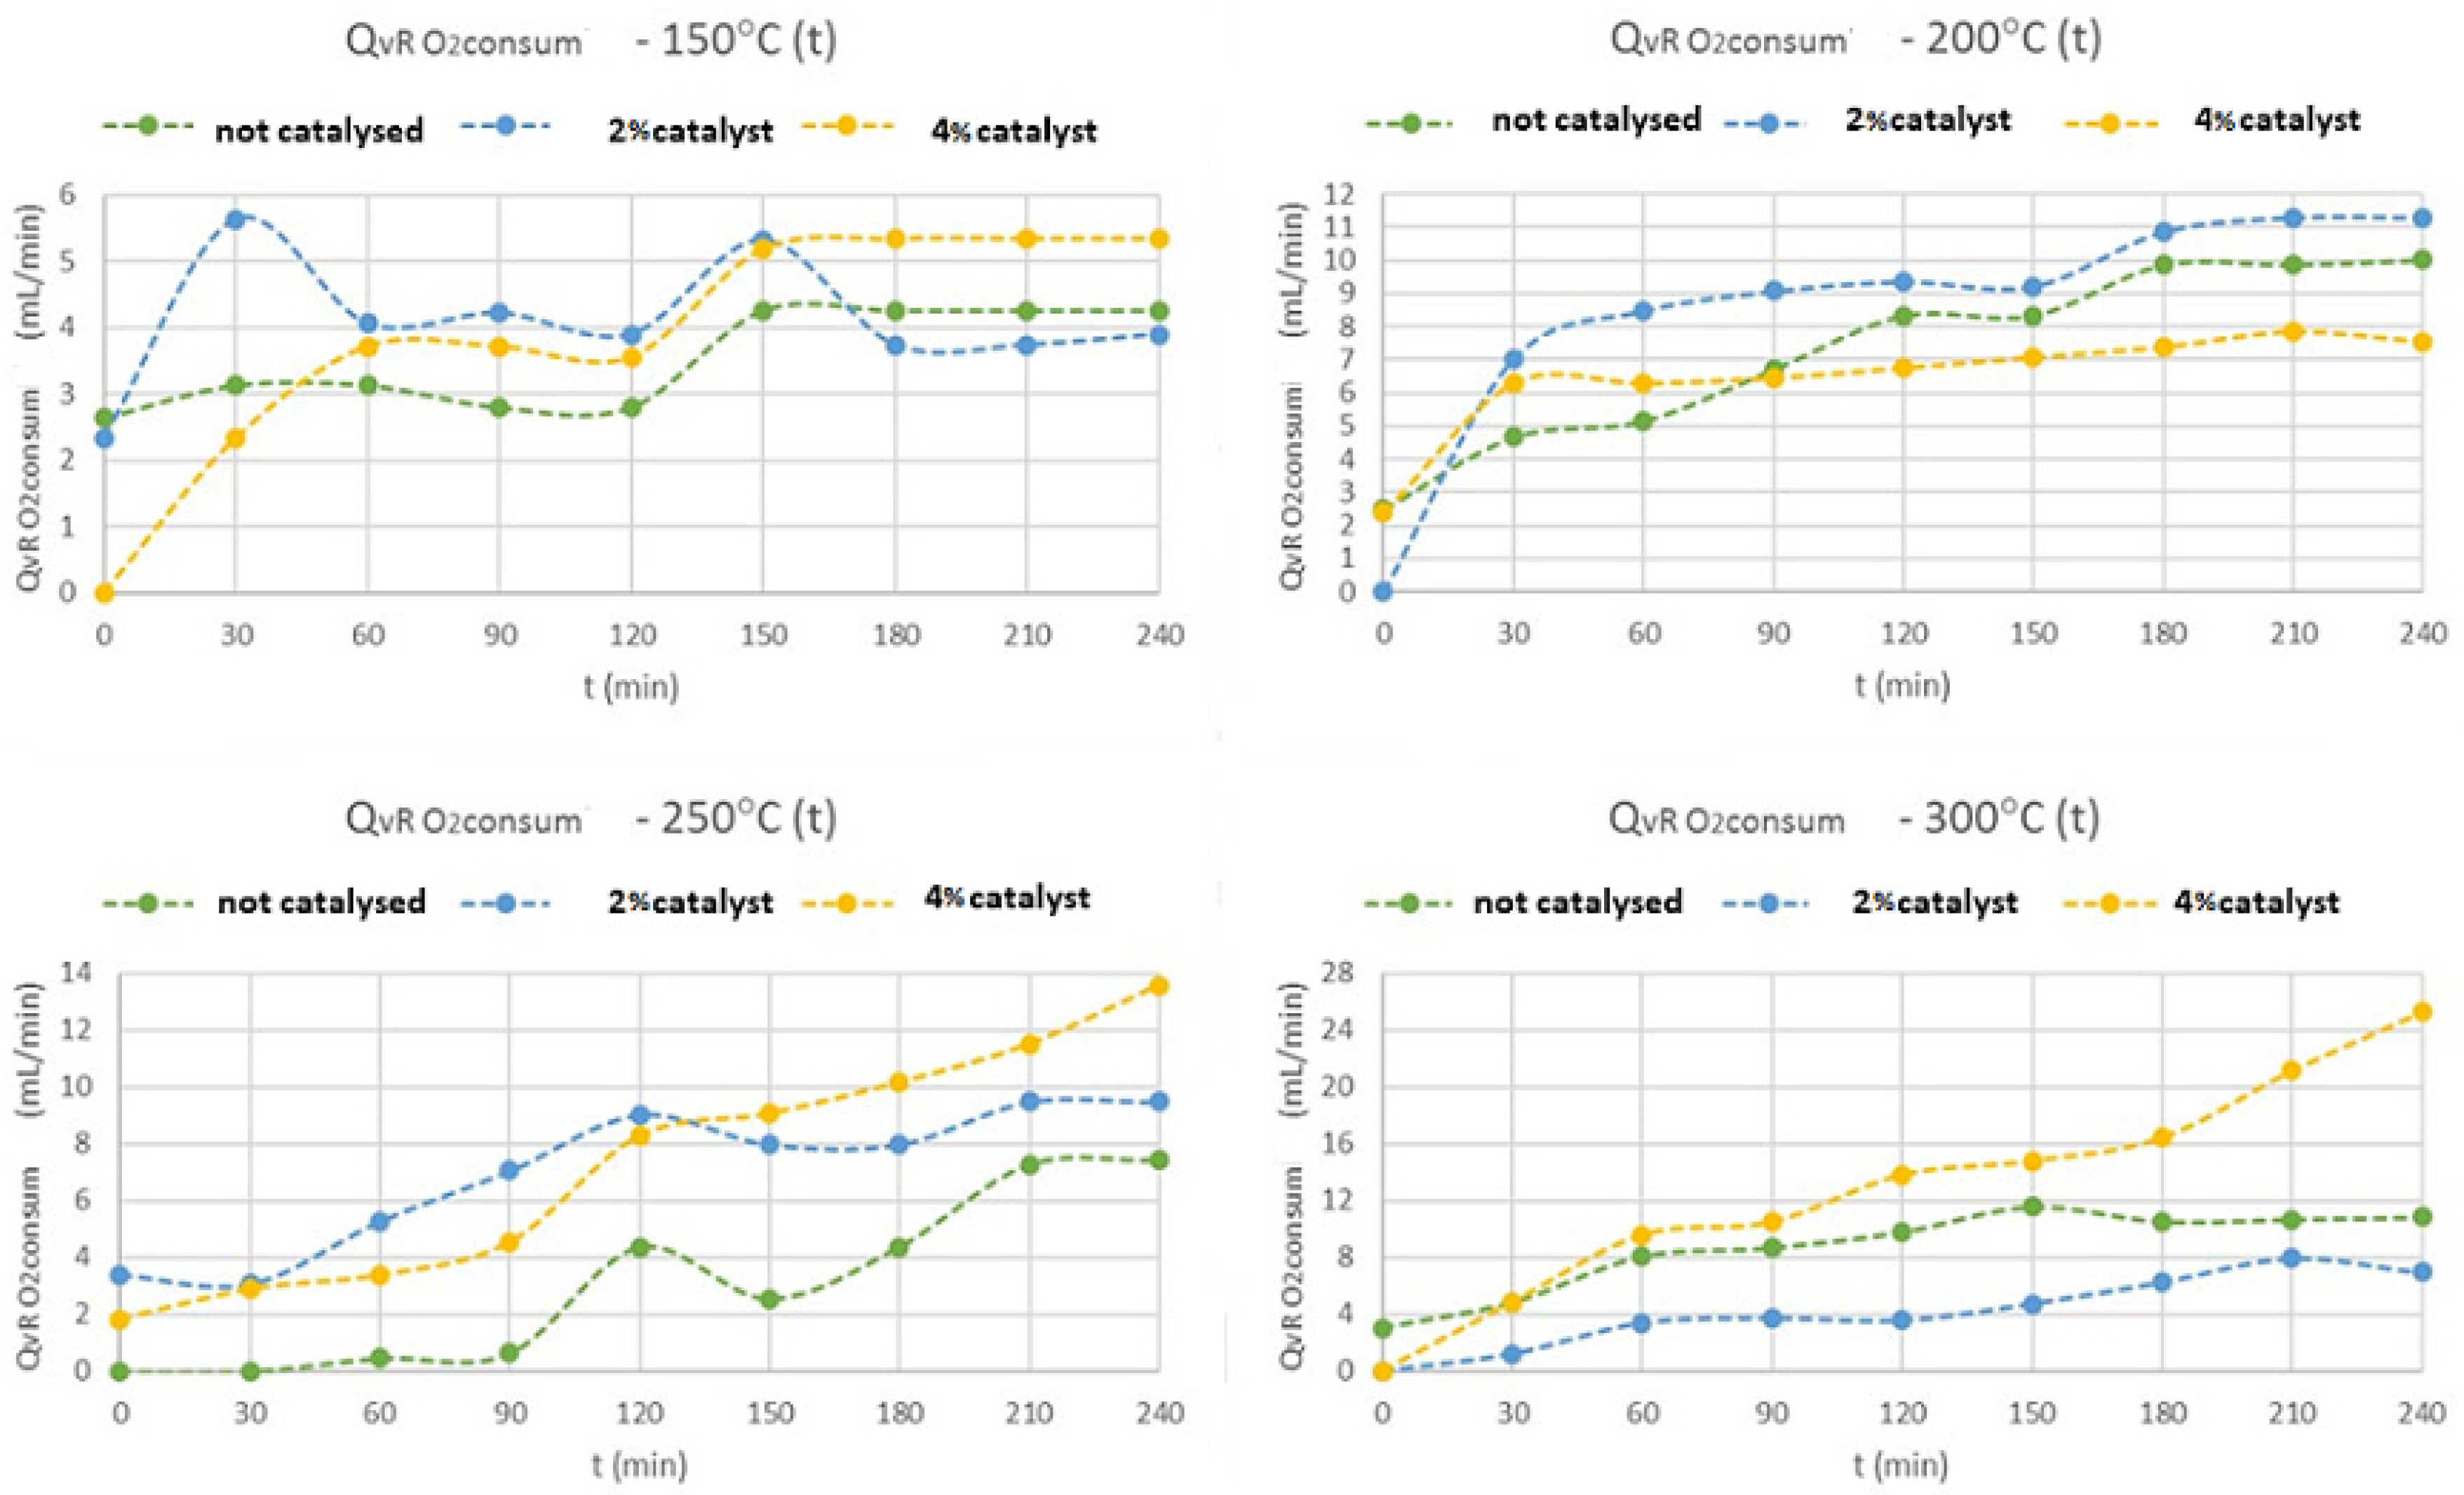
3.3.3. Oxygen Flow Rate Consumed

The oxygen consumption evolution is shown in Figure 7, where it is possible to observe the increase in the reacted oxygen volumetric flow with the increase of temperature, mainly at 250 and 300 °C and, with 4% of z. HY catalyst. At 150 °C, this consumption does not exceed 6 mL·min−1, and, at 200 °C, this consumption has already reached 12 mL·min−1. At 250 °C, this consumption increased to 14 mL·min−1, and, at 300 °C, this consumption is even higher, reaching 28 mL·min−1, for the test with 4% of z. HY catalyst. The decreasing on the oxygen content in the syngas mixture, will increase the reacted oxygen to produce, mainly, methane gas. These conditions are enhanced with the increase of reaction temperature above 250 °C and, also, with 4% of weighted z. HY catalyst, for the same reasons pointed out above.

3.3.4. Methane Concentration

Figure 8 shows the production of methane through time, for different temperatures and different contents of zeolite HY catalyst, in the syngas/methanation reactor. At 150 °C, the methane concentration is very low, even with the use of the solid catalyst. Increasing the temperature and the amount of catalyst shows that, the methane production increases, with a maximum of 35%, obtained in the 300 °C test with 4% (w/w) of that catalyst. The reasons to explain this behavior of the methane production were explained above in this article, since the production of this fuel gas is directly related with the consumption of oxygen in this reactor, enhanced by the increase of temperature and, with, at least, 4% (w/w) of catalyst.
Best conditions which maximized methane concentration (300 °C, 4% (w/w)) were replicated three times and, the same behavior were observed, since, at the end of the 4 hour reaction time, final methane concentration achieved (yield) was 33% and 34% (twice), which gives an overage value of 34%, although, it was achieved also, a maximum concentration of 35% in all replicate experiments. The remaining gas compositions measured were basically the same. After these three replications, z. HY catalyst was calcinated again, to eliminate coal deposition in surface catalyst, to reactivate it, because coal deposition covered the catalyst active sites.
Another experiment with the same best operating conditions was performed, after catalyst recalcination in the same operating conditions and, the achieved results were the same of the previous ones, again with 34% of methane final concentration, at the end of 4 h of reaction time. After recalcination, catalyst acquire the same aspect as used in the first experiments.
In comparison with other similar studies, for instance, with Guerra et al. [24], it was reached a methane volumetric content of 25.7% of the syngas mixture produced in the 1 kW SYM electrochemical reactor, combined with a follow fixed bed catalytic reactor, under atmospheric pressure and, at 125 °C, using graphite electrodes in the electrolyser and, a Ni/(CaO-Al2O3) heterogeneous catalyst. These conditions give a methane gas selectivity of 96.5%, a CO2 conversion of 44.2% and, residual concentrations of CO. In another study performed also, by the same authors, Guerra et al. [25] they achieved volumetric CO2 concentration values of between 2.00–2.50% at 2 bar and 70 °C, but with residual values of methane gas and, with 25% of CO. In this last case, it isn’t occurred any significant production of methane gas, which means, it doesn’t show any relevant processual advantages when compared with the current study. No more similar studies were found in the literature, regarding the electrolytical production of syngas. Besides these two references, only pyrolysis/gasification process shows significant volumetric syngas and methane gas concentrations but, achieved with significant higher temperatures, higher than 400 °C and, in the case of pure syngas, only higher than 700 °C, in gasification process. These higher temperatures will need higher energy inputs for the syngas production, when compared with the electrochemical processes.

3.4. Stoichiometric Analysis

Due to the existence of methane in the final gas produced, it is apparent that the following main reactions occur [24,25], between carbon from biomass and the oxygen and hydrogen produced in the alkaline electrolyser. In the electrolyser itself, it occurs, both at the same time, the following reactions:
Anode:
Water alkaline oxidation:
4 OH   ( 45 55 )   ° C 2 H 2 O + 4 e   +   O 2
Cathode:
Water alkaline reduction:
4 H 2 O + 4 e   ( 45 55 )   ° C 4 OH + 2 H 2
In the syngas/methane glass reactor, with the presence of the liquified biomass, attending the production of methane gas, the follow reactions seems to take place, according with [19,24,25]:
Partial carbon oxidation:
C + 1 2 O 2   ( 100 300 )   ° C CO Δ Hr   =   222   kJ · mol 1
Total carbon oxidation:
C + O 2   ( 100 300 )   ° C CO 2 Δ Hr   =   394   kJ · mol 1
After the production of CO and CO2 gases, in the same methanation reactor, it will be produced methane gas, according with the following reactions, described elsewhere [19], which is enhanced by temperature and catalyst increases:
Sabatier reaction:
CO + 3 H 2 c a t . , ( 200 300 )   ° C CH 4 + H 2 O Δ Hr   =   206   kJ · mol 1
Water-gas shift reaction:
CO 2 + H 2 c a t . ,   ( 200 300 )   ° C CO + H 2 O Δ Hr   =   + 41   kJ · mol 1
The overall reaction from these two (reactions (5) and (6)) leads to the following one:
CO 2 + 4 H 2 c a t . ,   ( 200 300 )   ° C CH 4 + 2 H 2 O Δ Hr   =   165   kJ · mol 1
This means that, in the methanation reactor, the above reactions took placed in the follow order: first, the reactions (3) and (4), simultaneously, then the reactions (5) and (6), which, together, leads to the reaction (7), where, the standard specific enthalpy reaction is equal to − 206 + 41 = −165 kJ.mol−1.
According to the stoichiometry of these reactions, it is possible to obtain some outputs such as: molar flow at the outlet of the electrolyser, molar flow of oxygen and hydrogen at the outlet of the electrolyser, molar flow at the exit of the syngas reactor, molar flow of oxygen, methane, hydrogen, carbon dioxide and carbon monoxide at the exit of these reactor, as well, the molar flow rate of oxygen, methane and hydrogen consumed. From these outputs, in the 300 °C test with 4% of z. HY catalyst, where there is a higher percentage of methane produced, and, since there is a portion of the flow produced that is not justified by the stoichiometry of these reactions, it means that, there are compounds formed in addition to those mentioned before, at the same time, in the reactor. These compounds may be hydrocarbons resulting from cracking processes of biomass itself, enhancing the methane production [29]. As reported in the literature, the propagation step mechanism of cracking paraffins leads, inevitably, to the co-production of methane gas [29].
On the other hand, the very low contents of CO and CO2 observed, suggests that, through the temperature reaction and heterogeneous catalyst used conditions, these gases were basically consumed to produce methane, through the Sabatier process. Besides that, the most part of the liquified biomass in the reactor, was converted to liquid condensate.
In the same test with 300 °C and 4% (w/w) of z. HY catalyst, it was also observed, after the 240 min of reaction time, the deposition of small black particles, thus covering the catalyst surface, which could be ascribable to the deposition of coke particles, resulting most probably from the follow reaction (Equation (8)), which typically occurs on the methane conversion processes in the presence of steam water and/or oxygen, as well, in the gasification of coal and biomass [15]:
2 CO c a t . ,   ( 200 300 )   ° C C + CO 2 Hr   =   173   kJ · mol 1
Although the global process is exothermic, due to the negative values of reaction enthalpies, it’s necessary supply heat in order to achieve the desired temperature. The same procedure occurs in the thermochemical processes of syngas/methane production, like pyrolysis and gasification. Pyrolysis process starts at 400 °C and, syngas production in the gasification process normally occurs from temperatures higher than 700 °C. In order to calculate the theoretical supply heat to the correspondent process ( H ¯ T ), it’s necessary to calculate the calorific values of syngas and methane produced in both cases (electrochemical/Sabatier combined process and, both thermochemical processes mentioned above), for the 300 °C achieved in this study and, for 400 °C and 700 °C, which normally occurs in the pyrolysis and in the gasification processes, respectively. To perform this task, it’s necessary to apply the following expression (Equation (9)):
H ¯ T =   C p ¯ · T
where C p ¯ is the mean specific calorific capacity between 25 °C and the temperature (T) used, T is the difference of temperature between 25 °C (room temperature) and the operating one (T). The product C p ¯ · T corresponds to the specific calorific heat which is needed to supply for the process.
To calculate C p ¯ values, is need, in first place, calculate each Cp for the correspondent component, between 25 °C and the operating temperature. With Equation (10), it’s possible to calculate each (Cpi) value, through the thermodynamic values of (a), (b), (c) and (d), which were collected in this study, from the literature (Himmelblau, [30]). These values are showed in Table 6. Equation (11) calculate the overall specific calorific capacity ( C p ¯ ) for the syngas/methane mixture at the reactor outlet, where (xi) represents the correspondent volumetric composition of each gas component:
C p i   =   25   ° C T ( a + b · T + c · T 2 + d · T 3 ) d T ( T 25 )
C p ¯   =   i = 1 n x i · C p i
The values of ( C p ¯ ) for each case, depending of the operating temperature (T), applied in Equation (9), gives the values of specific heats. Table 7 shows those values for the analyzed processes. N2 was only applied for outlet gases in pyrolysis and gasification processes, while O2 only in the electrolytic process.
It’s possible to conclude, according with H ¯ T values that, higher temperature process means a significant increase in the input energy and, as consequence, a significant increase with the energetic (operating) costs. Comparing the pyrolysis process (14.15 kJ·mol−1) with the combined electrochemical/Sabatier one (10.38 kJ·mol−1) and considering the same syngas/methane flow and the same gas composition, an decrease of 36% in the input energy was observed. By another hand, the comparison between the same combined process (10.38 kJ·mol−1) with the gasification one (26.92 kJ·mol−1), an decrease of 159% in the input energy was observed, both values applied for each mole of syngas/methane mixture.
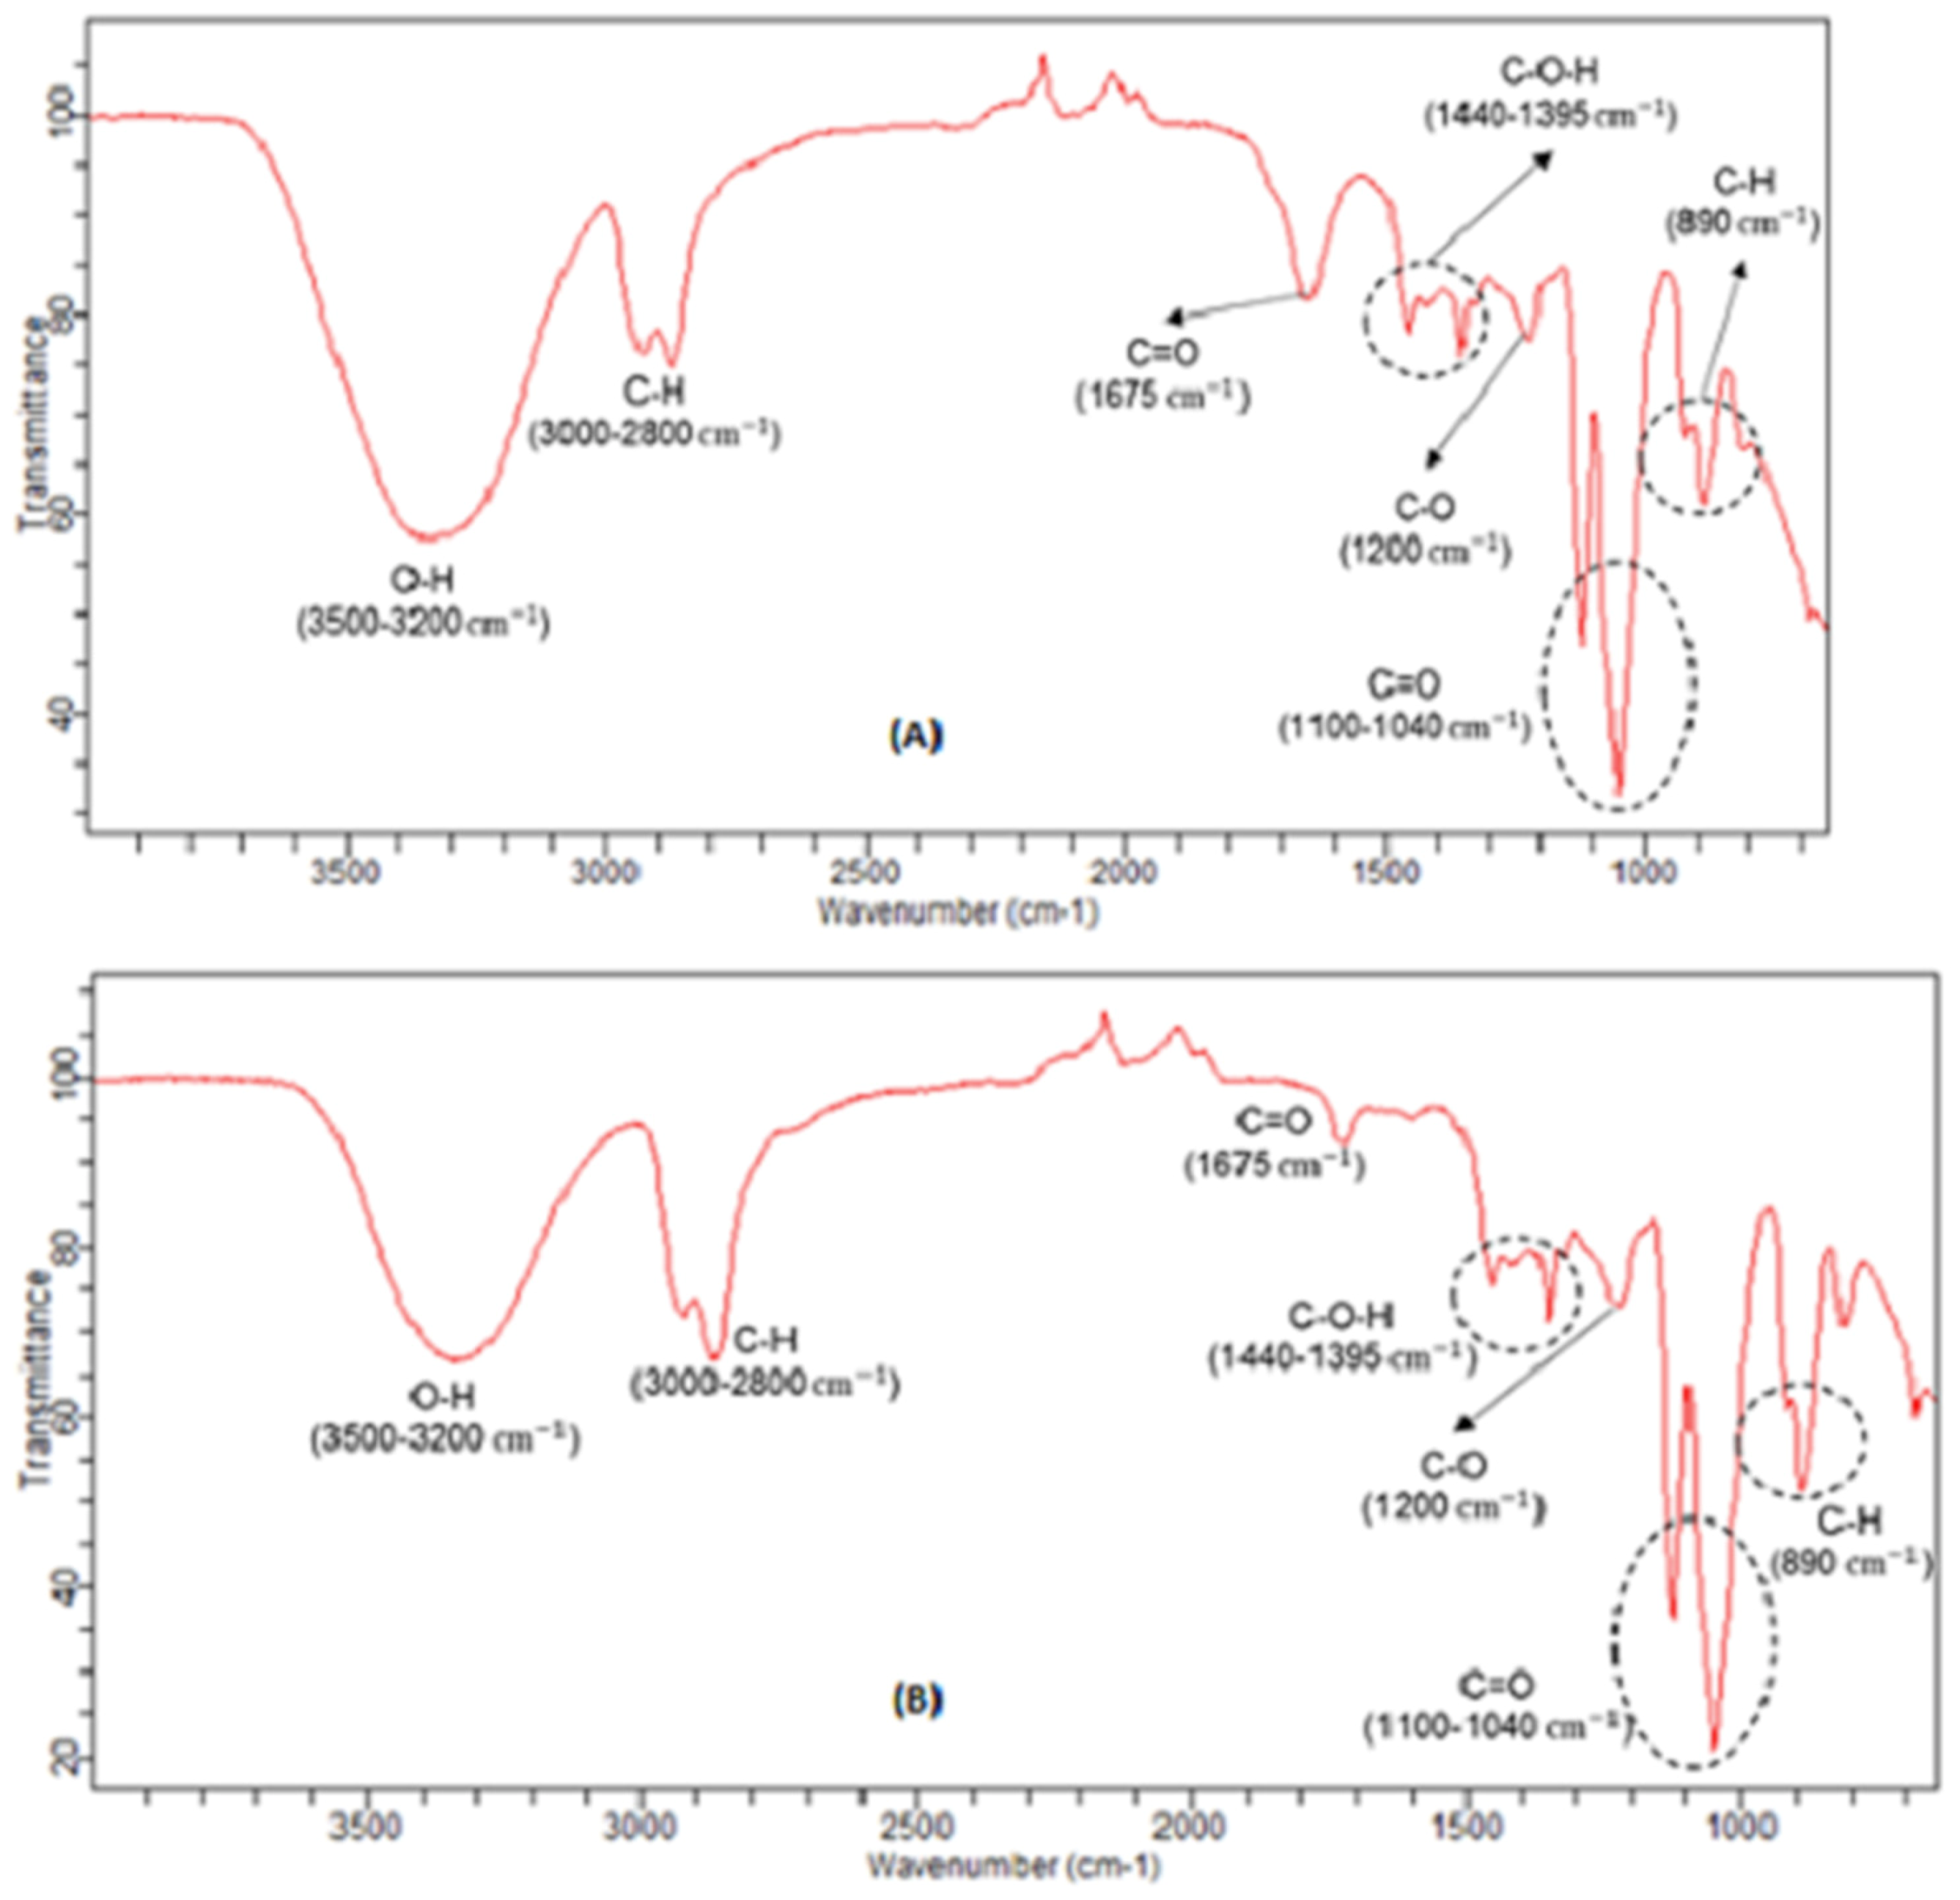
3.5. FTIR Analysis

Infrared spectroscopy analyzes were performed on some liquid samples obtained in the previous experiments. These liquid samples refer to the biomass used in the tests, before and after those tests, as well, in the condensate obtained. Analyzing Figure 9A,B, it can be seen that, the liquified biomass spectra are identical, before and after the trials, respectively, since the absorption peaks detected were almost the same, varying only their intensity.
It can be seen that, the most intensity peak is related with the O-H absorption peaks between 3200 and 3500 cm−1, mainly ascribable with alcohols, water and, for the case of biomass samples, are related also with O-H bonds of the hydroxyl groups present in the several monomers of the cellulose and hemicellulose structures [31]. Nevertheless, it’s possible to see a little decreasing in intensity of these absorption peaks of O-H (3200–3500 cm−1), and also, at 1675 cm−1 related with C=O bonds (stretching vibrations) of aldehydes and ketones, after the correspondent experiment, due to the evaporation of some of these compounds to the condensate.
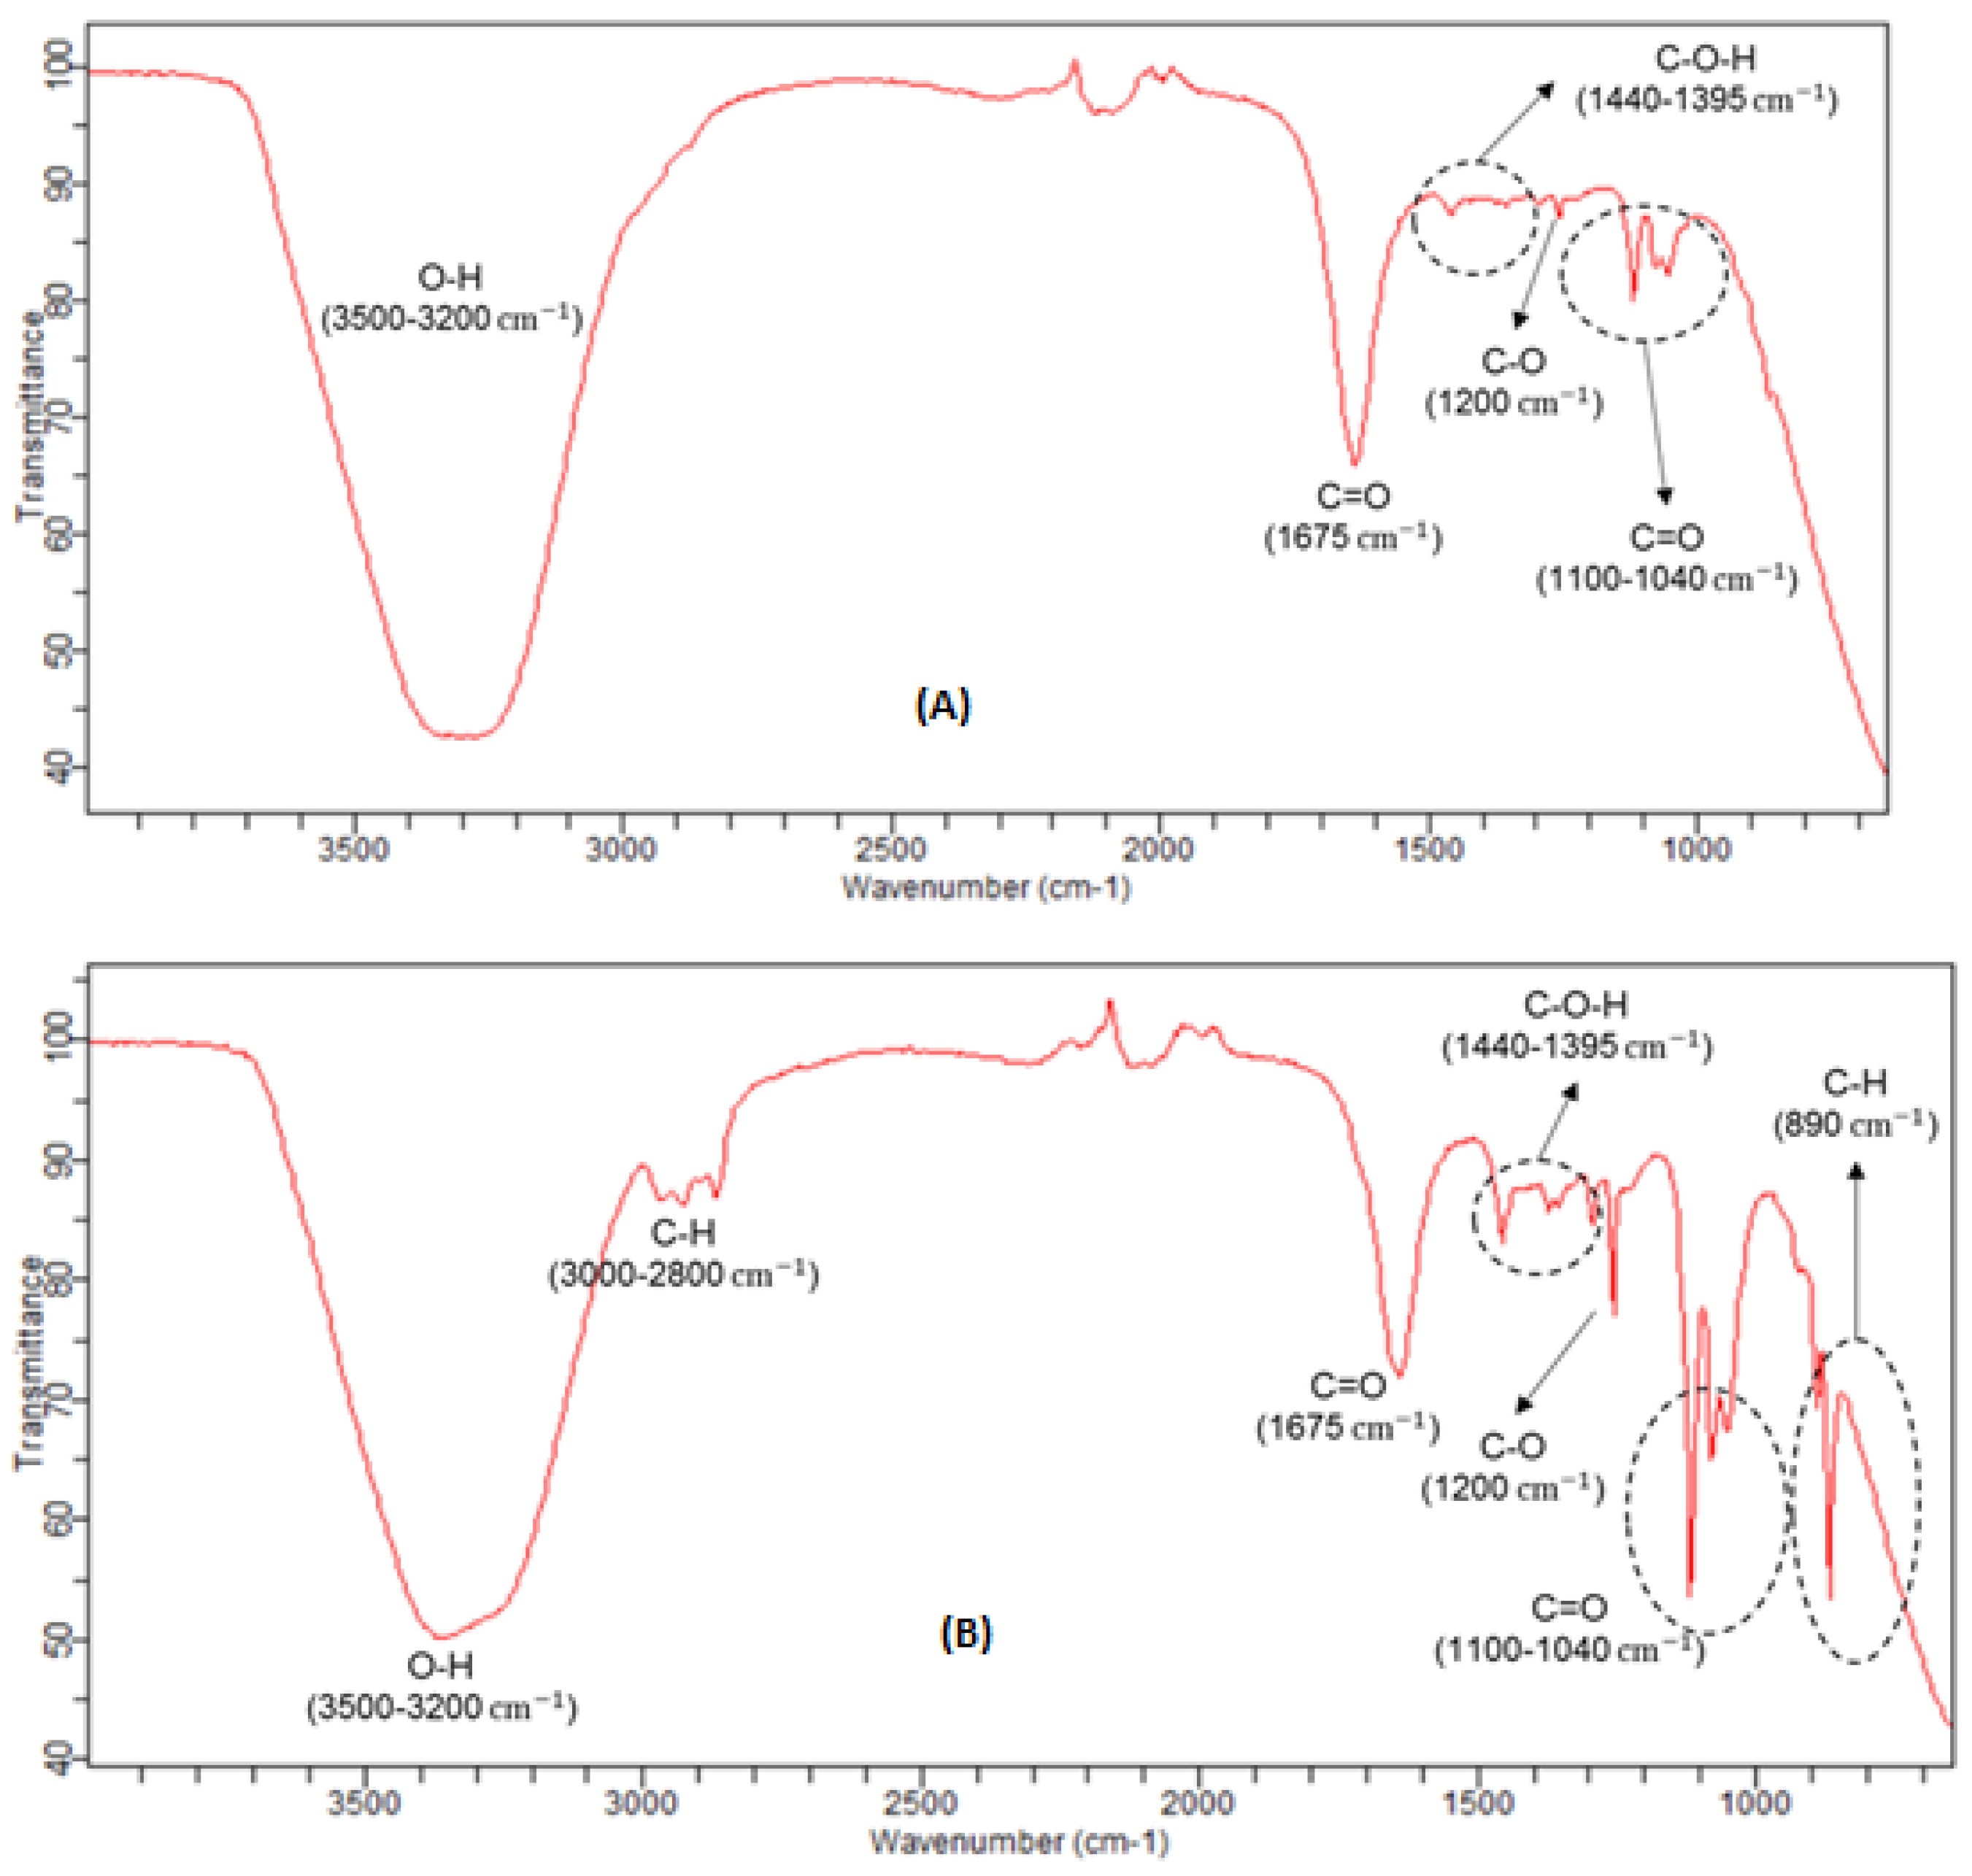
The spectra presented in Figure 10A,B are related with the liquid condensate samples obtained, respectively, for the trials of 150 °C with 4% of catalyst and, at 300 °C with 2% of catalyst. The remaining trials performed give similar condensate FTIR spectra to these two cases. For low reaction temperatures, it’s possible to detect the O-H stretching vibrations bonds, typical in water, alcohols and similar compounds, but also, the C=O absorption peaks, at 1675 cm−1, typical of aldehydes and ketones. For higher temperatures (250 and 300 °C), it is also possible to detect, besides these absorption peaks mentioned before, other ones, mainly at, 2800–3000 cm−1 and at 890 cm−1, which correspond to the stretching and bending vibrations of the C-H bonds of the aldehydes, as well, at 1040–1100 cm−1, for stretching vibrations of the C=O bonds of the carboxylic acids, 1200 cm−1, addressed to stretching vibrations of the C-O bonds of the alcohols and, finally, at 1395–1440 cm−1, ascribable to stretching vibrations of the C-O-H bonds of the carboxylic acids, also.
When comparing the FTIR spectra of liquified biomass and condensate liquid samples, it’s possible to verify that, the functional groups which are decreasing its intensity in the biomass samples, increase in the condensate samples.
This fact was to be expected, since the most volatile constituents with O-H, C-O and C=O bounds evaporate during the reaction and, therefore, are collected in condensate tank. Since the evaporation of the condensate previous collected was almost complete at 100 °C, suggests that the major quantity of those alcohols, aldehydes and carboxylic acids have boiling temperatures below 100 °C, which could be ascribable to formaldehyde, methanol, ethanol and, formic acid, since these compounds have, all, normal boiling temperatures below than 100 °C.

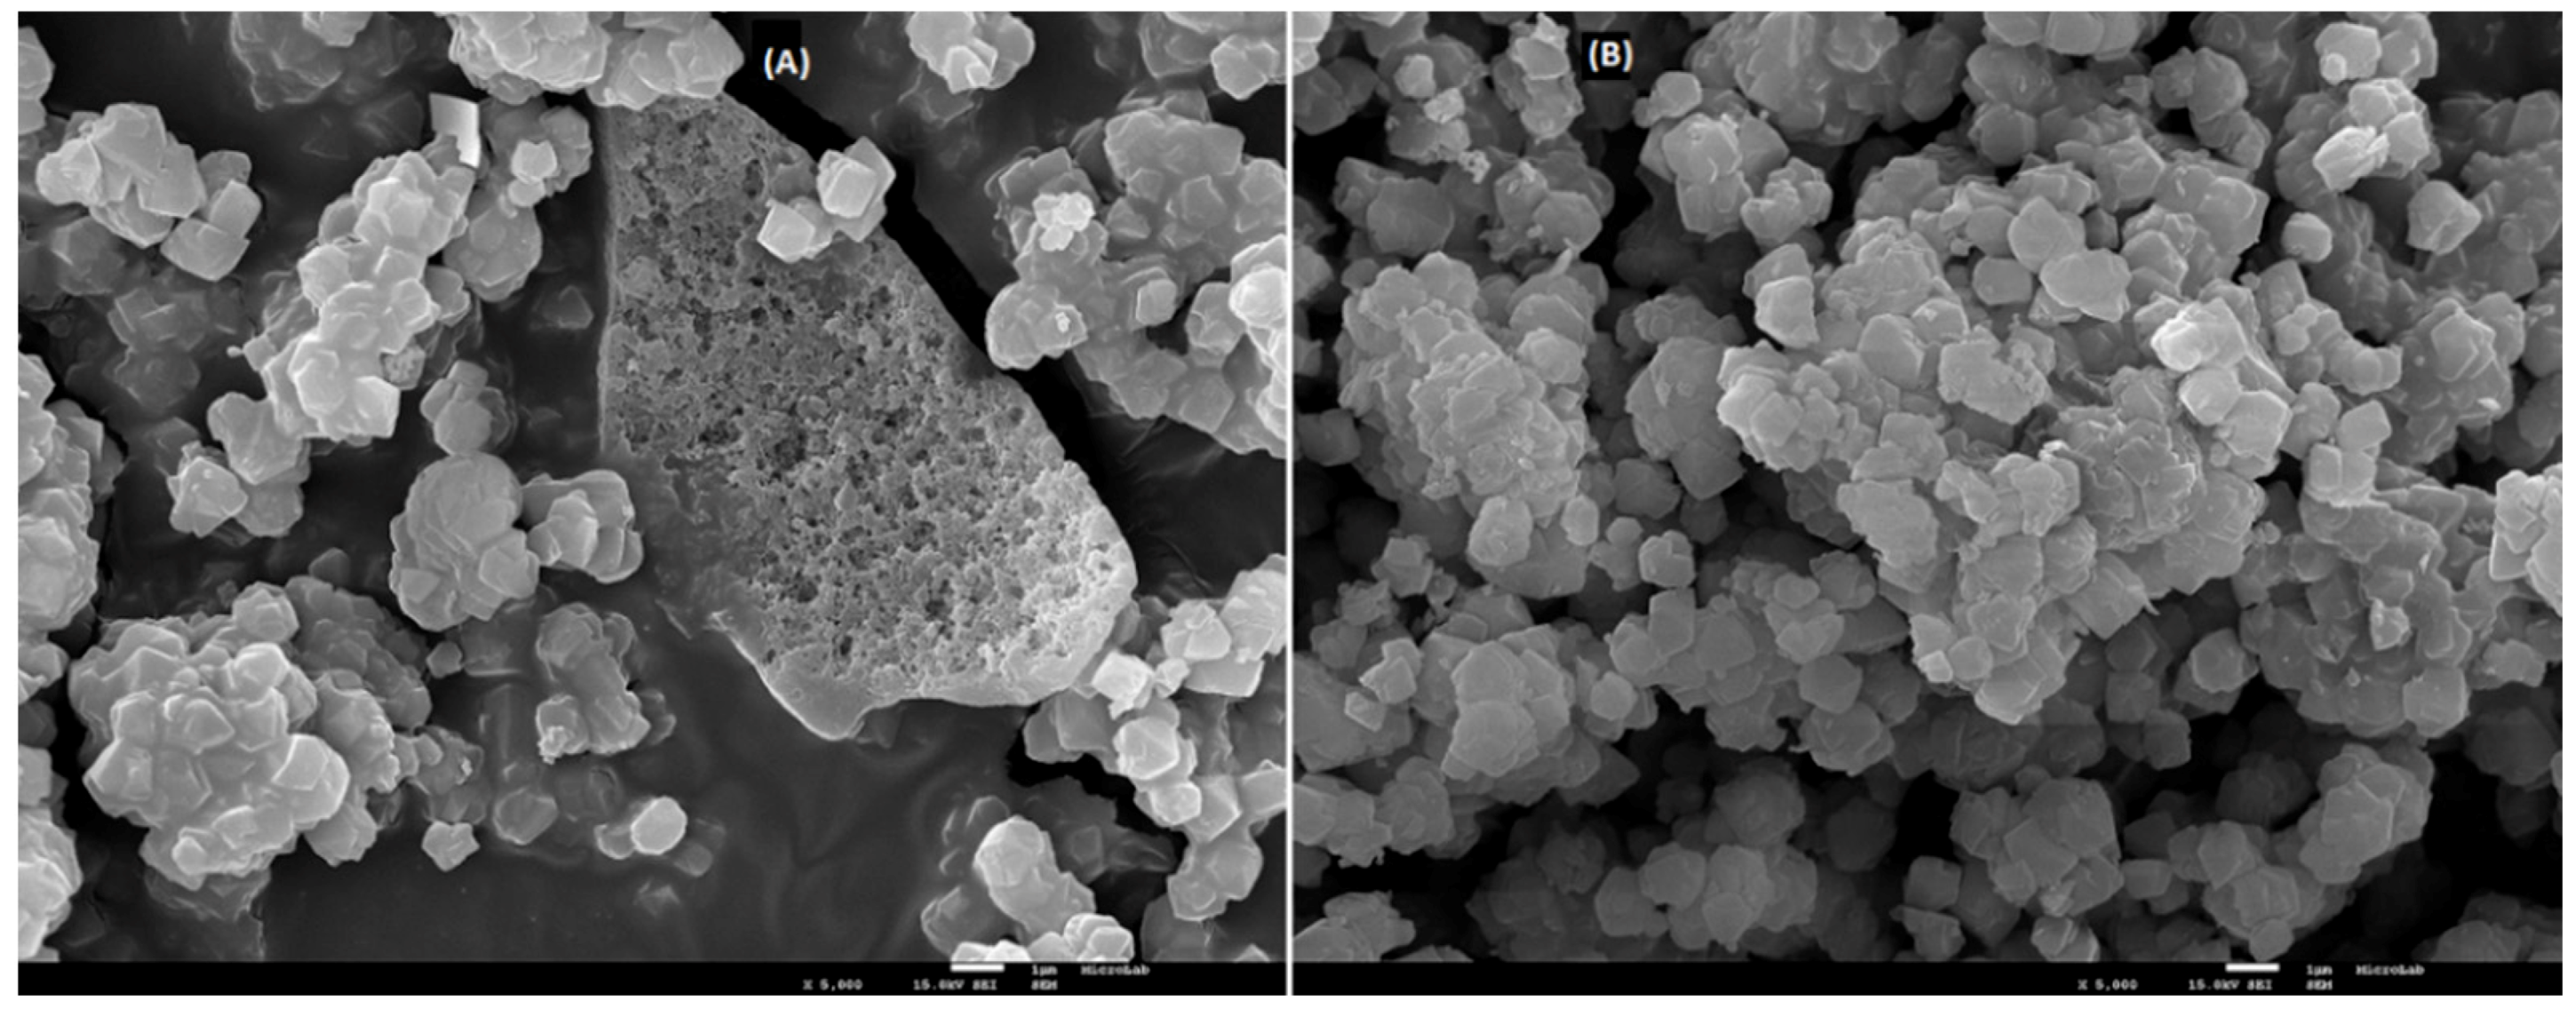
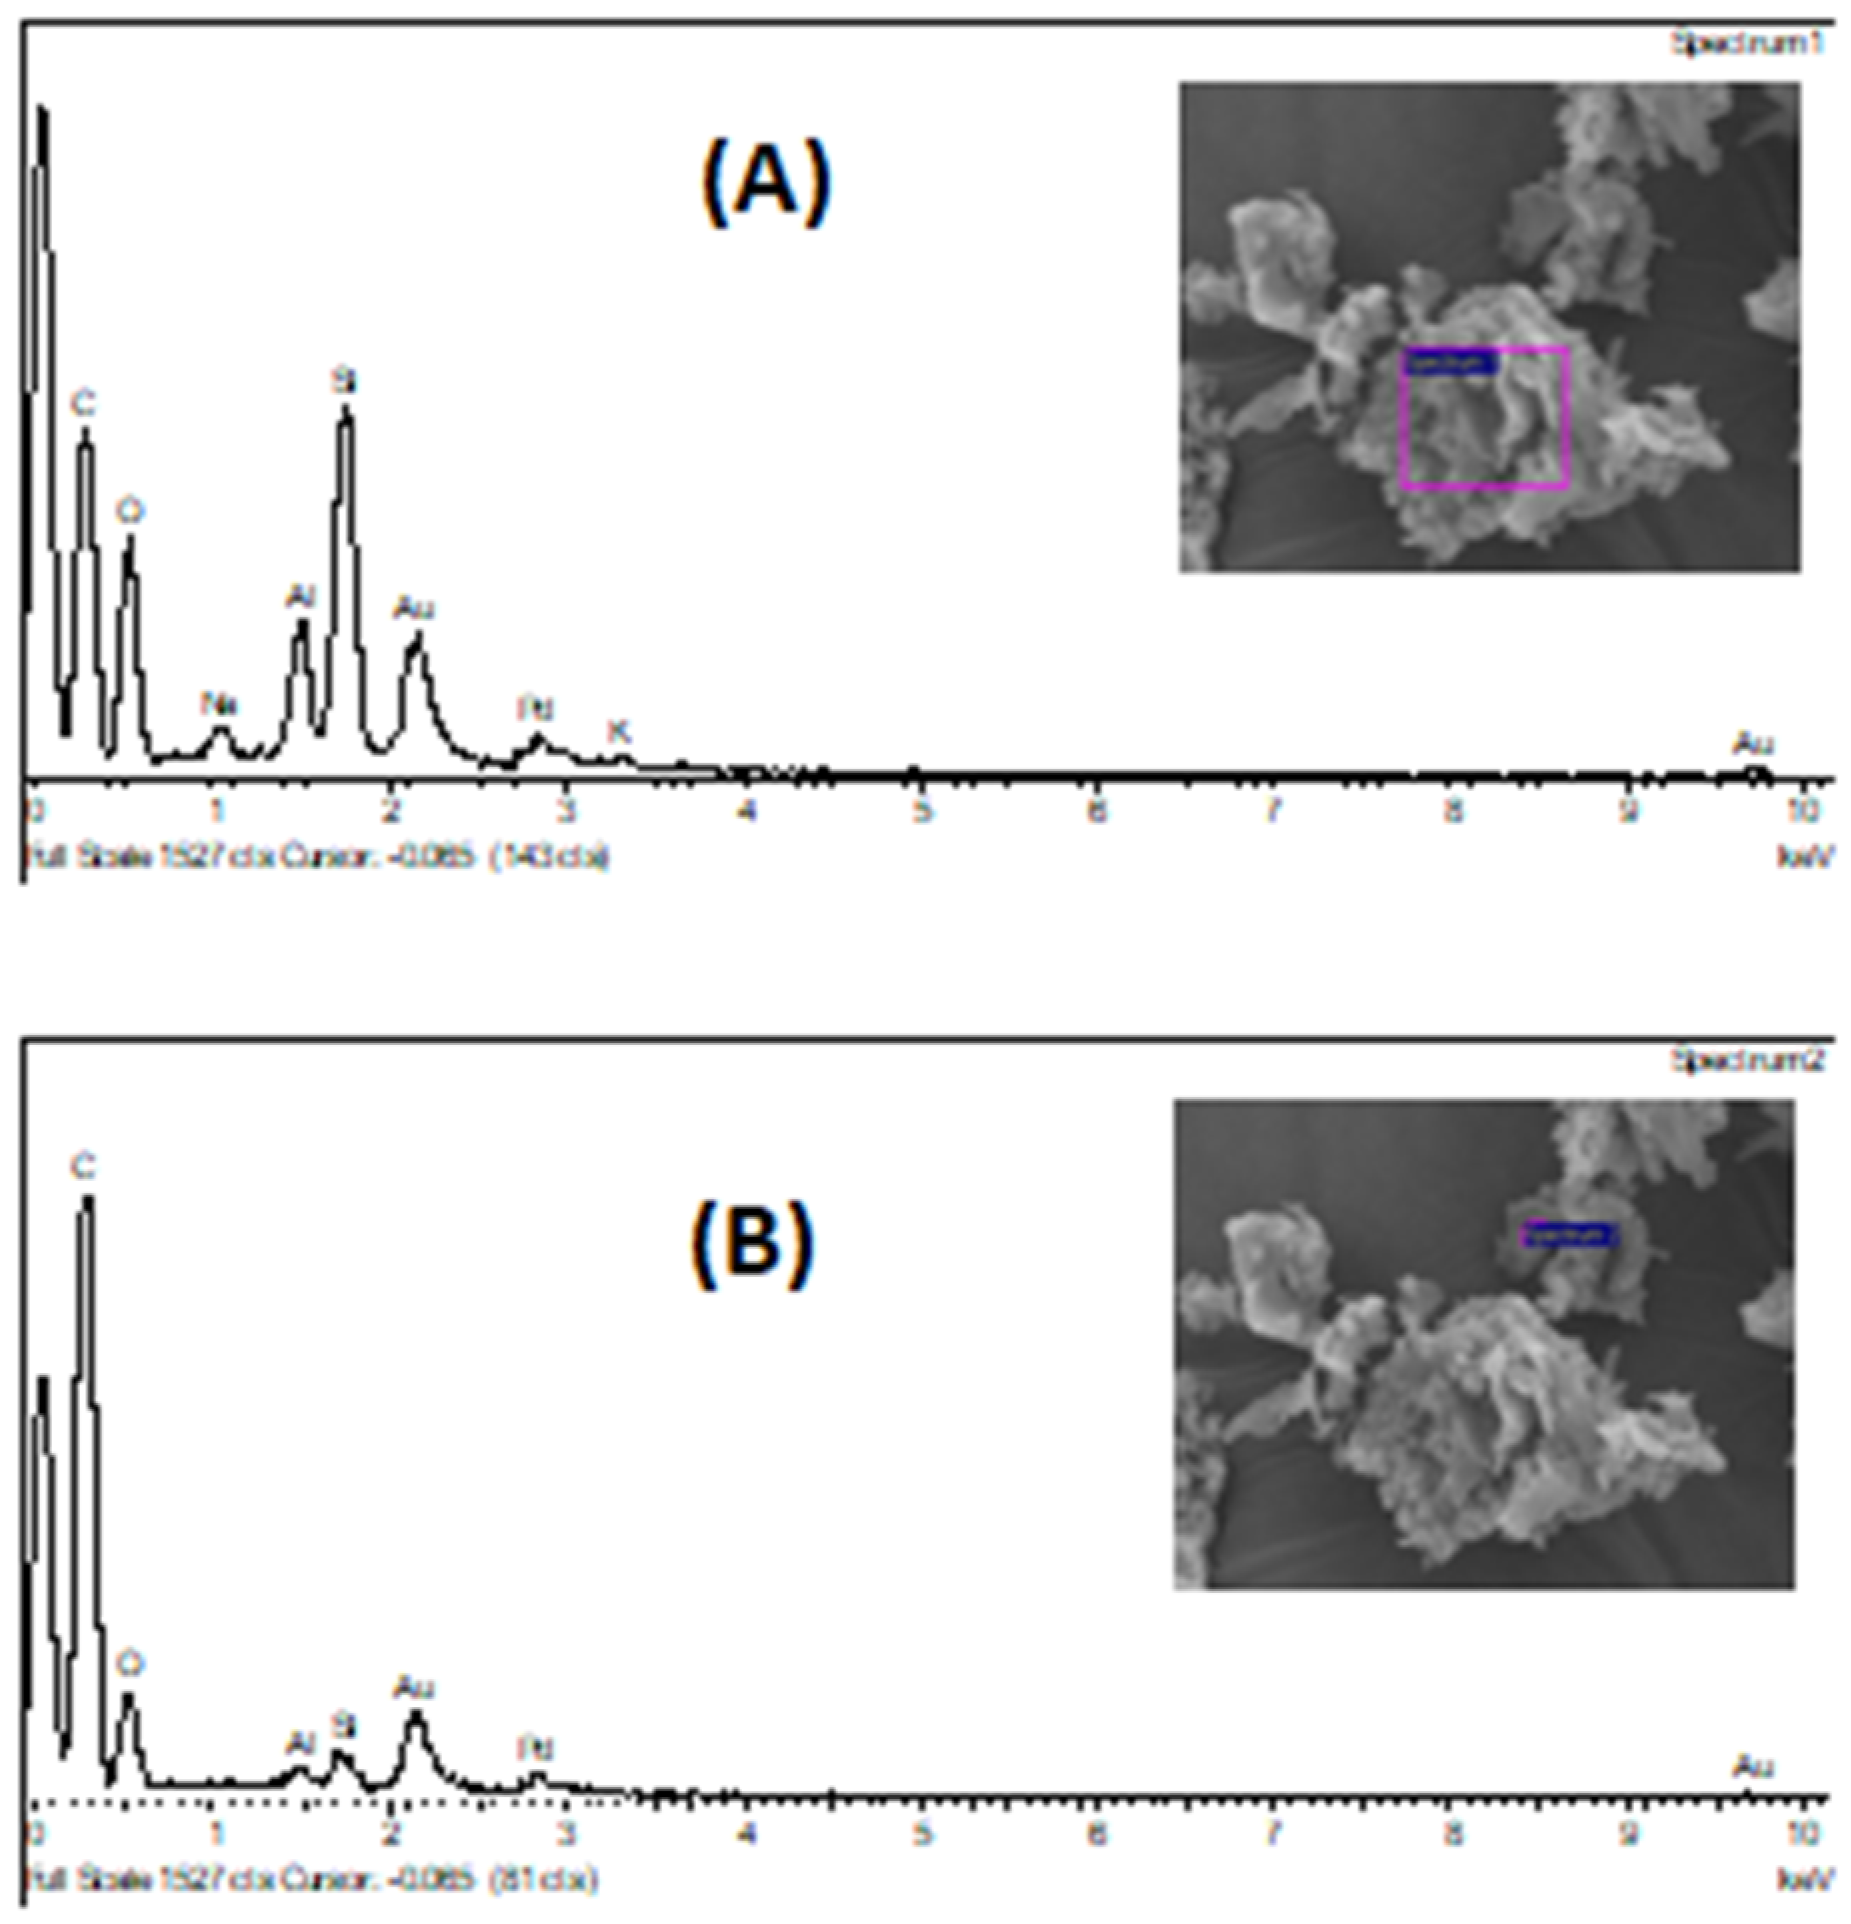
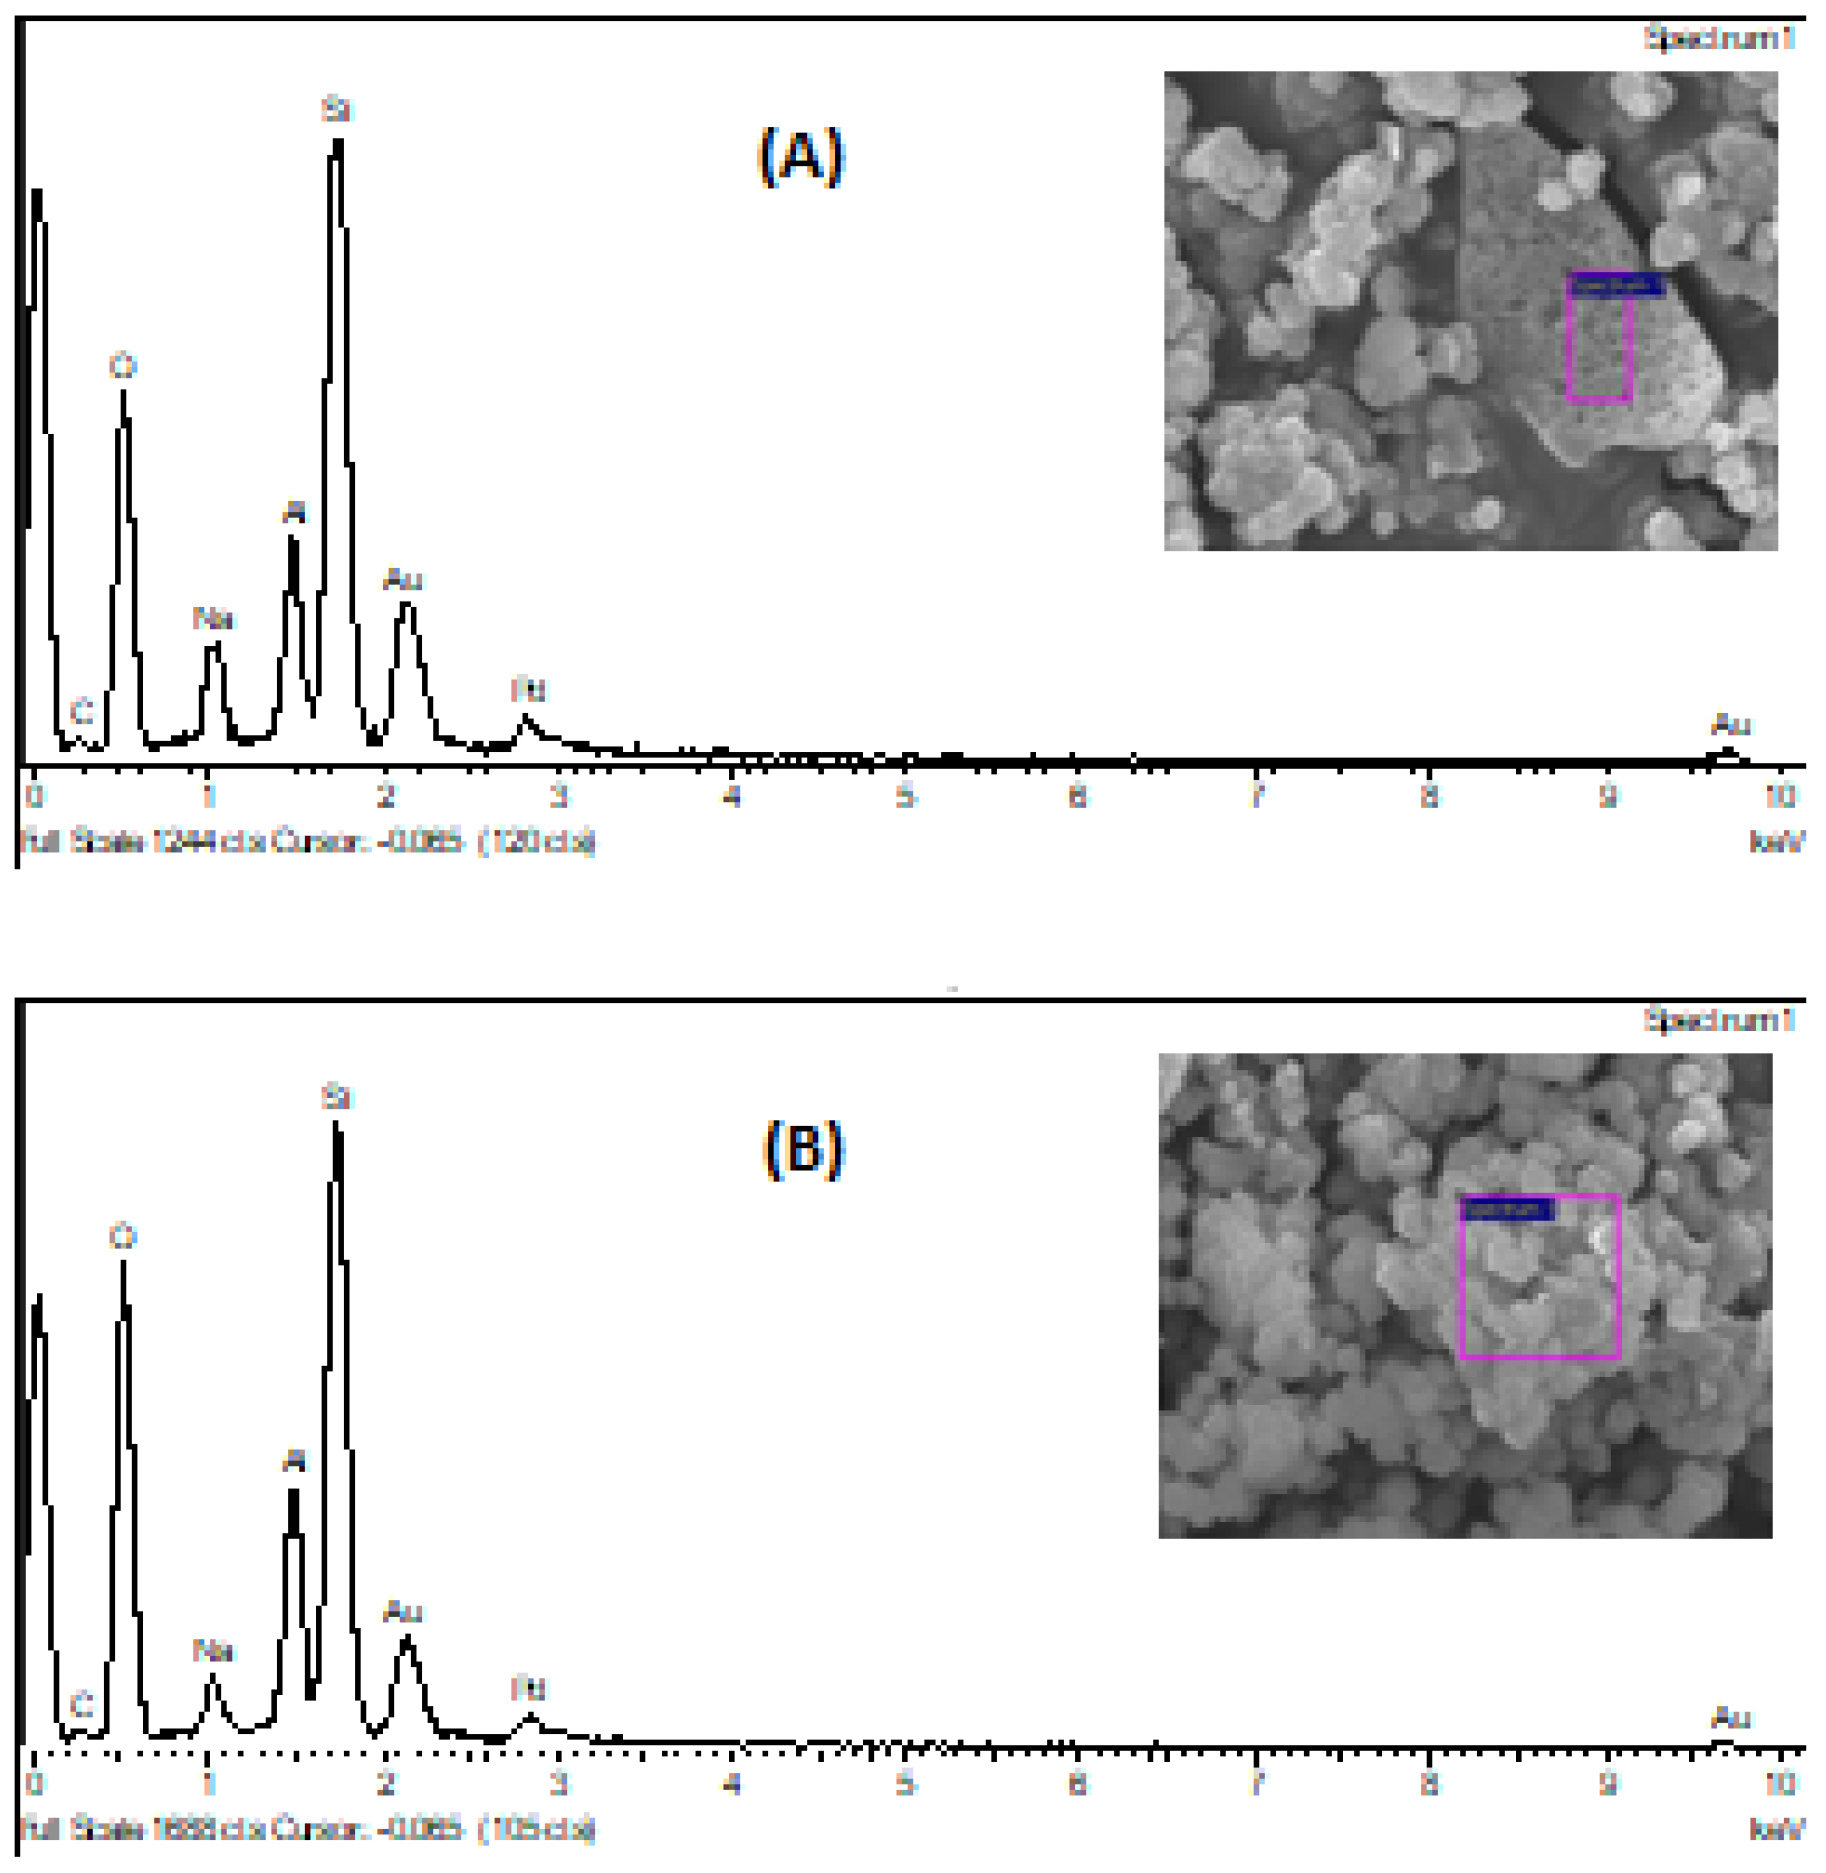
3.6. SEM-EDS Analysis

By the end of the syngas production test at 300 °C, with 4 g of z. HY catalyst, a solid was obtained, with some black particles, ascribable to coke deposition. In order to observe and characterize morphologically, this sample, before and after the acidification and calcination processes, as well, after the reaction at those conditions, SEM-EDS analysis was used, as shown in Figure 11 and Figure 12 (SEM images) and Figure 13 and Figure 14 (EDS spectra – atomic percentages).
Analyzing the several SEM micrographics of these figures, it is possible to conclude that the solid sample is not homogeneous in its constitution, mainly in the solid sample collected after the reaction process, at 300 °C with 4% of weighted catalyst. The grey areas of post-reaction catalyst, according with SEM image of Figure 11B can be ascribable to the carbonaceous residue deposited on the surface catalyst, with a significant content, since the carbon atomic content increase significantly, from 3.4% to 68.1% and 76.2%, in two different points of the solid surface analyzed, according with Table 8.
Several researchers pointed out in their articles that, this coke can be eliminated to CO2, regenerating the zeolite HY catalyst, to be active again in this reaction. The same phenomena was also observed in this work. It is well known that, this catalyst is the same that is currently used in the fluid catalytic cracking of heavy diesel fuels, in the crude oil refining industry [32]. The catalyst has the same behavior, in both processes.
Besides this, when comparing SEM images and EDS analysis of atomic contents, before and after the catalyst activation process (acidification and calcination), there aren’t significant changes in the morphology of the catalyst surface, with a little exception in the decreasing of the sodium content, which was expectable, due to the ionic exchange performed, where the sodium cation was leached.
The carbon atomic content decreased also, probably due to the calcination process, where the adsorbed CO2 was released of the catalyst surface, to the atmosphere and/or, due to the decomposition of some sodium carbonate adsorbed, which was converted to sodium oxide with CO2 released.

4. Conclusions

From this research work, it can be concluded that it is possible to produce syngas and methane, using this electrolysis system (electrofuel), together with a fixed bed catalytic reactor to produce methanation (Sabatier process), with significant less energy inputs when compared with the conventional thermochemical processes of syngas/methane production, like pyrolysis and gasification. Comparing the combined electrochemical/Sabatier process (10.38 kJ·mol−1) with the pyrolysis one (14.29 kJ·mol−1) and considering the same syngas/methane flow and the same gas composition, an increase of 38% in the input energy was observed. By another hand, the comparison between the same combined process (10.38 kJ·mol−1) with the gasification one (27.21 kJ·mol−1), an increase of 162% in the input energy was observed, both values applied for each mole of syngas/methane mixture. With the utilization of this combined electrochemical/Sabatier reactors, it’s possible to reduce input energy to the system and, as consequence, reduce energetic (operating) costs.
Regarding the methane production in this reactor, the operating conditions obtained so far, which enhanced and maximized its production was, a temperature of 300 °C and a weight heterogeneous catalyst content of 4% of zeolite HY. However, it should be noticed that, there are compounds, in the produced gas, that were measurable by the portable sensors. It was possible to conclude also, that, z. HY catalyst was progressively deactivated, through the visualization of carbon particles deposition on the surface catalyst. Nevertheless, the catalyst can be reactivated, by calcination, to be used again in the Sabatier reaction, so it’s possible to conclude that, the use of z. HY catalyst was clearly suitable in the Sabatier reaction (methanation process), at normal pressure and temperatures between 200–300 °C.
Besides, the use of acidified zeolite HY catalyst and higher temperatures increases methane production, which points out for further research steps comprising the increase of catalyst mass, and, to study the increase of pressure and temperature in a new laboratory prototype. It will also be of interest to investigate the use of other heterogeneous catalysts which may be more active such as other zeolites, acid clays or bimetallic catalysts, as well, study the production of other biofuels, like biomethanol, bio-DME, etc., regarding this electrolytic system.

Author Contributions

Conceptualization, J.F.P. and J.F.G.; Execution and discussion of the results, A.G., L.G. and J.C.R.; writing—review and editing, M.T.S. and D.A.

Funding

This research was funded by F.C.T. (Fundação para a Ciência e Tecnologia), grant number SAICT-POL/23470/2016.

Acknowledgments

The authors thank SECIL, S.A. and Margarida Mateus (Ph.D. researcher) for supplying the liquefied cork samples used in this experimental work. The authors also thank ª Maria Celeste Serra, from CEEQ/ISEL, for equipment utilisation, ª Isabel Nogueira from MicroLab, at IST-UL, for SEM-EDS analysis, ª Ana Ribeiro, from CQE/IST-UL, for FTIR utilisation and, Carlos Henriques, also from CQE/IST-UL, for supplying the USY zeolite catalyst.

Conflicts of Interest

The authors declare no conflict of interest.

Nomenclature

%CH4volumetric percentage of methane produced
%O2volumetric percentage of methane produced
ΔHrstandard specific reaction enthalpy, at 1 atm and 25 °C
H ¯ T specific heat (specific calorific value) of syngas/methane mixture at T temperature
ΔTdifference of temperature = T − 25
A1, A2, A3, A4Liquified biomass samples codification
C p ¯ mean specific calorific capacity for syngas/methane mixture
Cpispecific calorific capacity for each gas component
FTIRFourier Transformed InfraRed Spectroscopy
GHGgreenhouse gas
HHVhigh heating value
LHVlow heating value
QvRnormalizedvolumetric flow rate of produced gas
QvRO2consumvolumetric flow rate of oxygen consumed
SEM-EDSScanning Electronic Microscopy with Electron Diffraction Spectroscopy
Wcatalyst/Wliq.biom.Weight catalyst content regarding weight of liquified biomass employed
Ttemperature
z. HYacidified zeolite HY catalyst
z. USYultra-stabilized zeolite Y catalyst

References

  1. IEA. IEA 2017. Available online: www.iea.org (accessed on 26 August 2019).
  2. BP. Statistical Review of World Energy, June 2018, BP. Available online: www.bp.com (accessed on 26 August 2019).
  3. Atabani, A.; Silitonga, A.; Badruddin, I.; Mahlia, T.; Masjuki, H.; Mekhilef, S. A comprehensive review on biodiesel as an alternative energy resource and its characteristics. Renew. Sustain. Energy Rev. 2012, 16, 2070–2093. [Google Scholar] [CrossRef]
  4. Mohr, S.; Wang, J.; Ellem, G.; Ward, J.; Giurco, D. Projection of world fossil fuels by country. Fuel 2015, 141, 120–135. [Google Scholar] [CrossRef]
  5. Lazkano, I.; NøStbakken, L.; Pelli, M. From Fossil Fuels to Renewables: The Role of Electricity Storage. Eur. Econ. Rev. 2017, 99, 113–129. [Google Scholar] [CrossRef]
  6. Mateus, M.; Bordado, J.; Santos, R. Potential biofuel from liquefied cork—Higher heating value comparison. Fuel 2016, 174, 114–117. [Google Scholar] [CrossRef]
  7. Huang, H.; Yuan, X. Recent progress in the direct liquefaction of typical biomass. Prog. Energy Combust. Sci. 2015, 49, 59–80. [Google Scholar] [CrossRef]
  8. Gollakota, A.; Kishore, N.; Gu, S. A review on hydrothermal liquefaction of biomass. Renew. Sustain. Energy Rev. 2018, 81, 1378–1392. [Google Scholar] [CrossRef]
  9. Haung, P.; Koj, M.; Turek, T. Influence of process conditions on gas purity in alkaline water electrolysis. Int. J. Hydrog. Energy 2017, 42, 9406–9418. [Google Scholar]
  10. Durak, H. Bio-oil production via subcritical hydrothermal liquefaction of biomass. In International Conference on Advances in Natural and Applied Sciences. Am. Inst. Phys. 2017, 1833, 1–5. [Google Scholar]
  11. Sapountzi, F.; Gracia, J.; Weststrate, C.; Fredriksson, H.; Niemantsverdriet, J. Electrocatalysts for the generation of hydrogen, oxygen and synthesis gas. Prog. Energy Combust. Sci. 2017, 58, 1–35. [Google Scholar] [CrossRef] [Green Version]
  12. Carmo, M.; Fritz, D.; Mergel, J.; Stolten, D. A comprehensive review on PEM water electrolysis. Int. J. Hydrog. Energy 2013, 38, 4901–4934. [Google Scholar] [CrossRef]
  13. Vincent, I.; Bessarabov, D. Low cost Hydrogen production by anion Exchange membrane electrolysis: A review. Renew. Sustain. Energy Rev. 2018, 81, 1690–1704. [Google Scholar] [CrossRef]
  14. Nguyen, V.; Blum, L. Syngas and Synfuels from H2O and CO2: Current Status. Chem. Ingénieur Tech. 2015, 87, 354–375. [Google Scholar] [CrossRef]
  15. Moulijn, J.; Makkee, M.; Diepen, A. Chemical Process Technology, 2nd ed.; John Wiley & Sons Ltd.: Bognor Regis, UK, 2013; ISBN 978-1118570746. [Google Scholar]
  16. Bellotti, D.; Rivarolo, M.; Magistri, L.; Massardo, A. Feasibility study of methanol production plant from hydrogen and captured carbon dioxide. J. CO2 Util. 2017, 21, 132–138. [Google Scholar] [CrossRef]
  17. Azizi, Z.; Rezaeimanesh, M.; Tohidian, T.; Rahimpour, M. Dimethyl ether: A review of technologies and production challenges. Chem. Eng. Process. Process. Intensif. 2014, 82, 150–172. [Google Scholar] [CrossRef]
  18. Khodakov, A.; Chu, W.; Fongarland, P. Advances in the Development of Novel Cobalt Fischer-Tropsch Catalysts for Synthesis of Long-Chain Hydrocarbons and Clean Fuels. Chem. Rev. 2017, 107, 1692–1744. [Google Scholar] [CrossRef] [PubMed]
  19. Stangeland, K.; Kalai, D.; Li, H.; Yu, Z. CO2 methanation: The effect of catalysts and reaction conditions. Energy Proc. 2017, 105, 2022–2027. [Google Scholar] [CrossRef]
  20. Loosdrecht, J.; Botes, F.; Ciobîcă Ferreira, A.; Gibson, P.; Moodley, D.; Saib, A.; Visagie, J.; Weststrate, C.; Niemantsverdriet, H. Fischer-Tropsh Synthesis: Catalysts and Chemistry. In Comprehensive Inorganic Chemistry II, 2nd ed.; Elsevier: Amsterdam, The Netherlands, 2013; Volume 7, pp. 525–557. ISBN 978-0-08-096529-1. [Google Scholar]
  21. Krylova, A. Products of the Fischer-Tropsch Synthesis A Review. Solid Fuel Chem. 2014, 48, 22–35. [Google Scholar] [CrossRef]
  22. Guerra, L.; Gomes, J.F.; Puna, J.F.; Rodrigues, J. Preliminary study of synthesis gas production from water electrolysis, using the ELECTROFUEL® concept. Energy 2015, 89, 1050–1056. [Google Scholar] [CrossRef]
  23. Chen, X.; Guan, C.; Xiao, G.; Du, X.; Wang, J. Syngas production by high temperature steam/CO2 co-electrolysis using solid oxide electrolysis cells. Faraday Discuss. 2015, 182, 341–351. [Google Scholar] [CrossRef] [PubMed]
  24. Guerra, L.; Rossi, S.; Rodrigues, J.; Gomes, J.F.; Puna, J.F.; Santos, M.T. Methane production by a combined Sabatier reaction/water electrolysis process. J. Environ. Chem. Eng. 2018, 6, 671–676. [Google Scholar] [CrossRef]
  25. Guerra, L.; Moura, K.; Rodrigues, J.; Gomes, J.; Puna, J.; Santos, M.T. Synthesis gas production from water electrolysis, using the Electrocracking concept. J. Environ. Chem. Eng. 2018, 6, 604–609. [Google Scholar] [CrossRef]
  26. Gonçalves, A. Utilização de biomassa liquefeita na produção eletrolítica de gás de síntese. In Master Thesis in Chemical and Biological Engineering; ISEL: Lisboa, Portugal, 2017. (In Portuguese) [Google Scholar]
  27. Buckman, H.O.; Brady, N.C. The Nature and Property of Soils—A College Text of Edaphology, 6th ed.; Macmillan Publishers: New York, NY, USA, 1960. [Google Scholar]
  28. Dimitriadis, A.; Bezergianni, S. Hydrothermal liquefaction of various biomass and waste feedstocks for biocrude production: A state-of-the-art review. Renew Sustain. Energy Rev. 2017, 68, 113–125. [Google Scholar] [CrossRef]
  29. Gary, J.; Handwerk, H.; Glenn, E. Petroleum Refining—Technology and Economics; Marcel Dekker Inc.: New York, NY, USA, 2001. [Google Scholar]
  30. Himmelblau, D.M. Basic Principles and Calculations in Chemical Engineering, 6th ed.; Prentice Hall: New York, NY, USA, 1996. [Google Scholar]
  31. Dhyani, V.; Bhaskar, T. A comprehensive review on the pyrolysis of lignocellulosic biomass. Renew. Energy 2018, 129, 695–716. [Google Scholar] [CrossRef]
  32. Alam, S.; Bangash, S.; Bangash, F. Elemental Analysis of Activated Carbon by EDS Spectrophotometry and X-rays Diffraction. J. Chem. Soc. Pak. 2009, 31, 46–58. [Google Scholar]
Figure 1. Experimental set-up.
Energies 12 03787 g001
Figure 2. Glass reactor used with liquified biomass to produce methane.
Energies 12 03787 g002
Figure 3. Electrolyser (left) and, steel electrodes used in the electrolyser unit (right).
Energies 12 03787 g003
Figure 4. Evolution of the oxygen concentration in the electrolyser, over time, for different tested electrolytes (average values).
Energies 12 03787 g004
Figure 5. Comparison of the behavior of the volumetric flow rate of gases produced over the test time for the synthesis gas production tests for different amounts of catalyst and temperature (average values).
Energies 12 03787 g005
Figure 6. Comparison of the behavior of the percentage of oxygen in the gas produced over the test time for the synthesis gas production tests for different amounts of catalyst and temperatures (average values).
Energies 12 03787 g006
Figure 7. Comparison of the behavior of the volumetric flow rate of oxygen consumed over the test time for the synthesis gas production tests for different amounts of catalyst and temperatures (average values).
Energies 12 03787 g007
Figure 8. Comparison of the behavior of the percentage of methane in the gas produced over the test time for the synthesis gas production tests for different amounts of catalyst and temperature (average values).
Energies 12 03787 g008
Figure 9. FTIR spectra: (A) corresponding to the initial sample of liquefied biomass, prior to any test; (B) corresponding to the biomass sample after the test at 250 °C, without catalyst.
Energies 12 03787 g009
Figure 10. FTIR spectra: (A) corresponding to the condensate resulting from the test at 150 °C with 4%g of z. HY catalyst; (B) corresponding to the condensate resulting from the test at 300 °C with 2% of z. HY catalyst.
Energies 12 03787 g010
Figure 11. SEM images of z. HY catalyst sample collected after the methanation reaction process, at 300 °C and with 4% (w/w) of z. HY catalyst (A: 2000 x, 10 μm; B: 5000 x, 1 μm).
Energies 12 03787 g011
Figure 12. SEM images (5000 x; 1 μm) of: (A) z. HY catalyst sample collected before the activation process; (B) same catalyst sample collected after the activation process.
Energies 12 03787 g012
Figure 13. EDS spectra and respective SEM image of: (A) solid sample collected before the syngas production test at 300 °C with 4% of z. HY catalyst and (B) solid sample collected after the syngas production test at 300 °C with 4%g of z. HY catalyst.
Energies 12 03787 g013
Figure 14. EDS spectra of: (A) z. HY catalyst sample collected before the activation process and (B) same catalyst sample collected after the activation process.
Energies 12 03787 g014
Table 1. Elemental composition, humidity and heating values of cork/eucalyptus bark solid biomass samples.
ComponentUsed (%(w/w)) (1)From Literature (Ligneous Biomass, % (w/w)) [28]
C46.0–49.044.0–53.0Cellulose30.0–50.0
H5.30–5.705.50–6.50Hemicellulose15.0–35.0
O42.0–47.5 (2)38.0–49.0Lignin20.0–35.0
N1.00–2.000.00–2.00Ashes0.20–8.00
S0.08–1.000.05–1.00
Cl0.05–0.25--
Total humidity44.0–67.0Variable
HHV (MJ/kg)17.5–19.515.0–19.0
LHV (MJ/kg)16.5–18.5--
(1)—Obtained before entering in the hydro liquefaction process used, after several measures performed; (2)—Estimated by difference from total weight composition.
Table 2. Elemental composition, humidity and heating values of cork/eucalyptus liquified biomass samples.
Component% (w/w)Component% (w/w)
C60.0–70.0S<0.50
H12.0–13.0Total humidity2.00–4.00
O14.5–25.5 (1)HHV (MJ/kg)31.5–39.0
N<2.50LHV (MJ/kg)29.0–36.0
(1)—estimated by difference from total weight composition.
Table 3. Experimental results achieved regarding the experiences performed in the electrolyser.
ElectrolyteT (°C)V (V)I (A)F (mL.min−1)pHipHfΔpH (%)Ki (mS.cm−1)Kf (mS.cm−1)ΔK (%)
NaOH 0.4 M76.928.53.6498.8014.214.10.7076.7068.1311.2
NaOH 1.2 M53.228.52.50103.014.214.20.00198.8194.91.96
NaOH 1.2 M + 5% (w/w) biom.53.128.51.2450.2814.211.121.8182.556.6770.0
NaOH 1.2 M + 10% (w/w) biom45.828.50.9648.7914.210.923.2136.448.7364.3
NaOH 1.2 M + 12% (w/w) biom43.228.50.8639.1514.212.710.6124.644.7064.1
NaOH 1.2 M + 15% (w/w) biom46.428.51.0950.7614.313.09.09116.338.5766.8
Table 4. Experimental results obtained with complementary experiences in the syngas/methane reactor.
Liquified BiomassT (°C)t (min.)Vf(liq.biom.) (mL)Yield(liq.biom.) (%)V(cond.) (mL)m(cond.) (g)ρap. (cond.) (g.cm−3)Yield(cond.) (%)Yield(gas) (%) (*)
A2100609898.0----2.0
150609697.0----3.0
20030--18.518.20.9818.5-
607274.023.522.80.9723.52.5
2407472.024.523.50.9624.53.5
(*)—estimated considering the initial volume of 100 mL of liquified biomass minus the volumes of final liquified biomass and condensate produced.
Table 5. Experimental results in the methanation reactor, for different reaction temperatures and different weight content catalyst.
Liquified Biomass% (Wcat./Wliq.biom.)T (°C)F (mL·min−1)%O2%CH4
A2---150142.933.50.19
200150.032.00.45
250138.533.30.45
300138.532.02.08
z. HY, 2%150145.233.80.25
200134.232.51.84
250145.232.24.16
300157.930.212.8
z. HY, 4%150145.233.90.28
200145.232.53.98
250134.230.05.02
300138.522.233.9
z. USY, 1%200125.033.10.17
z. USY, 2%200132.433.10.26
A3---200145.232.30.16
A4z. HY, 4%200133.632.23.81
Table 6. Thermodynamic values (a,b,c,d) expressed in J·mol−1 °C−1, of gas components, for application in equation 10 [30].
Compoundabcd
CO28.954.11 × 10−33.55 × 10⁻⁶−2.22 × 10⁻⁹
CO236.114.23 × 10−2−2.89 × 10−57.46 × 10−9
O229.101.16 × 10−2−6.08 × 10−61.31 × 10−9
N229.102.20 × 10−35.72 × 10⁻³-2.87 × 10⁻⁹
H228.847.65 × 10−53.29 × 10⁻⁶−8.70 × 10⁻¹⁰
CH434.315.47 × 10−23.66 × 10⁻⁶−1.10 × 10⁻⁸
Table 7. Calculated values of ( C p ¯ ) and ( H ¯ T ) for different syngas/methane production processes.
ProcessT (°C)( C p ¯ ) (J.mol−1·°C−1) H ¯ T ( kJ · mol 1 )
Electrochemical/Sabatier combination30034.6210.38
Pyrolysis (with N2 and without O2)40035.3914.15
Gasification (with N2 and without O2)70038.4626.92
Table 8. Atomic percent data obtained by EDS spectra for catalyst samples, before and after the activation processes, as well, after the biomethane reaction, at 300 °C with 4% (w/w) of zeolite HY.
ElementBefore ActivationAfter ActivationAfter Reaction
Sample 1 (Spectrum 1)Sample 2 (Spectrum 2)
C6.573.4368.176.2
O57.564.424.822.7
Na5.292.290.63-
Al6.737.741.580.36
Si24.022.14.740.77
K--0.18-

