Article

Energy Consumption Analysis and Characterization of Healthcare Facilities in the United States

1
Department of Engineering & Technology, Southeast Missouri State University, Cape Girardeau, MO 63701, USA
2
Industrial and Manufacturing Engineering Department, Kettering University, Flint, MI 48504, USA
*
Author to whom correspondence should be addressed.
Energies 2019, 12(19), 3775; https://doi.org/10.3390/en12193775
Submission received: 13 August 2019 / Revised: 29 September 2019 / Accepted: 30 September 2019 / Published: 4 October 2019
(This article belongs to the Section B: Energy and Environment)

Abstract

:
Healthcare facilities in the United States account for 4.8% of the total area in the commercial sector and are responsible for 10.3% of total energy consumption in this sector. The number of healthcare facilities increased by 22% since 2003, leading to a 21% rise in energy consumption and an 8% reduction in energy intensity per unit of area (544.8 kWh/m2). This study provides an analytical overview of the end-use energy consumption data in healthcare systems for hospitals in the United States. The energy intensity of the U.S. hospitals ranges from 640.7 kWh/m2 in Zone 5 (very hot) to 781.1 kWh/m2 in Zone 1 (very cold), with an average of 738.5 kWh/m2. This is approximately 2.6 times higher than that of other commercial buildings. High energy intensity in the healthcare facilities, particularly in hospitals, along with energy costs and associated environmental concerns make energy analysis crucial for this type of facility. The proposed analysis shows that U.S. healthcare facilities have higher energy intensity than those of most other countries, especially the European ones. This necessitates the adoption of more energy-efficient approaches to the infrastructure and the management of healthcare facilities in the United States.

1. Introduction

Healthcare facilities include physicians’ offices, dentists’ offices, outpatient and inpatient centers, medical laboratories, home healthcare facilities, general medical and surgical hospitals, and community care facilities. Healthcare facilities account for 4.8% of the total area of commercial buildings in the United States and are responsible for 10.3% of total energy consumption in this sector [1]. This amount of energy is responsible for a considerable level of environmental pollution and emissions, including acid rain (12%), greenhouse gas (10%), and air pollution (10%) [2]. Energy consumption in healthcare systems is mostly due to space heating, cooling, steam production, ventilation (air movement), lighting, equipment usage, domestic hot water, and cooking [3]. Finally, the biggest predictor of energy usage of these facilities is facility size (surface area), types of services, number of workers, number of beds, and geographical conditions.
In the past decades, significant attention has been paid to energy analysis and consumption optimization in various industries and buildings. Among those, the energy-savings opportunities for healthcare facilities (especially hospitals, considering their relative size) are of significant interest. Increasing energy prices, lack of natural resources for energy generation, and sustainability-based standards to enforce energy consumption and CO2 emissions minimization necessitate the analysis of energy consumption in these systems. Among healthcare facilities, hospitals are one of the most energy-intensive buildings in the United States due to their continuous energy usage patterns and various types of activities [4]. Among healthcare facilities in the U.S., large hospitals constitute 47% of the total area and are responsible for 64% of total energy consumption. Because more than half of the energy usage in healthcare systems occurs in hospitals, this study mostly concentrates on energy consumption data in hospitals. In 2012, the Energy Information Agency (EIA) reported that the U.S. commercial sector was responsible for 1036 million metric tons of carbon dioxide in the year 2003 and 10,073 million metric tons of carbon dioxide in the year of 2008 [1]. Since healthcare facilities are a big part of the commercial sector, it is very important for any healthcare facility to use energy efficiently. The study of healthcare facility energy utilization allows us to look for efficient ways to implement energy management improvements. Reduction in energy consumption will not only reduce greenhouse gas emissions but also reduce the plant operating costs.
The main contribution of this paper is to present an analytical overview of the end-use energy data in U.S. healthcare systems and hospitals. This research was motivated by a gap that currently exists in reporting the energy consumption analysis based on the end-use data from the U.S. healthcare sectors. This work is the first study to consolidate and characterize energy consumption data in healthcare systems in the United States from different perspectives. This study can serve as a benchmark to assess energy-related performance in the U.S. and highlight the necessity of implementing energy-efficient approaches in these healthcare facilities. It is worth mentioning that the current study addresses neither the energy-aware optimum design nor energy-saving or forecasting approaches.
The rest of this paper is summarized as follows. Section 2 presents a brief literature review of studies on the analysis of end-use energy data in healthcare systems. Section 3 provides an analytical overview of energy consumption in U.S. healthcare facilities. Section 4 discusses case studies on energy consumption in hospitals in the United States and compares the consumption data with other countries, and Section 5 analyzes the process and the non-process energy data in the U.S. health care facilities. Concluding remarks are presented in Section 6.

2. Literature Review

Numerous studies in the literature analyze energy data in healthcare. Because hospitals form the largest ratio of the area in the healthcare sector, the majority of these studies evaluate end-use energy consumption and energy-saving approaches at hospitals in different regions. In general, lack of reference values makes the evaluation of energy data in this sector a challenging task [5]. The energy audit of a Malaysian hospital showed that lighting and biomedical equipment consumed the largest amount of energy (36% and 34%, respectively), and energy intensity was reported to be 234 kWh/m2 [6]. A study in Thailand determined the energy intensity of 148.8 kWh/m2, with air conditioning units accounting for 57% of the total amount of energy consumption [7]. In another study of 210 hospitals in Thailand, electricity and thermal energy accounted for 31.61% and 36.81% of total energy requirements, respectively [8]. They also proposed a regression model to estimate energy consumption as a function of six predictors. Analyzing energy consumption data from two hospitals in Korea resulted in an electricity intensity of 0.46 GJ/m2 (128 kWh/m2) and a heat density of 1.63 GJ/m2 (452 kWh/m2) per year [9]. Hospitals in Spain were responsible for 7% of total energy consumption in the tertiary sector, and quantitative analysis of energy consumption in 20 hospitals concluded the energy intensity of 270 kWh/m2 [10]. They also evaluated the impact of the area, the number of workers, the number of beds, the type of management, the geographical location, the gross domestic product (GDP), the heating and cooling degree days, and the range of years (study span) on energy consumption. Quantification of energy data in German hospitals was investigated in [2]. They declared that 2100 hospitals in Germany consumed around 6000 kWh of electricity and 29,000 kWh of heat per bed per year. Energy-saving approaches in a 110-bed hospital in Grevena, Greece concluded the average energy intensity of its facility was 104.46 kWh/m2 [11].
In Germany, 20,000 h of data were collected for operating theaters, intensive care units, examination rooms, and large-scale medical equipment. The daily energy intensity ranged from 1.2 kWh/m2 for the operating rooms to 150 kWh/m2 for medical equipment [5]. In the UK, the study of a 48-bed hospital determined total annual energy demand of 289 kWh/m2 and identified overheating in some areas during summertime [12]. They also investigated temperature and ventilation performances of the hospital. While some studies analyze energy performance at a specific facility, Morgenstern et al. (2016) studied electricity consumption data in 28 departments across eight medium-to-large general acute hospitals in England and confirmed that different departments have considerably nonhomogeneous electricity consumption characteristics [13]. Studies in [14,15,16,17] provided an estimation of the energy requirements in healthcare facilities by considering basic services such as lighting and heating, ventilation, and air conditioning (HVAC) equipment, and medical and laboratory equipment in non-critical, non-secured, and secured categories. They also reviewed different energy-production and energy-storage technologies for healthcare systems. Assessing 55 healthcare facilities in Spain sized from 500 to 3500 m2 area concluded an average annual energy consumption of 86 kWh/m2 and determined energy-saving options through simulation [18]. With this background, Section 3 summarizes some of the current energy facts in the U.S. healthcare systems.

3. Energy Consumption in U.S. Healthcare Facilities

The Commercial Buildings Energy Consumption Survey (CBECS) provides energy consumption data in commercial buildings in the United States. In the latest report of the Energy Information Administration (EIA) published in 2012 [1], 10,000 inpatient and 147,000 outpatient facilities were studied in the country. The total area of these facilities was 386 million m2, including 220.55 million m2 of inpatient and 165.46 million m2 of outpatient centers, with an average floor space of 2462 m2 per facility.
Healthcare facilities accounted for 4.8% of the total area in commercial buildings and consumed 210.42 billion kWh of energy (which represents 10.3% of total energy consumption in the commercial sector). This yields the average energy intensity of 544.8 kWh/m2 (or 1.34 million kWh for a building with the average amount of floor space). This number is significantly higher than the average energy intensity of commercial buildings [1], which is 329.34 kWh/m2. 
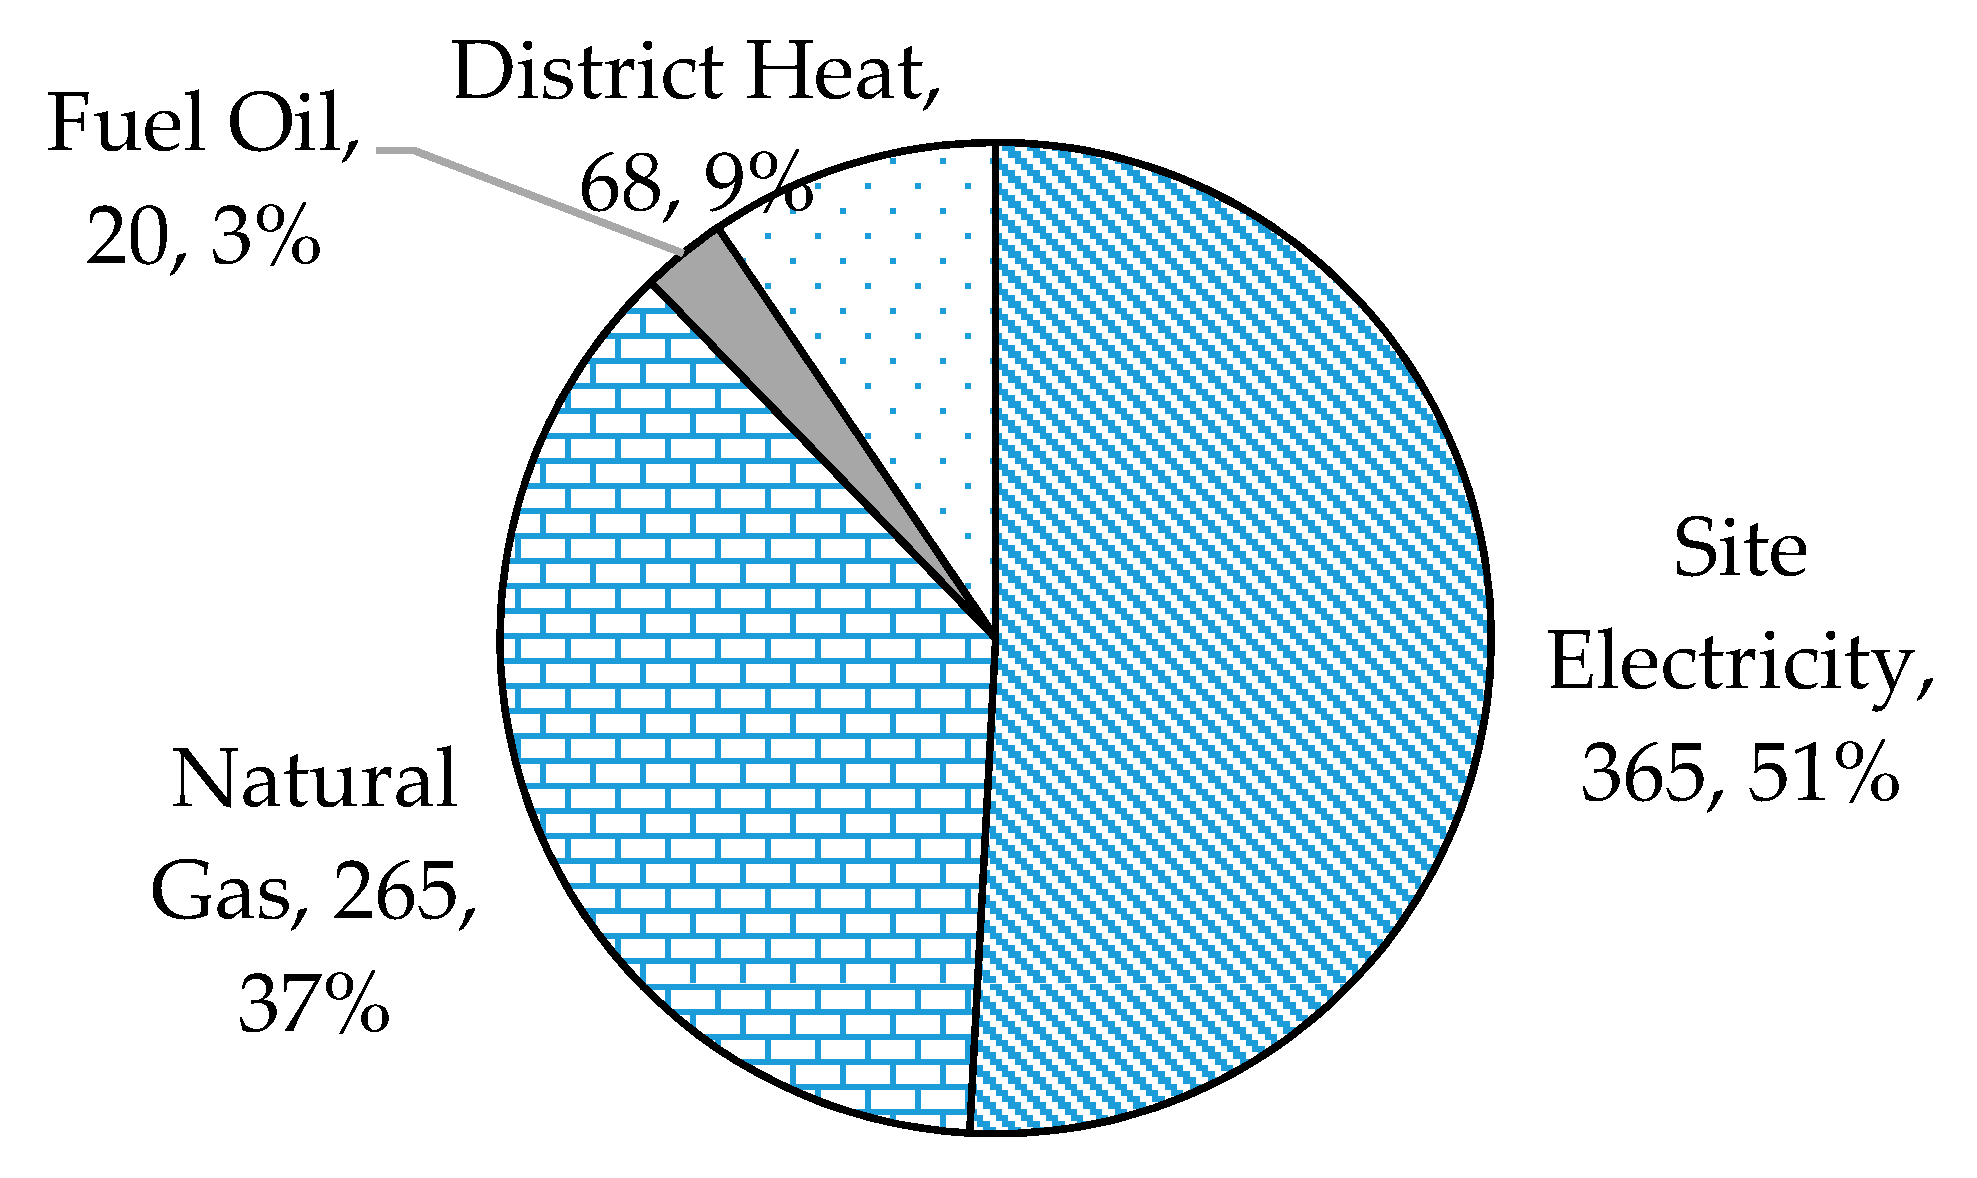
Figure 1 presents an overview of energy consumption by energy type, including electricity, natural gas, and fuel oil, in the U.S. healthcare sector.
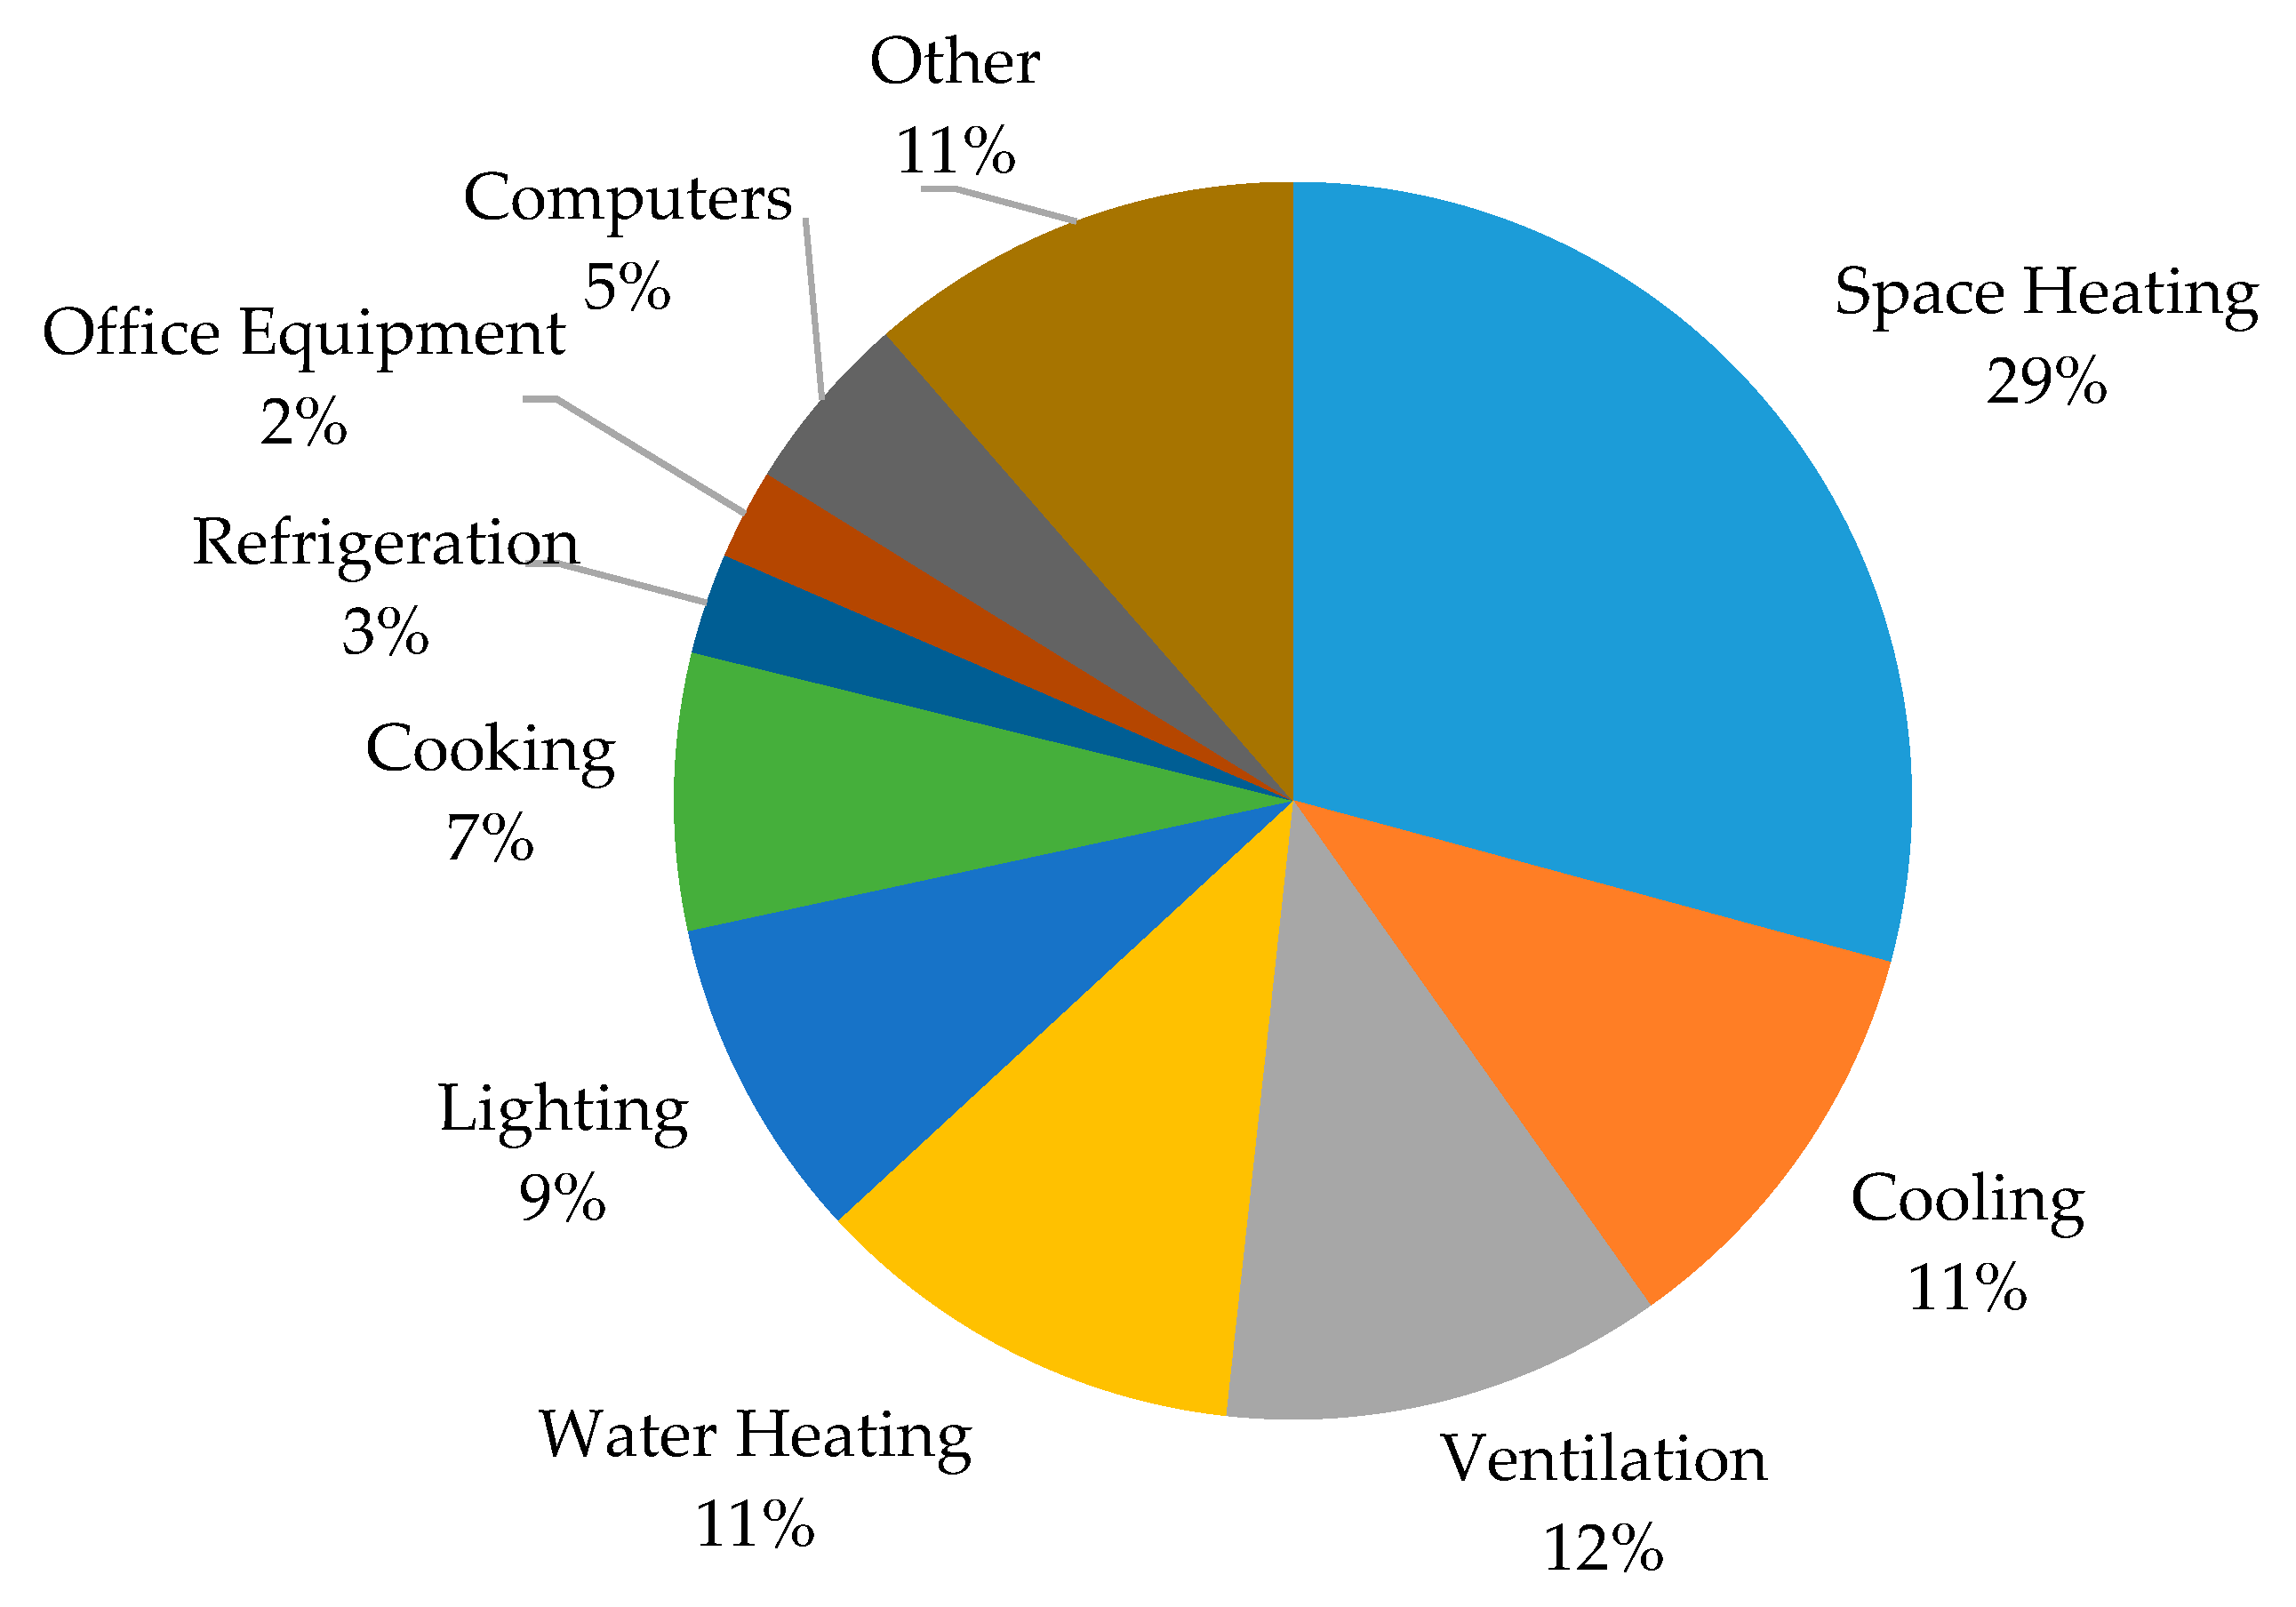
Analysis of energy data shows that space heating, ventilation, water heating, and cooling are major energy consumers in healthcare systems, accounting for 29%, 12%, 11%, and 11% of the total amount of energy, respectively (63% of total energy). Strict air quality requirements for hospitals to maintain safety and comfort contribute to the large energy consumption of heating and cooling activities. Table 1 and Figure 2 provide a breakdown of energy consumption by major fuel and usage type. As shown in Table 1, ventilation, cooling, and lighting are the most electricity-intensive activities, whereas the main usage of natural gas is space heating. Inpatient centers, which form 57% of the total area of healthcare systems, utilize 76.5% of total energy in this sector.
Similar findings are concluded in the literature studies. Teke and Timur (2014) also determined that HVAC systems are the major consumers of electrical energy consumption in hospitals [19]. Similarly, [4] showed that space heating and cooling are major consumers of energy in hospitals. Air and space heating in UK hospitals consumed 44% of total energy [12]. In India, HVAC systems are also major consumers of electricity, followed by lighting and water pumps (their electricity consumption accounts for 30–65%, 30–40%, and 10–12%, respectively) [14]. In Thailand, HVAC was responsible for 51.36% of total energy consumption in 210 understudy hospitals [8]. The energy consumption by end-use type in billion kWh is shown in Table 1. The major fuel consumption breakdown by end-use is depicted in Figure 2.
To bring the consumption data in scale, Table 2 elaborates the energy intensity per usage and fuel type, worker, and building in kWh/m2. As expected, total energy intensity in inpatient systems is significantly higher (2.4 times more) than that of outpatient systems. In outpatient facilities, space and water heating as well as cooling have the highest intensity per square foot. On the other hand, space heating and ventilation form the maximum intensities in outpatient centers. Energy consumption intensity is shown in Table 2.
Energy consumption charges constitute a significant portion of operating expenditures in healthcare facilities. Total energy expenditures and their intensity are provided in Table 3. Electricity accounts for 69% and 85% of total energy expenditures in inpatient and outpatient facilities, respectively. The energy cost density values conclude inpatient facilities are approximately 86% more expensive than outpatient centers per square foot. The energy cost intensity is presented in Table 3.
The analysis of the latest data reveals that, from 2003 to 2012, the number of buildings and the total area in healthcare increased by 22% and 31%, respectively. This growth resulted in a 21% increase in total energy usage and a 76% surge in energy expenditures. This growth rate necessitates analyzing energy-based data in the healthcare sector.

Energy Data in Hospitals

Large hospitals, constituting 47% of the total area in healthcare facilities, are responsible for 64% of total energy consumption in this sector. Hospitals, due to the nature of their work and running on a 24 h basis, have higher energy intensity per square foot than any other building in the commercial sector [1]. In the latest report of EIA, large hospitals had a total area of 1958 million square meters throughout 3040 buildings (2.2% of total commercial buildings area) and used 134.2 billion kWh of energy (6.6% of major fuel consumption in commercial buildings). This is equivalent to 16.29 million dollars of expenses.
Natural gas (63 billion kWh) and electricity (57 billion kWh) are the major types of energy consumed in hospitals. Natural gas is used mainly for space and water heating and cooking. Electricity is mostly used for cooling purposes (92% of buildings). A hospital’s average annual energy intensity is 738.5 kWh/m2 or 44.2 million kWh/building. A typical office building, by comparison, has an annual energy intensity of 246 kWh/m2 [20]. Around 61% to 79% of a hospital’s energy consumption is due to lighting, heating, cooling, and hot water production [21]. 
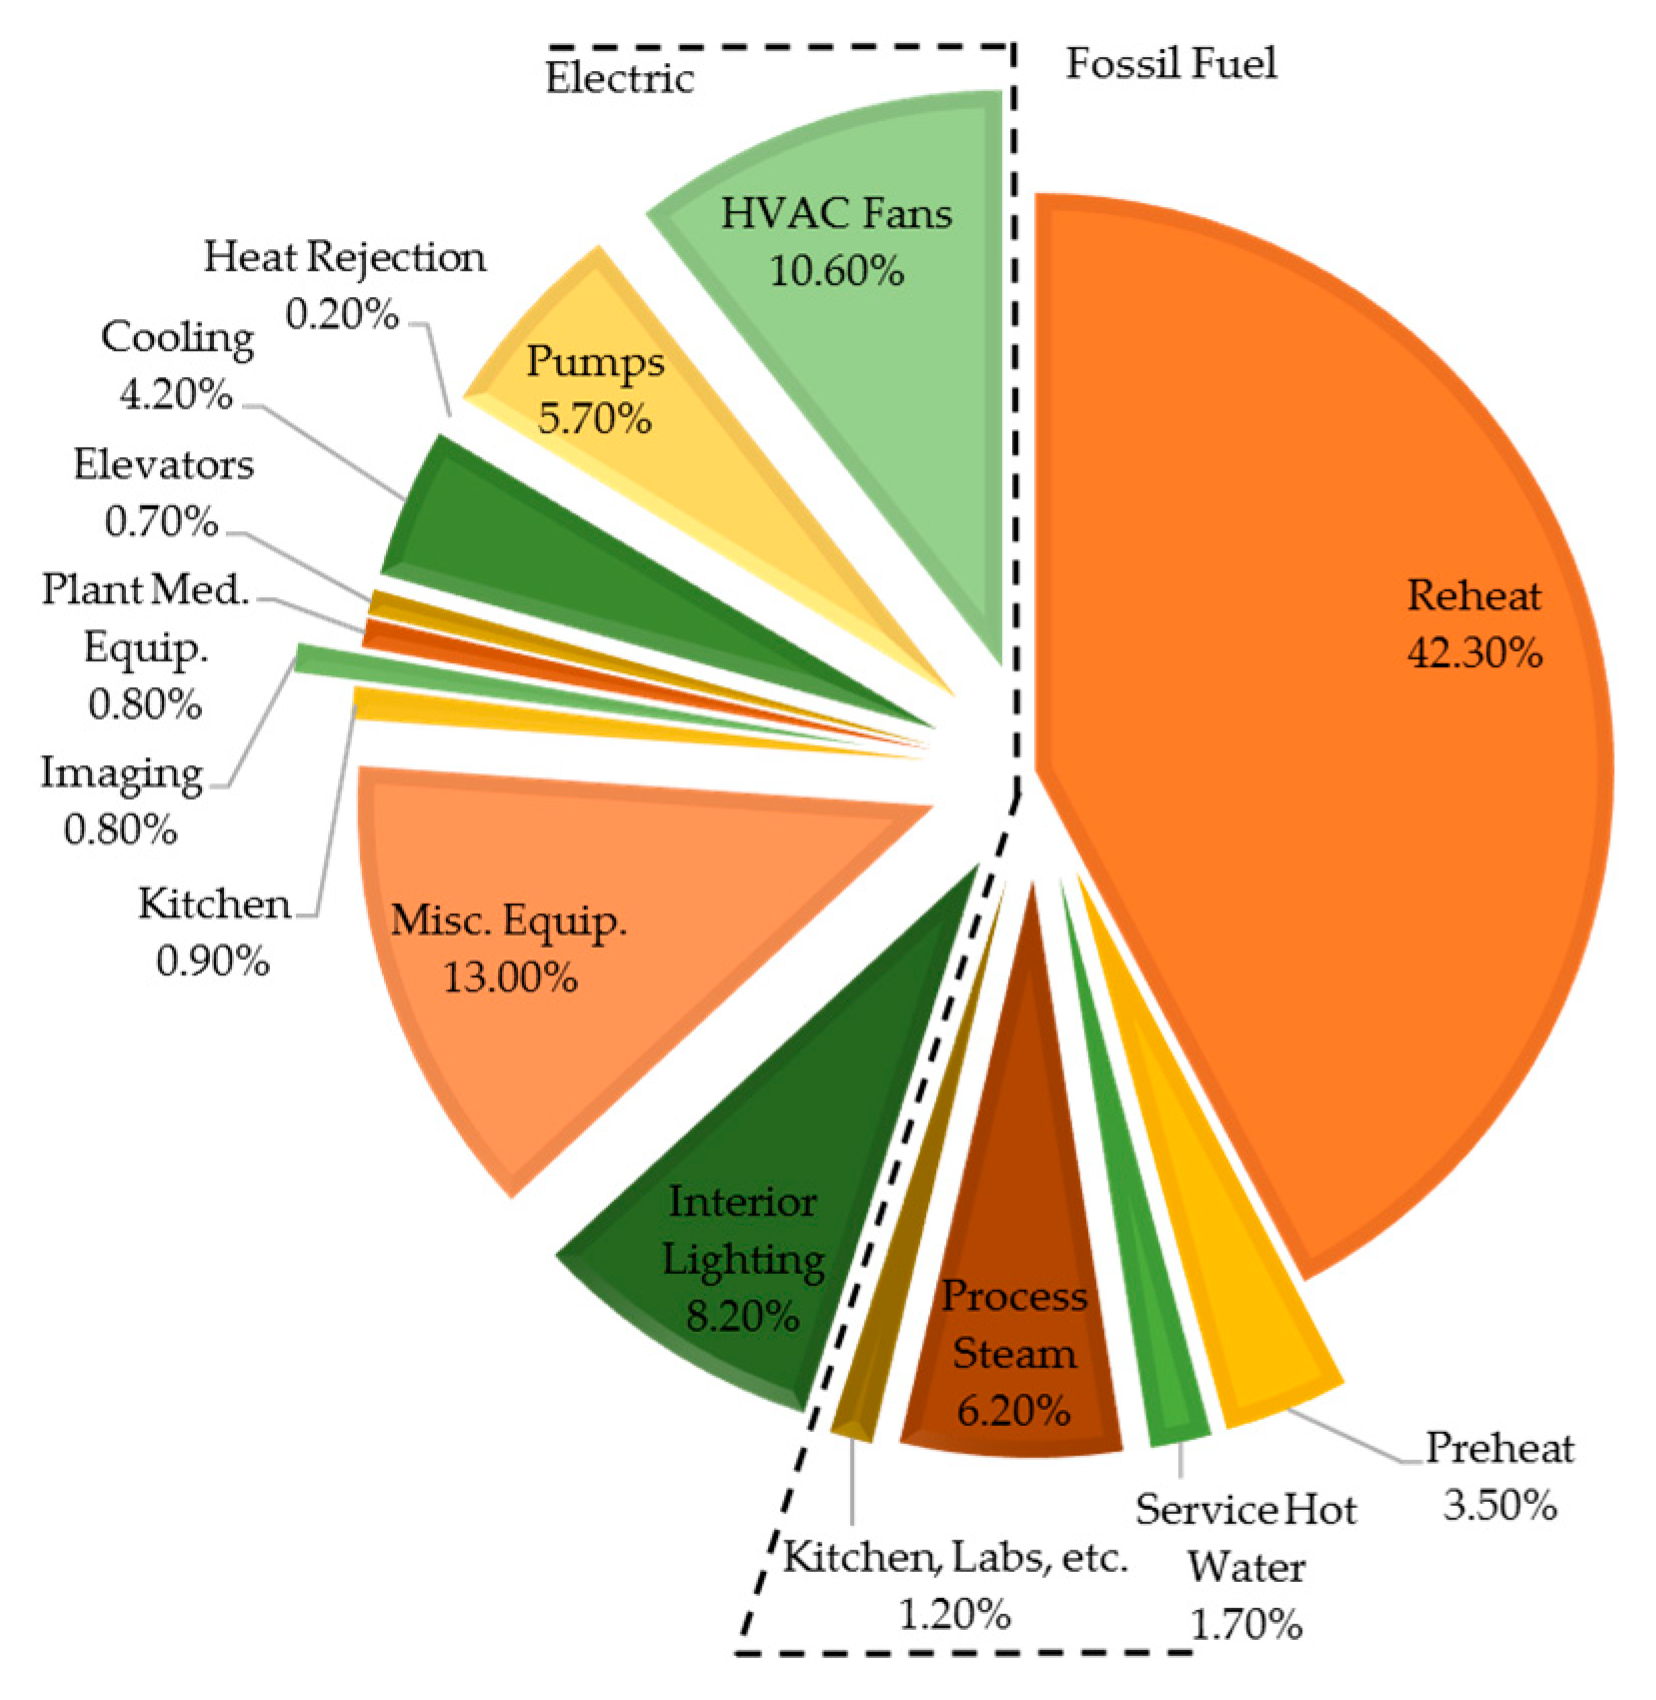
Figure 3 provides a breakdown of energy consumption by fuel and usage type in an energy evaluation study for a medical center in the U.S. [22]. It was shown that, the reheat system was the largest source of energy draw whereas the HVAC units were consuming 10.60% of the total energy for that facility. Hospital design requirements and the current practice of relying on relatively old standards in this sector contribute to large energy requirements by HVAC systems in U.S. hospitals. As a result of this, hospitals over-ventilate most of their spaces [23].
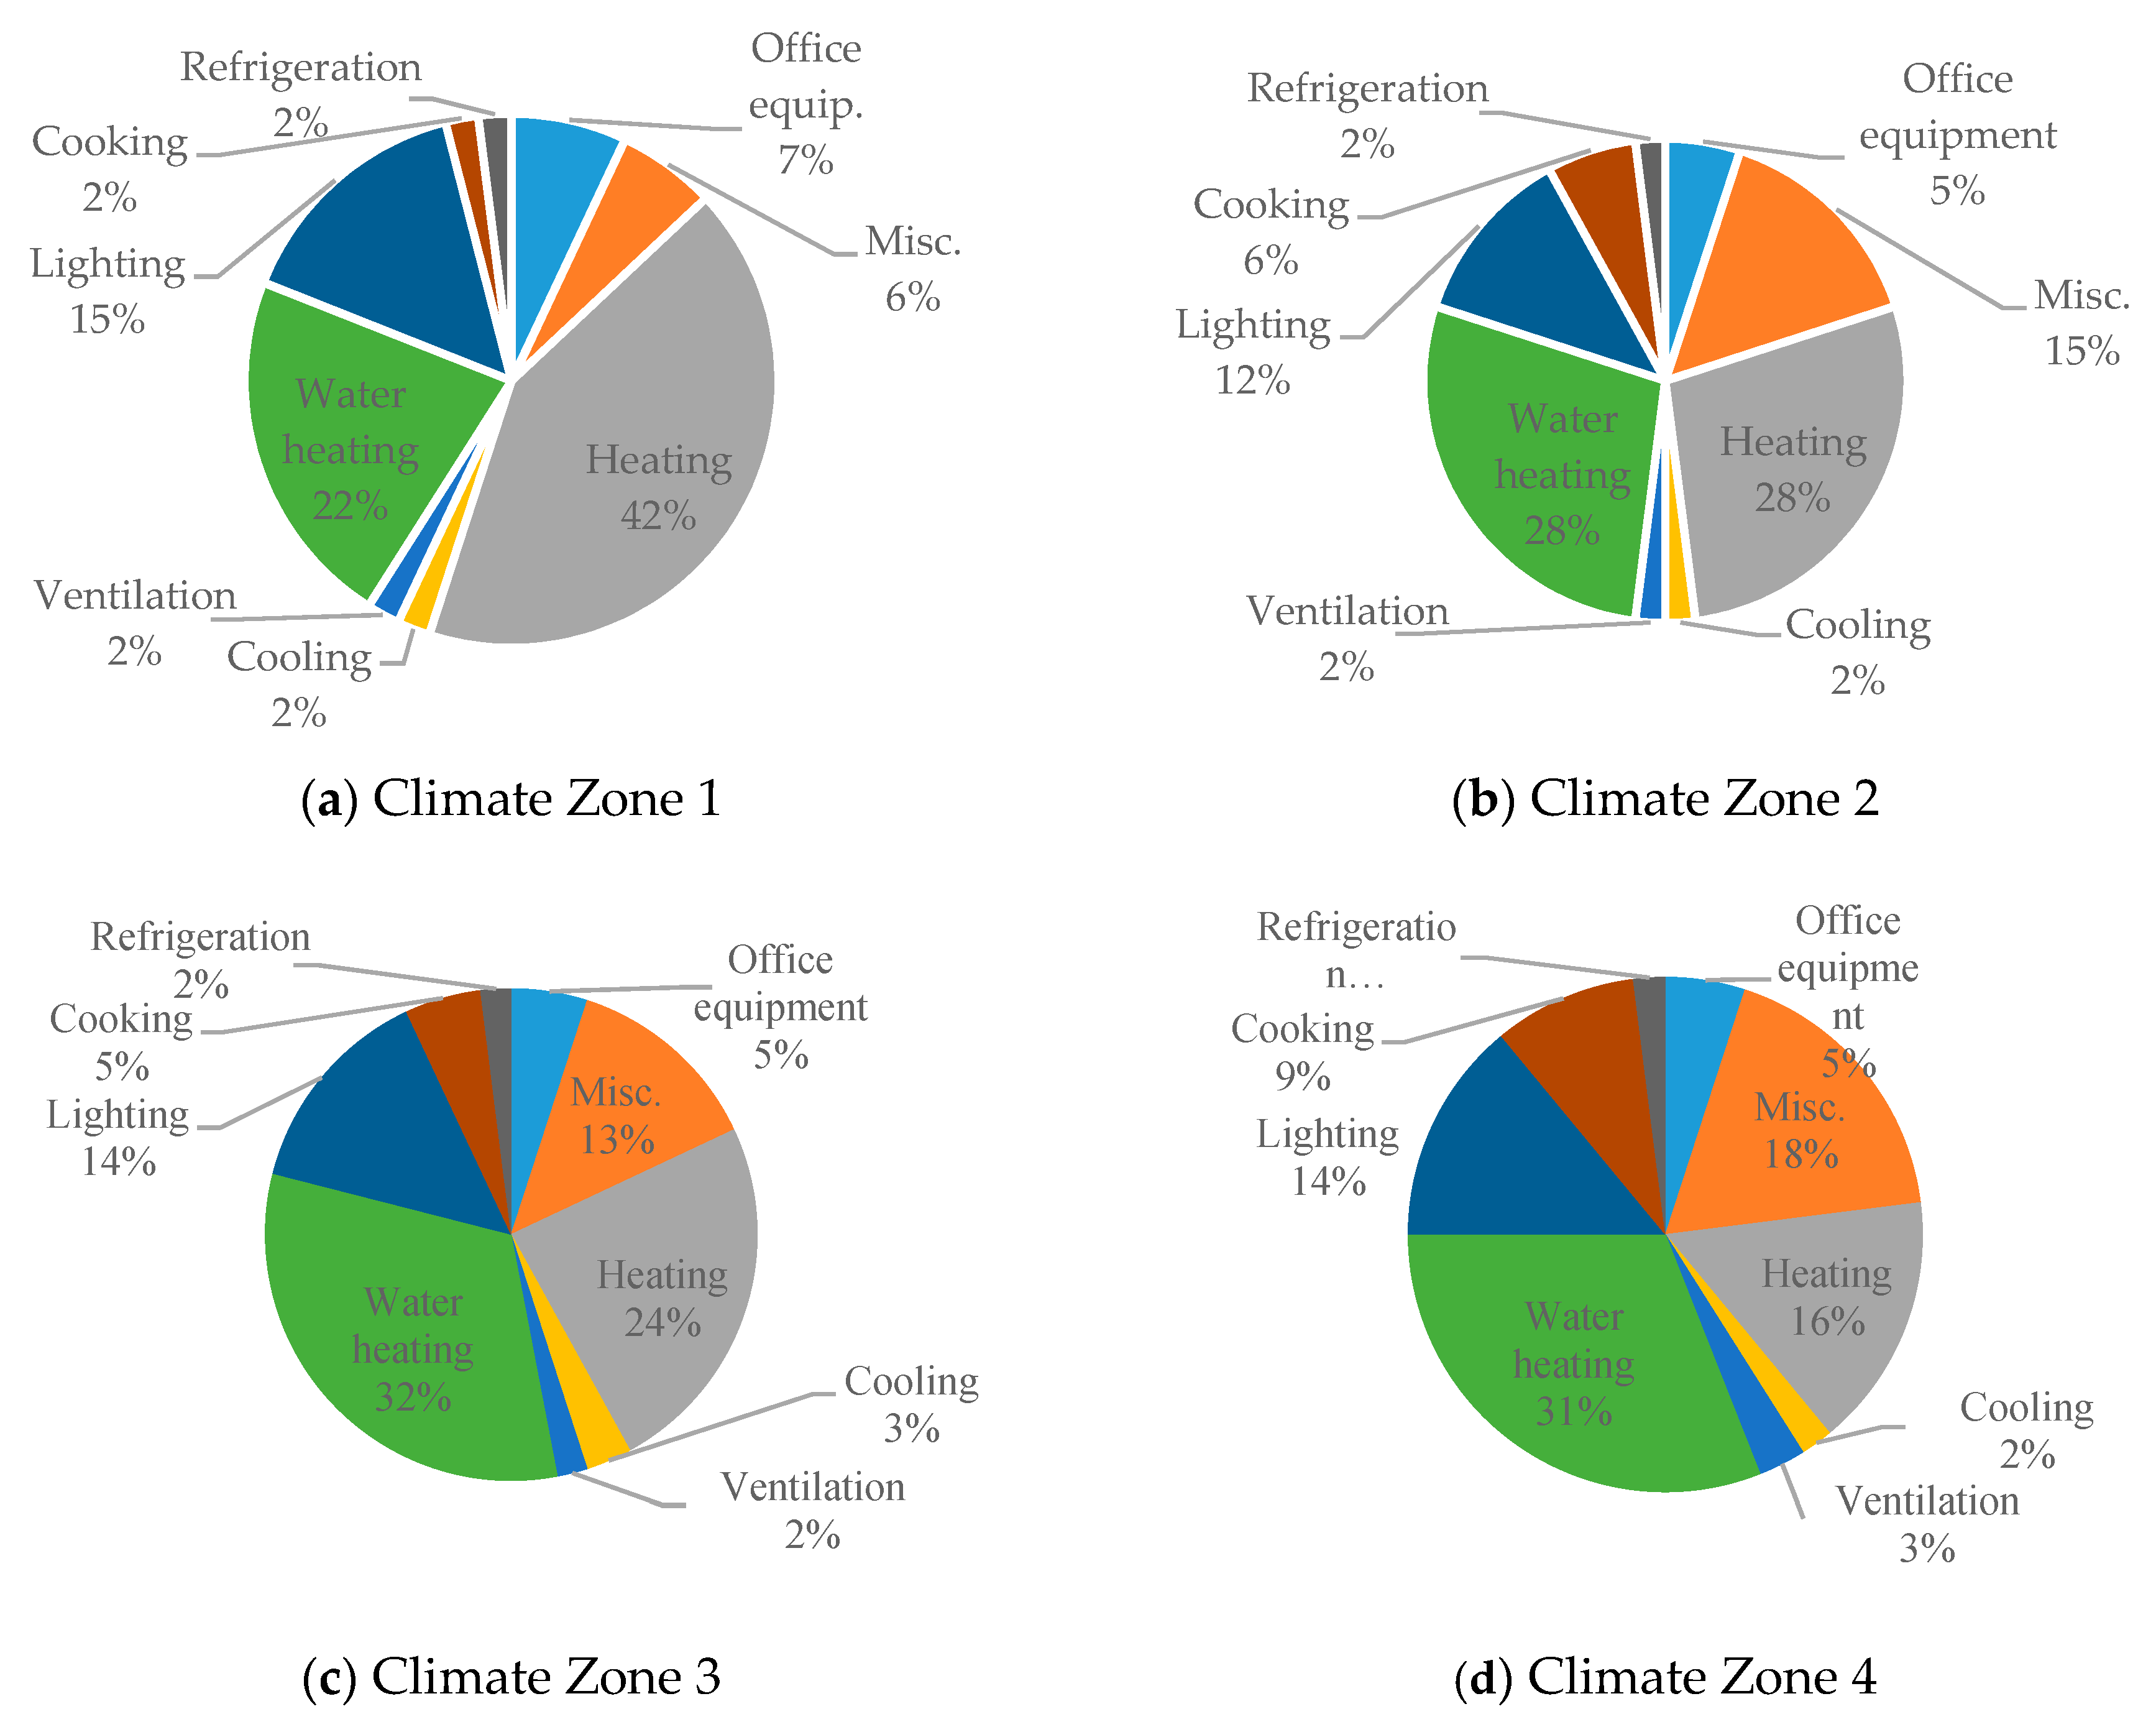
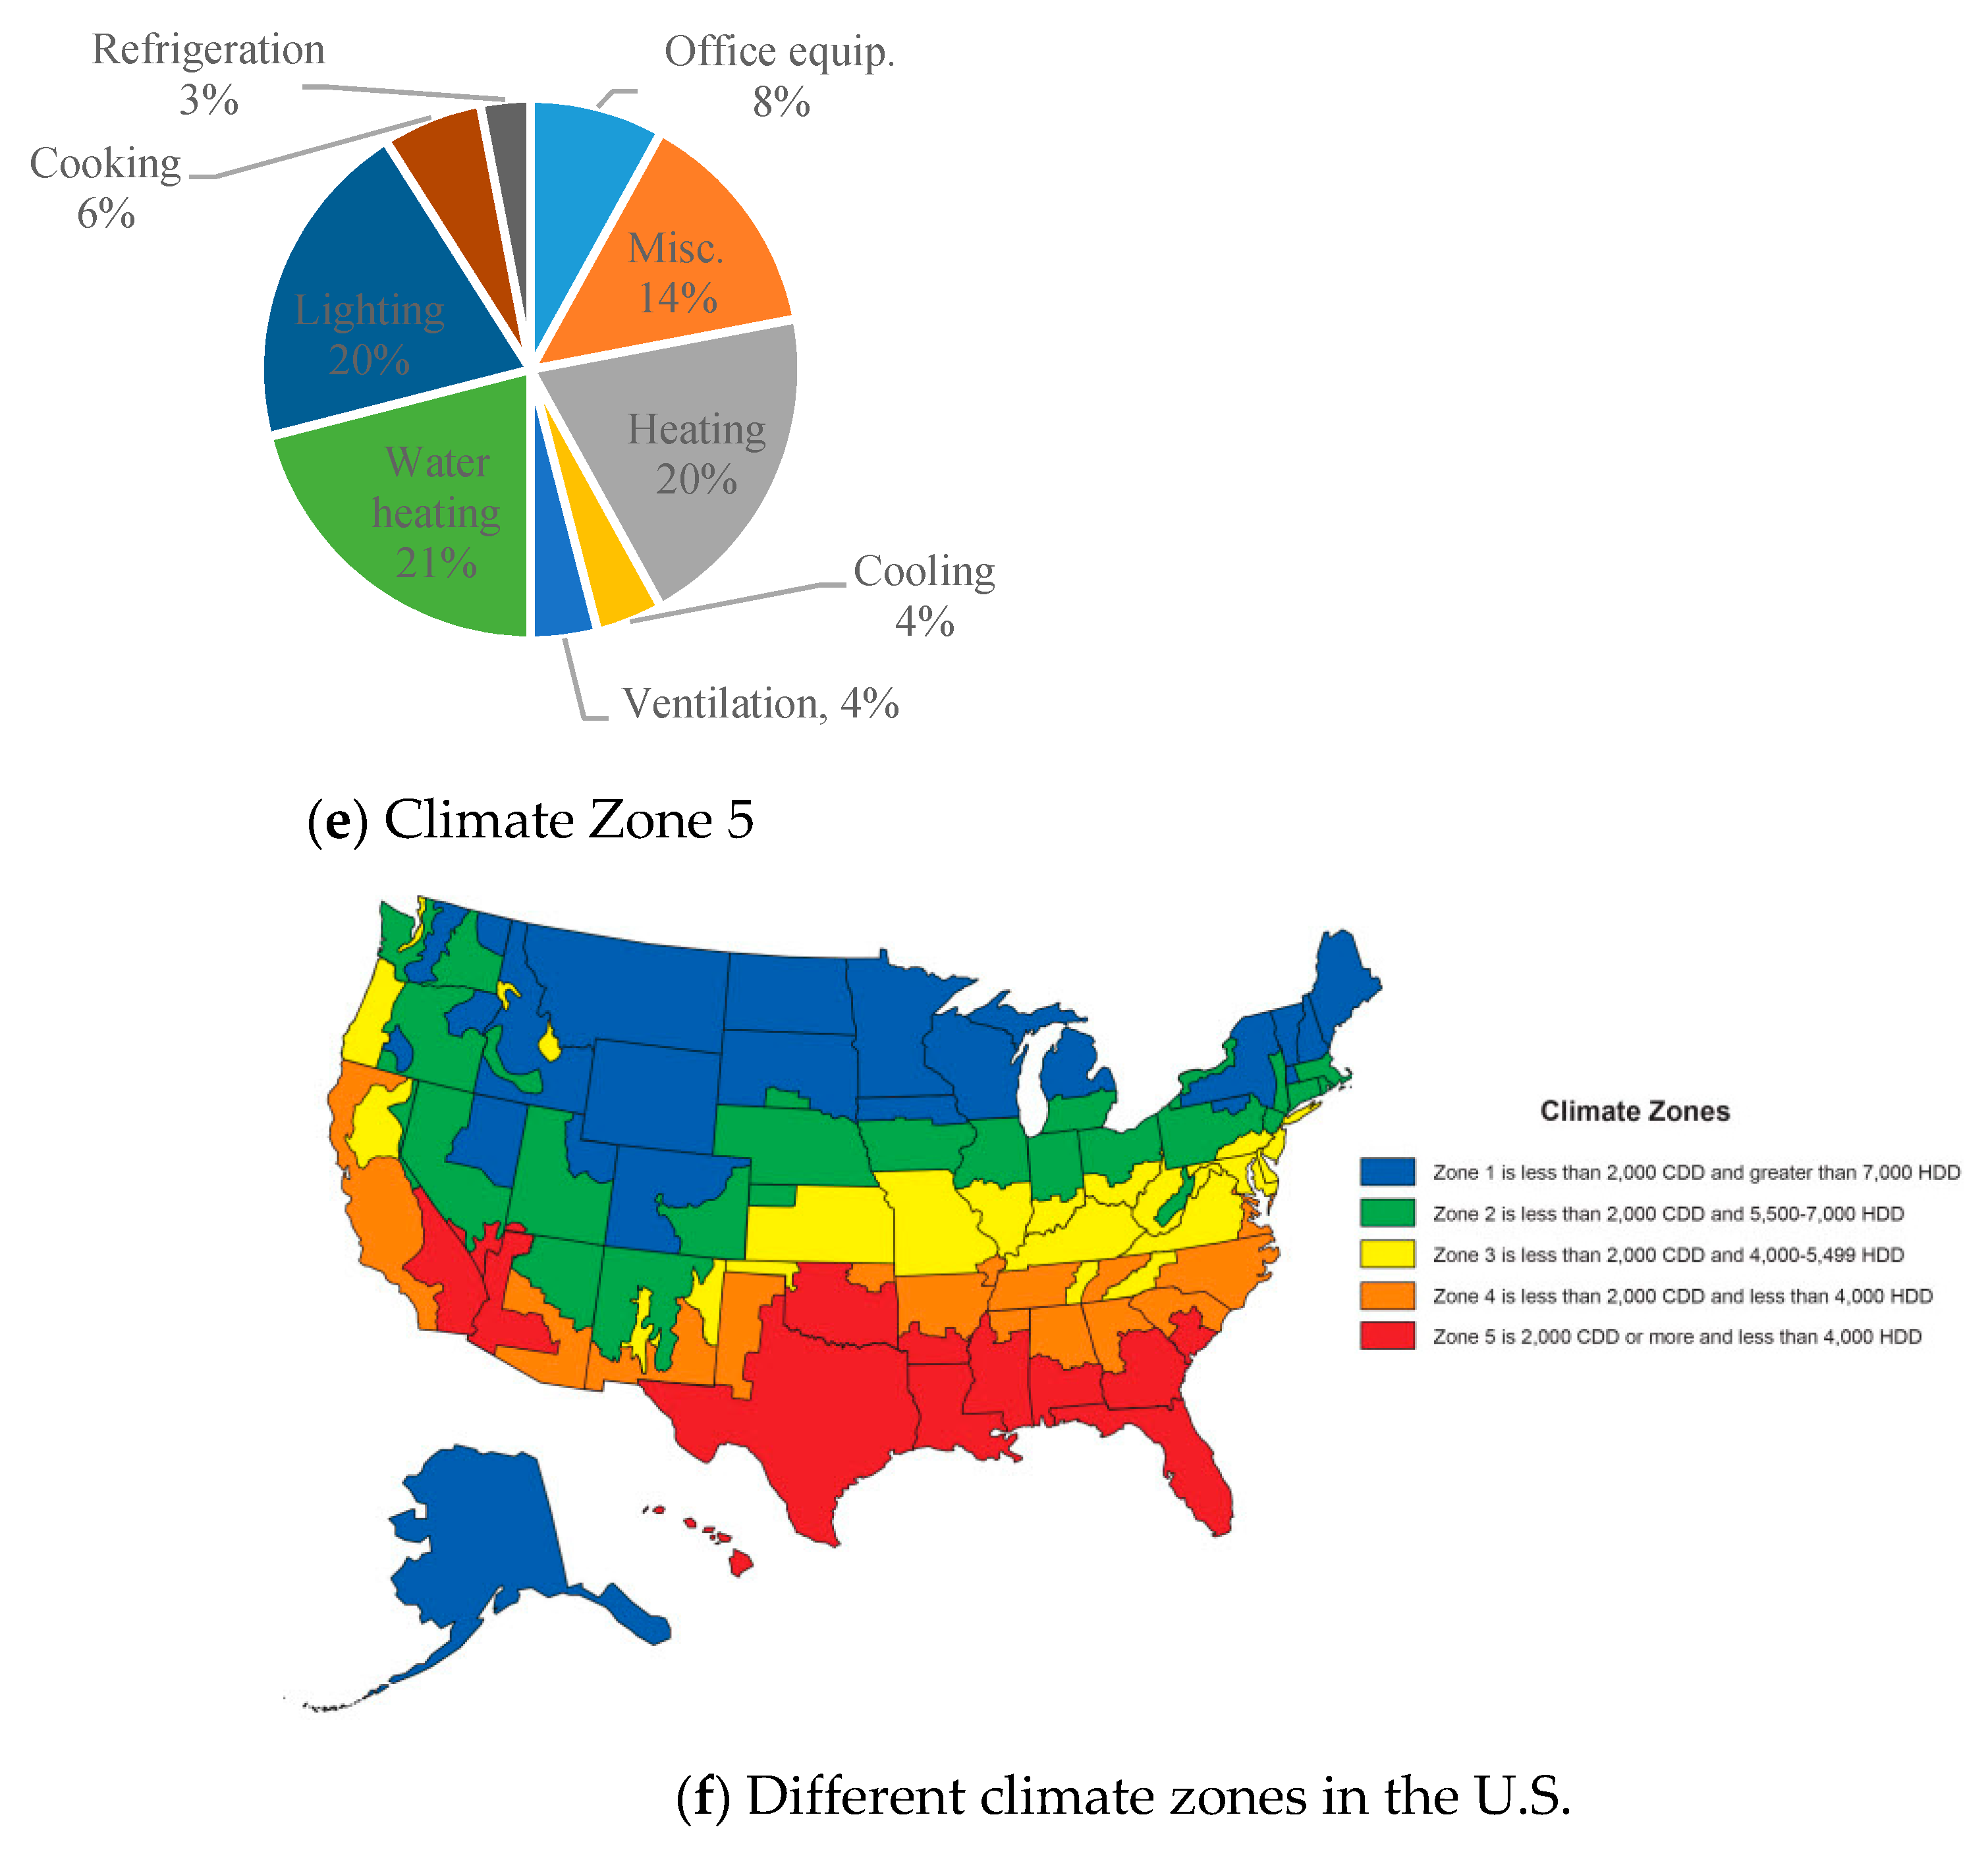
The annual energy consumption of hospitals for five U.S. climate zones with different cooling degree days (CDD) and heating degrees days (HDD) is shown in Figure 4. Zone 1 represents the very cold states, and Zone 5 represents the very hot states in the country. Zone 2 and Zone 4 represent 53% of the total number of hospitals and 54% of the total hospital area in the country. Zones 1, 3, and 5 accommodate 17%, 16%, and 13% of the total number of hospital buildings and 17%, 13%, and 18% of the total hospital area, respectively. Table 4 presents a detailed overview of the operational details of hospitals, and it includes data on the total area, the number of workers, and the number of beds in each zone.
Geographic location has a significant impact on heating energy, as shown in Figure 4. In Zone 1 climates, it makes up 42% of energy usage compared to Zone 5 climates where it only makes up 16% of total energy usage. Alternatively, there is not a significant dependence on climate zone for the energy usage used for ventilation, lighting, and cooling energy consumption. Table 5 shows the energy consumption intensities by energy source and climate zone.
As shown in Table 5, the largest energy consumption occurs in Zones 2 and 4. A significant part of the reason for this is that these zones also include the most hospitals and areas of hospitals. This table also shows that the highest intensity of natural gas consumption occurs in colder states. This makes sense, considering natural gas is mainly used for heating purposes. Electricity is used for all other activities (including cooling and equipment operations), and it is difficult to make any conclusions based on the variance of its intensity over the variety of climate zones. The following figure (Figure 4) shows the hospitals’ annual energy consumption breakdown for the five climate zones [1].

4. Case Studies

This section provides a summary of two published case studies in the U.S. and compares it with European and Canadian hospitals. There is a significant variation in energy consumption at hospitals in different locations. For example, according to the Center of Analysis and Dissemination of Demonstrated Energy Technology (CADDET) report in 1997, Australian hospitals consumed almost six times more electricity than those of Italy [24]. As another example, international hospitals, on average, use 50% less energy than a typical hospital in the United States. Climatic differences, energy unit price, age, and sophistication level of the systems can contribute to these differences [24].

4.1. Texas Hospitals Case Study

Energy data of 35 hospitals in the state of Texas were analyzed in a study published in 1998 [25]. Table 6 presents a summary of this analysis. Hospitals were spread out over the state with an average size of 13,313 m2. The collected data included monthly electrical energy and natural gas consumption and cost and total energy costs. As shown in Table 6, the annual electricity usage intensity ranged from 126 kWh/m2 to 666.3 kWh/m2, whereas the intensity of natural gas consumption was from 82.6 kWh/m2 to 1319.5 kWh/m2. Total annual energy cost ranged from $8.8/m2 to $42/m2, and the annual energy intensity varied from 316 kWh/m2 to 1593 kWh/m2, averaging 764 kWh/m2. The average energy intensity in these hospitals is comparable to the average intensity of 738.5 kWh/m2 at the national level. The detailed information on the energy intensity of each of these hospitals is given in Table A1 in the Appendix A. The vast majority of the state of Texas is located in Zone 5 according to Figure 4, and the reported major fuel intensity in this zone is 640.7 kWh/m2. This shows the energy intensity in this state is higher than the average intensity of its zone. The following Table 6 shows the annual energy data for Texas hospitals.

4.2. California Hospitals Case Study

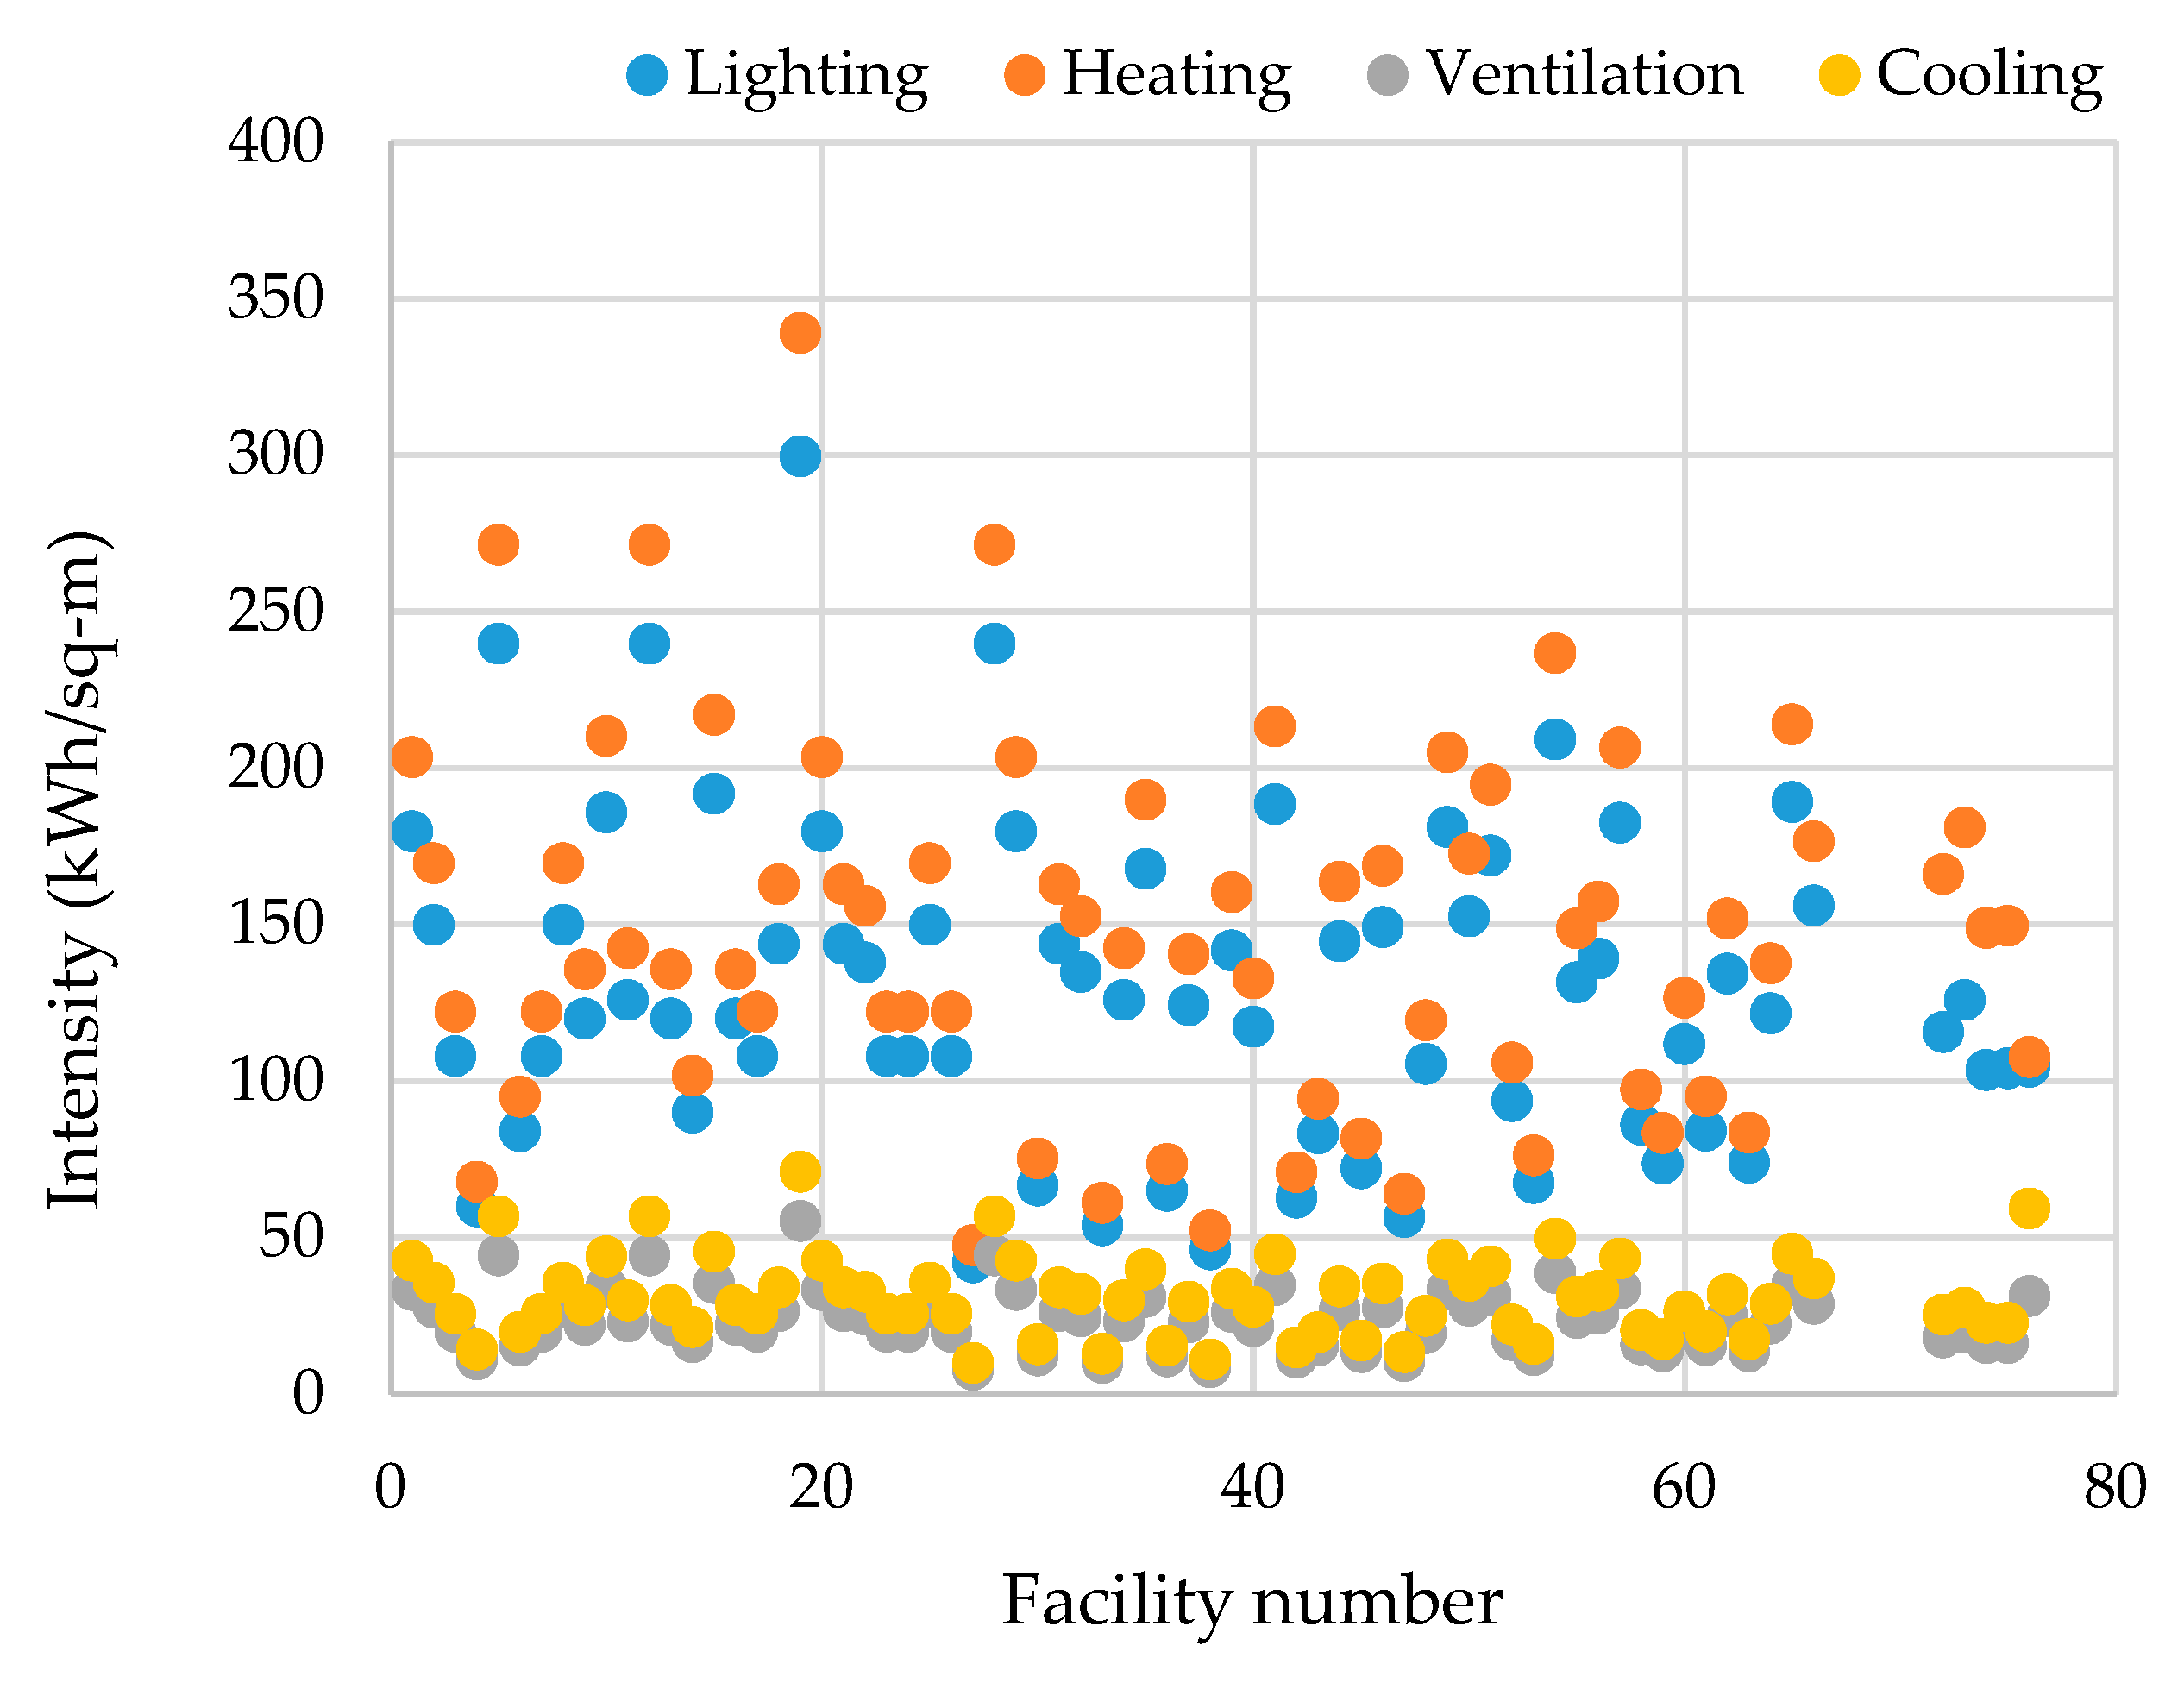
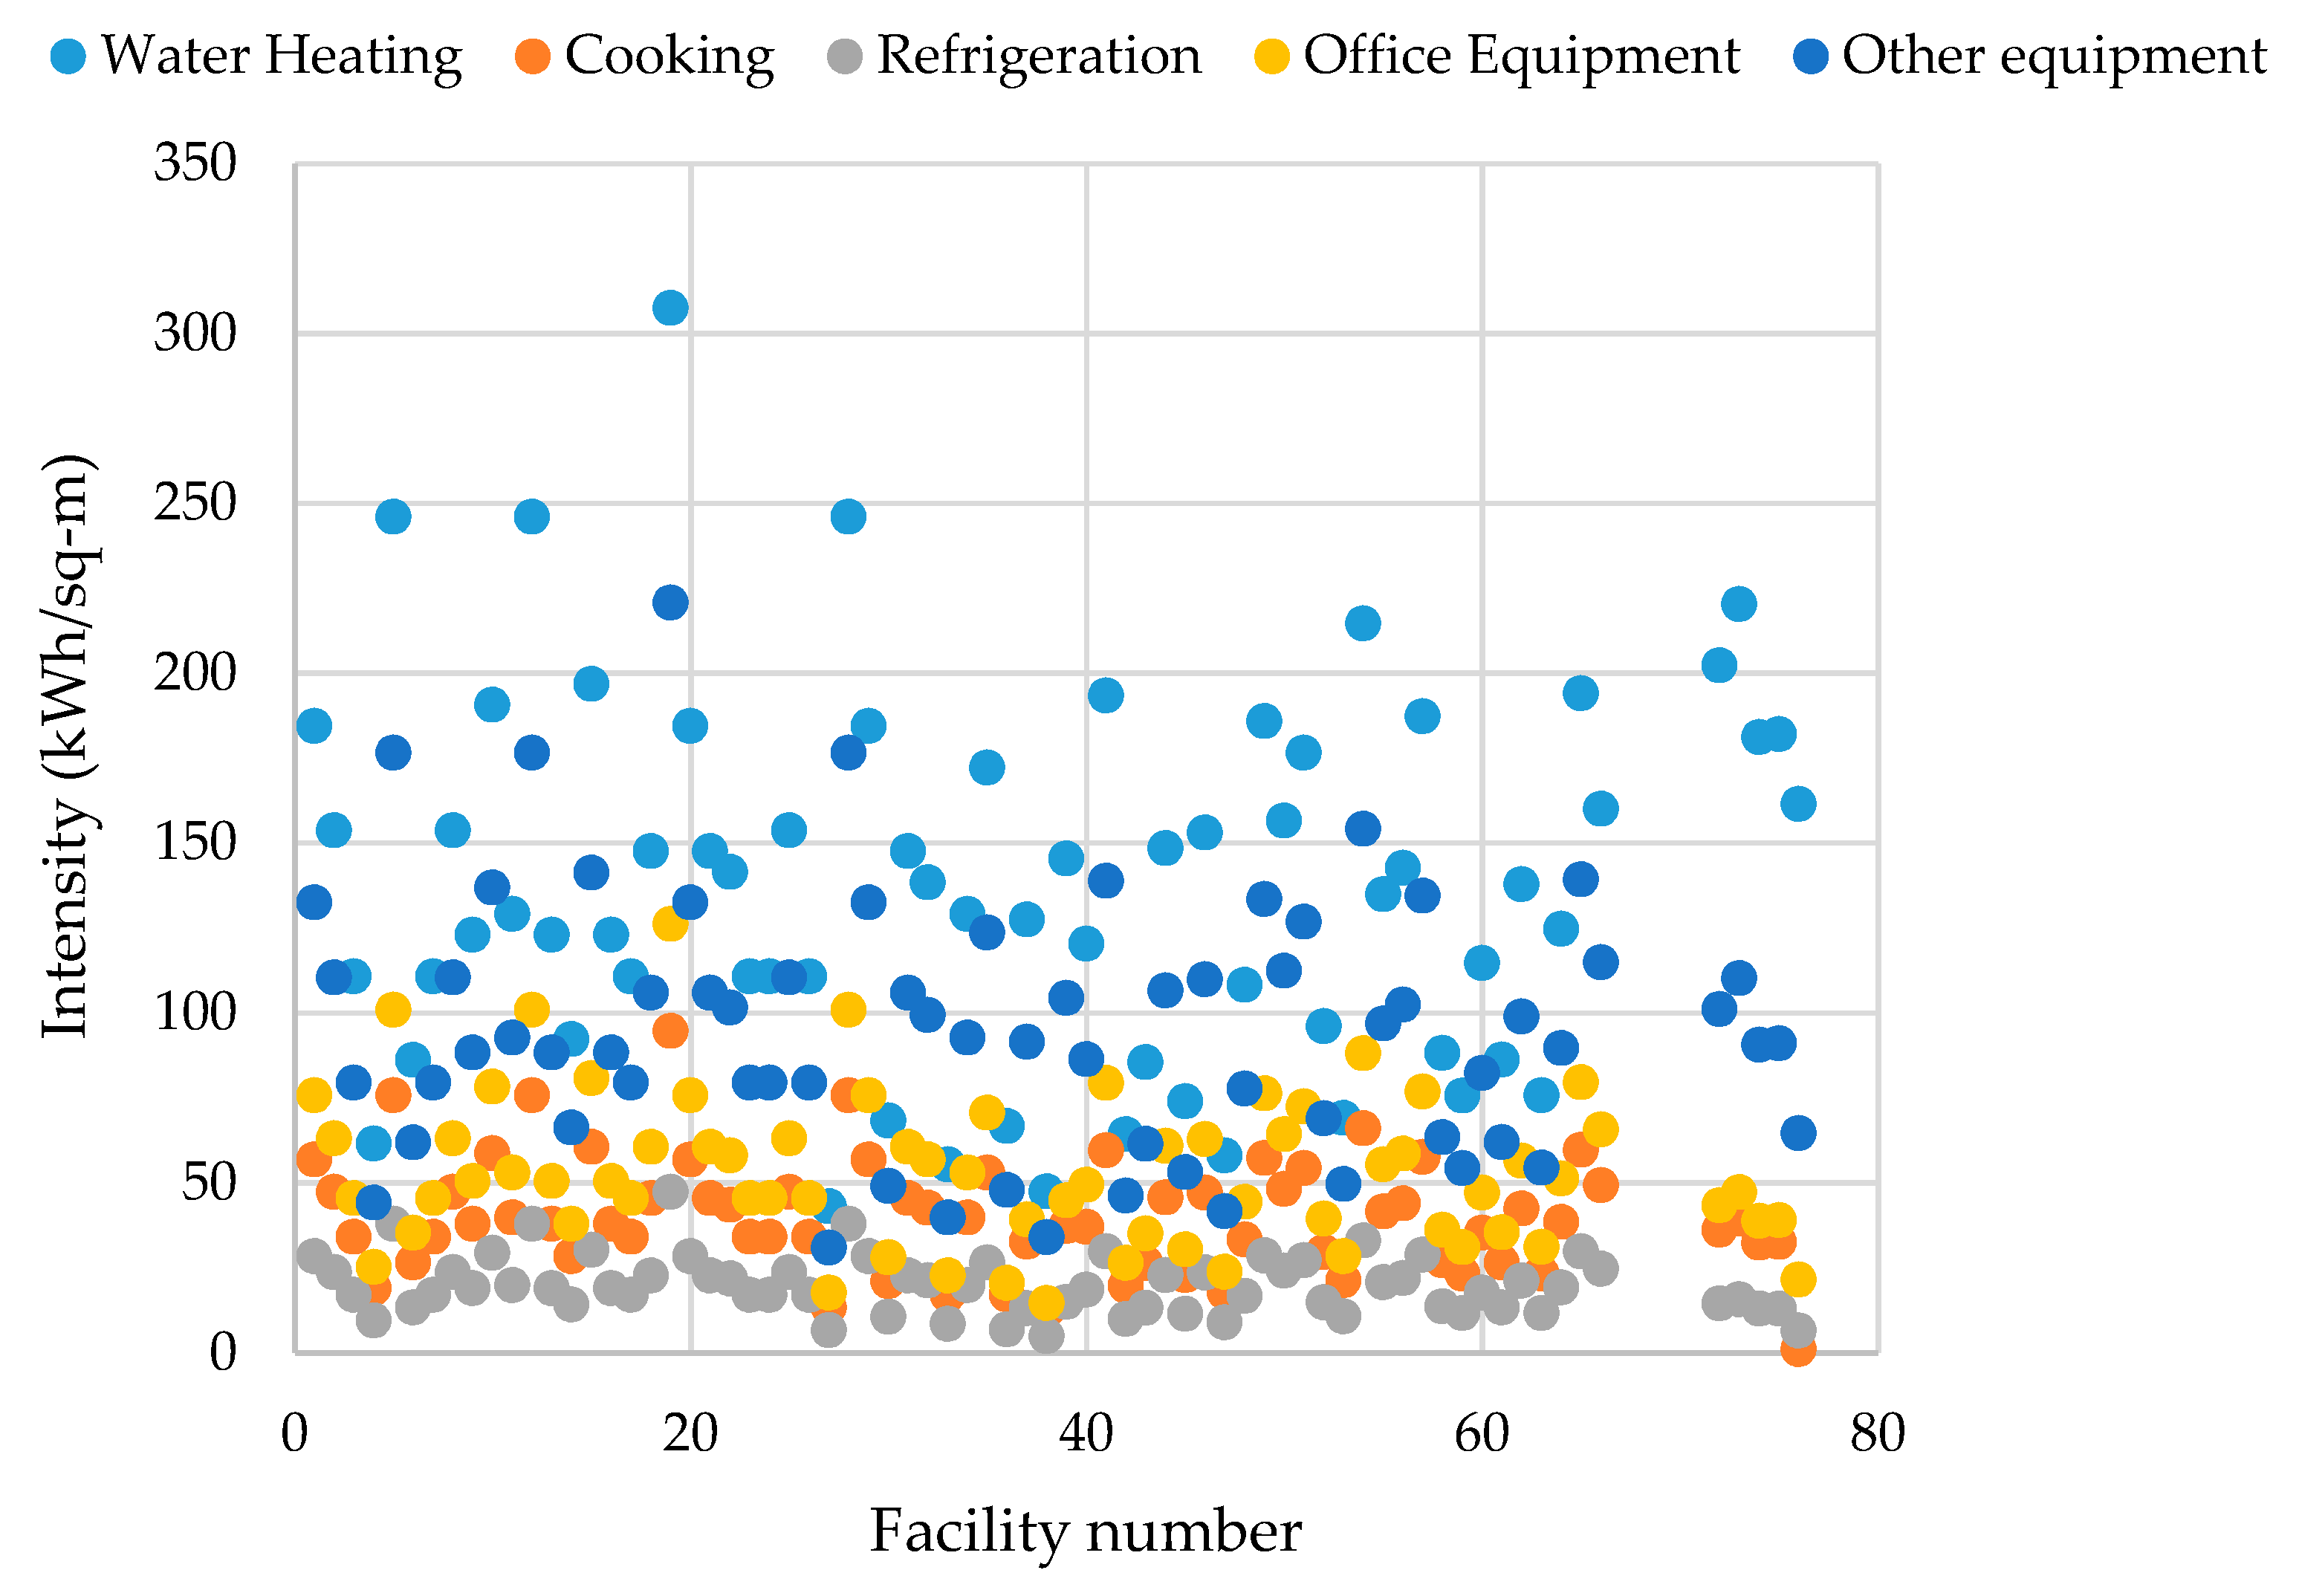
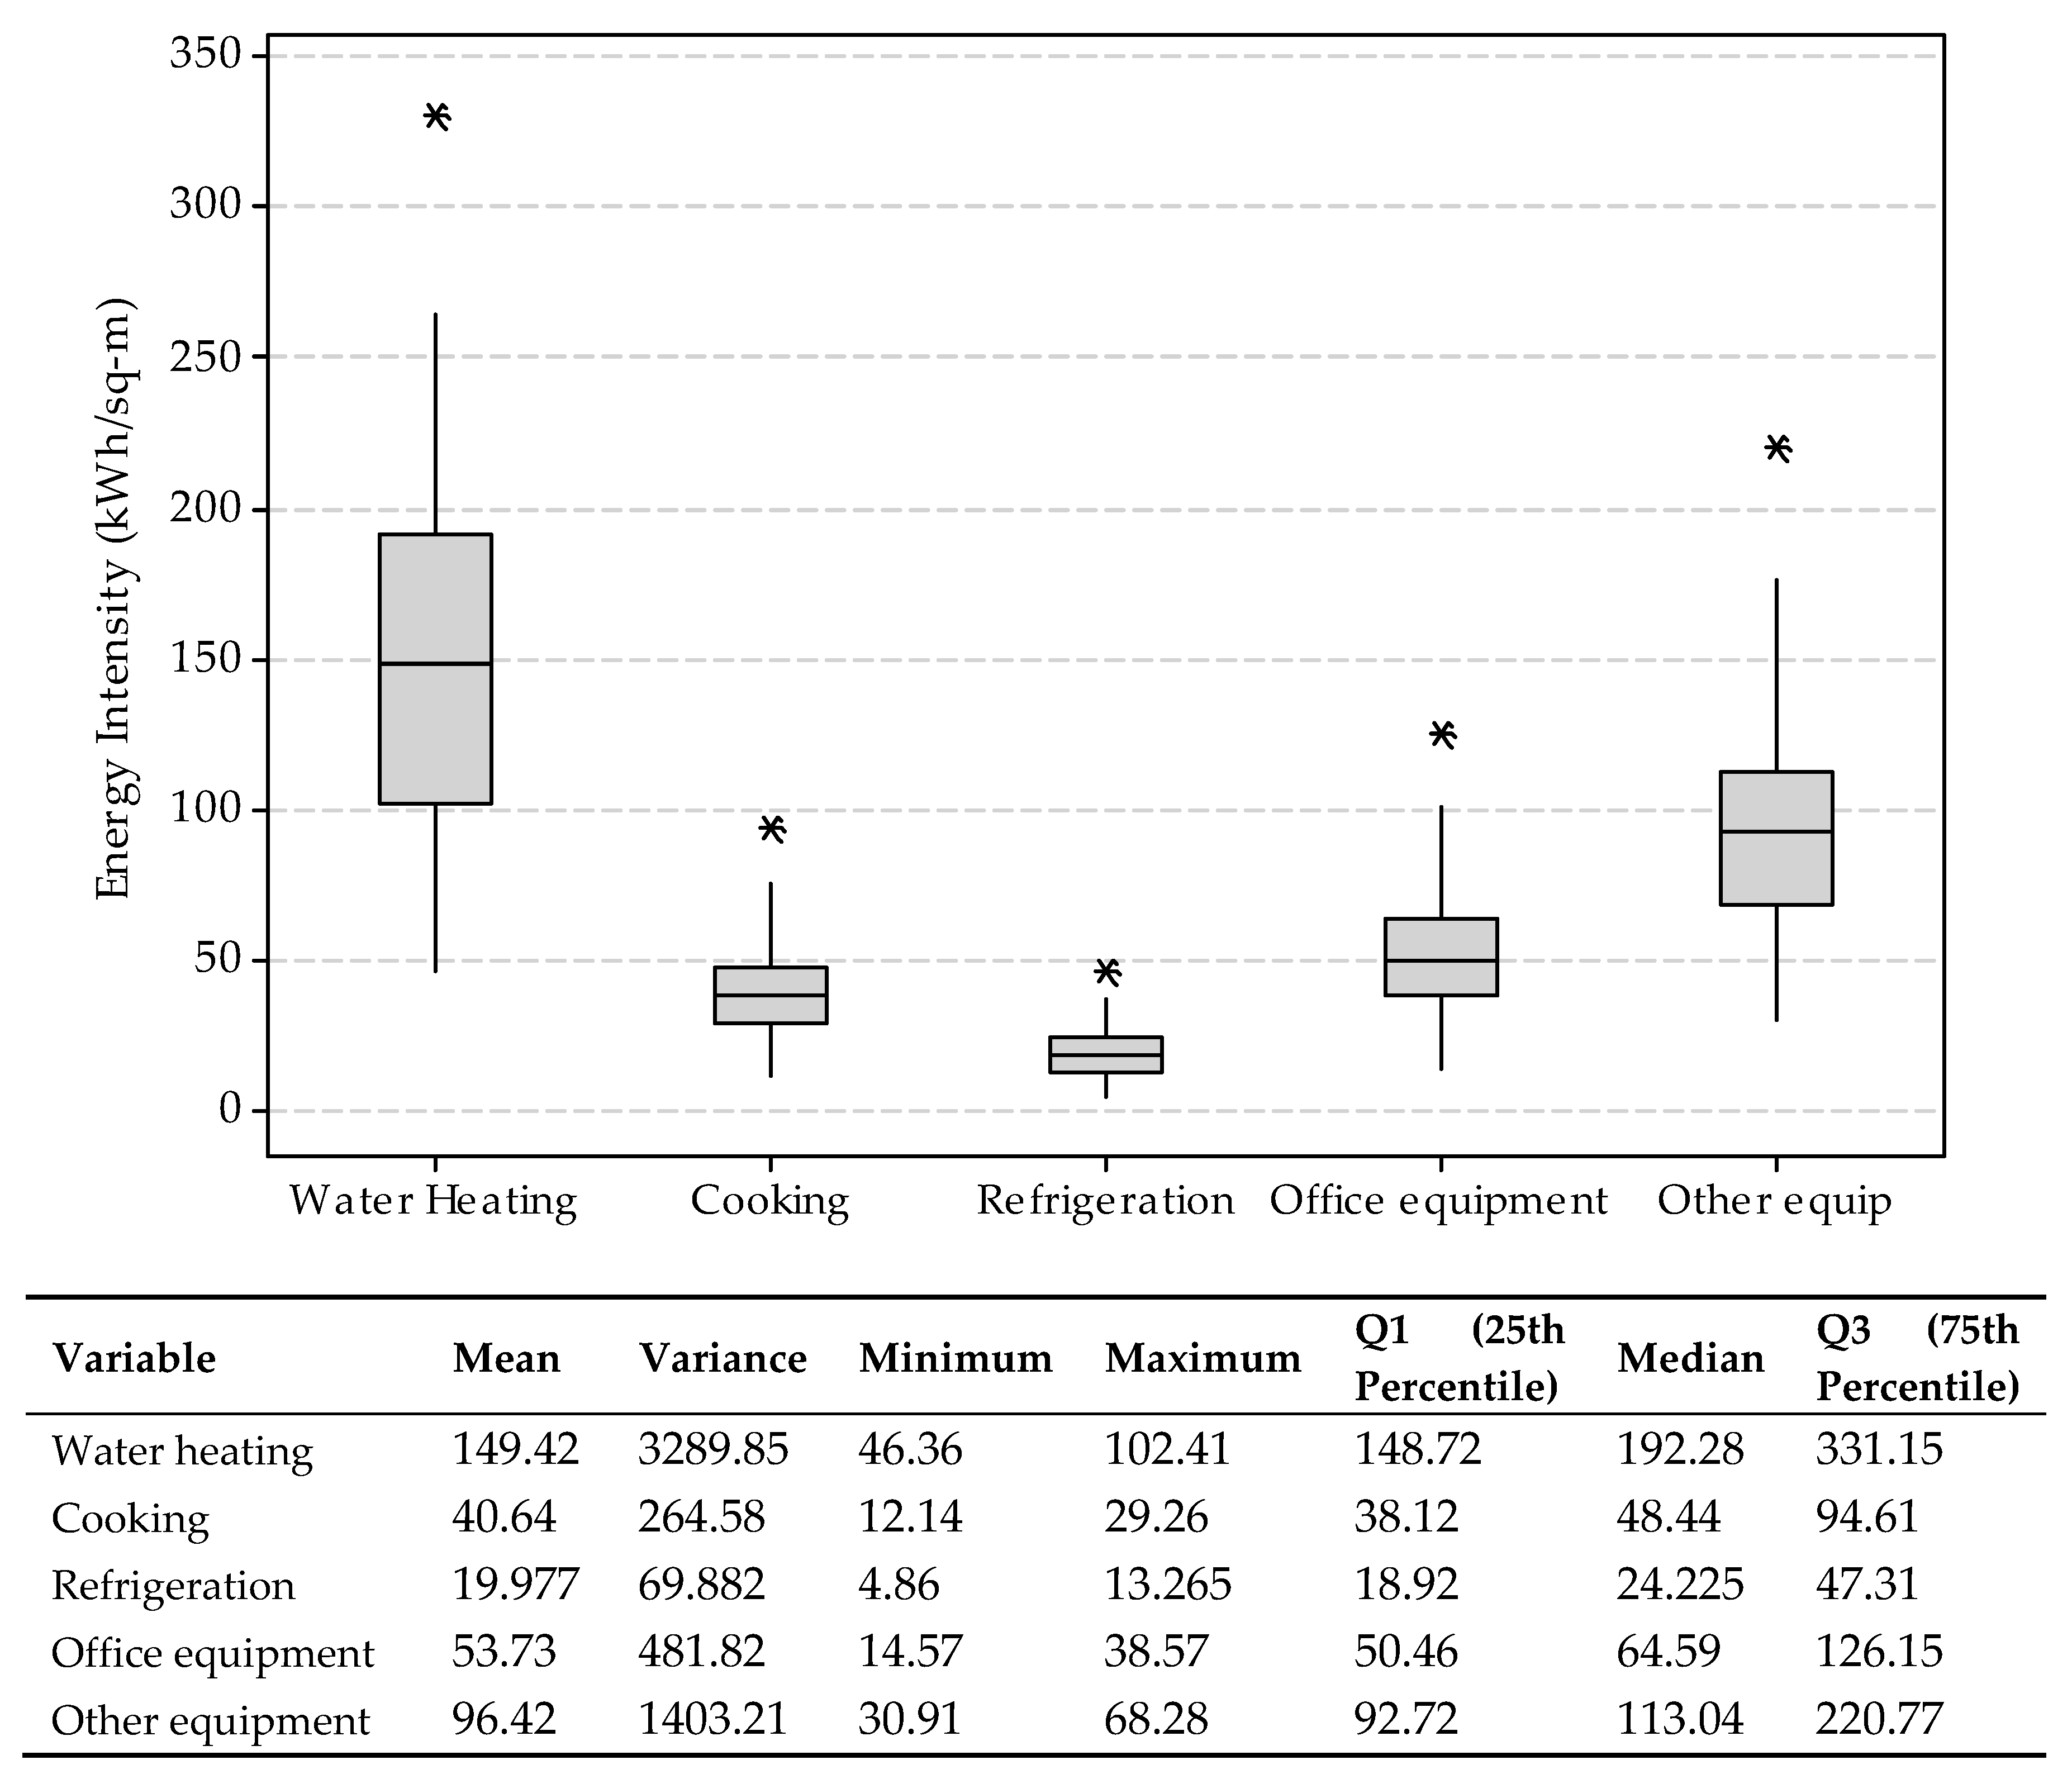
The Lawrence Berkeley Laboratory studied end-use load shapes and energy-use intensities of four types of commercial sector buildings: schools, colleges, healthcare systems, and lodging [26]. The end uses included cooling, ventilation, lighting (indoor and outdoor), cooking, refrigeration, and equipment. Their methodology was to reconcile the initial end-use load shape estimations with measured load data. The hospitals in their study accounted for 34% of healthcare buildings and formed 83% of floor area and a greater fraction of energy use. Table 7 summarizes the annual energy intensities of these four types of buildings. As shown in Table 7, the energy consumption intensity of healthcare facilities is significantly higher than the other types of buildings. The average total annual energy consumption intensity of the reported facilities was equal to 258.3 kWh/m2. According to Figure 4, the State of California consists of different climate zones, where Zones 4 and 5 form the majority of the state. The reported hospitals have significantly lower energy consumption intensity values compared to other facilities in these zones.

4.3. Healthcare Energy Data in Different Countries

This section provides examples of energy intensity values in healthcare facilities in European countries and can be used as a basis to evaluate the energy consumption of similar facilities in the United States. As explained before, various factors, including geographical situation, facility size, and operating conditions, influence the energy consumption of healthcare facilities. However, no single metric can address all these parameters. Therefore, as suggested in most of the studies, energy intensity per unit of area is used as a key metric to demonstrate energy performance as a function of facility size.
In Europe, healthcare facilities with a total area of 453.2 million m2 account for 6.5% of total non-residential (NR) areas according to the latest data available from the European Commission [27]. Total energy consumption in the NR sector is 141.22 million tons of oil equivalent (Mtoe), which reflects a 28.5% increase in comparison to 1995. Hospitals constitute 10% of total energy usage in the NR sector with an annual energy intensity of 252–434 kWh/m2, which is significantly higher than the overall energy intensity in the NR sector (280 kWh/m2) [28]. A comparison of energy intensity of hospitals and other health facilities in Greece, Scotland, Poland, Malaysia, Spain, and Thailand was presented in [29].
In an older study by the CADDET in 1997, healthcare facilities’ annual energy intensity was analyzed in the U.S., Canada, and European countries such as the UK, Sweden, Switzerland, Australia, Greece, the Netherlands, and Germany [24]. The analysis concluded a broad variation in electrical energy consumption ranging from 60.88 kWh/m2 for Switzerland’s hospitals to 339 kWh/m2 in Canadian hospitals, with a total average of 145 kWh/m2. Thermal energy consumption ranged from 168 kWh/m2 in Sweden to 690 kWh/m2 in the United States. In another study in Canada, the median site energy consumption intensity of hospitals was reported to be 741.7 kWh/m2 [30]. In [24], the authors discussed that there might be no clear justification for varying levels of energy consumption in different countries. The U.S. hospitals’ average annual energy intensity is 738.5 kWh/m2, which is higher than similar reported numbers in the European countries. Infrastructure, design standards, consumption culture, sophistication level of the equipment, and geographical conditions can all contribute to this difference. Table 8 summarizes the energy consumption intensity of healthcare facilities in various countries.

5. Non-Process and Process Energy Analysis in the United States Healthcare Facilities

5.1. Non-Process Energy Analysis

Non-process energy, which includes heating, cooling, lighting, and ventilation [31], has been collected and analyzed in 71 healthcare facilities in the United States. Table A2 in the Appendix A provides a detailed overview of the collection process and non-process energy data in different healthcare facilities. Figure 5 illustrates the annual non-process energy intensity in these facilities, ranging from 6 kWh/m2 for ventilation to 315 kWh/m2 for heating. Figure 5 shows the healthcare facility’s annual non-process energy intensity.
To further analyze the distribution of annual non-process energy intensity, a boxplot was constructed for each category of non-process operations in 71 facilities and is presented in Figure 6. According to Figure 6, lighting and heating intensities have larger variations compared to the other categories. The annual energy intensity of lighting ranges from 41 kWh/m2 in dentist offices to 299 kWh/m2 in inpatient hospitals. Alternatively, the heating energy intensity ranges from 47 kWh/m2 to 339 kWh/m2 in inpatient hospitals. A similar analysis of other categories yields annual energy intensity ranges from 9.9 kWh/m2 to 670 kWh/m2 for cooling and from 7 kWh/m2 to 55 kWh/m2 for ventilation. The included table in Figure 6 presents a summary of the statistics for non-process energies.

5.2. Process Energy Analysis

The annual process energy intensity data for the discussed 71 healthcare facilities are shown in Figure 7. Process energy includes the energy required for cooking, refrigeration, water heating, and running a variety of types of equipment. The boxplot in Figure 8 shows that water heating energy intensity has the largest variability with a range from 43 to 307 kWh/m2. The minimum variation is recorded for refrigeration, which ranges from 4.3 to 47 kWh/m2. A detailed descriptive statistical analysis is provided in the attached table under Figure 8. The overall annual process energy intensity ranges from 1.1 kWh/m2 for cooking to 331 kWh/m2 for water heating in an inpatient hospital. Figure 8 shows the boxplot of annual process energy intensity (kWh/fm2) in healthcare facilities.

5.3. Annual Process and Non-Process Energy Intensity Comparison

To compare process and non-process energy in healthcare, a boxplot with a detailed descriptive statistical data analysis was constructed and is presented in Figure 9. The annual process energy intensity ranges from 114kWh/m2 in dentist offices to 819 kWh/m2 in inpatient hospitals, while the non-process energy ranges from 105.9 kWh/m2 to 756 kWh/m2 in inpatient hospitals. Figure 9 presents a comparison of the process and the non-process annual energy intensity in kWh/m2.

6. Discussion and Conclusions

This paper is the first study to compile and analyze energy data in healthcare facilities in the United States. In general, the energy analysis in this research includes fuel type, end-use, cost, and intensity data in healthcare systems and hospitals in the country. Energy consumption in the U.S. healthcare sector, and particularly in hospitals, is very high in comparison to other commercial sectors in the country or similar healthcare facilities in other countries. The number of healthcare buildings increased by 22% in 10 years since 2003, and this led to a 21% rise in energy consumption. During the same period, the number of inpatient facilities increased to 10,000 units (a 25% growth in number and area), which resulted in a 16% increase in overall major fuel consumption. Because facility size has such a large impact on energy consumption, energy intensities are calculated and used for comparisons. Energy intensity per unit of area in healthcare and inpatient facilities decreased by 8% and 7%, respectively. The reduction in energy requirement per unit of area is interesting. This might be due to the adoption of more energy-efficient approaches in healthcare facilities. Another interesting fact is that Zone 2, which accommodates a larger number of hospitals and total floor space in healthcare in the U.S., has the second-lowest energy intensity in comparison to the other zones. This affirms that a larger area or number of facilities alone does not necessarily result in increased energy consumption intensity.
The average energy intensity of U.S. hospitals is 738.5 kWh/m2, which is approximately 2.6 times higher than that of other commercial buildings. This number is significantly higher than the European hospitals that have an approximate average intensity of 333.4 kWh/m2. This difference, as discussed previously, might be due to cultural differences in design and consumption or to the level of sophistication in terms of the amount of equipment per facility. The energy intensity of hospitals ranges from 640.7 kWh/m2 in Zone 5 (very hot) to 781.1 kWh/m
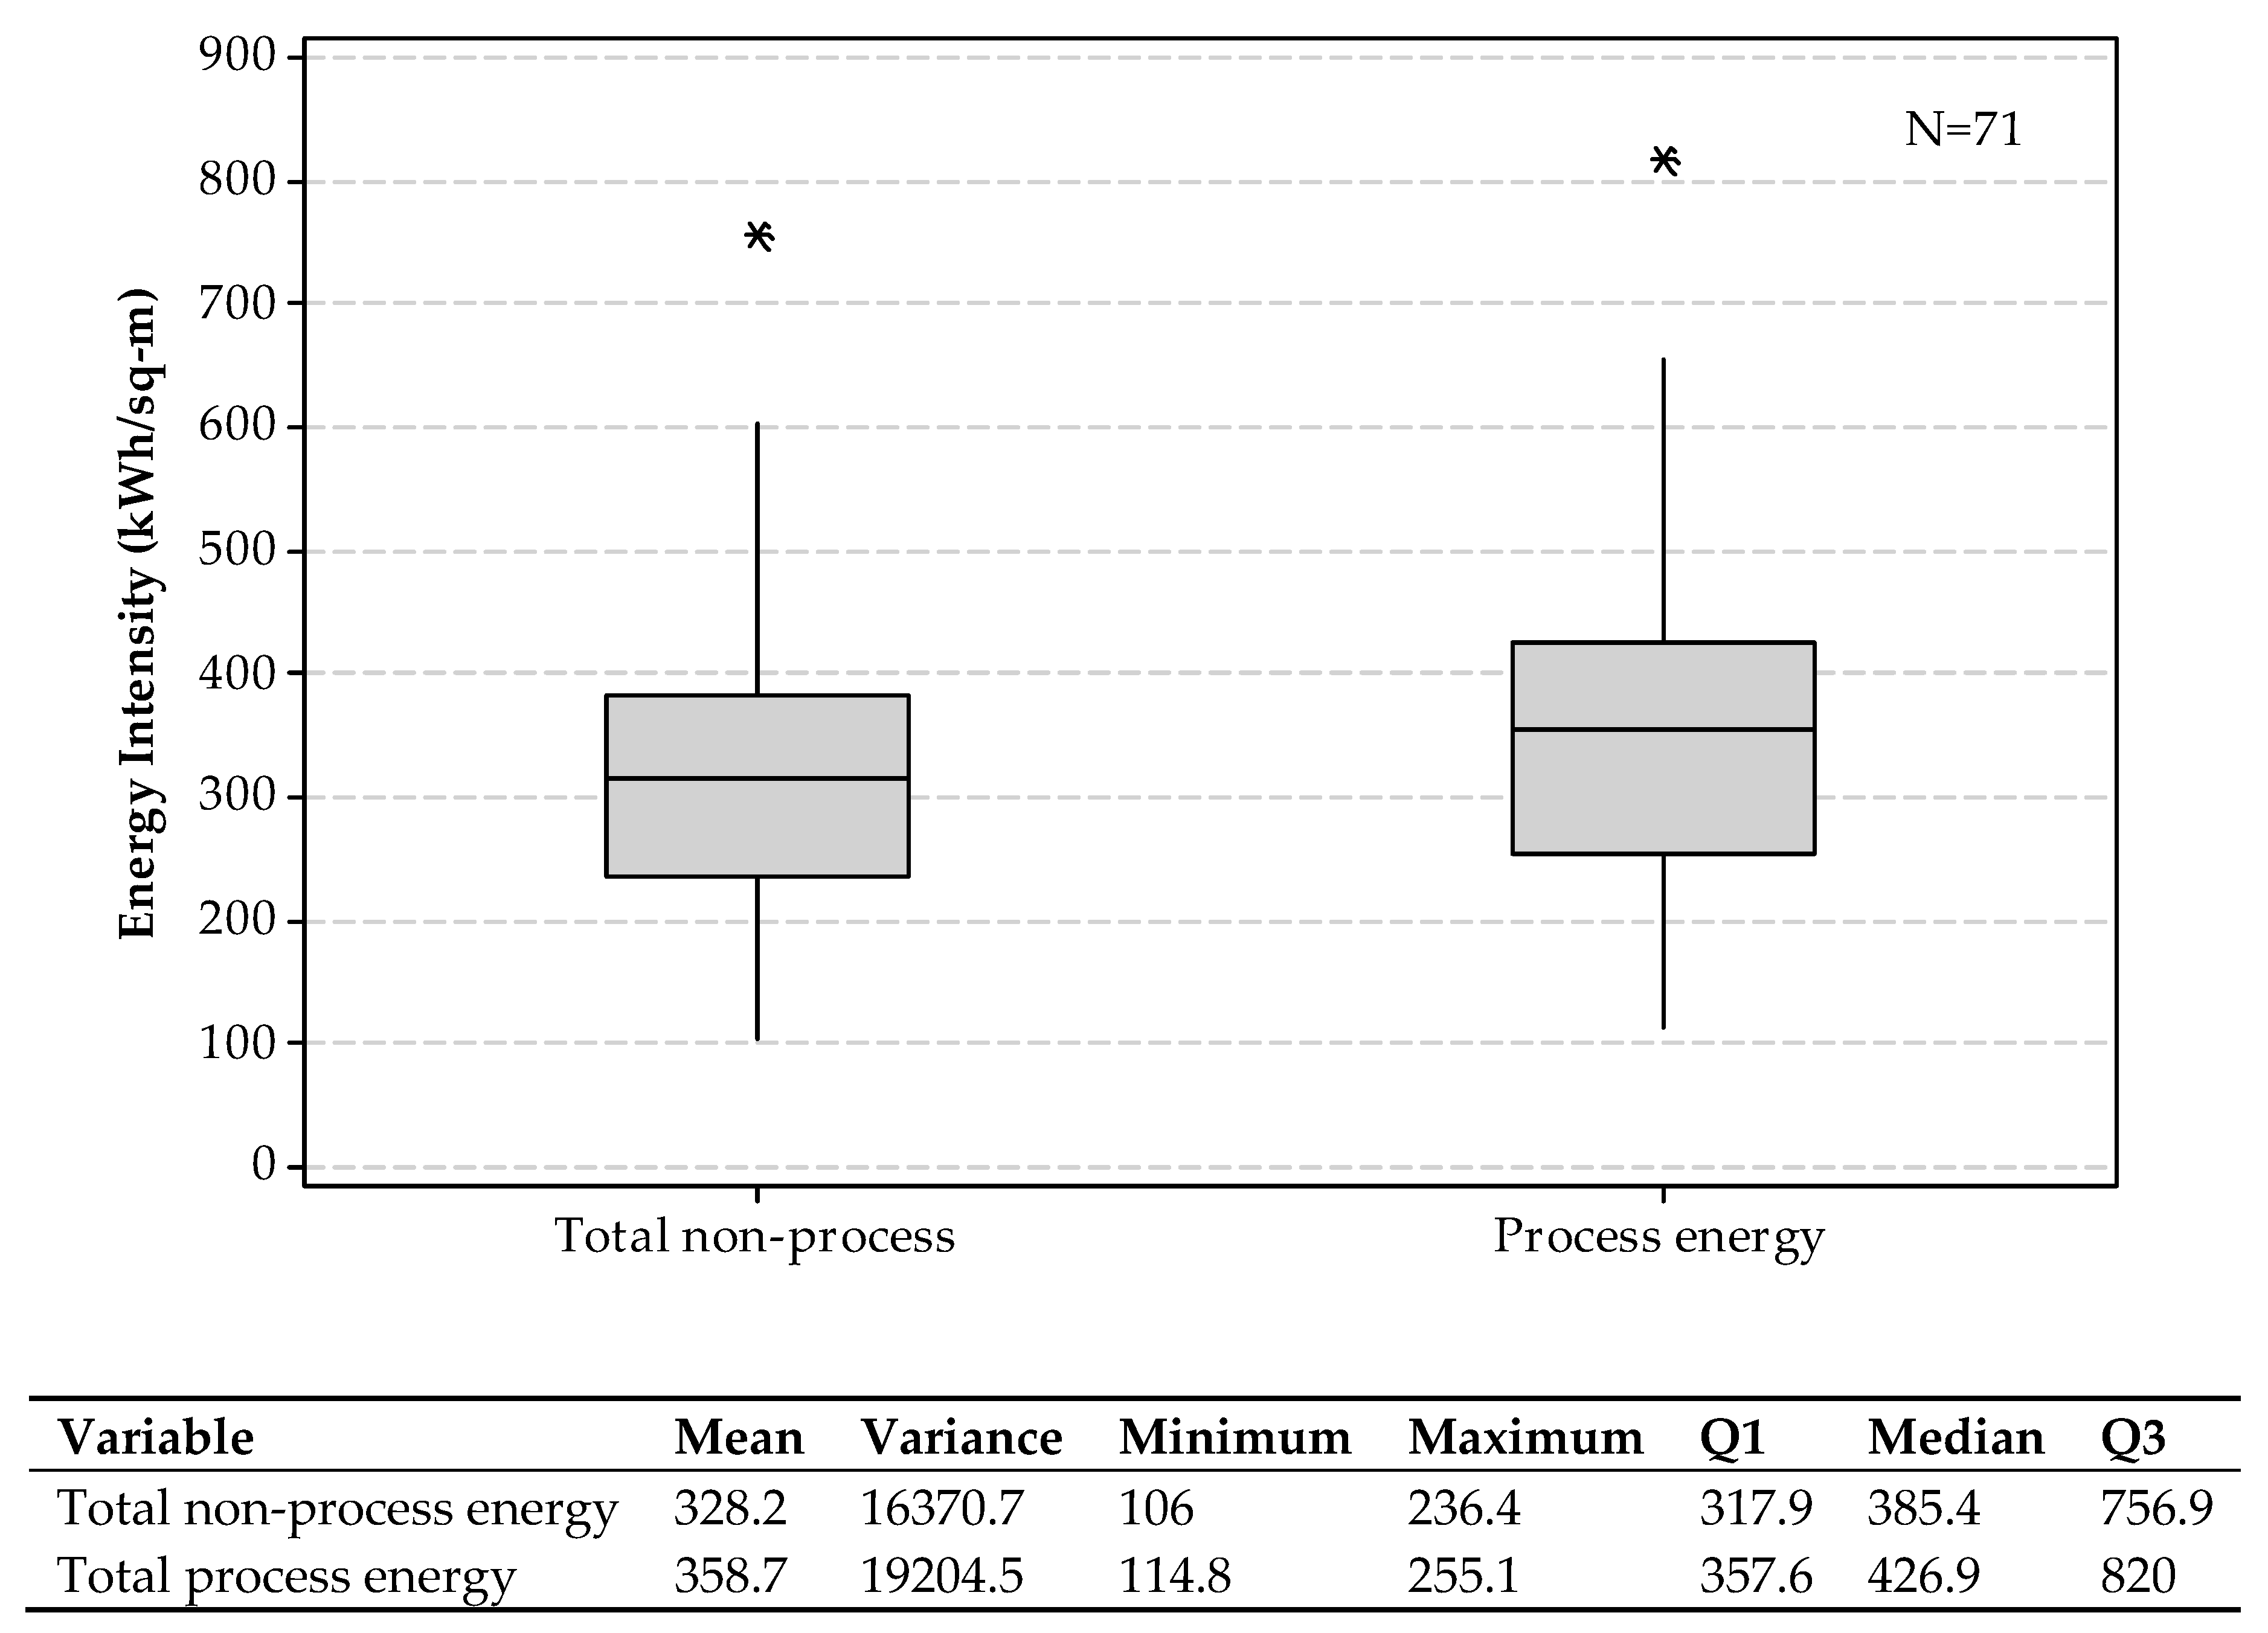
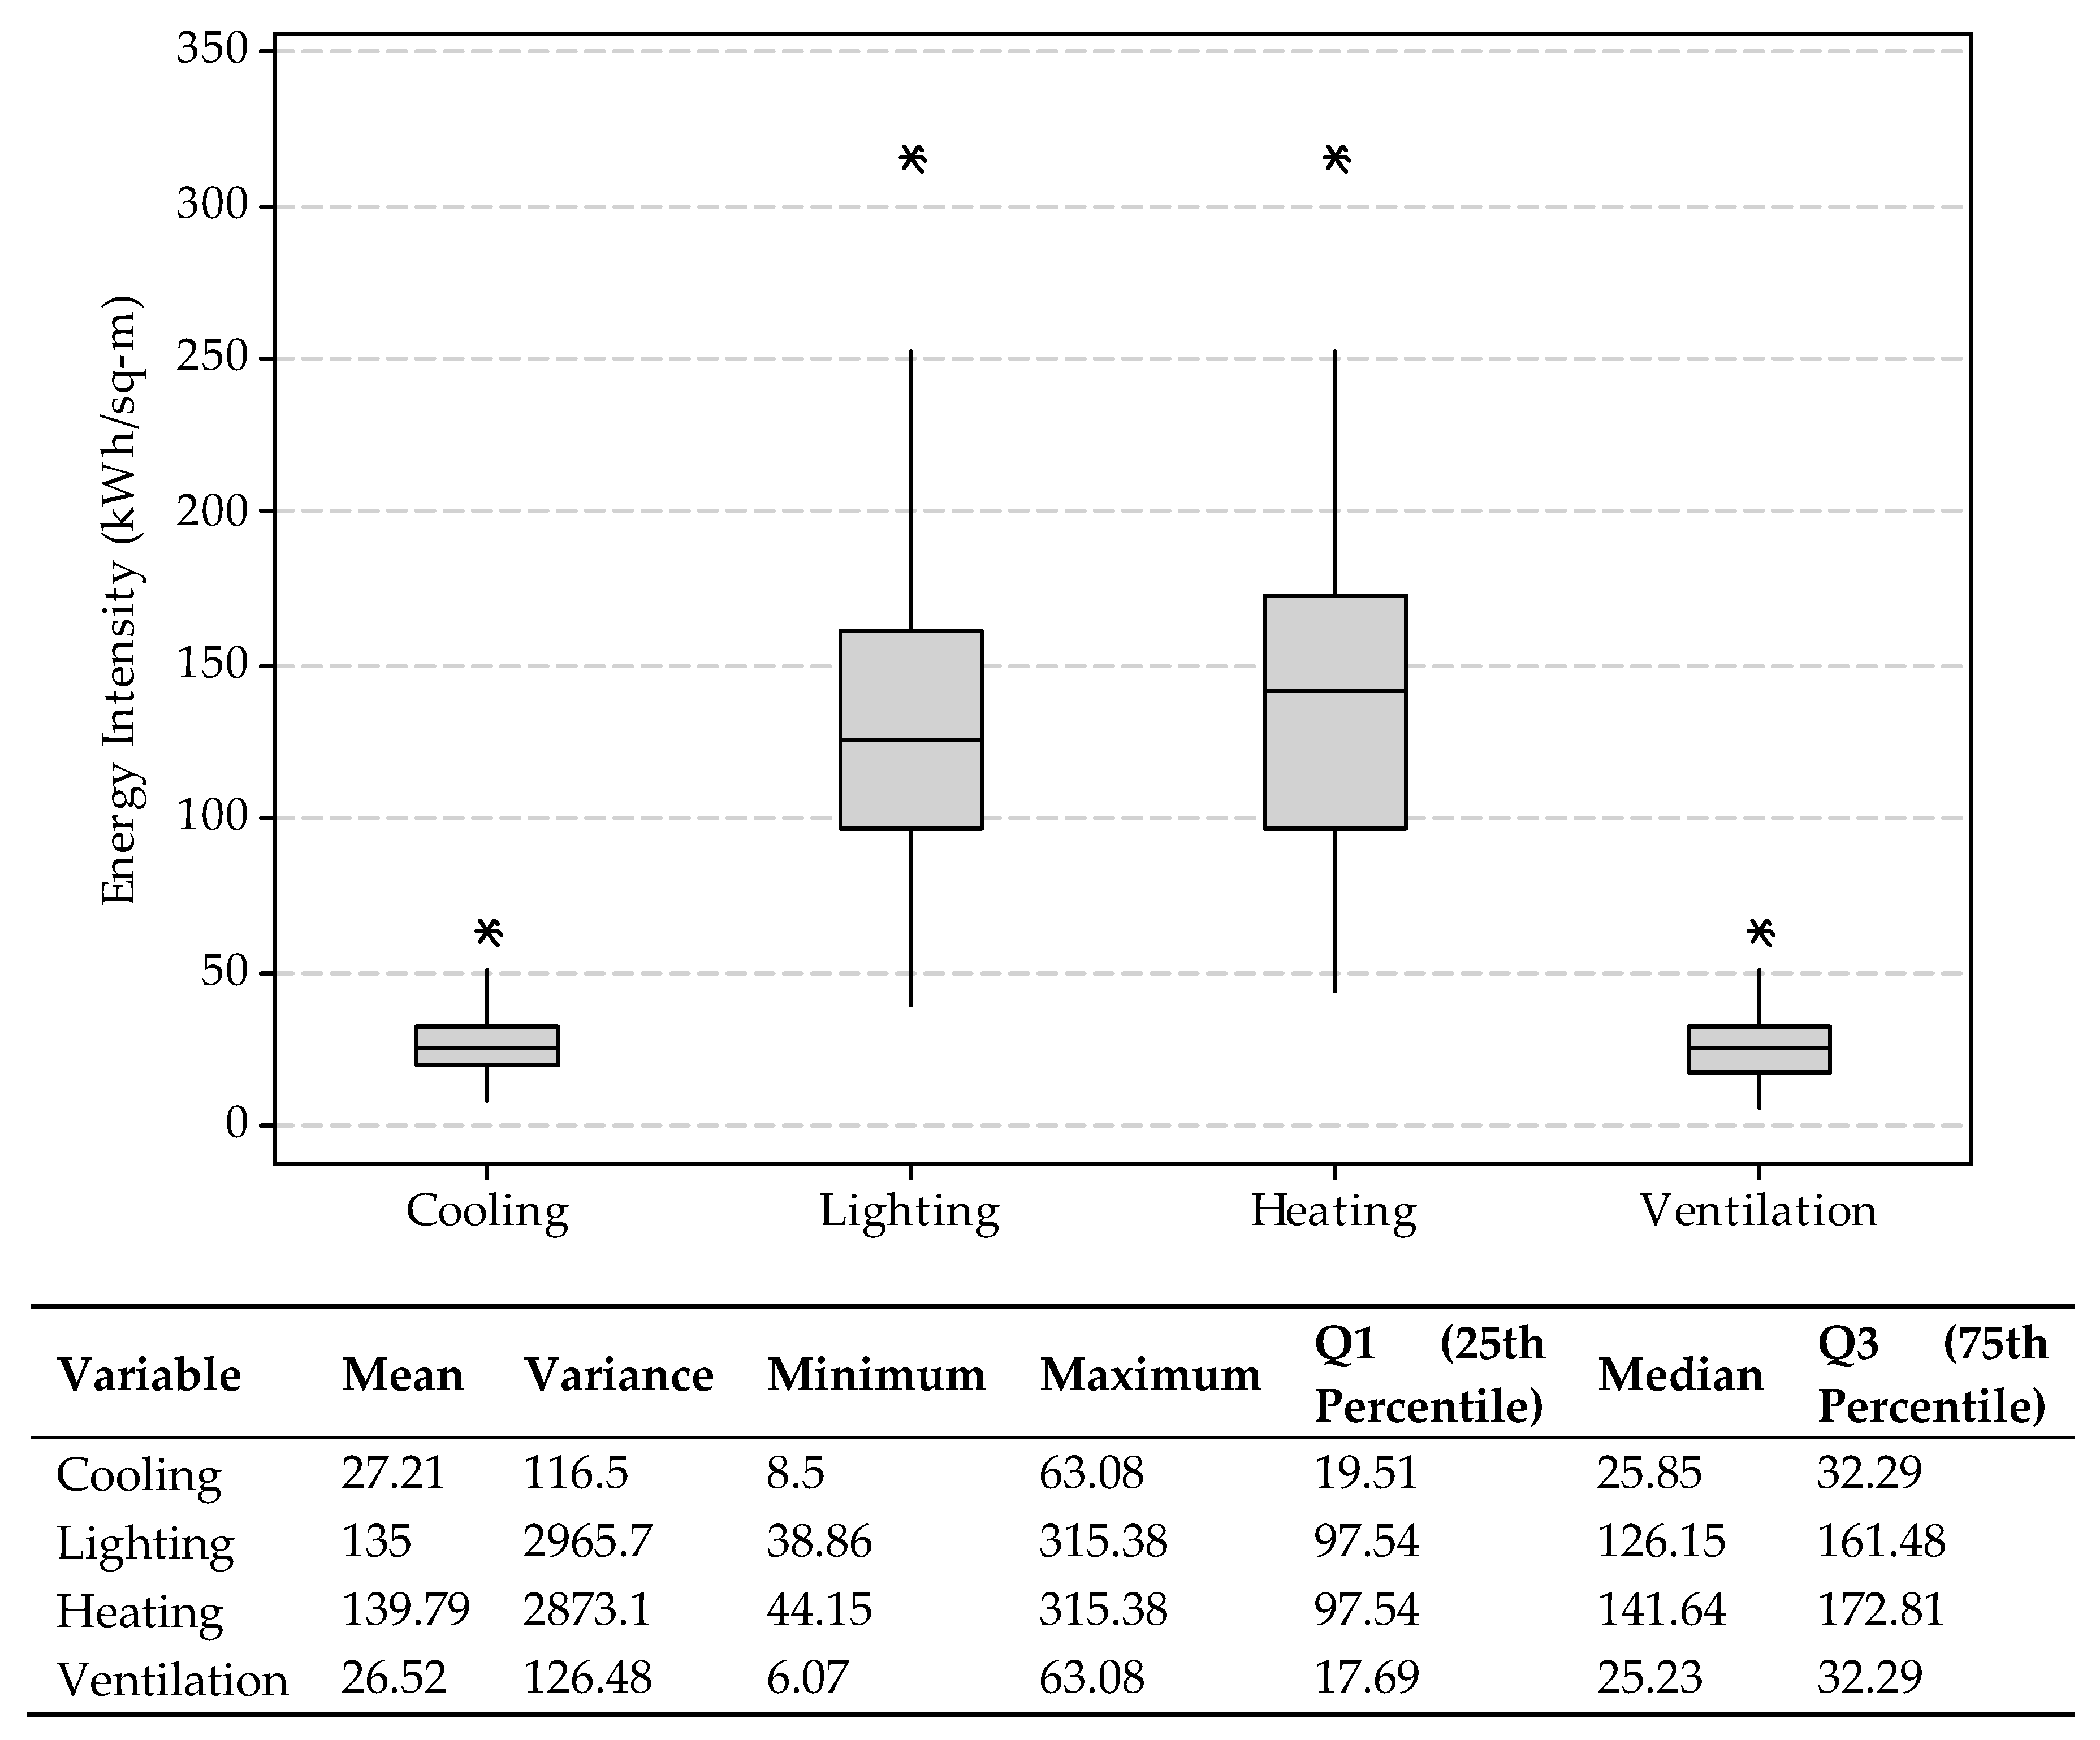
2 in Zone 1 (very cold). This variability is because of temperature differences in geographical zones and heating/cooling requirements. On average, 91% of healthcare facilities use natural gas, which is mainly consumed for space heating purposes. This reliance on natural gas highlights the need for updating the infrastructure of healthcare facilities and replacing it with renewable energy resources. Around 61% of a typical hospital’s energy consumption in the U.S. is due to heating, cooling, ventilation, and lighting (non-process energy), which confirms the need for technological developments and design updates, especially for HVAC systems. In general, non-process energy is being consumed regardless of the workload in hospitals, and this makes non-process energy savings very crucial in hospitals. Analysis of U.S. commercial energy data from 1972–2002 showed that significant energy reduction was observed in offices, but this reduction was not noticeable in hospitals [23].
This work sought to narrow the gap that exists in analyzing the end-use energy data in the U.S. healthcare system. The proposed analyses do not focus on either energy-saving or energy forecasting approaches in the U.S. healthcare sector. This work facilitates further analysis of US healthcare energy data similar to the one presented in [32], which investigates the impact of different factors on energy savings in healthcare in Spain.

Author Contributions

Conceptualization, K.B.; Data curation, F.G.N.; Formal analysis, K.B., F.G.N., M.R. and B.D.; Investigation, K.B., F.G.N. and M.R.; Methodology, K.B., F.G.N. and M.R.; Software, K.B., F.G.N., M.R. and B.D.; Validation, F.G.N.; Visualization, B.D.; Writing—Original draft, K.B.; Writing—Review & editing, K.B., F.G.N., M.R. and B.D.

Funding

This research received no external funding.

Conflicts of Interest

The authors declare no conflict of interest.

Appendix A

Table A1. Annual energy consumption for the 35 healthcare facilities in Texas.
Facility #Annual Energy Intensity (kWh/m2)Facility #Annual Energy Intensity (kWh/m2)
1946.3626567.80
2788.6727220.77
3567.80281261.85
4315.4929946.36
51261.8530350.15
6441.6431757.13
7567.8032709.77
8788.6733283.95
9630.8734662.41
10977.9035883.29
11662.41
121261.85
13630.87
14473.18
151009.44
16630.87
17567.80
18757.13
191577.34
20946.36
21757.13
22725.60
23567.80
24567.80
Table A2. Annual energy intensity for healthcare facilities.
Space typeAuthorArea thousand-m2Cooling energy intensity m2Lighting energy use (kWh/m2)Heating energy use (kWh/m2)Ventilation (kwh/m2)Water Heating (kwh/m2)Cooking (kwh/m2)Refrigeration (kwh/m2)Office equipment (kwh/m2)Other equip (kwh/m2)Total non-process (kwh/m2)Process energy (kwh/m2)Annual energy intensity (kwh/m2)
Inpatient Hospital (TX)(Dunn, 1998)(1.4-59)37.85189.23189.2337.85198.6956.7728.3875.69132.46454.15492.00946.15
Inpatient Hospital (TX)(Dunn, 1998)(1.4-59)31.54157.69157.6931.54165.5847.3123.6563.08110.38378.46410.00788.46
Inpatient Hospital (TX)(Dunn, 1998)(1.4-59)22.71113.54113.5422.71119.2134.0617.0345.4279.48272.49295.20567.69
Inpatient Hospital (TX)(Dunn, 1998)(1.4-59)12.6263.0863.0812.6266.2318.929.4625.2344.15151.38164.00315.38
Inpatient Hospital (TX)(Dunn, 1998)(1.4-59)50.46252.31252.3150.46264.9275.6937.85100.92176.61605.53656.001261.53
Inpatient Hospital (TX)(Dunn, 1998)(1.4-59)17.6688.3188.3117.6692.7226.4913.2535.3261.82211.94229.60441.54
Inpatient Hospital (TX)(Dunn, 1998)(1.4-59)22.71113.54113.5422.71119.2134.0617.0345.4279.48272.49295.20567.69
Inpatient Hospital (TX)(Dunn, 1998)(1.4-59)31.54157.69157.6931.54165.5847.3123.6563.08110.38378.46410.00788.46
Inpatient Hospital (TX)(Dunn, 1998)(1.4-59)25.23126.15126.1525.23132.4637.8518.9250.4688.31302.77328.00630.77
Inpatient Hospital (TX)(Dunn, 1998)(1.4-59)39.11195.54195.5439.11205.3158.6629.3378.21136.88469.29508.40977.69
Inpatient Hospital (TX)(Dunn, 1998)(1.4-59)26.49132.46132.4626.49139.0839.7419.8752.9892.72317.91344.40662.30
Inpatient Hospital (TX)(Dunn, 1998)(1.4-59)50.46252.31252.3150.46264.9275.6937.85100.92176.61605.53656.001261.53
Inpatient Hospital (TX)(Dunn, 1998)(1.4-59)25.23126.15126.1525.23132.4637.8518.9250.4688.31302.77328.00630.77
Inpatient Hospital (TX)(Dunn, 1998)(1.4-59)18.9294.6194.6118.9299.3528.3814.1937.8566.23227.08246.00473.07
Inpatient Hospital (TX)(Dunn, 1998)(1.4-59)40.37201.84201.8440.37211.9460.5530.2880.74141.29484.43524.801009.22
Inpatient Hospital (TX)(Dunn, 1998)(1.4-59)25.23126.15126.1525.23132.4637.8518.9250.4688.31302.77328.00630.77
Inpatient Hospital (TX)(Dunn, 1998)(1.4-59)22.71113.54113.5422.71119.2134.0617.0345.4279.48272.49295.20567.69
Inpatient Hospital (TX)(Dunn, 1998)(1.4-59)30.28151.38151.3830.28158.9545.4222.7160.55105.97363.32393.60756.92
Inpatient Hospital (TX)(Dunn, 1998)(1.4-59)63.08315.38315.3863.08331.1594.6147.31126.15220.77756.92820.001576.91
Inpatient Hospital (TX)(Dunn, 1998)(1.4-59)37.85189.23189.2337.85198.6956.7728.3875.69132.46454.15492.00946.15
Inpatient Hospital (TX)(Dunn, 1998)(1.4-59)30.28151.38151.3830.28158.9545.4222.7160.55105.97363.32393.60756.92
Inpatient Hospital (TX)(Dunn, 1998)(1.4-59)29.02145.08145.0829.02152.3343.5221.7658.03101.55348.18377.20725.38
Inpatient Hospital (TX)(Dunn, 1998)(1.4-59)22.71113.54113.5422.71119.2134.0617.0345.4279.48272.49295.20567.69
Inpatient Hospital (TX)(Dunn, 1998)(1.4-59)31.54157.69157.6931.54165.5847.3123.6563.08110.38378.46410.00788.46
Inpatient Hospital (TX)(Dunn, 1998)(1.4-59)22.71113.54113.5422.71119.2134.0617.0345.4279.48272.49295.20567.69
Inpatient Hospital (TX)(Dunn, 1998)(1.4-59)8.8344.1544.158.8346.3613.256.6217.6630.91105.97114.80220.77
Inpatient Hospital (TX)(Dunn, 1998)(1.4-59)50.46252.31252.3150.46264.9275.6937.85100.92176.61605.53656.001261.53
Inpatient Hospital (TX)(Dunn, 1998)(1.4-59)37.85189.23189.2337.85198.6956.7728.3875.69132.46454.15492.00946.15
Inpatient Hospital (TX)(Dunn, 1998)(1.4-59)14.0070.0170.0114.0073.5221.0010.5028.0149.01168.04182.04350.07
Inpatient Hospital (TX)(Dunn, 1998)(1.4-59)30.28151.38151.3830.28158.9545.4222.7160.55105.97363.32393.60756.92
Inpatient Hospital (TX)(Dunn, 1998)(1.4-59)28.38141.92141.9228.38149.0242.5821.2956.7799.35340.61369.00709.61
Inpatient Hospital (TX)(Dunn, 1998)(1.4-59)11.3556.7756.7711.3559.6117.038.5222.7139.74136.25147.60283.84
Inpatient Hospital (TX)(Dunn, 1998)(1.4-59)26.49132.46132.4626.49139.0839.7419.8752.9892.72317.91344.40662.30
Inpatient Hospital (TX)(Dunn, 1998)(1.4-59)35.32176.61176.6135.32185.4552.9826.4970.65123.63423.87459.20883.07
Medium EIA< 4.6511.9754.7078.638.5595.7217.096.8420.5147.86153.84188.02341.86
Large EIA> 4.6522.87104.56150.3016.34182.9732.6713.0739.2191.49294.06359.41653.48
Dentist OfficeEIA 8.5038.8655.856.0768.0012.144.8614.5734.00109.28133.56242.84
Inpatient HealthEIA 26.10119.33171.5418.65208.8337.2914.9244.75104.42335.62410.21745.83
Inpatient HealthEnergy sys Ass2.7692324.68123.40123.4024.68129.5737.0218.5149.3686.38296.17320.85617.01
Inpatient HealthEnergy sys Ass4.4520239.68198.39198.3939.68208.3159.5229.7679.36138.87476.14515.82991.96
Inpatient HealthEnergy sys Ass1.4797613.1965.9465.9413.1969.2419.789.8926.3846.16158.26171.45329.71
Inpatient HealthEnergy sys Ass1.9670417.5387.6687.6617.5392.0426.3013.1535.0661.36210.37227.90438.28
Inpatient HealthEnergy sys Ass3.4167530.45152.26152.2630.45159.8745.6822.8460.90106.58365.42395.87761.29
Inpatient HealthEnergy sys Ass1.7033615.1875.9175.9115.1879.7022.7711.3930.3653.13182.17197.35379.53
Inpatient HealthEnergy sys Ass3.5223531.39156.96156.9631.39164.8147.0923.5462.79109.87376.71408.11784.82
Inpatient HealthEnergy sys Ass1.335511.9059.5159.5111.9062.4917.858.9323.8141.66142.83154.73297.56
Inpatient HealthEnergy sys Ass2.4907322.20110.99110.9922.20116.5433.3016.6544.4077.69266.38288.58554.96
Inpatient HealthEnergy sys Ass4.2792438.14190.69190.6938.14200.2357.2128.6076.28133.48457.66495.80953.46
Inpatient HealthEnergy sys Ass3.6033132.11160.57160.5732.11168.6048.1724.0964.23112.40385.37417.49802.86
Inpatient HealthEnergy sys Ass4.0636436.22181.09181.0936.22190.1454.3327.1672.43126.76434.60470.82905.43
Inpatient HealthEnergy sys Ass2.2105819.7098.5198.5119.70103.4329.5514.7839.4068.96236.42256.12492.54
Inpatient HealthEnergy sys Ass1.5903214.1770.8770.8714.1774.4121.2610.6328.3549.61170.08184.26354.34
Inpatient HealthEnergy sys Ass4.9402244.03220.15220.1544.03231.1566.0433.0288.06154.10528.35572.381100.74
Inpatient HealthEnergy sys Ass3.1058527.68138.40138.4027.68145.3241.5220.7655.3696.88332.17359.85692.02
Inpatient HealthEnergy sys Ass3.2842629.27146.35146.3529.27153.6743.9121.9558.54102.45351.25380.52731.77
Inpatient HealthEnergy sys Ass4.3098838.41192.06192.0638.41201.6657.6228.8176.82134.44460.94499.35960.29
Inpatient HealthEnergy sys Ass2.0300518.0990.4690.4618.0994.9927.1413.5736.1963.32217.11235.21452.32
Inpatient HealthEnergy sys Ass1.7393715.5077.5177.5115.5081.3923.2511.6331.0054.26186.02201.53387.55
Inpatient HealthEnergy sys Ass2.6398523.53117.64117.6423.53123.5235.2917.6547.0682.35282.33305.86588.19
Inpatient HealthEnergy sys Ass1.9858917.7088.5088.5017.7092.9226.5513.2735.4061.95212.39230.09442.48
Inpatient HealthEnergy sys Ass3.1719828.27141.35141.3528.27148.4242.4121.2056.5498.95339.24367.51706.75
Inpatient HealthEnergy sys Ass1.7437215.5477.7077.7015.5481.5923.3111.6631.0854.39186.49202.03388.52
Inpatient HealthEnergy sys Ass2.8716625.59127.97127.9725.59134.3738.3919.2051.1989.58307.12332.72639.84
Inpatient HealthEnergy sys Ass4.4661239.80199.02199.0239.80208.9759.7129.8579.61139.31477.65517.45995.10
Inpatient HealthEnergy sys Ass3.6848832.84164.21164.2132.84172.4249.2624.6365.68114.94394.10426.94821.03
Inpatient Hospital (TX)(Dunn, 1998) 663.38
Inpatient Hospital (TX)(Dunn, 1998) 586.20
Inpatient Hospital (TX)(Dunn, 1998) 707.62
Inpatient Hospital (TX)(Dunn, 1998) 774.89
Inpatient Hospital (TX)(Dunn, 1998) 720.32
Inpatient Hospital (TX)(Dunn, 1998) 25.28115.56166.1218.06202.2336.1114.4543.34101.12325.02397.24722.26
Inpatient HealthEIA 27.54125.89180.9719.67220.3239.3415.7447.21110.16354.08432.76786.84
Inpatient HealthEIA 22.64103.51148.7916.17181.1432.3512.9438.8190.57291.11355.80646.91
Inpatient HealthEIA 22.75104.02149.5316.25182.0432.5113.0039.0191.02292.56357.58650.14
Inpatient HealthLBL 59.20104.41107.6431.22161.461.086.4621.5364.58302.47255.10557.57
Acute Care/ChildrenEnergy star27870.9 489.10

References

  1. Commercial Buildings Energy Consumption Survey (CBECS), U.S. Energy Information Administration. Available online: https://www.eia.gov/consumption/commercial/data/2012/c&e/cfm/c1.php (accessed on 8 August 2019).
  2. González González, A.; García-Sanz-Calcedo, J.; Rodríguez Salgado, D.J.E. Evaluation of energy consumption in German hospitals: benchmarking in the public sector. Energies 2018, 11, 2279. [Google Scholar] [CrossRef]
  3. Singer, B.C. Hospital Energy Benchmarking Guidance-Version 1.0; Lawrence Berkeley National Laboratory: Berkeley, CA, USA, 2009.
  4. Buonomano, A.; Calise, F.; Ferruzzi, G.; Palombo, A. Dynamic energy performance analysis: A Case study for energy efficiency retrofits of hospital buildings. Energy 2014, 78, 555–572. [Google Scholar] [CrossRef]
  5. Christiansen, N.; Kaltschmitt, M.; Dzukowski, F. Electrical energy consumption and utilization time analysis of hospital departments and large scale medical equipment. Energy Build. 2016, 131, 172–183. [Google Scholar] [CrossRef]
  6. Saidur, R.; Hasanuzzaman, M.; Yogeswaran, S.; Mohammed, H.A.; Hossain, M.S. An end-use energy analysis in a Malaysian public hospital. Energy 2010, 35, 4780–4785. [Google Scholar] [CrossRef]
  7. Chirarattananon, S.; Chaiwiwatworakul, P.; Hien, V.D.; Rakkwamsuk, P.; Kubaha, K. Assessment of energy savings from the revised building energy code of Thailand. Energy 2010, 35, 1741–1753. [Google Scholar] [CrossRef]
  8. Thinate, N.; Wongsapai, W.; Damrongsak, D. Energy performance study in Thailand hospital building. Energy Procedia 2017, 141, 255–259. [Google Scholar] [CrossRef]
  9. Chung, M.; Park, H.C. Comparison of building energy demand for hotels, hospitals, and offices in Korea. Energy 2015, 92, 383–393. [Google Scholar] [CrossRef]
  10. González, A.G.; García-Sanz-Calcedo, J.; Salgado, D.R. A quantitative analysis of final energy consumption in hospitals in Spain. Sustain. Cities Soc. 2018, 36, 169–175. [Google Scholar] [CrossRef]
  11. Bakaimis, B.; Papanikolaou, I. Electrical Energy Saving Policies, Initiatives, Results, Challenges and Lessons Learned for the Grevena Hospital. Procedia Environ. Sci. 2017, 38, 882–889. [Google Scholar] [CrossRef]
  12. Fifield, L.; Lomas, K.J.; Giridharan, R.; Allinson, D. Hospital wards and modular construction: Summertime overheating and energy efficiency. Build. Environ. 2018, 141, 28–44. [Google Scholar] [CrossRef]
  13. Morgenstern, P.; Li, M.; Raslan, R.; Ruyssevelt, P.; Wright, A. Benchmarking acute hospitals: Composite electricity targets based on departmental consumption intensities? Energy Build. 2016, 118, 277–290. [Google Scholar] [CrossRef]
  14. Franco, A.; Shaker, M.; Kalubi, D.; Hostettler, S. A review of sustainable energy access and technologies for healthcare facilities in the Global South. Sustain. Energy Technol. Assess. 2017, 22, 92–105. [Google Scholar] [CrossRef]
  15. Cannistraro, M.; Bernardo, E. Monitoring of the indoor microclimate in hospital environments a case study the Papardo hospital in Messina. Int. J. Heat Technol. 2017, 35, S456–S465. [Google Scholar] [CrossRef]
  16. Cannistraro, M.; Lorenzini, E. The Applications of the New Technologies “E-Sensing” in Hospitals. Int. J. Heat Technol. 2016, 34, 551–557. [Google Scholar] [CrossRef]
  17. Cannistraro, G.; Cannistraro, M. Hypothermia Risk, Monitoring and Environment Control in Operating Rooms” in Hospitals, International. J. Heat Technol. 2016, 34, 165–171. [Google Scholar] [CrossRef]
  18. García-Sanz-Calcedo, J.J.J.o.h.e. Analysis of energy efficiency in healthcare buildings. J. Healthc. Eng. 2014, 5, 361–374. [Google Scholar] [CrossRef] [PubMed]
  19. Teke, A.; Timur, O. Assessing the energy efficiency improvement potentials of HVAC systems considering economic and environmental aspects at the hospitals. Renew. Sustain. Energy Rev. 2014, 33, 224–235. [Google Scholar] [CrossRef]
  20. Burpee, H.; How, U.S. Hospitals can realize net-zero energy. REHVA Eur. HVAC J. 2017, 54, 31–35. [Google Scholar]
  21. Teke, A.; Timur, O. Overview of energy savings and efficiency strategies at the hospitals. Int. J. Econ. Manag. Eng. 2014, 8, 242–248. [Google Scholar]
  22. Burpee, H.; Loveland, J.; Helmers, A.; Hatten, M.; Griffin, D.; Connor, M. “Targeting 100! Web Tool.” University of Washington, Integrated Design Lab. 2012. Available online: www.idlseattle.com/t100 (accessed on 1 October 2019).
  23. English, T. The hope and possibility of net-zero hospitals in the US regulatory context. REHVA Eur. HVAC J. 2017, 54, 37–41. [Google Scholar]
  24. CADDET: Centre For the Analysis and Dissemination of Demonstrated Energy Technologies. Saving Energy with Energy Efficiency in Hospitals. 1997. Available online: https://www.certh.gr/dat/ 834E8024/file.pdf (accessed on 1 October 2019).
  25. Dunn, J.R. Energy Use and Costs in Texas Schools and Hospitals. In Proceedings of the Hot and Humid Climate Symposium, Fort Worth, TX, USA, 1–2 June 1998. [Google Scholar]
  26. Akbari, H.; Rainer, L.; Eto, J. Integrated Estimation of Commercial Sector End-Use Load Shapes and Energy Use Intensities; Phase 2; Lawrence Berkeley Lab.: Berkeley, CA, USA, 1993.
  27. European Commission, EU Building Stock Observatory. Available online: https://ec.europa.eu/energy/en/eu-buildings-database (accessed on 8 August 2019).
  28. Balaras, C.A.; Dascalaki, E.; Droutsa, P.; Micha, M.; Kontoyiannidis, S.; Argiriou, A.A. Energy Use Intensities for Non-Residential Buildings. In Proceedings of the 48th International Congress Exhibition on Heating Refrigeration and Air-Conditioning, Sava Center, Belgrade, Serbia, 6–8 December 2017; pp. 369–389. [Google Scholar]
  29. Brown, L.H.; Buettner, P.G.; Canyon, D.V. The energy burden and environmental impact of health services. Syst. Rev. 2012, 102, e76–e82. [Google Scholar] [CrossRef] [PubMed]
  30. Natural Resources Canada’s Office of Energy Efficiency. Major Energy Retrofit Guidelines for Commercial and Institutional Buildings HOSPITALS; Canada, 2018. Available online: http://publications.gc.ca/collections/ collection_2018/rncan-nrcan/M144-275-3-2016-eng.pdf (accessed on 1 October 2019).
  31. Bawaneh, K.; Overcash, M.; Twomey, J. Analysis techniques to estimate the overhead energy for industrial facilities and case studies. Adv. Build. Energy Res. 2016, 10, 191–212. [Google Scholar] [CrossRef]
  32. García-Sanz-Calcedo, J.; Al-Kassir, A.; Yusaf, T. Economic and environmental impact of energy-saving in healthcare buildings. Appl. Sci. 2018, 8, 440. [Google Scholar] [CrossRef]
Figure 1. U.S. 2012 energy consumption in the percentage of the total energy consumed in healthcare buildings by energy source.
Energies 12 03775 g001
Figure 2. Major fuel consumption breakdown by end-use.
Energies 12 03775 g002
Figure 3. Breakdown of energy consumption in a U.S. hospital. Note: Reproduced with permission from [22].
Energies 12 03775 g003
Figure 4. Hospitals’ annual energy consumption for the five climate zones in the U.S. (a) Climate Zone 1; (b) climate Zone 2; (c) climate Zone 3; (d) climate Zone 4; (e) climate Zone 5; (f) climate zones marked on the U.S. map.
Energies 12 03775 g004aEnergies 12 03775 g004b
Figure 5. Healthcare facilities annual non-process energy intensity.
Energies 12 03775 g005
Figure 6. Boxplot and statistical summary of annual non-process energy intensity (kWh/m2) in healthcare facilities (* outlier).
Energies 12 03775 g006
Figure 7. Healthcare facilities’ annual process energy intensity.
Energies 12 03775 g007
Figure 8. Boxplot of annual process energy intensity (kWh/m2) in healthcare facilities (* outlier).
Energies 12 03775 g008
Figure 9. Process and non-process annual energy intensity (kWh/m2) comparison. Notes: * represents the outliers.
Energies 12 03775 g009
Table 1. Energy consumption by end-use type in billion (109) kWh.
TotalSpace HeatingCoolingVentilationWater HeatingLightingCookingRefrigerationOffice EquipmentComputersOther
Electricity1071.1720.2224.0329317.882.355.574.989.9620.52
Natural gas77.646.6--17.88-9.38---3.52
Total major fuel210.461.523.1524.3224.0317.8815.245.574.989.9624.03
Inpatient 160.948.0619.6413.4822.8611.7213.774.103.526.1517.30
Outpatient 49.5213.483.5110.841.176.151.171.171.473.816.74
Table 2. Energy consumption intensity.
Major Fuel Consumption Intensity by Usage Type (kWh/m2)Electricity (kWh/m2)Natural gas (kWh/m2)Total Energy (kWh/m2)Consumption Per Building (million (106) kWh)Consumption per worker (kWh)
Space heatingCoolingVentilationWater heatingLightingCookingRefrigerationOffice equipmentComputersOther
Healthcare Overall 1636262624664141326642782545451.3427.6
Inpatient222956110453691916287933432772916.837.6
Outpatient832266838339823412021242990.3414.9
Table 3. Energy cost intensity.
Total Energy Expenditures (million $)Expenditure Intensity ($)
Sum of Major FuelsElectricityNatural gasFuel oilDistrict HeatPer sq. MeterPer BuildingPer Thousand kWh
Healthcare Overall13.0729.5851.8184441.22533.3683.26162.10
Inpatient9.3736.4351.4413621.13642937.30058.34
Outpatient3.6993.150377--22.625.16374.75
Table 4. Hospitals operational details per climate zone.
Number of BuildingsTotal Floorspace (Million m2)Total Workers (Thousand)Total Patient Beds (Thousand)
Total3040181.93340915
Zone 151730.9628165
Zone 281847.3803241
Zone 350123529132
Zone 479447.1875251
Zone 541033.6505127
Table 5. Energy consumption and intensity by a source per climate zone.
Sum of Major Energy SourcesIndividual Major Energy Sources
Consumption (Billion kWh)Intensity (kWh/m2)Expenditures (Million $)Electricity (Billion kWh)Electricity Intensity (kWh/m2)Natural Gas (Billion kWh)Natural Gas Intensity (kWh/m2)
Total134.2738.516.2957313.261.0353.6
Zone 124.0781.114.159300.312.0399.7
Zone 234.6733.418.4113279.915.8359.0
Zone 317.9777.616.568354.18.2405.7
Zone 436.0765.914.1616339.117.0355.2
Zone 521.7640.718.610305.77.9261.5
Table 6. Annual energy data for Texas hospitals.
LowAverageHigh
Area (m2)139313,31358,909
Age (year)12146
Annual electricity consumption intensity (kWh/m2)126375666.3
Annual gas consumption intensity (kWh/m2)833891320
Total annual energy intensity (kWh/m2)3167661593
Electrical cost/area ($/m2)6.218.432
Gas cost/area ($/m2)1.75.724
Total energy cost/area ($/m2)8.824.242
Table 7. Annual energy intensity in kWh/m2 for the four commercial buildings in California.
Energy Type (kWh/m2)Health FacilitiesSchoolsLodgingsCollege Campuses
Cooling----
Initial59.216.139.821.5
Reconciled56.08.632.316.1
Ventilation0.00.00.00.0
Initial31.219.411.839.8
Reconciled23.79.78.625.8
Indoor lighting0.00.00.00.0
Initial100.150.645.257.0
Reconciled115.235.543.140.9
Outdoor lighting0.00.00.00.0
Initial4.35.46.54.3
Reconciled4.312.96.53.2
Misc. Equipment0.00.00.00.0
Initial46.35.417.223.7
Reconciled52.74.316.117.2
Hospital equipment----
Initial9.7---
Reconciled11.8---
Cooking
Initial1.11.11.11.1
Reconciled1.11.11.11.1
Refrigeration0.00.00.00.0
Initial6.52.214.09.7
Reconciled6.52.214.09.7
Table 8. Energy intensity of healthcare facilities in other countries.
CountryAnnual Energy Intensity (kWh/m2)
Greece [29]-
Hospitals, health centers, and clinics, 1980 235
Hospitals, health centers, and clinics, 2001 233
Hospitals, health centers, and clinics, 2010 (projected) 236
Scotland: small health buildings, 2001 [29]310
Poland [29]-
University hospital, heat/hot water only, 2005–2008268
Provincial hospital, heat/hot water only, 2005–2008327
Malaysia: public hospital, 2008 [29]234
Spain: [29]-
Hospital, total energy use,~2005 494
Hospital, electricity only, ~2005 169
Thailand: an average of 79 hospitals, electricity only, 1996–2006 [29]149
Bulgaria [27]656.5
Estonia [27]147.8
France [27]228.2
Germany [27]317.2
Netherlands [27]237.8
Sweden [27]230.6
UK [27]516.2

