Article

Techno-Economic Optimization of CO2-to-Methanol with Solid-Oxide Electrolyzer

1
Department of Energy, Systems, Territory and Constructions Engineering, University of Pisa, 56122 Pisa, Italy
2
Group of Energy Materials, Swiss Federal Institute of Technology in Lausanne (EPFL), 1950 Sion, Switzerland
3
Industrial Process and Energy Systems Engineering, Swiss Federal Institute of Technology in Lausanne (EPFL), 1950 Sion, Switzerland
*
Authors to whom correspondence should be addressed.
Energies 2019, 12(19), 3742; https://doi.org/10.3390/en12193742
Submission received: 2 September 2019 / Revised: 25 September 2019 / Accepted: 30 September 2019 / Published: 30 September 2019

Abstract

:
Carbon capture and utilization are promising to tackle fossil-fuel depletion and climate change. CO2 hydrogenation can synthesize various chemicals and fuels, such as methanol, formic acid, urea, and methane. CO2-to-methanol integrated with solid-oxide electrolysis (SOE) process can store renewable power in methanol while recycling recovered CO2, thus achieving the dual purposes of storing excess renewable power and reducing lifetime CO2 emissions. This paper focuses on the techno-economic optimization of CO2 hydrogenation to synthesize green methanol integrated with solid-oxide electrolysis process. Process integration, techno-economic evaluation, and multi-objective optimization are carried out for a case study. Results show that there is a trade-off between energy efficiency and methanol production cost. The annual yield of methanol of the studied case is 100 kton with a purity of 99.7%wt with annual CO2 utilization of 150 kton, representing the annual storage capacity of 800 GWh renewable energy. Although the system efficiency is rather high at around at 70% and varies within a narrow range, methanol production cost reaches 560 $/ton for an electricity price of 73.16 $/MWh, being economically infeasible with a payback time over 13 years. When the electricity price is reduced to 47 $/MWh and further to 24 $/MWh, the methanol production cost becomes 365 and 172 $/ton with an attractive payback time of 4.6 and 2.8 years, respectively. The electricity price has significant impact on project implementation. The electricity price is different in each country, leading to a difference of the payback time in different locations.

1. Introduction

In the 21st century, the consumption of fossil fuel (oil, natural gas, and coal) and climate change are major problems in the fields of energy, environmental protection, and economic development [1,2]. A large amount of fossil fuel is used to generate electricity with the severe issue of greenhouse gas emissions [3]. Moreover, process industries, such as petrochemical, iron and steel, aluminum, paper and pulp, refineries, and cement, also emit CO2 as a result of raw material conversion [4,5]. The Paris Agreement seeks to balance sources and sinks after 2050, which effectively calls for new net-zero emissions. To achieve the goals of the Paris Agreement, carbon capture, utilization, and storage (CCUS) is essential to mitigate climate change [5]. Furthermore, carbon capture and utilization (CCU) represents a new carbon dioxide economy by producing high-value chemicals and fuels from captured CO2, including methanol, formic acid, urea, and methane [4,6].
Methanol is one of the top chemicals produced in the world [7,8] and is a widely recommended alternative chemical carrier [9] for producing a number of chemicals, such as olefins, gasoline, DME (dimethyl ether), DTBE (methyl tert-butyl ether), acetic acid, formic acid, and hydrogen [7,8,10,11,12]. Methanol can also be used directly as a transportation fuel in internal combustion engines [13], as a reactant for direct methanol fuel cell [14], and to produce H2 by steam reforming for fuel cell applications [7] or as fuel blend of gasoline from small concentrations as an additive to 15% (M15) and even 85% (M85) [7,9,13]. We also agree with [15] that power to fuel technologies such as fuel methanol and methane are the most interesting and feasible alternatives to producing just hydrogen and using it in a completely new infrastructure. Methane as a gas and methanol as a liquid fuel can be easily carried to the final users by using the existing infrastructure distributing natural gas and liquid fuels. This is the original motivation for studying power to methanol processes.
Methanol is mostly produced from catalytic synthesis, the most developed conversion method for enhanced carbon recovery [4]. CO2 hydrogenation to synthesize methanol has been extensively studied using both homogenous and heterogeneous catalysts [4,16,17,18,19,20,21]. The heterogeneous catalyst is preferable in terms of cost, stability, separation, handling, and reuse of catalyst as well as reactor design. It is also adopted today for large-scale industrial applications to synthesize methanol from syngas [16,20]. Using CuO-ZnO-Al2O3-Cr2O3 as catalyst at 70 bar and 250 °C, methanol can be produced with 79% selectivity, 20% yield, and 25% CO2 conversion [22]. While with CuO-ZnO-CrO3 as the catalyst at 50 bar and 250 °C, methanol was produced with 57.8% selectivity, 14% yield, and 24% CO2 conversion [23]. There have been papers in literature, e.g., [19], for the design and evaluation of large-scale CO2-to-methanol system. However, CO2-to-methanol fed with renewable hydrogen derived from electrolysis technologies has not been little investigated [24,25].
The methanol synthesis through CO2 hydrogenation (CO2-to-methanol process) requires pure hydrogen. The Power-to-Hydrogen (PtH) technology can supply carbon-free hydrogen from renewable energy. The core of the PtH technology is the electrolyzer that electrochemically splits water into hydrogen and oxygen. There are mainly three available electrolysis technologies [26], alkaline electrolysis (AE), polymer electrolyte membranes electrolysis (PEME), and solid-oxide electrolysis (SOE), suitable for different applications of power-to-hydrogen process chains [27]. The SOE has been demonstrated with high electrical and system efficiency [15,26,28] due to the electrolysis at high temperature over 600 °C. Therefore, there is a great opportunity for integrating SOE with high-temperature processes to realize high system-level heat integration and to achieve high overall system efficiency [26,29,30,31,32]. The coupling of PtH and CO2-to-methanol might solve two crucial problems: (1) long-term and large-scale Electrical Energy Storage (EES) and (2) large-scale CCUS.
Therefore, in this study, the concept of CO2-to-methanol integrated with SOE is designed and optimized from a techno-economic perspective. The key issues studied for CO2-to-methanol process integrated with SOE include: (1) system-level heat integration; (2) the impacts of operating variables on system performance, i.e., the overall system efficiency and cost. To achieve this, CO2-to-methanol process integrated with SOE has been modeled and investigated with a multi-objective optimization (MOO) platform considering heat cascade calculation.
The remaining paper is organized as follows: The CO2-to-methanol conversion system is briefly described and modeled in Section 2. In Section 3, the optimization methodology and platform are briefly introduced with a detailed definition of the optimization problems. Afterward, the thermodynamic and economic performances for the case study employed are discussed comprehensively in Section 4 to support the design of such a system in the real world. Finally, the conclusions are drawn in Section 5.

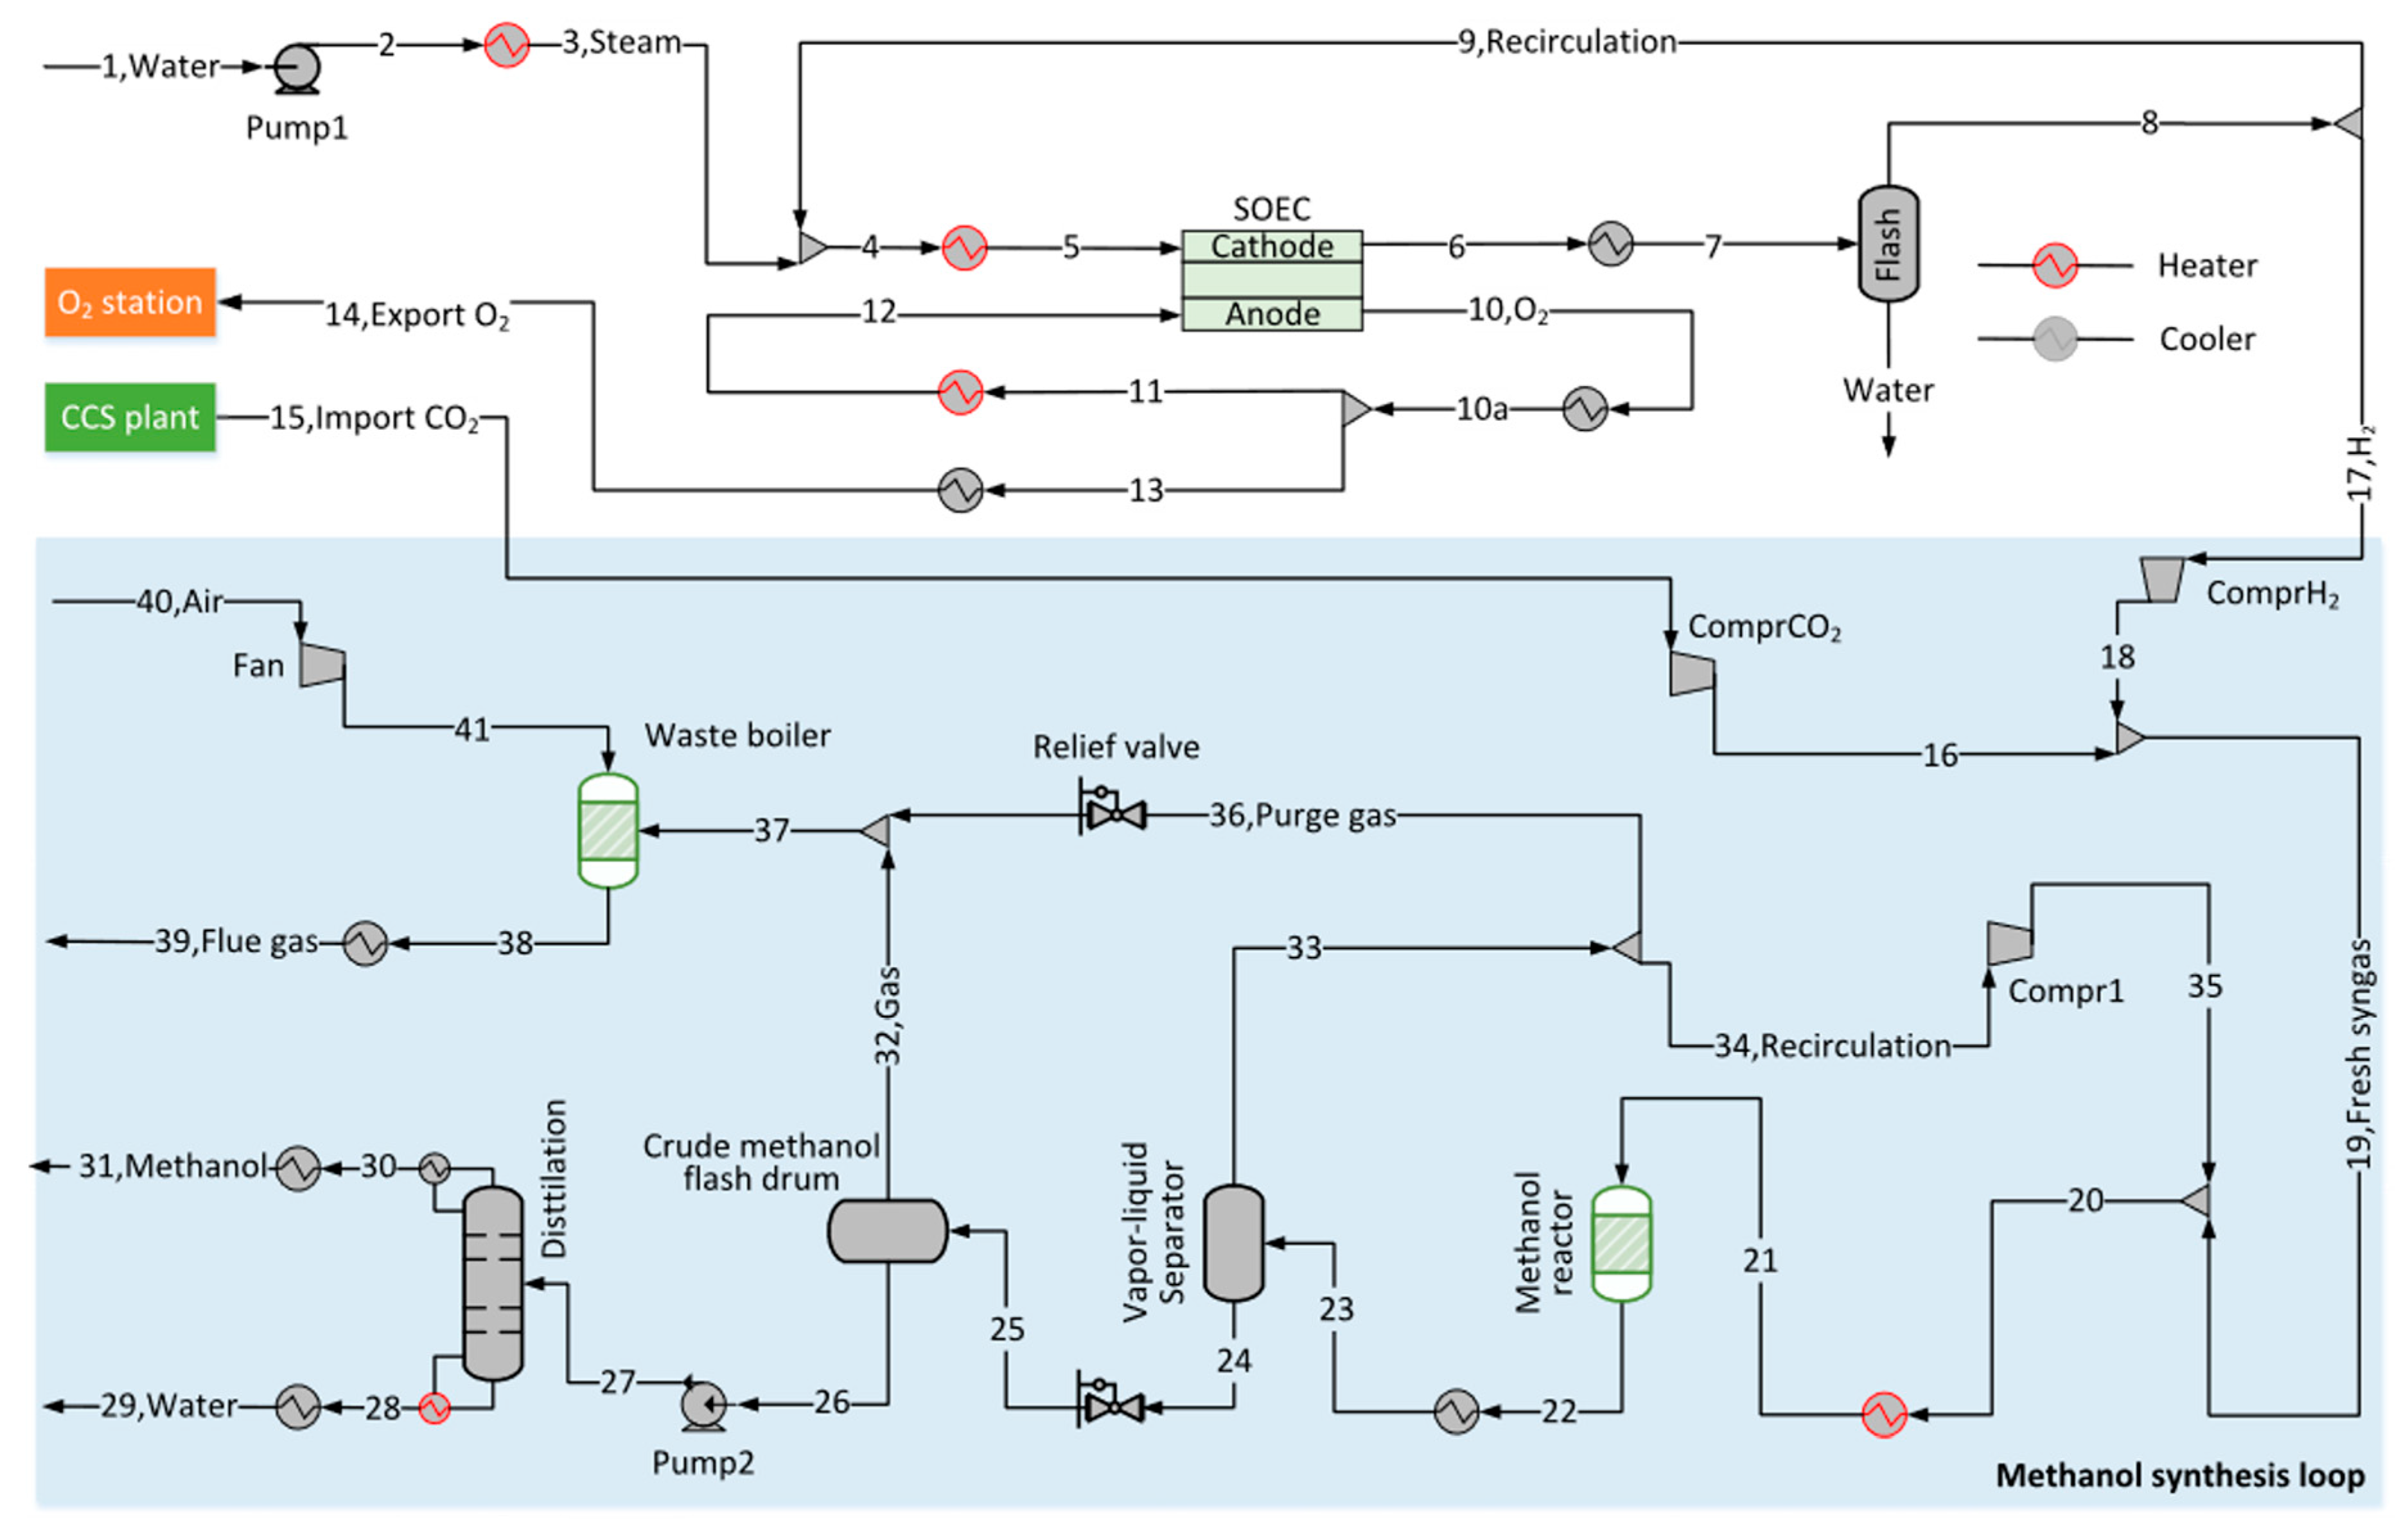
2. System Description and Modeling

The proposed CO2-to-methanol integrated with SOE process is illustrated in Figure 1 with steady-state simulation models developed in ASPEN PLUS. The system produces annually 100 kton of methanol with a purity of 99.7 wt%, which is the common scale of commercial methanol plants. The system mainly consists of two blocks: SOE process and methanol synthesis upgrading.

2.1. Solid-Oxide Electrolysis Process

The SOE processes have been described clearly in the authors’ publications, e.g., [33,34,35,36]. The demineralized water (1) is first vaporized and then mixed with the recirculated cooled product (9) from the SOE. The mixed feed (4) is further heated to 750 °C mainly by SOE outlets, waste boiler, or electrical heating if necessary. The steam is then partially decomposed into hydrogen and oxygen in the SOE, and the produced gas mixture (6) is cooled to 40 °C before entering a flash drum, where most of the unreacted water is separated. The obtained hydrogen (17) is transported to the methanol synthesis process, while the oxygen is piped to the oxygen station as a byproduct. The sweep oxygen (11) is cooled or heated to 750 °C and fed into the SOE for the thermal management of the stack.
For the SOE modeling, a quasi-2D model developed and experimentally validated in [33,34,35] is employed. The SOE operates adiabatically with an inlet temperature of 750 °C and a maximum temperature gradient of 120 °C. The other key parameters are shown in Table 1. Under the adiabatic conditions, if the stack operates with a properly large current density (overpotential), the stack outlet temperature will be higher than the inlet temperature [33], which offers additional freedom and benefits for system design since electrical heating can be reduced.

2.2. Methanol Synthesis and Upgrading

Methanol production via CO2 hydrogenation is mainly based on two reactions, i.e., methanol synthesis Equation (1) and reverse water gas shift (RWGS) Equation (2) [1,4,19].
3 H 2 +   CO 2 CH 3 OH + H 2 O     H 298 K   =   49.5   kJ / mol
H 2 +   CO 2 CO + H 2 O     H 298 K   =   41.2   kJ / mol
The CO2-to-methanol model is mainly built on the basis of the work of References [4,19]. The commercial catalyst CuO-ZnO-Al2O3 is employed for a feed ratio of H2/CO2 being 3 at 290 °C and 78 bar with a recirculation ratio of 5.2, achieving a single-pass CO2-to-methanol conversion of 21% and a crude methanol content of 4.4 vol.%. In line with the capacity of commercial methanol plants, the annual yield of methanol of the proposed system is set as 100 kton with a purity of 99.7 wt%. Assuming annual operation hours of 7200, the CO2 stream fed into the system is around 21 ton/hr.
A CO2 capture unit was assumed to be located near the methanol plant supplying carbon dioxide at 2 bar and ambient temperature. We assumed to use captured CO2 because we wanted to fix a cost of carbon dioxide to be used in the economic analysis. Solutions such as the one described in [38] are too dependent on the location of the plant and cannot be generalized. It is mixed with 2.9 ton/h of H2 (17) and then enters the methanol synthesis process. The reactant is pressurized to 78 bar and heated up to 230 °C before entering the reactor, which is modeled as an isothermal reactor at 290 °C. The resulting gas (22) from the methanol reactor is cooled to 40 °C with vapor-liquid separation at 74 bar. The gas stream (33) of unreacted H2 and CO2 is recycled to the reactor after purging around 1.3% of it to avoid the accumulation of inert gases. The liquid stream (24) is relieved to 1.2 bar and fed to the crude methanol flash drum. The residue gas (32), mainly H2 and CO2, is burnt in a waste boiler together with the purge gas to achieve heat recovery. The liquid, the crude methanol of 63 wt% methanol and 37 wt% water, out of the crude methanol flash drum is gas-free. The crude methanol (26) is pressurized to 3 bar and further upgraded in a distillation column (modeled with RadFrac column) to reach a purity of 99.7 wt%.

2.3. Heat Exchanger Network and Steam Turbine Network

The performance of the heat exchanger network is estimated by mathematically-formulated heat cascade calculation, described elsewhere [33,39]. The steam turbine network (steam cycle) is employed for heat recovery, which is formulated as described in [40,41].

3. Methodology

The optimal system design is investigated regarding the overall energy efficiency and methanol product cost, as described below.

3.1. Thermodynamic Performance Indicators

The thermodynamic performance is evaluated with energy efficiency (η) in the following Equation (3).
η = M · M e O H L H V M e O H Δ E ·
where M · M e O H is mass flow of the produced methanol, LHVMeOH is the LHV of methanol, Δ E · is electric power input.

3.2. Economic Performance Indicators

Cost evaluation considers both capital expenditure (CAPEX) and operational expenditure (OPEX). The investment cost (CAPEX) is estimated based on [37], with the uncertainty range up to ±30% [37,42,43]. The OPEX includes depreciation costs and variable costs, related to labor, electricity, catalysts, oxygen, and carbon dioxide, etc.

3.2.1. Capital Investment

The pressure-and-material-factored method and the capacity-factored method are employed to calculate the investment cost. The capacity-factored method given in Equation (4) is used for the components listed in Table 2.
C i n v = I i n d e x I r e f _ i n d e x C p , r e f 0 ( A A r e f 0 ) a
where C p , r e f 0 and A r e f 0 refer to the base cost and size or capacity of equipment taken from literature while α is cost exponent, which is assumed to be 0.65–0.85. Iindex and Iref_index are Marshall and Swift index of the desired and reference year (2017).
The pressure-and-material-factored method is for standard series equipment and process vessels, such as pump, compressor, heat exchanger, flash drum, waste boiler and distillation column. The related factors refer to the paper by Turton et al. [37].

3.2.2. Operational Cost

The OPEX calculation is based on literature [46]. The depreciation cost is calculated by dividing the total investment cost by the present worth of annuity as shown in Equation (5).
C d e p = C i n v × i × ( i + 1 ) n ( i + 1 ) n 1
where Cdep is the depreciation cost ($/year), Cinv is the total investment cost ($/year), i is the annual interest rate and n is the plant lifetime (year).

3.2.3. Payback Time and Levelized Methanol Production Cost

The payback time τ is calculated by dividing the total investment cost with the annual profit of the methanol plant in Equation (6) with the annual profit being the difference between revenue and operation cost:
τ = C i n v C r e v m e t h + C r e v b y p C o p t
where Copt is the operating cost ($/year), C r e v M e O H is the methanol revenue ($/year), and C r e v b y p is the revenue of byproduct from the exported electricity and the sold oxygen ($/year).
The methanol production cost ($/ton) is defined in Equation (7).
C M e O H = C o p t + C d e p C r e v b y p P M e O H
where PMeOH is methanol production (ton/year).

3.3. Optimization Methodology and Problem Definition

Multi-objective techno-economic optimization is carried out with an inhouse optimization platform developed by the Group of Industrial Process and Energy Systems Engineering at École Polytechnique Fédérale de Lausanne [47,48,49], Switzerland. The methodology has been described in detail in [33,47,49] and applied to deal with various energy systems and industrial processes [33,34,35]. The iterative optimization is implemented as follows with the decision variables and their bounds considered listed in Table 1.
(1) For specific values of the decision variables, Aspen Plus is employed to obtain the mass and energy flows of the considered process and also each equipment.
(2) Heat cascade calculation is performed mathematically with the selection and sizing of hot and cold utilities to close the energy balance. Classical hot-cold and grand composite curves are obtained for the interpretation of thermal integration as well as the calculation of heat exchanger numbers and area [37,49].
(3) The objective functions, i.e., the system efficiency, methanol production cost (payback time), are then calculated with the estimation of investment and operating costs, following Section 3.2.
(4) Genetic algorithm is employed to iterate the steps 1–3 with a systematic generation of decision variables and comparison of the evaluated solutions and to finally obtain a cluster of Pareto-optimal solutions (or Pareto front) revealing the trade-offs between the conflicting objective functions.

4. Results and Discussion

The techno-economic feasibility of the proposed system is investigated via the Pareto fronts, system-level heat cascade, as well as cost breakdown. A sensitivity analysis is conducted to identify the major factors enhancing its economic performance.

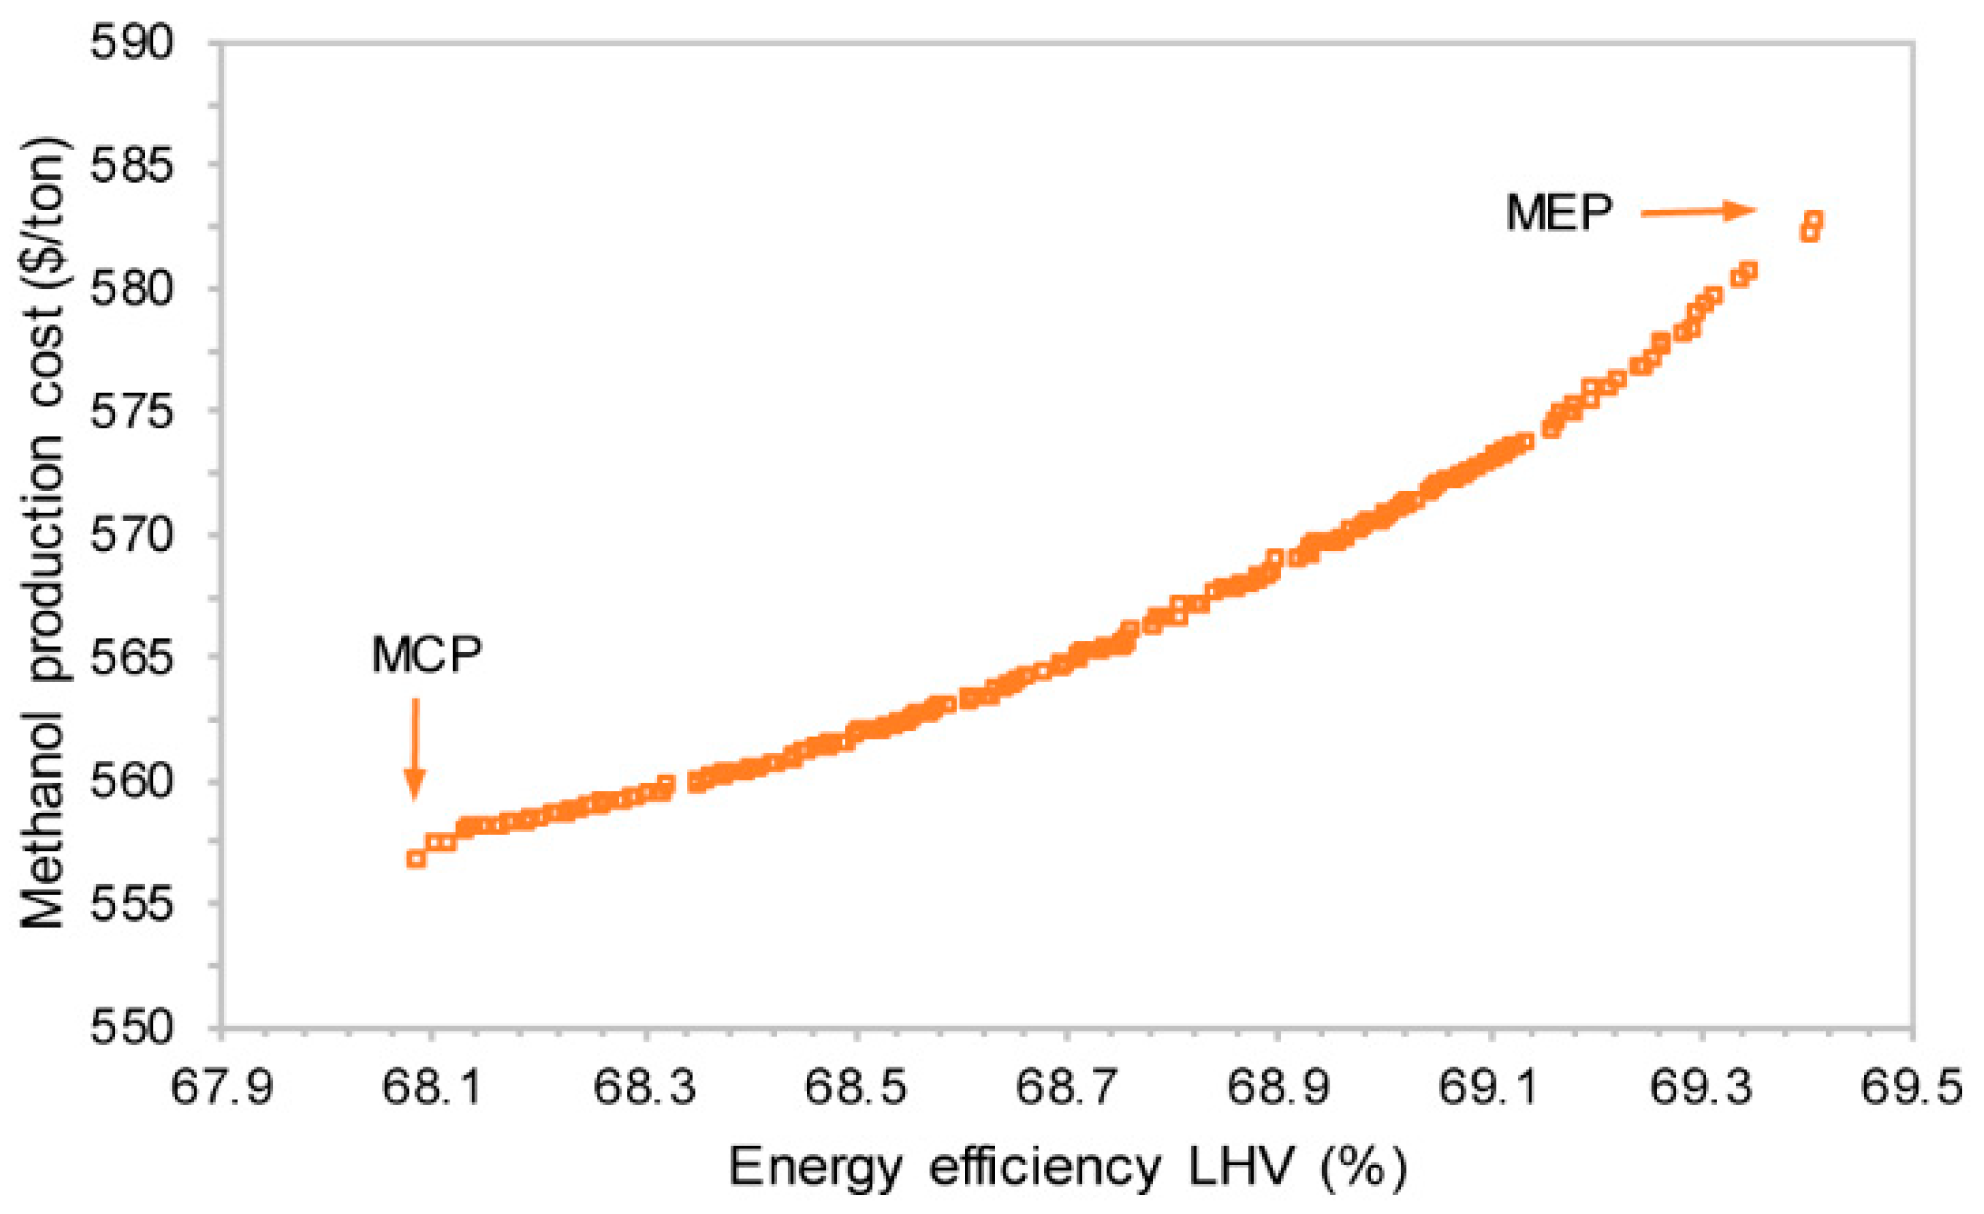
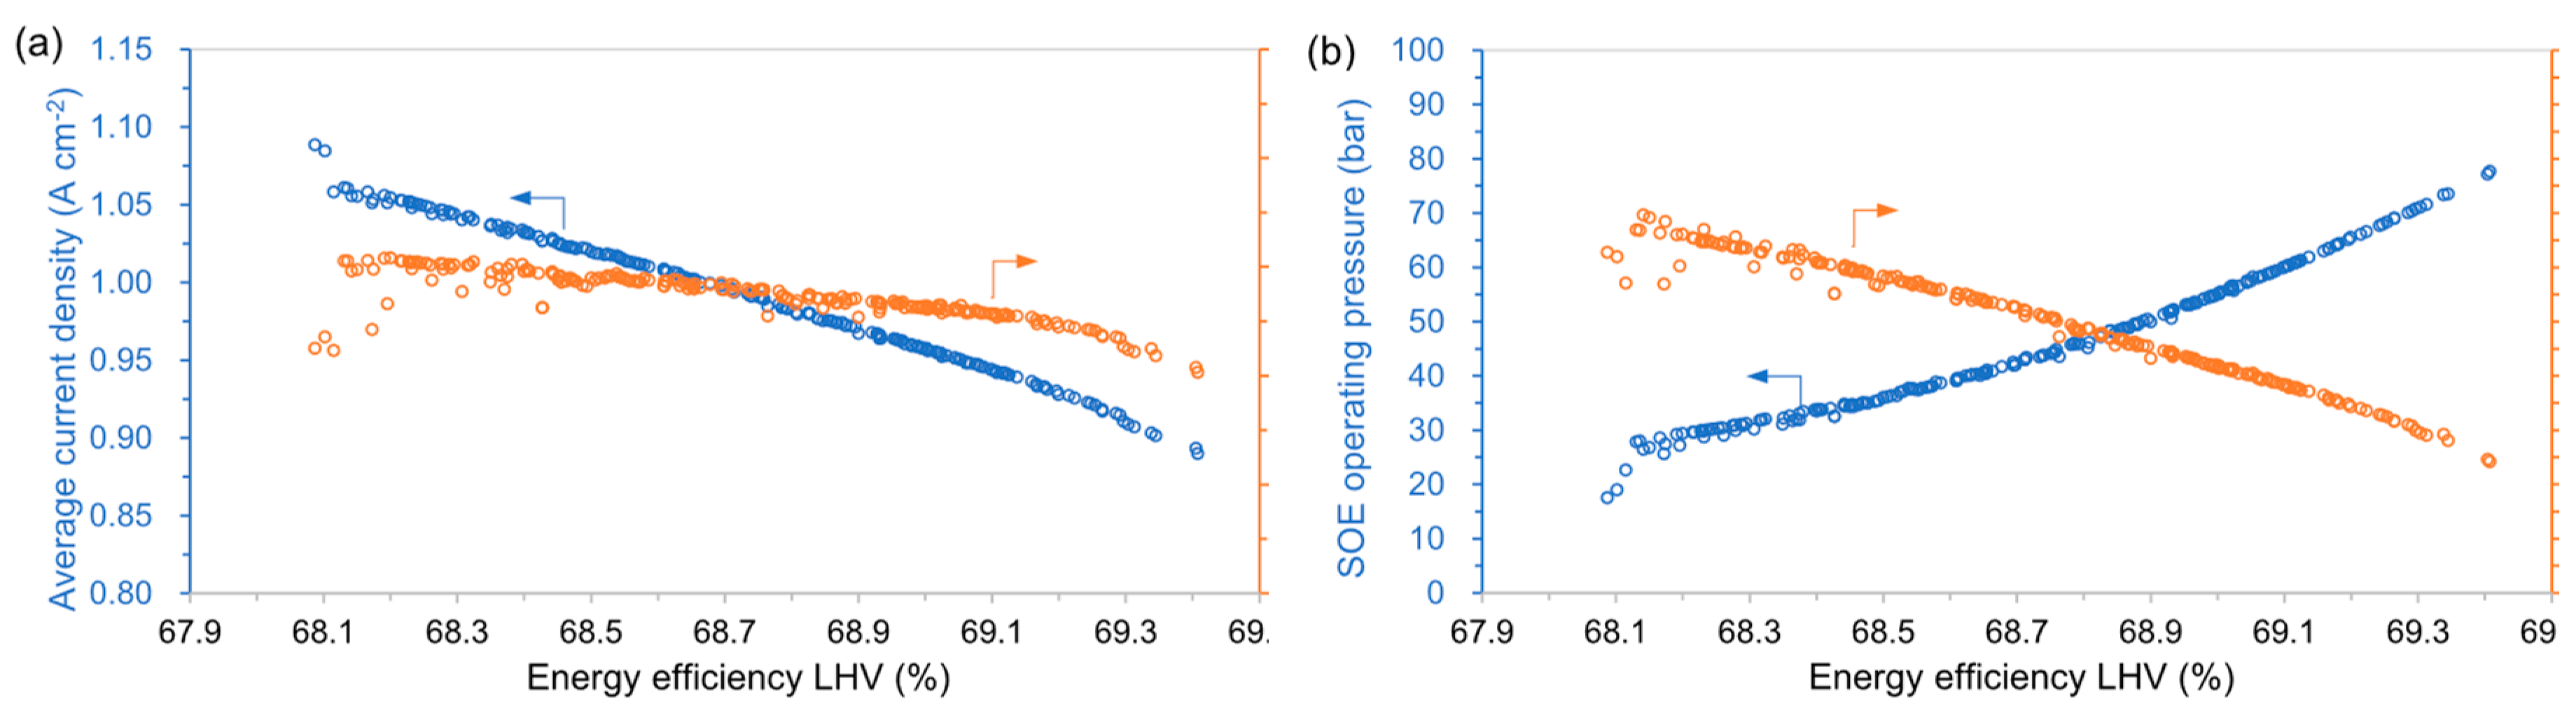
4.1. Trade-Off between Efficiency and Cost

There is only a slight trade-off between the cost and efficiency, as shown in Figure 2: The methanol production cost increases with the increasing system efficiency. However, the ranges of both objective functions are limited, which indicates that the operating window of the SOE stack is rather narrow to realize a system efficiency as high as possible. This can be explained by the variation of the key decision variables with respect to the system efficiency as shown in Figure 3. The efficiency increase is mainly due to a decrease in current density, which results in a reduced overpotential (voltage), as shown in Figure 3a. The current density remains at a high level between 0.9 and 1.1 A/cm2 with the voltage slightly over 1.42 V, which indicates that the stacks are operated under strongly exothermic mode with the stack outlet temperature hitting the upper bound of 870 °C for an inlet temperature of 750 °C. A further increase in the current density will require additional sweep gas to cool the stack, thus the upper bound of the sweep gas constrains the minimum system efficiency (Figure 3b). The factor of limiting the maximum efficiency is, however, due to the system-level heat integration, as discussed below.
The SOE is preferred to operate under high pressure over 20 bar (Figure 3b), due to the high pressure of the methanol synthesis process. This allows for reducing significantly the work required for hydrogen compression, which can take up to 1/4 and even 1/3 of the total power consumption. The highest SOE pressure is approaching 78 bar, which indicates the avoidance of hydrogen compression.

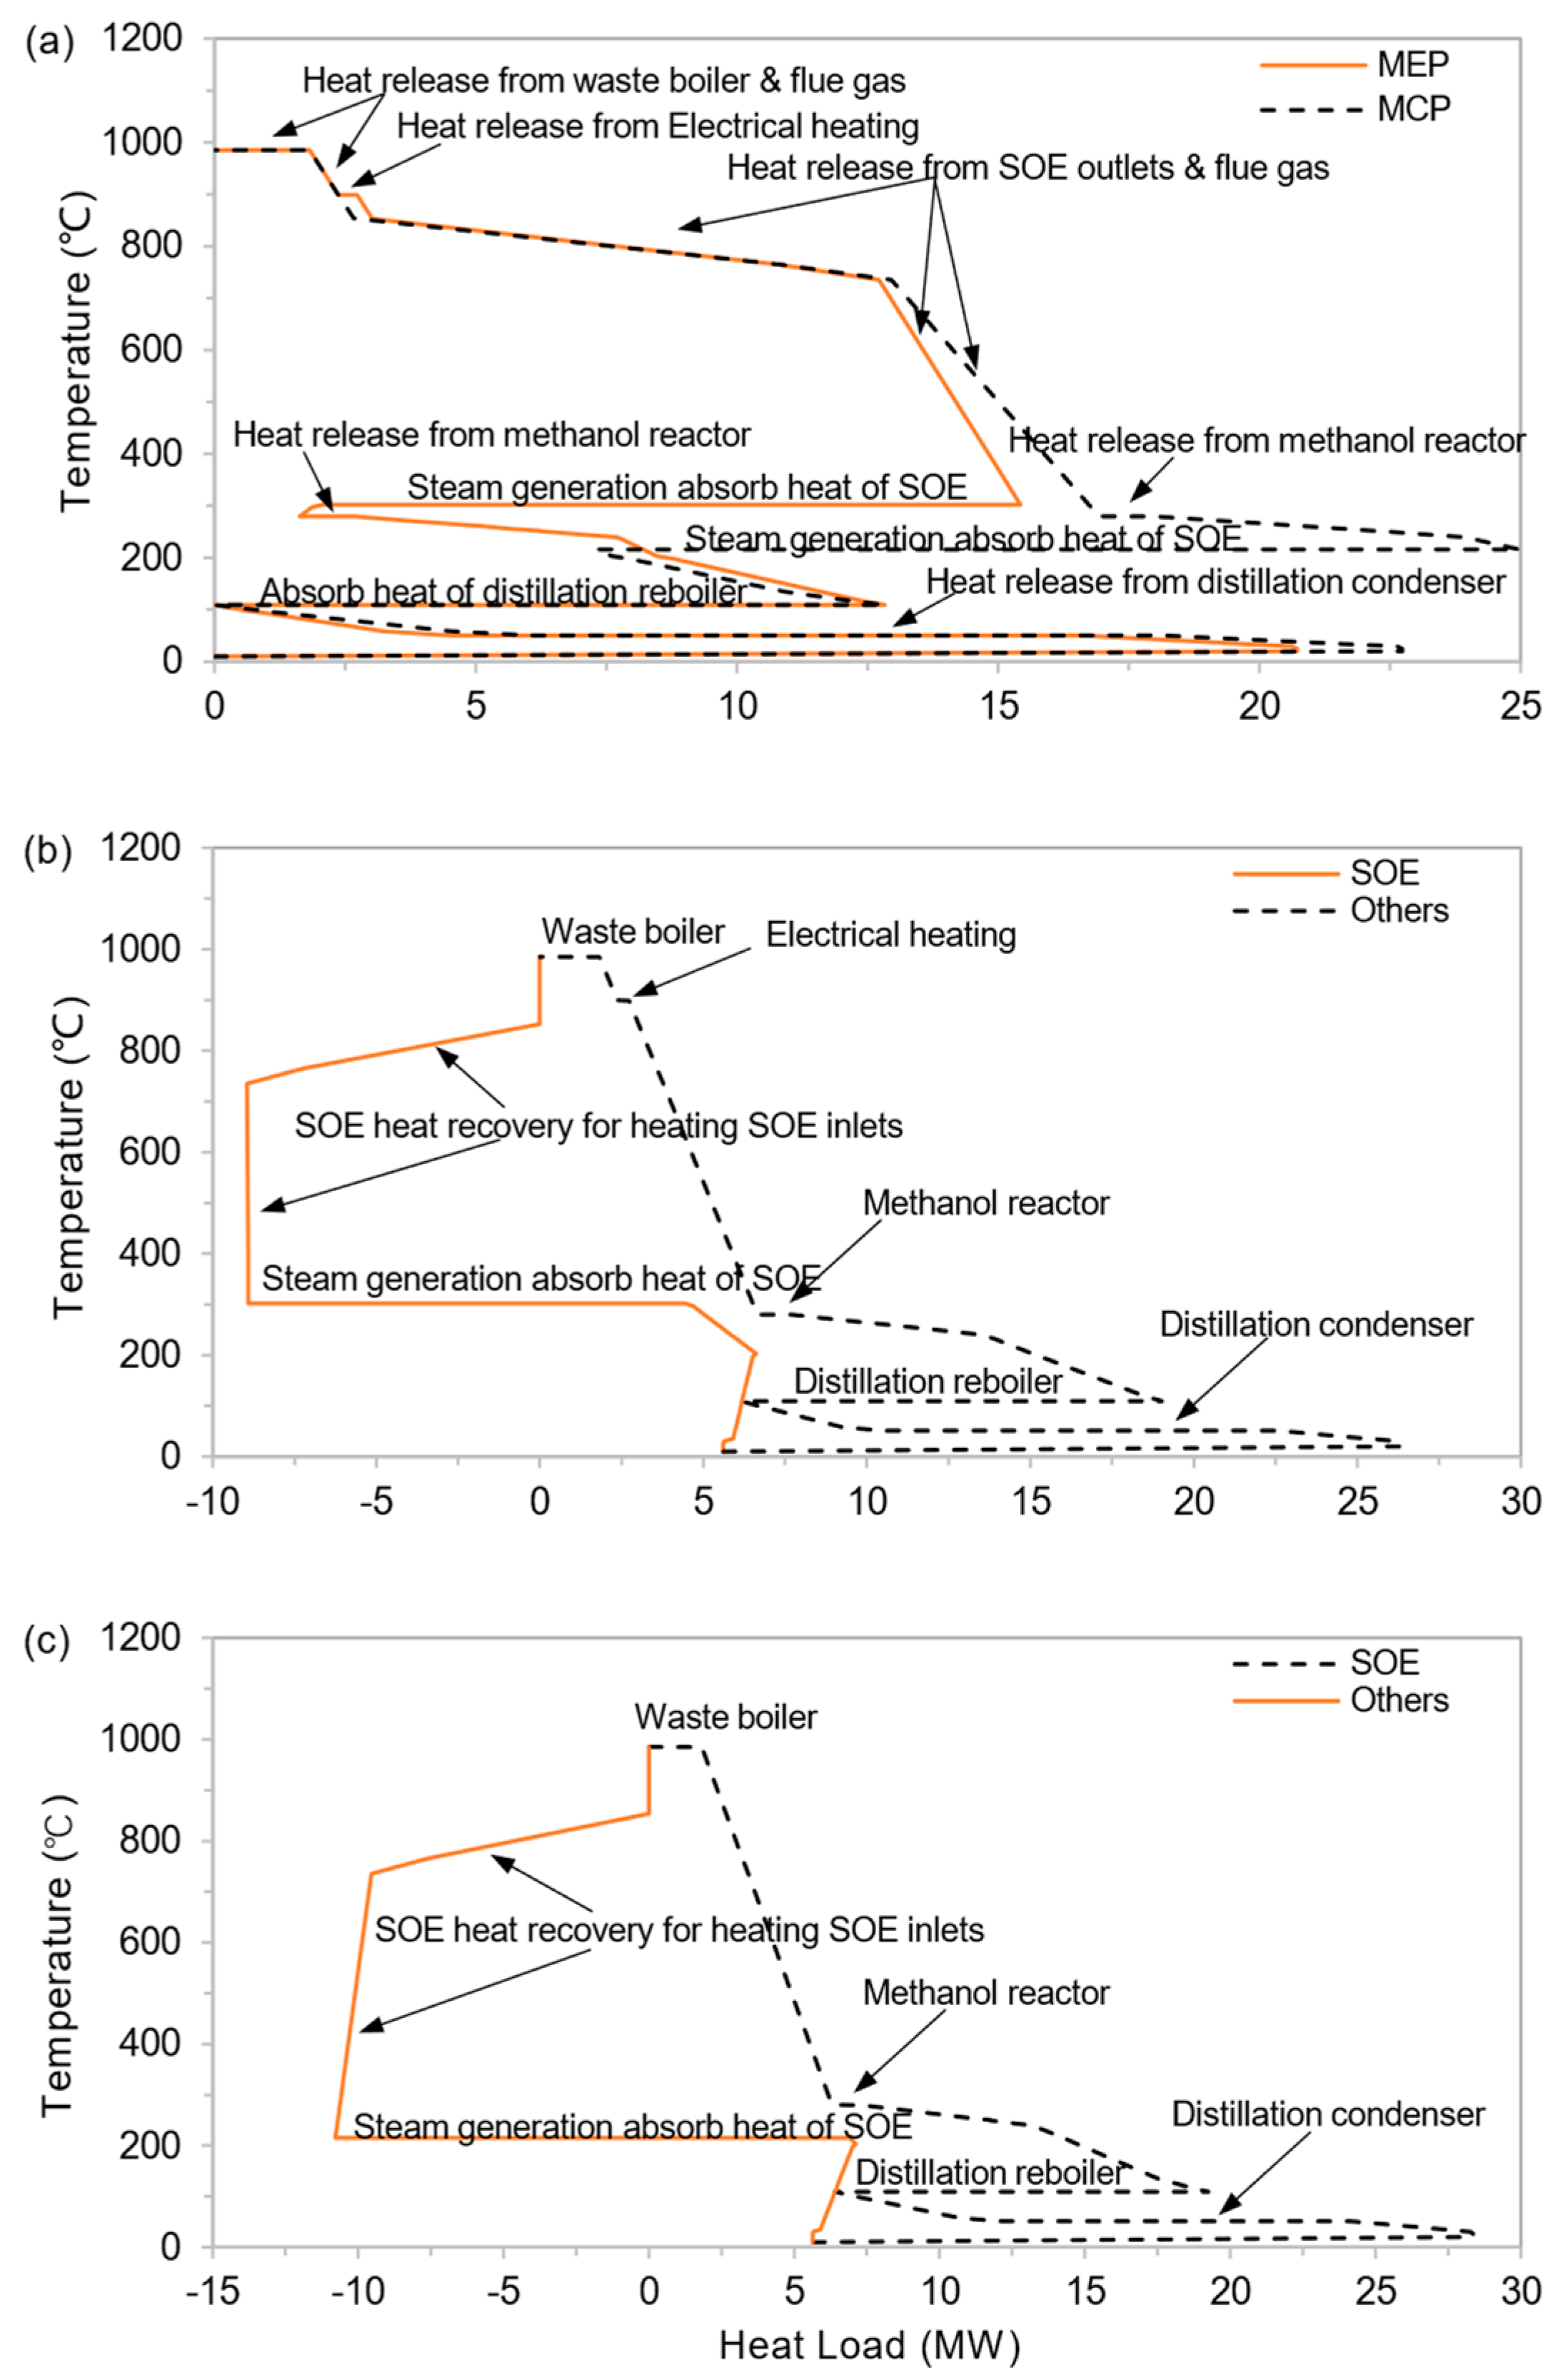
4.2. Heat Integration

Two design points, i.e., minimum cost design point (MCP) and maximum efficiency design point (MEP), are selected for detailed investigation on the system level heat integration, as shown in Figure 4. It is built from a summation of hot and cold streams in the same temperature intervals. The segment from left to right means excess of heat that needs to be extracted from the system, whereas the system needs to absorb heat. It provides the following straightforward conclusions from Figure 4a. Below 400 °C, there is a significant heat requirement for water vaporization and distillation column, which leads to the pinch point of the heat exchange. The steam generation between 200 and 300 °C is supported mainly by the high-temperature heat available from the waste boiler and the SOE outlet, which is not rational for the heat cascade utilization. The SOE outlet contributes a significant amount of heat, indicating the importance of the exothermic operation of the SOE for the system-level heat management. The heat for distillation column can be more or less covered by the heat released from methanol synthesis process. The MCP case runs at slightly higher current density than the MEP case under the same reactant utilization, indicating slightly more water input and thus heat for steam generation. This difference is also shown in the integrated grand composite curves of the SOE in Figure 4b,c, where the composite curves without SOE are very similar to each other, while the heat supply and uptake by the SOE are slightly different with different operating points.
In general, by choosing proper operating point of the SOE, the SOE integrated CO2-to-methanol can realize the self-sufficient heat management, so that it only needs a small or even no electrical heating.

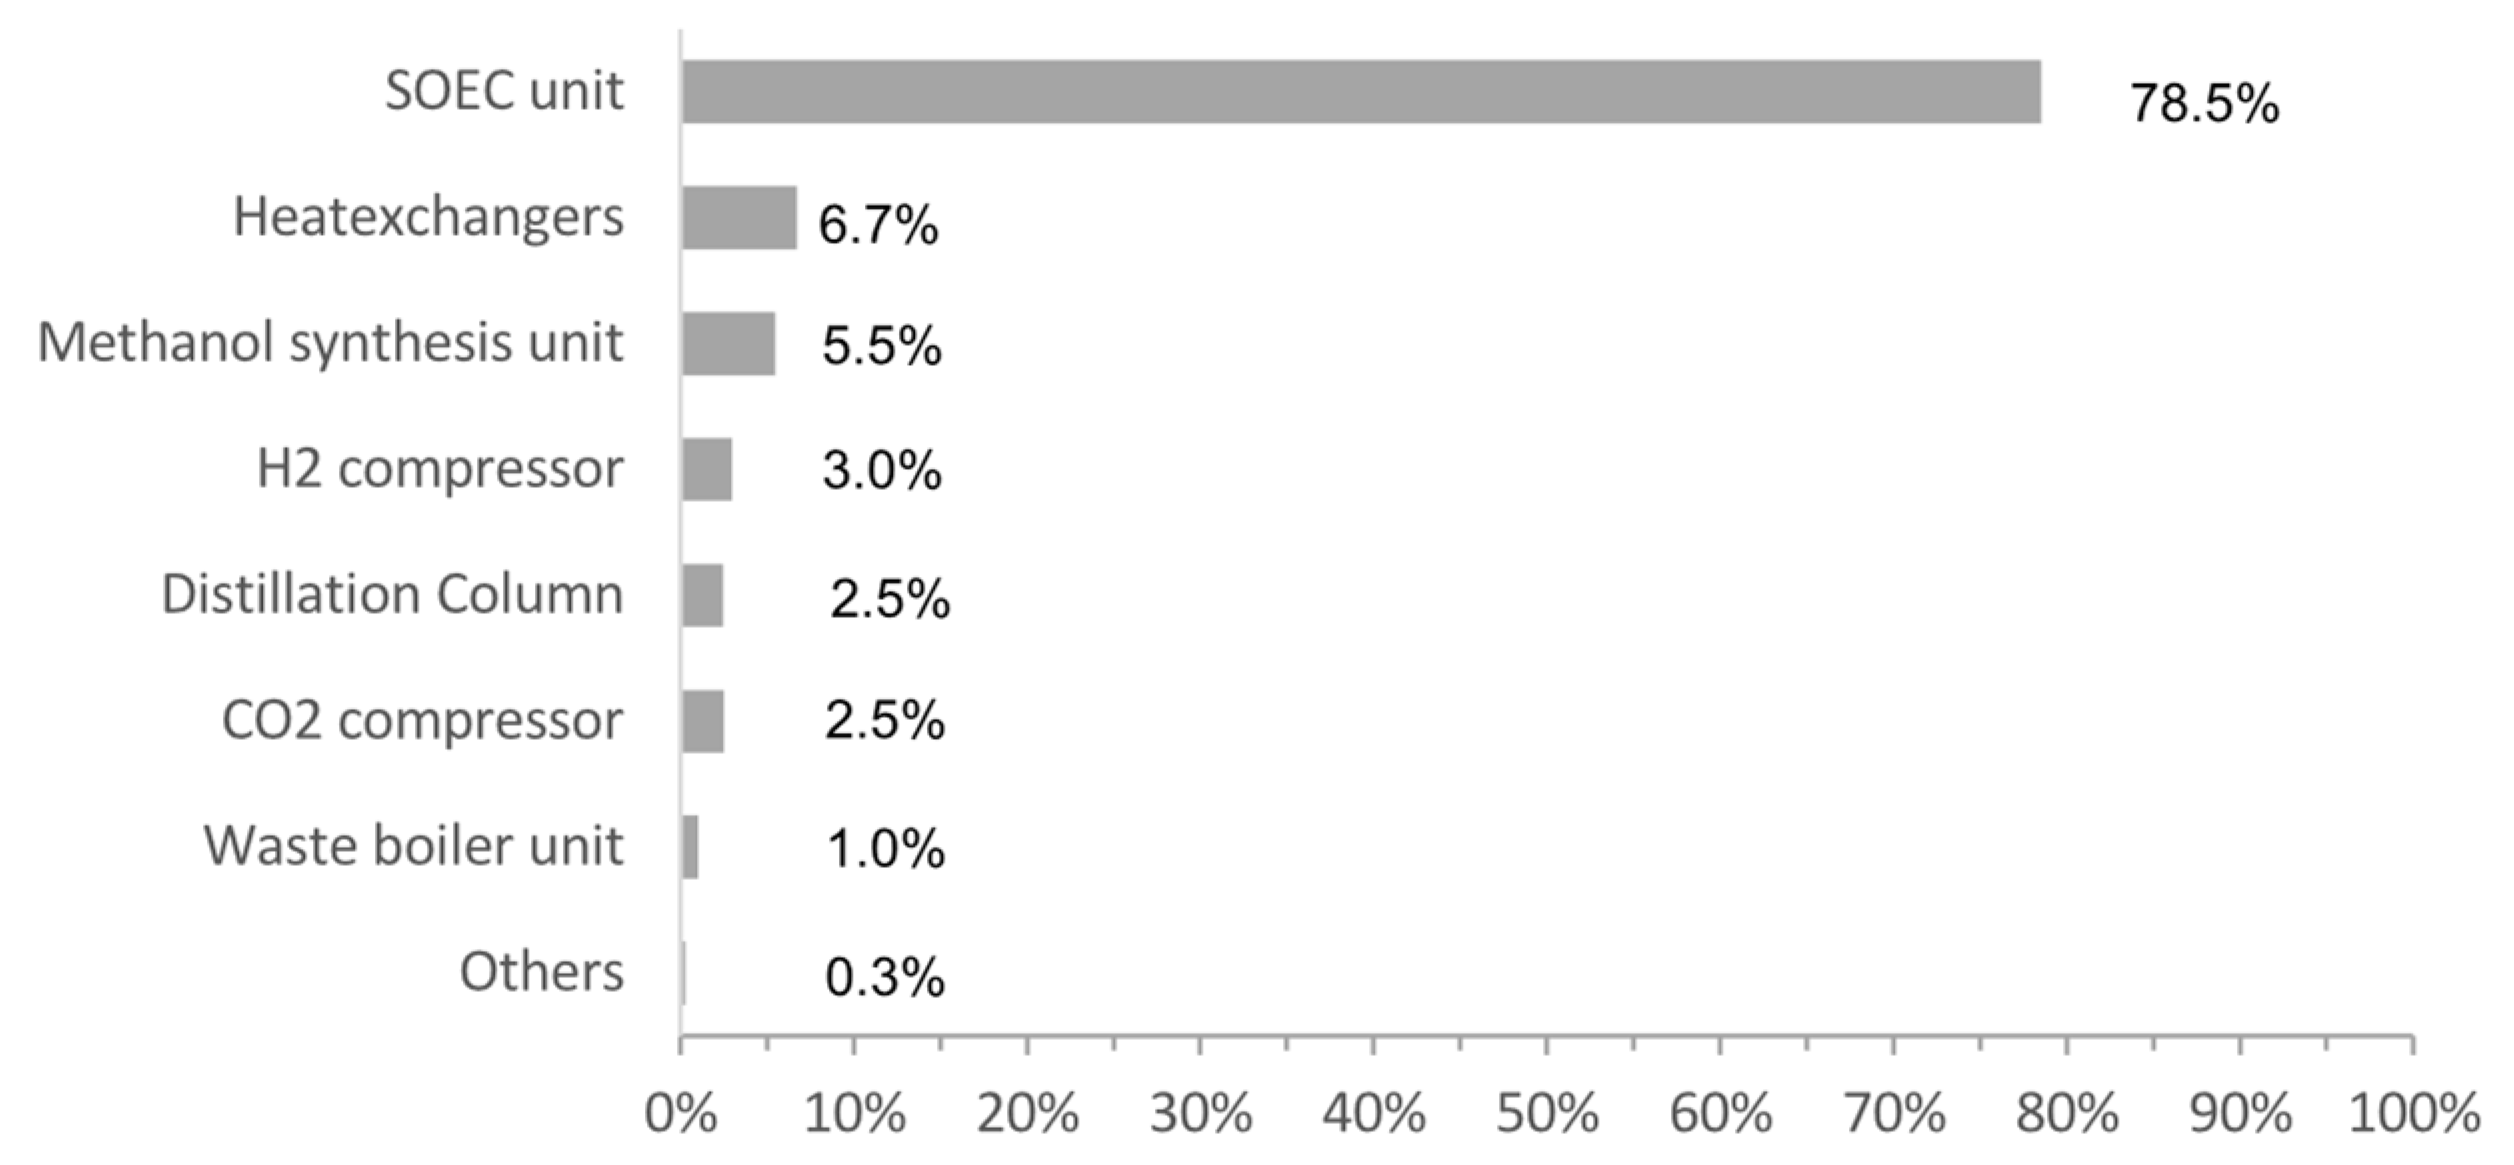
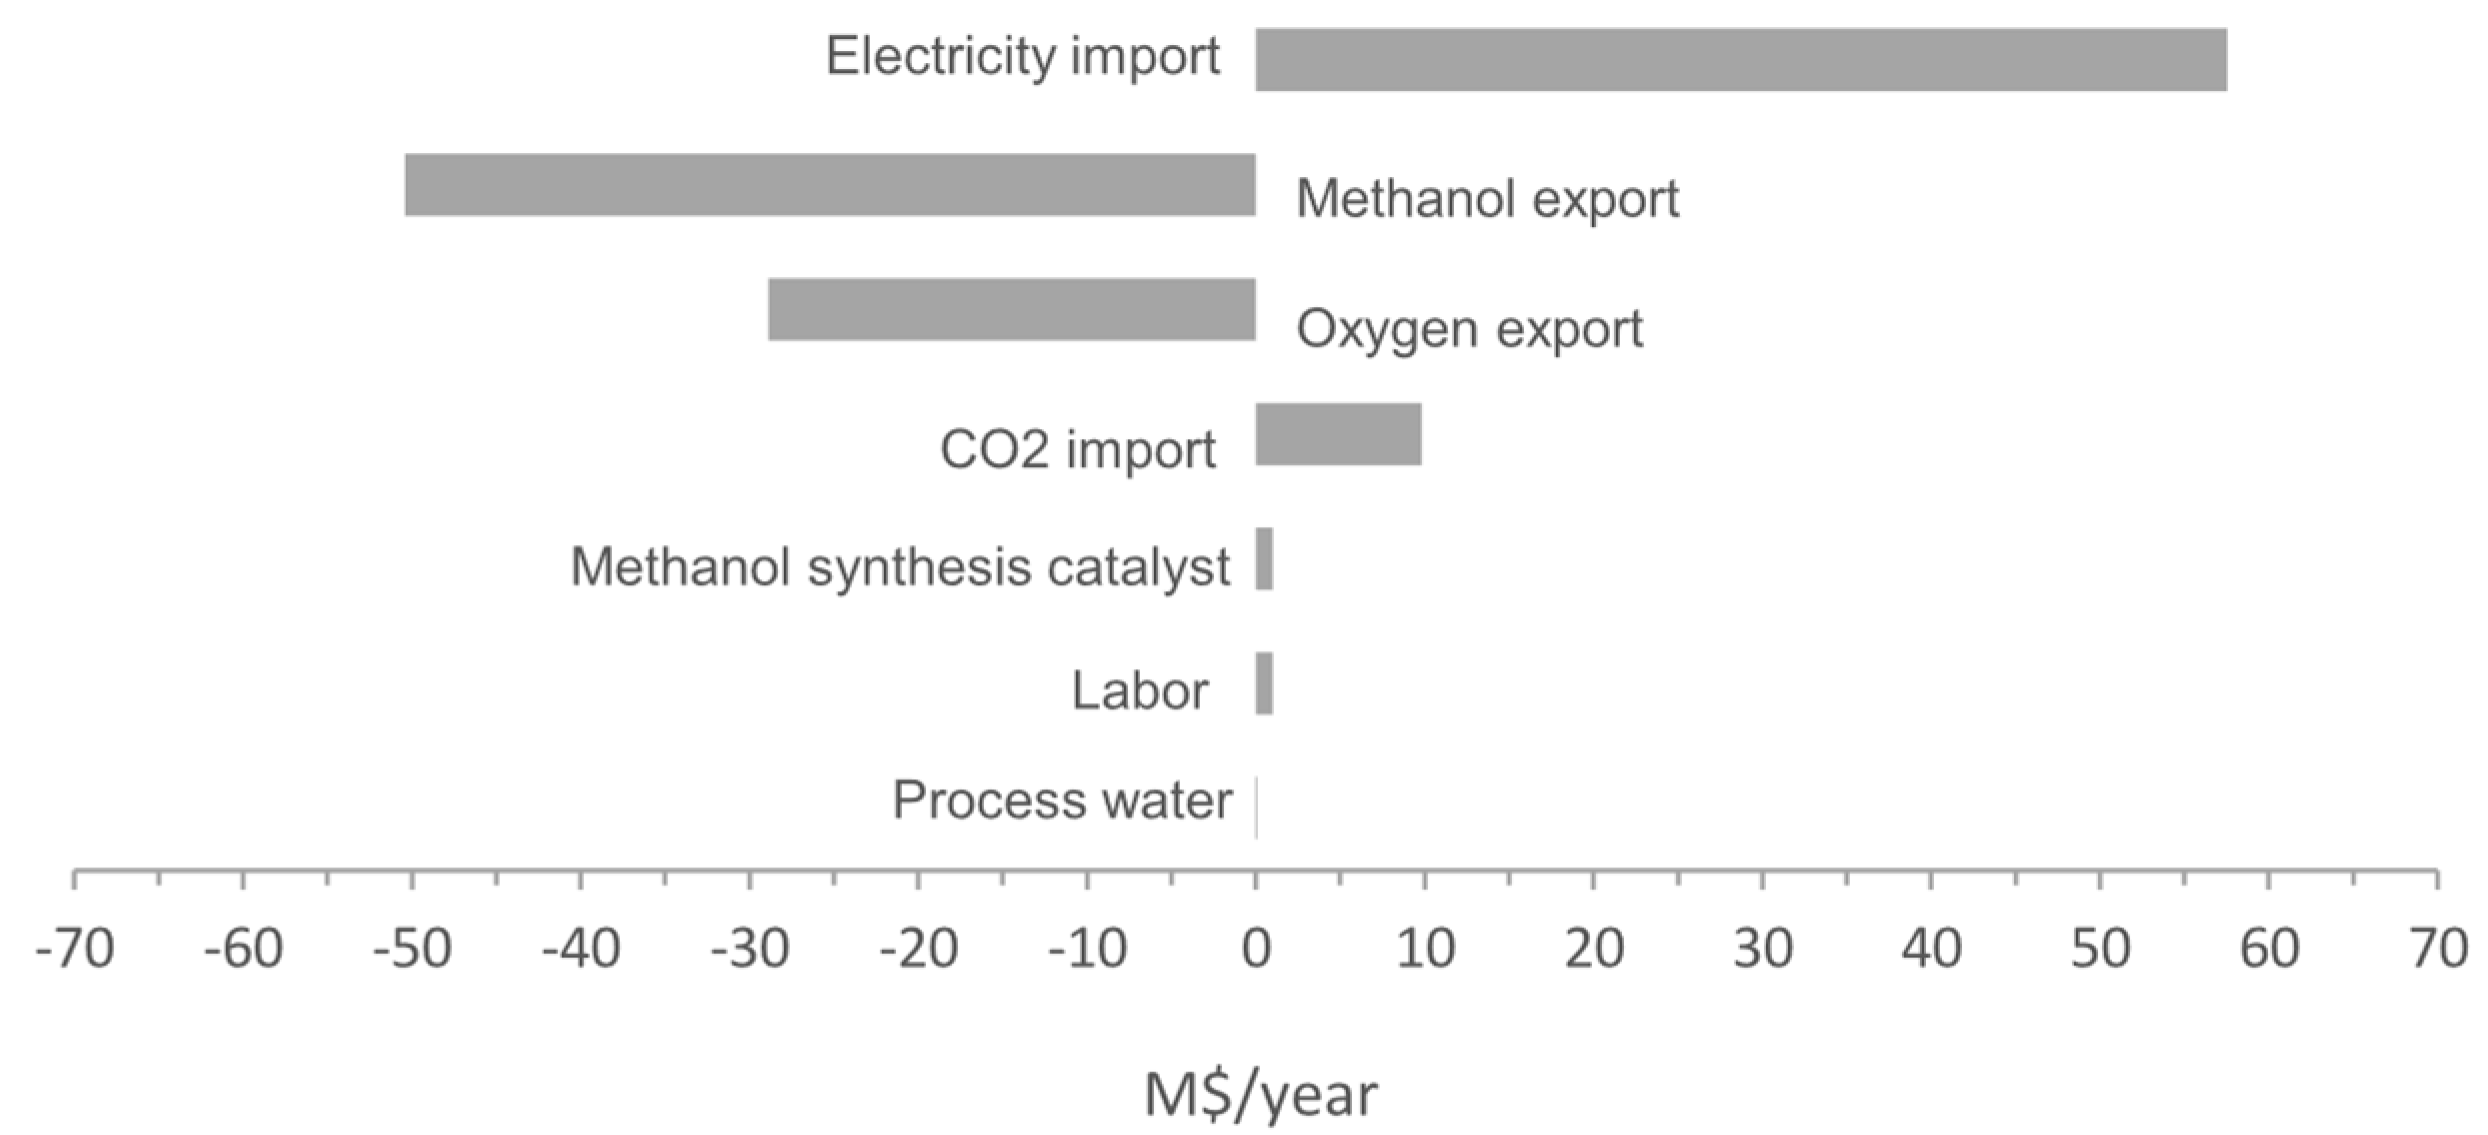
4.3. Cost Distribution

Based on the economic assumptions given in Table 3, the two chosen designs are economically evaluated with the key indicator given in Table 4. It shows that, for the given economic assumptions, both designs are not economically feasible with a payback time over 13 years. However, it is still interesting to understand the cost breakdown and identify the key contributors to the levelized methanol cost. The cost distribution is analyzed based on MCP. Figure 5 shows the investment distribution of the proposed case at MCP. The total investment is 133.8 M$, with the highest contribution from the SOE (79%). All other components contribute less than 10%, respectively. Figure 6 shows the distribution of operating cost (positive value) and revenue (negative value) of the proposed case at MCP. The total operating cost (70 M$/year) is mostly contributed by the electricity consumption, about 50 M$/year, followed by the CO2 purchase, about 10 M$/year. The revenue comes from the sale of methanol and byproduct oxygen, about 50 M$/year and 29 M$/year, respectively. Therefore, it can be seen that the main influence factors of methanol production cost and payback time will be the prices of the SOE stack, the imported electricity, and CO2.

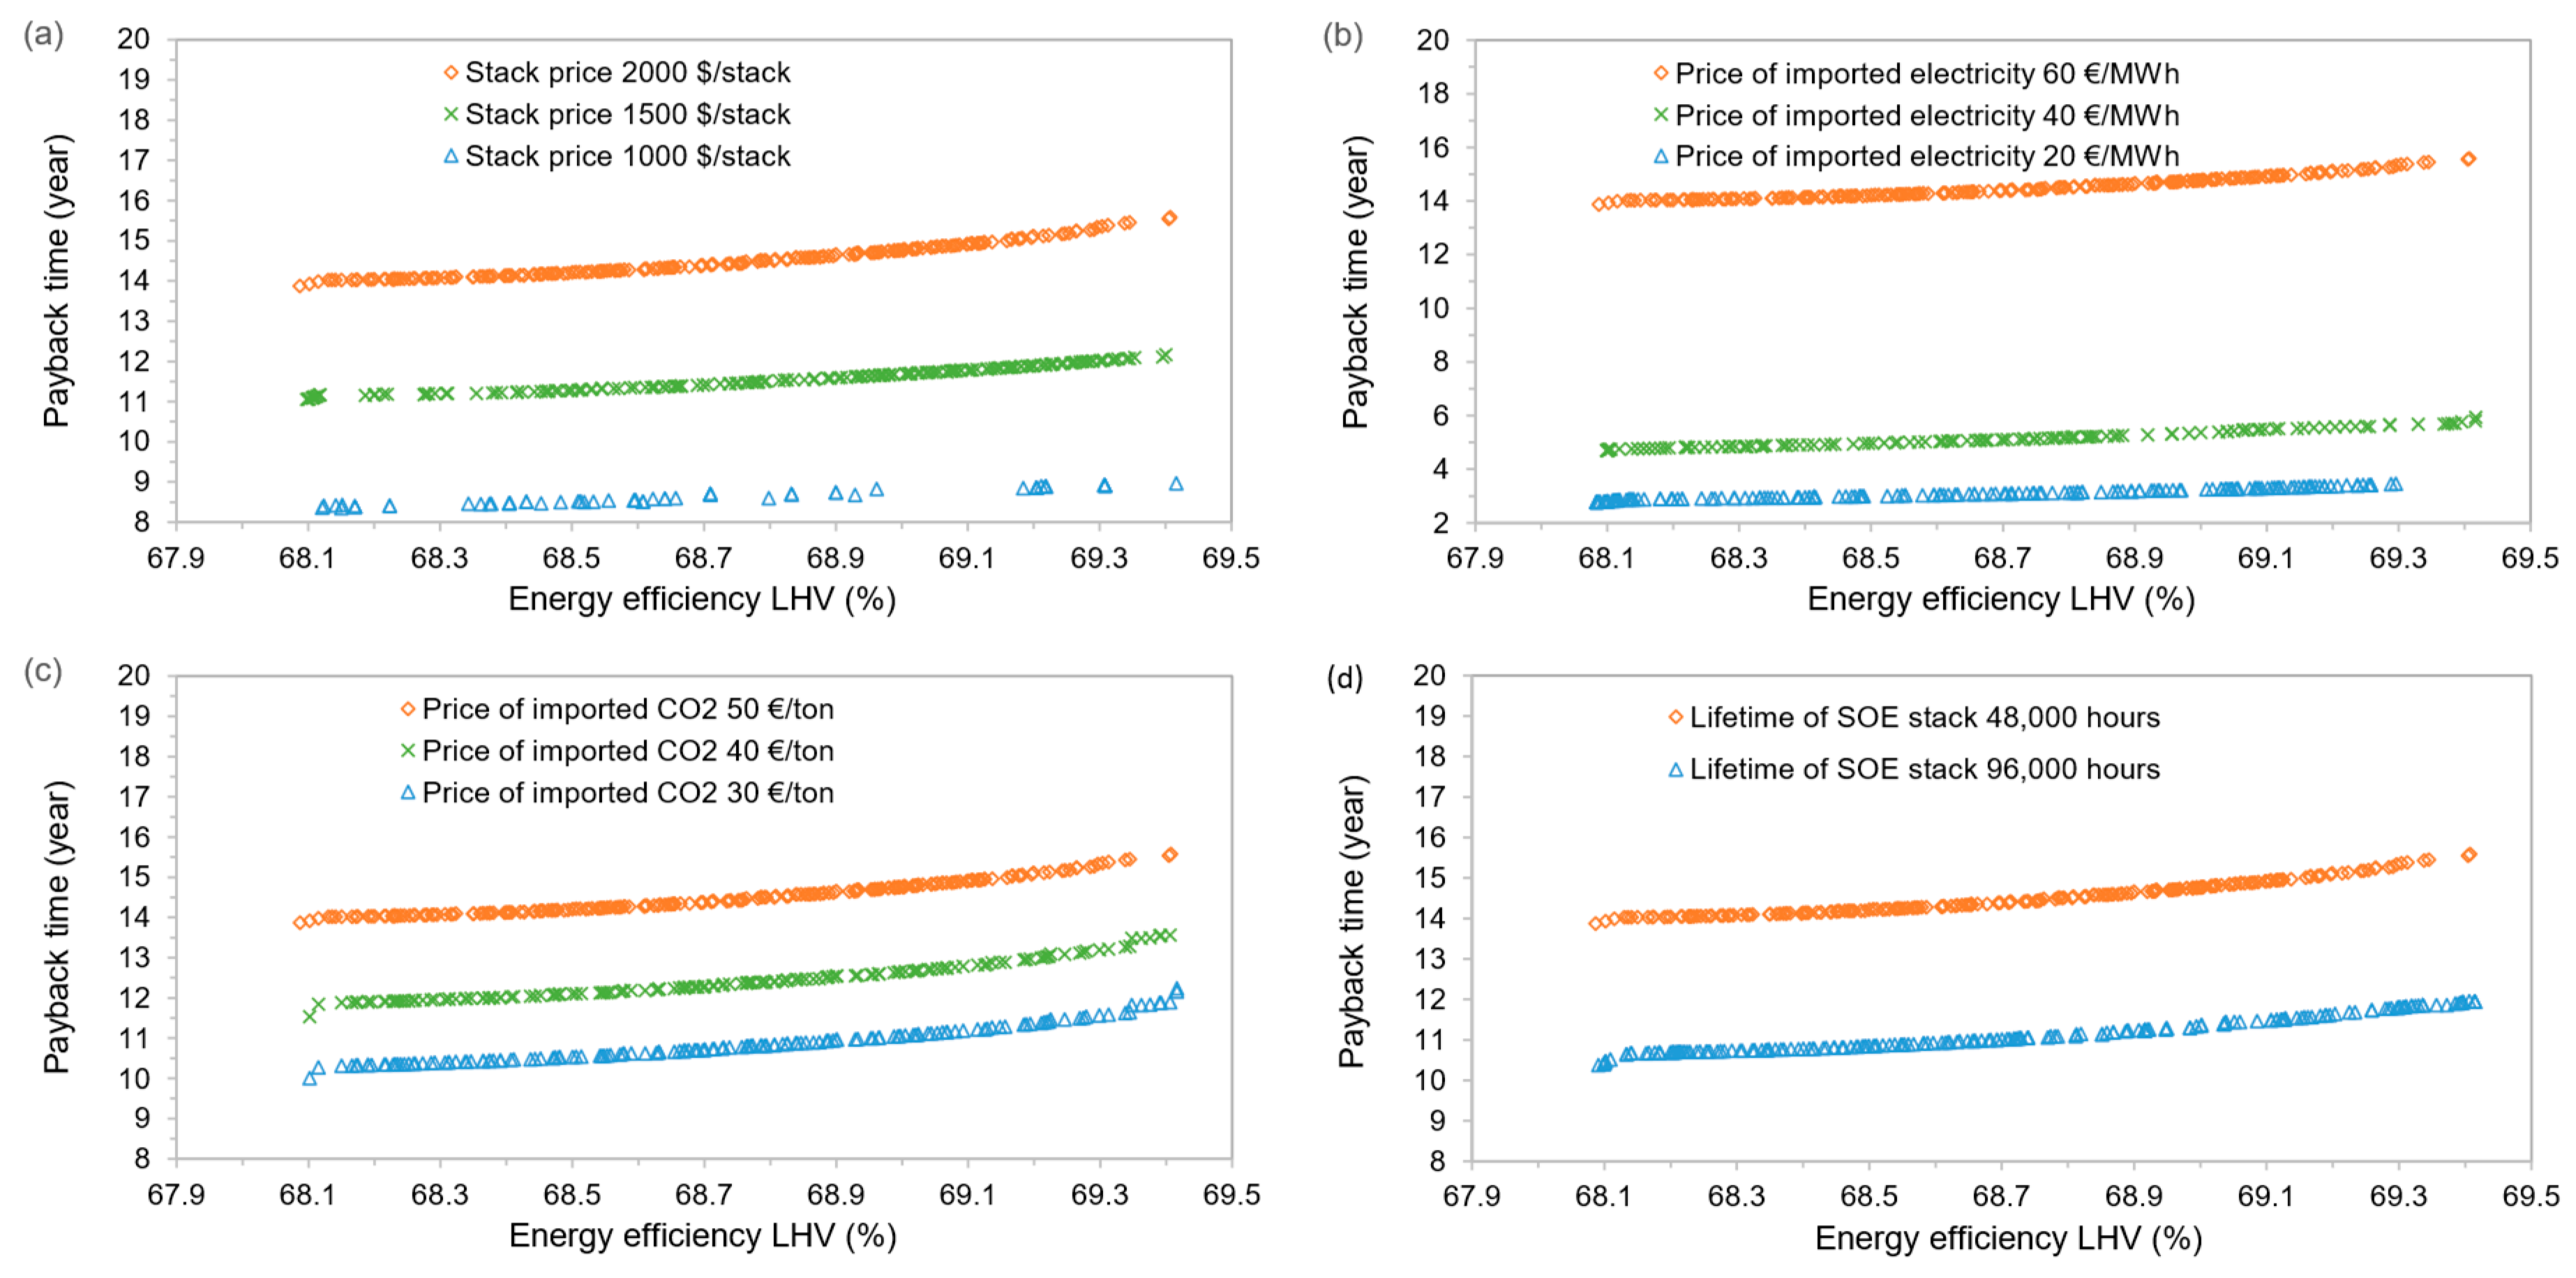
4.4. Sensitivity Analysis

A sensitivity analysis is further performed to the key influential factors, the prices of the imported electricity and carbon dioxide, and the SOE stack to identify the economic conditions making such integrated system economically attractive. The wholesale electricity price differs from country to country. For example, the prices in the 4th quarter of 2017 are within 57–62 €/MWh in Italy, Portugal, Greece, Switzerland, and France, but the range becomes 30–31 €/MWh in Denmark, Sweden, and Norway [51]. The imported price of CO2 is assumed to be 55 €/ton according to the literature [53]. With the progress of CO2 capture and sequestration technology and governments’ concern with environmental protection, the price of imported CO2 may be reduced.
In this study, the purchase price of SOE stack is assumed to be 2000 $/stack [45], with its lifetime being 48,000 hours [28]. At present, the SOE is still at the demonstration stage with high investment costs. Mass production towards commercialization will significantly reduce the cost of SOE stack and related equipment. The stack lifetime (48,000 hours) is below the lower bound (60,000 to 90,000 hours [28]) put forward by industry experts. Therefore, SOE stacks need to be replaced for three times when the project lifetime is 25 years and operates for 7200 hours per year. In the future, with the development of materials and design of the SOE stack, the lifetime of SOE stack is expected to be significantly improved. if the lifetime of SOE stack is doubled to 96,000 hours, SOE stacks will only need to be replaced once, which significantly reduces the investment cost into SOE.
For the sensitivity analysis, the stack price varies from 2000 $/stack to 1000 $/stack, the electricity price varies from 60 to 20 €/MWh, the CO2 varies from 50 to 30 €/ton, and the lifetime of SOE stack from 48,000 to 96,000. The results are summed up in Figure 7. When the SOE stack price reduces from 2000 $/stack to 1000 $/stack (Figure 7a), the payback time decreases almost by half from 14 years to 8.4 years. When the lifetime of SOE stack extends from 48,000 to 96,000 hours, (Figure 7d), the payback time decreases almost by 30% from 14 years to 10 years. When the price of the imported electricity changes from 60 €/MWh to 20 €/MWh (Figure 7b), the payback time is reduced down to 2.8 years, which indicates great economic competitiveness. When the price of the imported CO2 varies from 50 €/ton to 30 €/ton (Figure 7c), the payback time is shortened to 10 years.
Therefore, the economic performance of such a system is very sensitive to the price of imported electricity. Take the European electricity prices in the 4th quarter of 2017 as an example, the proposed project is not feasible to be invested in some countries with higher electricity prices, such as Italy, Portugal, Greece, Switzerland, or France, but it is worth investing in Denmark, Sweden and Norway because of the lower imported electricity prices. The SOE stack price and lifetime are also highly sensitive to the investment feasibility of the project. With a 25% reduction in its price, the payback time can be reduced by about 20%. With the lifetime of SOE stack doubled to 96,000 hours, the payback time can be reduced by about 30%. It reflects the significant impact of SOE commercialization on economic feasibility. The price of the imported CO2 has a smaller impact on the investment than the two factors mentioned above.
The payback time of commercial methanol production plants is usually less than 5 years. The payback time of proposed process is over 13 years in this study. We assumed that such a long payback time, which is almost three times the normal payback time for such plants, is not acceptable. The sensitivity analysis, however, shows that the payback time can be shorter than 5 years with a reduction in stack cost and the electricity purchase price and with an extended stack lifetime.

5. Conclusions

In this study, the techno-economic optimization of the solid-oxide electrolyzer integrated CO2-to-methanol is carried out. Firstly, the system is designed in detail with the models developed using ASPEN Plus and calibrated with the manufacturer or experimental data. Then, multi-objective optimization and system-level heat integration are employed to compare the performances of the optimal conceptual designs in terms of energy efficiency and methanol production cost. A sensitivity analysis is performed to identify the key influential parameters for high economic competitiveness. The major conclusions are
  • There is a trade-off between the system efficiency and methanol production cost. Increasing system efficiency will slightly increase the cost. The operating window of solid-oxide stack is rather narrow due to the high heat requirement of steam generation and methanol upgrading. The optimized system is with a system efficiency of above 68% with annual utilization of carbon dioxide 150 kton.
  • The bottleneck of the heat integration comes from steam generation and distillation column. The SOE needs to operate at highly exothermic mode to drive the whole system and avoid heat transfer from/to the stack. High-pressure operation of the SOE stack is also preferred to avoid the work by hydrogen compression. The steam generation is driven mainly by the heat from the SOE outlet and the waste boiler. Almost no electrical heating is required for all designs.
  • The economic performance is dominated by SOE stack, the electricity price, and the product sale revenue. Given the current market assumptions on these factors, the concept is not economically feasible with a payback time over 13 years. However, if reducing the stack to 1000 $/stack and electricity price down to 20 €/MWh, which is available in some countries, the payback time can be reduced to even less than 3 years, indicating its competitiveness for specific economic conditions.

Author Contributions

This study was done as part of H.Z. doctoral studies supervised by U.D., L.W., F.M. and J.V.h.

Funding

The research leading to the above results was funded by China Scholarship Council and the University of Pisa for H.Z.

Acknowledgments

H.Z. thanks Group of Industrial Process and Energy Systems Engineering at EPFL and Energy Systems and Turbomachinery Group at University of Pisa for their support.

Conflicts of Interest

The authors declare no conflict of interest.

Nomenclature

Abbreviations
AEAlkaline electrolyzer
AMPLA mathematical programming language
AOHAnnual operating hours
CCS Carbon capture storage
CCUCarbon capture and utilization
CCUSCarbon capture, utilization and storage
EESElectrical energy storage
HENHeat exchanger network
HHVHigher heating value
IEAInternational energy agency
IRENAInternational renewable energy agency
LCILifecycle indicator
LHVLower heating value
MCPMinimum cost point
MEPMaximum efficiency point
MILPMixed integer linear programming
MSSMethanol synthesis system
MOOMulti-objective optimizer
PECPurchased equipment cost
PEMEPolymer electrolyte membrane electrolyzer
PtHPower-to-hydrogen
SESteam electrolysis
SOE Solid-oxide electrolysis
USDUnited states dollar
Greek Symbols
ηEnergy efficiency
τPayback time
Mathematical Symbols
CAPEXCapital expenditure
CdepDepreciation cost
CinvInvestment cost
CoptOperational cost
C r e v M e O H Methanol revenue
C r e v b y p Byproduct revenue
CMeOHMethanol production cost
Δ E · Electric power input
∆H298KStandard enthalpy of formation
iAnnual interest rate
MSyngas modular
M · M e O H Mass flow of obtained methanol
nNumber of electrons exchanged in the reaction
OPEXOperational expenditure
PMeOHMethanol production
TTemperature
Subscripts
nProject lifetime

References

  1. Bukhtiyarova, M.; Lunkenbein, T.; Kähler, K.; Schlögl, R. Methanol Synthesis from Industrial CO2 Sources: A Contribution to Chemical Energy Conversion. Catal. Lett. 2017, 147, 416–427. [Google Scholar] [CrossRef]
  2. Olah, G.A. Beyond oil and gas: The methanol economy. Angew. Chem. Int. Ed. 2005, 44, 2636–2639. [Google Scholar] [CrossRef] [PubMed]
  3. Lin, H.; Jin, H.; Gao, L.; Han, W. Techno-economic evaluation of coal-based polygeneration systems of synthetic fuel and power with CO2 recovery. Energy Convers. Manag. 2011, 52, 274–283. [Google Scholar] [CrossRef]
  4. Pérez-Fortes, M.; Schöneberger, J.C.; Boulamanti, A.; Tzimas, E. Methanol synthesis using captured CO2 as raw material: Techno-economic and environmental assessment. Appl. Energy 2016, 161, 718–732. [Google Scholar] [CrossRef]
  5. Coal Industry Advisory Board (CIAB) to the International Energy Agency (IEA). An International Commitment to CCS: Policies and Incentives to Enable a Low-Carbon Energy Future; IEA: Paris, France, 2016. [Google Scholar]
  6. Peters, M.; Kler, B.; Kuckshinrichs, W.; Leitner, W.; Markewitz, P.; Müller, T. Chemical technologies for exploiting and recycling carbon dioxide into the value chain. ChemSusChem 2011, 4, 1216–1240. [Google Scholar] [CrossRef] [PubMed]
  7. Huber, G.; Iborra, S.; Corma, A. Synthesis of Transportation Fuels from Biomass: Chemistry, Catalysts, and Engineering. Chem. Rev. 2006, 106, 4044–4098. [Google Scholar] [CrossRef] [PubMed] [Green Version]
  8. Swanson, R.; Statrio, J.; Brown, R. Techno-Economic Analysis of Biofuels Production Based on Gasification; Technical Report; NREL: Golden, CO, USA, 2010. [Google Scholar]
  9. Olah, G.A.; Goeppert, A.; Prakash, G.S. Chemical Recycling of Carbon Dioxide to Methanol and Dimethyl Ether: From Greenhouse Gas to Renewable, Environmentally Carbon Neutral Fuels and Synthetic Hydrocarbons. J. Org. Chem. 2009, 74, 487–498. [Google Scholar] [CrossRef] [PubMed]
  10. Cheng, W.; Kung, H. Methanol Production and Use; Marcel Dekker: New York, NY, USA, 1994. [Google Scholar]
  11. Botta, G.; Solimeo, M.; Leone, P.; Aravind, P.V. Thermodynamic Analysis of Coupling a SOEC in Co-Electrolysis Mode with the Dimethyl Ether Synthesis. Fuel Cells 2015, 15, 669–681. [Google Scholar] [CrossRef]
  12. Moradi, G.; Yaripour, F.; Abbasian, H.; Rahmanzadeh, M. Intrinsic reaction rate and the effects of operating conditions in dimethyl ether synthesis from methanol dehydration. Korean J. Chem. Eng. 2010, 27, 1435–1440. [Google Scholar] [CrossRef]
  13. Specht, M.; Staiss, F.; Bandi, A.; Weimer, T. Comparison of the renewable transportation fuels, liquid hydrogen and methanol, with gasoline—Energetic and economic aspects. Int. J. Hydrogen Energy 1998, 23, 387–396. [Google Scholar] [CrossRef]
  14. Kuliyev, S.A.; Aksongur, S.; Mat, M.D.; Ibrahimoğlud, B.; Kozlue, M.D. Direct Methanol Solid Oxide Fuel Cell. J. Electrochem. Soc. 2009, 25, 1093–1098. [Google Scholar]
  15. Andika, R.; Nandiyanto, A.B.D.; Putra, Z.A.; Bilad, M.R.; Kim, Y.; Yun, C.M.; Lee, M. Co-electrolysis for power-to-methanol applications. Renew. Sustain. Energy Rev. 2018, 95, 227–241. [Google Scholar] [CrossRef]
  16. Ye, J.; Johnson, J. Catalytic hydrogenation of CO2 to methanol in a Lewis pair functionalized MOF. Catal. Sci. Technol. 2016, 6, 8392–8405. [Google Scholar] [CrossRef]
  17. Huff, C.A.; Sanford, M.S. Cascade catalysis for the homogeneous hydrogenation of CO2 to methanol. J. Am. Chem. Soc. 2011, 133, 18122–18125. [Google Scholar] [CrossRef] [PubMed]
  18. Wang, W.H.; Himeda, Y.; Muckermann, J.T.; Manbeck, G.F.; Fujita, E. CO2 hydrogenation to formate and methanol as an alternative to photo- and electrochemical CO2 reduction. Chem. Rev. 2015, 115, 12936–12973. [Google Scholar] [CrossRef] [PubMed]
  19. Everton, S.; Chakib, B. Design and simulation of a methanol production plant from CO2 hydrogenation. J. Clean. Prod. 2013, 57, 38–45. [Google Scholar]
  20. Goeppert, A.; Czaun, M.; Jones, J.P.; Prakash, G.S.; Olah, G.A. Recycling of carbon dioxide to methanol and derived products—Closing the loop. Chem. Soc. Rev. 2014, 43, 7957–8194. [Google Scholar] [CrossRef]
  21. Nieminen, H.; Laari, A.; Koiranen, T. CO2 Hydrogenation to Methanol by a Liquid-Phase Process with Alcoholic Solvents: A Techno-Economic Analysis. Processes 2019, 7, 405. [Google Scholar] [CrossRef]
  22. Arakawa, H.; Dubois, J.; Sayama, K. Selective conversion of CO2 to methanol by catalytic hydrogenation over promoted copper catalyst. Energy Convers. Manag. 1992, 33, 521–528. [Google Scholar] [CrossRef]
  23. Masahiro, F.; Hisanori, A.; Mutsuo, T.; Yoshie, S. Hydrogenation of carbon dioxide over Cu-Zn-Cr oxide catalysts. Chem. Soc. Jpn. 1994, 67, 546–550. [Google Scholar]
  24. Graves, C.; Ebbesen, S.D.; Mogensen, M.; Lackner, K.S. Sustainable hydrocarbon fuels by recycling CO2 and H2O with renewable or nuclear energy. Renew. Sustain. Energy Rev. 2011, 15, 1–23. [Google Scholar] [CrossRef]
  25. Tremel, A.; Wasserscheid, P.; Baldauf, M.; Hammer, T. Techno-economic analysis for the synthesis of liquid and gaseous fuels based on hydrogen production via electrolysis. Int. J. Hydrogen Energy 2015, 40, 11457–11464. [Google Scholar] [CrossRef]
  26. Götz, M.; Lefebvre, J.; Mörs, F.; Koch, A.M.; Graf, F.; Bajohr, S.; Reimert, R.; Kolb, T. Renewable Power-to-Gas: A technological and economic review. Renew. Energy 2016, 85, 1371–1390. [Google Scholar] [CrossRef] [Green Version]
  27. Gahleitner, G. Hydrogen from renewable electricity: An international review of power-to-gas pilot plants for stationary applications. Hydrog. Energy 2013, 38, 2039–2061. [Google Scholar] [CrossRef]
  28. Schmidt, O.; Gambhir, A.; Staffell, I.; Hawkes, A.; Nelson, J.; Few, S. Future cost and performance of water electrolysis: An expert elicitation study. Hydrog. Energy 2017, 42, 30470–30492. [Google Scholar] [CrossRef]
  29. Ni, M.; Leung, M.; Leung, D. Technological development of hydrogen production by solid oxide electrolyzer cell (SOEC). Hydrog. Energy 2008, 33, 2337–2354. [Google Scholar] [CrossRef]
  30. Leonzio, G. Design and feasibility analysis of a Power-to-Gas plant in Germany. J Clean. Prod. 2017, 162, 609–623. [Google Scholar] [CrossRef]
  31. Sterner, M.; Stadler, I. Energiespeicher-Bedarf, Technologien, Integration; Springer-Verlag: Berlin, Germany, 2014. [Google Scholar]
  32. Pozzo, M.; Lanzini, A.; Santarelli, M. Enhanced biomass-to-liquid (BTL) conversion process through high temperature co-electrolysis in a solid oxide electrolysis cell (SOEC). Fuel 2015, 145, 39–49. [Google Scholar] [CrossRef]
  33. Wang, L.; Pérez-Fortes, M.; Madi, H.; Diethelm, S.; Van herle, J.; Maréchal, F. Optimal design of solid-oxide electrolyzer based power-to-methane systems: A comprehensive comparison between steam electrolysis and co-electrolysis. Appl. Energy 2018, 211, 1060–1079. [Google Scholar] [CrossRef]
  34. Wang, L.; Megha, R.; Stefan, D.; Tzu-En, L.; Hanfei, Z.; Maréchal, F. Power-to-methane via co-electrolysis of H2O and CO2: Process modeling, pressurized operation and internal methanation. Appl. Energy 2019, 250, 1432–1445. [Google Scholar] [CrossRef]
  35. Wang, L.; Johannes, D.; Francois, M.; Van herle, J. Trade-off designs and comparative exergy evaluation of solid-oxide electrolyzer based power-to-methane plants. Int. J. Hydrogen Energy 2018, 44, 9529–9543. [Google Scholar] [CrossRef]
  36. Wang, L.; Chen, M.; Kungas, R.; Tzu-En, L.; Stefan, D.; Maréchal, F.; Van herle, J. Power-to-fuels via solid-oxide electrolyzer: Operating window and techno-economics. Renew. Sustain. Energy Rev. 2019, 110, 174–187. [Google Scholar] [CrossRef]
  37. Turton, R.; Bailie, R.C.; Whiting, W.B.; Shaeiwitz, J.A. Analysis, Synthesis and Design of Chemical Processes; Pearson Education: London, UK, 2008. [Google Scholar]
  38. Kauw, M.; Benders, R.M.J.; Visser, C. Green methanol from hydrogen and carbon dioxide using geothermal energy and/or hydropower in Iceland or excess renewable electricity in Germany. Energy 2015, 90, 208–217. [Google Scholar] [CrossRef]
  39. Wang, L.; Yang, Z.; Sharma, S.; Mian, A.; Lin, T.E.; Tsatsaronis, G.; Maréchal, F.; Yang, Y. A review of evaluation, optimization and synthesis of energy systems: Methodology and application to thermal power plants. Energies 2019, 12, 73. [Google Scholar] [CrossRef]
  40. Wallerand, A.S.; Kermani, M.; Kantor, I.D.; Maréchal, F. Optimal heat pump integration in industrial processes. Appl. Energy 2018, 219, 68–92. [Google Scholar] [CrossRef] [Green Version]
  41. Kermani, M.; Wallerand, A.S.; Kantor, I.D.; Maréchal, F. Generic superstructure synthesis of organic Rankine cycles for waste heat recovery in industrial processes. Appl. Energy 2018, 212, 1203–1225. [Google Scholar] [CrossRef]
  42. Peduzzi, E.; Boissonnet, G.; Haartemmer, G.; Marechal, F. Thermo-economic analysis and multi-objective optimisation of lignocellulosic biomass conversion to Fischer–Tropsch fuels. Sustain. Energy Fuels 2018, 2, 1069–1084. [Google Scholar] [CrossRef]
  43. Hamelinck, C.N.; Faaji, A.P.C.; den Uil, H.; Borrigter, H. Production of FT transportation fuels from biomass; technical options, process analysis and optimisation, and development potential. Energy 2004, 29, 1743–1771. [Google Scholar] [CrossRef]
  44. Tan, E.C.; Talmadge, M.; Dutta, A.; Hensley, J.; Schaldie, J.; Biddy, M.; Humbird, D.; Snowden-Swan, L.; Ross, J.; Sexton, D.; et al. Process Design and Economics for the Conversion of Lignocellulosic Biomass to Hydrocarbons via Indirect Liquefaction, Thermochemical Research Pathway to High-Octane Gasoline Blendstock through Methanol/dimethyl Ether Intermediates; Technical Report: NREL/TP-5100-62402; National Renewable Energy Laboratory (NREL): Golden, CO, USA, 2015. [Google Scholar]
  45. Regis, A.; David, C.; Annabelle, B.; Mathieu, M. Bottom-up cost evaluation of SOEC systems in the range of 10e100 MW. Int. J. Hydrogen Energy 2018, 43, 20309–20322. [Google Scholar]
  46. Albarelli, J.Q.; Onorati, S.; Caliandro, P.; Peduzzi, E.; Meireles, M.A.; Marechal, F.; Ensinas, A.V. Multi-objective optimization of a sugarcane biorefinery for integrated ethanol and methanol production. Energy 2017, 138, 1281–1290. [Google Scholar] [CrossRef]
  47. Gerber, L. Integration of Life Cycle Assessment in the Conceptual Design of Renewable Energy Conversion Systems. Ph.D. Thesis, École Polytechnique Fédérale de Lausanne, Lausanne, Switzerland, 2012. [Google Scholar]
  48. Tock, L. Thermo-Environomic Optimisation of Fuel Decarbonisation Alternative Processes for Hydrogen and Power Production. Ph.D. Thesis, École Polytechnique Fédérale de Lausanne, Lausanne, Switzerland, 2013. [Google Scholar]
  49. Mian, A. Optimal Design Methods Applied to Solar-Assisted Hydrothermal Gasification Plants. Ph.D. Thesis, École Polytechnique Fédérale de Lausanne, Lausanne, Switzerland, 2016. [Google Scholar]
  50. Exchange Rate. Available online: www.x-rates.com/historical/?from=USD&amount=1&date=2018-05-08 (accessed on 5 August 2018).
  51. European Commission. Quarterly Report on European Electricity Markets, Fourth Quarter of 2017; European Commission, Directorate-General for Energy, Market Observatory for Energy: Brussels, Belgium, 2018. [Google Scholar]
  52. Asif, M.; Gao, X.; Lv, H.; Xi, X.; Dong, P. Catalytic hydrogenation of CO2 from 600 MW supercritical coal power plant to produce methanol: A techno-economic analysis. Int. J. Hydrogen Energy 2018, 43, 2726–2741. [Google Scholar] [CrossRef]
  53. Guilera, J.; Morante, J.R.; Andreu, T. Economic viability of SNG production from power and CO2. Energy Convers. Manag. 2018, 162, 218–224. [Google Scholar] [CrossRef]
Figure 1. Schematic of the CO2-to-methanol system integrated with solid-oxide electrolyzer (SOE). Heat exchanger network is not explicitly designed, but its performance is estimated with classical chemical engineering method in, e.g., [37].
Energies 12 03742 g001
Figure 2. Trade-off between methanol production cost and energy efficiency (MCP—minimum cost point, MEP—maximum efficiency point).
Energies 12 03742 g002
Figure 3. Variation of key variables with respect to the system efficiency: (a) current density and voltage and (b) pressure and sweep-gas feed. For all designs, the utilization factor is settled at the upper bound (80%), and the stack’s outlet temperature is at 870 °C.
Energies 12 03742 g003
Figure 4. The insights to system-level heat integration: (a) grand composite curve (inlet temperature 750 °C, MEP: average current density 0.89 A cm−2, average cell voltage 1.42 V, reactant utilization 0.8, and outlet temperature 868 °C; MCP: average current density 1.08 A cm−2, average call voltage 1.43 V, reactant utilization 0.8, and outlet temperature 869 °C), (b) integrated composite curve of SOE at MEP, and (c) integrated composite curve of SOE at MCP.
Energies 12 03742 g004
Figure 5. Investment cost distribution of MCP.
Energies 12 03742 g005
Figure 6. Operating cost and revenue distribution of MCP.
Energies 12 03742 g006
Figure 7. Sensitivity analysis of key economic parameters: (a) the SOE stack price (a stack is defined with 5120 active cell area), (b) the import electricity price, (c) the CO2 price, (d) the SOE stack lifetime.
Energies 12 03742 g007
Table 1. The decision variables and their bounds.
VariableLower BoundUpper BoundUnit
SOE operating pressure1.178bar
SOE steam utilization0.30.8-
Steam feed flowrate0.515sccm/cm2
Sweep-gas feed flowrate0.136sccm/cm2
Note: The SOE inlet temperature is set at 750 °C. The current density is calculated based on the given feed flowrates to reach given steam utilization.
Table 2. Parameters for the cost evaluation of major equipment via the capacity-factored method.
Unit Base   Cos t   C p , r e f 0   ( M $ ) Base   A r e f 0 Base UnitBase YearαRef.
SOE single stack a2 × 10−3-----
Methanol reactor3.544.28ton/d methanol20110.8[44]
Steam turbine system5.910.3MWh20020.65[43]
a The SOE stack is taken as around 2000 $/stack [45], with its lifetime being around 48,000 hours [28].
Table 3. Economic assumptions.
Economic ParameterValueUnitRef.
Project lifetime25year[46]
Loan interest rate10%[46]
Annual operating hours (AOH)7200hours/year-
Exchange rate (€ to $)1.18-[50]
Electricity price (import)73.16$/MWh[51]
Methanol price504$/ton[52]
Catalyst (methanol reactor)21.36$/kg[44]
Catalyst lifetime (methanol reactor)4year[44]
Oxygen price177$/ton[53]
Carbon dioxide captured59$/ton[53]
Carbon dioxide trading5.9$/ton[53]
Process water price0.4756$/ton[52]
Operator salary52,900$/year[37]
Table 4. Summary of the two optimal solutions with MeOH capacity of 100 kton/year and the economic assumptions given in Table 3.
Design η (%) SOE Electricity Consumption (MW)Import Electricity (MW)Investment Costs (M$)Optimal Costs ($/Year)Levelized MeOH Cost ($/Ton)Payback Time (Years)
MEP69.410711017168.358215.6
MCP68.010811313469.455713.5

