1. Introduction
Ground source heat pump (GSHP) systems have become increasingly popular in Norway during the recent decades. Similar trends are also seen worldwide, and recent studies indicate a large potential for the technology [
1]. Among a wide range of GSHP concepts, groundwater heat pump (GWHP) systems, also known as open loop GSHP systems, are unique because they extract thermal energy directly from groundwater rather than via heat collectors in soil or bedrock formations. These systems are less common than closed loop GSHP systems, but GWHP systems provide an efficient and cost-effective alternative in areas where the local hydrogeological conditions are favorable, especially for medium to large facilities (>100 kW heating capacity systems) and for facilities with large annual cooling demands.
These systems extract groundwater from an aquifer. In Norway, GWHP technology is typically applied in areas with large Quaternary deposits of saturated sand and gravel material. Many aspects of system performance are governed by the local and the over-all aquifer conditions. An aquifer formation beneath the town center of Melhus (Norway) is currently utilized as a heat source by nine individual GWHP systems. The first installation started production in 1999 and is still in operation today. A range of clogging and fouling problems has occurred in the different systems over the years, leading to the recent investigations [
2,
3,
4,
5].
The problems typically distinguish into three main categories: (1) Suspension and deposition of sediments in the system, (2) bacterial growth in the groundwater—biofouling, (3) chemical fouling, typically by iron and/or manganese compounds. These problems are identical to problems reported in many similar GWHP systems [
6,
7,
8,
9,
10,
11,
12,
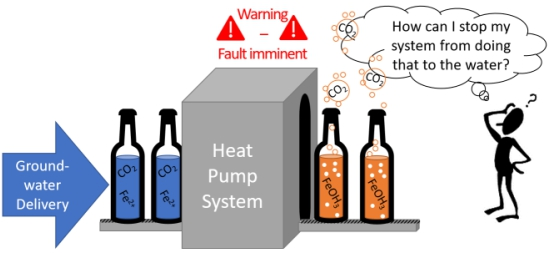
13]. However, these references also emphasis several clogging issues caused by or catalyzed by a fourth problem category: (4) Exsolution of gases dissolved in groundwater. The exsolution and escape of specific gases, e.g., CO
2, can facilitate chemical imbalances in the groundwater and cause precipitation reactions. Nordell et al. [
12] describe findings of iron precipitation caused by exsolution of CO
2 in borehole bedrock wells in the Emmaboda borehole thermal energy storage system. Gas exsolution also represents a direct risk of clogging by gas bubbles in, e.g., the well screen upon re-injection, which is a reported problem by many others e.g., [
6,
9,
10]. Observations and investigations in Melhus by Brøste [
3] have revealed gas bubbles in the groundwater during groundwater sampling, similar to some of the observations of Yon-Gyung et al. [
14] in a CO
2 storage site in Korea. This arguably points towards gas exsolution as a possible cause for some of the clogging and fouling problems found in Melhus. This is currently being investigated.
This paper deals with the topic of GWHP design solutions and their influence on pressure- and temperature-induced gas exsolution within the systems. The traditional Norwegian design does not consider in-situ pressures and temperatures as key design parameters to avoid clogging problems, and the design thus enforces alterations to the in-situ groundwater conditions during operation. As examples of a typical gas exsolution triggers, pressure and temperature changes within a typical Norwegian GWHP system configuration are analyzed and presented. The analysis shows how the design affects the gas solubility in groundwater. An alternative design strategy introduces the solubility grade line (SGL) as a design tool for optimizing the system configuration. The new strategy provides an alternative approach to the traditional Norwegian GWHP design methodology and focuses on preventing or limiting the risk of gas exsolution.
1.1. Current Investigations in Melhus
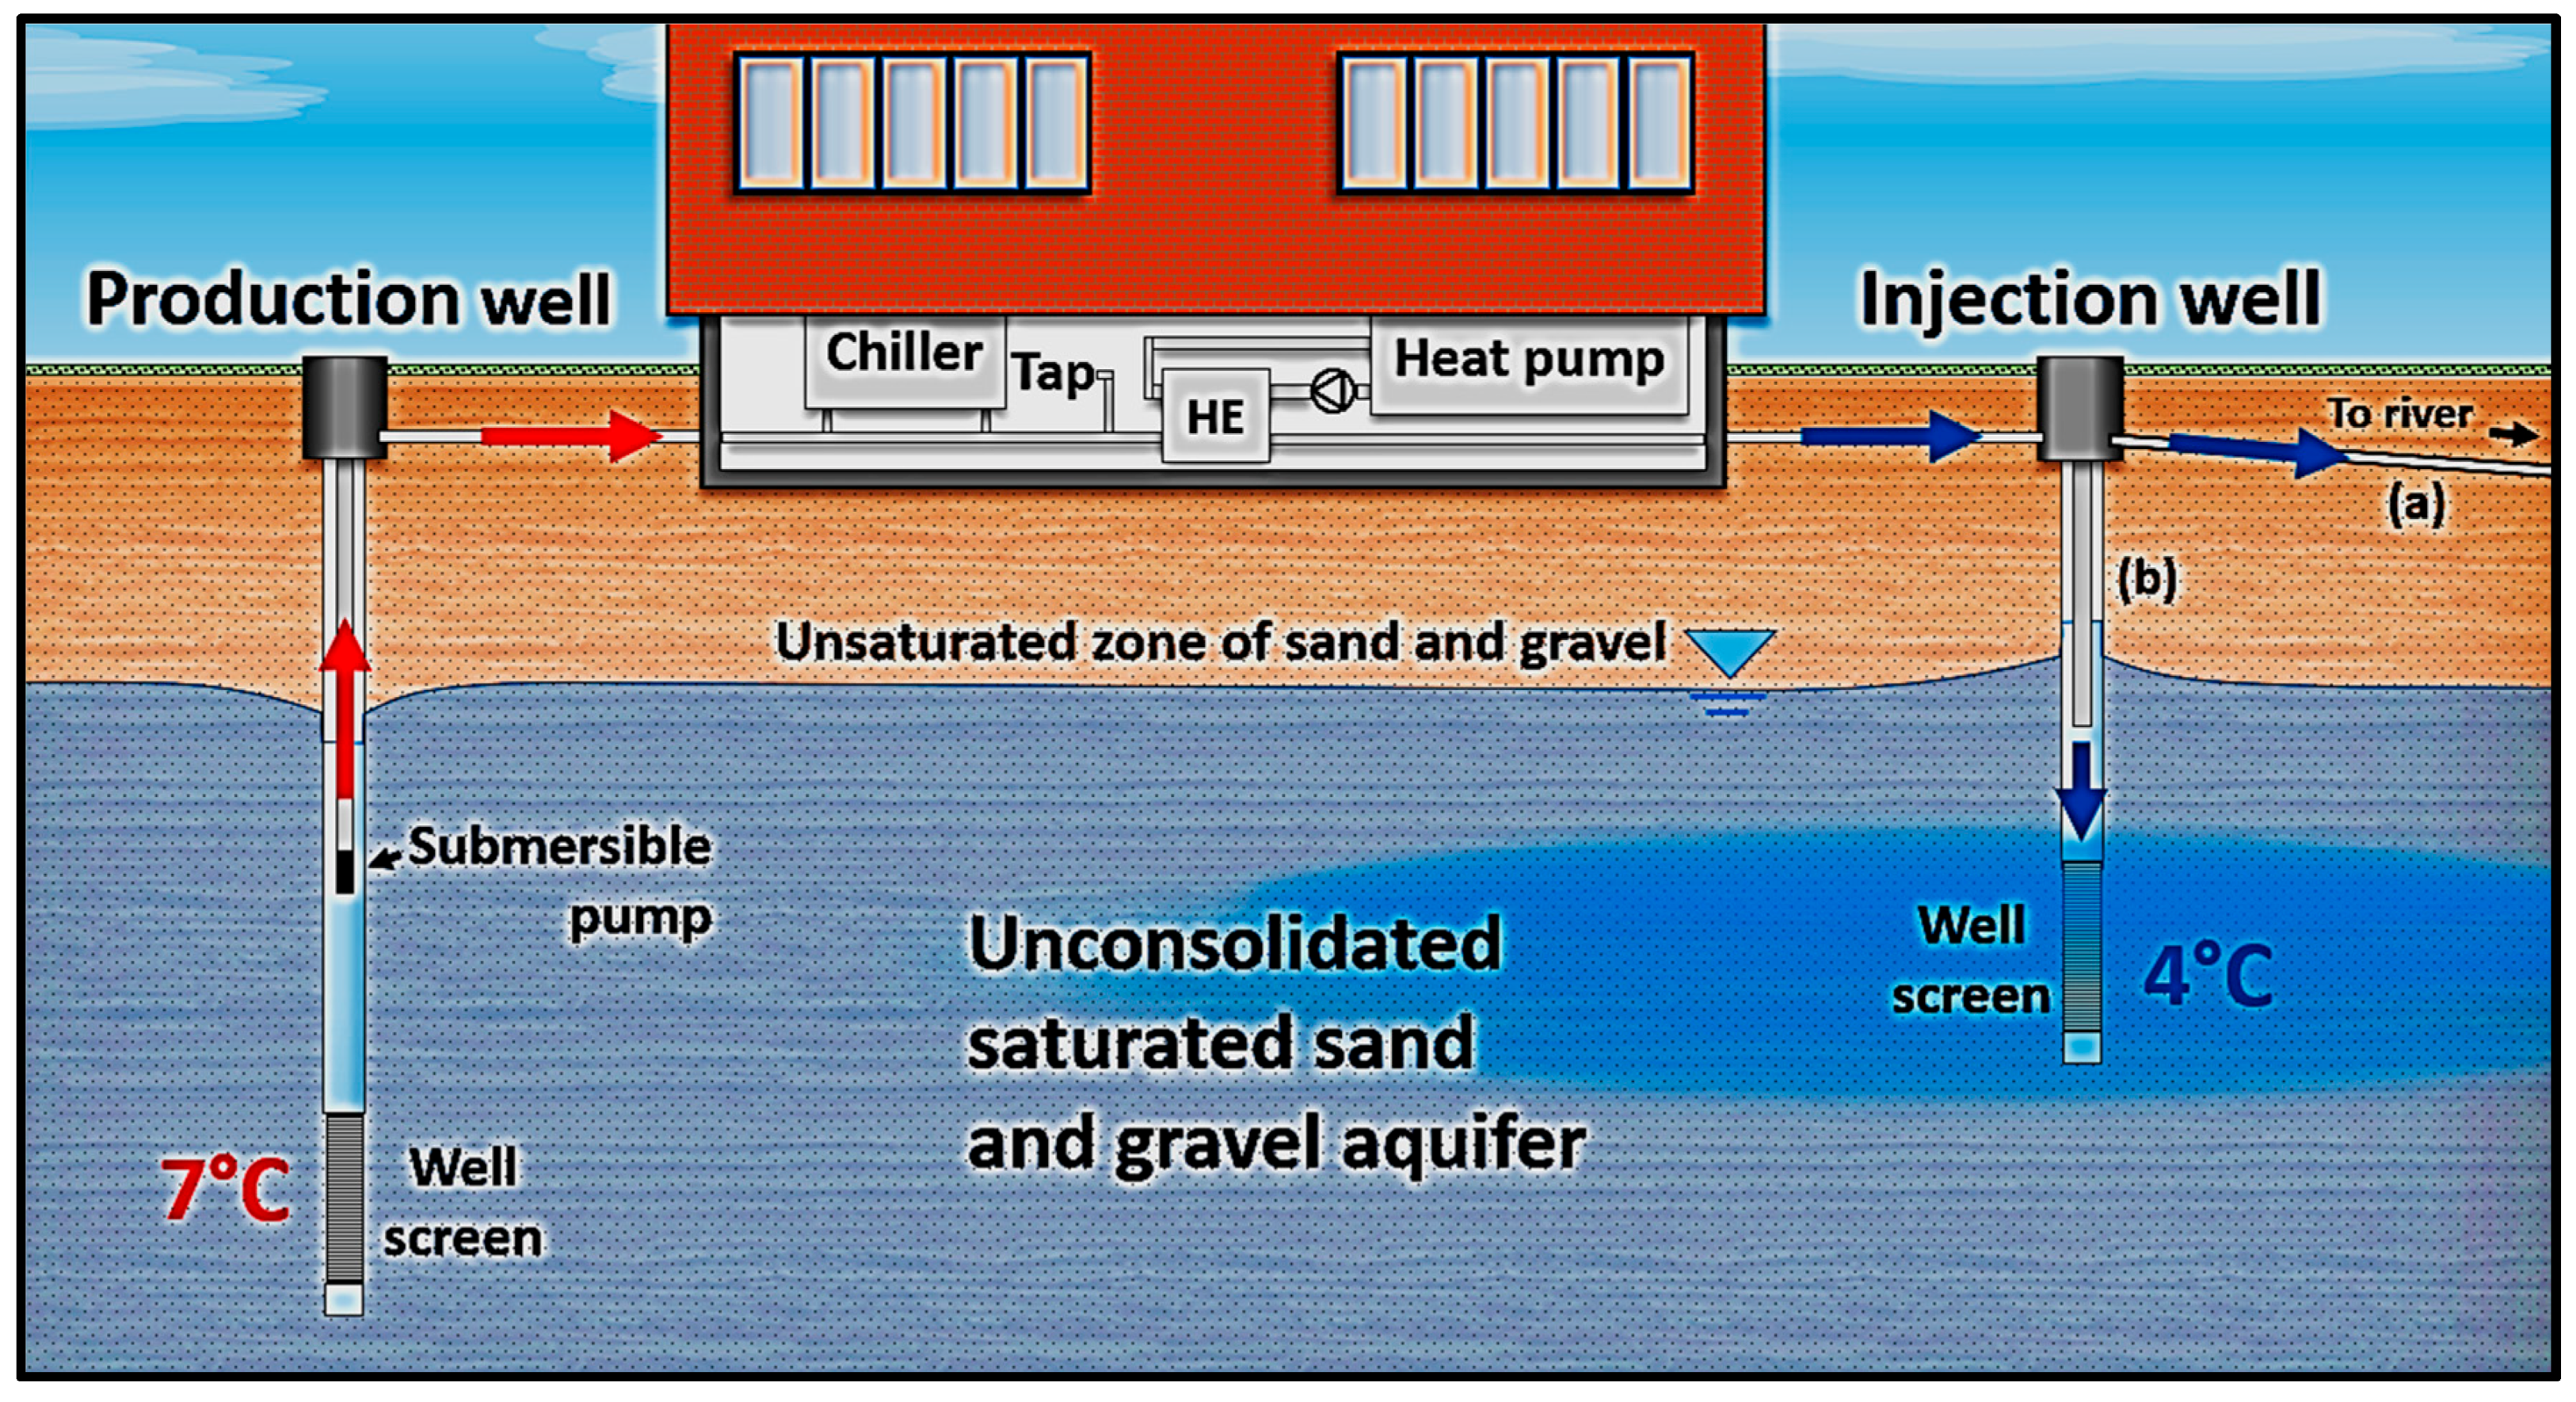
There are two typical GWHP system design concepts employed in Melhus, i.e., with or without reinjection of groundwater to the aquifer (
Figure 1). The heat pump system connects to the aquifer through a production well with slotted screens. Groundwater is pumped from the production well through a groundwater heat exchanger (HE), where thermal energy is extracted from or injected into the water. The water temperature is typically reduced or increased by 3–4 °C, respectively. The Melhus aquifer receives sufficient groundwater recharge and the systems can discharge the heat-exchanged groundwater through the local drainage system (
Figure 1a). However, the more common system solution is designed to re-inject the heat-exchanged groundwater back into the aquifer in an injection well (
Figure 1b). Re-injection is deemed favorable because it helps maintain the water level in the aquifer and the contractors do not have to apply for extraction permits from the regulating authorities. Groundwater from different depths are extracted depending on the location of the different installations. The shallowest installation utilizes water from a depth of 5–20 m and the deepest installation utilizes water from a depth of 60–70 m with respect to the water table.
The nine GSHP systems are cost-effective, but all of them have experienced a variety of different clogging and fouling issues. The major issues are related to clogging of the injection wells and the surrounding aquifer formation. All of the seven re-injection systems have experienced clogging of the injection well screen [
5]. The clogging material is often a mixture of sediments and precipitated hydroxides [
3,
4]. Inspections of the systems have shown that re-injection of groundwater is done without a backpressure technique, and vacuum pressures have been observed in the re-injection pipeline in several installations. Banks [
10] (p.226) discusses this issue and suggests that >0.5 bar over-pressure should be achieved everywhere within the groundwater circuit to mediate this problem. Similarly, gas-related problems in deep Australian groundwater systems (>500 m depth) have led their industrial standard to recommend fully pressurized GWHP systems, typically with 1–4 bar over-pressure [
11].
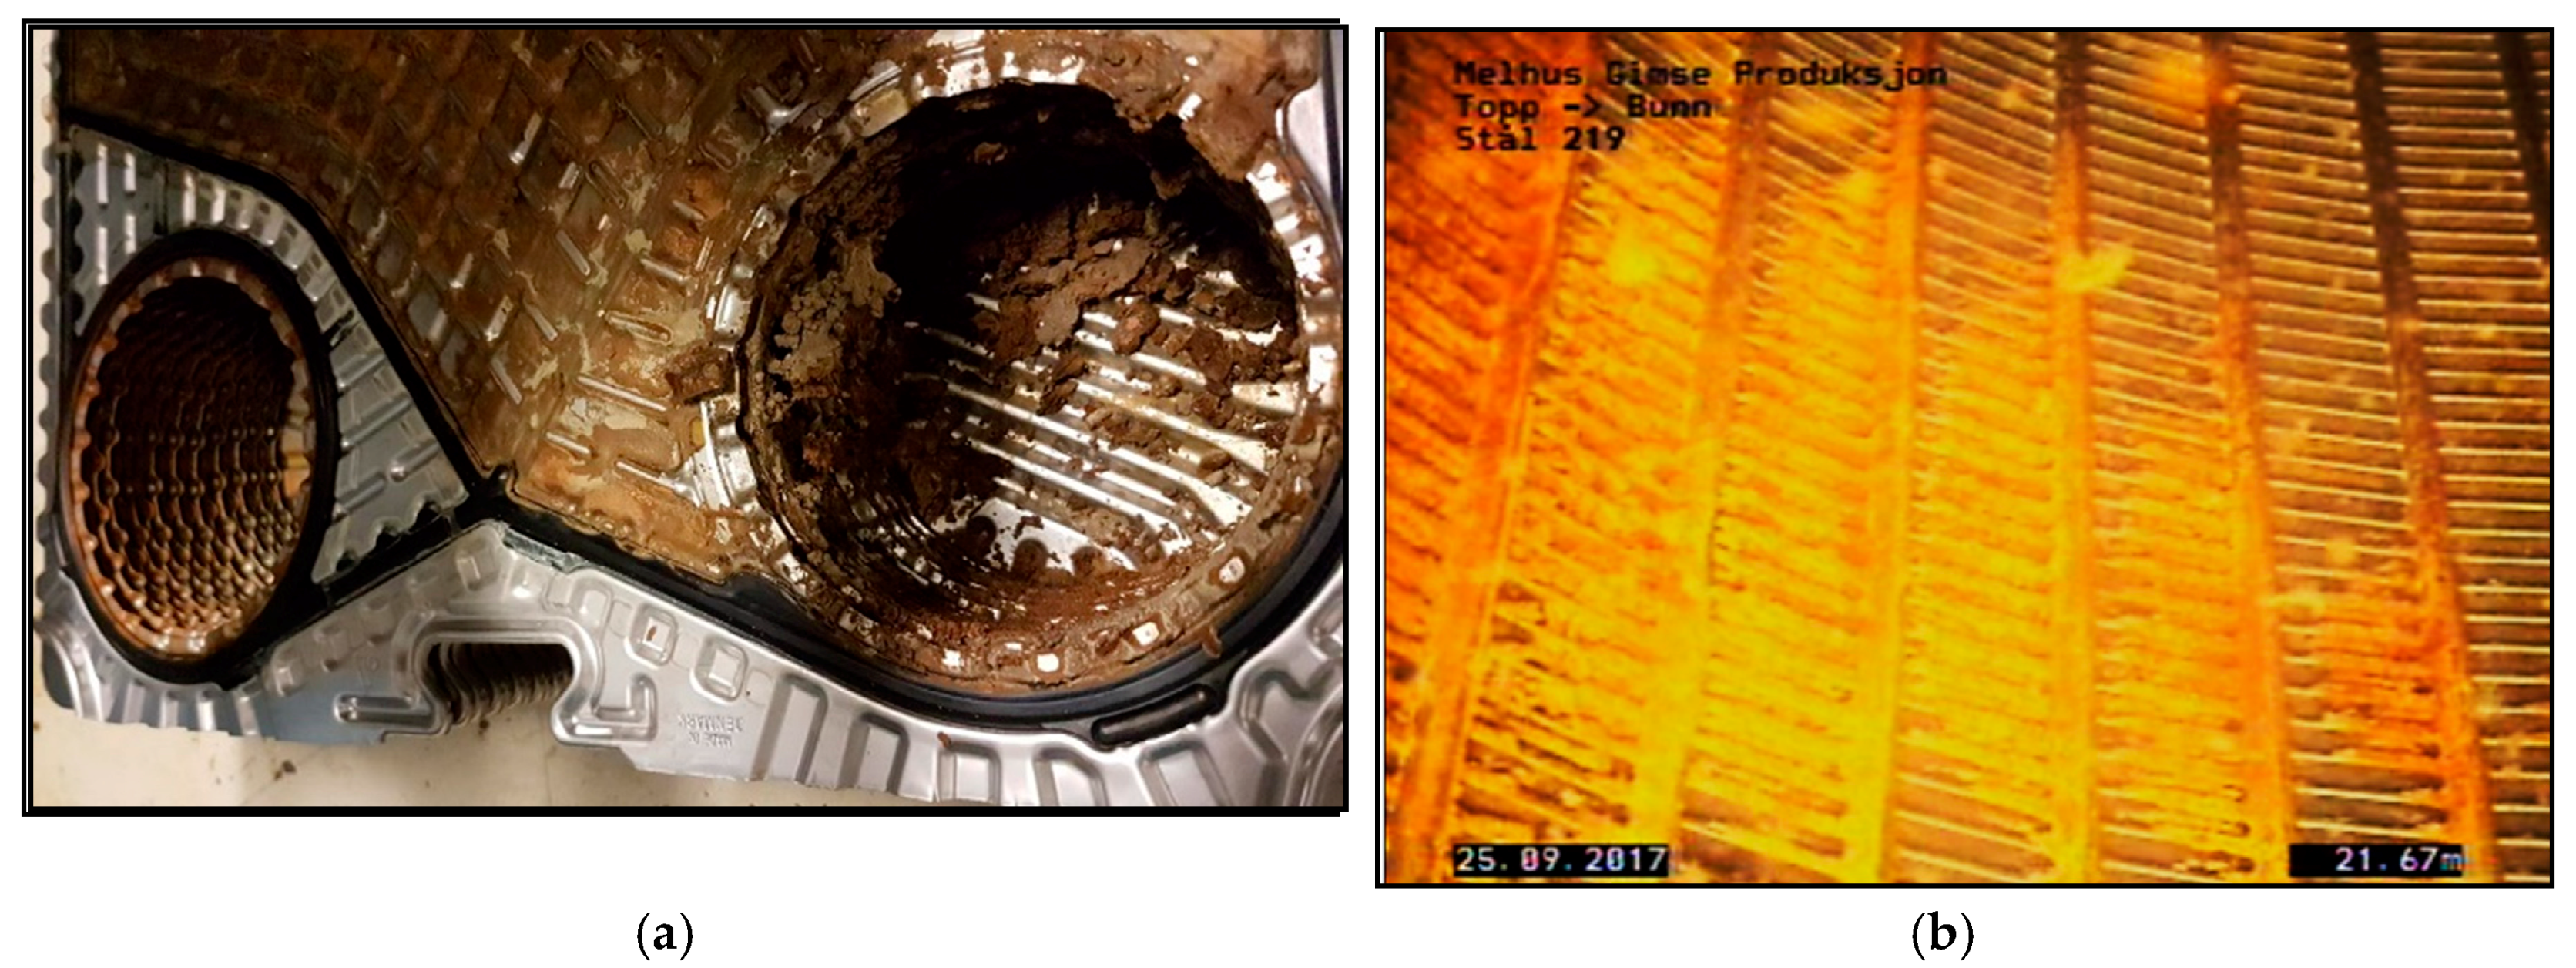
Vacuum pressures have also been observed in the pipeline leading into the basement of the building on several occasions, sometimes as far back as the groundwater heat exchanger. Seven of the Melhus systems have experienced fouling of the groundwater heat exchanger (
Figure 2a), but whether this is triggered by vacuum pressures or not is unclear. Mixing of different groundwater qualities in the system, or alteration of the groundwater temperature, are typically emphasized to explain why such fouling has occurred [
6,
9,
10,
15]. Water quality sampling of the aquifer [
2,
3], in different installations and observation wells, has revealed large spatial variations in both ion concentrations and dissolved oxygen levels in the aquifer. For instance, dissolved iron and manganese ions were found to vary from 0.05–5.78 mg/L and 0.01–0.68 mg/L respectively, depending on the location and depth of the different wells in the aquifer formation. The issue of chemical precipitation is thus a complex matter, probably with multiple triggering factors. In Melhus, the loss of in-situ pressure in the pipeline is now perceived to be a part of the problem.
Inspection of a particular production well in 2017 suggests that loss of pressure might be relevant for the observed fouling problems. The production wells in Melhus are seldom affected by clogging issues [
4], but in this particular well, the pump was installed in the screened section of the well (
Figure 2b). During a routine maintenance check of the 15-m-long screen, a video-inspection of the well revealed a minor issue where precipitated iron hydroxides were found highly localized in the screen area at the location of the suction inlet section of the submersible pump, 10–11 m below the water table. Houben [
15] reports that similar observations are typical for water wells in general, and emphasizes that the rate of fouling deposition is enhanced in areas of high flow velocities. He states that this is likely caused by the mixing of different groundwater qualities, but this explanation seems insufficient considering the small area of affected screen (20 cm in diameter) after eight years of continuous operation. The suction inlet section of the pump is often associated with high entrance velocities that cause relatively large losses of hydrostatic pressure around the pump entrance. If these pressure losses contribute to exsolution of dissolved gases that in turn affect the chemical balance of the groundwater, it might provide an explanation for the observed fouling. In this case, the problem can be easily avoided by correcting the system design. The physical–chemical relations concerning gas solubility and chemical precipitation are thus relevant for GWHP designers.
1.2. Relevance of Gas Solubility and Chemical Precipitation in GWHP Design
To broaden the relevance of gas solubility in GWHP systems, it is appropriate to recount the relations of some gases to that of chemical precipitation. Numerous physical-chemical relations concern the topic of dissolved gases and their possible influence on precipitation reactions. Oxygen (O
2) and carbon dioxide (CO
2) are often considered the most relevant gases because they affect the chemical equilibrium of many compounds [
16]. Most of the clogging problems in Melhus are connected to precipitation of iron and manganese compounds specifically. The following section therefore focuses on these two elements in relation to oxygen (O
2) and carbon dioxide (CO
2) gases. Some possible gas-related precipitation triggers are highlighted. Microbial activity that catalyzes precipitation reactions is not within the scope of this paper.
The dissolution and precipitation of iron and manganese is governed by the solvent’s redox potential (Eh) and pH [
16,
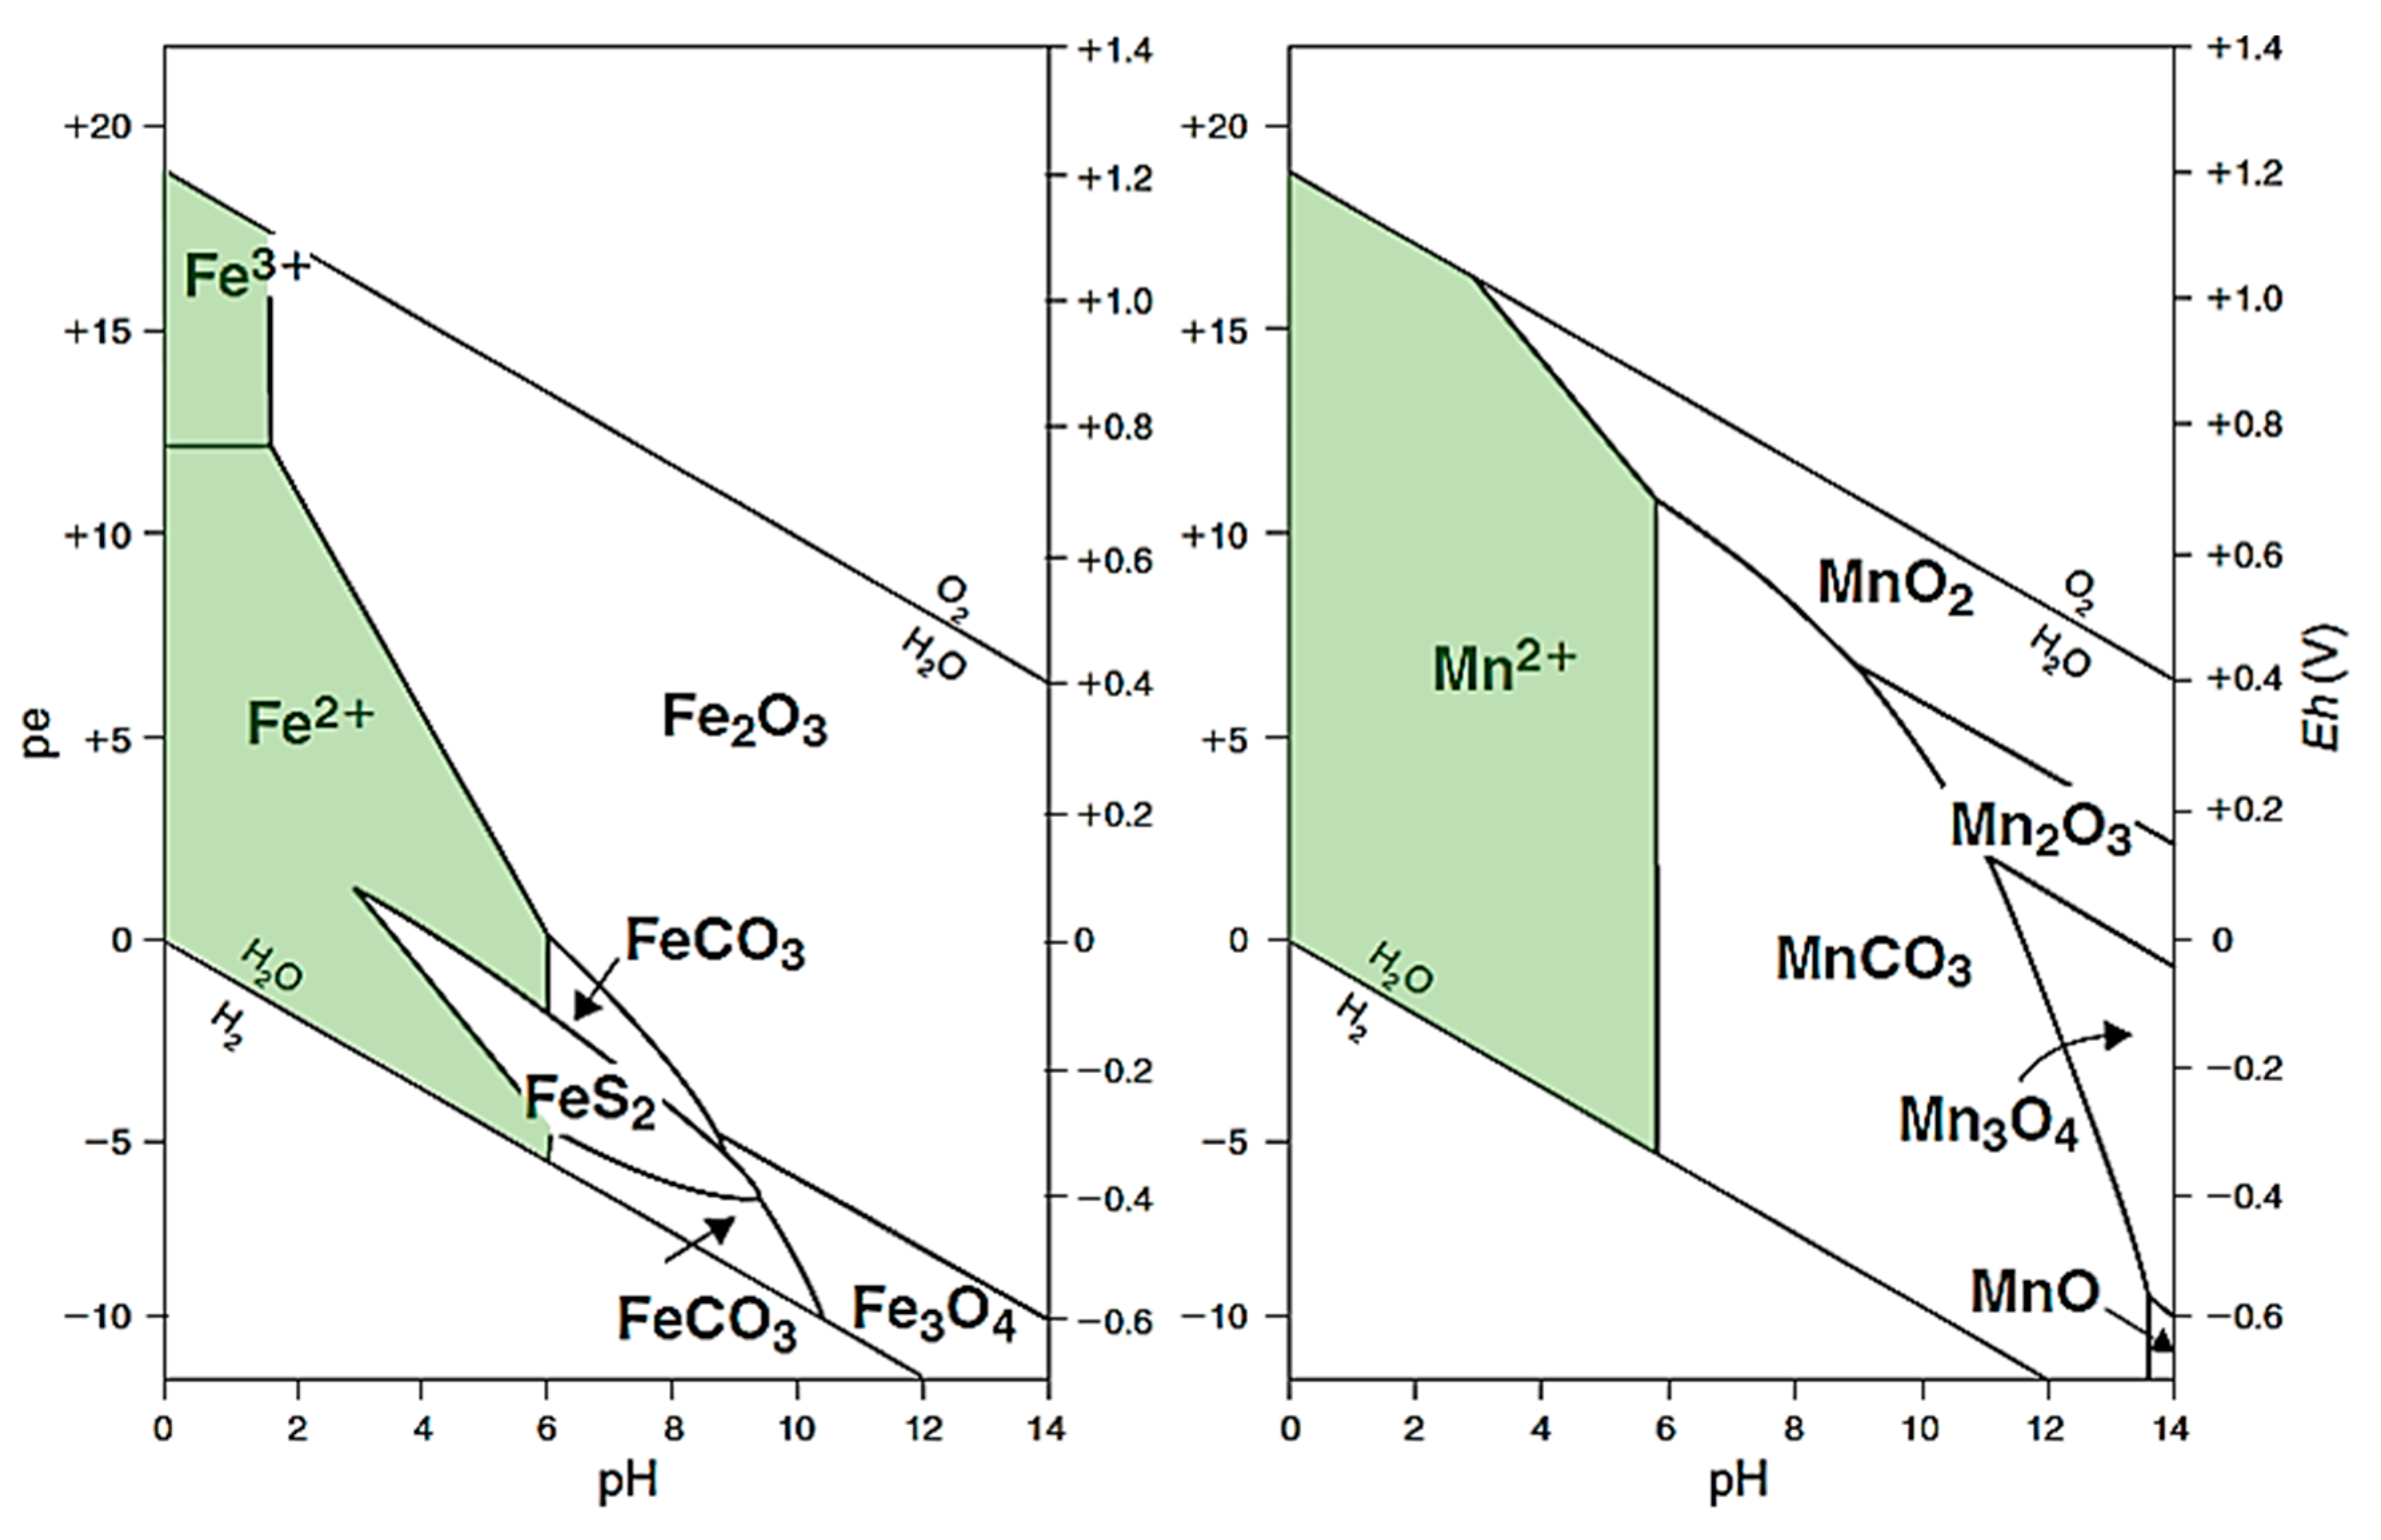
17]. Assuming chemical equilibria, the stability fields of various iron species can be visualized in Eh–pH diagrams. Higher Eh and pH levels in groundwater would, for most elements, tend to favor insoluble species. In the case of iron and manganese (
Figure 3), it is evident that the soluble species of Fe
2+ and Mn
2+ are favored below pH ≈ 6 with decreasing solubility with higher Eh levels, conditions that are commonly found in many aquifer formations. However, numerous factors control Eh and pH, thus making the dissolution–precipitation process more complex.
Eh is controlled by the oxidant availability. High Eh values indicate a large abundance of oxidants, leading to higher oxidation states of the reductants, i.e., electron donors. Oxygen (O
2) is the thermodynamically preferred oxidant. Oxygen depletion, so called anoxic conditions, make nitrate (NO
3−), manganese (Mn
4+), iron (Fe
3+), sulphate (SO
42−), and carbon dioxide (CO
2) in sequence the thermodynamically preferred oxidants [
18]. Anoxic conditions are usually found in deeper parts of water bodies, as oxygen supply is lower there [
16]. Mixing anoxic groundwater with oxygen-rich groundwater, or mixing with oxygen in the air, are typical precipitation triggers because this alters the preferred iron or manganese species from soluble species, e.g., Fe
2+, to insoluble species that are unable to stay in solution, e.g., Fe
2O
3 (
Figure 3). Groundwater quality mixing and leakages of air into the system should thus be avoided. This forms the basis for much of the prevailing emphasis on groundwater quality issues within the GWHP design [
10].
The Eh–pH diagram represents an equilibrium approach and characterizes a steady state situation where the reactions have had sufficient time to stabilize. Aquifers in general, and especially aquifers utilized in GWHP systems, never achieve equilibrium, making kinetic considerations necessary for evaluating chemical relations. The reactions involved in iron and manganese dissolution and precipitation display various rates and rate controlling factors. For the oxidation of ferrous iron, the following rate equation is relevant and exemplifies some interesting relations [
20]:
where
k is a temperature-dependent rate constant, [
Fe2+] is the ferrous iron concentration,
p(
O2) is the partial pressure of oxygen, and [
OH−] is the hydroxide concentration. Catalytic effects of other ions in solution and complex formation affects the reaction rate, which often makes the practical utilization of Equation (1) difficult. Even in ideal conditions, Equation (1) is only rate controlling up to pH ≈ 7. When pH > 8, the pH component of Equation (1) is so large that the amount of available O
2 and the diffusion of O
2 becomes rate controlling in practice [
20]. Temperature effects have a minor and often negligible influence on the rate reaction constant (
k). This is because the magnitude of temperature change is often small in GWHP systems, as discussed by, e.g., [
21]. Without emphasizing the practical usefulness of Equation (1), the equation shows how the kinetics are more sensitive to alterations of pH than to Eh if pH > 5, due to the second order term of [
OH−] and the single order term of
p(
O2), respectively. The works of, e.g., [
15,
22,
23] demonstrate that the severity of precipitation problems in groundwater wells often cannot be explained by oxygenation (
p(
O2)) or large concentration of dissolved iron ions alone ([
Fe2+]), and pH alteration mechanisms have been identified as major contributors to the problems. Accounting for pH controlling physical–chemical relations in the GWHP system design is thus relevant.
Carbon dioxide is the major pH-controlling component in groundwater [
18]. This is due to the dissolution and chemical reactions CO
2 undergoes in contact with water. A relatively small proportion of the total dissolved CO
2 hydrates, forming carbonic acid (H
2CO
3). This diprotic acid affects the pH level of the groundwater and lowers the pH if the water does not have sufficient buffering capacity. The magnitude of pH change depends on the water quality in question and the amount of alteration of dissolved carbon dioxide in the water [
16]. Other gases are also relevant, e.g., the sulfur system may contribute to the acidity of natural waters [
24,
25], but this will not be elaborated upon here.
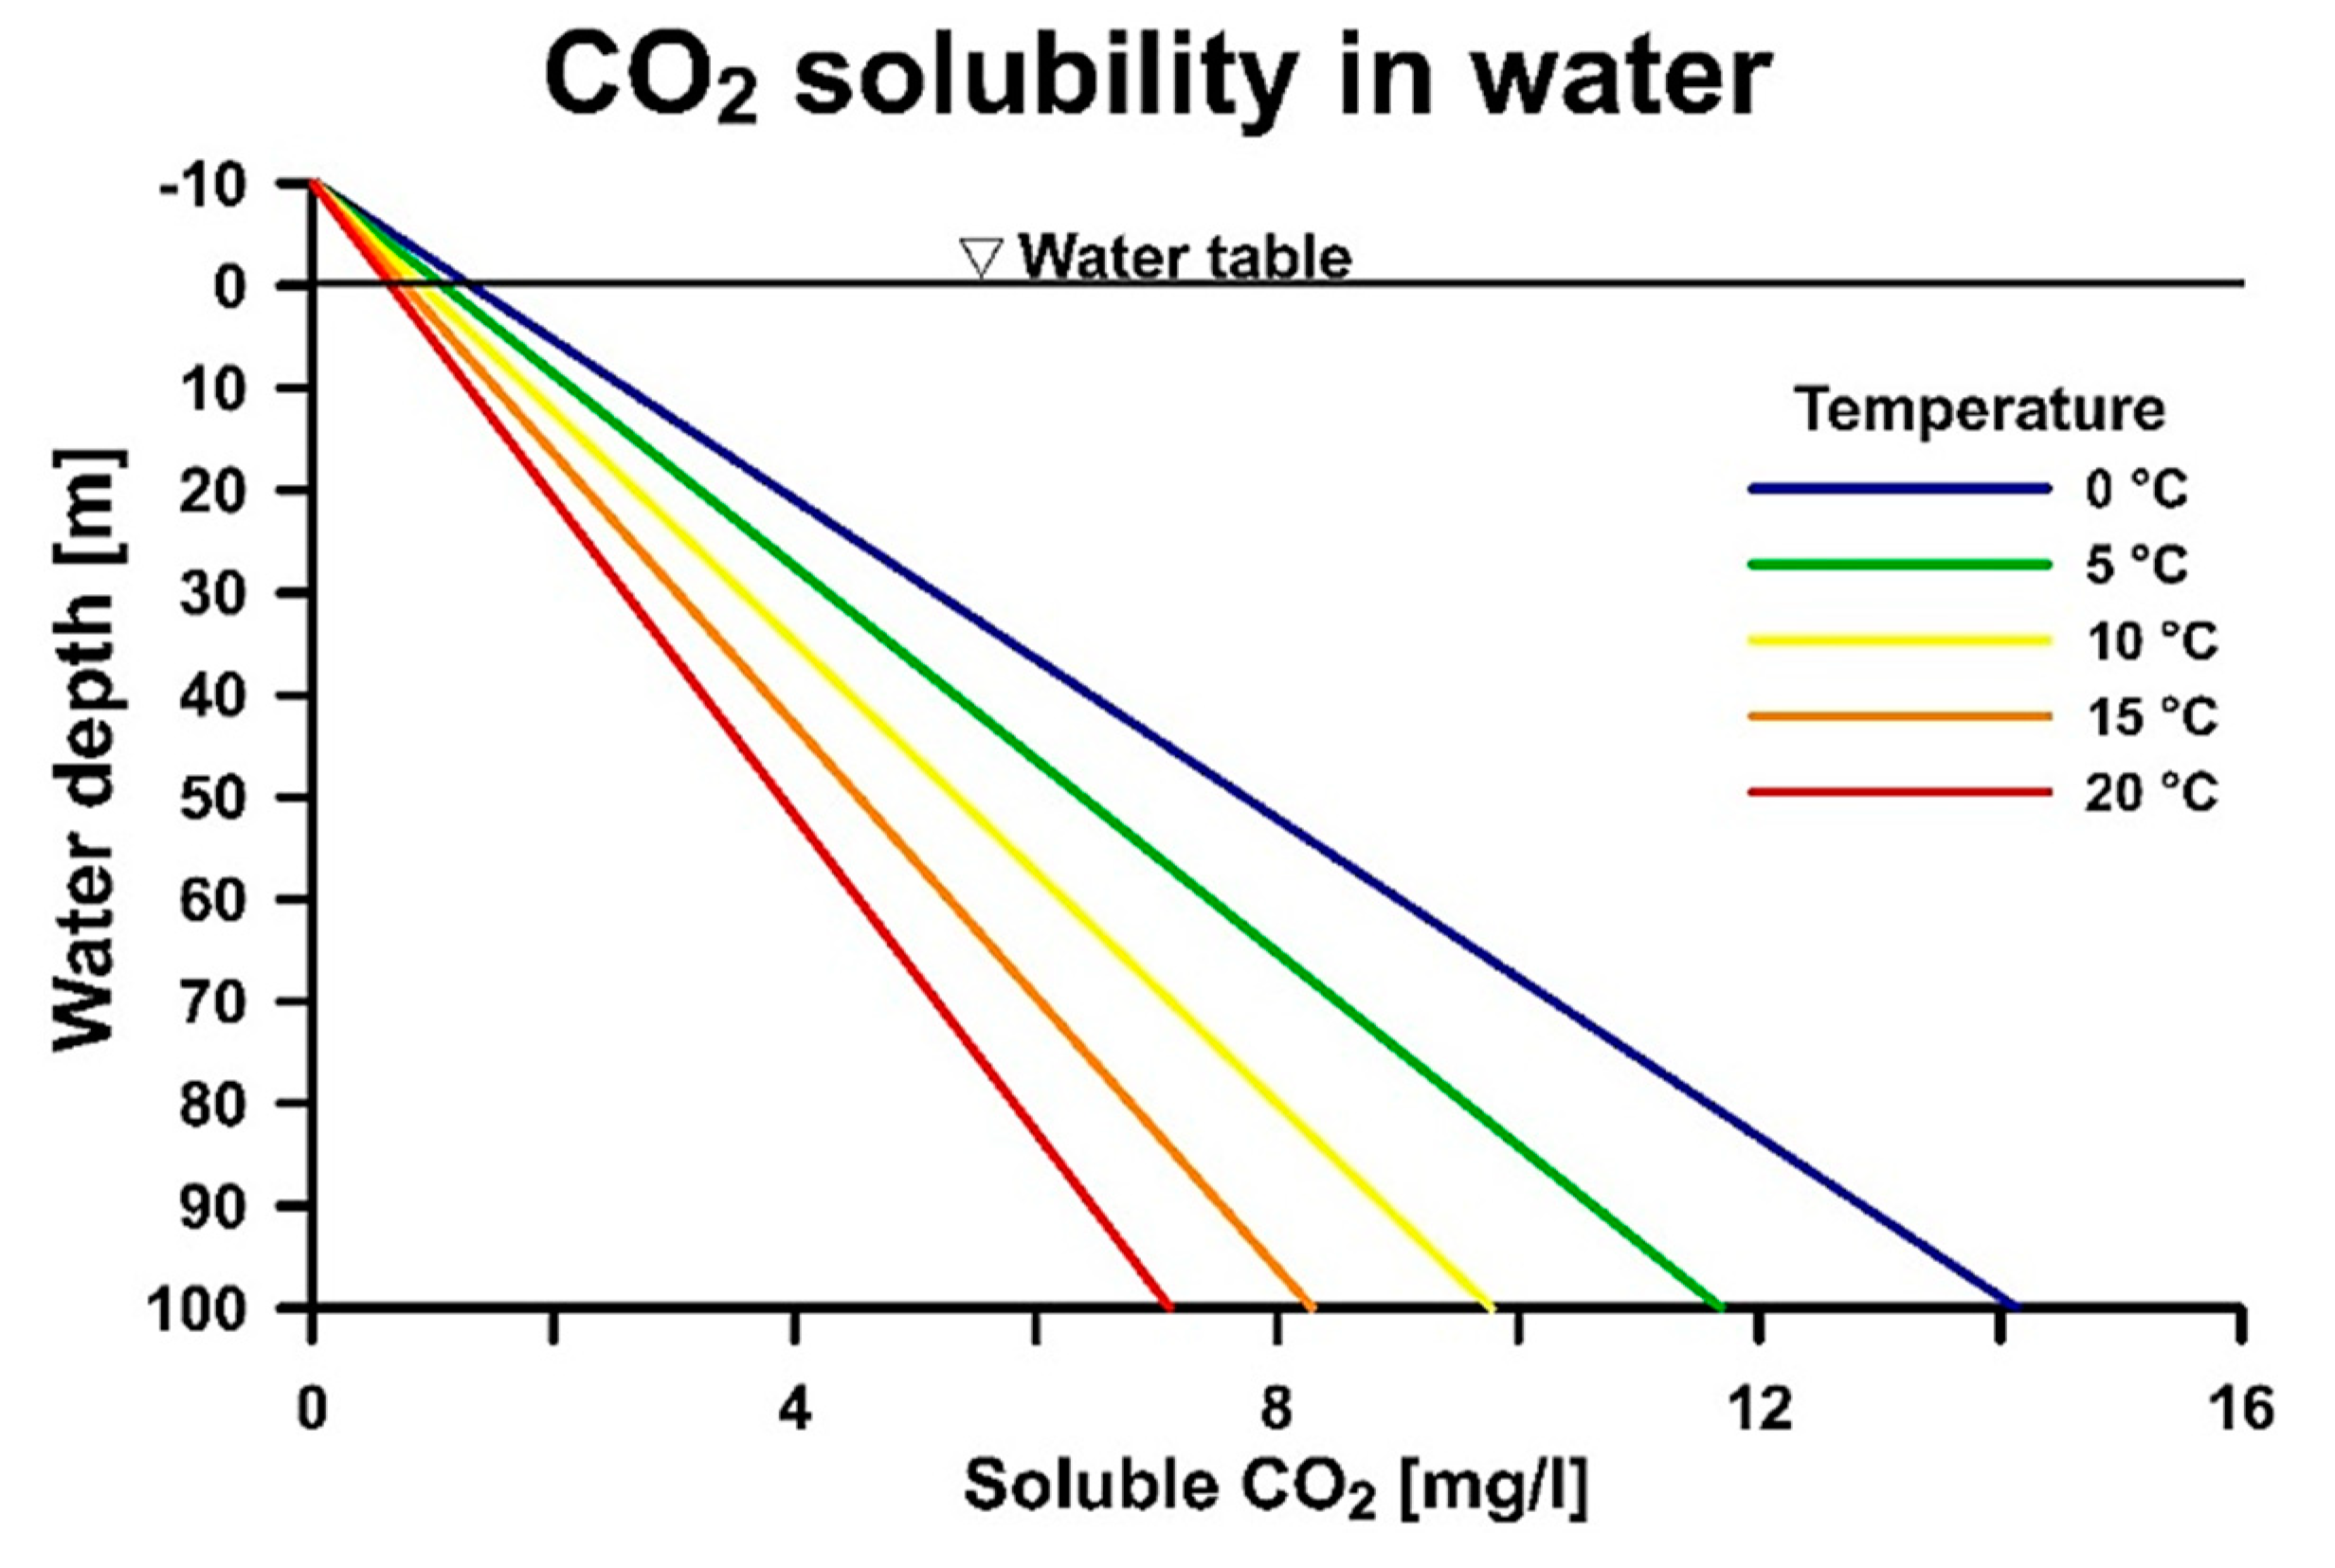
Physical properties that control the amount of dissolved carbon dioxide in the groundwater can have an indirect influence on the pH level of the water. Gas solubility (in water) is dependent on pressure, concentration, and temperature, as stated in Henry’s law [
26].
Figure 4 shows data provided by Colt [
27] and exemplifies the relations of Henry’s law in a water body supplied with CO
2 from an atmosphere with 0.039% atm
p(
CO2). The figure shows that higher partial pressures and lower water temperatures facilitate more gas dissolution. For groundwater with a given chemical signature, this implies that CO
2 is more soluble at low water temperatures and higher partial pressures of
p(
CO2), corresponding to greater aquifer depths.
This has practical relevance for GWHP systems, because extracting water from a water body at a given depth below the water table triggers a loss of pressure, leading to CO
2 oversaturation. The exsolution of CO
2 triggers a chemical imbalance in the groundwater. This results in a rise of pH, and subsequently causes precipitation reactions [
16,
18]. This phenomenon is stressed by Garcia-Gil et al. [
23], who demonstrate a direct risk for precipitation in groundwater systems in Zaragoza (Spain) if the water is allowed to interact with the atmosphere before re-injection. This is both because oxygen can dissolve into the water, and also because carbon dioxide can escape the system.
The water might also be oversaturated with gas if the temperature is increased. In this way, even though the temperature effects are often negligible, e.g., on the rate reaction of Equation (1) directly (k), the temperature can have an indirect influence on the pH. Accordingly, temperature indirectly poses an important role in the kinetics. The utilization of groundwater for cooling purposes in a GWHP system is thus more at risk than a system that utilizes groundwater for heating applications.
The concentration of ions and gases in the groundwater is defined by the local geological conditions in an aquifer system, and there is typically no intension for the GWHP system to alter the chemical composition of the groundwater during production [
10]. However, altering the pressure and temperature conditions of the groundwater do enforce changes to the in-situ groundwater conditions. To evaluate the pressure and temperature conditions in the whole GWHP system is necessary to properly assess the risks of gas clogging caused by gas exsolution and its possible relevance for other fouling issues.
2. Method of Analysis
To properly assess the risks of gas exsolution in a system, one must investigate the influence of the system design on the groundwater pressure and temperature during operation. GWHP systems and aquifer thermal energy storage (ATES) systems are highly fluctuating pressure and temperature systems. Pressure changes through a system can be visualized in diagrams via the hydraulic grade line (HGL); a method frequently applied in fluid mechanics [
30]. The HGL describes the magnitude of hydrostatic pressure head and elevation head at any given location through the entire length of a system. The method requires a detailed description of each system component. Effects caused by size, length, and roughness of the piping system need to be considered, in addition to their elevation with respect to a common reference datum. Energy losses caused by flow through the aquifer, pump, heat exchanger, pipes, and pipefittings (valves, bends, filters, etc.) must also be considered. All these effects are dependent on the groundwater flow rate. These effects are expressed in terms of hydraulic heads (m) in the form of the steady-flow energy equation (rearranged after equation 5.77 in [
30]:
where
p denotes the hydrostatic pressure (Pa),
V the mean groundwater flow velocity (m/s),
g the acceleration due to gravity (m/s
2),
ρ the density of groundwater (kg/m
3),
z the elevation (m) in relation to a reference plane, and
α is a correction factor for turbulence in pipes, usually
α = 1.05 [
30]. The subscripts 1 and 2 denote two arbitrary locations in the system. The terms
p/
ρg are the pressure heads (m),
V2/2
g are the velocity heads (m), and
z are the elevation heads (m) for the two point along the system. Hydraulic head supplied by the submersible pump is included in the term
hpump (m). The sum of all frictional and inertial losses is included in the term
hlosses (m). The term
hturbine (m) is usually not relevant, but signifies that regeneration of energy is possible in some system. The reader is encouraged to read [
30] for more information on this topic and for examples on how to estimate these parameters in piping systems. For estimation of aquifer pressure losses, the reader is encouraged to read [
31].
Equation (2) states that parts of the hydrostatic pressure are converted to kinetic energy, especially in regions of high flow velocities, e.g., at the pump entrance or through narrow channels, e.g., within a plate heat exchanger. Pressure is also converted into potential energy if the water is relocated to a point of higher elevation relative to the reference elevation. When considering their effects on gas solubility, alterations of energy forms must be considered as losses of pressure, in a similar fashion as to that of the frictional pressure losses induced by fluid flow through the system. For this reason, Equation (2) is rearranged in this paper for pressure head to give a modified form of the HGL, termed the gauge pressure head grade line (GPHGL). The assumption made is: Point 1 can be chosen to be at the water table in the aquifer and at a sufficient distance away from the inlet of the pump. The velocity squared of the water at this point is thus negligible. The reference elevation is said to be at this elevation, thereby z
1 = 0. The pressure here is, by definition, the atmospheric pressure, and substituting into Equation (2) the gauge pressure at an arbitrary point can be calculated by Equation (3):
The term
hpump and
hlosses are the heads corresponding to energy added by the pump and lost to friction, respectively, to the flow up to a given point. Inside the pipe, the mean velocity is conveniently calculated as
Q/
A, where
Q is the flow (m
3/s) and
A is the cross-sectional area of the pipe (m
2). The pump being a component at a fixed location means that, for a point in front of the pump,
hpump should not be present in Equation (3). The sum of all the head losses are met by the submersible pump, which must supply an amount of hydraulic head equal to the losses to maintain the balance of Equation (3) at the designed rate of flow. The argument for this is understood if the arbitrary point is at the water table a significant distance away from the injection well; here, the elevation is zero, the velocity squared is negligible, the gauge pressure is zero—making
hpump and
hlosses equal. The equation thus also describes the power needed,
P (W), to circulate the groundwater:
where
η is the coefficient of mechanical and hydraulic efficiency of the pump, typically ranging from 0.5–0.75 or less for submersible pumps depending on pump size and motor speed [
32]. In this sense, the GPHGL also visualizes the energy needed for groundwater circulation at the specific mode of operation.
The GPHGL analysis is constructed by Equation (3) along a line (A–I) that describes the pressure exerted on the water traveling along the line through the system during operation. Along the line, the water is assigned properties with respect to the water table and the flow velocity at each point along the line. The GPHGL is a visualization of the bulk pressure exerted on the water at different segments in the GWHP system. This pressure directly controls gas solubility in the water. As the pressure varies through the system, the solubility of gases is altered according to Henry’s law. The GPHGL therefore describes the general risk of gas exsolution in the system.
However, alterations of temperature in the groundwater heat exchanger renders the GPHGL and Equation (3) unable to adequately describe the system’s influence on gas solubility. Combining Equation (3) with the temperature solubility relations for, e.g., CO
2 in water, the GPHGL is modified further to provide a solubility grade line (SGL) for the system in relation to CO
2 specifically. In this study, this is done for water with 0.039% atm.
p(
CO2), corresponding to atmospheric concentrations. This data is readily available for a wide range of temperatures and pressures in Colt [
27]. The behavioral trends are seen in
Figure 4, and the variable pressure and temperature components result in different solubilities for the water along the line (A–I). The reader is referred to [
27] for the specific details regarding the solubility relations that constitute
Figure 4. Solubility of other gases are not considered in the SGL.
For simplicity, the SGL analysis in this paper does not consider the thermal energy provided by cooling of the submersible pump motor or the thermal energy provided by frictional losses through the system, as these thermal contributions are estimated to be small in relation to the heat exchanged in the groundwater heat exchanger. Considering the GWHP system presented in
Figure 1, it is apparent that several components can cause considerable alterations to the gas solubility as the groundwater travels through the system. The application of the GPHGL and the SGL will be presented in the following section for two different fictional GWHP systems with 0.039% atm.
p(
CO2)-saturated groundwater conditions.
3. Example of Gas Exsolution Triggers and Application of the SGL
The examples presented in the following sections are theoretical and are not actual systems in Melhus. The first example presents a design that follows the traditional Norwegian GWHP concept. Numerous risk areas of this design are presented. The second example is a new design approach that eliminates all of the risk areas by relocating the system components in the aquifer. The components are otherwise identical in both examples. These two systems demonstrate that the design and location of the wells and piping system can have a profound effect on gas solubility during groundwater circulation.
For simplicity, the example cases assume that the groundwater is saturated with CO
2 at the location of the production well screen and injection well screen depths, corresponding to the solubility relations provided by Colt [
27]. This situation would resemble an unconfined aquifer with limited or no organic material in the soil formation. This situation serves as an example of how gas clogging risks in an aquifer can be managed through design and system control.
The water table is, per definition, the location of the atmospheric pressure in the aquifer. The GPHGL analysis in the presented examples refers to the water table as the reference datum for gauge pressure calculations, Zwater table = 0. It should be noted that the water table might have seasonal fluctuations in natural groundwater systems and that the presented examples must be viewed as steady state situations. Only the aquifer, piping (3” ID), and heat exchanger pressure losses are included in the analysis and the components are equal for the two cases, with the exception of the piping length and well depths. The cases are thus simplified versions of actual systems, but they are intended to demonstrate the concepts, not to present a specific system in Melhus.
3.1. The Traditional Norwegian GWHP Design Concept
The traditional Norwegian open loop well design follows the same dimensioning principles utilized in wells constructed for drinking water purposes. The main purpose of the design is to provide the GWHP system with sufficient groundwater circulation (
Q (m
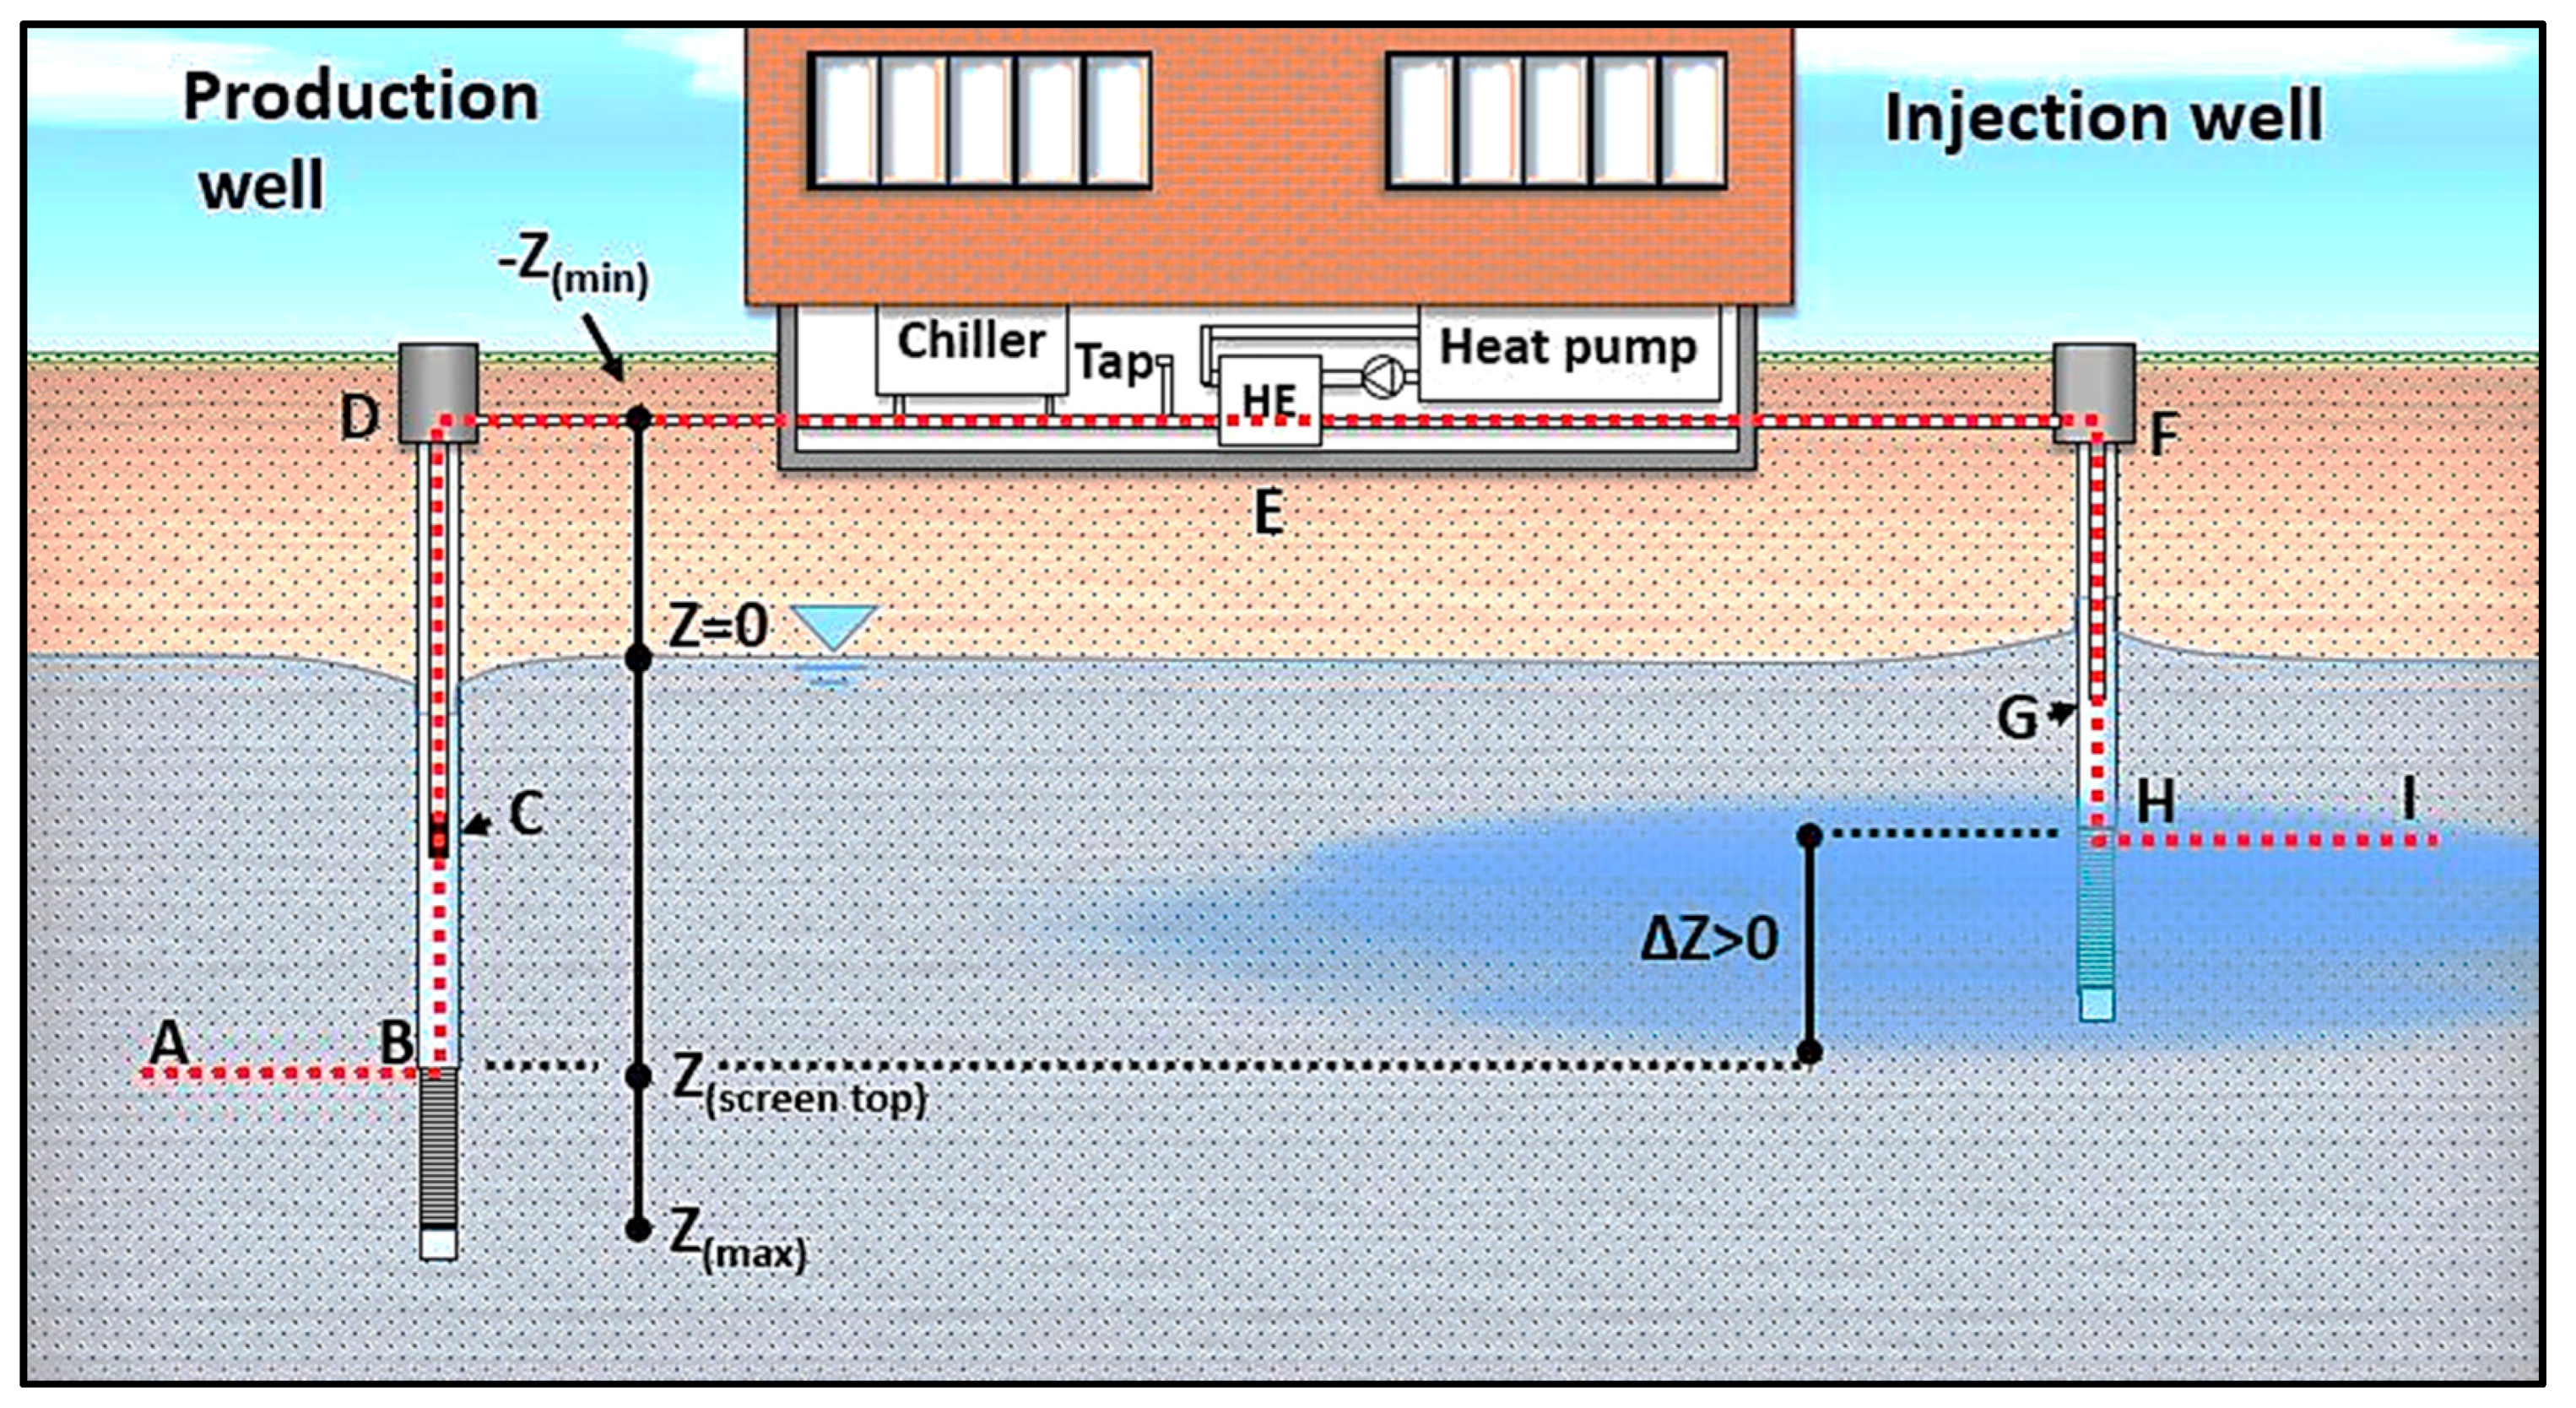
3/s)) and, thus, thermal energy. In practice, these principles involve minimizing the investment cost by limiting the well size and depth (z (m)) and, thus, reduce the drilling costs. In a homogeneous and isotropic aquifer, where impermeable sediments in the aquifer are not an issue, this principle can typically lead to the GWHP system configuration in
Figure 5. Here, the injection well screen (H) is located at a shallow depth (Δ
z > 0 (m)) compared to the production well screen (B).
The exact placement of the submersible pump in the production well (C) and the outlet pipe in the injection well (G) are selected based on evaluations of operational risks. The submersible pump must be installed sufficiently deep to prevent excessive drawdown of the well water level at the designed maximum flow rate. This often leads to a pump placement directly above the well screen, consequently maximizing the available drawdown potential of the well. However, if the well is sufficiently deep and the risks of excessive drawdown are small, the pump can typically be located as seen in
Figure 5 to save costs on raiser pipe length and electrical cable. Similarly, the injection pipe outlet (G) must be submerged below the water table to limit the risk of mixing with the air in the well bore before injection. The injection pipe is rarely located deeper than a few meters below the well water table.
Before injection, the thermal energy is extracted in the groundwater heat exchanger in the basement of the building, which is located a certain elevation above the water table in the aquifer (−Zmin (m)). The location of the heat exchanger is often close to the heat pump unit, contributing to an as short as possible indirect loop of secondary fluid, yielding lower costs associated with the indirect loop and the circulation of secondary fluid. This might be convenient in many installations, but if the distance from the wells to the building is great, the length of the groundwater loop can sometimes be several hundred meters more than the shortest distance between the wells themselves.
The system design presented in
Figure 5 imposes a number of pressure changes to the groundwater as it travels through the system. As a simplified example, we can consider the following situation where the production well screen is installed at B = 20–25 m depth and the injection well screen at H = 10–15 m depth. The submersible pump is installed at C = 10 m depth and the injection pipe exit at G = 3 m depth.
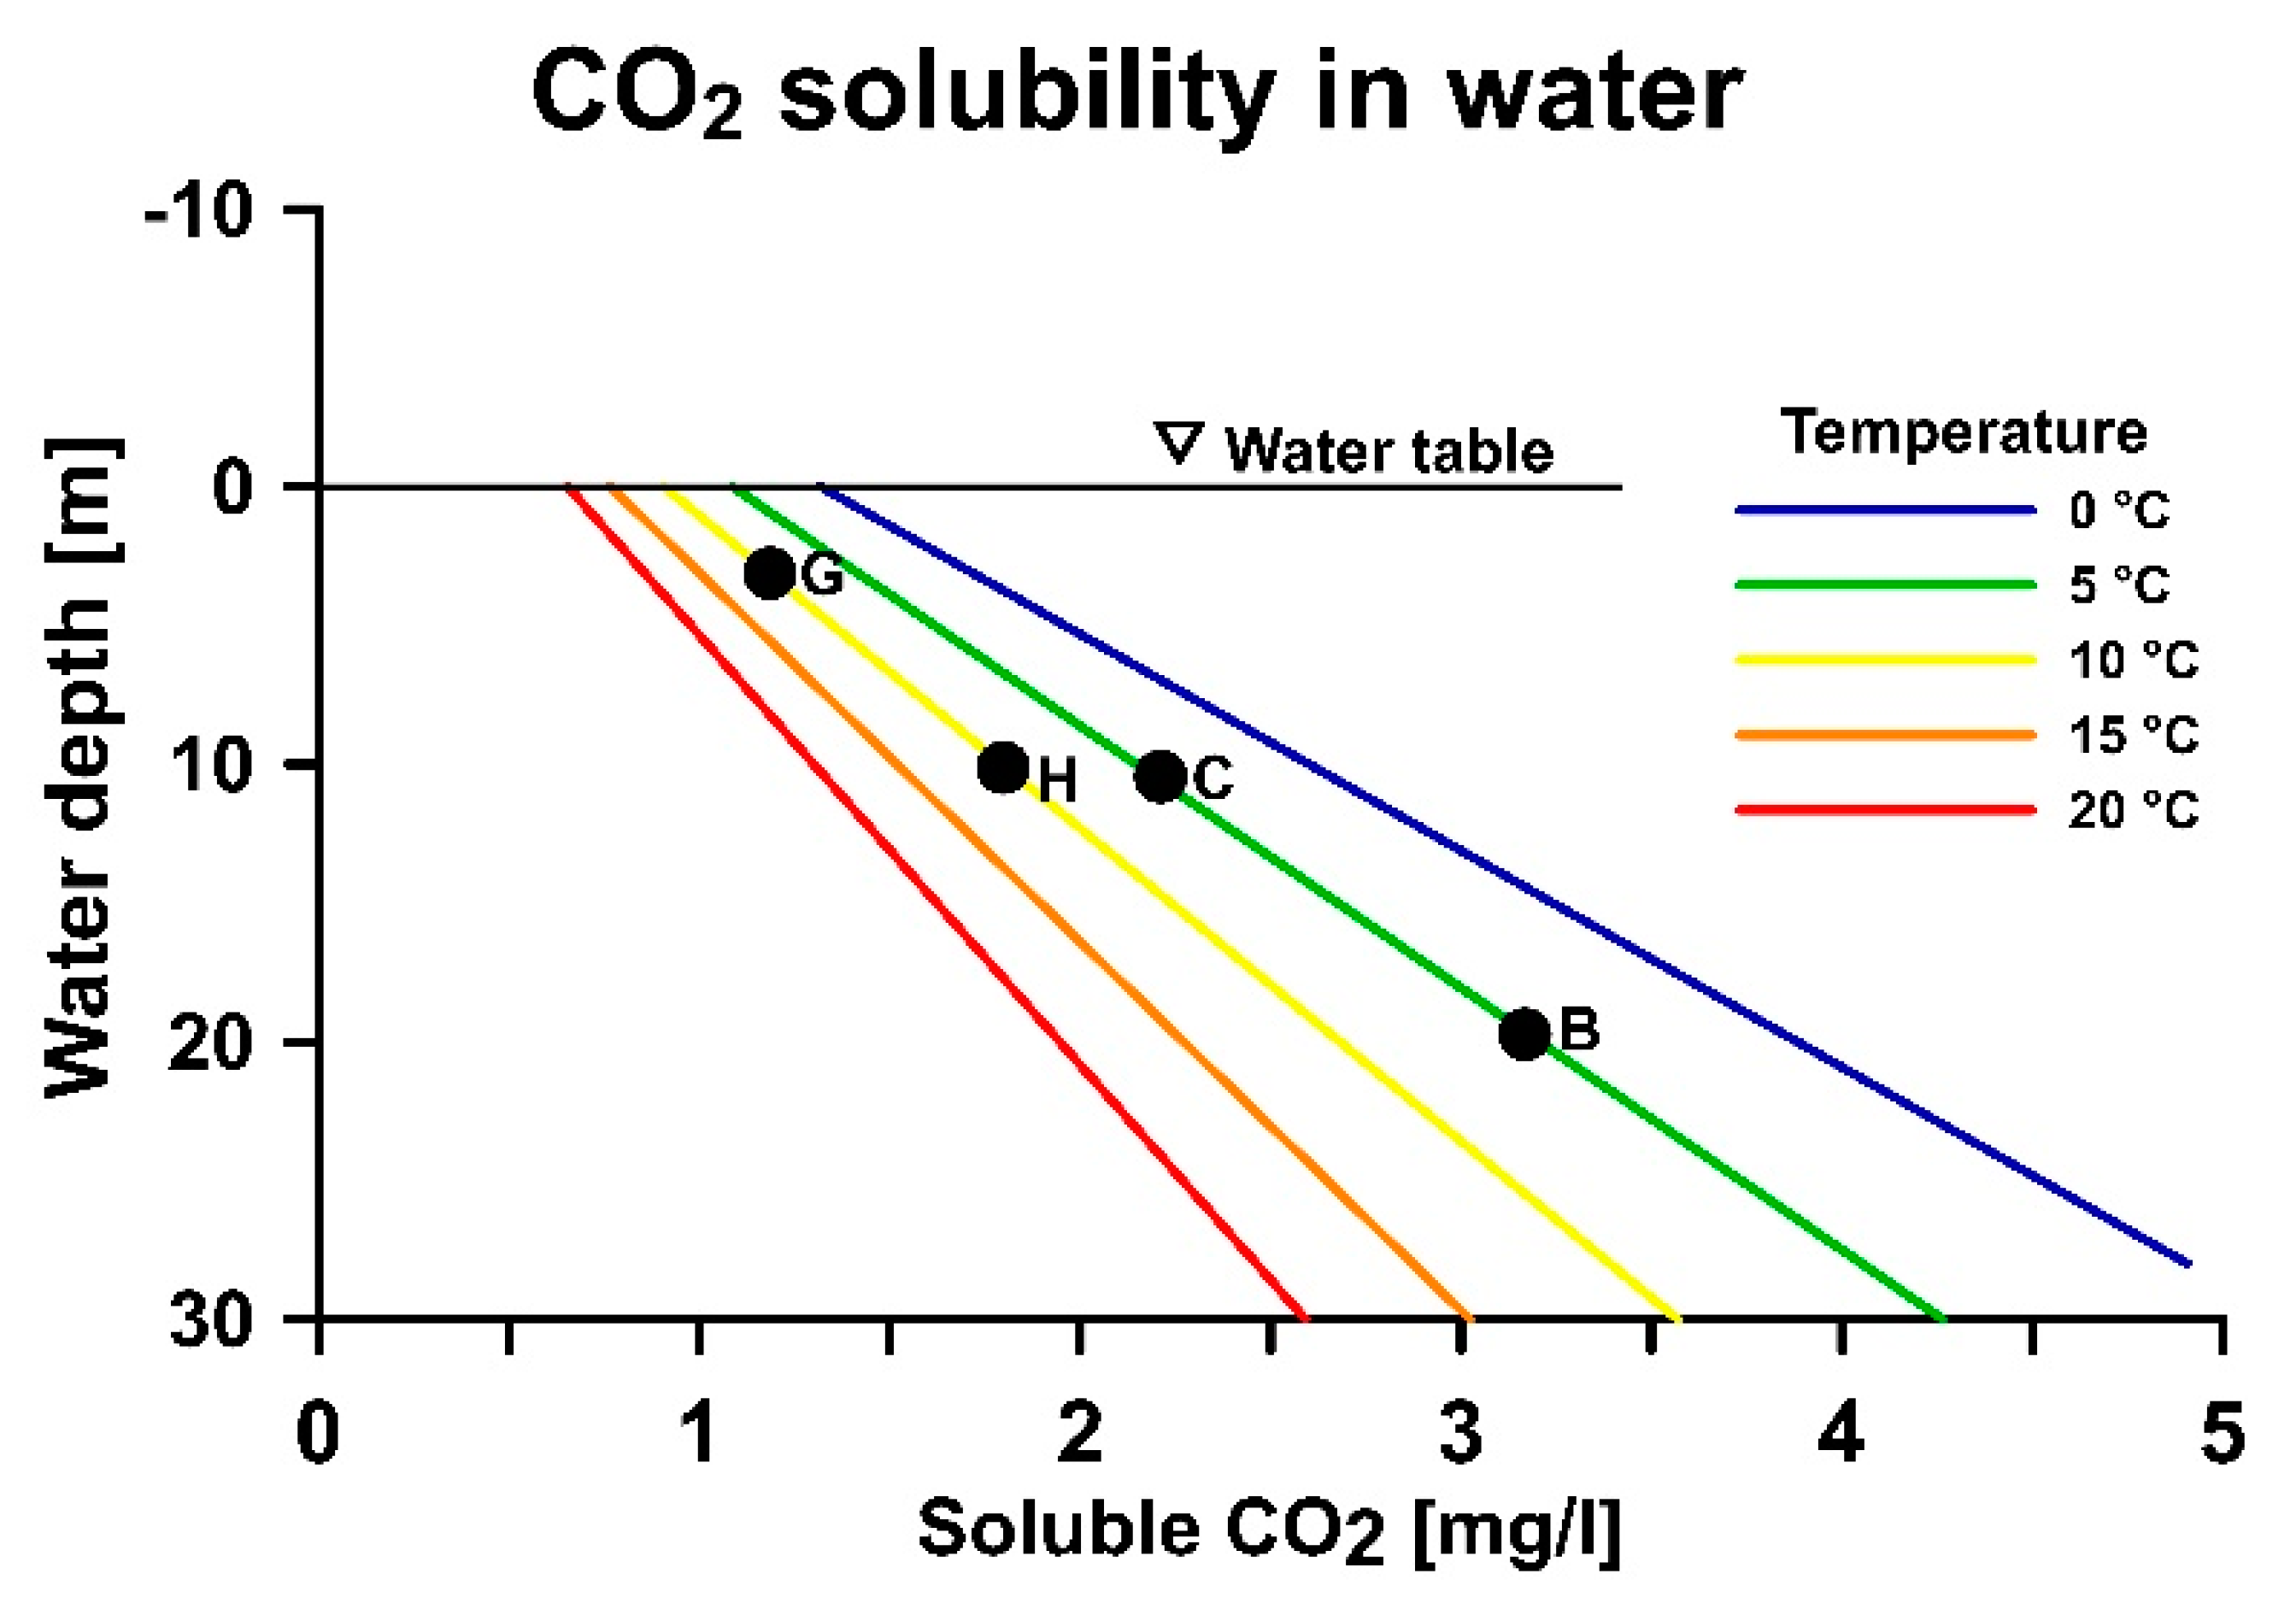
Figure 6 presents these key design components in view of their effects on CO
2 solubility in groundwater. In addition, the groundwater temperature is altered depending on the energy demand in the building. If there exists a cooling demand, the groundwater temperature is re-injected into the aquifer with a higher temperature than the original temperature, e.g., an increase from 5–10 °C.
The location of the pump at 10 m above the production well screen triggers a pressure drop of 1.0 bar and the solubility of CO
2 decreases (
Figure 6B,C). The initial groundwater is saturated with CO
2, the gas is exsolved out of the water phase, and chemical reactions are triggered. These reactions increase the pH level of the water, which in turn can trigger precipitation reactions.
The shallow placement of the injection pipe (G) in the injection well, combined with the increased temperature caused by the cooling of the building, further decreases the solubility of gases and increases the gas exsolution (
Figure 6C vs.
Figure 6G). The groundwater is further depleted with CO
2 and the chemical reactions are accelerated and allowed to continue. The shallow injection screen depth prevents the CO
2 bubbles from dissolving, and the bubbles effectively clog the well screen and aquifer formation near the well (
Figure 6G,H).
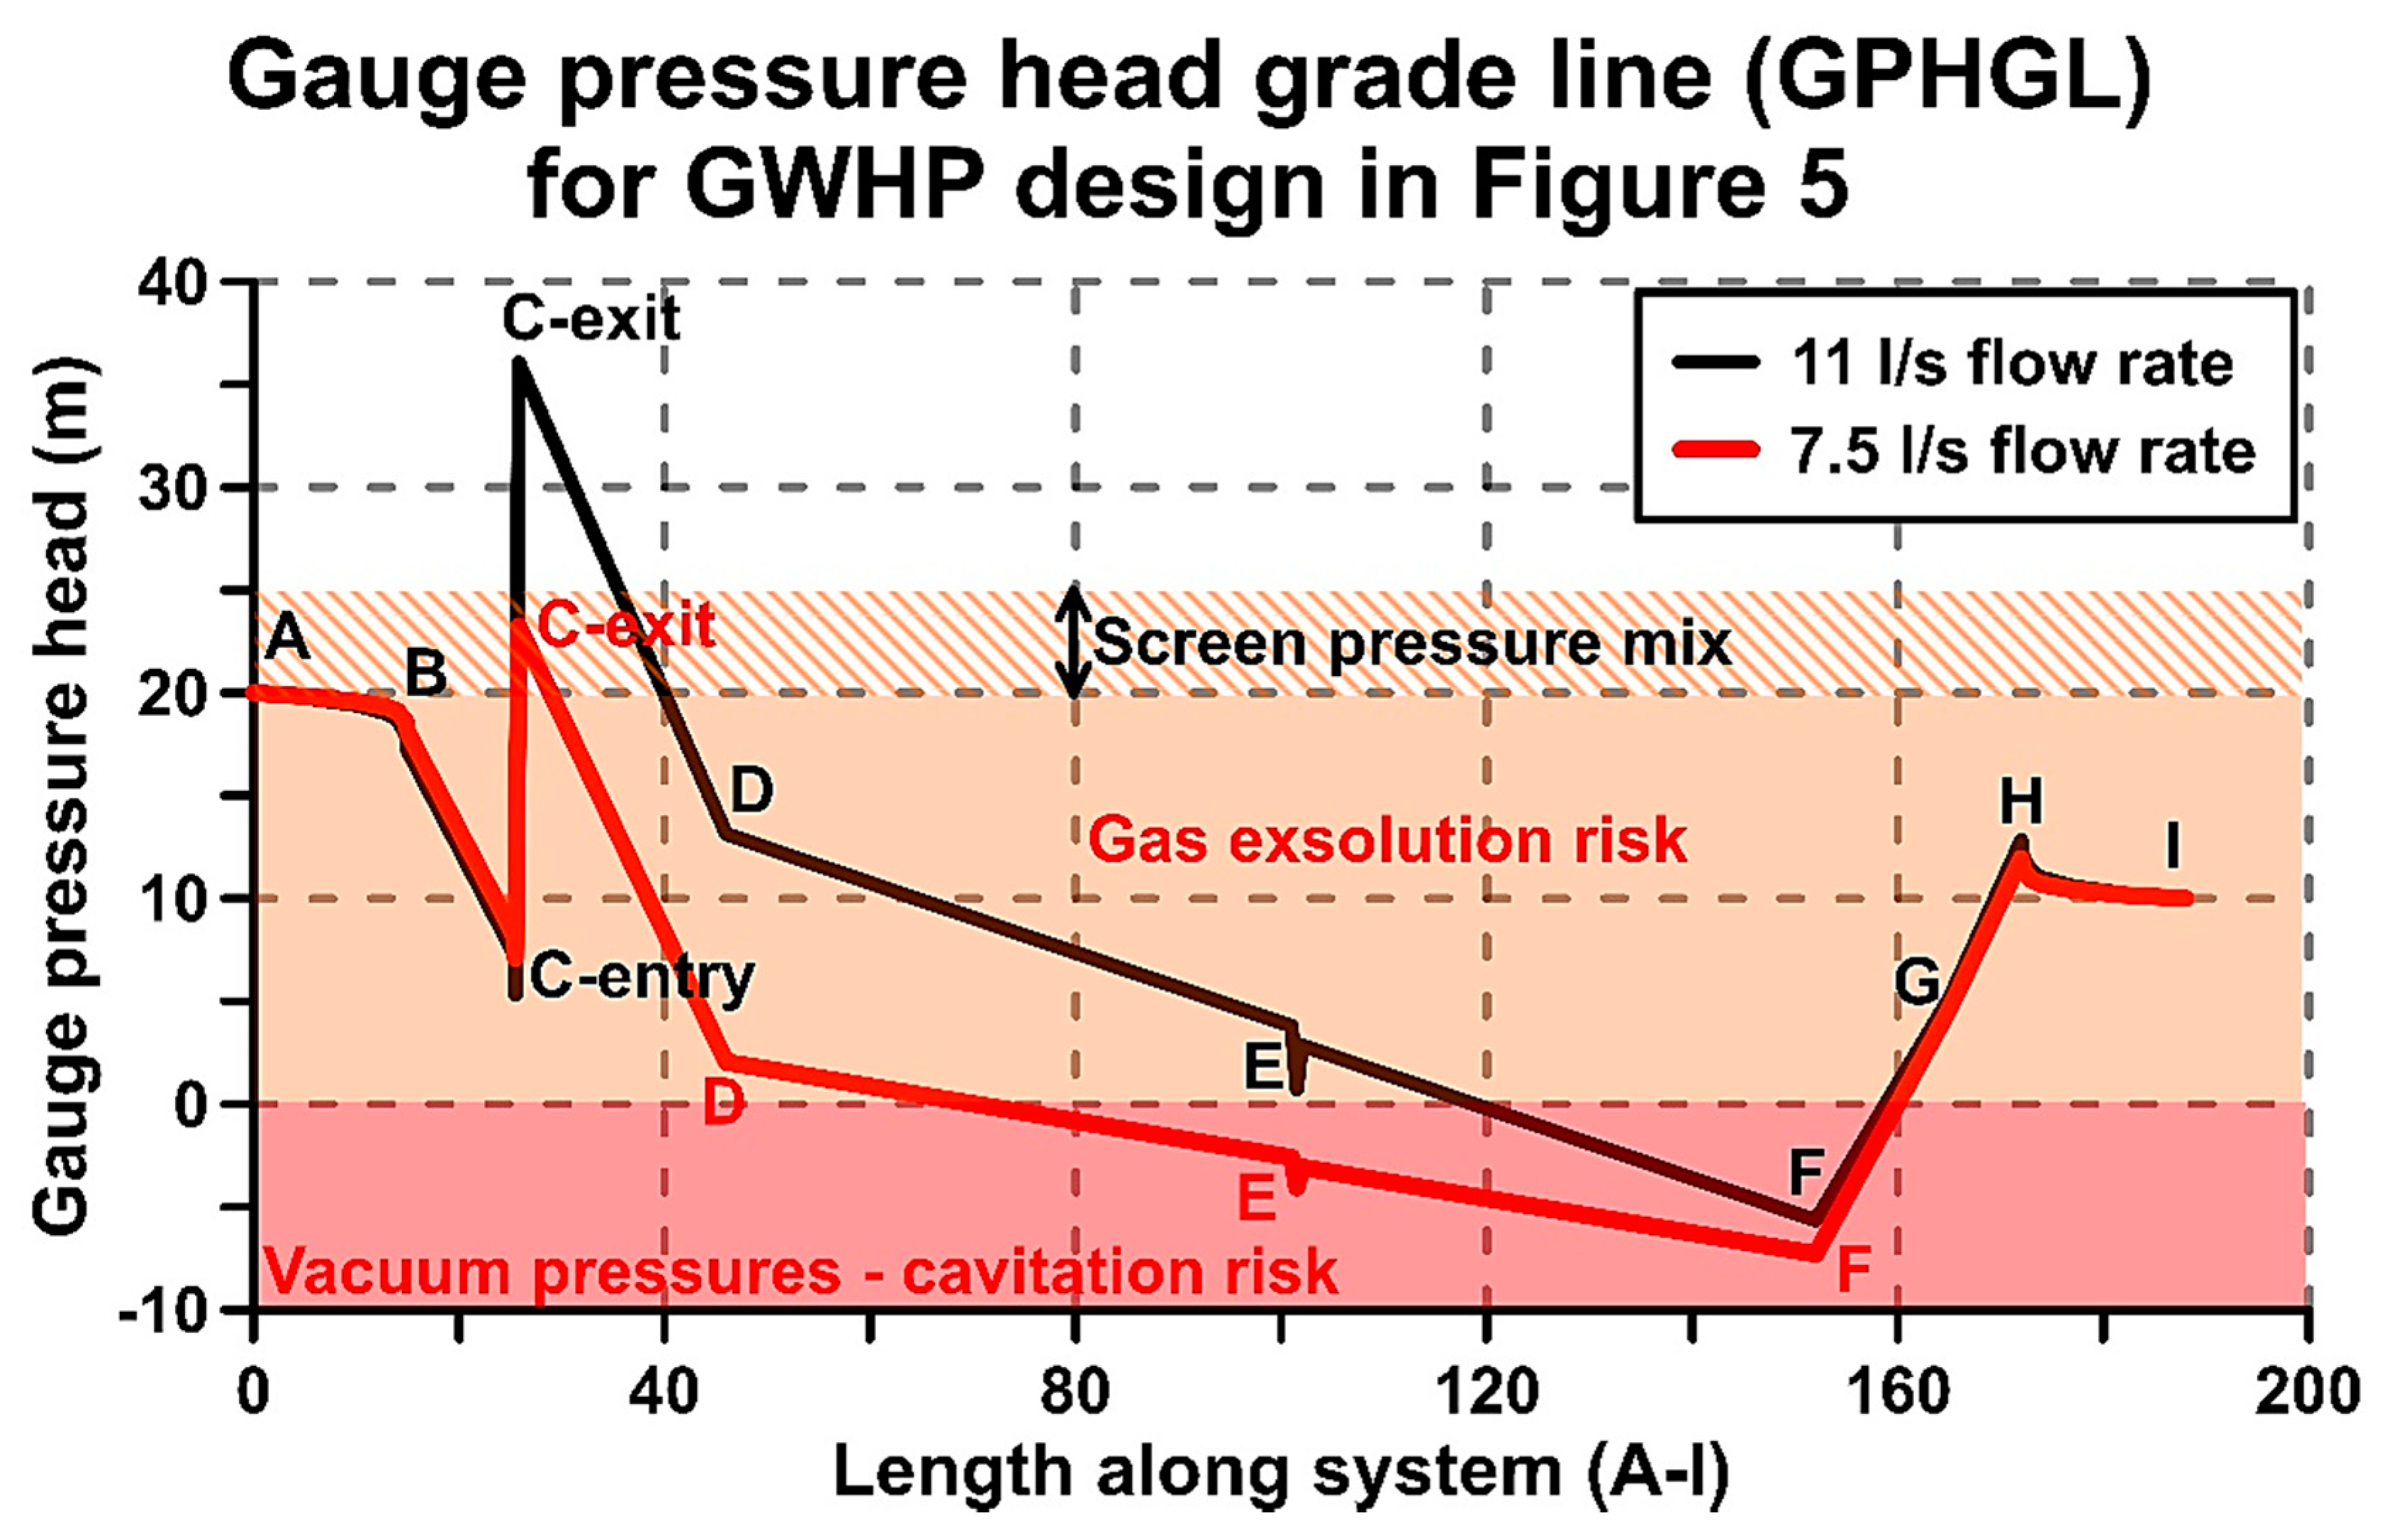
The GPHGL analysis of the pressure reveals the dynamic pressure changes through the piping system. The GPHGL analysis along the dotted line A–I in
Figure 5 shows that the traditional system configuration is predisposed to losses of pressure after the groundwater has entered through the production well screen (
Figure 7). Frictional losses in this aquifer only cause minor drawdown losses before entry through the screen (A–B). This is typical for highly permeable aquifers. The length of the well screen allows for mixing of groundwater from 20–25 m depth before the entry to the pump. The groundwater entering at the bottom of the screen is thus subjected to larger losses of pressure and corresponding changes in gas solubility.
In addition to the 1.0 bar pressure loss before the pump (B–C), the actual pressure loss at the pump entry can be higher because of the relatively high speed of the water when entering into the pump impellers (7.5 l/s vs. 11 l/s of C-entry in
Figure 7). The abrupt pressure increase displayed at C represents the additional pressure,
hpump, that is supplied by the submersible pump. The input power is equal to the frictional and elevation losses in the system. The input power and the supplied pressure is thus smaller for the 7.5 l/s vs. 11 l/s mode of operation. After pump exit (C-exit), the additional pressure supplied by the pump is quickly dissipated by the elevation rise towards the top well fitting (C-exit towards D).
The length D–F represents the pipe length from the production well to the injection well which, in this case, is 105 m. Since the heat exchanger is located in the basement of the building, the distance D–F is often unnecessarily long and filled with bends, valves, and filters. These components are not included in this analysis, but can contribute to local low-pressure zones along the D–F line that might enter the vacuum region of the GPHGL diagram. This is exemplified by the slight dip within the heat exchanger (E). The risk associated with vacuum is, e.g., severe gas exsolution caused by significant loss of gas solubility (
Figure 4). In the worst case, the water starts to boil, and the onset of cavitation might occur. The severity of the vacuum and size of the vacuum region depends on the flow rate and the specific location of different components in the system. For this system, the heat exchanger (E) enters the vacuum region if the flow rate is reduced from 11 to 7.5 l/s (
Figure 7).
The injection pipe (G) is submerged beneath the water table and the risk of entering the vacuum region is largely controlled by the elevation difference from water table within the well and the injection well top fitting (F). The elevation difference from F to the well water table causes a suction within the pipe, and the magnitude of suction is proportional to the elevation distance of F above the well water table. The re-injection of groundwater into the aquifer (I) requires an increase in the hydraulic gradient (H–I). This leads to an artificially high water level within the injection well. The magnitude of suction in the system is thus a function of the injection well characteristics and the mode of operation. For instance, the suction is larger at lower rates of flow, as seen in
Figure 7.
The GPHGL analysis shows that the location of the injection well screen at a shallower depth causes a permanent loss of pressure (I vs. A). The traditional system design is unable to avoid gas clogging issues if the groundwater is saturated with gas.
3.2. New Design Principle and Proposed Alternative Design Concept
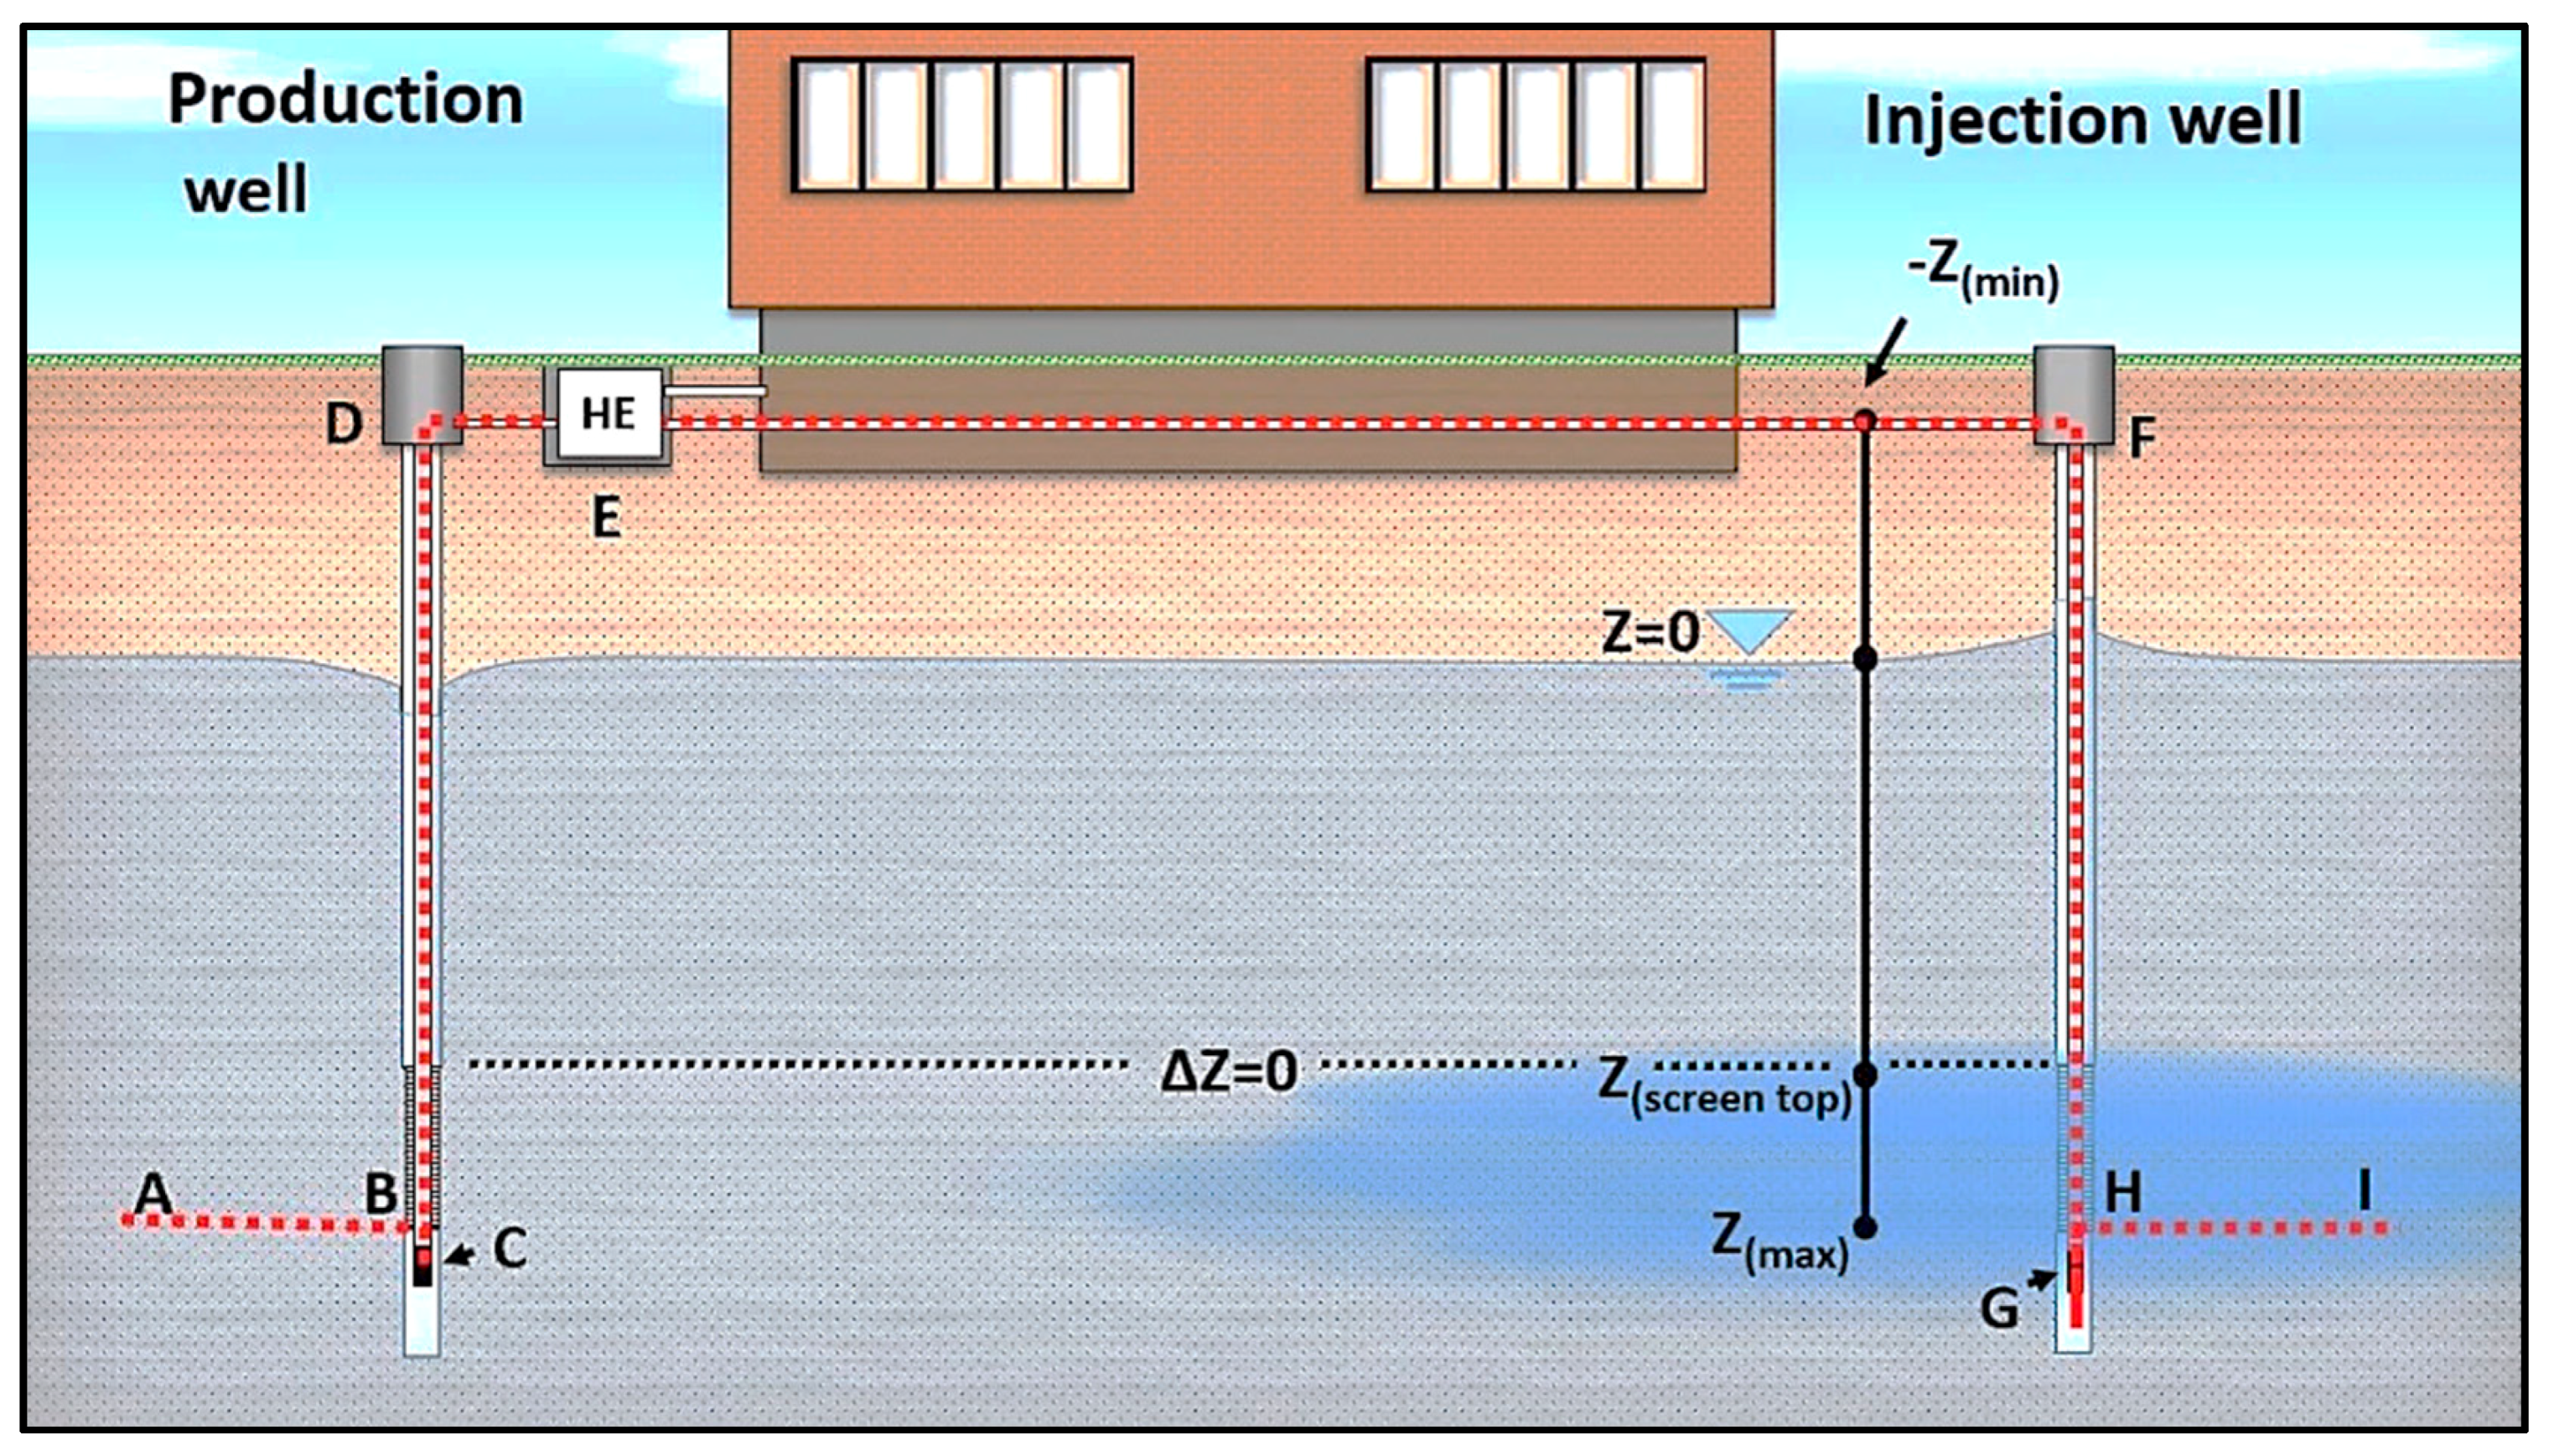
The new design alternative incorporates considerations of pressure and temperature, in addition to the traditional design principles. The design should provide the building with sufficient thermal energy without allowing gas exsolution to occur. This can be avoided by imposing a consistent rise in pressure within the system, instead of allowing pressure to drop. This means that the whole system must be designed in relation to the location of the production well screen relative to the aquifer water table (
Figure 8). Solubility relations also depend on the temperature, meaning the magnitude of temperature alteration during operation must be considered in relation to the corresponding pressures needed to avoid gas exsolution.
The location and length of the production well screen enables extraction of groundwater with a fixed pressure range relative to the groundwater table (20–25 m). The highest pressures are found in the deepest part of the well, at the lower end of the screen. The installed depth of the screen bottom thus forms the baseline for the design (B = 25 m). The location of the pump below the screen bottom ensures that the pressure level is preserved until the water has entered the pump impellers (C > 25 m). Similarly, the re-injection pipe in the injection well must be installed beneath the injection well screen to ensure over-pressure upon re-entry to the well (G > H). Without considering alterations to the groundwater temperature yet, it is evident that the injection well screen (H) must be installed at minimum the same depth as the production well screen to avoid a permanent loss of pressure after the groundwater has left the GWHP system.
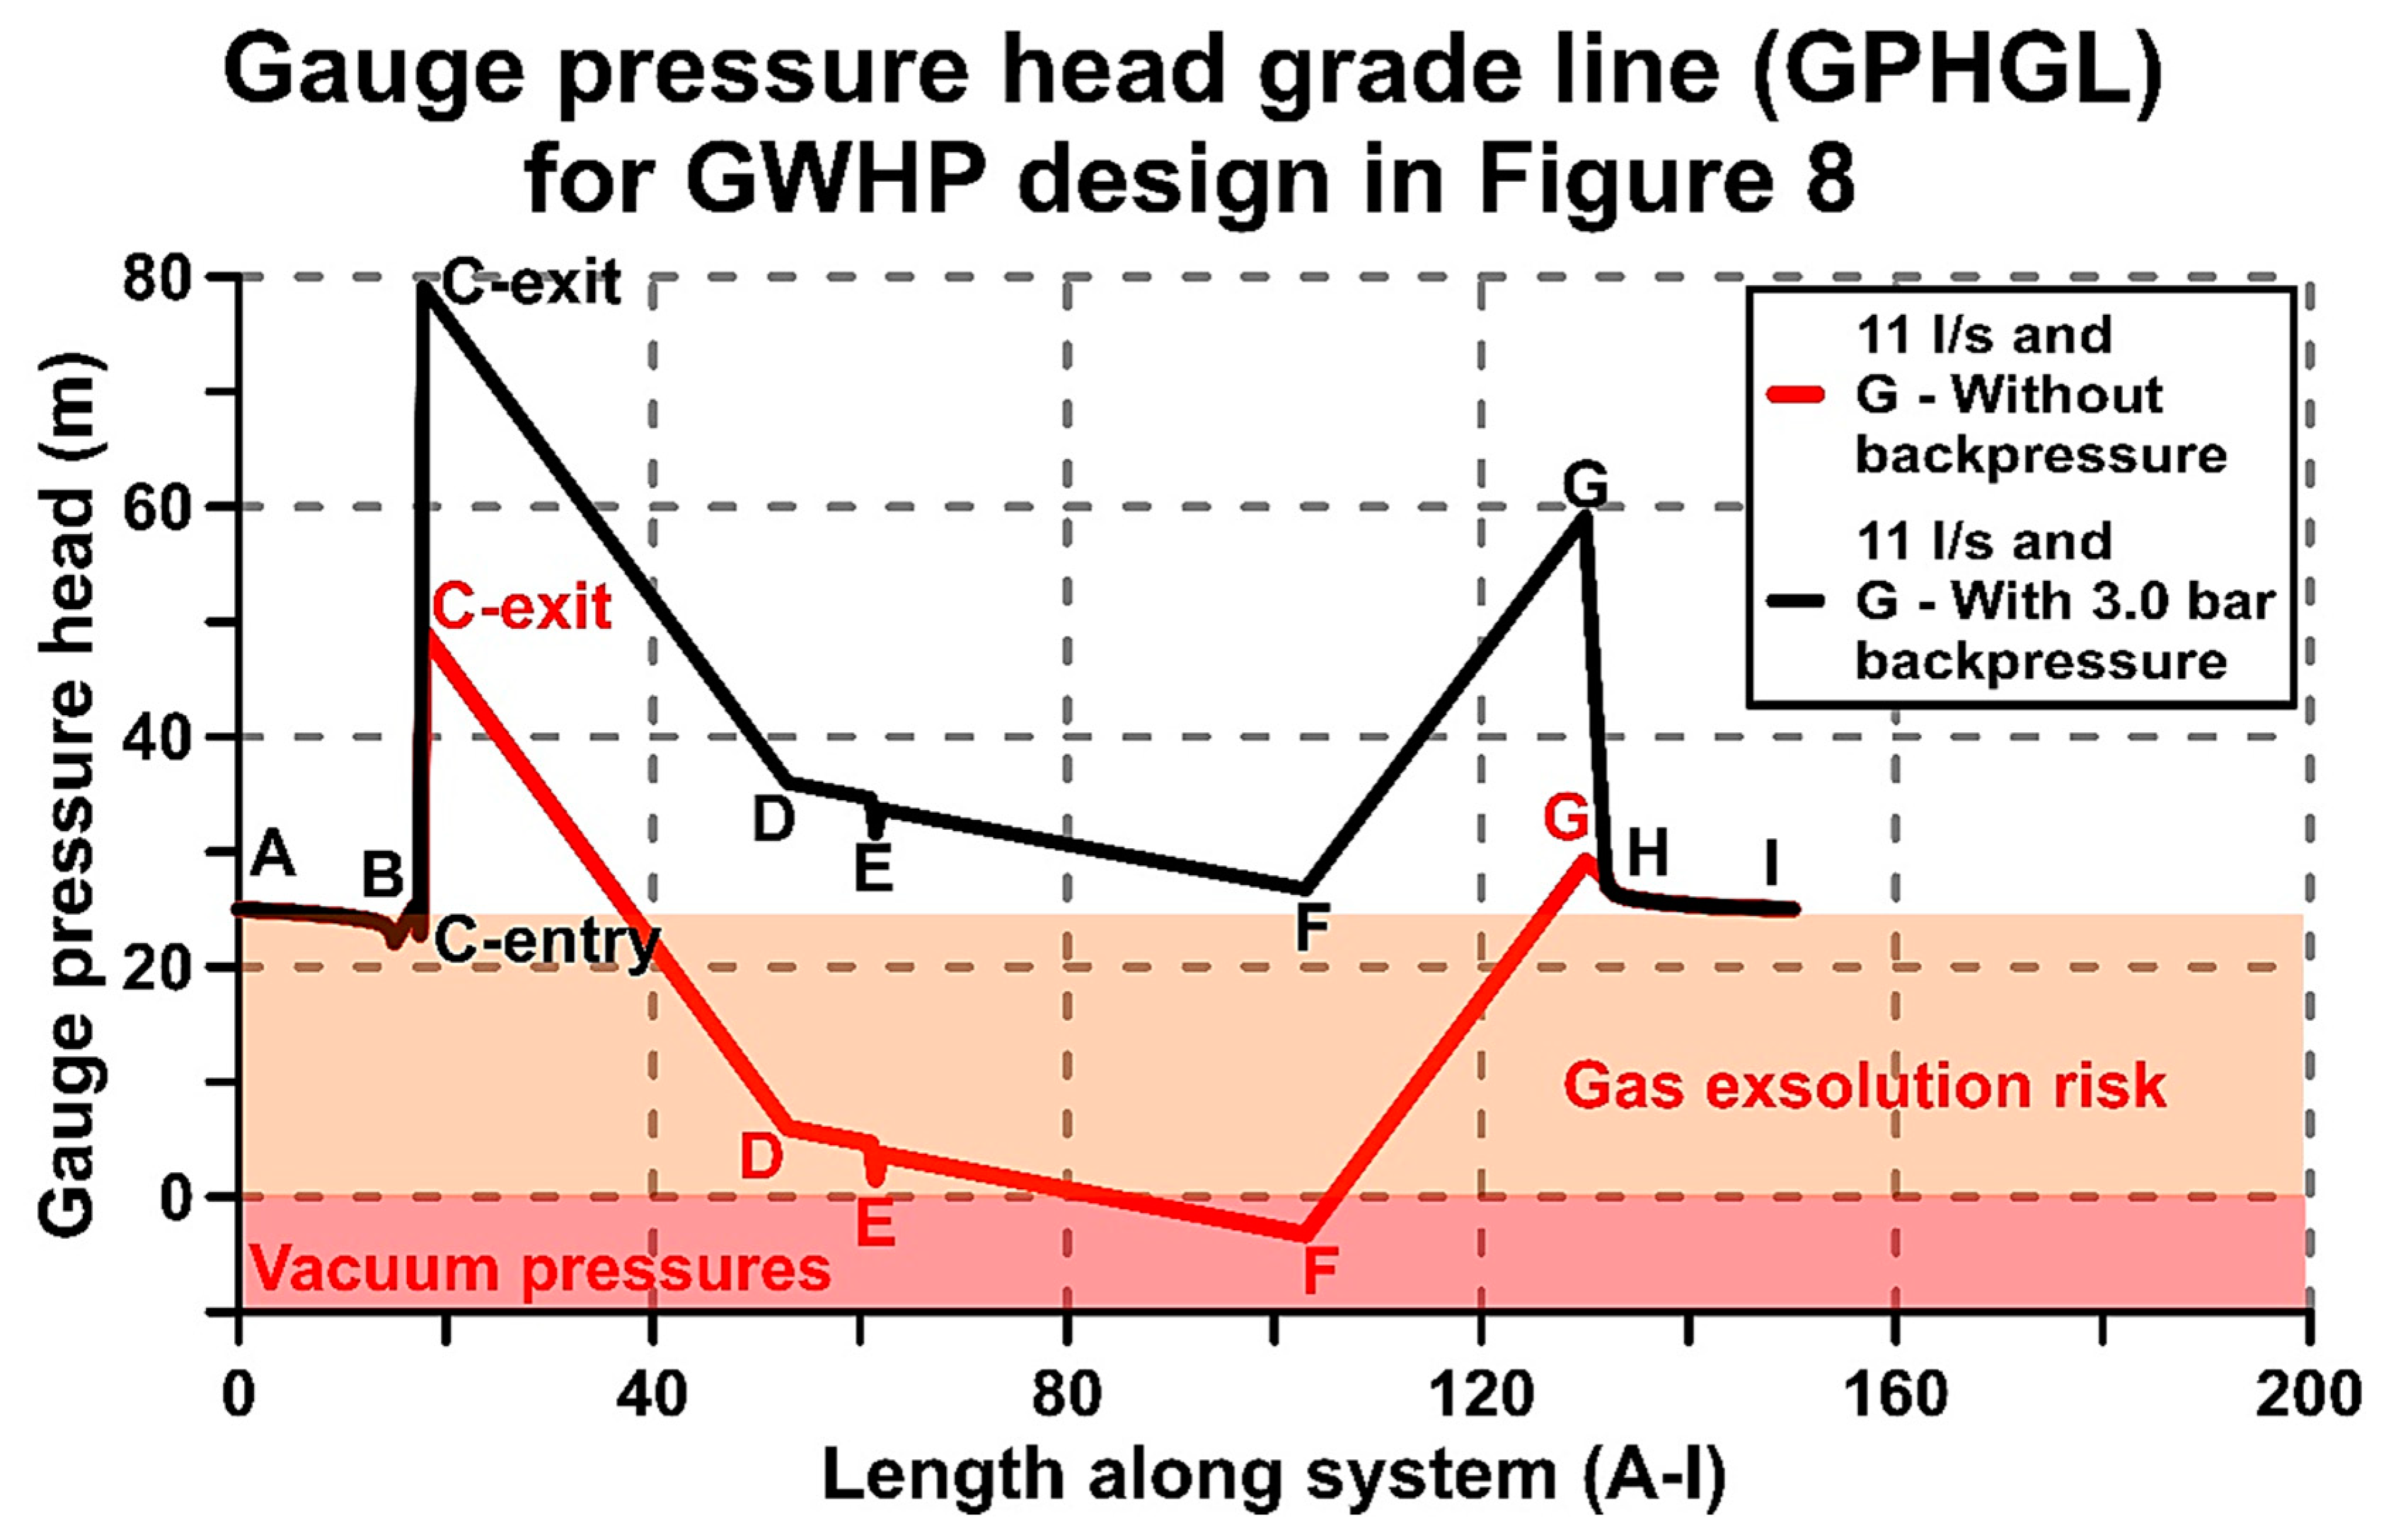
The GPHGL analysis shows that these minor design adjustments ensure a pressure level that reduces the risk of gas exsolution in the production well and the injection well (
Figure 9). The pressure drop in the aquifer around the production well (A–B) cannot be avoided, but the magnitude of drawdown can be controlled by adjusting the pumping rate through the system.
The pressure within the groundwater pipeline (C–G) is still not sufficiently controlled. Sufficient over-pressure is only achieved by installing a backpressure devise (G). The magnitude of backpressure required is a function of the reference pressure in the production well (2.5 bar), the required elevation lift above the water table (1.0 bar), and the groundwater flow rate in the system. For instance, for the pressure to be 2.5 bar at F at zero flow, the additional backpressure at G must be 3.5 bar to simulate a 25-m-high “water column” above F. During groundwater circulation, the friction in the injection pipe and the water level increase in the injection well provide some of this backpressure. The additional backpressure needed is correspondingly less. If the flow rate is set to, e.g., 11 l/s, the GPHGL analysis of this system shows that the pipeline pressure is sufficient if the backpressure valve is 3.0 bar (
Figure 9). The main drawback with the backpressure technique is the substantial amount of additional pumping power required for groundwater circulation. This is seen in the 30-m-higher C–exit point for the black GPHGL (
Figure 9).
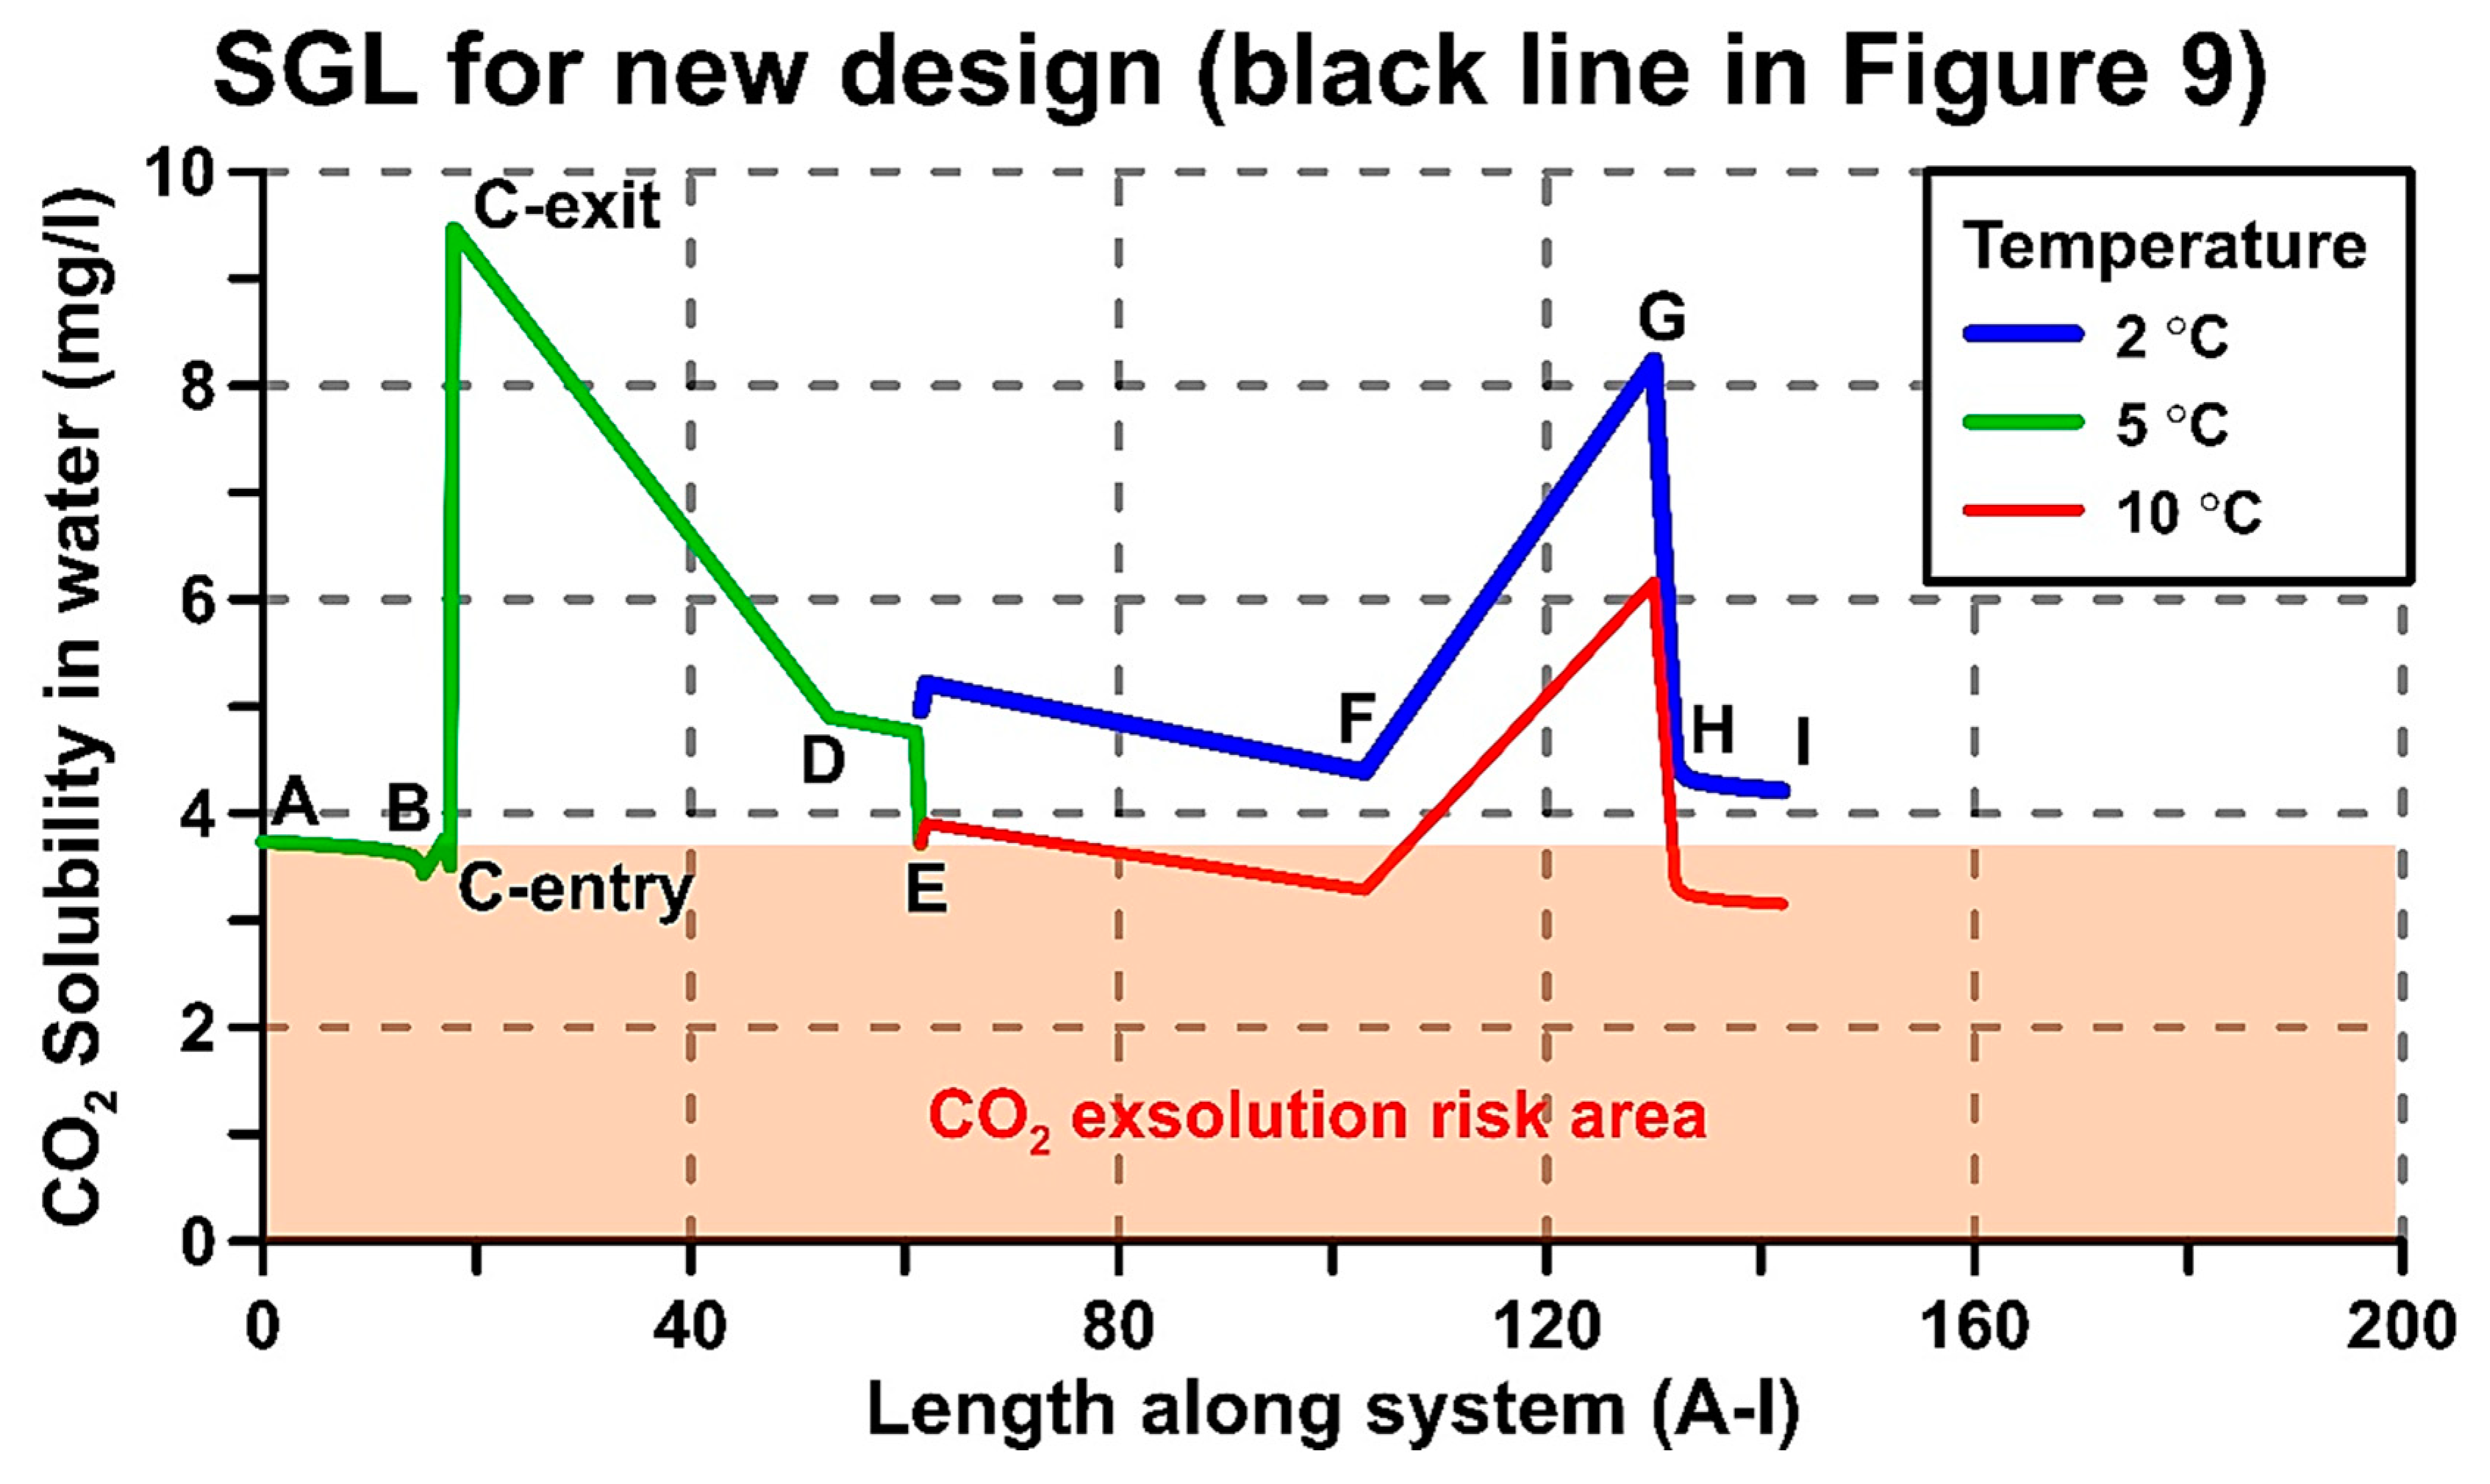
The precise location of the injection well screen and the magnitude of backpressure required is a function of the mode of system operation. The system is typically operated in heating mode or cooling mode, or a combination of these two modes, depending on the demand in the building. Since the solubility of the dissolved gases is affected by temperature, the risk of gas exsolution is affected by the mode of operation. The SGL of the black GPHGL (
Figure 9) is shown in
Figure 10. The SGL shows that the GWHP system in heating mode reduces the risks of gas exsolution after heat extraction. Operating the system in cooling mode forces the solubility line bellow the initial solubility limit and CO
2 exsolution occur (
Figure 10). The backpressure valve of 3.0 bar is not sufficient to prevent CO
2 exsolution during cooling mode. Furthermore, the installed injection screen depth needs to be deeper in cooling mode to avoid gas exsolution in the injection well and aquifer formation. This is not necessary in heating mode, where a shallower depth would suffice for the colder water.
The location of the heat exchanger in the new design is moved to separate housing close to the production well (
Figure 8). The distance D–F is reduced to 50 m in this case. This is done to exemplify the strategic benefit of controlling where in the system the temperature change should occur (
Figure 10). Early heat exchange provides additional gas solubility in heating mode, and vice versa in cooling mode. The optimum location of the heat exchanger is not necessarily at the same location for both modes and installing the heat exchanger close to the production well helps to avoid vacuum pressures in the heat exchanger.
4. Discussion and Comparison of Design and Design Tools
Two different GWHP system designs have been presented in an attempt to highlight the risks of gas exsolution in such systems. GPHGL analysis is a useful tool for system analysis because it can display the effect of each system component on the hydrostatic pressure. The analysis presented in this paper only shows a simplified representation of actual systems, but demonstrates how the GPHGL can be applied for dimensioning of GWHP systems. For dimensioning of actual systems, a detailed description that includes all relevant components should be analyzed. Alternatively, an existing GWHP system can be installed with pressure sensors and the values from these sensors can be plotted in a similar fashion. This would represent the actual GPHGL of the system. It is recommended to install pressure sensors in both well water tables (B and H), on both well housings (D and F), and on both sides of the groundwater heat exchanger (E) to ensure the proper visualization of the most basic GPHGL. Some systems might require more sensors depending on the complexity of the design.
The GPHGL analysis of the traditional Norwegian GWHP system configuration shows that the system configurations are predisposed to gas exsolution risks. To some degree, these risks are unavoidable, particularly in view of the production well and its influence on the aquifer. Extraction of groundwater from an aquifer always induces loss of pressure around the well, and these losses can presumably be enough to trigger exsolution of dissolved gases if the groundwater is saturated with gas. Pre-investigation of the aquifer formation with appropriate techniques is necessary for establishing the limits of the system. The current state-of-the-art techniques applied in Norway do not consider levels of dissolved gas in the pre-investigation phase of projects [
2], but this should be included in the portfolio of water quality sampling. These limits can function as the baseline for the dimensioning GPHGL analysis.
The only design parameters that can influence aquifer pressure loss are the rate of groundwater extraction or the size and length of the well screen. In this regard, it is recommended that due consideration is given to reducing the required flow rate, rather than increasing the well screen length. The length of the well screen essentially limits the range of pressures that can be extracted from the aquifer; longer screens enable groundwater with larger pressure variability and, thereby, gas solubility to enter the well bore. The screen length thus determines the risk of “groundwater quality mixing” and “pressure mixing” before groundwater extraction, as exemplified in
Figure 7. Reducing the extraction rate would limit the pressure loss, but also reduce the required screen length of the well, which seems doubly beneficial if chemical stability is a concern for the system.
The GPHGL analysis shows that the installation depth of the submersible pump is a key feature in the system design. The location of the pump high above the production well screen is a possible gas exsolution trigger. The current well design is not able to prevent gas bubbles from escaping the well bore [
4]. If these gases are pH-regulating, e.g., CO
2, the design might facilitate alterations of the groundwater chemistry and trigger precipitation reactions. Installing the pump below the screen bottom helps negate the risks of gas exsolution in the production well but triggers a range of other operational consequences that increase the investment cost of the production well. For instance, a flow sleeve that forces water past the motor is necessary to ensure appropriate cooling of the pump. The flow sleeve increases the width of pump and the size of the well must increase slightly to meet the space requirements. The well must also be slightly deeper to account for the installation space needed by the pump. Furthermore, a sensor that regulates the speed of the pump motor is necessary to ensure and control that excessive drawdown is prevented. The risk of sediments entering the pump is higher when the pump is installed below the screen, and appropriate screen design should be given high priority.
The highest risks are linked to the onset of the vacuum in the system, and the GPHGL analysis identifies the injection well configuration as a particularly high-risk vacuum area in the system. If the vacuum region in the system is left unchecked, it might extend backwards to the groundwater heat exchanger. Observed vacuum conditions in some of the injection wells and systems in Melhus confirm this effect. The vacuum poses a problem even if the groundwater is not fully saturated with gas, because the vacuum causes severe flashing conditions for dissolved gases and might cause the water to boil. Alternatively, if the groundwater piping system is insufficiently sealed, the vacuum can also cause invasion of air into the system through leaky components. These leakages would not be visible on the outside of, e.g., a pipe, which makes these types of faults particularly difficult to discover. This means that the traditional system design is also predisposed to air-mixing risks if components are not airtight. The onset of the vacuum can be prevented by installing a backpressure devise at the injection pipeline exit, but the magnitude of backpressure required is dependent on several factors. These factors will be highlighted in the subsequent discussion.
The GPHGL analysis shows similar results to that of the installation depth of the pump in the production well for the installation depth of the pipeline in the injection well. The location of the pipeline exit at a shallow depth, high above the injection well screen, is a possible gas exsolution trigger. A sudden drop in flow speed after the pipeline exit aids the escape of gas bubbles up the well bore, possibly triggering precipitation reactions. Installing the pipe exit below the injection well screen can negate the risks of gas exsolution in the injection well, but only if the injection well screen is installed at a depth that yields satisfactory solubility conditions. This depth is not directly revealed by the GPHGL analysis. As a general rule of thumb, this would be the same depth as the production well screen, but might be deeper or shallower depending on the mode of GSHP operation and the initial level of dissolved gas in the groundwater. There would be considerable risks associated with installing the injection pipeline below the screen if the screen is not installed sufficiently deep in the aquifer. Gas bubbles can then enter the well screen with ease and clog the well and aquifer formation.
The new design concept incorporates the solubility grade line (SGL) analysis as a tool for deciding on the specific location of the injection well screen depth. The added benefit of the SGL compared to the GPHGL is the possibility to analyze the system for groundwater qualities that are under-saturated with respect to gas. The actual gas solubility in an aquifer, discovered through pre-investigative measures, can function as a limit in the SGL (
Figure 10), and the injection depth and the operational temperatures must be selected according to the limit. In the presented case (
Figure 10), the groundwater is saturated with CO
2 and the injection depth should be deeper than the extraction depth if the water is used for the cooling of the building. If the water is utilized for heating purposes, the injection depth can be shallower than the extraction depth.
Operating the GSHP system in heating mode provides additional gas solubility in the groundwater and reduces the risk of gas exsolution. The strategic benefit of achieving heat exchange early in the system is apparent. This means that the groundwater heat exchanger should be installed as close as possible to the production well in systems with a predominant annual heating demand (
Figure 8), and not necessarily in the basement of the building (
Figure 5). The SGL also shows that the magnitude of temperature alteration in the heat exchanger can be used strategically, depending on the mode of operation. For instance, if the groundwater quality is sensitive to increased temperatures, the increase should be kept small, i.e., ΔT = 2–3 °C. Thus, most of the thermal energy could be supplied by circulating larger quantities of groundwater. Alternatively, the groundwater flow rate can be kept low and most of the thermal energy extracted by means of a larger temperature alteration, e.g., ΔT = 5–6 °C, increasing gas solubility before re-injection. Before determining the optimal mode of operation, these alternatives should be reviewed in light of their influence on the heat pump system’s seasonal coefficient of performance (SCOP). Increasing the ΔT means that a heat pump would receive lower suction pressures to the compressor, which reduces the SCOP and the heating capacity of the system [
33].
A major disadvantage of the alternative design strategy (
Figure 8) is the large increase of work required for the groundwater circulation. A backpressure devise (G) supplies additional losses. Assuming the efficiency of a submersible pump in
Figure 9 is 0.6, the added power consumption for a 3.0 bar backpressure valve is approximately 5.4 kW if the circulation rate is maintained at 11 l/s (Equation (4)). Assuming that reducing the flow rate by half would reduce the efficiency of the pump to 0.5 and the required backpressure would increase to 3.25 bar, the additional pumping power required would reduce to 3.2 kW. If this backpressure is supplied by a passive flow valve devise, e.g., a ball valve, spring valve, or a constriction at the pipe ending, this added loss leads to large amounts of “wasted” energy in the process of water circulation. These losses can presumably be too high in some cases, especially for small installations where even a slight alteration of system SCOP can disturb the financial benefit of the GWHP installation.
Passive backpressure devises also provide pressures that are flow rate-dependent, and the required backpressures could be difficult to achieve for a range of flow rates with a single devise. For instance, avoiding gas exsolution when the system is shut-off would be difficult if the backpressure is supplied by a constriction of the injection pipe. Minimizing the total amount of frictional losses, and thereby the required pumping power, is a possible solution to the problem. This could be done by increasing the pipe diameter and reducing the length of the pipeline and number of fittings, bends, valves, etc. (D–F), or by selecting a mode of operation that requires a low rate of flow, e.g., higher ΔT through the heat exchanger.
An alternative and favorable approach would be to supply the necessary backpressure by installing a turbine that can regenerate the losses into electrical energy. A turbine can essentially be a pump working in reverse and can be preprogrammed to follow a predefined algorithm that accounts for flow rate variations in the system and only provides the backpressure needed. The turbine would also be able to retain the backpressure when the system is shut-off. Installing a turbine in GWHP systems also provides a range of benefits in regard to simplifying certain maintenance routines of the system. For instance, it enables the operator to alter the flow direction through the loop, which is useful when cleaning the system. The turbine can also function as a backup solution if the production well pump suffers unforeseen problems and must be taken out of service. A turbine seems beneficial for ATES systems in particular. ATES systems have well doublets with submersible pumps in both the production well and the injection well, irrespective of the groundwater quality. Utilizing these pumps as turbines seems beneficial, regardless of gas-related groundwater quality issues.
Another problem with the alternative design can occur if groundwater is extracted from deep aquifers with high native pressure levels. A typical example can be the Challenge Stadium installation in Perth, Australia, where the production well is located at 750 m depth [
11]. Maintaining the same pressure level throughout the loop would result in more than 75.0 bar over-pressure at the surface. Some system components, the plate heat exchanger in particular, have problems with operating at such high-pressure loads. Piping materials also have pressure limitation and it is reasonable to assume that avoiding gas exsolution in deep aquifers can lead to increased investment costs if “high-grade” materials are needed in the design. On the other hand, deep aquifers have higher gas solubility and can dissolve more gas than shallow aquifers, and the alternative design might be the best solution nonetheless.
The alternative design solution offers a range of design and control strategies that arguably benefit GWHP and ATES systems in gas-saturated aquifer conditions. Some of the solutions have both benefits and drawbacks, which proposes that deriving a single optimal solution for all aquifer conditions is difficult. The added effort of avoiding gas-related issues should outweigh the downside of allowing gas exsolution to occur. The additional investment and operational costs should be lower than the clogging maintenance cost of a system built in the traditional manner. Alternatively, the additional costs must provide a more stable system with less unforeseen faults. GWHP systems that function relatively well, even though they allow vacuum conditions in the loop exist. Aquifers with low concentrations of dissolved iron and manganese ions presumably pose less risk than aquifers with high dissolved ion concentrations. In Norway, aquifers utilized for domestic water purposes have to satisfy certain national guidelines to qualify as a source of potable water. Similar guidelines should be developed for GWHP systems, where risks associated with different levels of ion concentrations and gas concentrations are explained. The guideline should preferably relate levels of ion concentrations and gas concentrations to the risks of clogging in a fashion that allows designers to select the best system configurations for particular conditions. Applying the SGL methodology to the gas solubility data allows such water quality data and guidelines to be integrated in the monitoring scheme of the plant. The data can be presented as a figure in the control unit display that is easily understood by the operator, e.g., similar to that of
Figure 10. The operator would then be able to see the situation live on a monitor and assess whether the current mode of operation is within the safety limits of the aquifer.
Often in groundwater quality studies, e.g., [
21,
22,
23], the effects of a GWHP system on the groundwater quality is simplified to models that investigate the production wells, injection wells, or the aquifer conditions alone. The influence of the whole system design on the pressure, temperature, and quality alterations are not necessarily accounted for. The presented examples demonstrate that, e.g., the pressure conditions within the system piping layout can provide worse gas solubility conditions in the groundwater than can be identified in the wells or aquifer itself, particularly in view of vacuum conditions. At any given GWHP aquifer, it is thus relevant to incorporate the influence of the actual system design on the development of the local groundwater quality. It is often the intension of the system designer to not alter the groundwater chemistry, but the presented results show that a given system must be customized to the particular water quality situation in question for this to be a genuine objective. Both Bakema [
7] and Banks [
10] emphasize the lack of input from a hydrogeologist as one of the major shortcomings in the design of groundwater GSHP systems. By simplifying the design of the piping system, it would be easier for the hydrogeologist to customize the heat source system in agreement with the challenges given by the aquifer. The application of the GPHGL and the SGL would then be easy to construct in the planning and dimensioning phase of new projects.
5. Conclusions
Problems caused by dissolved gases are closely linked to that of chemical precipitation in GWHP and ATES systems. Exsolution of dissolved gases from groundwater can be induced by alterations of in-situ pressure, concentration, and temperature conditions, and exsolution of some gases, e.g., CO2, can catalyze precipitation reactions of dissolved ions. The design and control strategy of GWHP systems must include considerations regarding pressure and temperature alterations to mediate these risks. The gauge pressure head grade line (GPHGL) is an adequate design tool for evaluating pressure-related risks, while the solubility grade line (SGL) is a new design tool that directly evaluates and identifies gas exsolution risk zones in the entire system configuration with respect to specific gases. For this reason, the SGL should be included in the design strategy of GWHP and ATES systems.
Avoiding gas exsolution is possible through correct system design. The conditions at the production well screen depth function as the baseline of the design, and the other components must be selected based on the in-situ gas solubility in the aquifer at this location. The findings from the SGL analysis presented in this paper can be summarized as follows:
The traditional Norwegian GWHP design is predisposed to clogging risks in gas-saturated groundwater conditions. Installing the injection well at a shallow depth compared to the production well is unfavorable. The traditional injection well configuration is a particularly high-risk component in the design because it can trigger vacuum pressures in the piping system. The injection well must utilize a backpressure devise to avoid vacuum conditions if the elevation lift from the water table is too high.
The new design methodology can prevent gas exsolution. The new design utilizes the depth of the production well as a baseline for the design of all other components. The analysis shows that installing the pump and injection pipe below the well screens and utilizing a turbine to supply parts of the necessary backpressure in the system are necessary to avoid gas exsolution.
The new system design configuration requires higher investment costs than the traditional solution. Optimizing the design through strategic heat exchange, reducing the groundwater pipeline length, and reducing the groundwater flow rate can help decrease the cost of the new system design. However, if viewed in a broader picture, the new design might allow utilization of challenging aquifers as heat sources that would otherwise be too risky for the traditional design configuration.
Further work is being conducted that investigates the correlation of vacuum, gas exsolution, and precipitation in the affected GWHP systems in Melhus. The solubility grade line method and the alternative design methodology can then be tested and verified when designing new systems and configurations. Similar investigations in a variety of groundwater conditions should be conducted to help develop and verify the methods.

 ,
, 


