1. Introduction
Numerous innovations have significantly expanded the possibilities for designing energy-efficient buildings: compact combined heat and power plants, thermally activated building systems and geothermal systems have been part of construction practice for several years. In this context, near-surface geothermal energy, as a regenerative energy source, plays an important role in the environmentally friendly heating and cooling of modern buildings. This can be very efficiently combined with heating and cooling systems that operate close to the temperature level of the ground. As the same technology (ground coupled heat pumps) can be used for both heating and cooling, it is particularly suitable for the temperature control of office and administration buildings. However, in order to guarantee the energy efficiency of the systems and the thermal comfort in the building, as well as the long-term functionality, there are a number of things that have to be taken into account, especially with complex systems and their combined use for heating and cooling. This is because the systems for using geothermal energy differ from conventional heating and cooling technology both in terms of planning and operation. Many planners, contractors and operators, however, still lack experience in dealing with this technology. This can lead to problems during planning and implementation and, as a result, to inefficient modes of operation.
Due to the small temperature differences between the ground and the heating or cooling system in the building, the systems react very sensitively to faults and malfunctions. In addition, design and operating faults due to the inertia of the systems and redundancy with other heating and cooling systems are usually only detected at a late stage. Incorrect operation therefore not only reduces the current efficiency of the system but can also impair its performance for subsequent years.
In addition to appropriate planning and faulty-free execution, building and plant operation determine the efficiency and cost-effectiveness of the systems. In order to guarantee a permanent and energy-efficient function, an optimal adjustment of the building energy requirement to the thermal supply in the ground decides which level of thermal performance can be achieved. In contrast to conventional heating and cooling systems, building and system operation must be continuously adapted to fluctuating boundary conditions such as weather and building use. An essential instrument for this is the metrological monitoring of the plants, especially in the first operating phase.
In practice, heat pumps still often function unsatisfactorily or at least sub-optimally. Often, the reasons for this are either an improper connection to the low-temperature heat source and/or an incorrect dimensioning of the corresponding heat exchanger. In some cases, heat pumps are not operated in accordance with the design conditions, which is often due to overoptimistic assumptions during planning, but also partly to user-dependent operating errors. In many cases, the primary energy savings and the ecological and economic potential of a heat pump system is greater than achieved in practice [
1,
2,
3,
4,
5,
6,
7,
8,
9,
10].
In Germany, geothermal systems for the heating and cooling of office and non-residential buildings have been implemented since 1990 [
11,
12]. While the first buildings were still pilot projects, most of the systems used currently are state-of-the-art. In spite of the large number of projects already carried out, there are still often mistakes in the implementation which lead to problems in operation. The redundancy of the load coverage via ground-coupled and conventional systems often means that a malfunction is not detected or is detected very late without accompanying investigations. When the monitoring of the six ground source heat pump systems (described in this paper) started in 2004 [
1,
3], there were fewer examinations or comparative studies from real operation dealing with the functionality and efficiency of the installed heat pumps and their system components. The reporting and documentation on innovative buildings usually ends with the completion of the buildings and facilities, so that there is little reliable knowledge regarding the actual performance of the buildings in full operation and thus during most of their life cycle. The advantages of monitoring during operation have been recognized over time in practice, meaning that a pronounced increase in knowledge can be observed today.
Since 2005, a large-scale study on heat pumps in residential buildings (single-family houses) has been carried out in Germany by Fraunhofer ISE in Freiburg [
4,
5]. The study shows that ground-coupled heat pumps reach Seasonal Performance Factors (SPF) between 2.6 and 4.9. With regard to non-residential buildings, only a few studies and comparisons can be found. Not many buildings have been examined and monitored over a longer period (>5 years), which is due to the duration of the research projects. In the studies that can be found on this topic, SPFs of 3.3 to 6.5 for ground-coupled systems are listed [
6,
7,
8,
13,
14,
15]. In 2019, Spitler and Gehlin [
9] presented an overview of the performance of around 55 ground-coupled heat pump systems—from multi-family buildings to office buildings—with a heating capacity of 21 to 17,500 kW. The listed buildings all have a heterogeneous implementation with regard to their distribution systems in the building. Within the framework of the SPF evaluations (the SPFs are formed according to SEPEMO (SEasonal PErformance factor and MOnitoring for heat pump systems in the building sector (IEE Project)) [
16]), values of 2.2 to 5.9 for heating and 4 to 26.1 for cooling are obtained for SPF H2 and SPF C2, respectively.
Within the framework of the IEA HPT Annex 52, the Steinbeis-Innovationszentrum (SIZ) energie+ is investigating the interaction between heat pumps and geothermal borehole heat exchangers as well as energy piles using six different buildings (commercial, institutional and multi-family buildings) in a long-term monitoring period between 2 and 13 years. The aim is to obtain and document reliable knowledge about the actual performance of the buildings with regard to energy consumption, user comfort and operation. Such measurements can also be used to gain insight into how the various system components and control strategies affect overall performance, to identify best practices, design and installation issues that lead to poor performance and to give guidance on how unanticipated consequences of the design can be partially or totally avoided.
For the majority of the examined systems, errors have been analyzed and rectified so that operation-as-planned could be implemented. Subsequently, optimization measures were carried out with regard to the more efficient operation of the geothermal heat storage system in heating and cooling mode, where these were feasible.
2. Monitoring Concepts and Implementation
The essential requirement for the long-term functioning of a geothermal heating system is fault-free operation adapted to the climatic conditions and the use of the building. This applies in particular to geothermal energy storage systems, where due to the thermal inertia of the system, faulty operating modes or those not adapted to the actual boundary conditions are often detected at a late stage. A long-term malfunction can cause serious and durable restrictions for further operation, depending on the type and extent of the malfunction [
2,
6,
7,
8,
13,
14].
The control technology available in modern buildings, especially in complex integral heating and cooling systems, does not yet guarantee immediate operation in the planned state. Only coordinated energy and operation monitoring enables early fault detection and elimination as well as continuous operation monitoring, adjustment and optimization.
While energy monitoring concentrates primarily on the analysis of energy and resource consumption, subdivided into individual energy types and consumption, operational monitoring serves to record and monitor the operating states of the plant’s components. By recording malfunctions, operation can be optimized with regard to fault-free operation and energy efficiency. It is usually the sum of many small errors in operation and inaccuracies in planning and execution that has a negative impact. The aim of operation and energy monitoring is to transfer the plants to regular operation and to optimize their energy efficiency. It therefore makes sense to start an appropriate monitoring system as soon as the system is put into operation.
In addition to the energy quantities, plant, switching and control states must be continuously recorded for operational monitoring and optimization. The measurement data must be recorded in a suitable temporal resolution. The smaller the measurement interval, the more detailed the analysis and optimization can be. Current values with a measuring interval of 15 minutes have proven to be a good compromise between informative values and the manageability and processing of the data for the analysis of heating and cooling systems. In order to save costs and limit effort, measurement technology and data acquisition from building automation should be used as far as possible to analyze and check plant operation. Since operational monitoring does not require laboratory conditions and operational disturbances and measurement data failures cannot be ruled out, the accuracy of the building automation sensors is generally sufficient. In addition, this allows the checking of the setpoints used for the facility control while monitoring the plant. To avoid a huge number of different data acquisition systems and to keep monitoring as simple as possible, the energy meters required for energy balancing and the evaluation of the systems should also be connected to the building control system.
For the extensive energy and operation monitoring of a geothermal system, in addition to the energy quantities, volume flows and valve positions, switching and operating states of energy generators and circulating pumps as well as temperatures at characteristic points (flow and return temperature) must also be recorded. When determining the energy yields and energy efficiency of a geothermal system, the energy flow of the geothermal system from the ground to the consumer should be reproducible. Required measurement variables are the heat injection and extraction on the ground side and the heating and cooling energy provided to the building, as well as the electrical energy required for circulation pumps, heat pump and, if necessary, cooling machines. In general, the measurement concept should be structured in such a way that a distinction can be made between thermal energy and electrical energy according to heat pump, free cooling and cooling machine operation. Thus, in addition to the overall system, the individual operating modes can also be balanced and their efficiency evaluated. If additional heat sources are integrated into the geothermal heating system, further energy measurements may be necessary for a complete balancing and a distinct efficiency evaluation. An example of a measurement concept is shown in
Figure 1.
3. Monitoring Buildings and Systems
Within the framework of monitoring, four office buildings, a school and a multi-family building are measured and analyzed (
Table 1). The six buildings are newly constructed buildings in different locations in Germany. Three buildings are equipped with a borehole heat exchanger, and the other three with energy piles, which serve as heat sources for the heat pump systems.
The year of construction and commissioning of the buildings took place in the years between 2002 and 2016. However, most of the measurement data are not available from the beginning of the building’s use. The buildings were evaluated in the period from 2006 to 2018. For some buildings, however, the data are only available since 2011 or 2017 (commissioning of the building or data transmission). The geothermal systems are integrated in the buildings for heating via a heat pump and for cooling in free cooling mode and via a reversible heat pump [
1,
3].
The energy concepts for all buildings contain the combination of floor heating or another low-temperature system to heat the building with a heat pump. In the building, heat and cold are distributed or transferred via concrete core activation and ventilation systems. In the buildings AOV, EFB and VGH, high-temperature distribution systems with convectors or radiators are implemented to cover the peak loads of the heating. These buildings are either connected to the district heating network or use a gas condensing boiler [
1,
3].
Concerning the monitored school, it is necessary to add that, in addition to the energy piles, a so-called “Agrothermiefield” was installed beneath the sports field next to the school and gym. The Agrothermiefield (Agrothermie) is basically a horizontal collector. The pipes are laid in parallel at a distance of 0.5 to 1 m at a depth of about two meters in the ground with a special plough (see
Figure 2). This method preserves the soil stratification, and the pipes are located far below the root horizon of the plants [
17,
18]. A larger excavation for laying the pipes is avoided. The installation of a 4400 m
2 collector was done in one day.
As part of the monitoring of the six buildings, all relevant data are collected in order to be able to describe the buildings and their plant technology with sufficient accuracy. The measurement concept provides the recording of all essential heat flows and electricity consumption, so that a balanced assessment including the individual producers and consumers is possible.
For older or already commissioned buildings, additional measuring equipment had to be installed. For the other buildings, the monitoring and measuring concept was already defined during the construction phase so the data could be obtained directly from the system control. For reasons of cost and time, the additional equipment was installed on top of the existing system technology in such a way that data access was given without interrupting the building services or structural changes. Depending on the requirements, this could be achieved through the use of mobile digital measurement technology (additional heat meters with temperature and volume flow sensors at relevant points). The measured datasets were mainly recorded on-site either by a computer or by the building management system. The recorded data could be retrieved with remote access.
The measured values are recorded every 15 min so that parameters of the system components can also be mapped. The measurements and analysis include, among other things, operating modes, control strategies, the ground source heat extraction and injection, fluid temperatures as well as seasonal performance factors.
Depending on the building, the monitoring extends over two to more than 10 years, so that at least two heating and/or cooling periods are available for evaluating the performance of individual system components and for determining characteristic values.
4. Monitoring Results
In addition to technical practicability, energy as well as ecological and economic aspects (not shown in this paper) play a central role in the general decision for or against a particular heating or cooling system. When comparing geothermal systems with conventional systems, the question arises as to whether they can guarantee a similarly high level of thermal comfort in buildings and what usable advantages they offer with regard to the above-mentioned aspects.
In the following sections, the monitoring results of the six buildings and systems are used to discuss energy yields and system efficiency as well as system performance.
The systems GEW and VGH had already been in operation for several years before they were analyzed in more detail as part of this project. Therefore, in these buildings and plants, faults went undiscovered for a long time and were only discovered during monitoring and corrected as far as possible. The measurement results reflect the fault detection and correction as well as the subsequent operational optimization and therefore vary considerably from year to year in some cases.
The results documented in the following are not target or guideline values for other projects, but are intended to show optimization successes and potentials as well as the possibilities and limits of these GSHP.
The measured heating and cooling supply for the buildings, the electricity consumption and the SPFs for the different monitoring periods are shown in
Table 2.
4.1. Heat Extraction and Injection
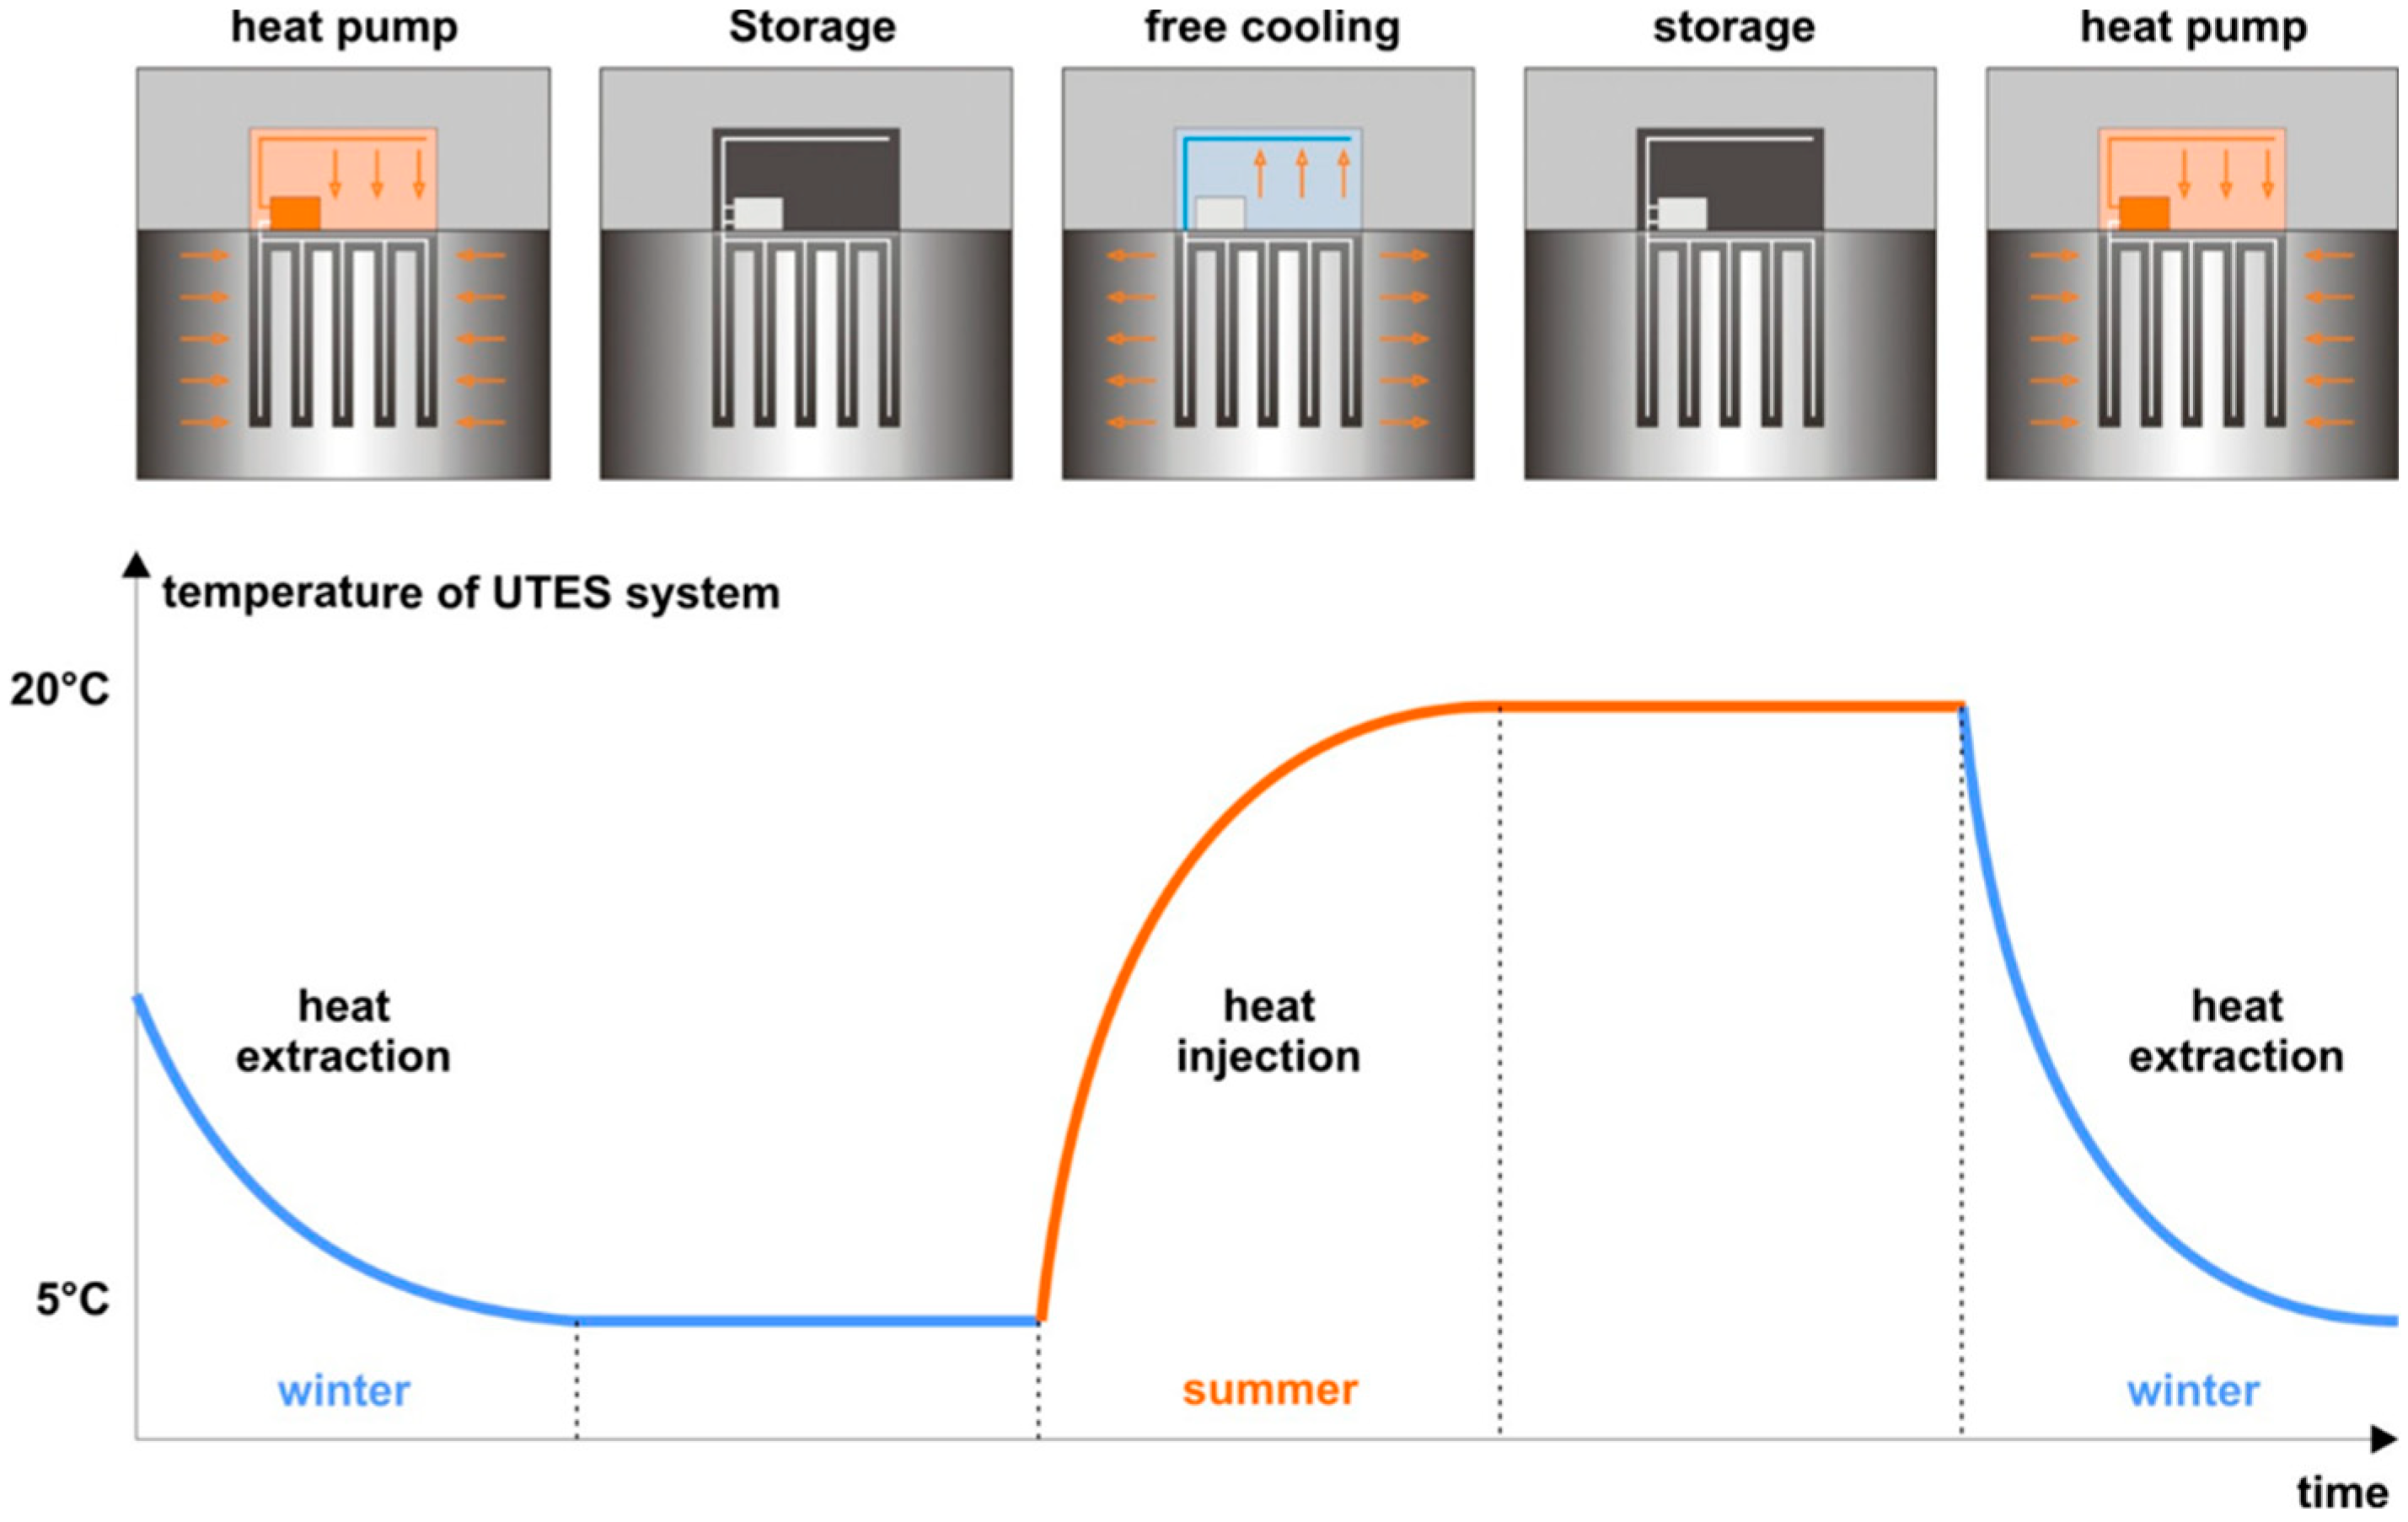
The soil can be used all year round as a heat source or sink. When using the soil thermally, a distinction must be made between two types of application. On the one hand, there is the pure cooling or heating case, in which either only heat is supplied to the soil or extracted; on the other hand, there is the seasonal use of the soil, in which heat is extracted and injected into the soil during the course of the year (see
Figure 3).
In the first case—heat extraction or injection only—the ground should be able to be regenerated in the summer or winter phase by natural heat fluxes. On the one hand, this takes place through seasonal influences such as solar radiation, surface water infiltration and groundwater, and on the other hand through the thermal heat flow from the Earth’s interior. In addition, regeneration takes place via the natural heat transport capacity of the soil. In any case, care must be taken to ensure that the extraction or injection of heat does not exceed the amount of possible natural regeneration. When using the soil for heating and cooling buildings, the relatively constant temperature level of the source throughout the year is an advantage. For example, the soil can still be used efficiently in free cooling mode without the use of cooling machines even at high outside temperatures in summer. A requirement for the long-term functionality of the system, however, is that the soil heated up in summer as a result of the heat input is actively cooled down again in winter and vice versa. This takes place via the thermal loads arising from the building and transferred to the ground. In this way, the heat transfer fluid heated in the building is cooled down again in the ground, and the waste heat is stored in the ground. The relative proximity of the source temperatures in the ground to the required system temperature for heating and cooling in the building guarantees the simplicity of the system of seasonal heat and cold storage via the ground. Geothermal heat storage systems are planned with the aim of maintaining a constant temperature level in the ground over time and a permanently stable operation for approximately equal yields from heat extraction and injection.
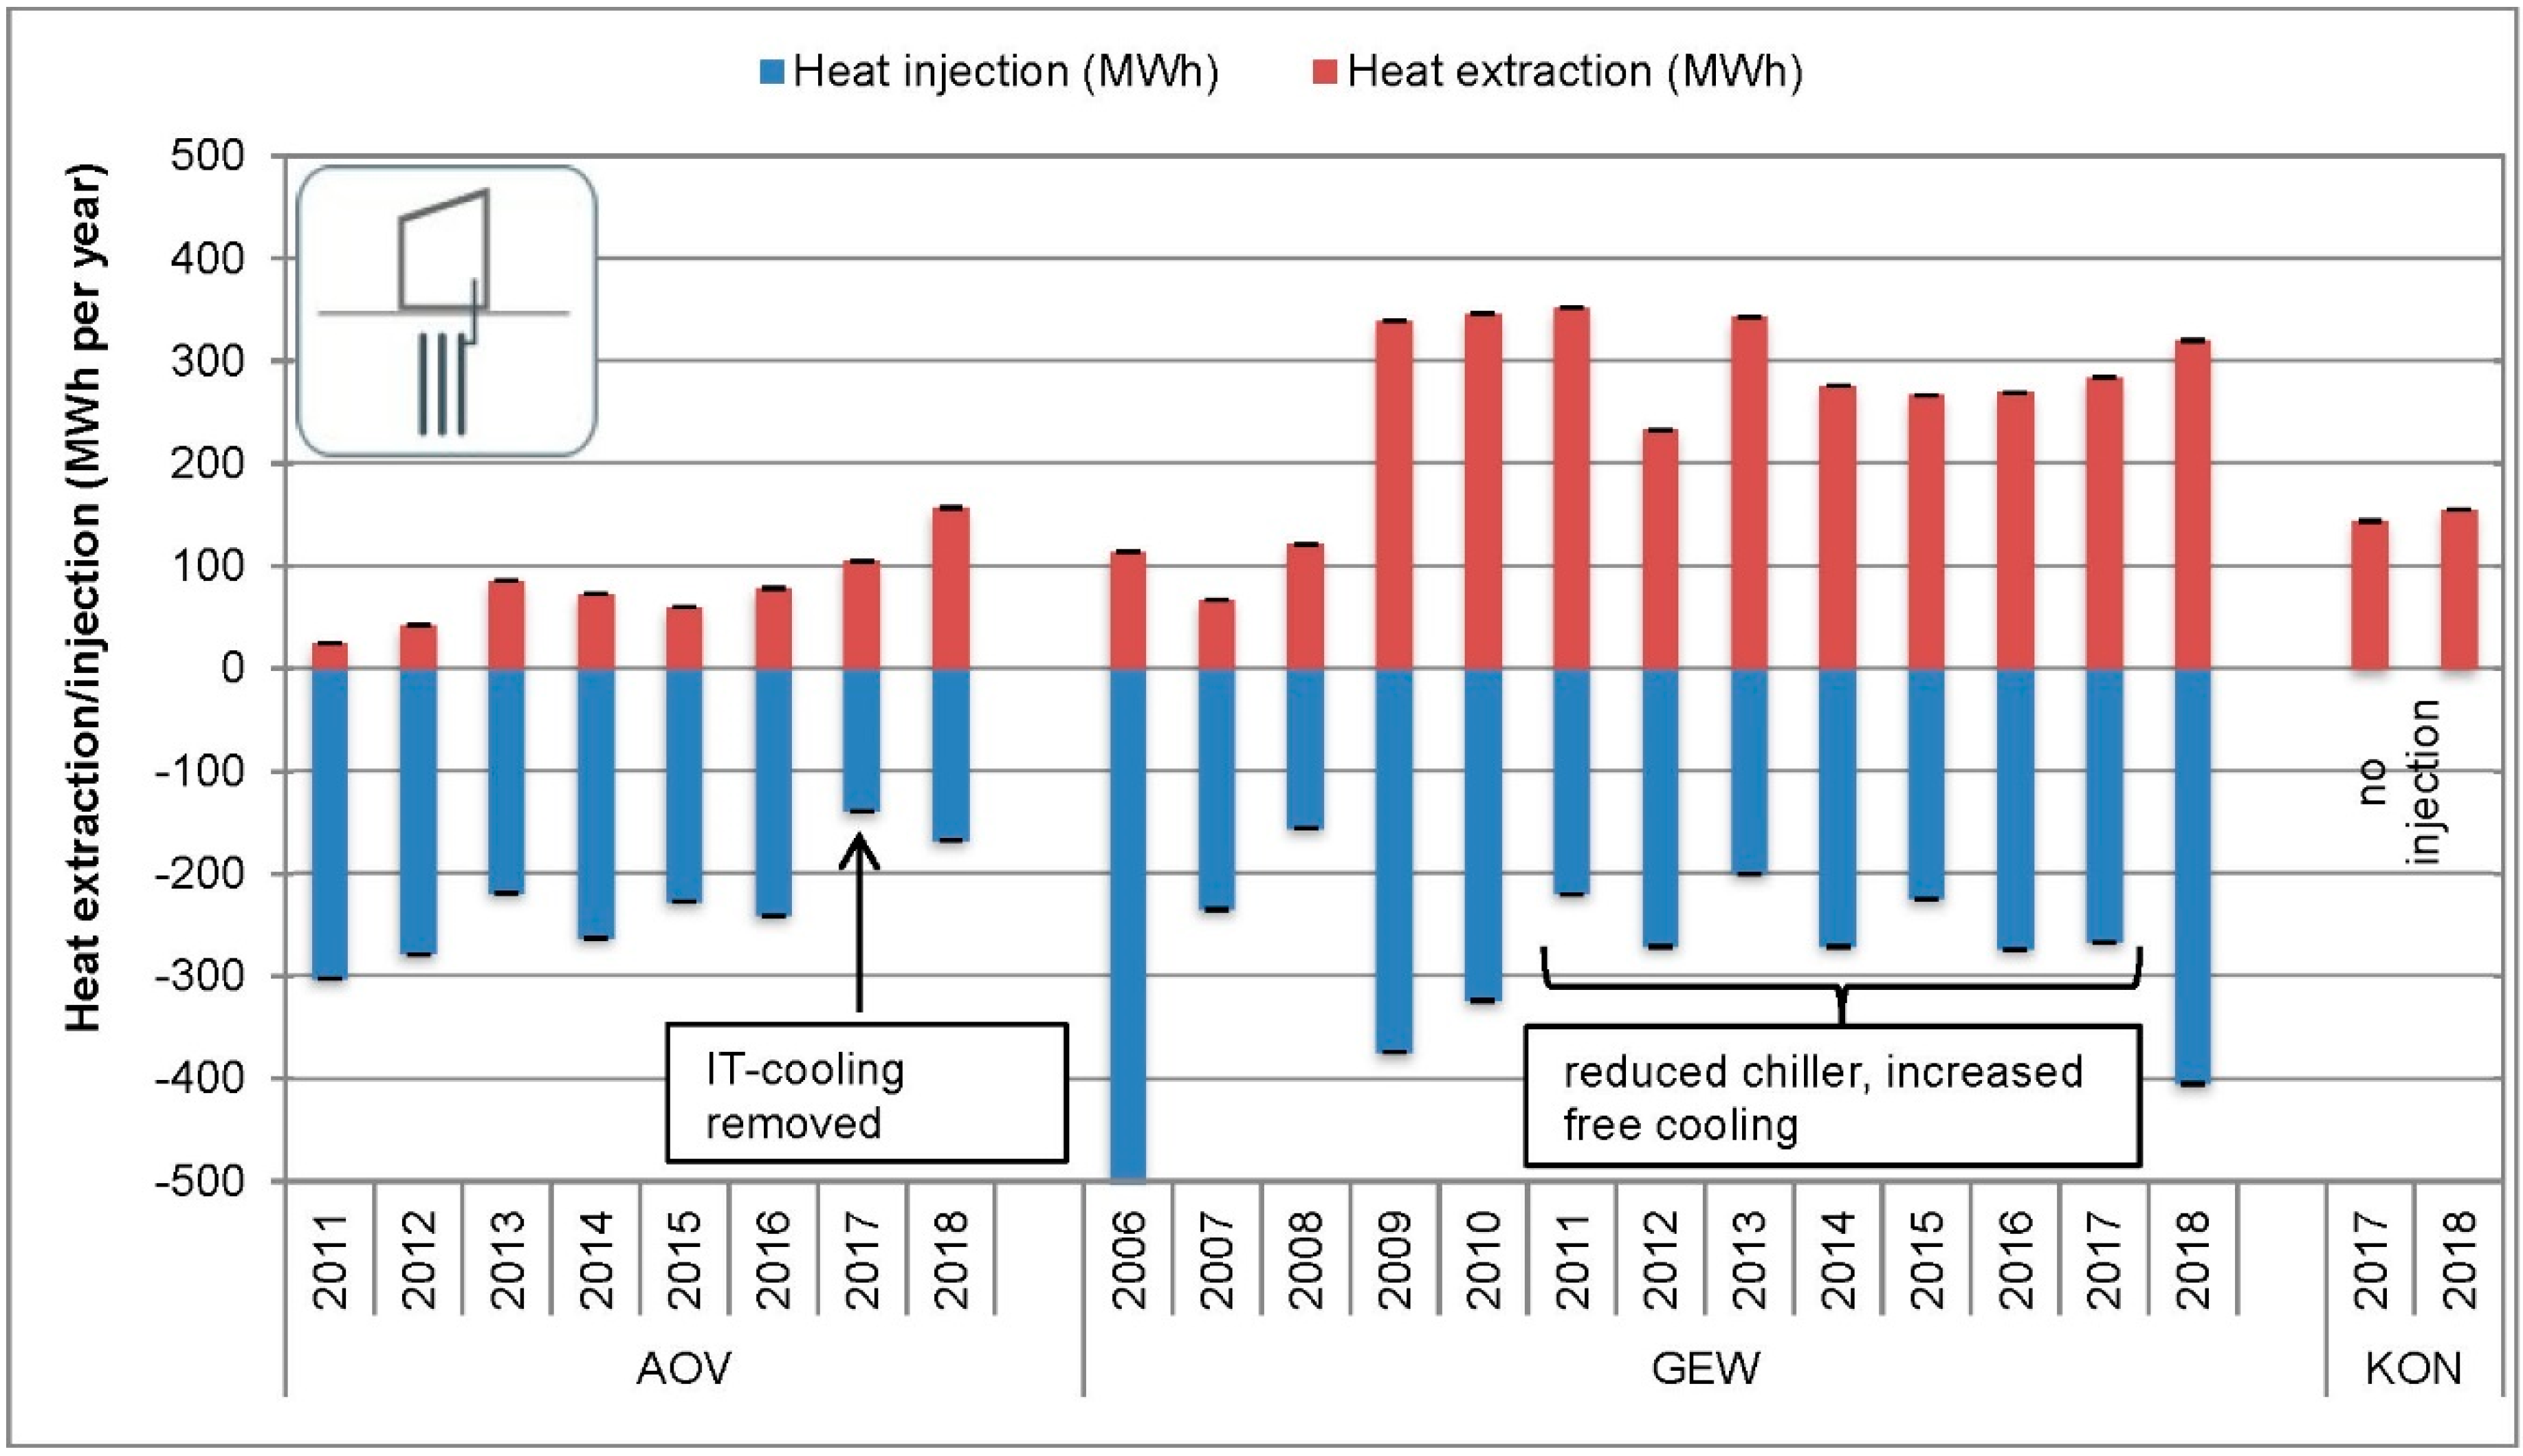
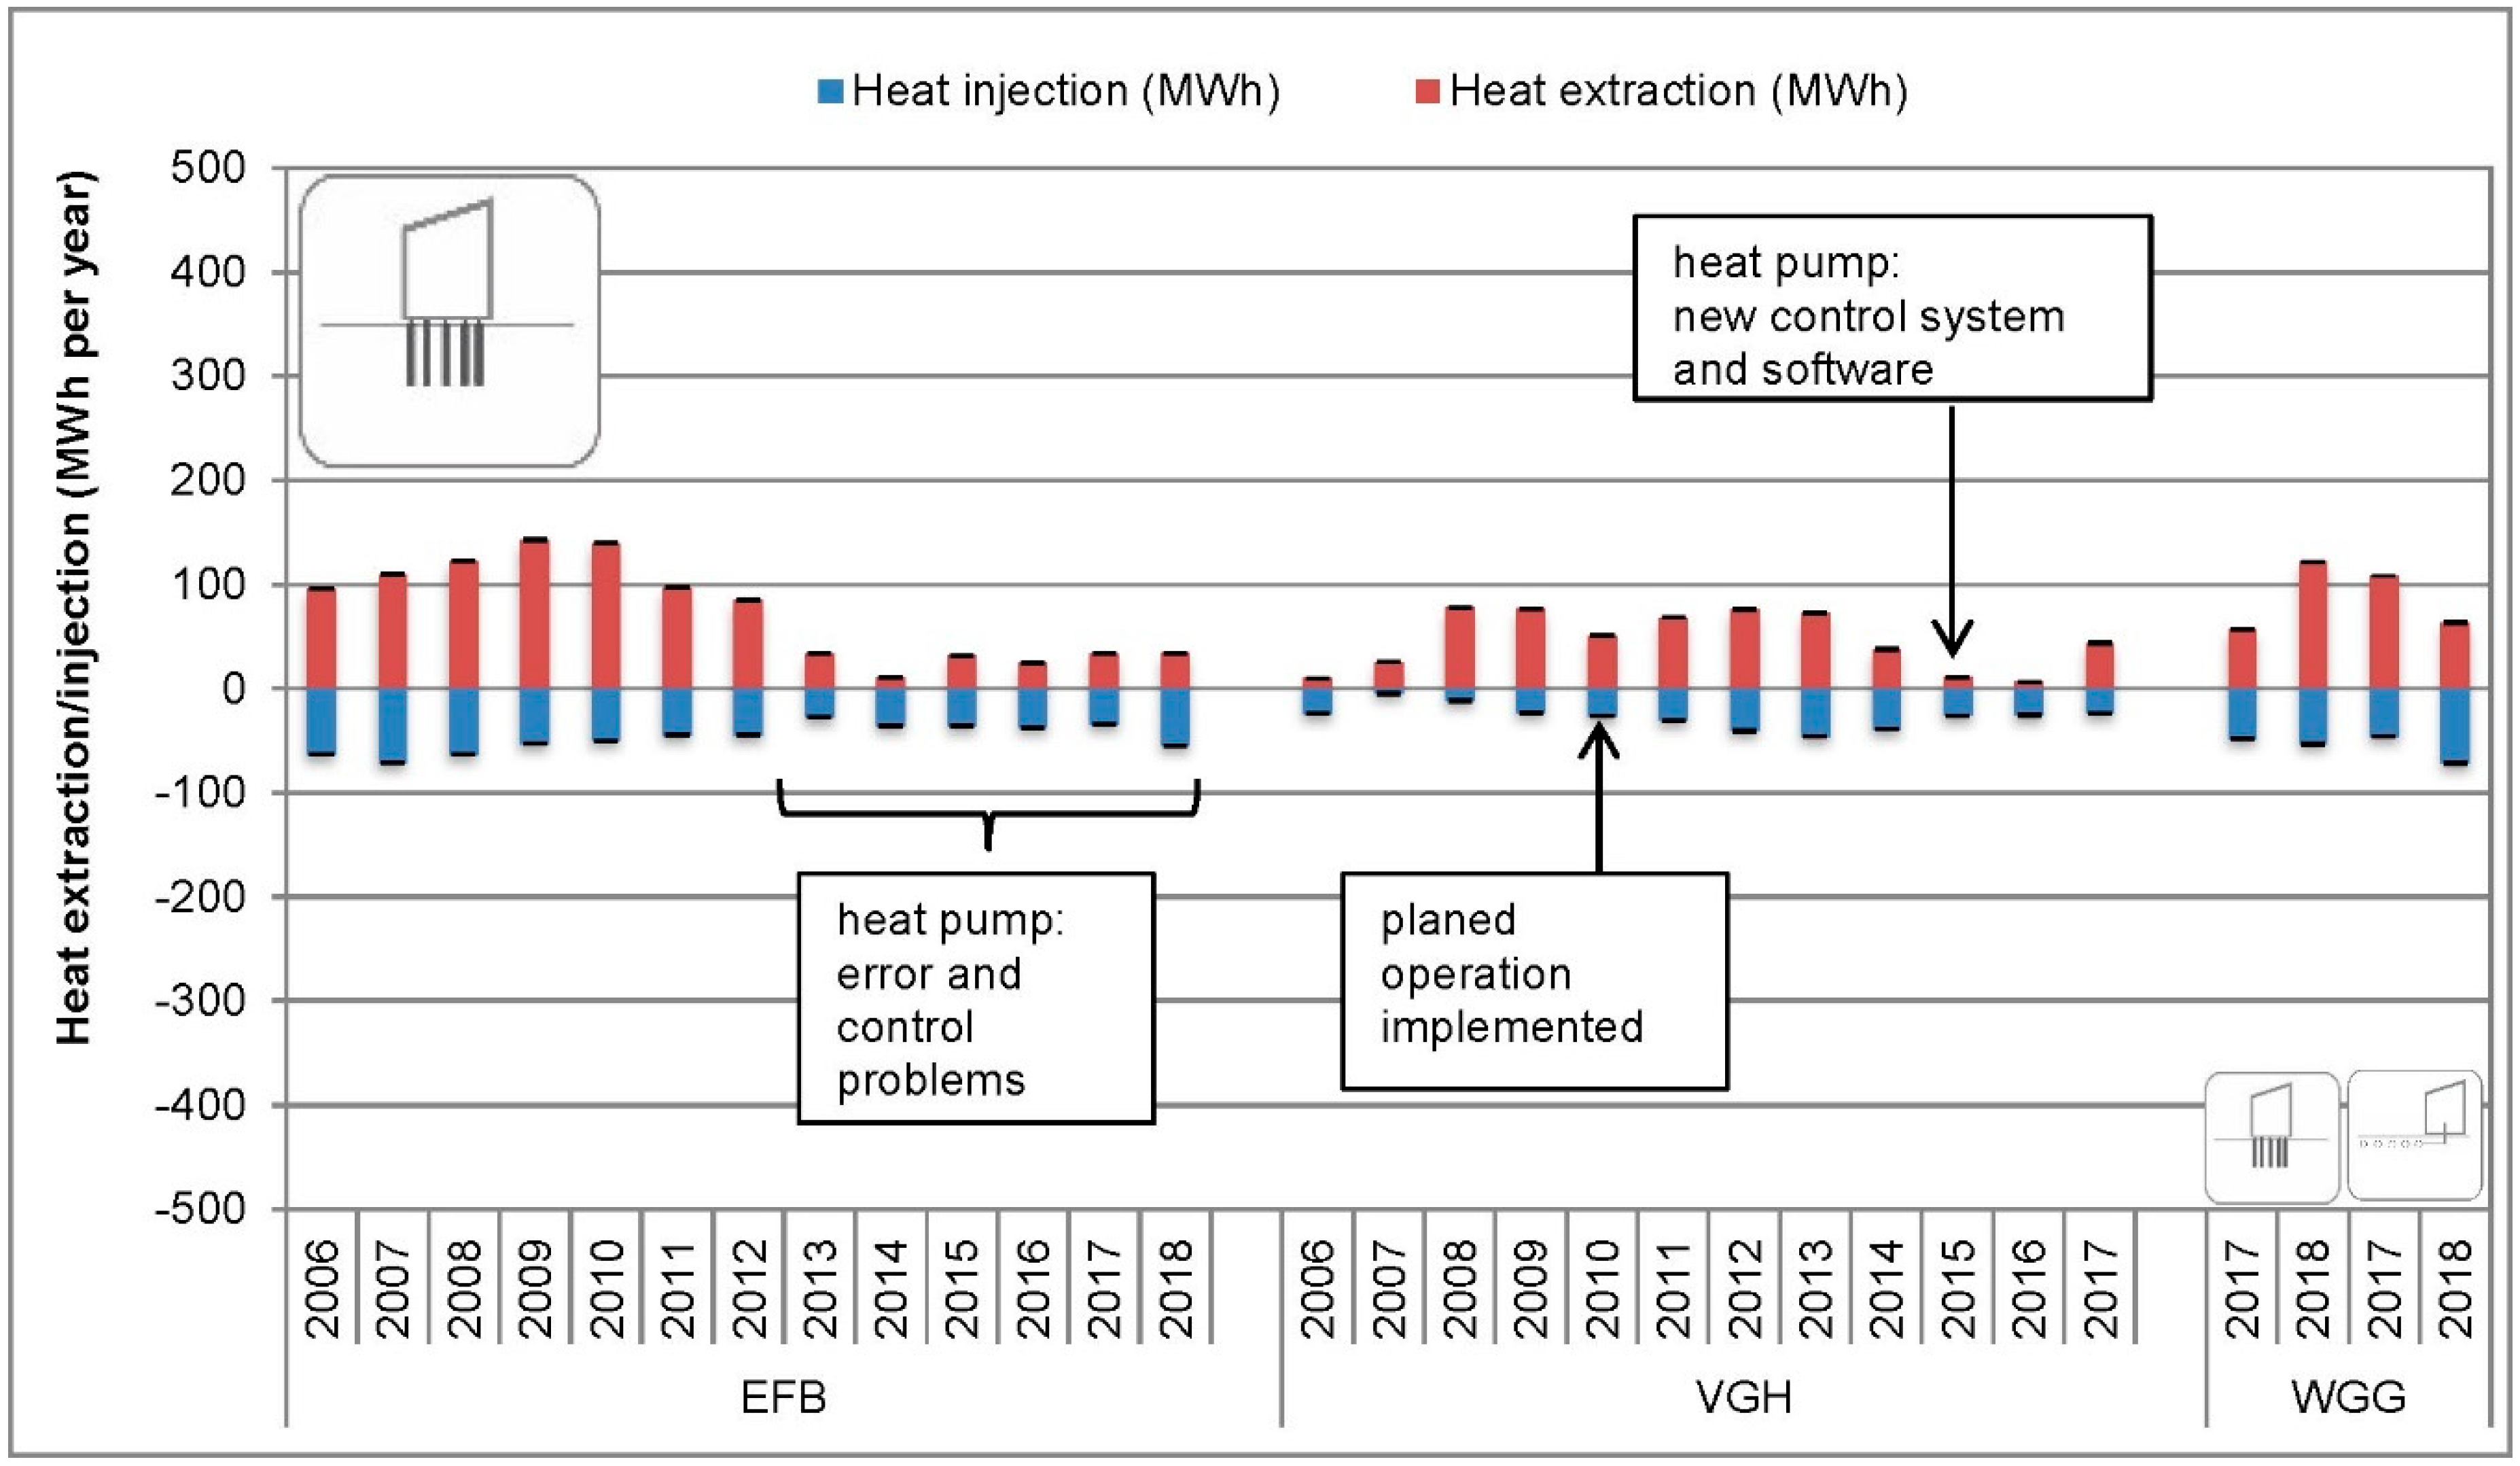
The energy yields recorded as part of the monitoring vary from year to year—mainly because of the system optimizations, but also as a result of the influence of the weather and the resulting varying consumption. Overall, the extracted heat corresponds more or less to the planned values. The heat injection, on the other hand, deviates considerably from the planned values for the buildings AOV and GEW (see
Table 1 and
Figure 4 and
Figure 5). The reasons for this are faults in current operation or an excessively high temperature level in the ground for free cooling operation as a result of operating faults immediately after start-up. In order to achieve a constant temperature level over the years, some systems require a higher heat extraction than heat injection due to higher than expected temperatures of the underground.
For inner-city areas, monitoring has shown that less deep systems, such as energy piles, which are used as seasonal storage systems, usually require a higher heat extraction rate than the heat injection. Due to the high density of buildings and the high degree of surface sealing, the near-surface layers in inner-city areas are relatively warm [
19,
20,
21]. With a well-adjusted balance between heat extraction and heat injection, the temperature level of the heat sink is usually too high for free cooling operation in summer.
4.1.1. Borehole Heat Exchanger
For the AOV, it can be noted that the heat injection is noticeably higher than the heat extraction (in 2015: 3.5 times). A well-adjusted heat balance is therefore not obtained, despite an almost 100% heat supply via the heat pumps. It is therefore essential to ensure that more heat is extracted from the ground or that significantly less heat is injected into the ground due to server cooling. On the basis of the total energy quantities, it can be seen from the annual balance sheets that, since 2011, significantly less heat has been extracted than assumed in the planning/design. It can also be seen, however, that the optimizations and modifications to the heat pump have increased heat pump operation and have thus also enabled significantly more heat to be extracted from the ground since 2013. The heat injection could be significantly reduced by outsourcing the servers and the associated server cooling (2017). In 2018, a good balance between heat injection and heat extraction was established (
Figure 4).
In the case of the GEW building, heat extraction significantly increased from 2009 onwards. For the years 2009 to 2018, the heat extraction was between 230 and 330 MWh per year. During the years 2011 to 2017, the reduced active cooling mode and an increased proportion of free cooling led to a reduction in heat injection into the ground. During this period, the heat injections were between 220 and 270 MWh per year. In 2018, 405 MWh per year were injected into the ground as a result of the further increase in cooling machine operation (
Figure 4).
The KON system has been running according to plan and without any incidents. The heat extraction amounted to about 150 MWh per year in the years 2017 and 2018 (
Figure 4).
The success of the optimization measures and error corrections carried out can be clearly seen in the buildings. Nevertheless, a well-adjusted balance was not fully achieved.
4.1.2. Energy Piles
For the EFB, it can be noted that around two times more heat is extracted from the ground than injected during the summer. The aim is to cool down the underground and enable a higher proportion of free cooling in summer. In 2009, the heat extraction, at 142 MWh per year, was almost three times higher than the heat injection, which was 53 MWh per year. Both heat extraction and heat injection were significantly reduced in the years 2013 to 2018 due to errors in the heat pump (among others, the thermostat relay of the compressor, no change into winter mode, etc.) and control problems and amounted to 10 MWh per year to 33 MWh per year for extraction and 28 MWh per year to 55 MWh per year for injection (
Figure 5).
At VGH, the planned heating and cooling operation was implemented during the monitoring process until 2009. From 2014, heat extraction from the ground was reduced to between 5 MWh per year and 43 MWh per year (
Figure 5). In mid-October 2014, the heat pump manufacturer installed a software update (system change of the operating system) so that the system was up to date and fundamental optimization and new control strategies could be implemented. During the evaluation of the measured data, it was established that the basic setting values in the heat pump must have been changed or not set to the set values, such as volume flow rates, supply temperature, etc. The measurement data are no longer conclusive and plausible in many areas. However, changes to the system or the settings have not been communicated and have not been changed, even after repeated references.
The alternating heating and cooling operation of the WGG requires a coordination between the Agrothermie and energy piles. For the years 2017 and 2018, the energy piles had a heat extraction of 63 MWh per year and 107 MWh per year as well as a heat injection of 46 MWh per year and 72 MWh per year. The extraction and injection values of the Agrothermie in the same period were 56 MWh per year and 121 MWh per year for the extraction and 48 MWh per year and 53 MWh per year for the injection. Since the beginning of the building’s use, adjustments have been made to the control strategies of the two sources on the basis of the brine entry and exit temperatures of the geothermal low-temperature heat sources and their heat exchangers. The inefficient year-round continuous operation of both sources (parallel operation), which was implemented at the beginning, was replaced by a prioritization (addition/removal of one source). To increase the efficiency, the two sources have been controlled separately in the winter months since the changeover. The changeover is based on the higher brine outlet temperatures per source system. During the heating period, the heat pumps primarily use the energy piles (higher brine temperature level). To ensure that the piles are kept frost-free, they are only operated up to a brine entry temperature of >3 °C. Afterwards, the heat is removed from the Agrothermie. A reverse priority is planned for the cooling period. The Agrothermie will act as a priority, and then the bored piles will be controlled to ensure, among other things, the regeneration of the energy piles.
For an assessment of the efficiency of the Agrothermie, the energy piles were deactivated during the heating period 2018/2019. The control adaptation serves to determine the heat injection and extraction in a heat pump system with the sole heat source of an Agrothermie. It has been shown that the field can serve as the sole source for the heat pumps up to and including December (and beyond). For the future operation of both heat sources, however, it must be ensured that there is a balance in both sources and that the soil is overcooled neither in the Agrothermie nor in the energy piles. Regeneration is necessary in both cases (
Figure 5).
The success of the optimization measures and error corrections carried out can be clearly seen in the buildings. Nevertheless, a well-adjusted balance was not fully achieved.
4.1.3. Specific Annual Energy Yields
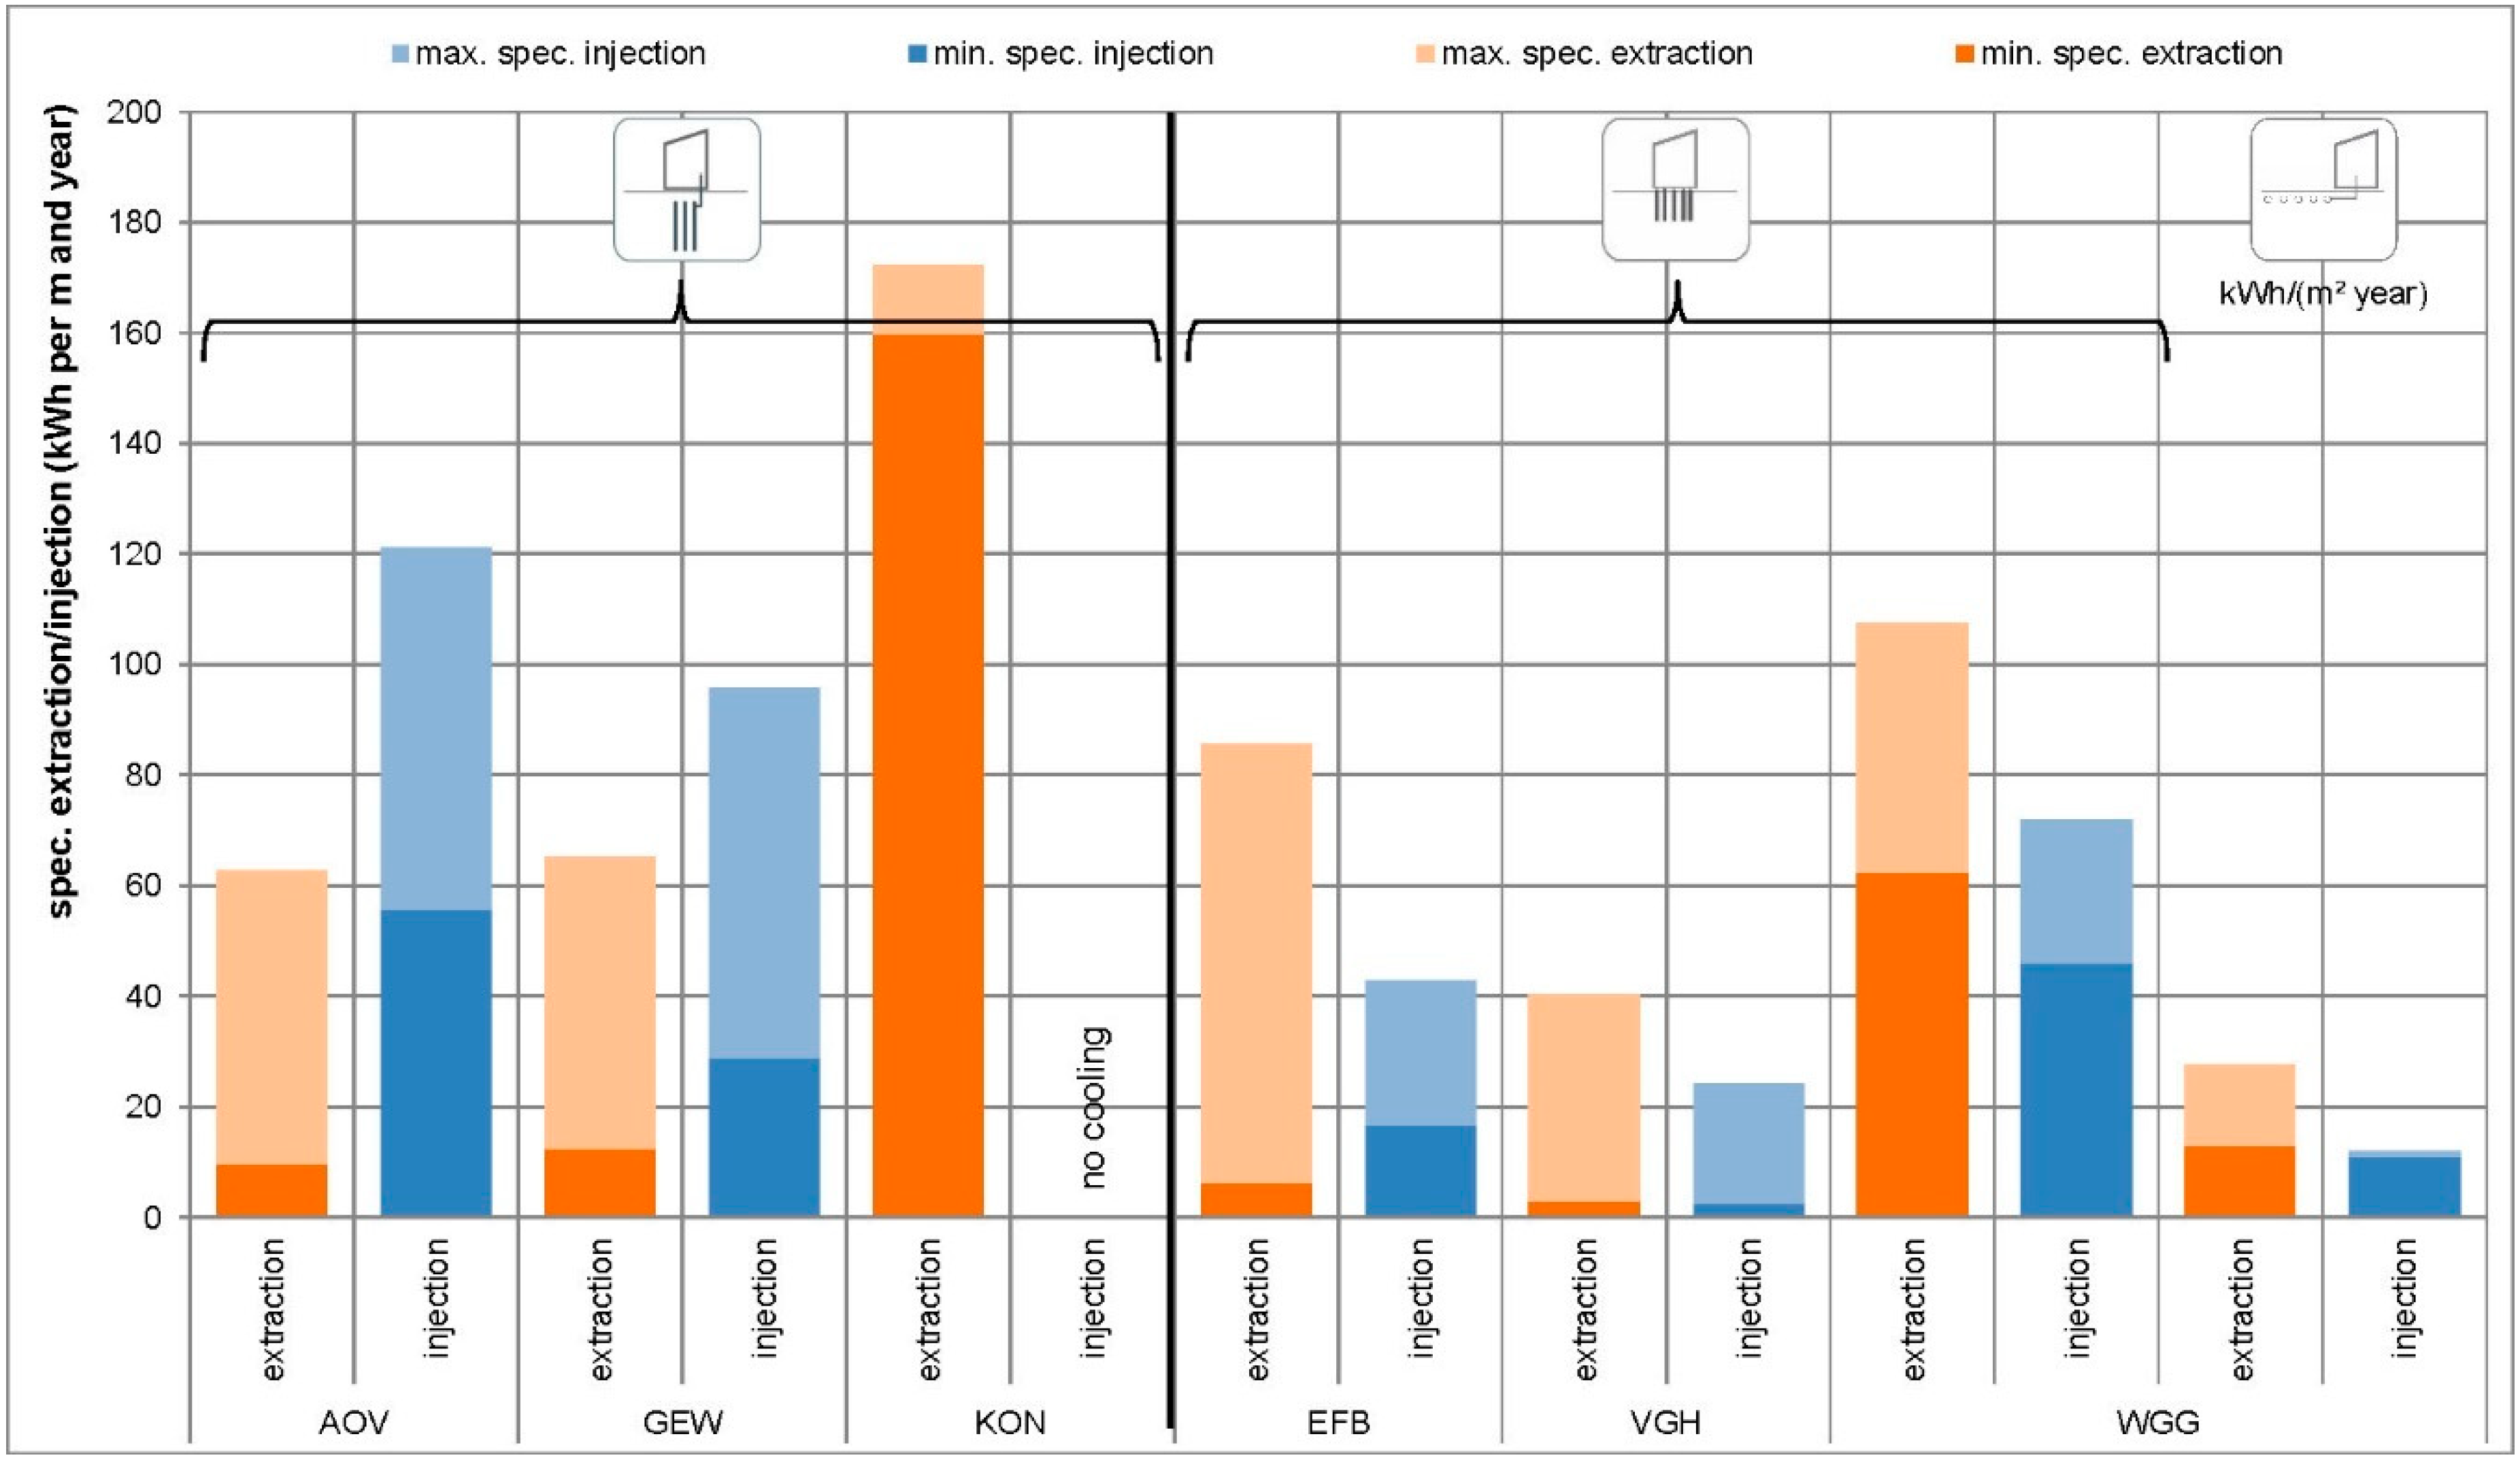
The specific annual energy yields for the various heat sources and heat exchanger systems are shown in
Figure 6 per meter of borehole heat exchanger or energy pile.
The largest specific energy extraction occurs in the KON and WGG. In one year, up to 170 kWh/(m·year) and 107 kWh/(m·year) are extracted from the ground. The AOV and GEW have the highest specific heat injection. A maximum of 120 kWh/(m year) and 96 kWh/(m·year) are injected into the ground. The average specific heat extraction for borehole heat exchangers is 80 kWh/(m year) and that for energy pile systems is 50 kWh/(m·year). The values for heat injection are 75 kWh/(m year) for the borehole heat exchangers and around 34 kWh/(m·year) for the energy piles.
4.2. Seasonal Performance Factor
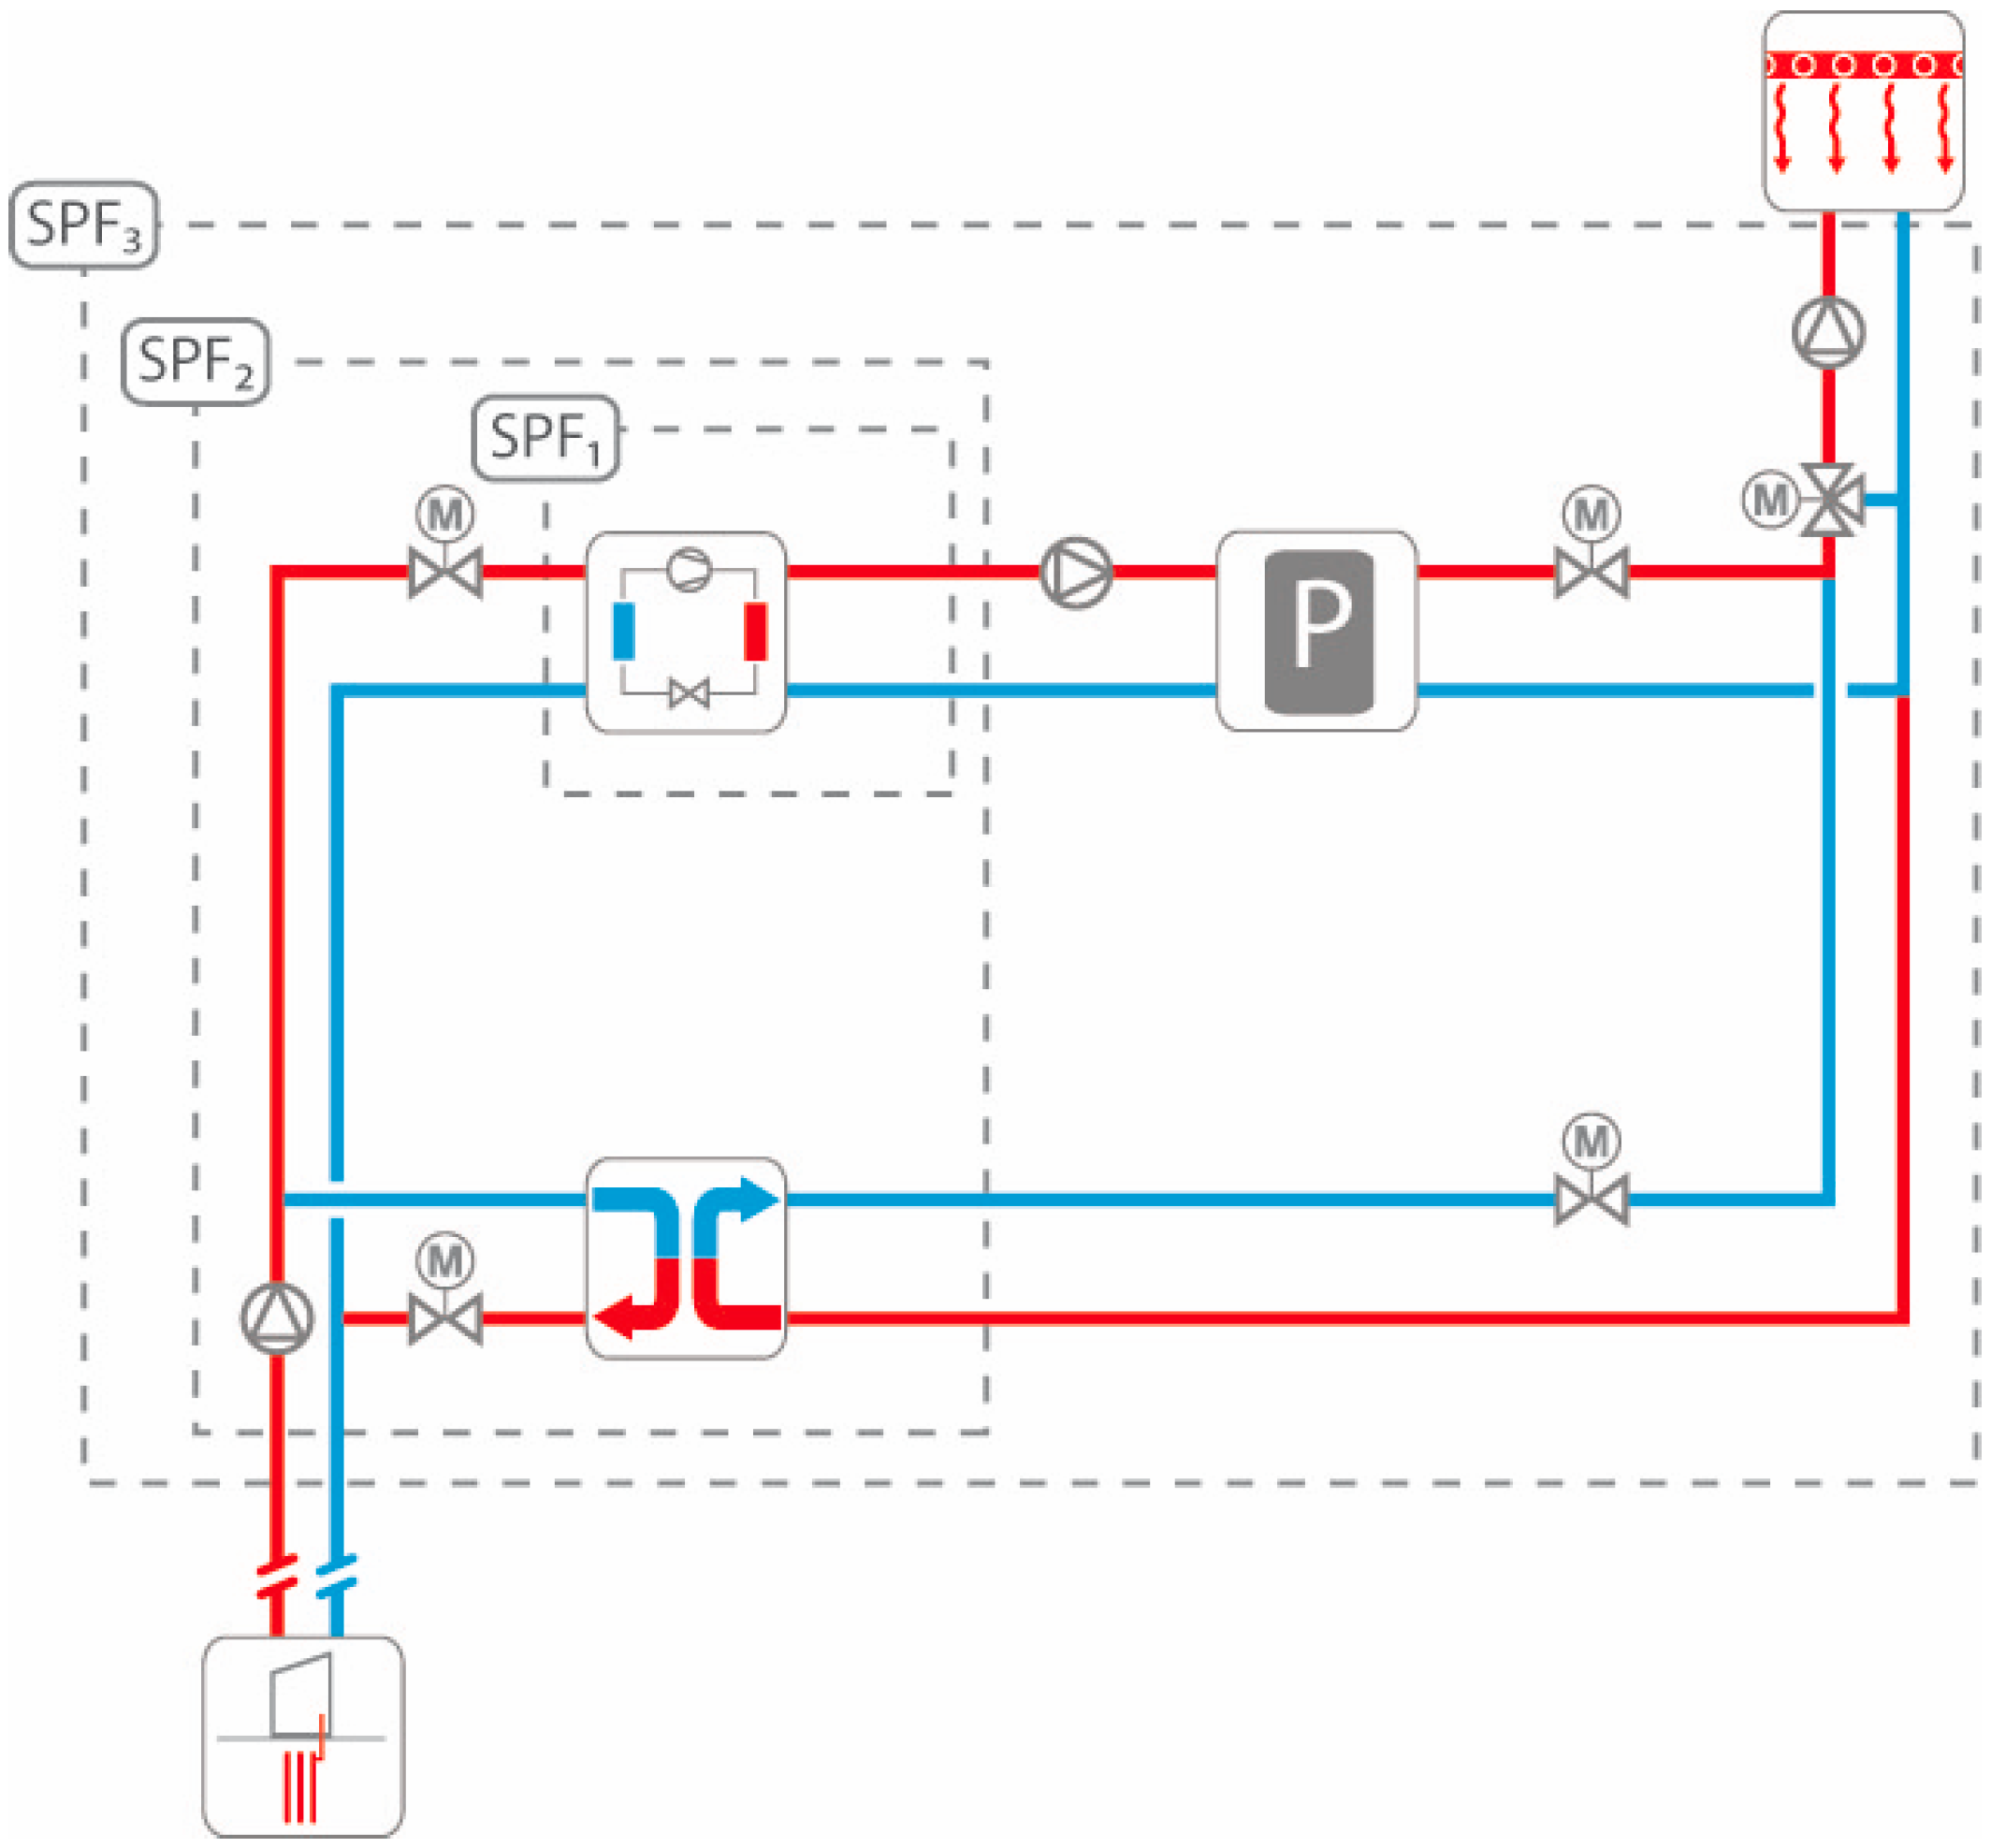
In order to ensure a uniform basis in the evaluation of the heat pump performance, system boundaries for the calculation of the Seasonal Performance Factor (SPF) are set in advance according to the boundaries defined by SEPEMO (SEasonal PErformance factor and MOnitoring for heat pump systems in the building sector (IEE Project)) [
16]. The boundaries are shown in
Figure 7.
This paper only evaluates SPF2 for heating and cooling, respectively. In addition, depending on the available measurement data, the heating and cooling cases are considered separately, so that a Seasonal Performance Factor is determined for both heating and cooling modes. SPF2 is chosen for this paper because it can be calculated for all presented buildings. As part of the individual building monitoring, the other SPFs were also analyzed as far as the database allowed.
The Seasonal Performance Factors of heat pumps, free cooling and cooling machines vary widely in their magnitude. From a primary-energy perspective, heat pump operation with a SPF greater than 3 is considered efficient. In active cooling mode, the SPF should reach a value greater than 2.5. Free cooling operation is particularly efficient. Here, electrical energy consumption on the generator side is only required for driving the circulating pumps of the geothermal system. With correct dimensioning and mode of operation, SPFs of 20 to 50—or higher—can be achieved [
1,
11,
15].
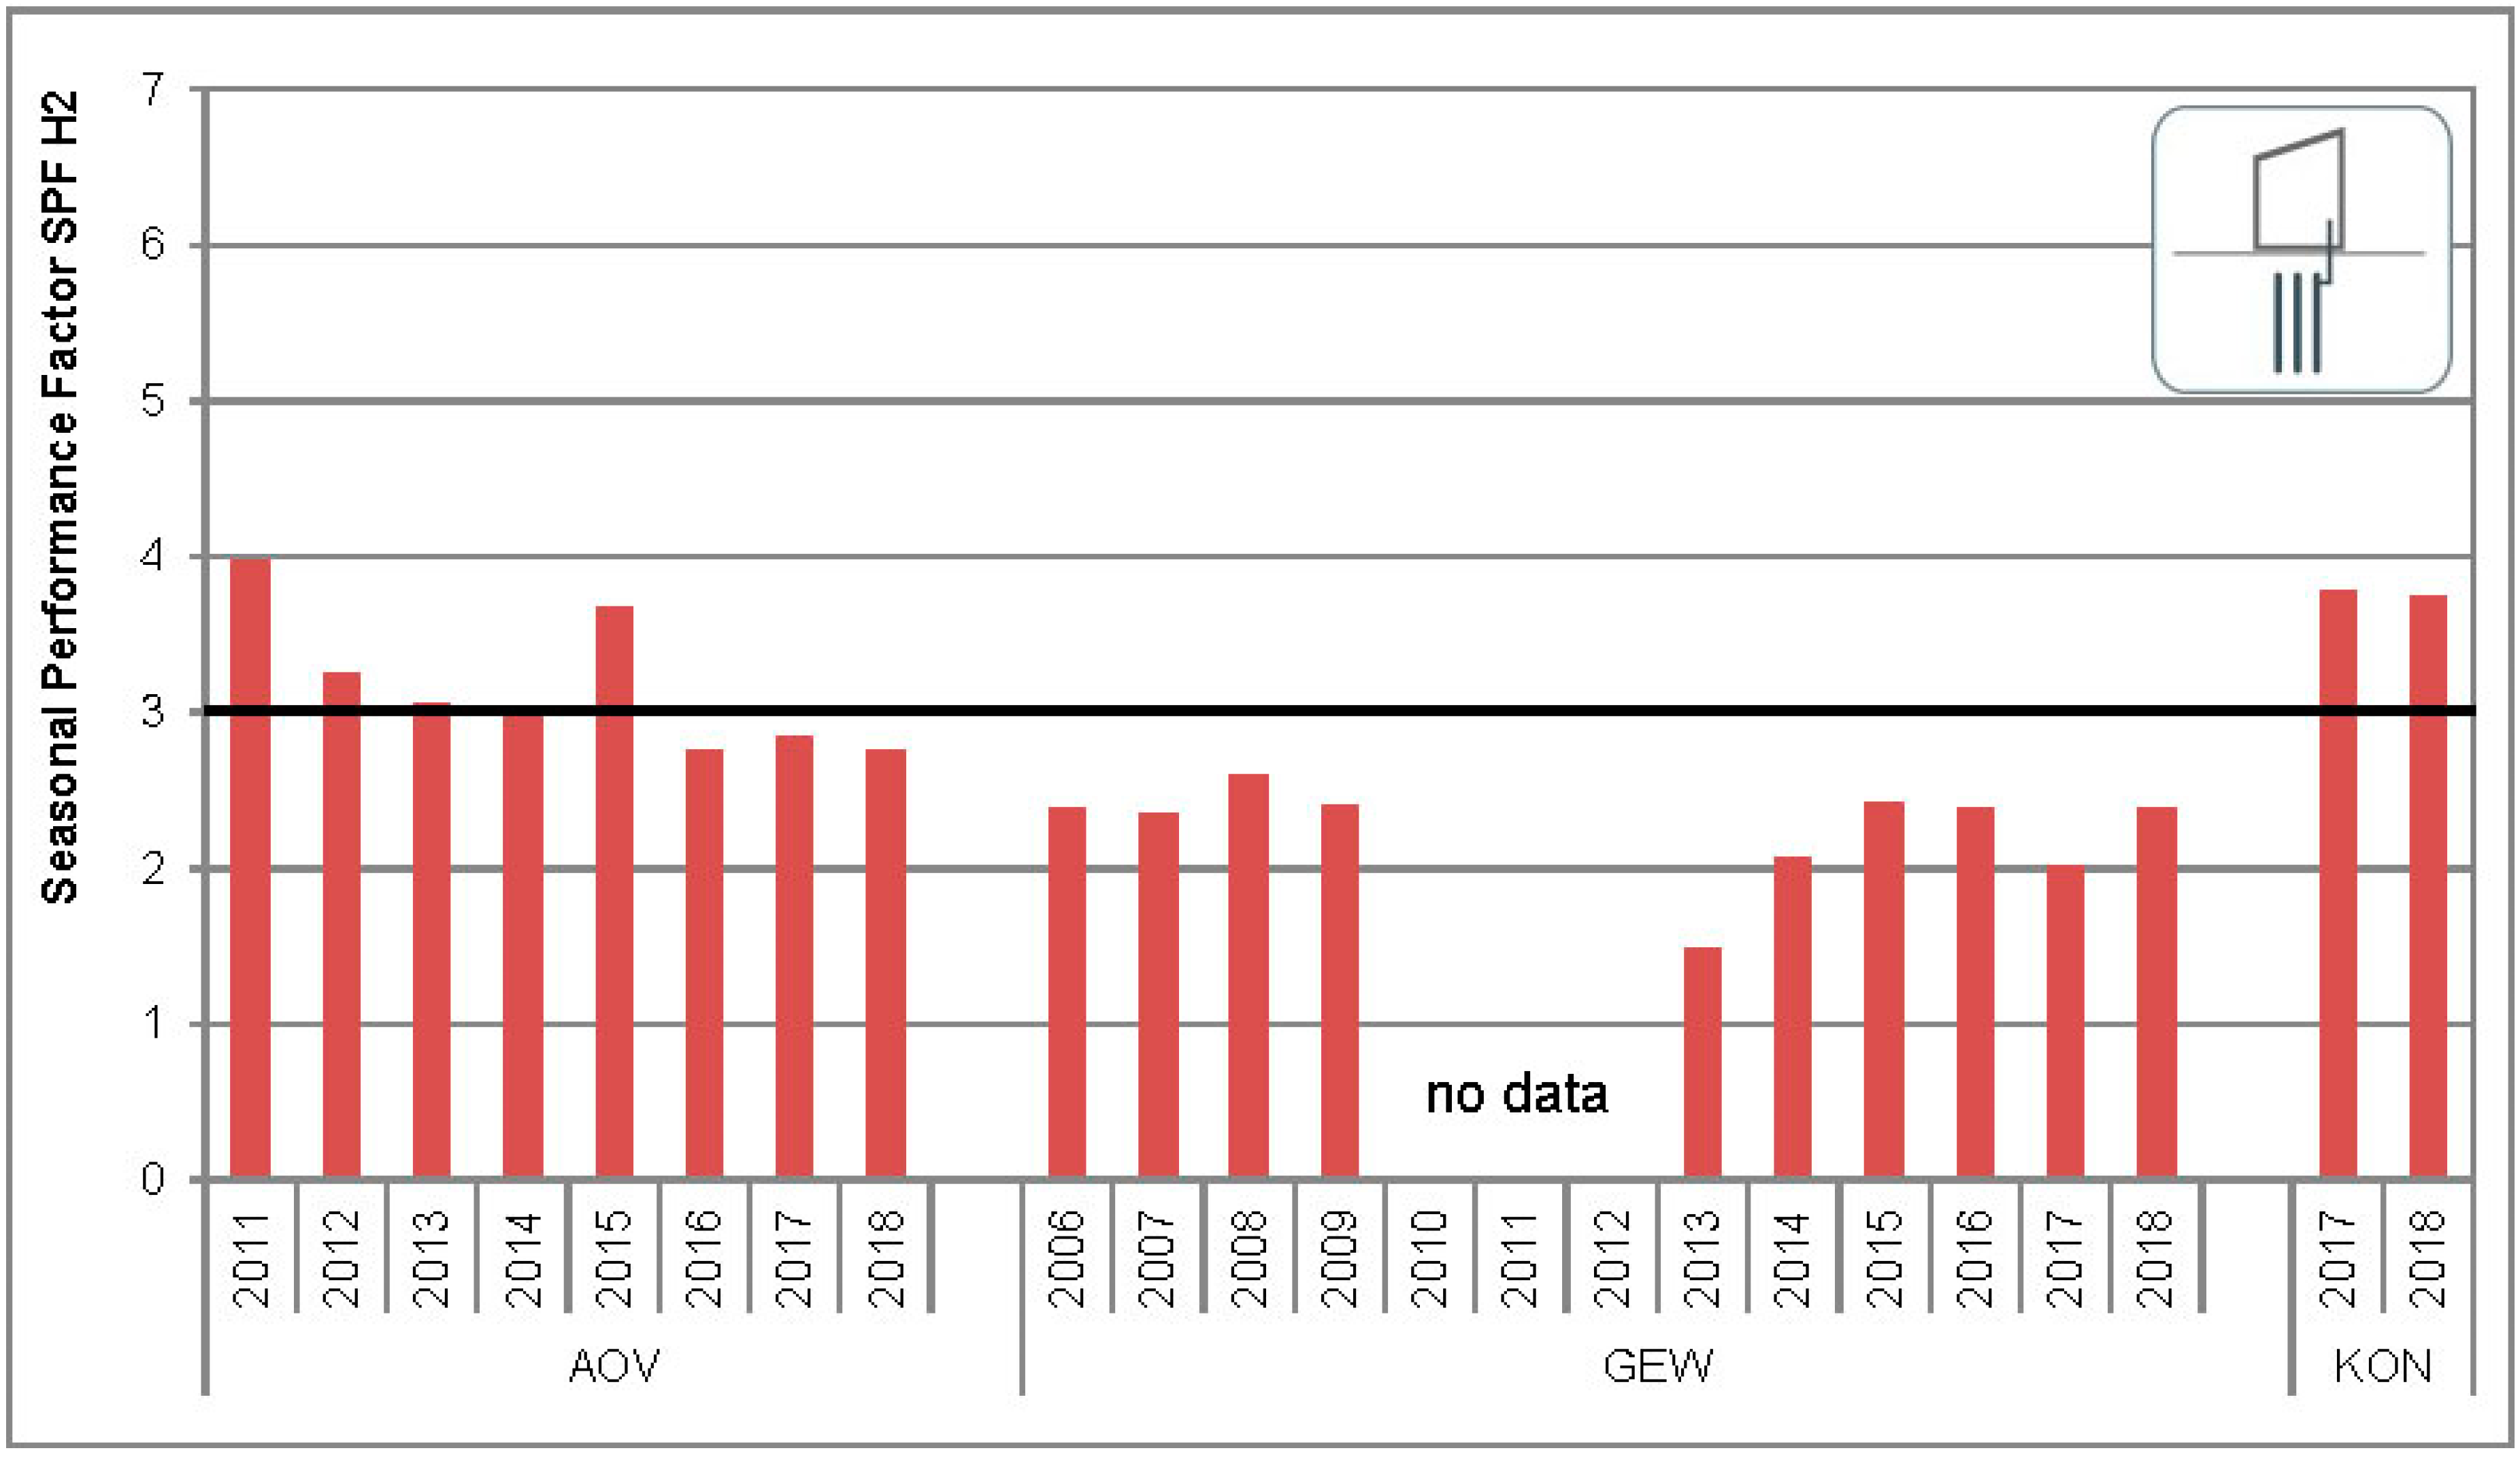
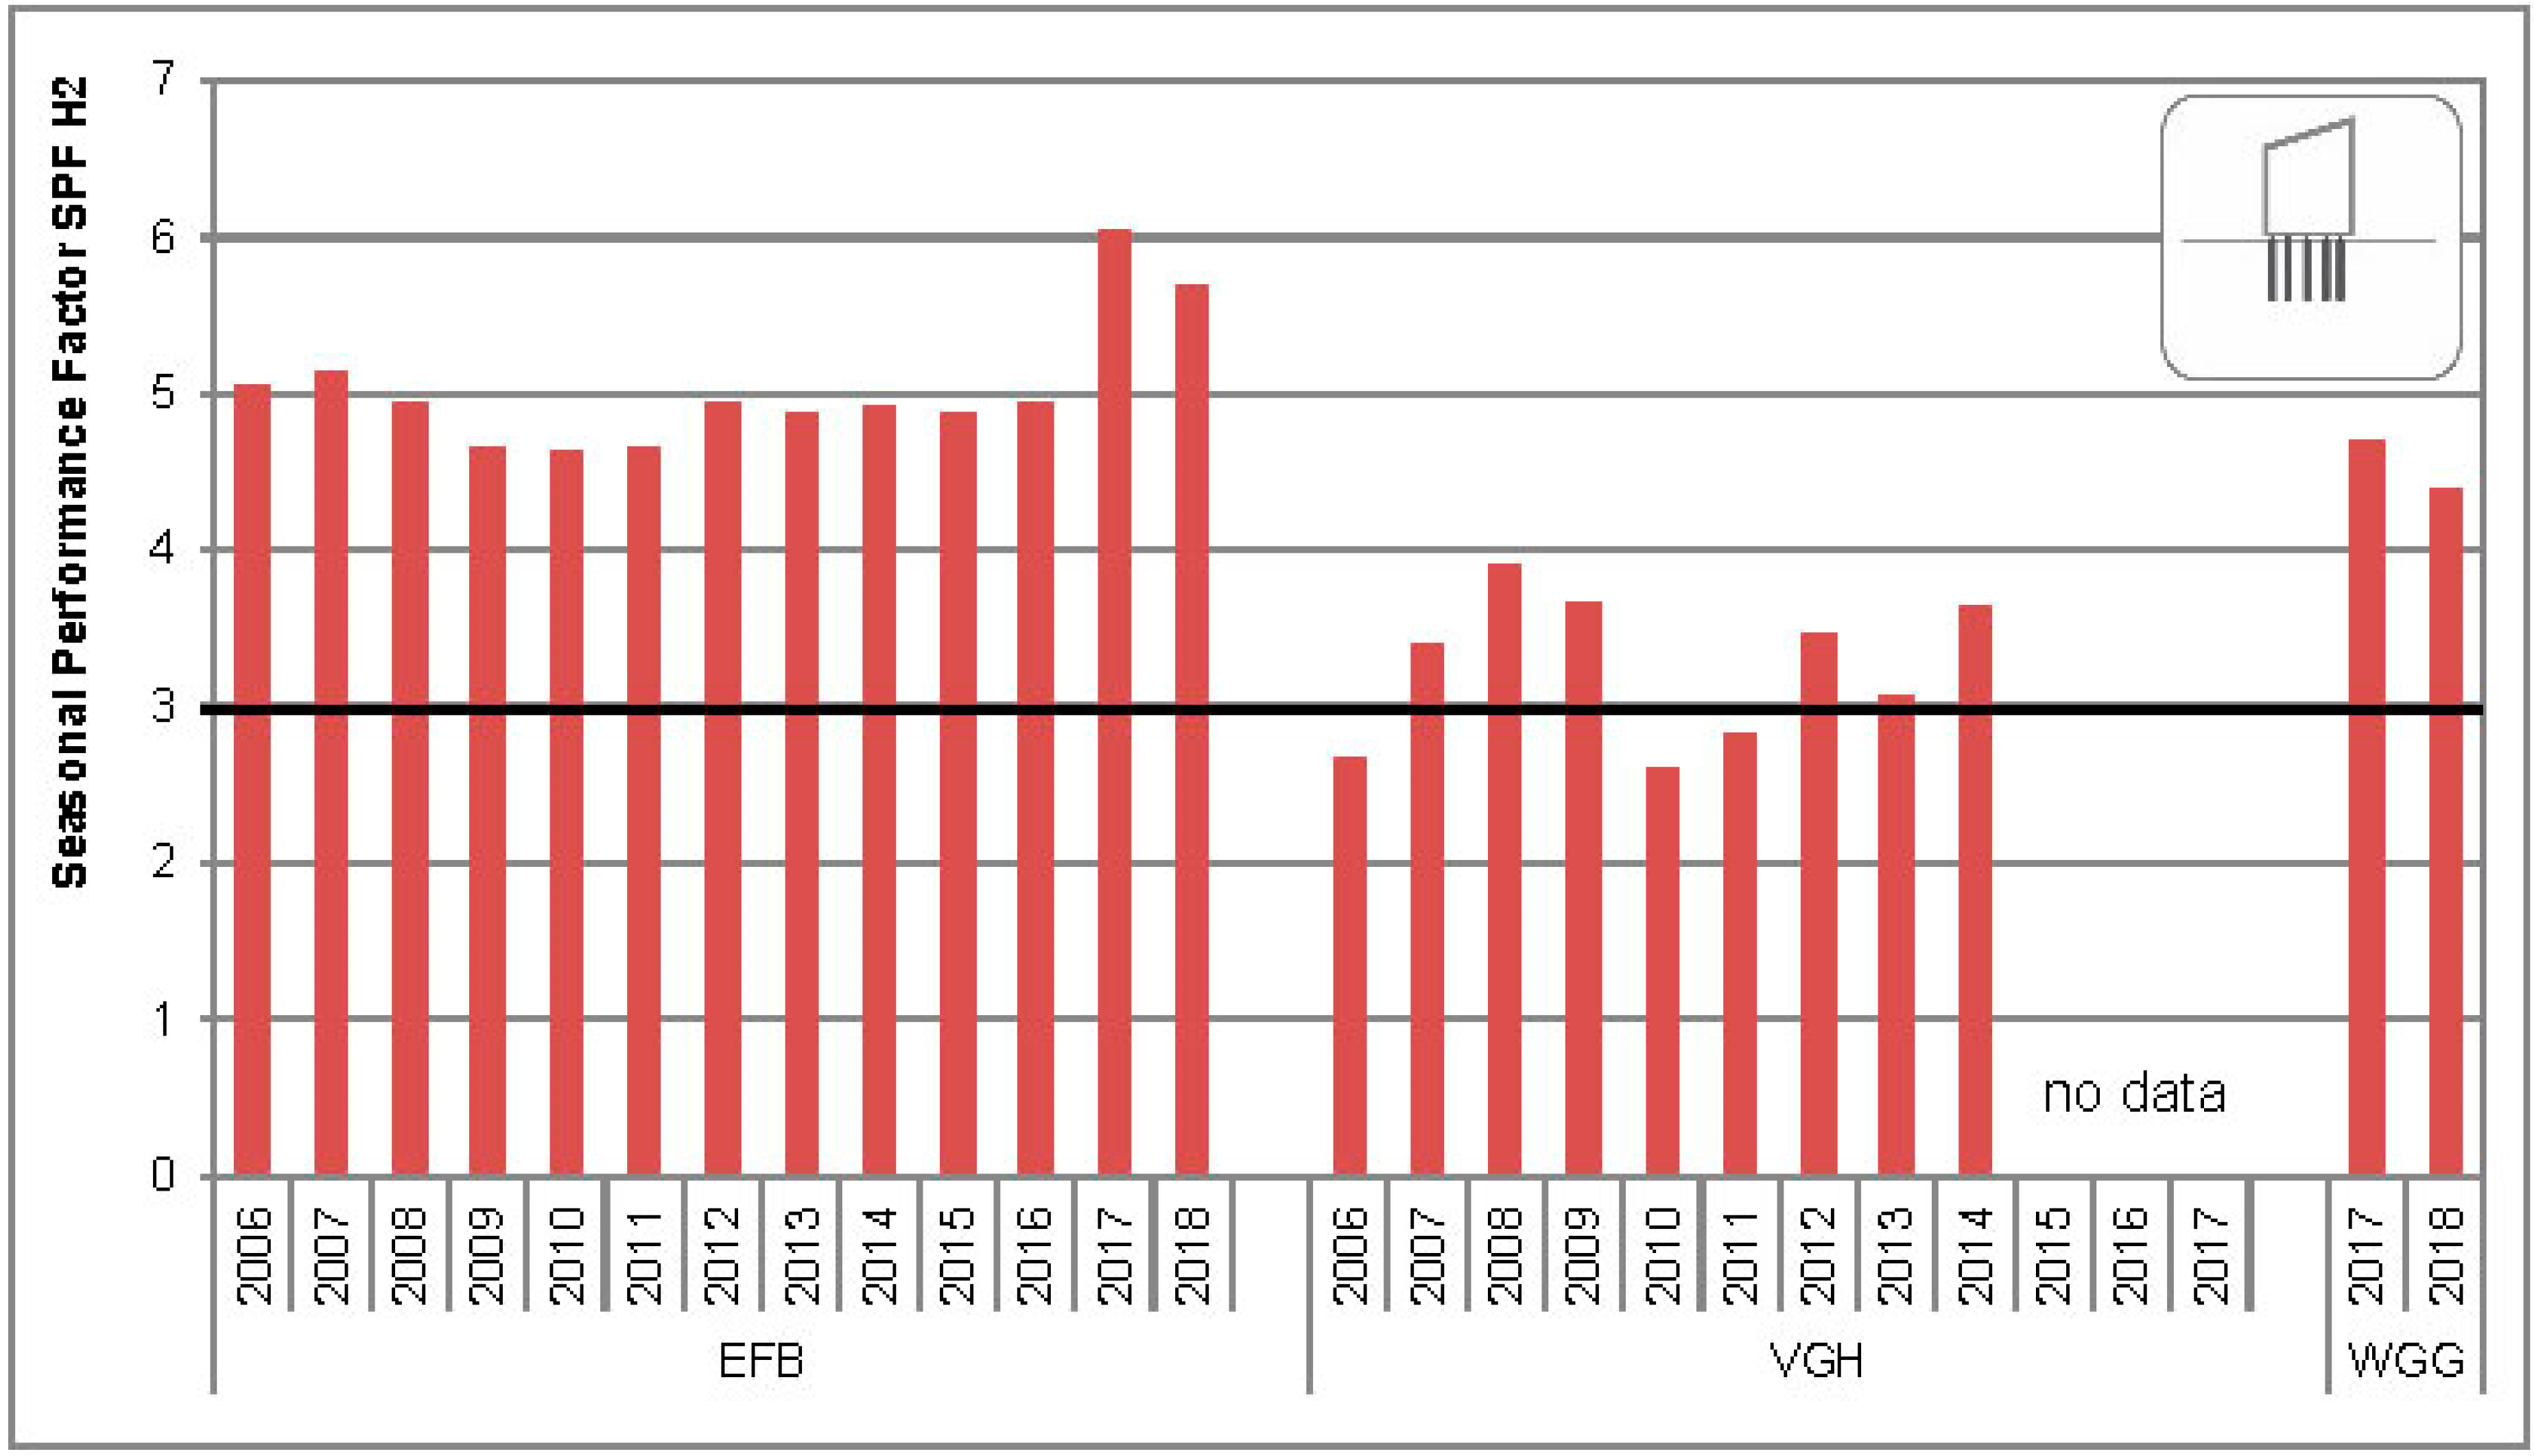
With seasonal performance factors of less than 3 at the beginning of the monitoring, the values show that the operation of some of the monitored plants did not meet the design goals. Within the scope of the monitoring, the systems and the operation could be optimized to such an extent that all plants achieved seasonal performance factors between 3 and 6 (
Figure 8 and
Figure 9). Larger differences in the seasonal performance factor—e.g., in the energy pile system of the VGH or the GEW system—are usually due to system optimizations or hydraulic changes. Causes of slight fluctuations, such as in the energy pile system of the EFB building, are, for example, due to varying requirements depending on the weather as well as varying underground temperatures. A decisive influence on the seasonal performance factor of the cooling system is the proportion of the very efficient free cooling operation in relation to the active cooling mode.
The comparatively low seasonal performance factors of the borehole heat exchanger system of the GEW building with almost optimized operation are related to the specified objective. The energy concept ensures that the building is heated and cooled exclusively by the ground-coupled heat pump. Only the supply air is cooled to room temperature in summer by an independent system. In order to cover the cooling loads of the building even on extreme summer days, the heat pump is reversible and can therefore also provide active cooling during summer. In contrast to the other monitored systems, the GEW borehole heat exchanger system has not only been designed for basic but also for peak load coverage. The consequence of the peak load design is that the heat pump runs for a large part of the operating time in less efficient partial load operation and therefore has lower SPFs. In addition, this heat pump is not a standard product and was individually designed with individual components at the time of commissioning. In this case, Seasonal Performance Factors >3 are not to be expected (according to data sheet).
The results of the EFB, AOV, KON and WGG buildings show that targeted quality assurance and operational monitoring pay off right from operational start-up. To date, Seasonal Performance Factors of up to 5 have been achieved here (
Figure 8 and
Figure 9). It should also be noted that operational monitoring is also helpful after a calibration phase. Thus, it can be stated that, after the end of the actual research project and the optimization phase (2010/2011), the Seasonal Performance Factor at the VGH fell below 3.0 again. The low values here relate to the plant technology. After updating the software of the heat pump, the limit and control values were not set correctly again. The “wrong” values lead to poor plant operation.
The majority of the buildings meet the consumption calculated in the planning and there are no major user-dependent changes;
In monitored buildings, the heat pump systems are generally reliable and efficient (after optimization);
For the heating mode (
Figure 8 and
Figure 9), Seasonal Performance Factors larger than 3 are achieved for AOV, KON and VGH. SPF values over/nearly 5.0 were determined for EFB and WGG. For GEW, the Seasonal Performance Factor is below 3.0 according to the measured data, which is due to the design and the plant itself;
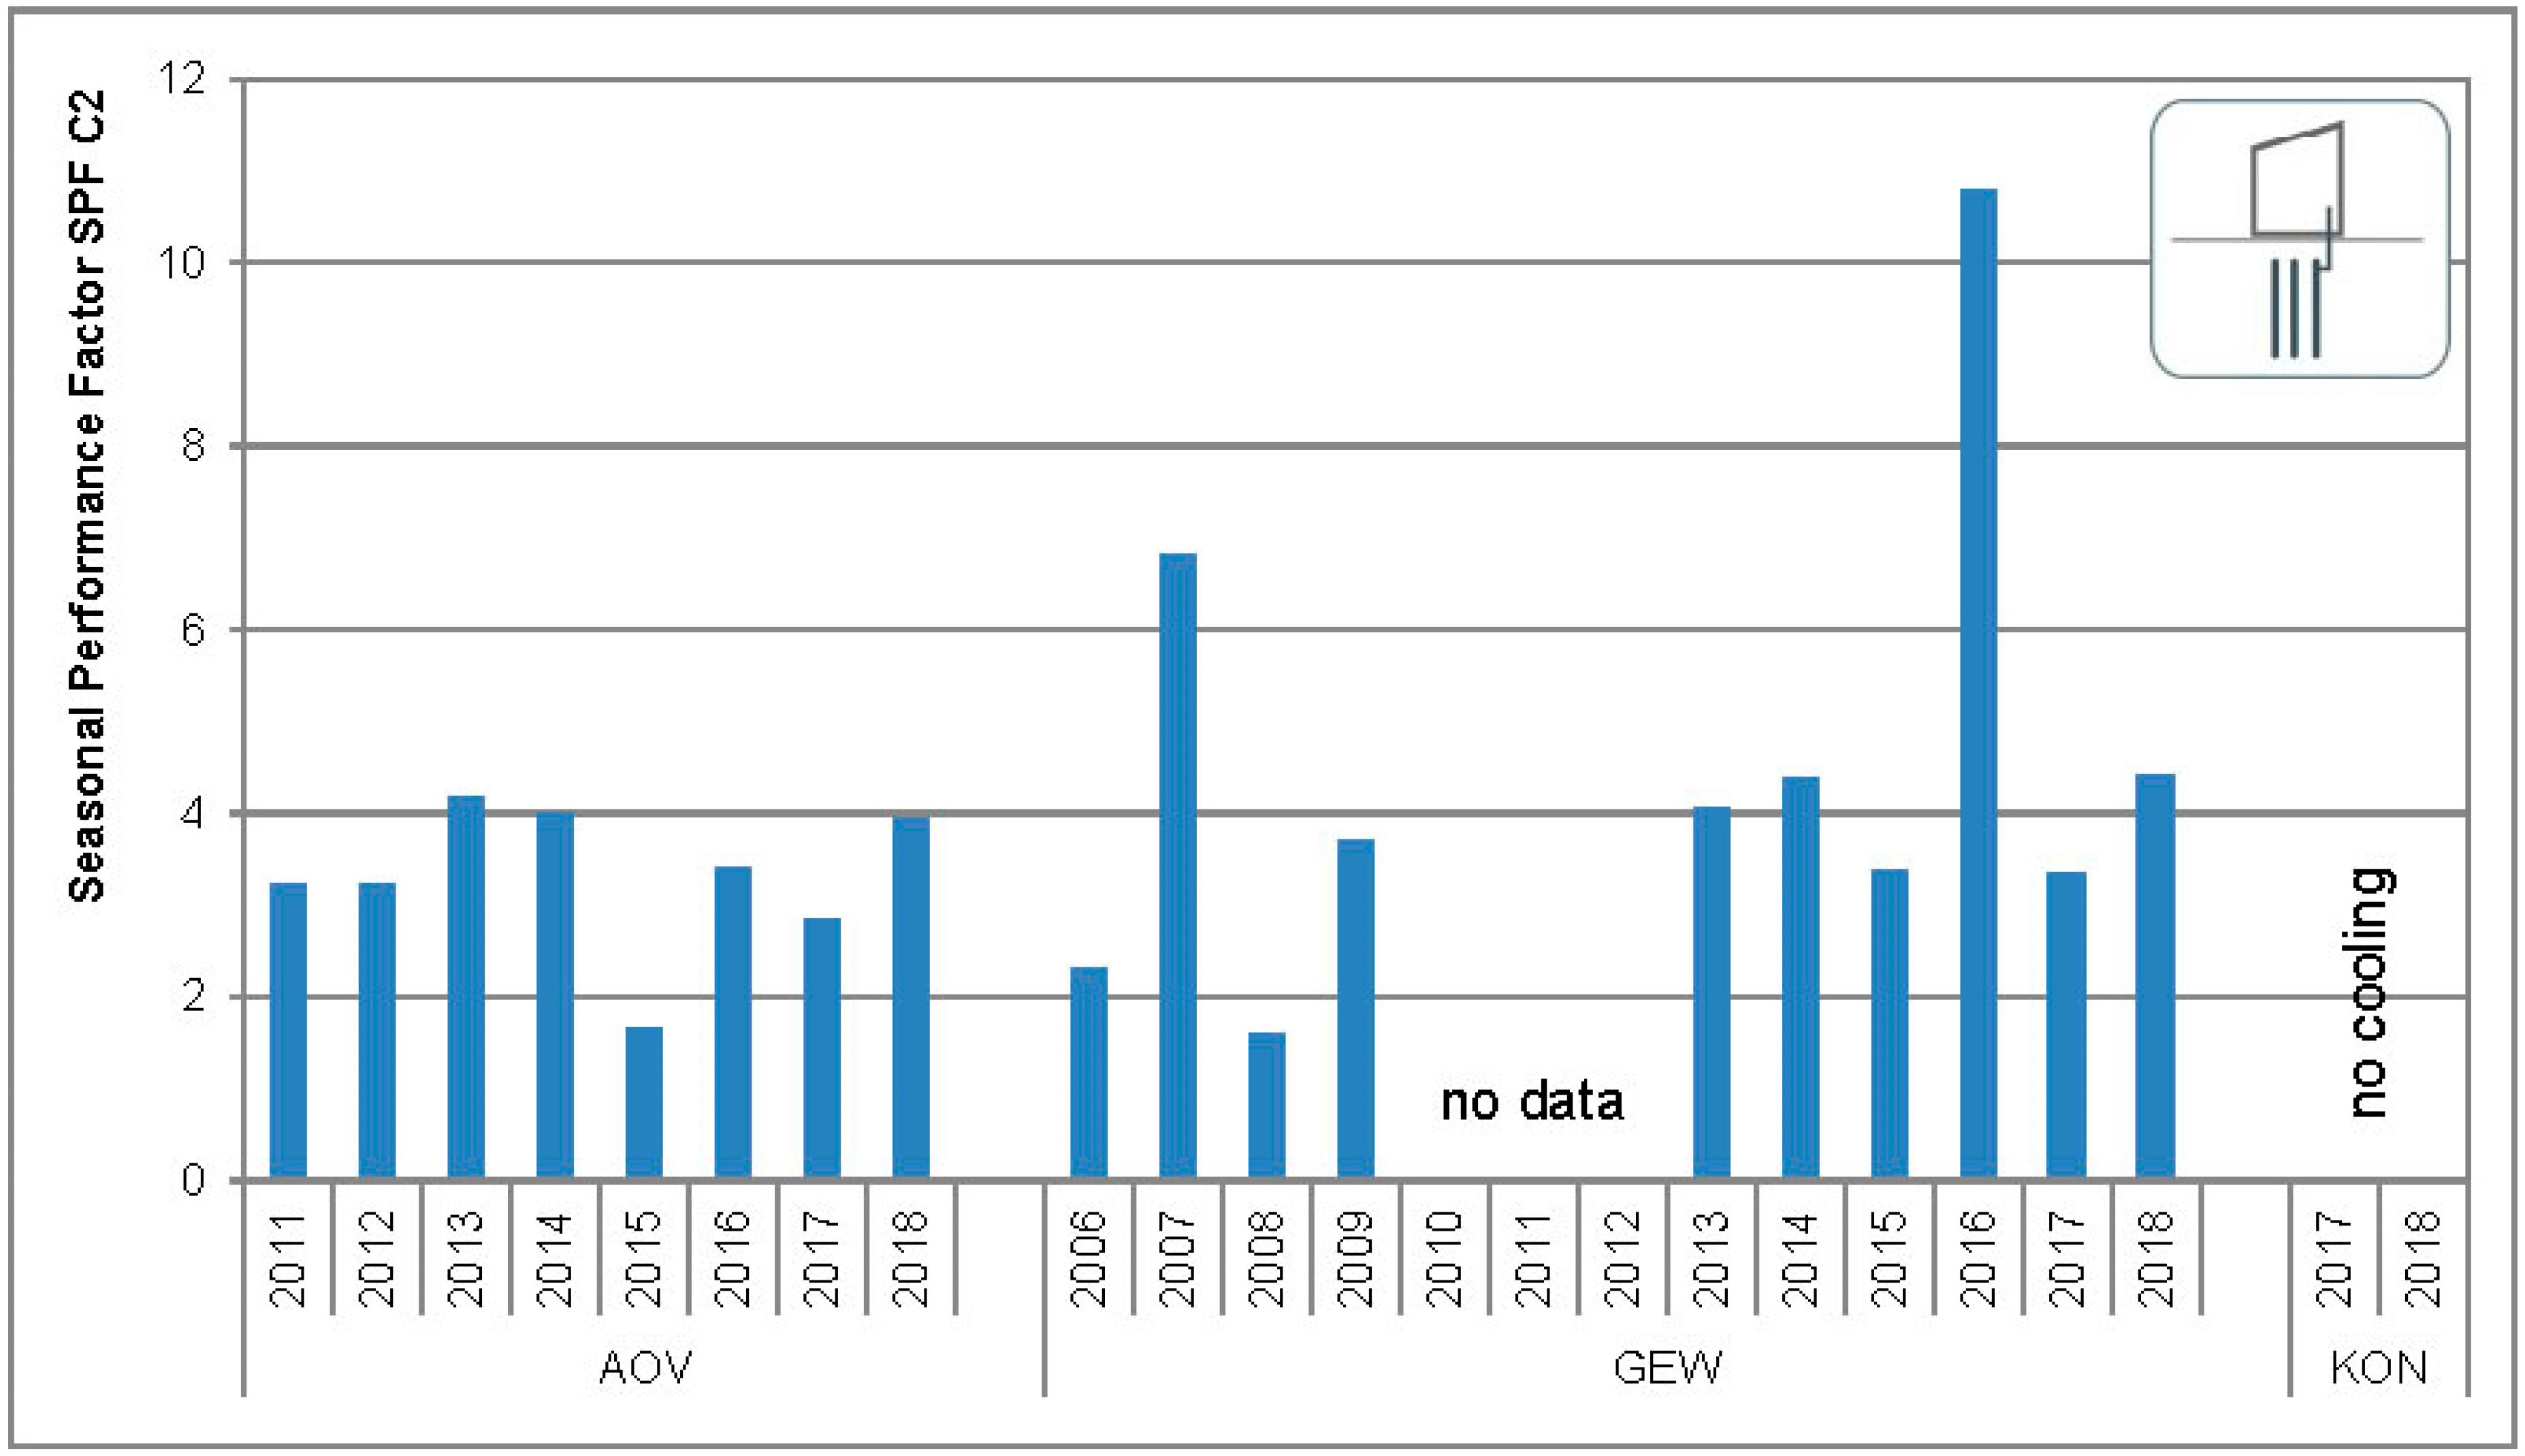
For cooling operation (
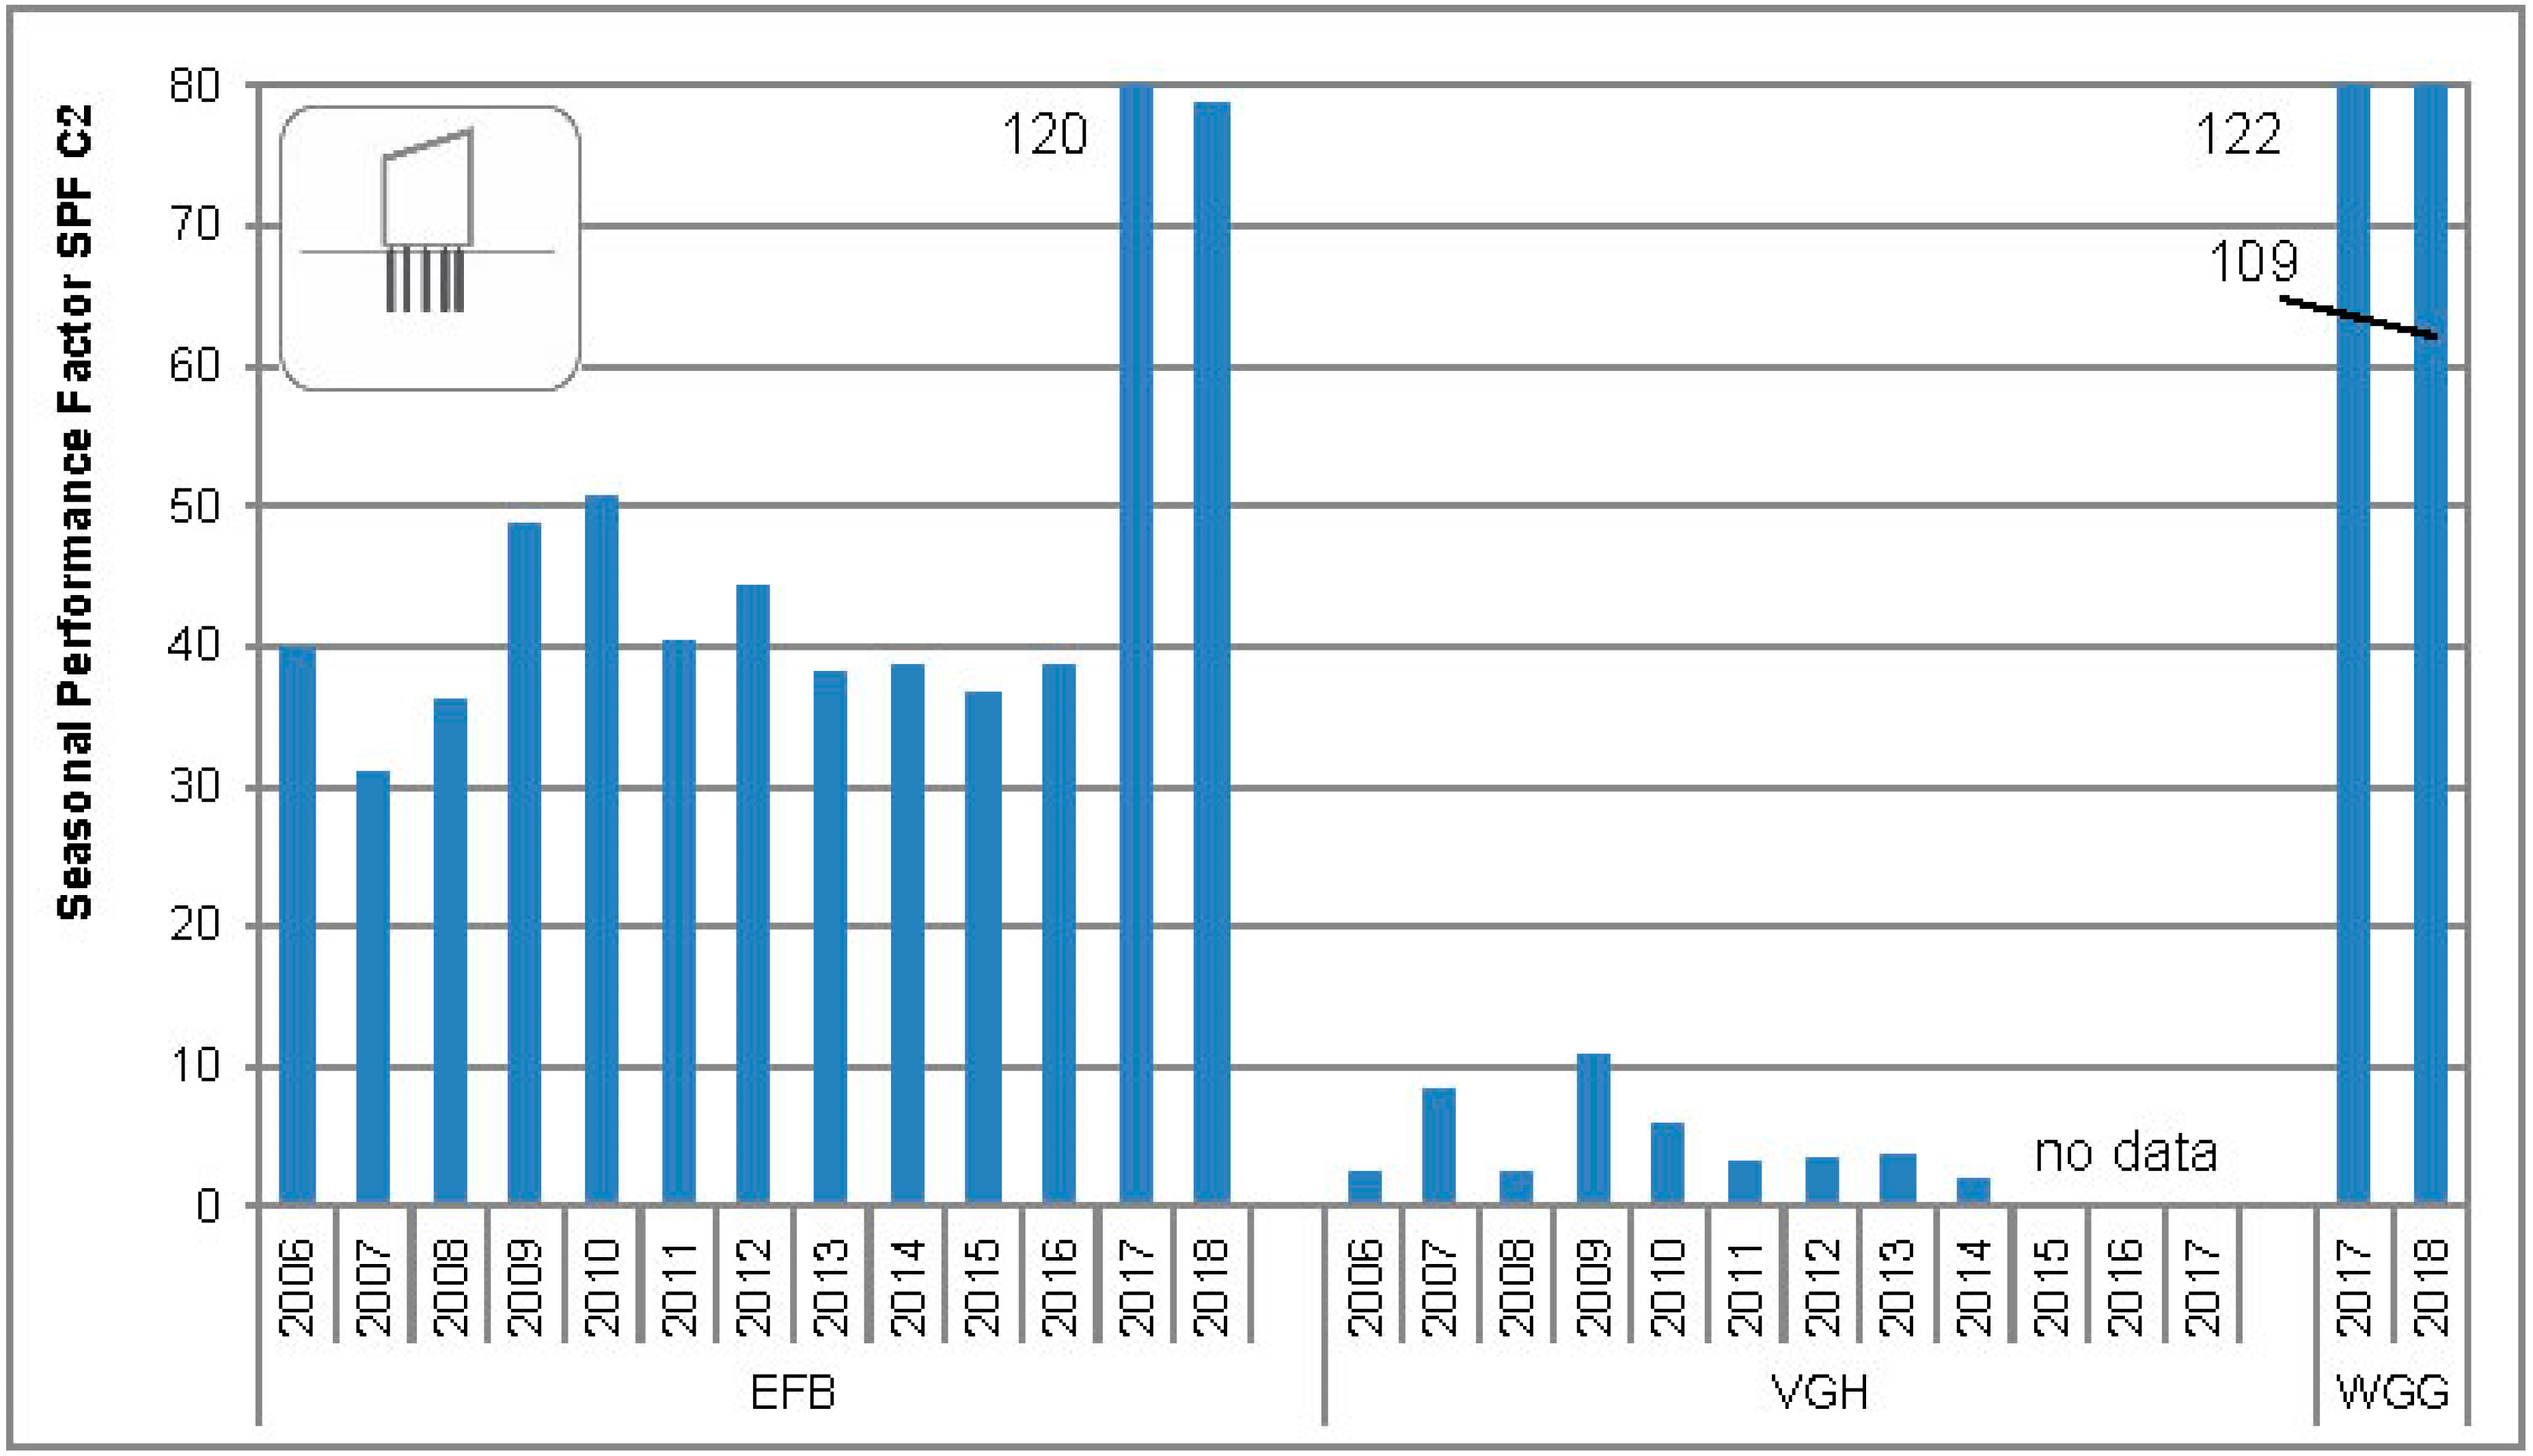
Figure 10 and
Figure 11), Seasonal Performance Factors of around 4 can be achieved for AOV and GEW if there is a priority active cooling process (reversible heat pump). The free cooling operation of the EFB and WGG alone leads to Seasonal Performance Factors of around 40 up to over 100 in cooling mode. VGH has SPFs from 2 to 11, depending on the proportion of free and active cooling modes.
The reasons for the low seasonal performance factors include, but are not limited to, the following:
The continuous operation of the system (running times), as shown in
Table 3;
Non-coordinated operating strategies as well as heating and cooling curves between the operating states of heating, active cooling and free cooling (more or less in every building—all buildings should be corrected/optimized);
Changed setpoints—e.g., outdoor air temperature as the starting value of the cooling mode—were not reset to standard mode after changes in the settings due to defective equipment (EFB, VGH);
Faulty measurement (incorrect recording of energy quantities and temperatures, measurement data failures, incorrect measurement, etc.—for every building more or less).
4.3. Temperature Level
The operation mode of the heat pump and the corresponding temperature level of the source as well as the sink have a significant influence on the seasonal performance factor. For example, low outlet temperatures of the source systems or high supply flow temperatures in the building have a negative effect. With regard to the supply temperatures of the monitored buildings, appropriate low temperatures (in a range of 25–45 °C in heating mode) should prevail here, since in the investigated buildings, low-temperature transfer systems are mainly used to condition the buildings.
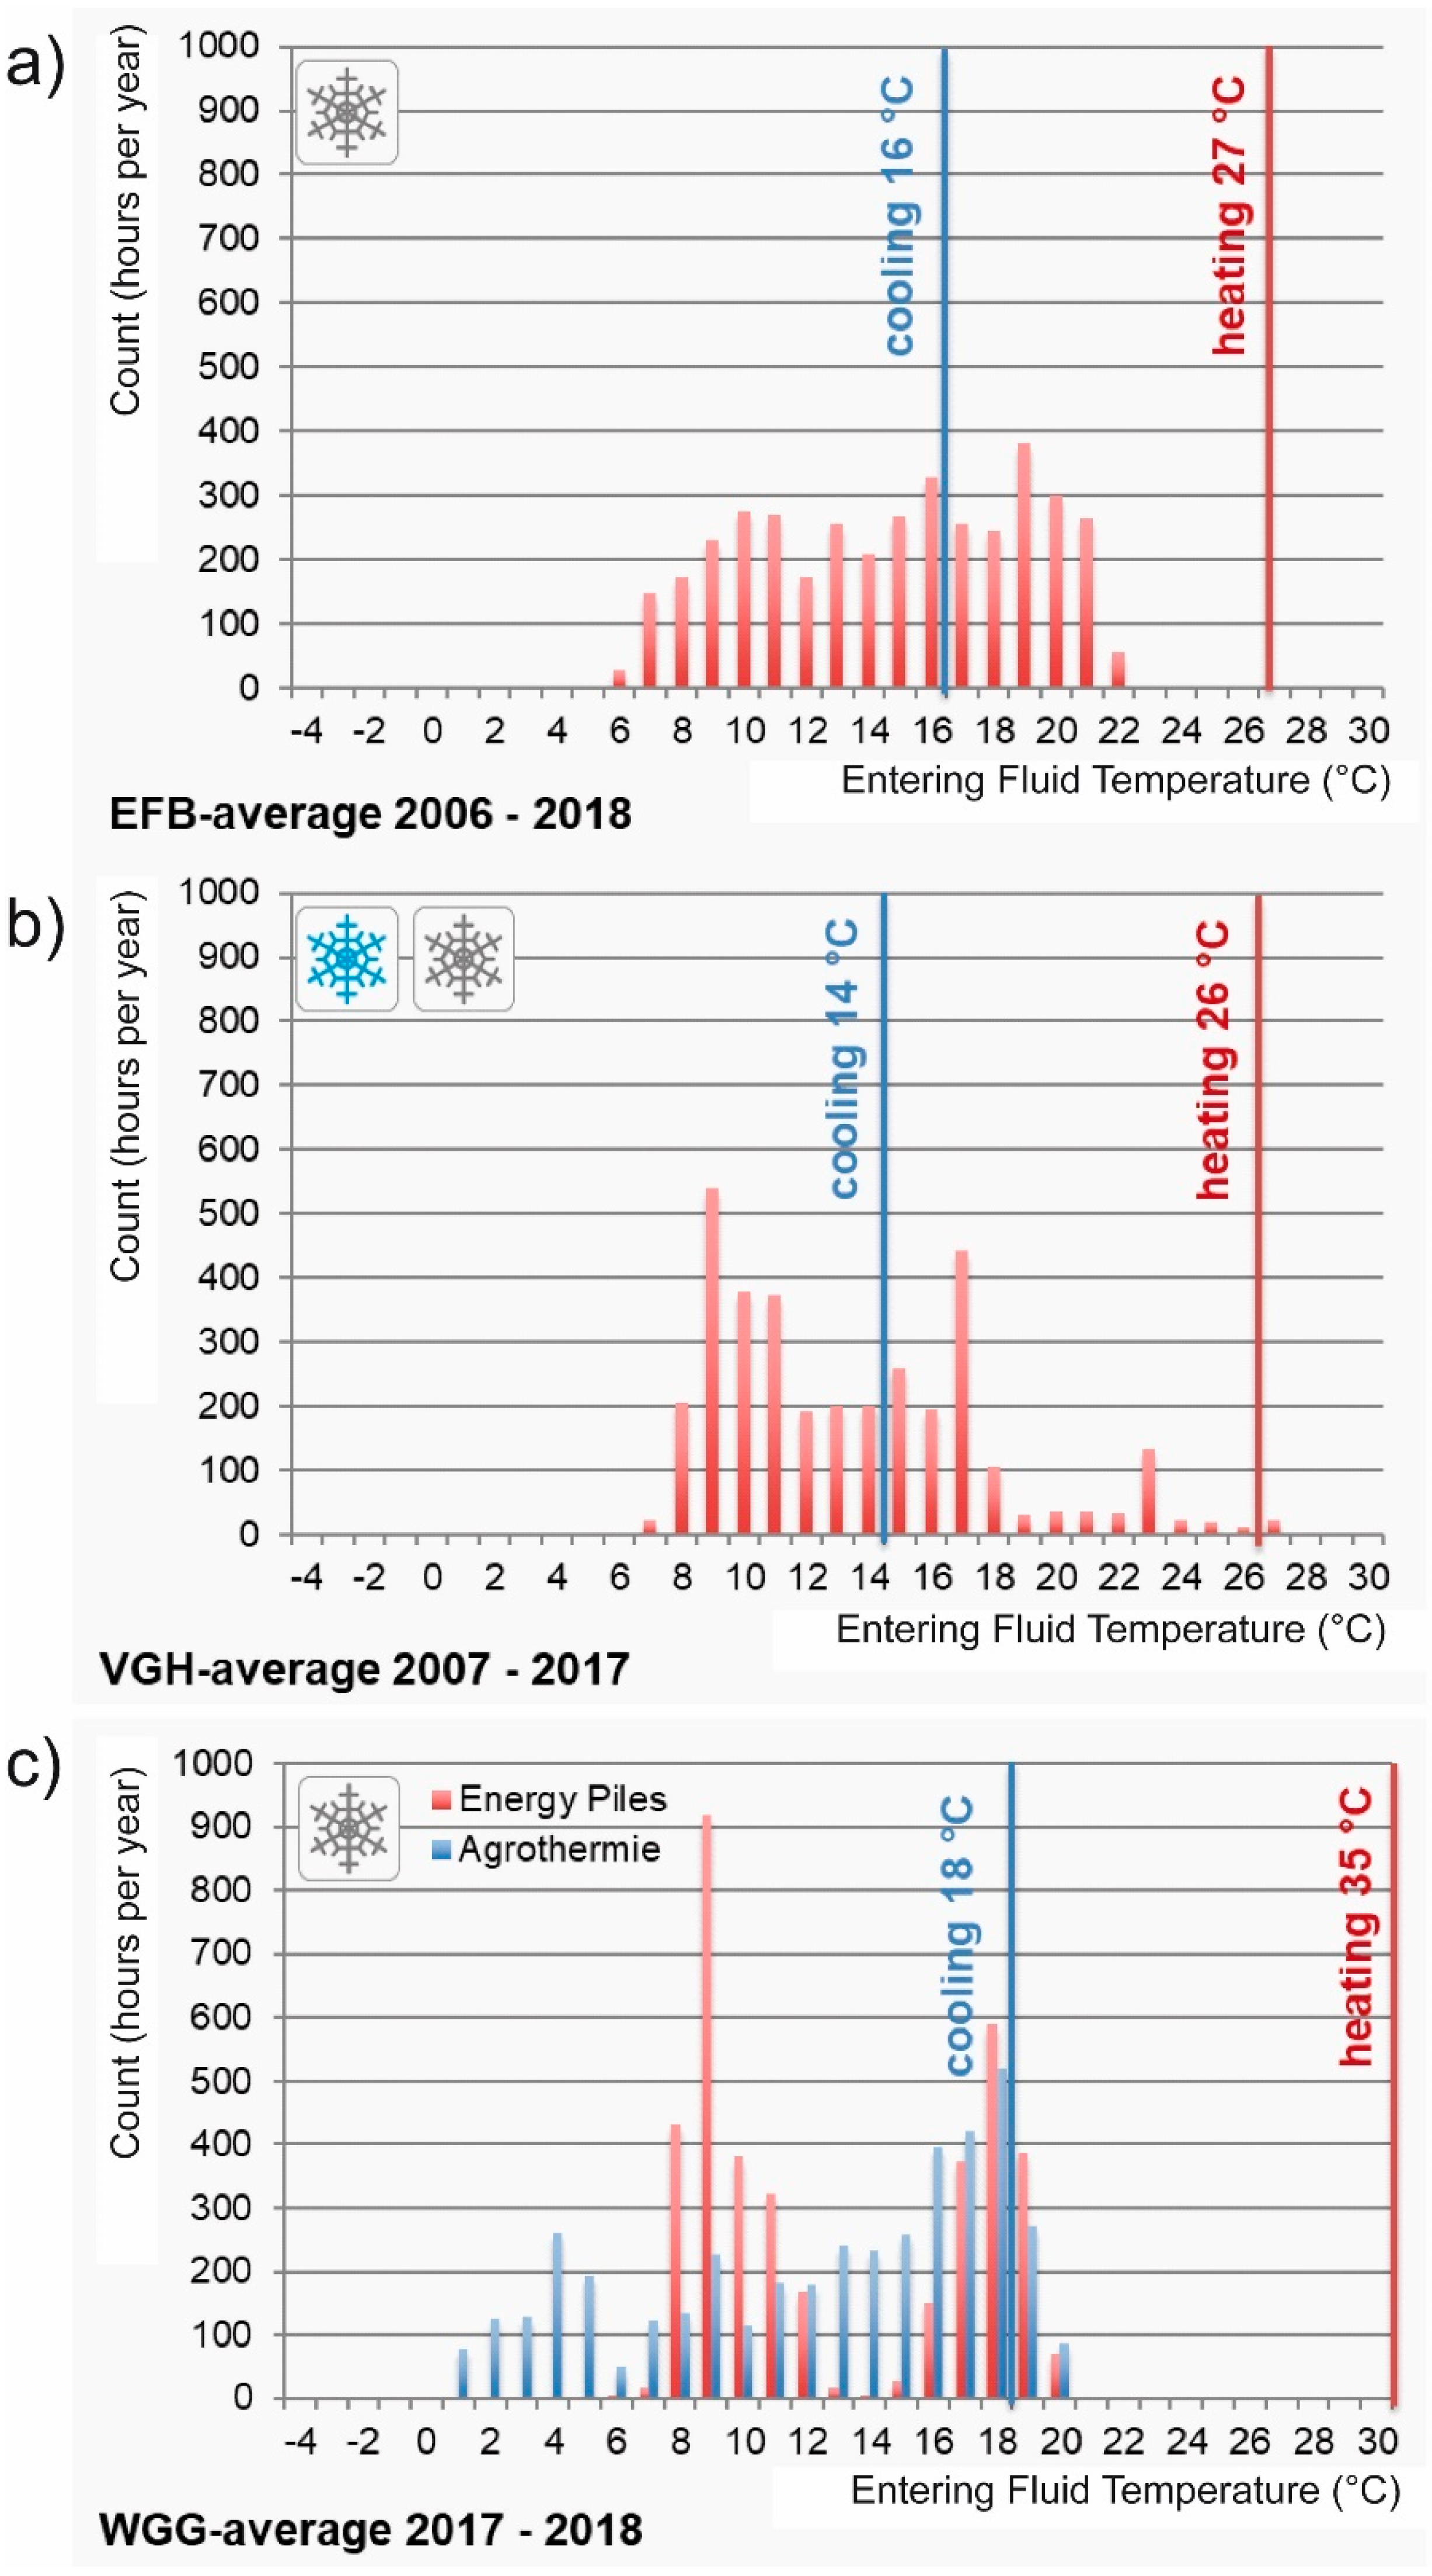
Figure 12 and
Figure 13 show the absolute frequency of the measured outlet temperatures and their average temperatures during the measurement periods. The temperatures represent the temperature level of the entering fluid temperature on the source side in the heating or cooling mode of free cooling as well as to the reversible heat pumps. The figures also show the maximum and minimum temperature level that should be provided by the heat pump for room heating and cooling in accordance with the planning. The switchover between free cooling and active cooling takes place when the required supply flow temperature can no longer be guaranteed via free cooling.
On the basis of the evaluated outlet temperatures from the borehole heat exchangers or energy piles, the following can be determined:
The outlet temperatures from the heat exchangers are always greater than 4 °C, with the exception being the Agrothermie with 1 °C. In the case of energy pile systems, no temperatures below 5 °C can be observed in the outlet of the geothermal system. This is due to the fact that, for static safety reasons, no medium with temperatures below 3 °C is allowed to be injected into the energy piles. The heat pumps would automatically go out of operation before this;
The outlet temperatures also increase to 29 °C. This is particularly the case in the summer months, when active cooling is in operation and the ground is significantly warmed by the higher return temperatures;
On average, the supply flow temperatures for room heating are between 26 and 40 °C (domestic hot water 60 °C) according to the planning. Additionally, for cooling, the supply temperatures are around 16 °C;
The average temperature lift in heating mode for heat pumps is 16 to 32 K. A maximum lift of 56 K had to be overcome.
In the systems of the buildings AOV, GEW and VGH, it can be observed that the temperature level in the ground is clearly outside the temperature range to be able to use the potential of free cooling. The entering fluid temperature reaches values above the required supply flow temperature of the cooling systems in the building (>14–18 °C). In these cases, an increased use of the reversible heat pump operation is necessary or the required cooling capacity cannot be transferred to the building. The troubleshooting and thermal regeneration of the ground can take several years, depending on the project status.
Table 3 lists the operating hours or proportions of the operating modes once again. It can be seen here that a base load can be covered by free cooling, which usually takes place during spring. If the cooling demand and the temperatures in the ground increase, the active cooling mode must be switched on for buildings with reversible heat pumps.
5. Operating Experiences
The experience gained from the project monitoring shows that it is possible and sensible to integrate geothermal systems into innovative energy concepts for office buildings as well as schools and multi-family houses. However, a regulation phase is required during which the direct interaction between the geothermal system, the building, other thermal conditioning systems and not least the users is optimized. A lack of experience from contractors and plant operators often significantly prolongs this adjustment phase. Compared to conventional heating and cooling systems, geothermal low-temperature sources are subject to a special feature with regard to the detection of system and operating faults due to their inertia and the interaction of base and peak load components. Without targeted operational monitoring, errors due to system inertia remain unnoticed until defined operating parameters can no longer be achieved. As this usually only happens after several years, the ground is—in the worst case—already significantly undercooled or overheated. Once the fault has been rectified, the ground may no longer be usable for the intended operating mode—heating or cooling—for a longer period of time. The ground must first be thermally regenerated.
Many of the results presented in this paper have been generalized, as they have not only been found in individual buildings. In one building, the points listed may have been more serious/amplified than in another. We would like to consider the following statements generally valid, although they should also be checked/monitored for all buildings in the future.
Essential points of the performed defect and error removal at the buildings and plants examined by measuring technology and the resulting problems included the following:
Hydraulic investigation uncovered the incorrect installation of valves and check valves or opening valves without heating or cooling media;
Defects in dimensioning and design: system components were dimensioned/designed too small, e.g. plate heat exchanger, circulating pumps;
Control of the geothermal system: poorly coordinated control strategies were present, or circulation pumps were left running 24/7;
Poor coordination of the individual exchange systems and components;
Faulty operation is usually not due to the geothermal system, but to the technical and operational integration of the single system modules in the complex overall system;
Errors in design and implementation were observed, but particularly faults in control and operation.
Important findings and experience gained include the following:
Heat is drawn from other sources instead of using the ground (district heating, internal loads, etc.). In some buildings, an unequal energy balance in the ground was recorded. In addition, other installations did not function reliably, meaning that no continuous and controlled heat extraction and injection into the ground could be recorded. This led to the overheating or cooling of the ground. The supply of district heating or similar must be limited exclusively to covering peak loads;
Faulty operation: for under or over-heated soil, free cooling was not possible and the temperature level between the heat sink and building were often not tuned. The adaptation of heating and cooling curves as well as the control and release limits of heat pumps, reverse heat pumps and free cooling during operation is mandatory;
There must be an adaptation of room set points and general set points to the actual boundary conditions;
The control and recording of the function of a building combined with installation of geothermal system is important, and it is not a system that works for itself;
Constant control required: the resetting of changes in the operation modes is often forgotten;
Slow system → late fault detection, with long-term consequences.
Recommended fault prevention strategies include the following:
“Keep it as simple as possible”—simple energy concepts with simple systems and modules are needed. A large number of different supply systems should not be used—one or two are enough (e.g. ground and peak load);
Quality assurance during the construction phase as well as comprehensive final inspection and commissioning after completion is advised, including a review of plans and components in the construction phase, on-site inspection of installation and detailed acceptance of functionality in all operating conditions.
Improved and early integration of geothermal systems into building concept and control strategies. It cannot only be considered during the implementation phase that a heat pump should be integrated into the building. The integration requires necessary boundary conditions, which have to be considered already in the design phase of a building;
There must be a consultation between the architect, building services planner and geothermal planning. The actors have to talk to each other so that misunderstandings and mistakes can be avoided and the right boundary conditions can be chosen and defined as well as the right consumption or temperature level being fixed.
Monitoring: By monitoring the operating conditions of most buildings, it is possible to prove that they are not in accordance with the design. For this reason, error analyses and error corrections are necessary at the beginning of monitoring in order to transfer the buildings to regular operation. Only then can the operating data be used for the objective of the project and the actual measurements and evaluation can begin.
- ■
Minimum measurement equipment for monitoring of operation;
- ■
Monitoring of operation to detect and eliminate performance faults, adjusting operation to real boundary conditions;
- ■
Monitoring of annual energy amount (heat injection and extraction) as well as brine temperatures.
6. Conclusions
In addition to reducing the energy requirements of buildings, the sustainable (e.g. CO2-neutral) coverage of energy requirements is a focus of research and development. From the perspective of the use of regenerative energies and energy-efficient construction, in recent years, the ground has increasingly been integrated into energy concepts as a supplier of heat and cooling in conjunction with a heat pump for the heating and cooling of modern office and administration buildings as well as multi-family houses. Heat pump technology will therefore continue to play an important role in the future supply of heat and cooling. In order to exploit the potential of this energy supply variant as efficiently as possible, the choice of a low-temperature heat source and the most suitable heat exchanger for the respective application is of decisive importance.
The results from the research work and the scientific monitoring of the projects, as well as their implementation in practice—presented in the paper—show that it is generally possible and sensible to integrate ground-coupled heat pumps into innovative energy concepts. By monitoring six buildings and their geothermal systems for more than 10 years, it has been shown that, for a successful and permanent operation of energy pile and borehole heat exchanger systems, a high-quality standard has to be maintained during planning, implementation and operation.
It also becomes clear that it is not only a harmonious energy concept and innovative plant technology that lead to an energy-efficient building. Even with detailed, careful planning, malfunctions often occur during operation, which can cause rising energy consumption or cause discomfort [
22]. For this reason, quality assurance (operational analysis and optimization) is of crucial importance for ground-coupled supply concepts, especially in the first years of operation and beyond the project phases. This is the only way to ensure that buildings and systems achieve their planning objectives and long-term functionality, as well as progress in system energy efficiency and user comfort. For all heating and cooling systems in this study, it was found that holistically coordinated control strategies are required, and these must be double-checked and monitored during operation until regular operation is achieved. In cooperation with the building management, possible errors and optimization potentials could be identified step by step, the operation of the systems optimized and the balancing phase shortened. Most of the considered buildings and their ground-coupled heat pumps could be brought into operation as planned and now operate efficiently with an SPF H2 between 2.5 and 6 and in cooling mode between 4 and greater than 100 (depending on the proportion of free and active cooling). The results also show that there is generally no significant difference in operation and performance between a borehole heat exchanger and an energy pile.
In general, it should be stated for all buildings that a balancing phase and continuous monitoring of the injection and extraction quantities should not be neglected. As found in earlier monitoring projects and also in the buildings currently under investigation, it is only possible to detect errors and inconsistencies which have a decisive influence on the operation of the plant through long-term monitoring. Continuous monitoring, adjustment and maintenance is therefore necessary to ensure the intended operation of the plant.


